Analysis of the seismic wavefield properties of volcanic explosions at Volcán de Colima, México:...
16
Geophys. J. Int. (2009) 177, 1383–1398 doi: 10.1111/j.1365-246X.2009.04134.x GJI Volcanology, geothermics, fluids and rocks Analysis of the seismic wavefield properties of volcanic explosions at Volc´ an de Colima, M´ exico: insights into the source mechanism M. Palo, 1 J. M. Ib´ a˜ nez, 2,3 M. Cisneros, 4 M. Bret´ on, 4 E. Del Pezzo, 5 E. Oca˜ na, 2 J. Orozco-Rojas 4 and A. M. Posadas 6 1 Universit´ a degli Studio di Salerno, Dipartimento di Matematica e Informatica, Italy 2 Instituto Andaluz de Geof´ ısica, Universidad de Granada, Spain. E-mail: [email protected] 3 Departamento de F´ ısica Te´ orica y del Cosmos, Universidad de Granada, 18071 Granada, Spain. 4 Observatorio Vulcanol´ ogico, Universidad de Colima, Colima, M´ exico 5 Osservatorio Vesuviano, INGV, Naples, Italy 6 Departamento de F´ ısica Aplicada, Universidad de Almer´ ıa, Spain Accepted 2009 January 27. Received 2009 January 27; in original form 2008 April 8 SUMMARY We have investigated the wavefield properties of the seismic signals generated by the explosions of Volc´ an de Colima (M´ exico). We have analysed these properties to understand the initial mechanism that triggered the explosive events. Our study is focused on the direct waves coming from the crater area. Thus, we have analysed a set of moderate volcanic explosions at Volc´ an de Colima that was recorded by a small aperture seismic array over two periods: October 2005 and April 2006. We can distinguish two types of explosions, Vulcanian and ash-free events. Both types of explosions share the same characteristics, that is a long-period signal (not related to any type of emission) before the arrival of high frequency phases, and a later high frequency signal directly related to ash or gas emission. We have applied the Zero Lag Cross Correlation technique to obtain backazimuth and apparent slowness of the incoming waves. We have also applied polarization analysis to the record of every detected volcanic explosion. By comparing the results of both of these analyses, we have been able to identify the dominant wave types that comprise the seismic wavefield and infer in time and space a possible primary source mechanism that would trigger the volcanic explosions. We have observed an apparent slowness variation of the first onset of the long-period (LP) signal with a possible upward migration of the source; the depth of the source has been identified at a range between 2.6 and 3.3 km below the crater, associated with the range of measured apparent velocities relative to the first onset of the LP signal. Key words: Explosive volcanism; Volcano monitoring. 1 INTRODUCTION Volcanic explosions are usually modelled as produced by an un- steady flux of gas being released from the magma. Small bubbles move upwards in the melt and grow, driving the magma conduit sys- tem into oscillation. When the bubbles get close to the free surfa- ce of the magma, they explode (Cashman et al. 2000; Morrissey & Mastin 2000; Vergniolle & Mangan 2000). This process gener- ates seismic signals. The observation of these seismic signals using short and broad-band instruments shows a common signature: (1) an initial low frequency phase, followed by (2) resonance effects and (3) by a high frequency phase associated to the emission of magmatic material. The initial phase is characterized by very low frequency content (<0.2 Hz), and it is related to the change of pres- sure at depth and to the bubble migration toward the surface (Aster et al. 2003; Chouet 2003). Resonance effects accompany this migra- tion of gas which produces trapped waves in the volcanic conduits and generates low frequency signals (0.2–3.0 Hz), as described by Chouet (2003) and Sturton & Neuberg (2006). Several models have tried to connect the mass movement to the observed seismic wave- field, created by the coupling between a fluid, such as magma or gas, and the solid surrounding rock. Most of the elastic energy that is originated in the mass displacement or in the pressure transient is trapped in the fluid-filled conduit, and so only a small portion can directly travel from the source to the seismic station. In the literature, there are two main models that can explain these signals: events modelled by a pressure transient in a resonating fluid-driven crack (Chouet 1986, 1988, 1996, 2003), and events modelled by a resonating conduit section, where the magma properties may be depth and time dependent (Sturton & Neuberg 2006; De Lauro et al. 2009). Hence, the seismic signal seen is the result of two processes, that is direct waves coming from the source and conduit resonance waves that travel while trapped in the volcanic conduit or pipe. In general, the signals generated by the trapped waves are known as low frequency (LF) or long-period (LP) events. Finally, starting when the gas fraction reaches the surface and produces the emission C 2009 The Authors 1383 Journal compilation C 2009 RAS at Universidad de Granada - Historia de las Ciencias on April 14, 2015 http://gji.oxfordjournals.org/ Downloaded from
-
Upload
independent -
Category
Documents
-
view
2 -
download
0
Transcript of Analysis of the seismic wavefield properties of volcanic explosions at Volcán de Colima, México:...
Geophys. J. Int. (2009) 177, 1383–1398 doi: 10.1111/j.1365-246X.2009.04134.x
GJI
Vol
cano
logy
,ge
othe
rmic
s,flui
dsan
dro
cks
Analysis of the seismic wavefield properties of volcanic explosionsat Volcan de Colima, Mexico: insights into the source mechanism
M. Palo,1 J. M. Ibanez,2,3 M. Cisneros,4 M. Breton,4 E. Del Pezzo,5 E. Ocana,2
J. Orozco-Rojas4 and A. M. Posadas6
1Universita degli Studio di Salerno, Dipartimento di Matematica e Informatica, Italy2Instituto Andaluz de Geofısica, Universidad de Granada, Spain. E-mail: [email protected] de Fısica Teorica y del Cosmos, Universidad de Granada, 18071 Granada, Spain.4Observatorio Vulcanologico, Universidad de Colima, Colima, Mexico5Osservatorio Vesuviano, INGV, Naples, Italy6Departamento de Fısica Aplicada, Universidad de Almerıa, Spain
Accepted 2009 January 27. Received 2009 January 27; in original form 2008 April 8
S U M M A R YWe have investigated the wavefield properties of the seismic signals generated by the explosionsof Volcan de Colima (Mexico). We have analysed these properties to understand the initialmechanism that triggered the explosive events. Our study is focused on the direct wavescoming from the crater area. Thus, we have analysed a set of moderate volcanic explosionsat Volcan de Colima that was recorded by a small aperture seismic array over two periods:October 2005 and April 2006. We can distinguish two types of explosions, Vulcanian andash-free events. Both types of explosions share the same characteristics, that is a long-periodsignal (not related to any type of emission) before the arrival of high frequency phases, anda later high frequency signal directly related to ash or gas emission. We have applied theZero Lag Cross Correlation technique to obtain backazimuth and apparent slowness of theincoming waves. We have also applied polarization analysis to the record of every detectedvolcanic explosion. By comparing the results of both of these analyses, we have been able toidentify the dominant wave types that comprise the seismic wavefield and infer in time andspace a possible primary source mechanism that would trigger the volcanic explosions. Wehave observed an apparent slowness variation of the first onset of the long-period (LP) signalwith a possible upward migration of the source; the depth of the source has been identifiedat a range between 2.6 and 3.3 km below the crater, associated with the range of measuredapparent velocities relative to the first onset of the LP signal.
Key words: Explosive volcanism; Volcano monitoring.
1 I N T RO D U C T I O N
Volcanic explosions are usually modelled as produced by an un-steady flux of gas being released from the magma. Small bubblesmove upwards in the melt and grow, driving the magma conduit sys-tem into oscillation. When the bubbles get close to the free surfa-ce of the magma, they explode (Cashman et al. 2000; Morrissey& Mastin 2000; Vergniolle & Mangan 2000). This process gener-ates seismic signals. The observation of these seismic signals usingshort and broad-band instruments shows a common signature: (1)an initial low frequency phase, followed by (2) resonance effectsand (3) by a high frequency phase associated to the emission ofmagmatic material. The initial phase is characterized by very lowfrequency content (<0.2 Hz), and it is related to the change of pres-sure at depth and to the bubble migration toward the surface (Asteret al. 2003; Chouet 2003). Resonance effects accompany this migra-tion of gas which produces trapped waves in the volcanic conduitsand generates low frequency signals (0.2–3.0 Hz), as described by
Chouet (2003) and Sturton & Neuberg (2006). Several models havetried to connect the mass movement to the observed seismic wave-field, created by the coupling between a fluid, such as magma orgas, and the solid surrounding rock. Most of the elastic energy thatis originated in the mass displacement or in the pressure transientis trapped in the fluid-filled conduit, and so only a small portioncan directly travel from the source to the seismic station. In theliterature, there are two main models that can explain these signals:events modelled by a pressure transient in a resonating fluid-drivencrack (Chouet 1986, 1988, 1996, 2003), and events modelled bya resonating conduit section, where the magma properties may bedepth and time dependent (Sturton & Neuberg 2006; De Lauro et al.2009). Hence, the seismic signal seen is the result of two processes,that is direct waves coming from the source and conduit resonancewaves that travel while trapped in the volcanic conduit or pipe.In general, the signals generated by the trapped waves are knownas low frequency (LF) or long-period (LP) events. Finally, startingwhen the gas fraction reaches the surface and produces the emission
C© 2009 The Authors 1383Journal compilation C© 2009 RAS
at Universidad de G
ranada - Historia de las C
iencias on April 14, 2015
http://gji.oxfordjournals.org/D
ownloaded from

1384 M. Palo et al.
of gas to the atmosphere (volcanic explosion), a higher frequency(>3 Hz) third component follows. Lane et al. (2001) and Ripepeet al. (2001) provided an experimental explanation for the forma-tion of large bubbles, for their migration and for the final explosion,by the modelling of expanding gas–liquid flows. Bottiglieri et al.(2005) indicated that the initial bubble formation can be explainedby coalescence of diffusing gas particles.
The main objective of the present study was to investigate thewavefield properties of the seismic signals (>0.5 Hz) generated byexplosions of Volcan de Colima (Mexico). We have analysed theseproperties so as to understand the initial mechanism that triggeredthe explosive events. We have focused our study on the direct wavescoming from the crater area, using array techniques and polarizationanalysis. We have thus analysed a set of moderate volcanic explo-sions of Volcan de Colima that were recorded by a short-apertureseismic array over two periods: October 2005 and April 2006. Wehave applied the Zero Lag Cross Correlation (ZLCC) technique(Frankel et al. 1991) to obtain the wavefield propagation parame-ters of the incoming waves (backazimuth and apparent slowness),and polarization analysis to investigate the wave types. We havefocused our effort in the first portion of the seismograms from theexplosions most likely related to the primary source mechanism.Finally, we have proposed a conceptual model that describes thesource mechanism that triggered the volcanic explosions.
2 V O L C A N O L O G I C A L S E T T I N G
Volcan de Colima is an andesitic strato-volcano that rises to3 860 m above sea level, and is situated in the western portion of thetrans-Mexican volcanic belt. It is one of the most active volcanoesin Mexico and it shows a wide spectrum of eruption styles. The ma-terial emitted contains pyroclastic flows, ash falls, mud flows andlava flows, with the presence of vulcanian explosions and ash-freeevents (Breton et al. 2002; Zobin et al. 2002, 2005). This volcanicactivity is characterized by eruptive cycles, between which the vol-cano does not show any type of activity on the surface. Each of thesecycles starts with the growing of a dome within the summit zone,and when the dome reaches the border of the crater it produces lavaand pyroclastic flows followed by a phase of frequent explosionsof variable intensities (Luhr 2002; Zobin et al. 2005). The cyclefinishes with a Plinian explosion that destroys the summit region,and the activity then decreases with a series of small Vulcanianexplosions. Zobin et al. (2006) analysed more than 100 explosionsrecorded in the period 2004–2005 and reported that the power of theColima explosions spans five orders of magnitude, while the counterforces span four orders of magnitude. Moreover, they showed thatthe power of the volcanic explosions is proportional to the counterforce of the eruptions.
The most recent unrest began in 1997, on 28 November, witha sharp increase in its seismic activity. Since that moment to thepresent, three stages of activity have been recorded consisting ofthe extrusion of andesitic block lava with the formation of lavaflows, lava domes and the occurrence of very energetic explosions(Zobin et al. 2006). At present, Volcan de Colima shows a highrate of low energy volcanic explosions (three per day, on average),mainly of Vulcanian and Ash-free styles.
2.1 The 2005–2006 explosive activity at Volcan de Colima
The most recent stage of eruptive activity at Volcan de Colimastarted in 2004 with the extrusion of andesitic lava, lava flows,
and pyroclastic flows. This activity was accompanied by intermit-tent explosive activity, represented mainly by Vulcanian explosions,where streams of vapour and ash were emitted (Zobin et al. 2006).In the following sections, we briefly describe the explosive activitiesrecorded by the Observatorio Volcanologico of Colima Universityfor the 2005 and 2006 periods, separately.
2005
In January and February 2005, the size and number of explosionswere decreasing in comparison to the previous years with an av-erage of five events per day. On 27 February 2005, a 5.6 magni-tude tectonic earthquake occurred along the Manzanillo coast, nearVolcan de Colima, which caused no variation in the volcanic activityobserved. On March 10th the situation changed due to the occur-rence of the biggest explosion in the last months. During this eventVolcan de Colima emitted pyroclastic flows that reached distancesgreater than 3 km from the summit area. On March 13th, an evenmore energetic explosion (the biggest one in the previous 5 yr) oc-curred which dropped ash more than 60 km from the volcanic area.The GOES12 satellite showed an eruptive column with a height of5300 m on the summit cone. The Vulcanian activity contin-ued through March and April, and on May 15 a new big ex-plosion occurred, the biggest ever recorded by the ObservatorioVolcanologico, which produced several pyroclastic flows. Anothersignificant explosion was recorded on 23 May 2005, which waspreceded by an increase in the LP seismicity greater than that seenfor the explosion on May 15th. This explosion, with an eruptivecolumn that reached 10 000 m above sea level, destroyed a smalllava dome that was located in the summit zone. Its pyroclastic flowsreached a zone located 5 km distance from the crater area, and theenergy of the events that followed was increased. On June 5th, themost energetic explosion of the previous 20 yr took place. Afterthis series of explosions a new lava dome was seen growing in thecrater. After other important events that occurred on 9 June 2005,this dome was destroyed and the energy of the explosions startedto decrease. In general the VEI of these explosions has been notreporter. In the months of July, August, September and October2005 some important explosions occurred that were accompaniedby moderate events. By the end of the year a total of 1 100 explo-sions had been recorded, at least 18 of them considered as veryenergetic events, and one of them being the biggest ever recordedover the last 20 yr.
2006
The explosive activity of 2006 was smaller, on average, than thatrecorded through 2005, although there were still a few explosions(about four) per day. The most significant characteristic in 2006 wasthe observation of a new lava dome in the summit area in December,with the presence of new fumarolic emissions. At the time of writingthis paper (April, 2008) the dome is still growing and can be seenover the crater borders.
3 S E I S M I C I N S T RU M E N T S A N DS E I S M I C E V E N T C L A S S I F I C AT I O N
We deployed a 12-channel seismic antenna at the Cofradıa de Tonilasite in October 2005. This antenna was composed of 10 short-periodseismometers (nine vertical-component and one three-component).The receivers were Mark L28 instruments with a natural period of
C© 2009 The Authors, GJI, 177, 1383–1398
Journal compilation C© 2009 RAS
at Universidad de G
ranada - Historia de las C
iencias on April 14, 2015
http://gji.oxfordjournals.org/D
ownloaded from
Seismic wavefield properties of volcanic explosions 1385
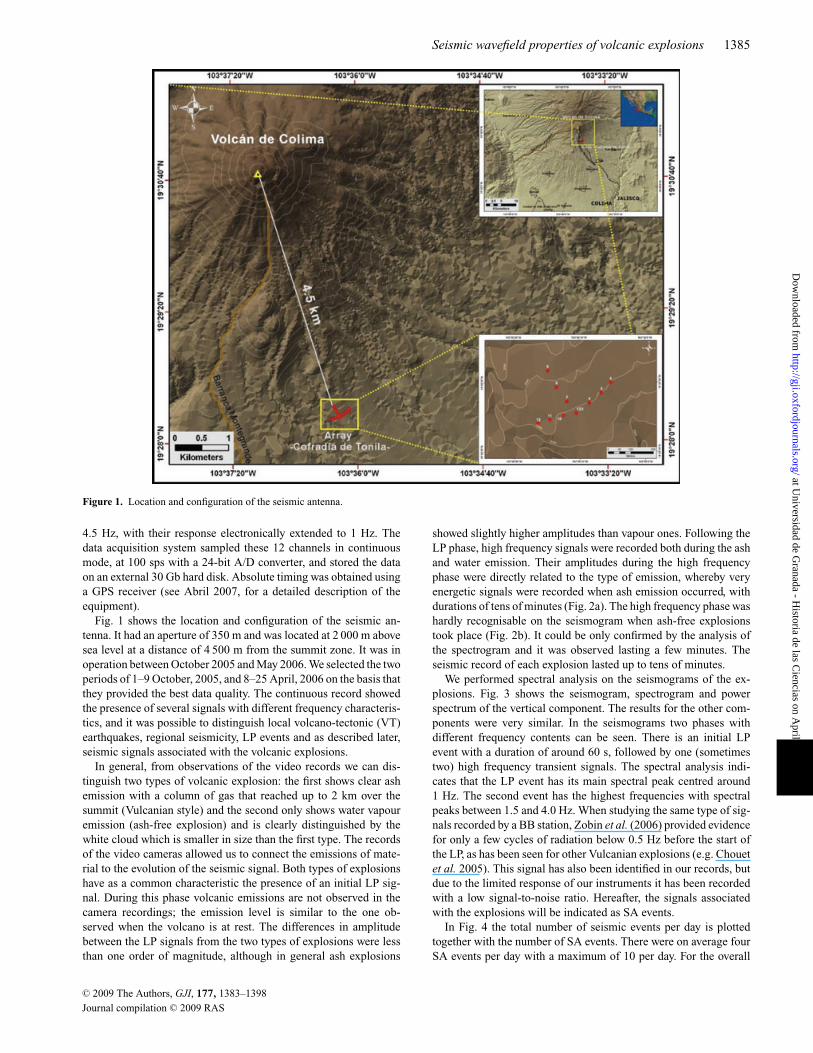
Figure 1. Location and configuration of the seismic antenna.
4.5 Hz, with their response electronically extended to 1 Hz. Thedata acquisition system sampled these 12 channels in continuousmode, at 100 sps with a 24-bit A/D converter, and stored the dataon an external 30 Gb hard disk. Absolute timing was obtained usinga GPS receiver (see Abril 2007, for a detailed description of theequipment).
Fig. 1 shows the location and configuration of the seismic an-tenna. It had an aperture of 350 m and was located at 2 000 m abovesea level at a distance of 4 500 m from the summit zone. It was inoperation between October 2005 and May 2006. We selected the twoperiods of 1–9 October, 2005, and 8–25 April, 2006 on the basis thatthey provided the best data quality. The continuous record showedthe presence of several signals with different frequency characteris-tics, and it was possible to distinguish local volcano-tectonic (VT)earthquakes, regional seismicity, LP events and as described later,seismic signals associated with the volcanic explosions.
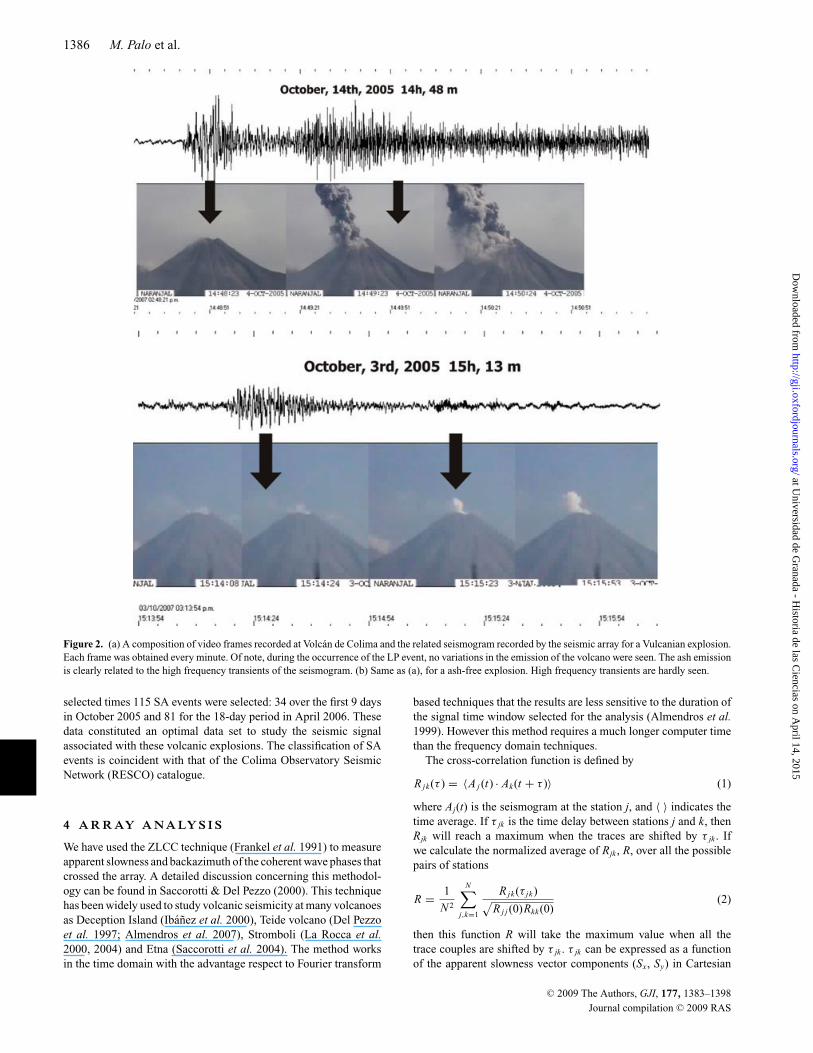
In general, from observations of the video records we can dis-tinguish two types of volcanic explosion: the first shows clear ashemission with a column of gas that reached up to 2 km over thesummit (Vulcanian style) and the second only shows water vapouremission (ash-free explosion) and is clearly distinguished by thewhite cloud which is smaller in size than the first type. The recordsof the video cameras allowed us to connect the emissions of mate-rial to the evolution of the seismic signal. Both types of explosionshave as a common characteristic the presence of an initial LP sig-nal. During this phase volcanic emissions are not observed in thecamera recordings; the emission level is similar to the one ob-served when the volcano is at rest. The differences in amplitudebetween the LP signals from the two types of explosions were lessthan one order of magnitude, although in general ash explosions
showed slightly higher amplitudes than vapour ones. Following theLP phase, high frequency signals were recorded both during the ashand water emission. Their amplitudes during the high frequencyphase were directly related to the type of emission, whereby veryenergetic signals were recorded when ash emission occurred, withdurations of tens of minutes (Fig. 2a). The high frequency phase washardly recognisable on the seismogram when ash-free explosionstook place (Fig. 2b). It could be only confirmed by the analysis ofthe spectrogram and it was observed lasting a few minutes. Theseismic record of each explosion lasted up to tens of minutes.
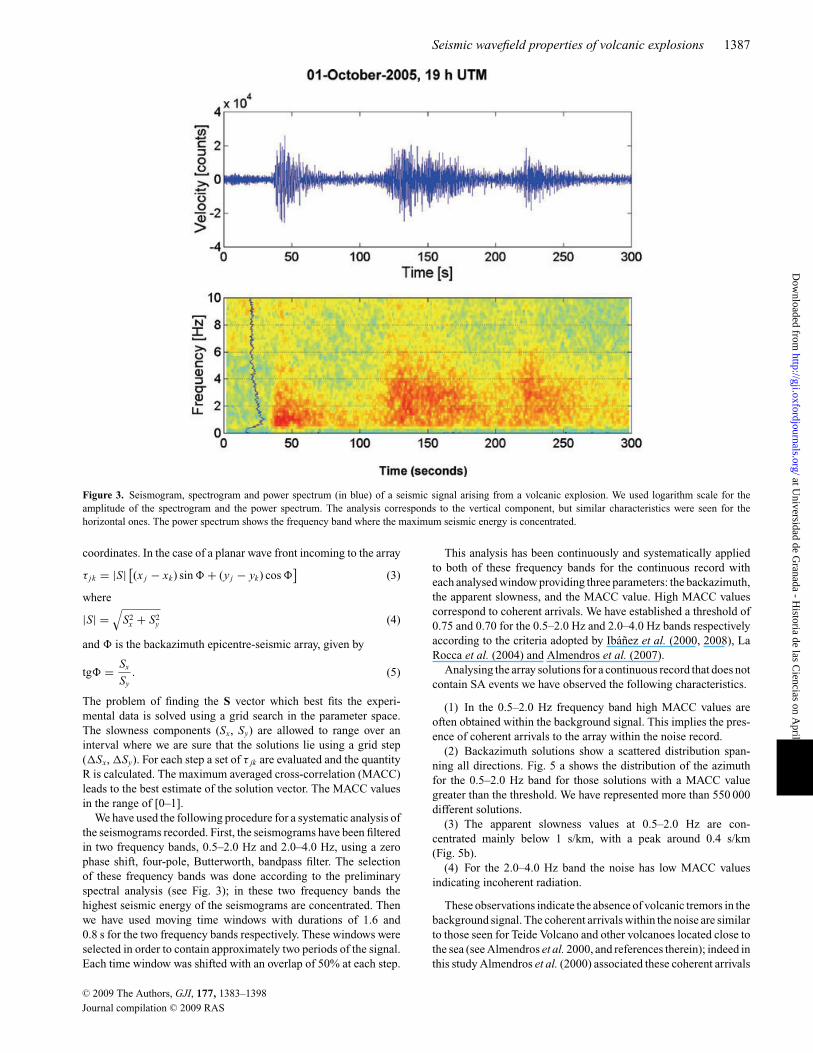
We performed spectral analysis on the seismograms of the ex-plosions. Fig. 3 shows the seismogram, spectrogram and powerspectrum of the vertical component. The results for the other com-ponents were very similar. In the seismograms two phases withdifferent frequency contents can be seen. There is an initial LPevent with a duration of around 60 s, followed by one (sometimestwo) high frequency transient signals. The spectral analysis indi-cates that the LP event has its main spectral peak centred around1 Hz. The second event has the highest frequencies with spectralpeaks between 1.5 and 4.0 Hz. When studying the same type of sig-nals recorded by a BB station, Zobin et al. (2006) provided evidencefor only a few cycles of radiation below 0.5 Hz before the start ofthe LP, as has been seen for other Vulcanian explosions (e.g. Chouetet al. 2005). This signal has also been identified in our records, butdue to the limited response of our instruments it has been recordedwith a low signal-to-noise ratio. Hereafter, the signals associatedwith the explosions will be indicated as SA events.
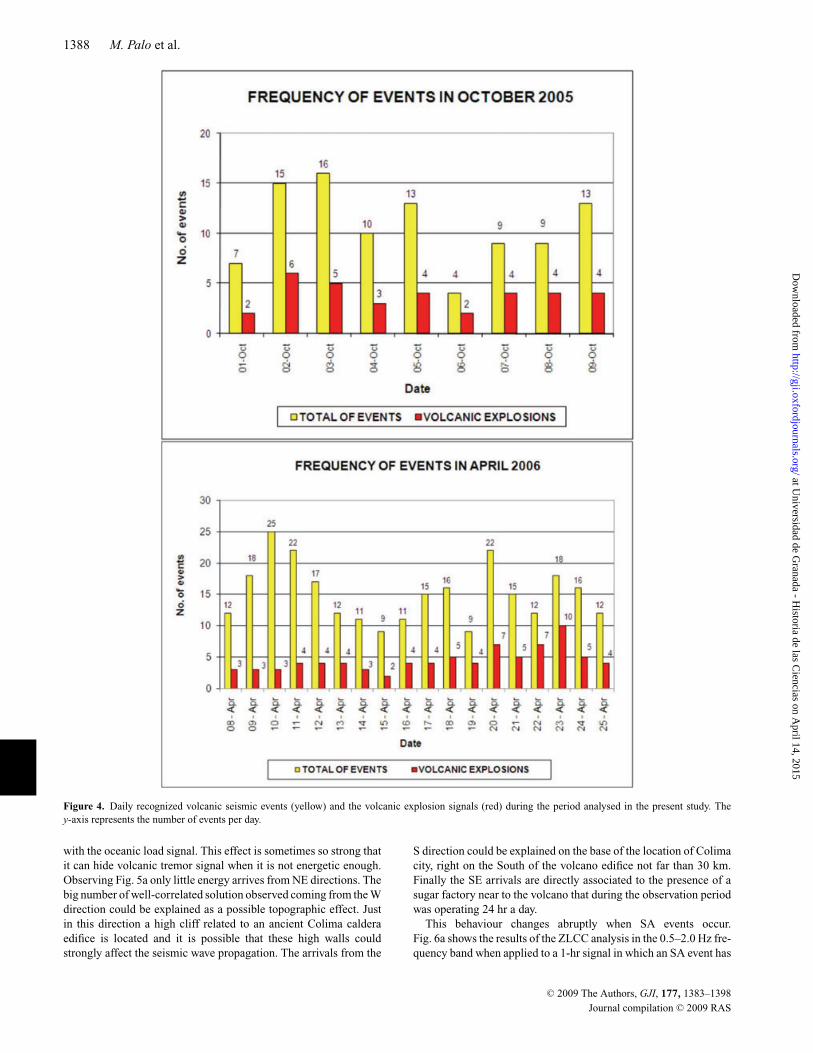
In Fig. 4 the total number of seismic events per day is plottedtogether with the number of SA events. There were on average fourSA events per day with a maximum of 10 per day. For the overall
C© 2009 The Authors, GJI, 177, 1383–1398
Journal compilation C© 2009 RAS
at Universidad de G
ranada - Historia de las C
iencias on April 14, 2015
http://gji.oxfordjournals.org/D
ownloaded from
1386 M. Palo et al.
Figure 2. (a) A composition of video frames recorded at Volcan de Colima and the related seismogram recorded by the seismic array for a Vulcanian explosion.Each frame was obtained every minute. Of note, during the occurrence of the LP event, no variations in the emission of the volcano were seen. The ash emissionis clearly related to the high frequency transients of the seismogram. (b) Same as (a), for a ash-free explosion. High frequency transients are hardly seen.
selected times 115 SA events were selected: 34 over the first 9 daysin October 2005 and 81 for the 18-day period in April 2006. Thesedata constituted an optimal data set to study the seismic signalassociated with these volcanic explosions. The classification of SAevents is coincident with that of the Colima Observatory SeismicNetwork (RESCO) catalogue.
4 A R R AY A NA LY S I S
We have used the ZLCC technique (Frankel et al. 1991) to measureapparent slowness and backazimuth of the coherent wave phases thatcrossed the array. A detailed discussion concerning this methodol-ogy can be found in Saccorotti & Del Pezzo (2000). This techniquehas been widely used to study volcanic seismicity at many volcanoesas Deception Island (Ibanez et al. 2000), Teide volcano (Del Pezzoet al. 1997; Almendros et al. 2007), Stromboli (La Rocca et al.2000, 2004) and Etna (Saccorotti et al. 2004). The method worksin the time domain with the advantage respect to Fourier transform
based techniques that the results are less sensitive to the duration ofthe signal time window selected for the analysis (Almendros et al.1999). However this method requires a much longer computer timethan the frequency domain techniques.
The cross-correlation function is defined by
R jk(τ ) = 〈A j (t) · Ak(t + τ )〉 (1)
where Aj(t) is the seismogram at the station j, and 〈 〉 indicates thetime average. If τ jk is the time delay between stations j and k, thenRjk will reach a maximum when the traces are shifted by τ jk . Ifwe calculate the normalized average of Rjk , R, over all the possiblepairs of stations
R = 1
N 2
N∑j,k=1
R jk(τ jk)√R j j (0)Rkk(0)
(2)
then this function R will take the maximum value when all thetrace couples are shifted by τ jk . τ jk can be expressed as a functionof the apparent slowness vector components (Sx, Sy) in Cartesian
C© 2009 The Authors, GJI, 177, 1383–1398
Journal compilation C© 2009 RAS
at Universidad de G
ranada - Historia de las C
iencias on April 14, 2015
http://gji.oxfordjournals.org/D
ownloaded from
Seismic wavefield properties of volcanic explosions 1387
Figure 3. Seismogram, spectrogram and power spectrum (in blue) of a seismic signal arising from a volcanic explosion. We used logarithm scale for theamplitude of the spectrogram and the power spectrum. The analysis corresponds to the vertical component, but similar characteristics were seen for thehorizontal ones. The power spectrum shows the frequency band where the maximum seismic energy is concentrated.
coordinates. In the case of a planar wave front incoming to the array
τ jk = |S| [(x j − xk) sin � + (y j − yk) cos �]
(3)
where
|S| =√
S2x + S2
y (4)
and � is the backazimuth epicentre-seismic array, given by
tg� = Sx
Sy. (5)
The problem of finding the S vector which best fits the experi-mental data is solved using a grid search in the parameter space.The slowness components (Sx, Sy) are allowed to range over aninterval where we are sure that the solutions lie using a grid step(�Sx, �Sy). For each step a set of τ jk are evaluated and the quantityR is calculated. The maximum averaged cross-correlation (MACC)leads to the best estimate of the solution vector. The MACC valuesin the range of [0–1].
We have used the following procedure for a systematic analysis ofthe seismograms recorded. First, the seismograms have been filteredin two frequency bands, 0.5–2.0 Hz and 2.0–4.0 Hz, using a zerophase shift, four-pole, Butterworth, bandpass filter. The selectionof these frequency bands was done according to the preliminaryspectral analysis (see Fig. 3); in these two frequency bands thehighest seismic energy of the seismograms are concentrated. Thenwe have used moving time windows with durations of 1.6 and0.8 s for the two frequency bands respectively. These windows wereselected in order to contain approximately two periods of the signal.Each time window was shifted with an overlap of 50% at each step.
This analysis has been continuously and systematically appliedto both of these frequency bands for the continuous record witheach analysed window providing three parameters: the backazimuth,the apparent slowness, and the MACC value. High MACC valuescorrespond to coherent arrivals. We have established a threshold of0.75 and 0.70 for the 0.5–2.0 Hz and 2.0–4.0 Hz bands respectivelyaccording to the criteria adopted by Ibanez et al. (2000, 2008), LaRocca et al. (2004) and Almendros et al. (2007).
Analysing the array solutions for a continuous record that does notcontain SA events we have observed the following characteristics.
(1) In the 0.5–2.0 Hz frequency band high MACC values areoften obtained within the background signal. This implies the pres-ence of coherent arrivals to the array within the noise record.
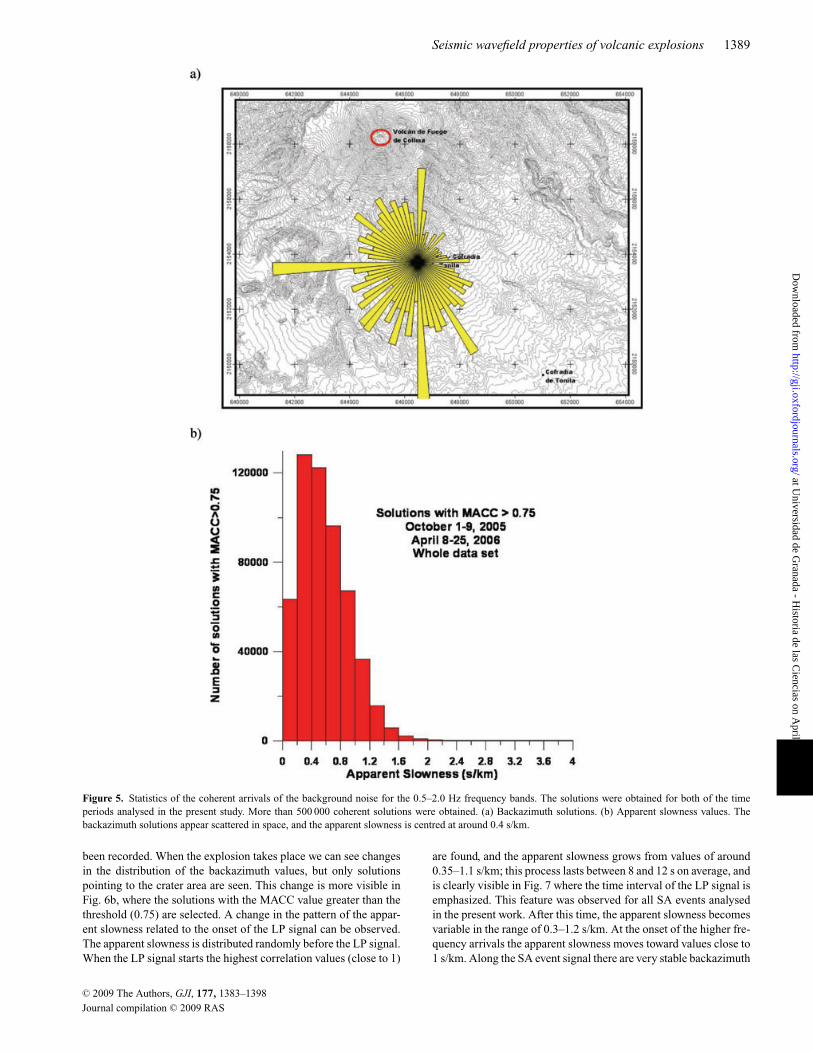
(2) Backazimuth solutions show a scattered distribution span-ning all directions. Fig. 5 a shows the distribution of the azimuthfor the 0.5–2.0 Hz band for those solutions with a MACC valuegreater than the threshold. We have represented more than 550 000different solutions.
(3) The apparent slowness values at 0.5–2.0 Hz are con-centrated mainly below 1 s/km, with a peak around 0.4 s/km(Fig. 5b).
(4) For the 2.0–4.0 Hz band the noise has low MACC valuesindicating incoherent radiation.
These observations indicate the absence of volcanic tremors in thebackground signal. The coherent arrivals within the noise are similarto those seen for Teide Volcano and other volcanoes located close tothe sea (see Almendros et al. 2000, and references therein); indeed inthis study Almendros et al. (2000) associated these coherent arrivals
C© 2009 The Authors, GJI, 177, 1383–1398
Journal compilation C© 2009 RAS
at Universidad de G
ranada - Historia de las C
iencias on April 14, 2015
http://gji.oxfordjournals.org/D
ownloaded from
1388 M. Palo et al.
Figure 4. Daily recognized volcanic seismic events (yellow) and the volcanic explosion signals (red) during the period analysed in the present study. They-axis represents the number of events per day.
with the oceanic load signal. This effect is sometimes so strong thatit can hide volcanic tremor signal when it is not energetic enough.Observing Fig. 5a only little energy arrives from NE directions. Thebig number of well-correlated solution observed coming from the Wdirection could be explained as a possible topographic effect. Justin this direction a high cliff related to an ancient Colima calderaedifice is located and it is possible that these high walls couldstrongly affect the seismic wave propagation. The arrivals from the
S direction could be explained on the base of the location of Colimacity, right on the South of the volcano edifice not far than 30 km.Finally the SE arrivals are directly associated to the presence of asugar factory near to the volcano that during the observation periodwas operating 24 hr a day.
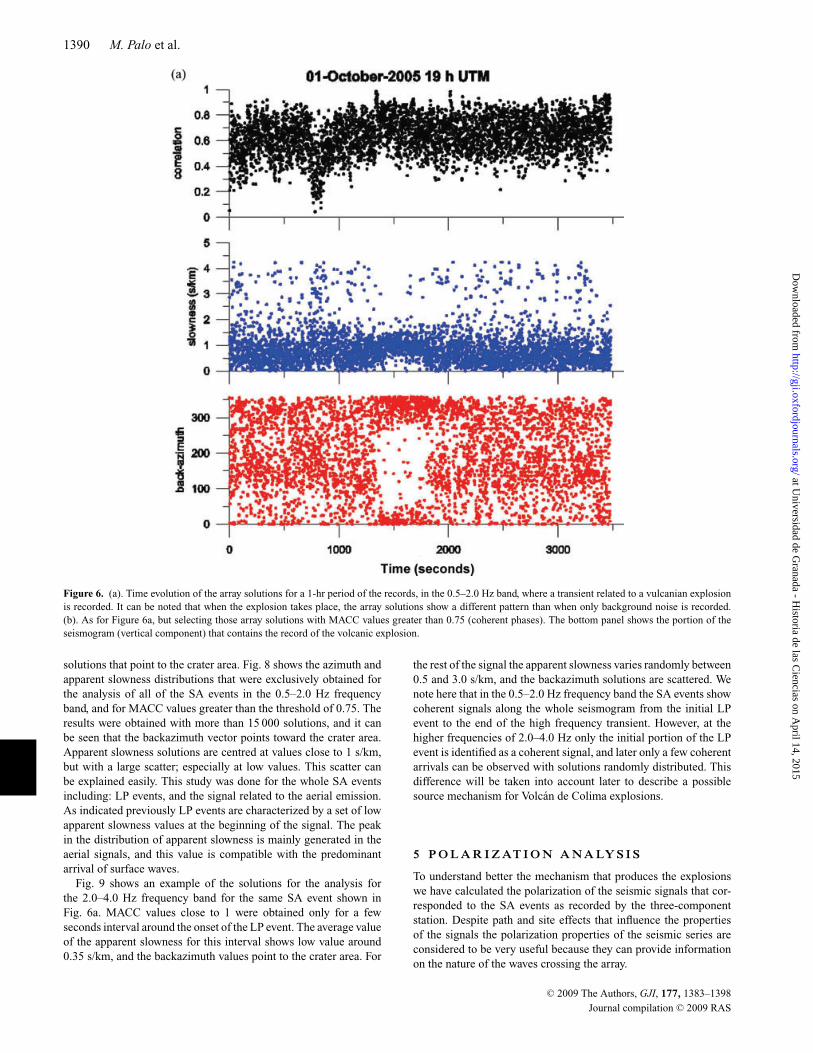
This behaviour changes abruptly when SA events occur.Fig. 6a shows the results of the ZLCC analysis in the 0.5–2.0 Hz fre-quency band when applied to a 1-hr signal in which an SA event has
C© 2009 The Authors, GJI, 177, 1383–1398
Journal compilation C© 2009 RAS
at Universidad de G
ranada - Historia de las C
iencias on April 14, 2015
http://gji.oxfordjournals.org/D
ownloaded from
Seismic wavefield properties of volcanic explosions 1389
Figure 5. Statistics of the coherent arrivals of the background noise for the 0.5–2.0 Hz frequency bands. The solutions were obtained for both of the timeperiods analysed in the present study. More than 500 000 coherent solutions were obtained. (a) Backazimuth solutions. (b) Apparent slowness values. Thebackazimuth solutions appear scattered in space, and the apparent slowness is centred at around 0.4 s/km.
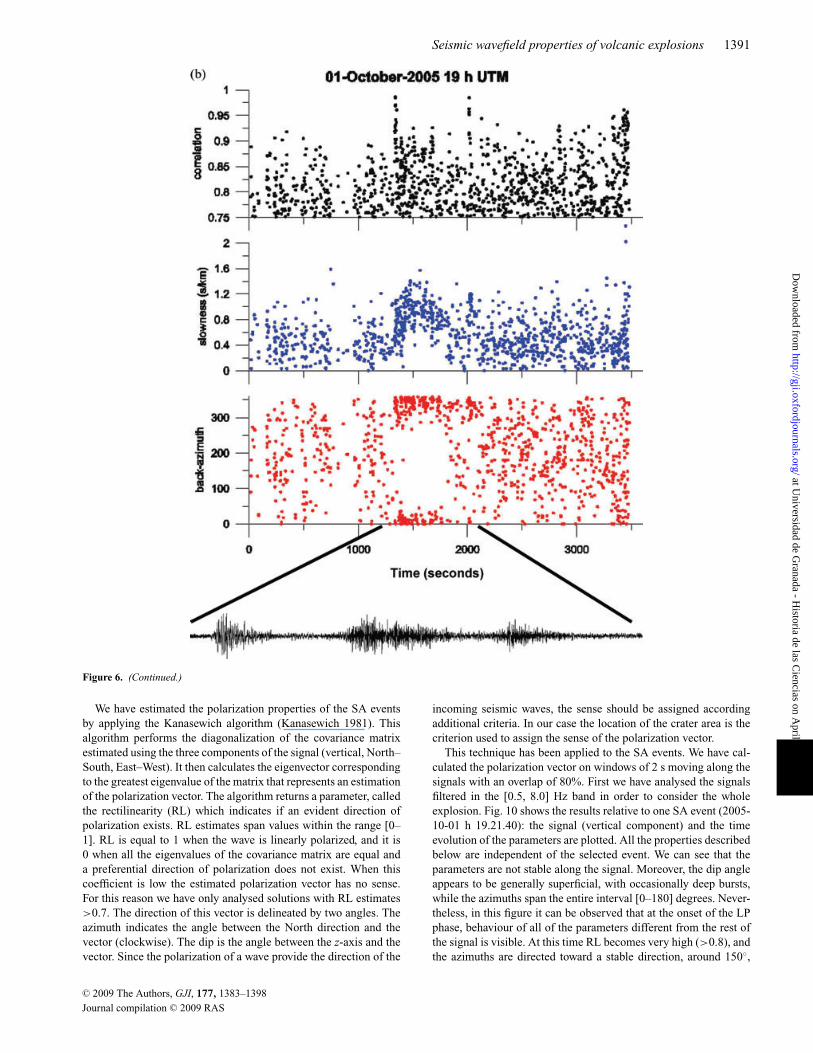
been recorded. When the explosion takes place we can see changesin the distribution of the backazimuth values, but only solutionspointing to the crater area are seen. This change is more visible inFig. 6b, where the solutions with the MACC value greater than thethreshold (0.75) are selected. A change in the pattern of the appar-ent slowness related to the onset of the LP signal can be observed.The apparent slowness is distributed randomly before the LP signal.When the LP signal starts the highest correlation values (close to 1)
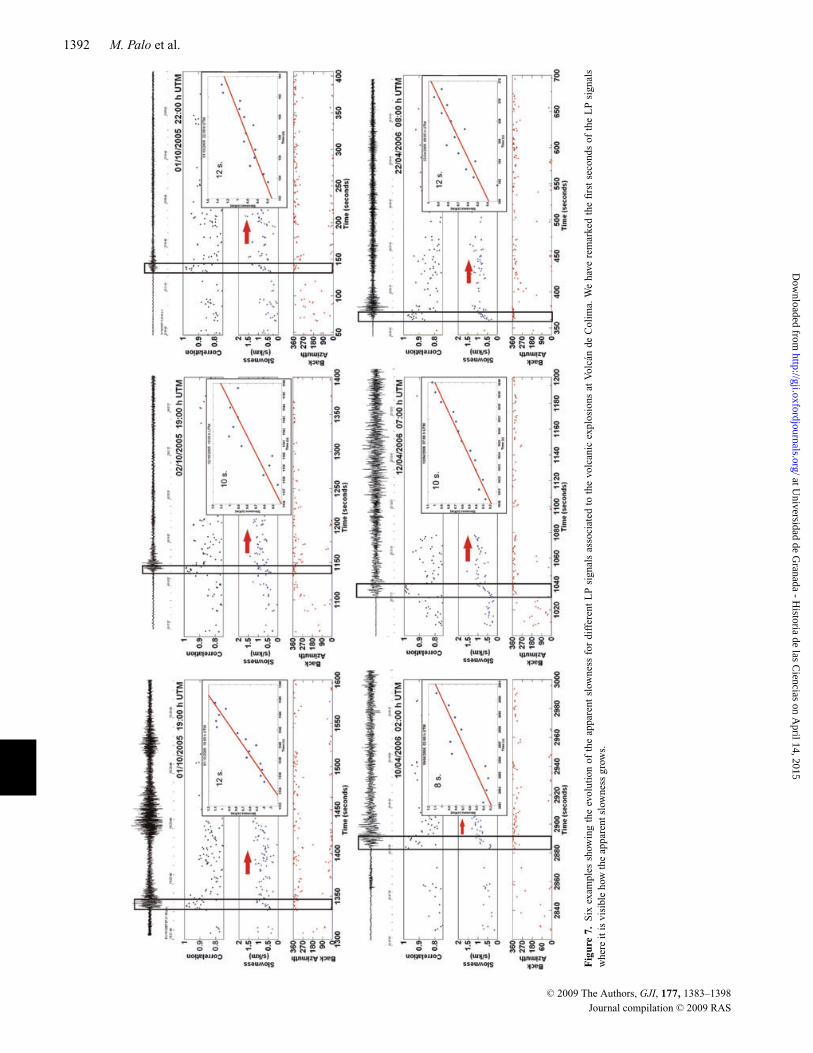
are found, and the apparent slowness grows from values of around0.35–1.1 s/km; this process lasts between 8 and 12 s on average, andis clearly visible in Fig. 7 where the time interval of the LP signal isemphasized. This feature was observed for all SA events analysedin the present work. After this time, the apparent slowness becomesvariable in the range of 0.3–1.2 s/km. At the onset of the higher fre-quency arrivals the apparent slowness moves toward values close to1 s/km. Along the SA event signal there are very stable backazimuth
C© 2009 The Authors, GJI, 177, 1383–1398
Journal compilation C© 2009 RAS
at Universidad de G
ranada - Historia de las C
iencias on April 14, 2015
http://gji.oxfordjournals.org/D
ownloaded from
1390 M. Palo et al.
Figure 6. (a). Time evolution of the array solutions for a 1-hr period of the records, in the 0.5–2.0 Hz band, where a transient related to a vulcanian explosionis recorded. It can be noted that when the explosion takes place, the array solutions show a different pattern than when only background noise is recorded.(b). As for Figure 6a, but selecting those array solutions with MACC values greater than 0.75 (coherent phases). The bottom panel shows the portion of theseismogram (vertical component) that contains the record of the volcanic explosion.
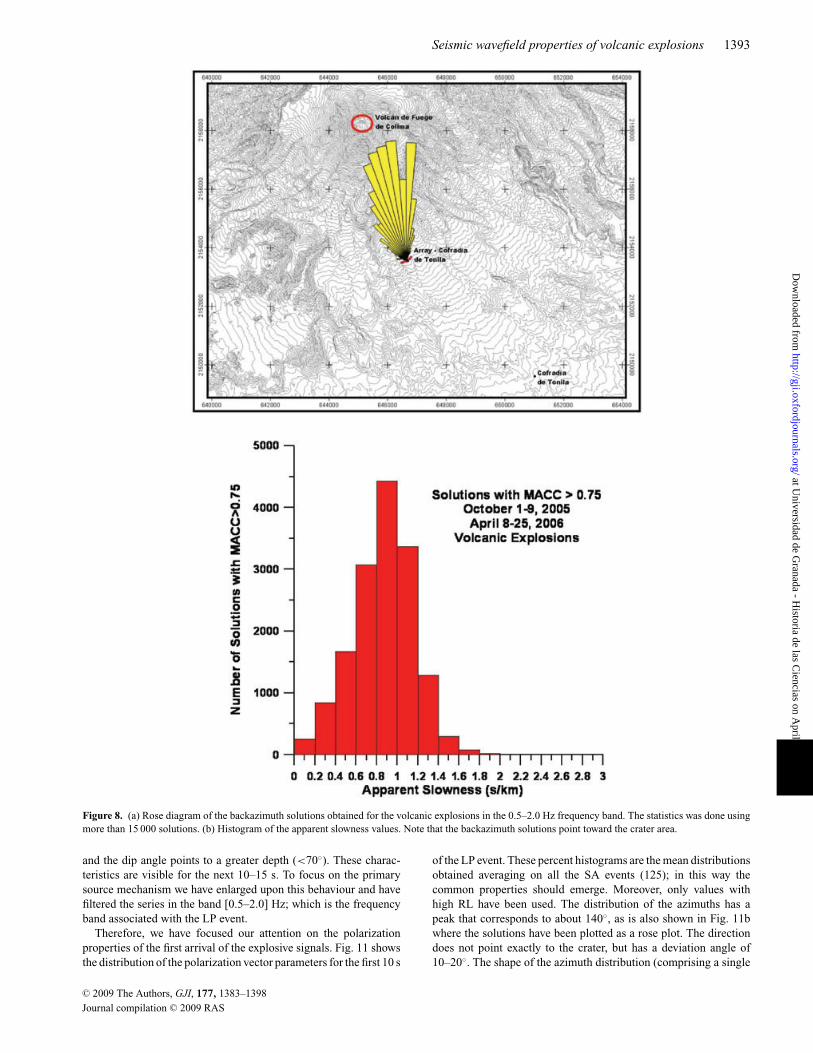
solutions that point to the crater area. Fig. 8 shows the azimuth andapparent slowness distributions that were exclusively obtained forthe analysis of all of the SA events in the 0.5–2.0 Hz frequencyband, and for MACC values greater than the threshold of 0.75. Theresults were obtained with more than 15 000 solutions, and it canbe seen that the backazimuth vector points toward the crater area.Apparent slowness solutions are centred at values close to 1 s/km,but with a large scatter; especially at low values. This scatter canbe explained easily. This study was done for the whole SA eventsincluding: LP events, and the signal related to the aerial emission.As indicated previously LP events are characterized by a set of lowapparent slowness values at the beginning of the signal. The peakin the distribution of apparent slowness is mainly generated in theaerial signals, and this value is compatible with the predominantarrival of surface waves.
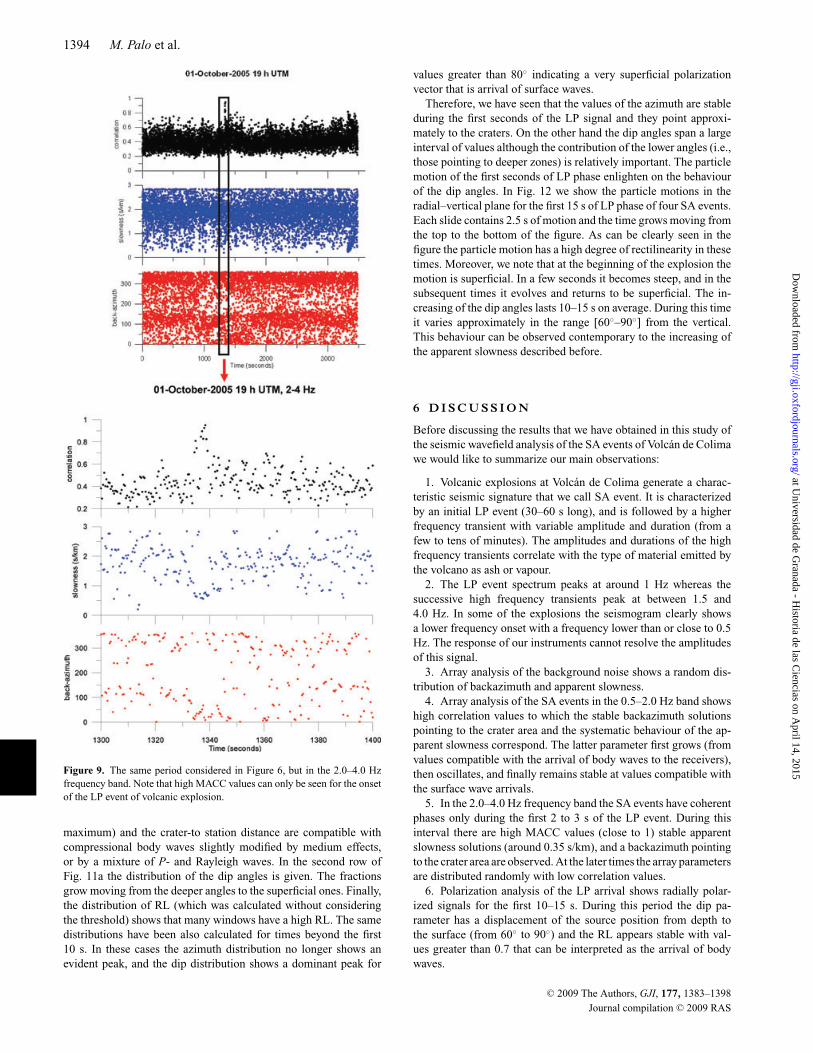
Fig. 9 shows an example of the solutions for the analysis forthe 2.0–4.0 Hz frequency band for the same SA event shown inFig. 6a. MACC values close to 1 were obtained only for a fewseconds interval around the onset of the LP event. The average valueof the apparent slowness for this interval shows low value around0.35 s/km, and the backazimuth values point to the crater area. For
the rest of the signal the apparent slowness varies randomly between0.5 and 3.0 s/km, and the backazimuth solutions are scattered. Wenote here that in the 0.5–2.0 Hz frequency band the SA events showcoherent signals along the whole seismogram from the initial LPevent to the end of the high frequency transient. However, at thehigher frequencies of 2.0–4.0 Hz only the initial portion of the LPevent is identified as a coherent signal, and later only a few coherentarrivals can be observed with solutions randomly distributed. Thisdifference will be taken into account later to describe a possiblesource mechanism for Volcan de Colima explosions.
5 P O L A R I Z AT I O N A NA LY S I S
To understand better the mechanism that produces the explosionswe have calculated the polarization of the seismic signals that cor-responded to the SA events as recorded by the three-componentstation. Despite path and site effects that influence the propertiesof the signals the polarization properties of the seismic series areconsidered to be very useful because they can provide informationon the nature of the waves crossing the array.
C© 2009 The Authors, GJI, 177, 1383–1398
Journal compilation C© 2009 RAS
at Universidad de G
ranada - Historia de las C
iencias on April 14, 2015
http://gji.oxfordjournals.org/D
ownloaded from
Seismic wavefield properties of volcanic explosions 1391
Figure 6. (Continued.)
We have estimated the polarization properties of the SA eventsby applying the Kanasewich algorithm (Kanasewich 1981). Thisalgorithm performs the diagonalization of the covariance matrixestimated using the three components of the signal (vertical, North–South, East–West). It then calculates the eigenvector correspondingto the greatest eigenvalue of the matrix that represents an estimationof the polarization vector. The algorithm returns a parameter, calledthe rectilinearity (RL) which indicates if an evident direction ofpolarization exists. RL estimates span values within the range [0–1]. RL is equal to 1 when the wave is linearly polarized, and it is0 when all the eigenvalues of the covariance matrix are equal anda preferential direction of polarization does not exist. When thiscoefficient is low the estimated polarization vector has no sense.For this reason we have only analysed solutions with RL estimates>0.7. The direction of this vector is delineated by two angles. Theazimuth indicates the angle between the North direction and thevector (clockwise). The dip is the angle between the z-axis and thevector. Since the polarization of a wave provide the direction of the
incoming seismic waves, the sense should be assigned accordingadditional criteria. In our case the location of the crater area is thecriterion used to assign the sense of the polarization vector.
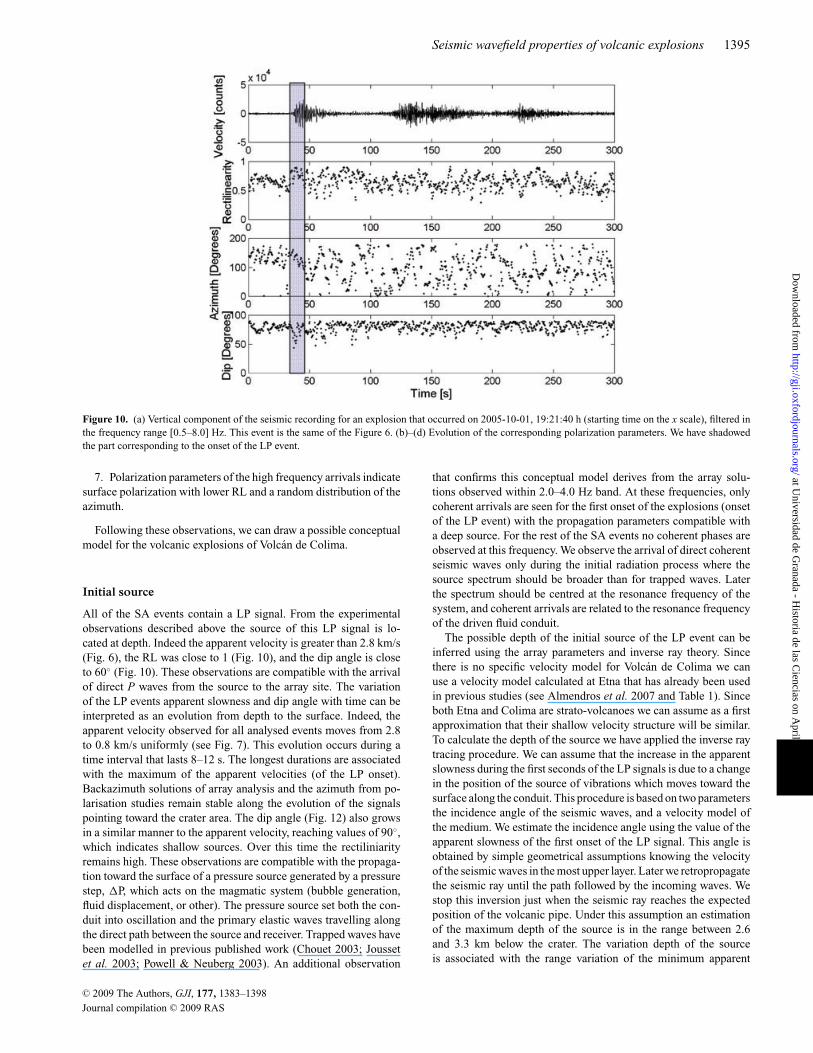
This technique has been applied to the SA events. We have cal-culated the polarization vector on windows of 2 s moving along thesignals with an overlap of 80%. First we have analysed the signalsfiltered in the [0.5, 8.0] Hz band in order to consider the wholeexplosion. Fig. 10 shows the results relative to one SA event (2005-10-01 h 19.21.40): the signal (vertical component) and the timeevolution of the parameters are plotted. All the properties describedbelow are independent of the selected event. We can see that theparameters are not stable along the signal. Moreover, the dip angleappears to be generally superficial, with occasionally deep bursts,while the azimuths span the entire interval [0–180] degrees. Never-theless, in this figure it can be observed that at the onset of the LPphase, behaviour of all of the parameters different from the rest ofthe signal is visible. At this time RL becomes very high (>0.8), andthe azimuths are directed toward a stable direction, around 150◦,
C© 2009 The Authors, GJI, 177, 1383–1398
Journal compilation C© 2009 RAS
at Universidad de G
ranada - Historia de las C
iencias on April 14, 2015
http://gji.oxfordjournals.org/D
ownloaded from
1392 M. Palo et al.
Fig
ure
7.S
ixex
ampl
essh
owin
gth
eev
olut
ion
ofth
eap
pare
ntsl
owne
ssfo
rdi
ffer
ent
LP
sign
als
asso
ciat
edto
the
volc
anic
expl
osio
nsat
Vol
can
deC
olim
a.W
eha
vere
mar
ked
the
firs
tse
cond
sof
the
LP
sign
als
whe
reit
isvi
sibl
eho
wth
eap
pare
ntsl
owne
ssgr
ows.
C© 2009 The Authors, GJI, 177, 1383–1398
Journal compilation C© 2009 RAS
at Universidad de G
ranada - Historia de las C
iencias on April 14, 2015
http://gji.oxfordjournals.org/D
ownloaded from
Seismic wavefield properties of volcanic explosions 1393
Figure 8. (a) Rose diagram of the backazimuth solutions obtained for the volcanic explosions in the 0.5–2.0 Hz frequency band. The statistics was done usingmore than 15 000 solutions. (b) Histogram of the apparent slowness values. Note that the backazimuth solutions point toward the crater area.
and the dip angle points to a greater depth (<70◦). These charac-teristics are visible for the next 10–15 s. To focus on the primarysource mechanism we have enlarged upon this behaviour and havefiltered the series in the band [0.5–2.0] Hz; which is the frequencyband associated with the LP event.
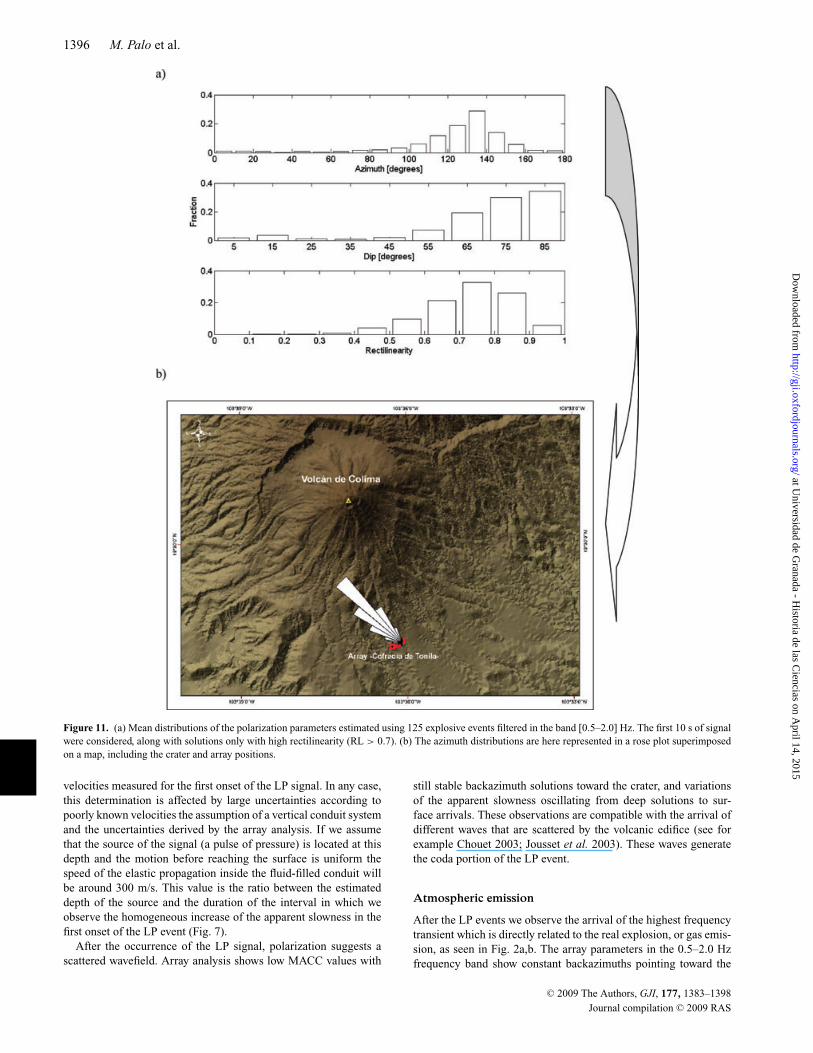
Therefore, we have focused our attention on the polarizationproperties of the first arrival of the explosive signals. Fig. 11 showsthe distribution of the polarization vector parameters for the first 10 s
of the LP event. These percent histograms are the mean distributionsobtained averaging on all the SA events (125); in this way thecommon properties should emerge. Moreover, only values withhigh RL have been used. The distribution of the azimuths has apeak that corresponds to about 140◦, as is also shown in Fig. 11bwhere the solutions have been plotted as a rose plot. The directiondoes not point exactly to the crater, but has a deviation angle of10–20◦. The shape of the azimuth distribution (comprising a single
C© 2009 The Authors, GJI, 177, 1383–1398
Journal compilation C© 2009 RAS
at Universidad de G
ranada - Historia de las C
iencias on April 14, 2015
http://gji.oxfordjournals.org/D
ownloaded from
1394 M. Palo et al.
Figure 9. The same period considered in Figure 6, but in the 2.0–4.0 Hzfrequency band. Note that high MACC values can only be seen for the onsetof the LP event of volcanic explosion.
maximum) and the crater-to station distance are compatible withcompressional body waves slightly modified by medium effects,or by a mixture of P- and Rayleigh waves. In the second row ofFig. 11a the distribution of the dip angles is given. The fractionsgrow moving from the deeper angles to the superficial ones. Finally,the distribution of RL (which was calculated without consideringthe threshold) shows that many windows have a high RL. The samedistributions have been also calculated for times beyond the first10 s. In these cases the azimuth distribution no longer shows anevident peak, and the dip distribution shows a dominant peak for
values greater than 80◦ indicating a very superficial polarizationvector that is arrival of surface waves.
Therefore, we have seen that the values of the azimuth are stableduring the first seconds of the LP signal and they point approxi-mately to the craters. On the other hand the dip angles span a largeinterval of values although the contribution of the lower angles (i.e.,those pointing to deeper zones) is relatively important. The particlemotion of the first seconds of LP phase enlighten on the behaviourof the dip angles. In Fig. 12 we show the particle motions in theradial–vertical plane for the first 15 s of LP phase of four SA events.Each slide contains 2.5 s of motion and the time grows moving fromthe top to the bottom of the figure. As can be clearly seen in thefigure the particle motion has a high degree of rectilinearity in thesetimes. Moreover, we note that at the beginning of the explosion themotion is superficial. In a few seconds it becomes steep, and in thesubsequent times it evolves and returns to be superficial. The in-creasing of the dip angles lasts 10–15 s on average. During this timeit varies approximately in the range [60◦–90◦] from the vertical.This behaviour can be observed contemporary to the increasing ofthe apparent slowness described before.
6 D I S C U S S I O N
Before discussing the results that we have obtained in this study ofthe seismic wavefield analysis of the SA events of Volcan de Colimawe would like to summarize our main observations:
1. Volcanic explosions at Volcan de Colima generate a charac-teristic seismic signature that we call SA event. It is characterizedby an initial LP event (30–60 s long), and is followed by a higherfrequency transient with variable amplitude and duration (from afew to tens of minutes). The amplitudes and durations of the highfrequency transients correlate with the type of material emitted bythe volcano as ash or vapour.
2. The LP event spectrum peaks at around 1 Hz whereas thesuccessive high frequency transients peak at between 1.5 and4.0 Hz. In some of the explosions the seismogram clearly showsa lower frequency onset with a frequency lower than or close to 0.5Hz. The response of our instruments cannot resolve the amplitudesof this signal.
3. Array analysis of the background noise shows a random dis-tribution of backazimuth and apparent slowness.
4. Array analysis of the SA events in the 0.5–2.0 Hz band showshigh correlation values to which the stable backazimuth solutionspointing to the crater area and the systematic behaviour of the ap-parent slowness correspond. The latter parameter first grows (fromvalues compatible with the arrival of body waves to the receivers),then oscillates, and finally remains stable at values compatible withthe surface wave arrivals.
5. In the 2.0–4.0 Hz frequency band the SA events have coherentphases only during the first 2 to 3 s of the LP event. During thisinterval there are high MACC values (close to 1) stable apparentslowness solutions (around 0.35 s/km), and a backazimuth pointingto the crater area are observed. At the later times the array parametersare distributed randomly with low correlation values.
6. Polarization analysis of the LP arrival shows radially polar-ized signals for the first 10–15 s. During this period the dip pa-rameter has a displacement of the source position from depth tothe surface (from 60◦ to 90◦) and the RL appears stable with val-ues greater than 0.7 that can be interpreted as the arrival of bodywaves.
C© 2009 The Authors, GJI, 177, 1383–1398
Journal compilation C© 2009 RAS
at Universidad de G
ranada - Historia de las C
iencias on April 14, 2015
http://gji.oxfordjournals.org/D
ownloaded from
Seismic wavefield properties of volcanic explosions 1395
Figure 10. (a) Vertical component of the seismic recording for an explosion that occurred on 2005-10-01, 19:21:40 h (starting time on the x scale), filtered inthe frequency range [0.5–8.0] Hz. This event is the same of the Figure 6. (b)–(d) Evolution of the corresponding polarization parameters. We have shadowedthe part corresponding to the onset of the LP event.
7. Polarization parameters of the high frequency arrivals indicatesurface polarization with lower RL and a random distribution of theazimuth.
Following these observations, we can draw a possible conceptualmodel for the volcanic explosions of Volcan de Colima.
Initial source
All of the SA events contain a LP signal. From the experimentalobservations described above the source of this LP signal is lo-cated at depth. Indeed the apparent velocity is greater than 2.8 km/s(Fig. 6), the RL was close to 1 (Fig. 10), and the dip angle is closeto 60◦ (Fig. 10). These observations are compatible with the arrivalof direct P waves from the source to the array site. The variationof the LP events apparent slowness and dip angle with time can beinterpreted as an evolution from depth to the surface. Indeed, theapparent velocity observed for all analysed events moves from 2.8to 0.8 km/s uniformly (see Fig. 7). This evolution occurs during atime interval that lasts 8–12 s. The longest durations are associatedwith the maximum of the apparent velocities (of the LP onset).Backazimuth solutions of array analysis and the azimuth from po-larisation studies remain stable along the evolution of the signalspointing toward the crater area. The dip angle (Fig. 12) also growsin a similar manner to the apparent velocity, reaching values of 90◦,which indicates shallow sources. Over this time the rectiliniarityremains high. These observations are compatible with the propaga-tion toward the surface of a pressure source generated by a pressurestep, �P, which acts on the magmatic system (bubble generation,fluid displacement, or other). The pressure source set both the con-duit into oscillation and the primary elastic waves travelling alongthe direct path between the source and receiver. Trapped waves havebeen modelled in previous published work (Chouet 2003; Joussetet al. 2003; Powell & Neuberg 2003). An additional observation
that confirms this conceptual model derives from the array solu-tions observed within 2.0–4.0 Hz band. At these frequencies, onlycoherent arrivals are seen for the first onset of the explosions (onsetof the LP event) with the propagation parameters compatible witha deep source. For the rest of the SA events no coherent phases areobserved at this frequency. We observe the arrival of direct coherentseismic waves only during the initial radiation process where thesource spectrum should be broader than for trapped waves. Laterthe spectrum should be centred at the resonance frequency of thesystem, and coherent arrivals are related to the resonance frequencyof the driven fluid conduit.
The possible depth of the initial source of the LP event can beinferred using the array parameters and inverse ray theory. Sincethere is no specific velocity model for Volcan de Colima we canuse a velocity model calculated at Etna that has already been usedin previous studies (see Almendros et al. 2007 and Table 1). Sinceboth Etna and Colima are strato-volcanoes we can assume as a firstapproximation that their shallow velocity structure will be similar.To calculate the depth of the source we have applied the inverse raytracing procedure. We can assume that the increase in the apparentslowness during the first seconds of the LP signals is due to a changein the position of the source of vibrations which moves toward thesurface along the conduit. This procedure is based on two parametersthe incidence angle of the seismic waves, and a velocity model ofthe medium. We estimate the incidence angle using the value of theapparent slowness of the first onset of the LP signal. This angle isobtained by simple geometrical assumptions knowing the velocityof the seismic waves in the most upper layer. Later we retropropagatethe seismic ray until the path followed by the incoming waves. Westop this inversion just when the seismic ray reaches the expectedposition of the volcanic pipe. Under this assumption an estimationof the maximum depth of the source is in the range between 2.6and 3.3 km below the crater. The variation depth of the sourceis associated with the range variation of the minimum apparent
C© 2009 The Authors, GJI, 177, 1383–1398
Journal compilation C© 2009 RAS
at Universidad de G
ranada - Historia de las C
iencias on April 14, 2015
http://gji.oxfordjournals.org/D
ownloaded from
1396 M. Palo et al.
Figure 11. (a) Mean distributions of the polarization parameters estimated using 125 explosive events filtered in the band [0.5–2.0] Hz. The first 10 s of signalwere considered, along with solutions only with high rectilinearity (RL > 0.7). (b) The azimuth distributions are here represented in a rose plot superimposedon a map, including the crater and array positions.
velocities measured for the first onset of the LP signal. In any case,this determination is affected by large uncertainties according topoorly known velocities the assumption of a vertical conduit systemand the uncertainties derived by the array analysis. If we assumethat the source of the signal (a pulse of pressure) is located at thisdepth and the motion before reaching the surface is uniform thespeed of the elastic propagation inside the fluid-filled conduit willbe around 300 m/s. This value is the ratio between the estimateddepth of the source and the duration of the interval in which weobserve the homogeneous increase of the apparent slowness in thefirst onset of the LP event (Fig. 7).
After the occurrence of the LP signal, polarization suggests ascattered wavefield. Array analysis shows low MACC values with
still stable backazimuth solutions toward the crater, and variationsof the apparent slowness oscillating from deep solutions to sur-face arrivals. These observations are compatible with the arrival ofdifferent waves that are scattered by the volcanic edifice (see forexample Chouet 2003; Jousset et al. 2003). These waves generatethe coda portion of the LP event.
Atmospheric emission
After the LP events we observe the arrival of the highest frequencytransient which is directly related to the real explosion, or gas emis-sion, as seen in Fig. 2a,b. The array parameters in the 0.5–2.0 Hzfrequency band show constant backazimuths pointing toward the
C© 2009 The Authors, GJI, 177, 1383–1398
Journal compilation C© 2009 RAS
at Universidad de G
ranada - Historia de las C
iencias on April 14, 2015
http://gji.oxfordjournals.org/D
ownloaded from
Seismic wavefield properties of volcanic explosions 1397
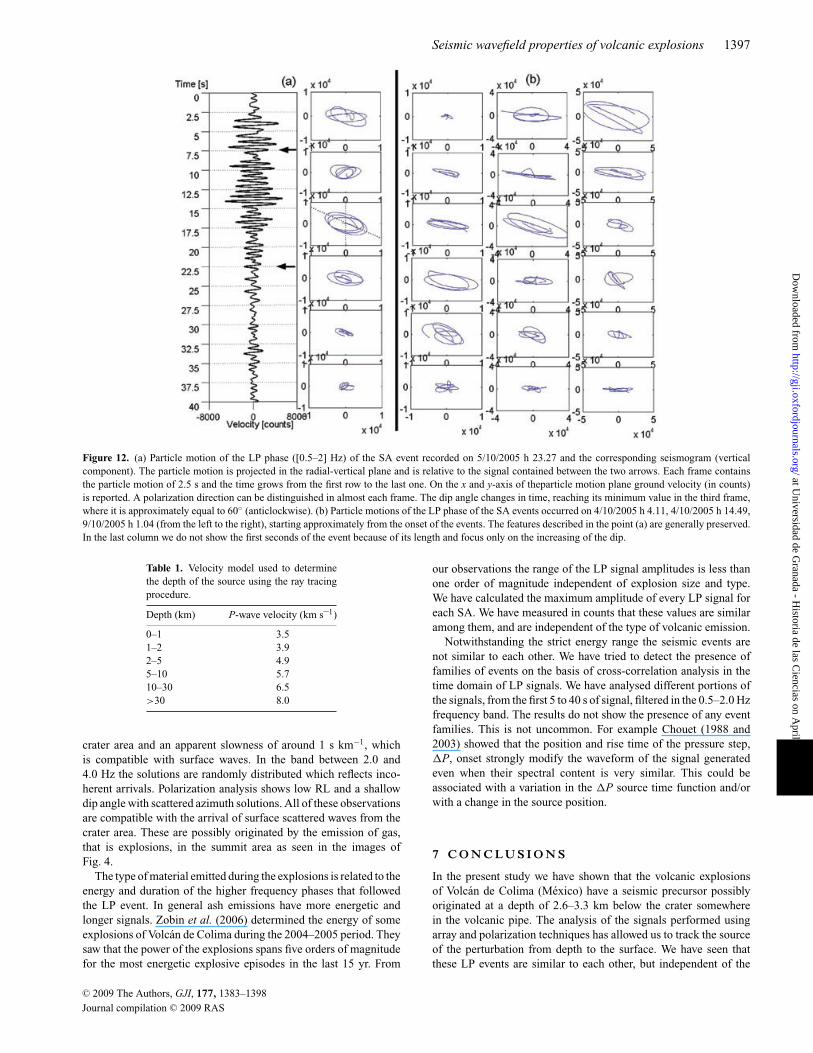
Figure 12. (a) Particle motion of the LP phase ([0.5–2] Hz) of the SA event recorded on 5/10/2005 h 23.27 and the corresponding seismogram (verticalcomponent). The particle motion is projected in the radial-vertical plane and is relative to the signal contained between the two arrows. Each frame containsthe particle motion of 2.5 s and the time grows from the first row to the last one. On the x and y-axis of theparticle motion plane ground velocity (in counts)is reported. A polarization direction can be distinguished in almost each frame. The dip angle changes in time, reaching its minimum value in the third frame,where it is approximately equal to 60◦ (anticlockwise). (b) Particle motions of the LP phase of the SA events occurred on 4/10/2005 h 4.11, 4/10/2005 h 14.49,9/10/2005 h 1.04 (from the left to the right), starting approximately from the onset of the events. The features described in the point (a) are generally preserved.In the last column we do not show the first seconds of the event because of its length and focus only on the increasing of the dip.
Table 1. Velocity model used to determinethe depth of the source using the ray tracingprocedure.
Depth (km) P-wave velocity (km s–1)
0–1 3.51–2 3.92–5 4.95–10 5.710–30 6.5>30 8.0
crater area and an apparent slowness of around 1 s km−1, whichis compatible with surface waves. In the band between 2.0 and4.0 Hz the solutions are randomly distributed which reflects inco-herent arrivals. Polarization analysis shows low RL and a shallowdip angle with scattered azimuth solutions. All of these observationsare compatible with the arrival of surface scattered waves from thecrater area. These are possibly originated by the emission of gas,that is explosions, in the summit area as seen in the images ofFig. 4.
The type of material emitted during the explosions is related to theenergy and duration of the higher frequency phases that followedthe LP event. In general ash emissions have more energetic andlonger signals. Zobin et al. (2006) determined the energy of someexplosions of Volcan de Colima during the 2004–2005 period. Theysaw that the power of the explosions spans five orders of magnitudefor the most energetic explosive episodes in the last 15 yr. From
our observations the range of the LP signal amplitudes is less thanone order of magnitude independent of explosion size and type.We have calculated the maximum amplitude of every LP signal foreach SA. We have measured in counts that these values are similaramong them, and are independent of the type of volcanic emission.
Notwithstanding the strict energy range the seismic events arenot similar to each other. We have tried to detect the presence offamilies of events on the basis of cross-correlation analysis in thetime domain of LP signals. We have analysed different portions ofthe signals, from the first 5 to 40 s of signal, filtered in the 0.5–2.0 Hzfrequency band. The results do not show the presence of any eventfamilies. This is not uncommon. For example Chouet (1988 and2003) showed that the position and rise time of the pressure step,�P, onset strongly modify the waveform of the signal generatedeven when their spectral content is very similar. This could beassociated with a variation in the �P source time function and/orwith a change in the source position.
7 C O N C LU S I O N S
In the present study we have shown that the volcanic explosionsof Volcan de Colima (Mexico) have a seismic precursor possiblyoriginated at a depth of 2.6–3.3 km below the crater somewherein the volcanic pipe. The analysis of the signals performed usingarray and polarization techniques has allowed us to track the sourceof the perturbation from depth to the surface. We have seen thatthese LP events are similar to each other, but independent of the
C© 2009 The Authors, GJI, 177, 1383–1398
Journal compilation C© 2009 RAS
at Universidad de G
ranada - Historia de las C
iencias on April 14, 2015
http://gji.oxfordjournals.org/D
ownloaded from
1398 M. Palo et al.
type of volcanic explosion (Vulcanian or ash-free). Tens of secondsafter the LP generation the aerial explosion takes place with thegeneration of surface waves. These signals have duration of the orderof tens of minutes for Vulcanian explosions and tens of seconds,with relatively lower amplitudes for water-vapour emissions.
A C K N OW L E D G M E N T S
This study was in part financed by the following researchprojects: FIRB (the Italian Ministery of Research) entitled “Anal-isi del campo d’onda associate al vulcanismo attivo”. VOLUME,UE, FP6–2004-Global-3–018471 and SISVOLTEDEC CGL2005-05789-C03-02/ANT. Justo Orozco is performing a research stageat University of Granada granted by PROMEP-Mexico. V. Zobin,Francesca Martini, Javier Almendros, editor Dr Michael Korn, andan anonymous reviewer are gratefully acknowledged for their usefuldiscussions. The ZLCC software was developed by Javier Almen-dros.
R E F E R E N C E S
Abril, M., 2007. Evolucion, diseno y desarrollo de antenas sısmicas. Las an-tenas del Gran Sasso, del Vesubio y las nuevas antenas sısmicas portatilesdel Instituto Andaluz de Geofısica. Aplicacion a zonas tectonicas yvolcanicas, Ph.D. Thesis. University of Granada, Granada, Spain 355pp. (in Spanish).
Almendros, J., Ibanez, J.M., Alguacil, G. & Del Pezzo, E., 1999. Arrayanalysis using circular wave-front geometry: an application to locate thenearby seismo-volcanic source, Geophys. J. Int., 135, 159–172.
Almendros, J., et al. 2000. A double seismic antenna experiment at TeideVolcano: existence of local seismicity and evidence for the non-existenceof volcanic tremor, J. Vol. Geo. Res., 103, 439–462.
Almendros J., Ibanez, J.M, Carmona, E. & Zandomeneghi, D., 2007. Arrayanalyses of volcanic earthquakes and tremor recorded at Las Canadascaldera (Tenerife Island, Spain), during the May 2004 seismic activationof Teide volcano, J. Volcanol. Geotherm. Res., 160, 285–299.
Aster, R., Mah, S., Kyle, P., McIntosh, W., Dunbar, N., Johnson, J., Ruiz, M.& McNamara, S., 2003. Very long period oscillations of Mount Erebusvolcano, J. Geophys. Res., 108, 2522–2541.
Bottiglieri, M., De Martino, S., Falanga, M., Godano, C. & Palo, M., 2005.Statistics of inter-time of Strombolian explosion-quakes, Europhys. Lett.,72, 493–498.
Breton, M., Ramırez, J.J. & Navarro, C., 2002. Summary of the historicaleruptive activity of Volcan de Colima, Mexico 1519–2000, J. Volcanol.Geotherm. Res., 117, 21–46.
Cashman, K.V., Sturtevant, B., Papale, P. & Navon, O., 2000. Magmaticfragmentation, in Encyclopedia of Volcanoes, pp. 1417, ed. Sigurdsson,H., Academic Press, San Diego, CA.
Chouet, B.A., 1986. Dynamics of a fluid-driven crack in three dimensionsby the finite difference method, J. Geophys. Res., 91, 13967–13992.
Chouet, B., 1988. Resonance of a fluid-driven crack: radiation properties andimplications for the source of long-period events and harmonic tremor, J.Geophys. Res., 93, 4375–4400.
Chouet, B., 1996. Long-period volcano seismicity: its source and use ineruption forecasting, Nature, 380, 309–316.
Chouet, B., 2003. Volcano seismology, Pure Appl. Geophys., 160, 739–788.Chouet, B., Dawson, P. & Arcienaga-Ceballos, A., 2005. Source mechanisms
of Vulcanian degassing at Popocatepelt Volcano, Mexico, determinedfrom wave-form inversions of very long period signals, J. Geophys. Res.110, B07301, doi:10.1029/2004JB003524.
De Lauro, E., De Martino, S., Del Pezzo, E., Falanga, M., Palo, M. &Scarpa, R., 2009. Model for high frequency Strombolian tremor inferred
by wavefield decomposition and reconstruction of asymptotic dynamics.J. Geophys. Res., in press.
Del Pezzo, E., La Rocca, M. & Ibanez, J.M., 1997. Observation of highfrequency scattered waves using dense arrays at Teide Volcano, Bull.Seism. Soc. Am., 87, 1637–1647.
Frankel, A., Hough, S., Friberg, P. & Busby, R., 1991. Observations ofLoma Prieta aftershocks from a dense array in Sunnyvale, California,Bull. Seism. Soc. Am., 81, 1900–1922.
Ibanez, J.M., Del Pezzo, E., Almendros, J., La Rocca, M., Alguacil, G.,Ortiz, R. & Garcıa A., 2000. Seismo volcanic signals at Deception Islandvolcano (Antarctica): wavefield analysis and source modeling, J. Geophys.Res., 105, 13905–13931.
Ibanez, J.M., Del Pezzo, E., Bengoa, C., Caselli, A., Badi, G. & Almendros,J., 2008. Volcanic tremor and local earthquakes at Copahue volcaniccomplex, Southern Andes, Argentina. J. Volcanol. Geotherm. Res., 174,184–194.
Jousset, P., Neuberg, J. & Sturton, S., 2003. Modelling the time-dependentfrequency content of low-frequency volcanic earthquakes. J. Volcanol.Geotherm. Res., 128, 201–223.
Kanasewich, E.R., 1981. Time sequence analysis, in Geophysics, Universityof Alberta Press, Edmonton, Canada.
La Rocca, M., Petrosino, S., Saccorotti, G., Simini, M., Ibanez, J.M., Al-mendros, J. & Del Pezzo, E., 2000. Location of the source and shallowvelocity model deduced by the explosion quakes recorded by two seismicantennas at Stromboli volcano, Phys. Chem. Earth 25, 731–736.
La Rocca, M., Saccorotti, G., Del Pezzo, E. & Ibanez, J., 2004. Probabilisticsource location of explosion quakes at Stromboli volcano estimated withdouble array data, J. Volcanol. Geotherm. Res., 131, 123–142.
Lane, S.J., Chouet, B.A., Phillips, J.C., Dawson, P., Ryan, G.A. & Hurst, E.,2001. Experimental observations of pressure oscillations and flow regimesin an analogue volcanic system. J. Geophys. Res., 106, 6 461–6 476.
Luhr, J.F., 2002. Petrology and geomechistry of the 1991 and 1998–1999lava flows from Volcan de Colima, Mexico: Implications for the end ofthe current eruptive cycle, J. Volcanol. Geotherm. Res., 117, 169–194.
Morrissey, M.M. & Mastin, L.G., 2000. Vulcanian eruptions, in Encyclo-pedia of Volcanoes, pp. 1417, ed. Sigurdsson, H., Academic Press, SanDiego, CA.
Powell, T.W. & Neuberg, J., 2003. Time dependent features in tremor spectra,J. Volcanol. Geotherm. Res., 128, 177–185.
Ripepe, M., Ciliberto, S. & Della Schiava, M., 2001. Time constraints formodelling source dynamic of volcanic explosions at Stromboli, J. Geo-phys. Res., 106, 8713–8727.
Saccorotti, G. & Del Pezzo, E., 2000. A probabilistic approach to the inver-sion of data from a seismic array and its implication to volcanic signals,Geophys. J. Int., 143, 249–261.
Saccorotti, G., Zuccarello, L., Del Pezzo, E., Ibanez, J.M. & Gresta, S.,2004. Quantitative analysis of the tremor wavefield at Etna volcano, Italy,J. Volcanol. Geotherm. Res., 136, 223–245.
Sturton, S. & Neuberg, J., 2006. The effects of conduit length and acousticvelocity on conduit resonance: Implications for low-frequency events, J.Volcanol. Geotherm. Res., 151, 319–339
Vergniolle, S. & Mangan, M., 2000. Hawaiian and Strombolian eruptions, inEncyclopedia of Volcanoes, pp. 447–461, ed. Sigurdsson, H., AcademicPress, San Diego, CA.
Zobin, V.M.et al;, 2002. Overview of the 1997–2000 activity of Volcan deColima, Mexico, J. Volcanol. Geotherm. Res., 117, 1–19.
Zobin, V.M., Orozco-Rojas, J, Reyes-Davila, G. & Navarro, C., 2005. Seis-micity of an andesitic volcano during block-lava effusion: Volcan de Col-ima, Mexico, November 1998–January 1999, Bull. Volcanol., 67, 679–688.
Zobin, V.M., Navarro, C., Reyes-Davil, G., Orozco, J., Breton, M., Tellez,A., Reyes-Alfaro, G. & Vazquez, H., 2006. The methodology of quan-tification of volcanic explosions from broad-band seismic signals and itsapplication to the 2004–2005 explosions at Volcan de Colima, Mexico,Geophys. J. Int., 167, 467–478.
C© 2009 The Authors, GJI, 177, 1383–1398
Journal compilation C© 2009 RAS
at Universidad de G
ranada - Historia de las C
iencias on April 14, 2015
http://gji.oxfordjournals.org/D
ownloaded from