Numerical modelling of tephra fallout associated with dome collapses and Vulcanian explosions:...
21
Numerical modelling of tephra fallout associated with dome collapses and Vulcanian explosions: application to hazard assessment on Montserrat C. BONADONNA~, G. MACEDONIO* & R. S. J. SPARKS' Department of Earth Sciences, University of Bristol, Bristol BS8 IRJ, UK (e-mail: [email protected]) Osservatorio Vesuviano, Via Diocleziano 328, 80 124 Napoli, Italy Abstract: Hazardous effects of tephra fallout on Montserrat include roof collapse, aviation threats, health hazards from respirable crystalline silica, crop pollution, road safety and lahar generation. An advection-diffusion model was developed to investigate tephra dispersal from dome collapses and Vulcanian explosions, which generated most of the fallout tephra during the 1995-1999 eruptive period of Soufritre Hills Volcano. Wind field, atmospheric diffusion, gravity settling, aggregation and elutriation processes are considered. Computed isomass maps compare well with field observations and require aggregation of fine ash for good agreement. Probability maps were also compiled. Individual probability maps (for individual dome collapses and Vulcanian explosions) are based on the statistics of wind profiles and show that fallout tephra generated by individual erup- tive events on a Montserrat scale do not cause serious damage in any area on Montserrat. Cumulative probability maps (for a given scenario of activity) are generated by sampling statistical distributionsof wind profiles and eruptive events over an extended period of time. They show that persistent tephra fallout can accumulate enough material to cause roof collapses and serious damage to vegetation in the SW part of the island, and minor damage to vegetation in the north, as also confirmed by field data. The study of tephra fallout from Soufrikre Hills Volcano, Mont- serrat, became a priority for hazards assessment when tephra fallout started to have a substantial effect on the quality of life of people living and working close to the volcano. There are several hazardous effects of fallout tephra: roof collapse, aviation threats, health hazards from respirable crystalline silica, crop pollution, road safety and lahar generation (Blong 1984; Baxter et a/. 1999). In this paper the term tephra is used in the original sense of Thorarinsson (1944), as a collective term for all particles ejected from volcanoes irrespective of size, shape and composition, whereas tephrafallout indicates the process of particle fallout. Processes leading to significant tephra fallout on Montserrat during the 1995-1999 period were mainly Vulcanian explosions and elutriation of fines from dome-collapse pyroclastic flows. Vulcanian explosions produced more fallout tephra in about five weeks in 1997 than did dome collapses in about one year from June 1996 to June 1997 (Bonadonna et al. 2002). However, the ash associated with dome-collapse pyroclastic flows seems to be more hazardous to health than Vulcanian tephra, as it contains more crystalline silica and is very fine-grained (Baxter et a/. 1999; Moore et al. 2002). Furthermore, large dome collapses also occurred once dome growth had stopped in March 1998, being purely gravitational and not needing any magmatic input (Norton et a[. 2002). In this paper an advection-diffusion model for dispersal of tephra from discrete sources is presented. This model is aimed a t improving understanding of particle fallout from multiple plumes generated by dome collapses and Vulcanian explosions. Diffusion, advection by wind transport and particle sedimentation are described using a physical model, which is a two-dimensional modification of that presented by Armienti et al. (1988). Previous models (e.g. Suzuki 1983; Armienti et a/. 1988; Glaze & Self 1991) considered dispersal of tephra from point-source plumes, in particular Plinian eruptions. Here we adapt these models to consider also weaker, fine-grained ash plumes from distributed sources in the areas inundated by pyro- clastic flows. The results are compared with data gathered at Montserrat Vol- cano Observatory (MVO) throughout the Soufrikre Hills Volcano 1995-1999 eruptive period. This model (HAZMAP) was developed as part of the emergency response programme on the effects of vol- canic ash, which started in July 1997. Elutriation from pyroclastic flows Tephra-fallout deposits from pyroclastic flows were first recognized and described by Lacroix (1904) and Hay (1959) in studies of the eruption of Mont Pelke on Martinique and Soufrihre of St Vincent in 1902. Sparks & Walker (1977) recognized that many deposits are commonly enriched in glass particles, and are complementary to the deposits of coevally emplaced pyroclastic flows, which are often enriched in crystals. They called this kind of tephra co-ignimbrite ash. Co-ignimbrite ash is very fine grained (typically <I mm), resulting from the combination of progressive fragmentation of material within the pyroclastic flows and elutriation of fines by expanding gases. However, pyroclastic-flow deposits produced by dome collapses are not strictly ignimbrites, if ignimbrite is defined as a deposit formed from pumiceous pyroclastic flows (Sparks et a/. 1973). In this paper, ash plumes from dome-collapse and fountain- collapse pyroclastic flows will be termed co-pyroclastic-flow plumes, or co-PFplumes. Experimental studies (Huppert et al. 1986; Carey et al. 1988; Woods & Caulfield 1992; Sparks et al. 1993; Woods & Bursik 1994), combined with observations and modelling (Sparks et a/. 1986; Dobran et a/. 1993; Hoblitt 1986; Woods & Kienle 1994; Calder el al. 1997), have helped in understanding the mechanisms lead- ing to the formation of co-PF plumes. Such plumes form by release and expansion of gases as the juvenile fragments disintegrate, and by expansion of air entrained into the flow. Large flows can generate very high ash plumes by buoyant lift-off, where the whole upper part of the flow ascends buoyantly due to entrainment and heating of air and sedimentation (Sparks et al. 1993). Studies at Mount St Helens show that topography plays an important role in the formation of such co-PF plumes (Hoblitt 1986; Levine & Kieffer 1991; Calder et al. 1997). Breaks in slope, bends and jumps cause enhanced mix- ing with air and produce more vigorous pulses of plume buoyancy, aiding the formation of discrete plumes, which merge as they ascend. Calder et a/. (1997) showed that the behaviour of ash plumes from pyroclastic flows at Mount St Helens (1980) were intermediate between that of a discrete thermal and a steady flux source. Eruption summary SoufriGre Hills Volcano is an andesitic dome complex, which started to erupt on 18 July 1995 (Robertson et al. 2000) after being dormant for at least 350 years (Wadge & Isaacs 1988; Harford et al. 2002). From November 1995, a new lava dome started to grow inside English's Crater (Fig. 1) and the first substantial pyroclastic flow was produced on 31 March 1996 by collapse of the new dome. Pyroclastic flows were initially confined to the Tar River valley, progressively building a delta in the sea. In March 1997 pyroclastic flows started to move down the White River valley on the southern flanks (Fig. 1). In May and June 1997, pyroclastic flows started DRUITT, T. H. & KOKELAAR, B. P. (eds) 2002. The Eruption of SoufriGre Hills Volcano, Montserrat, from 1995 to 1999. Geological Society, London, Memoirs, 21, 517-537. 0435-4052/02/$15 0 The Geological Society of London 2002.
Transcript of Numerical modelling of tephra fallout associated with dome collapses and Vulcanian explosions:...

Numerical modelling of tephra fallout associated with dome collapses and Vulcanian explosions: application to hazard assessment on Montserrat
C. BONADONNA~, G. MACEDONIO* & R. S. J. SPARKS' Department of Earth Sciences, University of Bristol, Bristol BS8 IRJ, U K
(e-mail: [email protected]) Osservatorio Vesuviano, Via Diocleziano 328, 80 124 Napoli, Italy
Abstract: Hazardous effects of tephra fallout on Montserrat include roof collapse, aviation threats, health hazards from respirable crystalline silica, crop pollution, road safety and lahar generation. An advection-diffusion model was developed to investigate tephra dispersal from dome collapses and Vulcanian explosions, which generated most of the fallout tephra during the 1995-1999 eruptive period of Soufritre Hills Volcano. Wind field, atmospheric diffusion, gravity settling, aggregation and elutriation processes are considered. Computed isomass maps compare well with field observations and require aggregation of fine ash for good agreement. Probability maps were also compiled. Individual probability maps (for individual dome collapses and Vulcanian explosions) are based on the statistics of wind profiles and show that fallout tephra generated by individual erup- tive events on a Montserrat scale do not cause serious damage in any area on Montserrat. Cumulative probability maps (for a given scenario of activity) are generated by sampling statistical distributions of wind profiles and eruptive events over an extended period of time. They show that persistent tephra fallout can accumulate enough material to cause roof collapses and serious damage to vegetation in the SW part of the island, and minor damage to vegetation in the north, as also confirmed by field data.
The study of tephra fallout from Soufrikre Hills Volcano, Mont- serrat, became a priority for hazards assessment when tephra fallout started to have a substantial effect on the quality of life of people living and working close to the volcano. There are several hazardous effects of fallout tephra: roof collapse, aviation threats, health hazards from respirable crystalline silica, crop pollution, road safety and lahar generation (Blong 1984; Baxter et a/. 1999). In this paper the term tephra is used in the original sense of Thorarinsson (1944), as a collective term for all particles ejected from volcanoes irrespective of size, shape and composition, whereas tephrafallout indicates the process of particle fallout.
Processes leading to significant tephra fallout on Montserrat during the 1995-1999 period were mainly Vulcanian explosions and elutriation of fines from dome-collapse pyroclastic flows. Vulcanian explosions produced more fallout tephra in about five weeks in 1997 than did dome collapses in about one year from June 1996 to June 1997 (Bonadonna et al. 2002). However, the ash associated with dome-collapse pyroclastic flows seems to be more hazardous to health than Vulcanian tephra, as it contains more crystalline silica and is very fine-grained (Baxter et a/. 1999; Moore et al. 2002). Furthermore, large dome collapses also occurred once dome growth had stopped in March 1998, being purely gravitational and not needing any magmatic input (Norton et a[. 2002).
In this paper an advection-diffusion model for dispersal of tephra from discrete sources is presented. This model is aimed a t improving understanding of particle fallout from multiple plumes generated by dome collapses and Vulcanian explosions. Diffusion, advection by wind transport and particle sedimentation are described using a physical model, which is a two-dimensional modification of that presented by Armienti et al. (1988). Previous models (e.g. Suzuki 1983; Armienti et a/. 1988; Glaze & Self 1991) considered dispersal of tephra from point-source plumes, in particular Plinian eruptions. Here we adapt these models to consider also weaker, fine-grained ash plumes from distributed sources in the areas inundated by pyro- clastic flows.
The results are compared with data gathered a t Montserrat Vol- cano Observatory (MVO) throughout the Soufrikre Hills Volcano 1995-1999 eruptive period. This model (HAZMAP) was developed as part of the emergency response programme on the effects of vol- canic ash, which started in July 1997.
Elutriation from pyroclastic flows
Tephra-fallout deposits from pyroclastic flows were first recognized and described by Lacroix (1904) and Hay (1959) in studies of the
eruption of Mont Pelke on Martinique and Soufrihre of St Vincent in 1902. Sparks & Walker (1977) recognized that many deposits are commonly enriched in glass particles, and are complementary to the deposits of coevally emplaced pyroclastic flows, which are often enriched in crystals. They called this kind of tephra co-ignimbrite ash. Co-ignimbrite ash is very fine grained (typically < I mm), resulting from the combination of progressive fragmentation of material within the pyroclastic flows and elutriation of fines by expanding gases. However, pyroclastic-flow deposits produced by dome collapses are not strictly ignimbrites, if ignimbrite is defined as a deposit formed from pumiceous pyroclastic flows (Sparks et a/. 1973). In this paper, ash plumes from dome-collapse and fountain- collapse pyroclastic flows will be termed co-pyroclastic-flow plumes, or co-PFplumes.
Experimental studies (Huppert et al. 1986; Carey et al. 1988; Woods & Caulfield 1992; Sparks et al. 1993; Woods & Bursik 1994), combined with observations and modelling (Sparks et a/. 1986; Dobran et a/. 1993; Hoblitt 1986; Woods & Kienle 1994; Calder el al. 1997), have helped in understanding the mechanisms lead- ing to the formation of co-PF plumes. Such plumes form by release and expansion of gases as the juvenile fragments disintegrate, and by expansion of air entrained into the flow. Large flows can generate very high ash plumes by buoyant lift-off, where the whole upper part of the flow ascends buoyantly due to entrainment and heating of air and sedimentation (Sparks et al. 1993). Studies at Mount St Helens show that topography plays an important role in the formation of such co-PF plumes (Hoblitt 1986; Levine & Kieffer 1991; Calder et al. 1997). Breaks in slope, bends and jumps cause enhanced mix- ing with air and produce more vigorous pulses of plume buoyancy, aiding the formation of discrete plumes, which merge as they ascend. Calder et a/. (1997) showed that the behaviour of ash plumes from pyroclastic flows at Mount St Helens (1980) were intermediate between that of a discrete thermal and a steady flux source.
Eruption summary
SoufriGre Hills Volcano is an andesitic dome complex, which started to erupt on 18 July 1995 (Robertson et al. 2000) after being dormant for a t least 350 years (Wadge & Isaacs 1988; Harford et al. 2002). From November 1995, a new lava dome started to grow inside English's Crater (Fig. 1) and the first substantial pyroclastic flow was produced on 31 March 1996 by collapse of the new dome. Pyroclastic flows were initially confined to the Tar River valley, progressively building a delta in the sea. In March 1997 pyroclastic flows started to move down the White River valley on the southern flanks (Fig. 1). In May and June 1997, pyroclastic flows started
DRUITT, T. H. & KOKELAAR, B. P. (eds) 2002. The Eruption of SoufriGre Hills Volcano, Montserrat, from 1995 to 1999. Geological Society, London, Memoirs, 21, 517-537. 0435-4052/02/$15 0 The Geological Society of London 2002.

518 C. BONADONNA ET AL.
Fig. 1. Topographic map of Montserrat showing the main valleys followed by both dome-collapse and fountain-collapse pyroclastic flows during the eruptive period 1995-1999 (WR, White River valley; FG, Fort Ghaut; TyG, Tyre's Ghaut; MG, Mosquito Ghaut; TG, Tuitt's Ghaut; WG, White's Ghaut; TR: Tar River valley). These valleys are highlighted by the positions of original rivers (dashed lines). Key localities are also shown: localities a, b and c (white triangles) are used for comparisons of computed with observed grain-size distributions (Fig. 18); locality c is also used to assess the accuracy of Monte-Carlo simulations (Fig. 23). Some of the most important populated areas are shown for the final discussion on hazard assessment.
travelling also down Tuitt's Ghaut and Mosquito Ghaut on the northern side of the volcano and down Fort Ghaut on the west- ern side (Fig. 1). On 25 June 1997 a large dome-collapse pyroclas- tic flow nearly reached the sea on the eastern coast, and caused the deaths of 19 people (Loughlin et a[. 2002). On 3 August 1997 a pyroclastic flow reached the capital Plymouth via Fort Ghaut. A series of 13 repetitive Vulcanian explosions with associated foun- tain collapse then occurred from 4 to 12 August 1997 (Druitt et a[. 2002). On 21 September 1997 another large dome collapse pyro- clastic flow travelled down Tuitt's Ghaut and White's Ghaut (Fig. 1) and entered the sea, triggering another series of 75 Vulcanian explosions, which ended on 21 October 1997 (Druitt et al. 2002). After this second series of Vulcanian explosions, the dome con- tinued to grow and produced further dome-collapse pyroclastic flows in early November 1997. On 26 December 1997 a flank failure accompanied the largest dome collapse to date (46 x lo6 m3 dense rock equivalent (DRE), Calder et a/. 2002). This occurred down the White River valley, causing widespread damage to the south of the island. Three other large dome collapses occurred after the lava dome stopped growing in March 1998: 3 July 1998, 12 November 1998 and 20 July 1999 (Norton et al. 2002). Tephra fallout has continued since dome growth resumed in November 1999 and has largely been related to rockfall activity and small pyroclastic flows.
Modelling
HAZMAP is a Fortran code for the solution of the equations of particle diffusion, transport and sedimentation used to model the dispersion of a volcanic plume in the atmosphere and the deposition of fallout tephra. The model is an application of the theory of Armienti et 01. (1988) and Macedonio et 01. (1988), with a simpli- fication of the equations from three to two dimensions. A similar application has been used to compile fallout hazard maps in the Vesuvius area (Italy), with the volcanic plume simulated as a verti- cal line and the vent located at the origin of the co-ordinate system (e.g. Barberi et a/ . 1990).
The concentration of particles in the plume C, is described by the following mass-conservation equation:
ac, ac, ac, aci a2c. a2cj ~ + w . y - f b V I , - V . - = R . & l a z K L + K V - ,y
ax2 . ay2 (1)
where x , y , z are the spatial co-ordinates, C, is the mass concentration of particles (kgm-3) corresponding to the settling- velocity class j, t is the time, i i ~ , and w,, are the x and y components of the wind velocity, K, and K,, are the horizontal diffusion coeffi- cients, and vi is the settling velocity of the particles of the size class j. The vertical wind component is assumed to be negligible. Verti- cal diffusion coefficient Kz is small above 500 m of altitude (Pasquill 1974), and therefore is assumed to be negligible. Horizontal diffu- sion is considered constant and isotropic (K = K, = K,). K depends on the typical area scale of the event, varying over the ranges 0-250 m2 s-' and 1000-10 000 m2 s-' a t the scales of a few tens of kilom- etres and a few hundreds of kilometres respectively (Pasquill 1974). K is not strictly a diffusion coefficient in HAZMAP, but an empir- ical parameter that takes into account the total factors affectingthe horizontal expansion of the volcanic cloud (i.e. atmospheric eddy diffusion and gravity flow at the height of neutral buoyancy). There- fore values of K in HAZMAP are expected to be slightly greater than the values of diffusion coefficient presented by Pasquill (1974).
HAZMAP investigates tephra dispersal from a system of discrete volcanic plumes, each of which is simulated as a vertical line and located at a point source i. Mass distribution along these lines is uniform unless stated otherwise. An analytical solution exists for Equation 1 for each instantaneous point source i. Each point source is processed independently due to the linearity of Equation 1, and the mass accumulated on the ground is obtained by summing that from each point source. Particle fallout is con- trolled by turbulent diffusion and wind transport on the horizontal axis, and by settling velocity on the vertical axis. Volcanic plumes are represented as instantaneous sources, with all the particles erupted at t = 0. Furthermore, every discrete plume and every pyroclastic flow is emplaced at the initial instant ( t = 0). Particles are assumed to be spherical, and the whole grain-size distribution is transformed into a settling-velocity spectrum. Wind velocity and direction typically vary with height. In HAZMAP the atmosphere is divided into horizontal layers characterized by a uniform horizontal wind velocity and direction specific for each layer. Each point source i is located in a horizontal layer, and particles released from that point source are initially transported by the wind specific for that layer, until they fall into a lower layer, whe~ are affected by a different wind. This process continues un particles reach the ground. Inside each layer, particle trans] described by the solution of Equation 1 in the x - y plan' emission from an instantaneous point source, the soluti Equation 1 is a Gaussian distribution of concentration in botl
.e they ~til the port is m Cnr
and y directions. Particles spread horizontally due to the con effects of turbulent eddy diffusion and gravity spreading
U. I " I
Ion to h the x ~bined - .
plume, and are transported by the wind for the time Stj SF
each layer. St, is a function of the settling velocity v, of the pa and the layer thickness 6z (St, = bz/vj). After the time 6tj, the of the Gaussian distribution is shifted in the x - y plane k tances of 6xj = w,6tj and 6yj = wyStj along the axes x respectively, where w, and w,, are the horizontal components wind speed in that layer. Particles falling from a point sc,,,, .
)y dis- and y of the
~ I I V P P i
of the jent in, ~rticles centre

MODELLING O F DOME-COLLAPSE AND VULCANIAN FALLOUT 519
located at (xi, yi,zi) reach the ground at the time ti,j, where ti?, = El,, 6rj = zi/v,. Therefore, the mass accumulation on the ground, Mi,,, of the particles j, released from the point source i is:
where M : ~ is the mass of particles released from the source point i and corresponding to the settling-velocity class j, xi,, and ji,, are the co-ordinates of the centre of the Gaussian distribution (,Yi,j = xi + Clu,,ers GX,,J~,~ = yi + Cia 6yj) and u:j is the width of the Gaussian distribution (ab = 2Kti.j).
Definition of the phys~cal system (total erupted mass, grain-size distribution, wind velocity profile, diffusion coefficient) and the computational grid are needed as input parameters. HAZMAP consists of four modules: the first module modifies the original grain-size distribution according to an aggregation model; the second module reads the modified grain-size distribution and redistributes the particles into settling-velocity categories according to their size and density; the third module calculates the vertical mass distribution along the column and generates the point-source distribution; the fourth module generates the output file (isomass/ probability maps) based on the input wind data, together with the input file produced by the pfevious module. All these modules and assumptions are discussed further below.
/ Parameters used in the modelling
The simulation of tephra dispersal from dome-collapse and Vulcanian plumes is based on the data gathered during the eruptive period of Soufribre Hills Volcano from 1995 to 1999. Tephra dispersal depends mainly on plume height, grain-size distribution and wind profile. In the case of co-PF plumes the direction and runout of the parent pyroclastic flows are also important.
Plume height
Vulcanian explosions generated two types of plume: a vent plume (main plume centred on the vent) and co-PF plumes (ash plumes from pyroclastic flows). During the eruptive period 1995-1999 of Soufrikre Hills Volcano, Vulcanian vent plumes and co-PF plumes reached heights of up to 15 and 3 km above sea level (a.s.1.) respec- tively. Co-PF plumes from dome-collapse pyroclastic flows typic- ally ascended to several thousands of metres. The highest co-PF plume was observed during the 26 December 1997 dome collapse, and reached about 15 km a.s.1. (Mayberry et al. 2002).
Given their very short periods of peak discharge, both co-PF plumes and Vulcanian vent plumes are modelled here as the instan- taneous injection of a thermal of a given initial mass (Woods & Kienle 1994; Druitt et a[. 2002). The height H (m) of a volcanic thermal rising into the troposphere can be expressed as:
where Q = f x M x C x AT is the excess thermal mass of the thermal injection (f is the mass fraction of the solids capable of losing their heat to the plume, M(kg) is the plume mass, C (Jkg-I K-I) is the solids specific heat, and AT(K) is the initial temperature contrast between the erupted mixture and the sur- rounding air). From Equation 3, a specific equation for the vent- plume height H V P (m a.s.1.) of a Vulcanian explosion was derived:
where f ia rahsll a a 0.8, C is 1100 J kg-' K-I, AT is 800 K and H v is the vent height (c. 1000m) (see Druitt et al. (2002) for a full description of these parameters). In Equation 4 the plume mass M is 33% of the total explosion mass, based on estimates on Mont- serrat that the collapsing fountain contains about two-thirds of the
erupted materials (Druitt et a/. 2002). Given an elutriation tem- perature of 600K for Vulcanian and dome-collapse pyroclastic flows (based on observed pyroclastic-flow temperatures; Cole et al. 1998; Calder et al. 1999), and 100% efficiency of thermal transfer between solids and gas in the plumes (due to the fine character of co-PF plume tephra), the equation of height of plume rise (a.s.1.) for both dome-collapse and fountain-collapse pyroclastic flows, HmpF(m), is derived from Equation 3 as:
where f is taken as 1, C is 1100J kg-' K-I and A T is 300K. Observations of co-PF plumes indicated that plume height is not constant for the whole length of the pyroclastic flow (Calder et al. 1997; Bonadonna el al. 2002). The most vigorous plume is the clos- est to the vent, and the height decreases away from vent (Bonadonna et al. 2002).
Grain-size distribution
Grain-size distributions of fallout tephra generated by dome collapses vary with the volume of the parent pyroclastic flow (Bonadonna et a/. 2002). Grain-size analyses were done on the on- land fallout tephra deposited between 2 and 10 km from the dome. This fraction (1 pm to 2 cm) covers all particle sizes of fallout tephra from dome collapses, but does not include the coarsest fraction of Vulcanian fallout tephra (2-10cm) in very proximal localities (i.e. within 2 km from the dome; see Bonadonna el a/. (2002) for full details). Fallout tephra from a small dome collapse (31 March 1997, 0.8 x lo6 m3 DRE; Fig. 2a) has all particle sizes below 1 mm (O4), with about 45 wt% fine ash (<63 pm, >44) (4 = -log2d, where d is the particle diameter in mm). The grain-size distribution of fallout tephra from a large dome collapse (21 September 1997, 1 1 x l o b 3 DRE; Fig. 2b) shows particles below 8 mm (-34), with about 70 wt% of fine ash. Fallout t e ~ h r a from Vulcanian ex~losions is typically coarser than that from dome collapses. Most Vulcanian samples (e.g. 26 September 1997, 1456 local time (LT); Fig. 2c) contain a coarse population with mode typically between 2 mm and 63 pm (- 1 and 44), and a fine population with mode typically in the 63 to 4 p m range (4 to 74) Total grain-size distributions were calculated by a'veraging all samples weighted by the thickness of tephra-fallout deposits (Bonadonna et a/. 2002). Scanning elec- tron microscopy (SEM) studies of ash collected on Montserrat, and direct observations of tephra fallout, have shown that fine particles (< 100 pm, >c. 34) mostly fell as aggregates (Bonadonna et al. 2002). The density of particles involved in the co-PF plumes from dome collapses is assumed to be 2600 kgm-3, as these particles consist mainly of dense crystals and dense glass (Fig. 2d). Vulcanian ash particles with diameter of 2 mm to 8 pm are modelled with a linear increase of density from 1 0 0 0 k ~ m - ~ to 2600 kgm-3 (Fig. 2d).
Mass distribution
For simplicity, tephra mass is assumed to be uniformly distributed with height in all co-PF plumes (Distribution 4 Fig. 3d), whereas the mass distribution in the vent plume of large Vulcanian explo- sions is modelled using three other different models (Fig. 3a-c). In Figure 3, Ht is the top of the laterally spreading plume and H b is the base, usually assumed to be the height of neutral buoyancy. For Distribution 1, all the mass is centred at a point half-way between Ht and H b (Fig. 3a). For Distribution 2, the mass is evenly distributed between H t and H b (Fig. 3b). For Distribution 3 the mass is distributed according to the Suzuki (1983) model (Fig. 3c). The spacing (6z,,) along the plumes at which particles are released was studied using sensitivity tests and a suitable value of 6zSp,= lOOm achieved a good compromise between computing efficiency and accuracy (discussed further below).

520 C. BONADONNA ET AL.
- (a)
- 31 March 97 dome collapse
I I , f I I t I
(b)
21 Sept 97 - dome collapse
I I. I
$ 20 26 Sept 97 (14:56 LT) Vulcanian explosion
0
0 - 4 - 2 0 2 4 6 8 1 0
phi
(d) A dome-collapse fallout tephra 0 Vulcaniarrexplosion fallout tephra
A A A A A A A A A ~ ~ ~ ~
0 0
0 0
0 0
- 0 0 0
1
Fig. 2. Observed grain-size distributions (weighted average; Bonadonna el a/. 2002) for: (a) a small dome collapse (31 March 1997, 0.8 x lo6 m3 DRE); (b) a large dome collapse (21 September 1997, 1 1 x lo6 m3 DRE); and (c) a large Vulcanian explosion (26 September 1997, 1456 LT, 0.5 x 10⁶m3 DRE). (d) Model of particle density used to compute tephra dispersal from dome-collapse and Vulcanian plumes. Dome-collapse particle density is assumed to be constant with size (black triangle). For Vulcanian particles (grey circles) a linear increase of density with 4 is assumed (for -14 <diameter < 79). 4 = -log2d, where d is the particle diameter (in mm).
Settling velocity
The settling velocities of the particles are obtained by the balance between gravity and air drag:
(a) DISTRIBUTION I (b) DISTRIBUTION 2
- - - - - - - 1 - - - - -Ht- - - ----
I I - - -Ht--- - I - 1
- - - - - - - 4 - - - - -Hb- - - ---- - - - H b - - - I I
(c) DISTRIBUTION 3 (d) DISTRIBUTION 4
Fig. 3. Diagram showing models of vent-plume mass distribution used in the simulations of Vulcanian explosions: (a) Distribution 1; (b) Distribution 2; (c) Distribution 3; and (d) Distribution 4. This diagram shows the mass distribution for a 5-km-high plume as an example (total explosion volume: 0.3 x 10' m3 DRE), with an input mass in the plume of 2.8 x lo7 kg (c. 104 m' DRE), and a source-point vertical spacing (6zsp) of 100m. The length of solid horizontal lines is proportional to the mass released at every plume step 6zSp. The vertical dashed line indicates the plume centreline. The horizontal dashed lines indicate the top (Ht) and the base (Hb) of the laterally spreading cloud.
density (assumed constant in this model). The drag coefficient CD is expressed as (Arastoopour et al. 1982):
where Re is the Reynolds number of the particles:
where p is the dynamic viscosity of the air. Grain-size distributions (Fig. 2a-c) are converted into distribu-
tions of settling velocity v (Fig. 4), where particles are represented by settling-velocity classes. Grain-size distributions are assumed to be continuous functions of 4:
with 4 = -log2d, where d is the particle diameter (mm) and N is the weight fraction of the particles. Settling-velocity distributions are assumed to be continuous and monotonic functions of v, so that a biunique relationship between f and v is defined. The settling- velocity function is defined as:
where g is the gravitational acceleration, d is the particle diameter, p, is the particle density, CD is the drag coefficient and p, is the air

MODELLING OF DOME-COLLAPSE AND VULCANIAN FALLOUT 521
Fig. 4. Settling-velocity distribution of (a) 'non-aggregated' and (b) 'aggregated' fallout tephra from a small dome collapse (31 March 1997), and (c) 'non-aggregated' and (d) 'aggregated' fallout tephra from a large Vulcanian explosion (26 September 1997, 14:56 LT). See text for details of settling-velocity classes. Corresponding 'non-aggregated' and 'aggregated'
31 March 97 dome collapse (a) 31 March 97 dome collapse (nonaggregated distribution) (aggregated distribution)
(b)
- B l l , r , ! , l I ! r , , I , - m , ,1,m,I,1,1,1,-, , , <
(c) - (dl - 26 Sept 97 (1456 LT) Vulcanian explosion - 26 Sept 97 (14:56 LT) Vulcanian explosion
(nonaggregated distribution) (aggregated distrlbutlon)
n I, I ,B ,~ , - , - , , , , , , , , , m , - , , ,~,w,w,I,JI, , , , , grain-size distributions are shown in Fig. 2a
Y
1 2 3 4 5 6 7 8 9 1 0 1 1 1 2 1 3 1 4 1 5 1 6 1 2 3 4 5 6 7 8 9 1 0 1 1 1 2 1 3 1 4 1 5 1 6 and c, and Figs 8c (Model 3) and 9d (Model 4) respectively. Settling velocity (m s-') Settling velocity (m s")
Combining Equations 10 and 11, the particle fraction N,,, for each 5-8 km and 18-20 km, typical for the Eastern Caribbean sub- settling-velocity class n, is given by: tropical climate. The high-level shear corresponds to the tropo-
l',r ji',* dv = 1'" d N dmd"
pause position (Fig. 5). Low-level (1-5 km) and high-level (20-30 N,, = 1 g(v)dv = -- km) winds typically blow west. Intermediate-level winds (8-18 km)
\',,- 1 1'"-1 dv k8,,- 1 dm dv typically blow east. The standard deviation for the direction values
d N Oh varies between about 30" and 162". Therefore, low-level winds can
(12) also blow to the NW, SW or south, and intermediate-level winds to the north, NW, NE, SW, SE or south. Wind velocities range
Values of db and d,, corresponding to each v,, and v,,-1, are calculated using Equation 6. f (6) is not a continuous distribution, as its values are known at sieving steps. T o perform the integration (Equation 12), a uniform distribution of particles within each sieving step is assumed. The variation of particle density with grain size used in the calculations is shown in Figure 2d.
When aggregation processes are taken into account, 'non- aggregated' grain-size distribution~ (i.e. original grain-size distribu- tions, consisting of individual free particles; Fig. 2a-c) are first converted into 'aggregated' grain-size distributions (using aggrega- tion models discussed further below), and then converted into settling-velocity classes (Fig. 4b and d). For typical grain-size distributions of fallout tephra from dome collapses and Vulcanian explosions on Montserrat, the whole population of particles can be represented by 16 classes. The first class (Class 1: 1 m s-I) represents particles with settling velocity from 0 to 1.5ms-' , the second class (Class 2: 2 m s-I) represents particles with settling velocity from 1.5 to 2.5 m s-' , the third class (Class 3: 3 m s-I) represents particles with settling velocity from 2.5 to 3.5 m s-', and so on until Class 16 (i.e. particles with settling velocity from 15.5 to 16.5 m s-I).
Wind profile
HAZMAP reads wind data as north and east vectors for any wind vertical spacing 6z,, then interpolates the data to fit them to the source-point vertical spacing 6zsp that characterizes the computed plumes from which the particles are released. North and east vectors give direction and velocity of wind at a specific height. Figure 5 shows vertical profiles of wind velocity and direction (with corresponding standard deviation) above Montserrat for the period 1992-1997, based on data from the National Oceanic and Atmo- spheric Administration (NOAA) Climate Diagnostic Center (http:l/ www.cdc.noaa.gov/). In this study wind vectors are given in 30 levels starting from 1 km a.s.1, and spaced at I km intervals (i.e. 62, = 1 km). Figure 5a shows two evident wind shears at about
between 3 and 10 m s-I for low-level winds, between 4 and 23 m s'l for intermediate-level winds, and between 4 and 20 m s-I for high- level winds (Fig. 5b).
N E S N N wind direction wind speed (m i')
(provenance + 180')
Fig. 5. Average (a) wind direction (provenance + 180") and (b) wind speed over the period 1992-1997, with corresponding standard deviations. Archived daily averages of wind direction and speed for 17 pressure levels were provided through the NOAA Climate Diagnostic Center. The average wind profile for 30 levels (i.e. wind-profile vertical spacing, 62, = I km) with corresponding standard deviation was calculated. Prevailing easterly low- and high-level wind direction and westerly intermediate-level wind with two wind shears (5-8 km and 18-20 km) are evident. The shaded area shows the fluctuation of the tropopause above Montserrat (W. 1. Rose, pers. comm.).

522 C. BONADONNA ET AL.
Dl ffusion coeficient
A value of 3000m2 s-' was found as a best fit of observed data for the Mount St Helens 1980 eruption (Armienti et al. 1988). A value of 2700 m2 s-' is used here for simulations of both dome collapses and Vulcanian explosions. Sensitivity tests are discussed further below.
Directions of pyroclasticJlows
During the eruptive period 1995-1999 of Soufriire Hills Volcano, pyroclastic-flow activity was confined to seven valleys around the volcano: Fort Ghaut (west), White River valley (south), Tar River valley (east), White's Ghaut (NE), Mosquito Ghaut and Tuitt's Ghaut (NNE), Tyre's Ghaut (north) (Fig. 1).
Runouts of pyroclastic Jlows
The runout of a pyroclastic flow is the length over which co-PF plumes are sourced. Data collected on Montserrat (Calder et al. 1999) yield the following empirical relationship between the runout of a dome-collapse pyroclastic flow and its volume:
(0.2 x lo6 5 V 5 14.3 x lo6; number of points= 10; R2 = 0.85) where RDc is the dome-collapse pyroclastic-flow runout (m) and V is the pyroclastic-flow volume (m3). Fountain-collapse pyroclastic flows are more mobile than dome-collapse pyroclastic flows; therefore the runout distance is determined using the empirical equation (from data in Calder et al. 1999):
(0.02 x lo6 5 V 5 0.14 x lo6; number of points = 4; R~ = 0.77) where RFc is the fountain-collapse flow runout (m) and Vis the pyro- clastic flow volume (m". Fig. 6. Map of Montserrat showing the source distribution, used in
modelling, of co-PF plumes along each of the main valleys around the volcano. Source points are I km apart (black diamonds). The position of Soufritre Hills Volcano is also shown (black triangle). For key to names
Particle source horizontal co-ordinates of the valleys, see caption to Figure I .
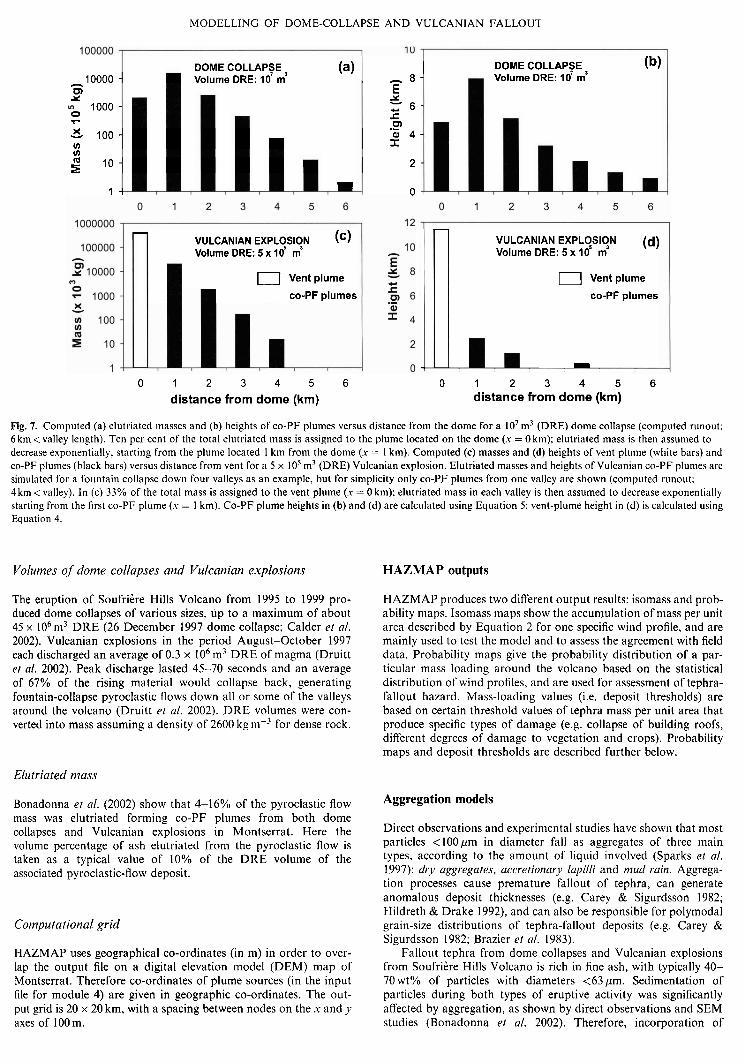
A system of point-source co-ordinates ri = (xi,yi) is generated based on the following assumptions. First, discrete plumes are modelled I km apart down the pyroclastic-flow valleys (Fig. 6). This assumption is based on observations of typical spacing between discrete plumes observed in pyroclastic flows of Soufrikre Hills Volcano and from the 7 August 1980 Mount St Helens pyroclastic flow (Hoblitt 1986; Levine & Kieffer 1991; Calder et al. 1997). Second, an exponential decay of elutriated mass along the pyroclastic-flow valley is assumed, starting from the co-PF plume located I km from the dome. The heights of co-PF plumes consequently decreases with distance (from Equation 5). This distribution of plume mass is supported by observations. The highest plume is formed close to the dome base, as it forms at the base of the dome talus where a significant break in slope enhances elutriation (Calder et al. 1997). Plume heights are observed to decline with distance (Bonadonna et al. 2002). For dome-collapse simulations 10% of the total elutriated mass is assigned to the first plume centred on the dome (Fig. 7a). The remaining mass decreases exponentially from the second plume at I km distance (Fig. 7a) according to the empirical equation:
with
M(ri) = A exp - - (
where ri is the distance from the dome, R is the pyroclastic-flow runout, and 0.9MTor is the total elutriated mass from all the co-PF plumes, excluding the co-PF plume centred on the dome. a is an empirical factor for decrease of elutriated mass down the valley of collapse. Sensitivity tests, discussed further below, show that the best fit to observed data is given for a = 0.1. Corresponding plume heights (Fig. 7b) are calculated using Equation 5.
For simulations of Vulcanian explosions, the vent-plume height is calculated using Equation 4. The elutriated mass in each co-PF plume is distributed assuming an exponential decrease start- ing from the first co-PF plume (positioned I km away from the vent plume) (Fig. 7c). Therefore M(ri) is calculated using Equation 15a with:
A = MTOT
5 exp (- 5) I= l
where M r o ~ is the total elutriated mass. Co-PF plume height is then calculated from the elutriated mass using Equation 5 (Fig. 7d).
In the case where the computed runout (calculated using Equations 13 and 14) is longer than the valley concerned, the calculation is truncated at the coastline (i.e. pyroclastic-flow runout = valley length), and the remaining mass is assumed to be lost when the pyroclastic flow enters the sea.
MODELLING OF DOME-COLLAPSE AND VULCANIAN FALLOUT
DOME COLLAPSE (a) DOME COLLAPSE Volume DRE: lo7 m3
(b) A
10000 - Volume DRE: l o 7 m3 A 8 - m Y
E Y
1000 - 0
2: 6 - F
C cn .-
3 100 - Q) 4 - In x U) 2 10 - 2 -
1 8 I 0
- VULCANIAN EXPLOSION ('1 Volume DRE: 5 x l o 5 m3
0 Vent plume
co-PF plumes
0 1 2 3 4 5 6
distance from dome (km)
- VULCANIAN EXPLOSION (d) Volume DRE: 5 x 10' m3
0 Vent plume
co-PF plumes
7 I
0 1 2 3 4 5 6 distance from dome (km)
Fig. 7. Computed (a) elutriated masses and (b) heights of co-PF plumes versus distance from the dome for a lo7 m3 (DRE) dome collapse (computed runout: 6 km < valley length). Ten per cent of the total elutriated mass is assigned to the plume located on the dome (.u = 0 km); elutriated mass is then assumed to decrease exponentially, starting from the plume located I km from the dome (x = I km). Computed (c) masses and (d) heights of vent plume (white bars) and co-PF plumes (black bars) versus distance from vent for a 5 x 10' m' (DRE) Vulcanian explosion. Elutriated masses and heights of Vulcanian co-PF plumes are simulated for a fountain collapse down four valleys as an example, but for simplicity only co-PF plumes from one valley are shown (computed runout: 4 km <valley). In (c) 33% of the total mass is assigned to the vent plume (x = 0 km): elutriated mass in each valley is then assumed to decrease exponentially starting from the first co-PF plume (.u = I km). Co-PF plume heights in (b) and (d) are calculated using Equation 5; vent-plume height in (d) is calculated using Equation 4.
Volumes of donie collapses and Vulcanian e,uplosions H A Z M A P outputs
The eruption of Soufriire Hills Volcano from 1995 to 1999 pro- duced dome collapses of various sizes, up to a maximum of about 45 x 1 0 h 3 DRE (26 December 1997 dome collapse; Calder ef a/. 2002). Vulcanian explosions in the period August-October 1997 each discharged an average of 0.3 x lo6 m"RE of magma (Druitt et 01. 2002). Peak discharge lasted 45-70 seconds and an average of 67% of the rising material would collapse back, generating fountain-collapse pyroclastic flows down all or some of the valleys around the volcano (Druitt et a/. 2002). DRE volumes were con- verted into mass assuming a density of 2600 kg m-3 for dense rock.
Elutriated mass
Bonadonna et nl. (2002) show that 4-16% of the pyroclastic flow mass was elutriated forming co-PF plumes from both dome collapses and Vulcanian explosions in Montserrat. Here the volume percentage of ash elutriated from the pyroclastic flow is taken as a typical value of 10% of the D R E volume of the associated pyroclastic-flow deposit.
Computational grid
HAZMAP uses geographical co-ordinates (in m) in order to over- lap the output file on a digital elevation model (DEM) map of Montserrat. Therefore co-ordinates of plume sources (in the input file for module 4) are given in geographic co-ordinates. The out- put grid is 20 x 20 km, with a spacing between nodes on the x and y axes of I00 m.
HAZMAP produces two different output results: isomass and prob- ability maps. Isomass maps show the accumulation of mass per unit area described by Equation 2 for one specific wind profile, and are mainly used to test the model and to assess the agreement with field data. Probability maps give the probability distribution of a par- ticular mass loading around the volcano based on the statistical distribution of wind profiles, and are used for assessment of tephra- fallout hazard. Mass-loading values (i.e. deposit thresholds) are based on certain threshold values of tephra mass per unit area that produce specific types of damage (e.g. collapse of building roofs, different degrees of damage to vegetation and crops). Probability maps and deposit thresholds are described further below.
Aggregation models
Direct observations and experimental studies have shown that most particles <100pm in diameter fall as aggregates of three main types, according to the amount of liquid involved (Sparks et a/. 1997): dr)) aggregates, accretionary lapilli and mud rain. Aggrega- tion processes cause premature fallout of tephra, can generate anomalous deposit thicknesses (e.g. Carey & Sigurdsson 1982; Hildreth & Drake 1992), and can also be responsible for polymodal grain-size distributions of tephra-fallout deposits (e.g. Carey & Sigurdsson 1982; Brazier et crl. 1983).
Fallout tephra from dome collapses and Vulcanian explosions from Soufriire Hills Volcano is rich in fine ash, with typically 40- 70wt% of articles with diameters <63um. Sedimentation of particles duiing both types of eruptive ac;ivity was significantly affected by aggregation, as shown by direct observations and SEM studies (Bonadonna et a/. 2002). Therefore, incorporation of

524 C. BONADONNA ET AL.
particle aggregation into the simulations of tephra fallout from both dome collapses and Vulcanian explosions on Montserrat is crucial. However, the types, sizes and amounts of aggregates formed during tephra fallout varied significantly from case to case (Bonadonna et al. 2002). Here we combine results from previous studies on particle aggregation and observations made on Montserrat. Four different aggregation models are presented and compared with field data (Table 1). Model 1 is the result of the best fit of computer simulations with the Campanian Y-5 ash field data (Cornell et al. 1983). It assumes aggregation of 50wt% of particles in the size range 125-63 pm, 75 wt% of particles in the size range 63-3 1 pm, and 100wt% of particles <31 pm. All aggregates (of unspecified type) have a diameter of 250pm (4 = 2) and a density of 2000 kgm-! Models 2, 3 and 4 are based on observations (Bonadonna et al. 2002) and are specific to the formation of accretionary lapilli due to the aggregation of particles <125pm in the presence of water in the volcanic plume. The diameter (m) of the accretionary lapilli is determined by the equation (Gilbert & Lane 1994):
where w is the plume mass loading (kgm-3), E the aggregation coefficient, x the thickness of the umbrella cloud (m), p, the particle density (kgm-3), + the aggregate porosity and pa, the pore density (kgm-3). Values used for p,, + and pg, are 2600 kgm-" 0.4 and I000 kg m-3 respectively. The aggregate density used is 1840 kg m-', the weighted average between particle and pore density.
The plume mass loading is calculated for dome-collapse and Vulcanian plumes considered as discrete volcanic thermals using the model of Sparks et a/. (1994). In these calculations, temperatures are assumed to be around 600 K (from measurements of pyroclastic- flow temperatures; Cole et al. 1998, 2002; Calder et al. 1999) and 1 lOOK (andesitic magma temperature) for (i) dome-collapse and Vulcanian co-PF plumes, and (ii) Vulcanian vent plumes respetively. The aggregation coefficient E depends on the particle size, and for Models 2, 3 and 4 three different values are used (from Gilbert & Lane 1994): 0.3 (for particles in the size range 125-31 pm), 0.75 (for particles in the size range 31-8 pm) and 1.0 (for particles in the size range 8-1 pm). Therefore, using these three values of E, three different size categories of accretionary lapilli are determined from Equation 16 for each dome collapse based on the highest co-PF plume. In simulations of Vulcanian explosions, the heights of the vent plume and of the associated co-PF plumes can be significantly different. Therefore, three size categories of accretionary lapilli are determined for both vent plume and the highest co-PF plume, resulting in a total of six size categories for each explosion simulated.
The proportions of ash of different size fractions involved in the formation of the accretionary lapilli (weighted over the whole fall- out tephra) vary significantly from case to case (Bonadonna et al. 2002). Models 2, 3 and 4 differ in the fractions of different particle
Table 1 . Description of the aggregation models used in the simulations
Model 1
sizes involved in the aggregation process (Table 1). Model 2 is used as the ash-rich end-member and assumes aggregation of 100wt% of particles with diameters <125pm (Table 1). Models 3 and 4 are based on a sequence of samples collected during 5- or 10-minute periods during the Vulcanian explosions of 28 September 1997 (23:03 LT) and 1 October 1997 (1 1:34 LT) respectively (Bonadonna et a/. 2002). Both explosions produced tephra fallout from co-PF plumes and from the vent plume. During the 28 September explosion, about 95 wt% of tephra fell in Old Towne (in Fig. 1) as accretionary lapilli up to 4 m m in diameter over the first 10 minutes of tephra fallout. During the 1 October explosion, about 35 wt% of tephra fell as accretionary lapilli up to 2 m m in diameter over the last 10 minutes of tephra fallout a t the same location. Proportions of particles involved in the aggregation process are given for four size ranges of <125pm and weighted over the whole tephra- fallout deposit: 125-63 pm, 63-8 pm, 8-4 pm, 4-2 pm (Table 1). In Models 2, 3 and 4 the amount of aggregated ash is then parti- tioned equally amongst the three categories of accretionary lapilli calculated using Equation 16.
As an example, Figures 8 and 9 show the results of applying the four aggregation models to the grain-size distributions for the 31 March 1997 dome collapse and 26 September 1997 (1456 LT) Vulcanian explosion respectively. When 'non-aggregated' grain-size distributions (Figs 2a-c and 4a, c) are converted into 'aggregated' grain-size distributions (Fig. 4b and d), a significant bimodality in the corresponding settling-velocity spectrum is shown.
Results
We have run simulations to investigate the sensitivity of results to the main parameters and assumptions, the main factors being diffusion coefficient, aggregation model, grain-size distribution, plume mass distribution of Vulcanian vent plume, source-point vertical spacing 6z,,, factor of elutriated-mass decrease in co-PF plumes a, and volume of the erupted material. All these parameters have been cross-checked to establish the absolute best fit to field data. Simulations presented here (Table 2) were carried out by varying the investigated parameter and by using the values that give the best fit to field data for the other parameters. Best-fit results were obtained by minimization of the misfit function mf:
where N is the number of data and xobs and x,,, are the ob- served and computed mass accumulation per unit area respectively. The misfit function is an estimate of the global agreement between observed and computed data, and so observations and model results were also compared at individual locations.
Model 2 Model 3 Model 4
Aggregate type Aggregate diameter (pm) Aggregate density (kg m-3)
Wt% of particles in aggregates:
125-63 pm 63-3 1 pm
<31 pm
Not specified 250
2000
Accretionary lapilli Accretionary lapilli Accretionary lapilli 180-1 1 500* 180-1 1 500* 180-1 1 500*
1840 1840 1840
Wt% of particles in accretionary lapilli:
50 125-63 pm 100 75 63-8 pm 100
100 8-4 pm 100 4-2 pm 100
Model 1 represents a slightly modified version of an aggregation model presented by Cornell et al. (1983). Models 2 , 3 and 4 are based on observations made on Montserrat. *Accretionary lapilli diameters are calculated using Gilbert & Lane (1994) theory, and computed for volcanic thermals with heights ranging from 2 to 15km and temperatures ranging from 600 to1 100K.

MODELLING OF DOME-COLLAPSE AND VULCANIAN FALLOUT 525
20
Fig. 8. Application of four aggregation 10
models (Table 1) to the original 0 grain-size distribution (i.e. individual
0 Computed aggregates 70 - C o m p u t e d accr. lapilli - (a) Model I Computed free particles 60 - (b) Model 2 u Computed free particles
+Original distribution -o- Original disbibulion 50 - 40 - 30 -
20 -
4 - 2 1 0 1 2 3 4 5 6 7 8 9 1 0 - 3 - 2 - 1 0 1 2 3 4 5 6 7 8 9 1 0 'non-aggregated' particles) of fallout tephra from the 31 March 1997 dome [ =Computed accr. lapilli 1 70 collapse (black circles): (a) Model 1 60 (Cornell et al. 1983); (b) Model 2; (c) Model 3; (d) Model 4. The four 50
models differ for the fraction of particles involved in the aggregation process. A certain fraction of free particles
1 :: 20
(i.e. non-aggregated particles) (grey bars) is aggregated in clusters of unspecified 10
type (white bars) in Model 1 and in 0 accretionary lapilli (black bars) in Models 2-4.
Fig. 9. Application of four aggregation models (Table 1) to the original grain-size distribution (i.e, individual 'non-aggregated' particles) of fallout tephra from the 26 September 1997 (14:56 LT) Vulcanian explosion (black circles): (a) Model 1 (Cornell el al. 1983); (b) Model 2; (c) Model 3; (d) Model 4. The four models differ for the fraction of particles involved in the aggregation process. A certain fraction of free particles (i.e. non- aggregated particles) (grey bars) is aggregated in clusters of unspecified type (white bars) in Model 1 and in accretionary lapilli (black bars) in Models 2-4.
t Original distribution 50
40
30
- 3 - 2 - 1 0 1 2 3 4 5 6 7 8 9 1 0 - 3 - 2 - 1 0 1 2 3 4 5 6 7 8 9 1 0 phi phi
FZ3 Computed free particle
C o m p u t e d accr. lapilli - (d) Model 4 OComputed free particles
-e- Original dishibution
Efect ofdi f is ion coeficient (Runs I in Table 2) 1
The effective horizontal diffusion depends on the typical area scale 0.8 of the event (Pasquill 1974), and, near source, also on gravity N-
spreading of the plume. Dome collapses and Vulcanian explosions 0.6 m generated by Soufriere Hills Volcano are of comparable scale, and 6 so it was anticipated that best-fit values of diffusion coefficient 0.4 would be similar for both kinds of activity. Sensitivity tests for diffusion coefficient were made on the fallout tephra from the 0.2 31 March 1997 dome collapse, as this has the most complete data set (Runs 1). The best fit to the data is 2700m2 s-' (Fig. lo), which 0 is very similar to the best-fit value found for the Mount St Helens 0 2000 4000 6000 8000 10000 12000 1980 eruption (3000m2 s-I; Armienti et al. 1988).
Difhrsion Coefficient (m2 s-I)
Efect of aggregation processes (Runs 2 in Table 2) Fig. 10. Diffusion coefficient versus misfit function (mf in Equation 17) for the tephra-fallout deposit from the 31 March 1997 dome collapse. The
The effect of particle aggregation was investigated for the cases of lowest (i.e. best fit) is obtained for a diffusion coefficient of 2700m2s-I the 31 March 1997 dome collapse (Runs 2a) and the 26 September (Runs I in Table 2).

526 C. BONADONNA ET AL,
Table 2. Parameters used in rile simulafions of dome collapses and Vulcanian e.rplosions
Runs Test Figure Event Diffusion Grain-size Vent-plume Aggregation Volume Wind 62,, a coefficient distribution mass model DRE profile (m) (m2 s-') distribution ( x 106m3)
--
Sensirivity 1 Diff. coeff. 2a Aggreg. model 2b Aggreg. model 3a Grain size 3b Grain size 4a Vent-plume mass distr. 4b Vent-plume mass distr. 5 6zsp 6 a 7a Volume 7b Volume 8a Best fit 8b Best fit
General re.~ulrs 9 Grain size 1Oa Diff. fallout lob DiK. fallout 10c Diff. fallout 10d Diff. fallout
Individual probability maps I 1 Thresholds: 12, 120,
180 kg m-2 12 Thresholds: 12,
120 kg mM2
DC 1000-10000 DC 2700 VE (FC) 2700 DC 2700 VE (FC) 2700 VE (FC) 2700 VE (NFC) 2700 DC 2700 DC 2700 DC 2700 VE 2700 DC 2700 VE (FC) 2700
18 DC 2700 19a VE (vent) 2700 19a VE (co-PF) 2700 19b VE (vent) 2700 19b VE (CO-PF) 2700
20f VE (FC) 2700
I I I1 I I1 I I I1 I I I I I I1
I I1 11 111 111
TOT
TOT
Values in bold are the parameters varied to test the sensitivity of the model. Simulations: DC, dome collapse; VE, Vulcanian explosion; VE (FC), Vulcanian explosion computed with fountain collapse; VE (NFC), Vulcanian explosion computed without fountain collapse; VE (vent): contribution of vent-plume tephra fallout only; VE (co-PF), contribution of co-PF plume tephra fallout only. Grain-size distributions are shown in Fig. 2 (A, 31 March 1997 dome collapse; B, 26 September 1997 (14:56 LT) Vulcanian explosion; C , 21 September 1997 dome collapse). Vent-plume mass distributions 1,2,3 and 4 are described in Fig. 3. Aggregation models 1, 2, 3 and 4 are described in Table I. Model 0 indicates the case of no aggregation. Volumes used in these simulations are from field data (Bonadonna er al. 2002), apart from: *total co-PF tephra volume (i.e. 10% of pyroclastic-flow DRE volume); t total volume of the 10 October 1997 (18:40 LT) Vulcanian explosion was calculated using Equation 4 and the plume height provided by NOAA (in Druitt et a[ . 2002) reduced by 20% as suggested by Druitt et al. (2002). Wind profiles used in simulations are interpolated according to the characteristic 6zsp (i.e. source-point vertical spacing), and determined for each specific day when the event simulated occurred (I, 31 March 1997; II,26 September 1997; 111, 10 October 1997). TOT, total data (i.e. 2192 daily wind profiles for the period 1992-1997; see text for details). 6zs, is the vertical spacing of point sources along the plumes. a is the coefficient of elutriated-mass decrease along the pyroclastic flow (in Equation 15).
1997 (1456 LT) Vulcanian explosion (Runs 2b) separately. The four aggregation models used give significantly different results for dome-collapse and Vulcanian fallout tephra (Figs 1 I and 12). The computed deposit is thicker in proximal areas for models in which more particles are involved in aggregation (Models 2 and 3), as might be expected.
When particle deposition is simulated with aggregation, prox- imal mass loadings are up to ten and four times those for no aggre- gation (Figs 1 I b and 12b), in the cases of the dome collapse and the Vulcanian explosion respectively. The grain-size distribution in the Vulcanian simulations is coarser than that of dome-collapse simulations. Therefore, a significant fraction of fall- out tephra in Vulcanian simulations is exoected to accumulate in oroximal areas. even when aggregation does not take place. This also results in a smaller variation of the misfit function (Amf) for Vulcanian simu- lations compared to dome-collapse simulations (Amf = 0.3 and 1.0 kgm-2 respectively; Figs 12g and 1 Ig). Model 3 gives the best fit for the 31 March 1997 dome collapse (Fig. 1 lg), whereas Model 4 gives the best fit for the 26 September 1997 explosion (Fig. 12g), even though Vulcanian simulations are less sensitive to aggregation processes than those of dome collapses.
ESfect of grainsize distribution (Runs 3 in Table 2 )
Tephra-fallout deposits from the 3 1 March 1997 dome collapse and the 26 September 1997 (1456 LT) Vulcanian explosion were com-
puted using the four aggregation models in ~ i ~ u r e s 8 and 9 applied to the two respective total grain-size distributions (Fig. 2a and c).
The results d o not vary significantly when the grain-size distribution is varied (Fig. 13). This can be explained by the aerodynamic similarities of coarse ash and lapilli, which character- ize Vulcanian tephra, and fine-ash aggregates, formed during both Vulcanian and dome-collapse tephra fallout. Effects of premature fallout of fine ash caused by aggregation during fallout of fine- grained tephra can be reproduced with simulations run with coarser grain-size distributions and vice versa.
EfSect of plume mass distribution (Runs 4 in Table 2 )
The effect of vertical mass distribution within the Vulcanian vent plumes was investigated using the four different distribution models in Figure 3. The mass distribution in the co-PF plumes is main- tained uniform (Distribution 4 in Fig. 3), as some of the co-PF plumes are too low to be sensitive to differences in the mass distri- bution. These models were tested on the 26 September 1997 (1456 LT) Vulcanian explosion.
Simulation results are only weakly sensitive to different vent- plume mass distributions (Fig. 14). However, the best agreement with observations was obtained using the uniform mass distribution (Distribution 4) (Fig. 14e). The double accumulation maximum in Figure 14a and b is due to the simultaneous release of particles from two tephra-fallout sources with a narrow range of source

MODELLING O F DOME-COLLAPSE AND VULCANIAN FALLOUT 527
Fig. 11. Isomass maps (kgm-2) of the 31 March 1997 (morning) dome collapse showing (a) field data, and the same deposit computed using (b) the original ('non-aggregated') grain-size distribution (in Fig. 2a), and the original distribution 'aggregated' using: (c) Model 1; (d) Model 2; (e) Model 3; (f) Model 4 (in Fig. 8). (g) Misfit function ( d i n Equation 17) calculated for computed deposits (b)-(f) in comparison to field data in (a) (Runs 2a in Table 2). TF, tephra-fallout deposit; PF, pyroclastic-flow deposit; NA, non-aggregated grain-size distribution. In (a) localities a, b and c (also in Fig. l), used for investigations of computed grain size (Fig. 18). are shown as circles. Contours of 0.05,0.1, 1 and 5 k g n r 2 are shown in all maps. Contours of 0.01, 10, 15 and 20 kgm-2 are also shown for computed deposits.
points (i.e. vent plume with Distributions 1 and 2 and low co-PF plumes). The effect of vent-plume mass distribution was also investi- gated using the same Vulcanian explosion, but without fountain collapse (i.e. all erupted mass concentrated in the vent plume, Runs 4b) (Fig. 15). Distributions 3 and 4 give slightly better fits compared to Distributions 1 and 2. Tephra dispersal computed using Distri- butions 1 and 2 (Fig. 15a and b) is dominated by intermediate-level winds, as all the particles are released high in the column.
Efect of source-point vertical spacing (SzSp) (Runs 5 in Table 2)
The spacing of vertical source points up the simulated eruptive plumes (Sz,,) can create numerical artefacts, such as a shift down- wind of the mass accumulation maximum and artificial mass accumulation double maxima. These numerical artefacts occur when the vertical spacing (Sz,,) is too large and the accumulation of particles from different point sources does not overlap. Sensitivity tests carried out using fallout tephra from the 31 March 1997 dome collapse show that decreasing Szsp improves the numerical accuracy (Runs 5, Fig. 16a). A 6zs, value of lOOm was chosen as a com- promise between minimizing the computing time and maximizing the computing accuracy.
Efect of decrease of elutriated mass along the pyroclastic flow (mass-decrease coeficient cr in Equation 15; Runs 6 in Table 2)
Co-PF plume mass is assumed to decrease exponentially with distance from the dome. In order to determine the influence of the empirical mass-decrease coefficient a in Equation 15, sensitivity tests were carried out on the 31 March 1997 dome-collapse fallout tephra (computed P F runout = 3 km, Table 3). Only values of a in the range 0.04-10 give results consistent with observations. Smaller values result in the concentration of elutriated mass in the co-PF plumes closest to the vent, and would require a grid and a physical model of higher resolution. Larger values result in a constant height of co-PF plumes. The best fit to observed data is given by cr = 0.1 (Fig. 16b). Variations of cr do not significantly affect the computed deposit for the 26 September 1997 (14:56 LT) Vulcanian explosion. We also use cr = 0.1 for Vulcanian explosions.
Eflect of volume (Runs 7 in Table 2)
Results are sensitive to the variation of the input volume, both for dome collapses and Vulcanian explosions (Fig. 16c). The best fit to the data is given by a total DRE volume of 0.8 x lo6 and

528 C. BONADONNA ET AL.
Fig. 12. Isomass maps (kgm-2) of the 26 September 1997 (1456 LT) Vulcanian explosion showing (a) field data, and the same deposit computed using (b) the original ('non-aggregated') grain-size distribution (in Fig. 2c), and the original distribution 'aggregated' using: (c) Model I; (d) Model 2; (e) Model 3; ( f ) Model 4 (in Fig. 9). (g) Misfit function (mJin Equation 17) calculated for computed deposits (b)-(f) in comparison to field data in (a) (Runs 2b in Table 2). TF, tephra-fallout deposit; NA, non-aggregated grain-size distribution. Contours of 1 2, 10 and 15 kgm-2 are shown in all maps. C o n t o ~ ~ r s of 0.01,0.1, 5,20,30 and 40 kgm-2 are also shown for computed deposits.
0.5 x 10⁶m' for the 31 March 1997 dome collapse and the Variation of grain-size distribution witlz distance from vent 26 September 1997 (1456 LT) Vulcanian explosion respectively, in ( R ~ ~ ~ 9 in ~ ~ b [ ~ 2 ) good agreement with field data (Bonadonna el al. 2002).
Best fit to field data and local differences (Table 3 and Runs 8 in Table 2 )
All the above sensitivity tests were carried out on the two tephra- fallout deposits with the most complete observations: 31 March 1997 dome collapse (number of sample points, 18; distances from the dome, 2-9 km; mass-accumulation range, 0.02-7.3 kgm-2; mf= 0.4 kgm-2) and 26 September (1456 LT) 1997 Vulcanian explosion (number of sample points, 12; distances from the dome, 6-9 km; mass-accumulation range, 0.02-16.6 kgm-2; mf = 3.9 kgm-*).
Local differences between the best-fit computed model and observations were also investigated (Fig. 17). The greatest dif- ferences were recorded for very low values of mass accumulation for both deposits (local difference, 70-500%; mass range, 0.02-1.0 kgm-2). This may be a result of the high measurement error involved in the sampling of very thin deposits. The local difference of the largest values of mass accumulation available (mass range, 1.0-16.6kgm-*), varies between 2 and 50%. Table 3 shows that there is good agreement between computed and observed runout (from Equation 13) and column height (from Equations 4 and 5) for both cases studied.
Tephra-fallout deposits computed with HAZMAP, using one of the aggregation models, consist of both aggregates and free individual particles (e.g. Fig. 18). Aggregates are generally not well preserved in the observed tephra-fallout deposits, and only the 'disaggregated' distribution is available from field data. In order to compare computed and observed grain-size distributions, computed aggre- gates were numerically 'disaggregated' and the resulting 'disag- gregated' particles were added to the computed free particles fallen at one locality (Fig. 18). The comparison between computed grain- size distribution and observed grain-size distribution at three different localities for the 31 March 1997 dome co l la~se (localities
a \
in Figs 1 and I la) shows good agreement. Computed data are con- sistent with about 95 wt% of tephra falling as accretionary lapilli up to 2 mm in diameter at locality a (Fig. 18a). The model also indi- cates a significant decrease of the proportions of accretionary lapilli with distance from the dome, being absent at the most distal locality (locality c, 9 km from the dome). As in our simulations accretionary lapilli are released from the plume at I = 0 together with all the other particles, we conclude that during the 31 March 1997 collapse most of the accretionary lapilli must have formed in the proximal area of the volcanic cloud and also accumulated in the proximal deposit. Bimodality, however, is predicted even when accretionary lapilli are absent (Fig. 18c).

MODELLING O F DOME-COLLAPSE A N D VULCANIAN FALLOUT 529
0 NA MODEL1 MODEL2 MODEL3 MODEL4
Fig. 13. Comparison of the misfit function (mf in Equation 17) obtained for: (a) the computed tephra-fallout deposit from the 31 March 1997 dome collapse, simulated with the grain-size distribution from the 31 March 1997 dome collapse (DCI, black bars, Fig. 2a), from the 21 September 1997 dome collapse (DC2, grey bars, Fig. 2b), and from the 26 September 1997 (14:56 LT) Vulcanian explosion (VE, white bars, Fig. 2c); (b) the computed tephra-fallout deposit from the 26 September 1997 (1456 LT) Vulcanian explosion, simulated with the three grain-size distributions as above. NA, non-aggregated grain-size distribution; Models 1-4, aggregation models in Table I (Runs 3 in Table 2).
Differential fallout from Vulcanian explosions (Runs I0 in Table 2)
Fallout tephra generated by Vulcanian explosions with fountain collapse is a combination of contributions from the vent plume and co-PF plumes. The heights of vent and co-PF plumes typically differ significantly. Particularly when the wind direction varies with altitude, these two types of fallout tephra are characterized by different dispersal (here called d~flerential fallout). Simulations of tephra fallout from the vent plume and from co-PF plumes were compared for two Vulcanian explosions (26 September 1997, 1456 LT, and 10 October 1997, 18:40 LT; Fig. 19). Although there is considerable overlap in dispersal, there is no significant deposition of computed co-PF ash in areas of northern Montserrat from the earlier Vulcanian explosion (Fig. 19a), in agreement with observa- tions (Bonadonna et al. 2002). Computed fallout tephra from the vent plume generated by the later Vulcanian explosion has a much wider dispersal than that from co-PF plumes (Fig. 19b). Differential fallout can strongly affect general grain-size characteristics of tephra-fallout deposits, as high vent plumes are typically coarser grained than the associated co-PF plumes.
Probab ~ility maps
Assessment of fallout tephra hazard is here based on the probabil- ity of reaching certain mass-accumulation thresholds in a particular
Fig. 14. Computed isomass maps (kgm-2) of the tephra-fallout deposit from the 26 September 1997 (14:56 LT) Vulcanian explosion, simulated with different mass distributions in the vent plume (Fig. 3): (a) Distribution 1; (b) Distribution 2; (c) Distribution 3; (d) Distribution 4. (e) Misfit function (mf in Equation 17). TF, computed tephra-fallout deposit. Contour interval is I kg m-2 for (a) and (b), and 3 kg m-2 for (c) and (d) (Runs 4a in Table 2).
area. Hazardous deposit thresholds (Blong 1984) are estimated for a 1200 kg m-) deposit density and from observations made on hazard- ous effects on Montserrat. Experience on Montserrat indicates that tephra accumulation of 12 kgm-' (equivalent to approximately 1 cm) causes minor damage to agriculture (also suggested by Blong 1984). Accumulation of fallout tephra of 12 kgmW2 is also useful for assessing health effects, as deposits thicker than about 1 cm were observed to persist on the ground for many weeks and months, and can be remobilized, causing health hazards (Moore el al. 2002). A threshold of 120kgm-' is approximately the value for collapse of wooden and corrugated roofs on Montserrat. Accumulations of 250 kg m-' or more are required for failure of concrete roofs. These thresholds reduce when tephra is wet. Other deposit thresholds are (Blong 1984): 180 kgme2 (partial survival of vegetation: zone 2); 600kgm-' (partial survival of vegetation: zone 1); 1800kgm-2 (zone of near-total vegetation kill); and 2400 kgm-' (zone of total vegetation kill). Only the deposit thresholds of 12, 120, 180 and 600 kgm-2 are considered in this study, as they represent the most significant values for the assessment of tephra fallout hazard from eruptive events on a Montserrat scale.
Probabilities of reaching significant thresholds were calculated for fallout tephra produced both by dome collapses and Vulcanian explosions, based on wind statistics. Unless stated otherwise, six

530 C. BONADONNA ET AL.
0.3 1 10 100 1000 10000
Plume vertical spacing (6%)
Mass decrease coefficient (a)
NF 4 Fig. 15. Computed isomass maps (kgm-2) of the tephra-fallout deposit E from the 26 September 1997 (14:56 LT) Vulcanian explosion, simulated with no fountain collapse and with different mass distributions in the vent plume
g 3 L
0 0 (c)
0 0 0
dome collapse 0 26 Sept 97 (1456 LT)
Vulcanian exgdosion
A A
A A A A
- (Fig. 3): (a) Distribution 1 ; (b) Distribution 2; (c) Distribution 3; E 2 (d) Distribution 4 (in Fig. 3). (e) Misfit function (mf in Equation 17). TF, computed tephra-fallout deposit. Contour interval is 2 kgm-* for 1 (a) and (b), and 5 kgm-2 for (c) and (d) (Runs 4b in Table 2).
0 0 0.5 1 1.5 2
years of daily wind data were used (1992-1997; Fig. 5). Therefore, 2192 isomass maps (i.e. daily isomass maps for six years) were calculated using daily wind profiles, then compared with the hazardous deposit thresholds. Contributions from daily isomass maps were calculated and summed in each node of the grid. Finally, all the values were renormalized to 100% probability of exceeding the deposit threshold. Probability maps were compiled for individual eruptive events (individual probability maps) and for a given scenario of activity resulting from the occurrence of several eruptive events during a certain period of time (cumulative probability maps).
Probability maps for individual events
A DRE volume of lo7 m3 was used in the compilation of individual probability maps for dome collapses, as this volume could have a significant impact on populated areas. Such a volume is compar- able to large dome collapses on Montserrat, such as 3 August and 21 September 1997 (Calder et a/. 1999). Dome collapses were
Volume (DRE) (x 1 o6 m3 )
Fig. 16. Sensitivity tests on: (a) vertical spacing of source points Sz,,; (b) decrease-factor of elutriated mass along the pyroclastic flow a; (c) input volume DRE (mf is from Equation 17) (Runs 5-7 in Table 2).
studied for the five main valleys around the volcano (Fig. 1). Individual probability maps were also compiled for a relatively large (106m3 DRE) 1997 Vulcanian explosion with fountain collapse down the same five valleys (Fig. 1). Figure 20 shows individual probability maps computed for a 12kgm-2 deposit threshold (Runs 11 and 12 in Table 2). Significant probabilities (>lo%) of reaching a deposit threshold of 120 kgm-2 for a lo7 m3 DRE dome collapse are confined to a narrow area around the valleys of collapse (Fig. 21). The probability of reaching a deposit threshold of 180 kgmV2 or higher is <0.1% in any area. For a 106m3 DRE Vulcanian explosion the probability of reaching a deposit threshold of 120 kgm-2 or higher is also <<0.1% in any area. Results show the dominance of tephra dispersal to the west by low-level winds (Fig. 20).

Table 3. Results of the best fit toJield data for a dome collapse and a Vulcanian explosion
Dome collapse Vulcanian explosion
Observed* Computed Observed* Computed
Vent-plume maximum height (m) - - 1 1 300 11 395 Co-PF plume height range (m) 4000 (max) 1000-4400 - 300-2400 Runout (m) 4000 3311 - 3644 Accretionary-lapilli diameter (mm):
vent plume - - - 0.8, 1.9, 2.6 co-PF plumes - 0.8, 2.0, 2.7 - 0.2, 0.6, 0.8
Wt% aggregated particles: vent plume co-PF plume
Plume mass loading (kgm-')t vent plume co-PF plumes
* Data from Bonadonna er al. (2002). t Calculated for volcanic thermals with temperature of l I00 K and 600 K for Vulcanian vent plumes, and for Vulcanian and dome-collapse co-PF plumes respectively. See also Table 2 (Runs 8) for input parameters. Dates: dome collapse, 31 March 1997; Vulcanian explosion, 26 September 1997 (14:56 LT).
Cumulative probability maps 70
Cumulative probability maps were compiled for a given eruption scenario, which involves many individual events occurring over a certain period of time (e.g. the scenario in Table 4). These maps are more complex than probability maps compiled for individual events, as they need to include individual probabilities of individual eruptive events, combinations of wind profiles and accumulation/erosion of tephra-fallout deposits over a certain period of time. As the process of erosion cannot be easily predicted, minimum-deposit and maxi- mum-deposit probabilities are investigated. Minimum-deposit prob- abilities represent the probability of reaching certain thresholds in a case where fallout tephra is completely eroded away between each separate event. Therefore, tephra accumulation is assessed separately for each dome collapse and Vulcanian explosion in the given activity scenario. Maximum-deposit probabilities represent the probability of reaching certain thresholds in a case where fallout tephra continu- ously accumulates with no erosion between separate events. In this case tephra accumulation is assessed as the final cumulative deposit produced by all dome collapses and Vulcanian explosions assumed in the given scenario. The eruptive scenario used to compile cumulative probability maps for Montserrat is described in Table 4 and is an approximation of the July 1995-March 1998 activity of
- equiline
- A 31 March 97 dome collapse
26 Sept 97 (14:56 LT) Vulcanian explosion
observed data (kg m")
Fig. 17. Comparison between field data and best-fit computed data of mass accumulation (kgm-=) for the fallout tephra from 31 March 1997 dome collapse (black triangles) and 26 September 1997 (14:56 LT) Vulcanian explosion (grey diamonds). The equiline (perfect agreement) is also shown, as a solid line, for reference (Runs 8 in Table 2).
10
0 3 - 2 - 1 0 1 2 3 4 5 6 7 8 9 1 0
phi
Fig. 18. Comparison between computed grain-size distribution (white diamonds, 'disaggregated' distribution; black bars, accretionary lapilli; grey bars, free particles) and observed grain-size distribution (black triangles) for tephra-fallout deposit in three localities at different distances from the dome for the 31 March 1997 dome collapse: (a) locality a 2km from the dome; (b) locality b 4 km from the dome; and (c) locality c, 9 km from the dome. Localities are shown in Fig. 1 and mass-accumulation values are shown in Figure I I. The numerically 'disaggregated' computed distribution (white diamonds) is used as a comparison with the field data (black triangles). See text for details (Runs 9 in Table 2).

C. BONADONNA ET AL.
26 Sept 1997 (14:56 LT) 10 Oct 1997 (18:40 LT) Vulcanian explosion Vulcanian explosion
- vent-plume deposit (kg m') Computed co-PF source points
- - co-PF-plume deposit (kg m') A SoufrlBre Hills Volcano
Fig. 19. Tephra-fallout deposits computed separately for the vent plume (solid lines) and the co-PF plumes (dashed lines) produced by the two Vulcanian explosions oE (a) 26 September 1997 (1456 LT) (computed vent-plume height = 11.3 km, computed co-PF-plume height range = 0.3-2.4 km); and (b) 10 October 1997 (18:40 LT) (computed vent-plume height = 7.6 km, computed co-PF-plume height range = 0.4-1.4 km) (Runs 10 in Table 2). Contours shown for the vent- plume tephra-fallout deposits are 0. I, 0.5, 1, 5, 10 and 20 kg m-2 (black numbers). Contours shown for the co-PF tephra-fallout deposits are 0. I , 0.5, I, 2 and 3 k g n r 2 (grey numbers). Computed co-PF plume sources are also shown (black diamonds) (valleys followed by fountain-collapse pyroclastic flows from Druitt el at. 2002).
Soufrikre Hills Volcano. Three years of wind data, and dome and fountain collapses down the four main valleys around the volcano are used in these computations (Tar River valley, White River valley, Fort Ghaut and Tuitt's Ghaut; see Fig. 1).
Figure 22 shows the maps of the minimum-deposit probability of reaching 12, 120, 180 and 600 kg m-2 of tephra accumulation for the scenario of Table 4. First, the probability of reaching a deposit threshold was calculated separately for each individual dome col- lapse and Vulcanian explosion in Table 4. Cumulative probabilities for the minimum deposit were then calculated by the union of indi- vidual probabilities of each eruptive event. Over a certain period of activity, dome collapses and Vulcanian explosions represent inde- pendent, but not mutually exclusive, events. Therefore, if A1 and A2 are the events 'fallout-tephra accumulation 2 deposit threshold' for the dome collapse (or Vulcanian explosion) 1 and 2 respectively, the probability of the union of A, and A2 is:
and as A, and A2 are independent: P(AI n A2) = P(AI)P(A2). Resolving Equation 18 for n events:
n
P(A I U A2 U . . . U A,) = x P(Ai) - x P(Ail AIZ) i= 1 il <iz
+ . . . + (- 1)"" P(AI A~ . . . A,) (19)
The sudtnation Cil<i ,...< ;, P(AilAR.. .Air) is taken over all of the (:) possible subsets of size r of the set {1,2,. . . , n ) (Ross 1989). An equivalent solution for the same problem is obtained by calculating the probability of the intersection of all the comple- ments Af, A;, . . . ,A$, in order to analyse the probability of 'never
Fig. 20. Individual probability maps for a 10' m3 (DRE) dome collapse (DC) down (a) Tar River valley, (b) White River valley, (c) Fort Ghaut, (d) Tyre's Ghaut and (e) Tuitt's Ghaut; ( f ) a lo6 m3 (DRE) Vulcanian explosion (VE) with a symmetrical fountain collapse down the same valleys. Co-PF plume sources used in the modelling are also shown (black diamonds). Contour interval is 10% probability. The threshold used is 12 kgm-2 (minor damage to agriculture), and wind data cover a six-year period starting from 1992 (Runs 11 and 12 in Table 2).

MODELLING OF DOME-COLLAPSE AND VULCANIAN FALLOUT 533
- Probability (%)
Computed co-PF source points
A Soufrihre Hills Volcano
PROBABILITY MAPS
Threshold: 120 kg m2
Fig. 21. Individual probability maps for a threshold of 120 kgm-2 (minimum threshold for roof collapse), and computed separately for a lo7 m3 (DRE) dome collapse down the five main valleys around the volcano (Tar River valley, White River valley, Fort Ghaut, Tyre's Ghaut and Tuitt's Ghaut; see Fig. 1). Computed co-PF plume sources are also shown (black diamonds). Contours shown are the 10% and 90% probability for each tephra-fallout contribution. The probability of reaching a threshold of 120 kg for a lo6 m3 (DRE) Vulcanian explosion is <0.1% everywhere on the island (Runs 11 and 12 in Table 2).
CUMULATIVE PROBABILITY MAPS FOR THE MINIMUM DEPOSIT
Computed co-PF
Fig. 22. Cumulative probability maps for the minimum tephra-fallout deposit corresponding to the activity scenario described in Table 4. Dome and fountain collapses are simulated down four valleys around the volcano (Tar River valley, White River valley, Fort Ghaut and Tuitt's Ghaut; see Fig. 1). These maps are based on the assumption of complete erosion between separate events (computed in terms of union and intersection of individual probabilities, see text for details). Thresholds used: (a) 12 k g n r 2 (minor damage to agriculture); (b) 120 kgm-2 (minimum accumulation for roof collapse); (c) 180kgm-~ (partial survival of vegetation: zone 2); (d) 600 k g m ~ ~ (partial survival of vegetation: zone I). Computed co-PF plume sources are also shown (black diamonds). Contour interval is 10% probability for (a), (b) and (c); in (d) only contours of 1%, 10% and 20% probability are shown. Wind data cover a three-year period starting from 1995.
The maximum-deposit probability is given by adding all the reaching a certain deposit threshold in a given grid point for a probable contributions of tephra-fallout deposition produced by scenario of activity9, l-hus, the probability of reaching a given individual dome collapses and Vulcanian explosions in the scen- threshold in a given grid point for a given scenario of activity is: ario of activity in Table 4 and considering erosion to be negligible.
However, the number of combinations of tephra-fallout deposit p(Al U A2 U . . . U A,) = 1 - ~ ( ~ 1 7 ) x P(A:) x . . . x P(A$) (20) produced by individual dome collapses and Vulcanian explosions,
Table 4. Parameters used in the simulations for cumulative-probability maps (approximation of the July 1995-March 1998 activity)
Event Volume DRE Number Diffusion coefficient Grain-size Vent-plume Aggregation (x lo6 m3) of events (m2 s-') distribution mass distribution model
Events: DC, dome collapse; VE, Vulcanian explosion (computed with fountain collapse). Volumes and numbers of events represent an approximation for three-year period of activity of Soufriere Hills Volcano (July 1995-March 1998). Grain-size distributions are shown in Figure 2 (A, 31 March 1997 dome collapse; B, 26 September 1997 (14:56 LT) Vulcanian explosion; C, 21 September 1997 dome collapse). Vent-plume mass Distribution 4 is described in Figure 3d. Aggregation Models 3 and 4 are described in Table 1.

534 C. BONADONNA ET AL.
valleys of collapse and wind profiles is impracticable to compute. Therefore, maps for the maximum-deposit probability were computed using a Monte-Carlo technique in which the computer generates pseudo-random numbers (random numbers that are the result of an algorithm). Pseudo-random numbers were then used to simulate naturally random parameters such as wind profile and valley of collapse. The wind profile is naturally random and does not depend on the eruptive event. The valley of collapse depends on the direction of preferential dome growth, which is assumed to be naturally random (Watts el al. 2002). Therefore, the valley of collapse is also assumed to be random.
The accuracy of the Monte-Carlo simulations was studied by calculating several times the probability of reaching a certain depo- sit threshold (12 kg m-2) a t a particular locality (site c in Fig. 1) for different numbers of runs and for different numbers of wind profiles (one, three and six years) (Fig. 23). These simulations (50, 100,200,
A A 3 years (1 992-1 997)
(a) -
A
10 0 200 400 600 800 1000 1200
Number of runs
0 0 200 400 600 800 1000 1200
Number of runs
A
3 years (1995-1997)
A 1 year (1 997) 3 years (1995-1997) +
+ 6 years (1 992-1997) A @I
B A - 0 0 A
Number of runs
Fig. 23. Accuracy of the Monte-Carlo technique used to compile cumulative probability maps for the maximum tephra-fallout deposit produced by the activity scenario in Table 4 (Fig. 24). The number of runs and the number of wind profiles are investigated on the basis of: (a) variability of probability values; @) variability of standard deviation (a) of probability values (corresponding power-law fit is shown); (c) variability of the mean of probability values. Probability values are computed for locality c in Fig. 1, a threshold of 12 kgnr2 , wind profiles of one-, two- and three-year periods, and 50, 100, 200, 500 and 1000 runs. Each simulation was run 20 times for the case of one-year period and ten times for the cases of two- and three-year periods.
500, 1000 runs) were repeated 20 times for the case of one year and ten times for the cases of three and six years, using different pseudo- random sequences. The standard deviation for the three wind-data groups decreases with the number of runs, but does not vary significantly with the number of wind profiles used (Fig. 23b). The variation of this standard deviation is fitted well by a power law (Fig. 23b). The mean probability also does not vary significantly for the three ranges of wind profiles used (Fig. 23c) (standard deviation of the mean probability of the three populations of wind profiles: 0.7, 0.6, 0.8 for one year, three years and six years of wind profile respectively). Maps in Figure 24 are computed using three-year wind profiles (1995-1997) over 200 runs.
Discussion
HAZMAP results show good agreement with field data, in terms of both mass accumulation of fallout tephra, and variations of grain- size distribution with distance from vent. This agreement has some implications for tephra-fallout processes and allows probability maps to be compiled.
Simulations of co-PF and Vulcanian vent plumes as thermal injections give good agreement with field data (Table 3). This is supported by the comparison of theory with observations for co- ignimbrite plumes (Woods & Kienle 1994), and by field observations
Fig. 24. Cumulative probability maps for the maximum tephra-fallout deposit corresponding to the activity scenario described in Table 4. Dome and fountain collapses are simulated down four valleys around the volcano (Tar River valley, White River valley, Fort Ghaut and Tuitt's Ghaut; see Fig. 1). These maps are based on the assumption of no erosion between separate events (i.e. computed using a Monte-Carlo technique, see text for details). Thresholds used: (a) 12 kg m-2, minor damage to agriculture; (b) 120 kgmT2, minimum accumulation for roof collapse; (c) 180kgnr2, partial survival of vegetation, zone 2; (d) 600 k g n ~ - ~ , partial survival of vegetation, zone I . Computed co-PF plume sources are also shown. Isomass contour interval is 20% probability. Maps are computed using a three-year period of wind profiles (1995-1997) and 200 runs.

MODELLING OF DOME-COLLAPSE AND VULCANIAN FALLOUT 535
for Vulcanian explosions described in Druitt et al. (2002). Model- ling dome-collapse and Vulcanian plumes as vertical lines, neglect- ing particle re-entrainment, still give adequate agreement near the source.
The model agrees well with observed data only if particle aggregation is incorporated into the simulations of tephra fallout from dome collapses and Vulcanian explosions (Figs 11 and 12). Dispersal of co-PF plumes from dome collapses is more sensitive to different aggregation models than that of Vulcanian plumes, since co-PF plumes are composed almost entirely of fine ash. Aggrega- tion models presented in this paper represent a first attempt to simulate numerical aggregation mechanisms that generate different types of aggregates, such as irregular aggregates and accretionary lapilli (Bonadonna et al. 2002). As a first approximation, the aggregation model of Cornell et al. (1983) (Model I) can be used to simulate the formation of irregular aggregates, as it assumes one fixed aggregate size of 250 pm (4 = 2), in agreement with the typical sizes of irregular aggregates observed on Montserrat (10-100pm). However, observations of fallout tephra from both dome collapses and Vulcanian explosions on Montserrat have shown that aggre- gates vary in size, and that accretionary lapilli are also character- ized by larger diameters (150pm to I l mm). Models 2, 3 and 4 better describe the formation of accretionary lapilli and their size variations. In these three models, the size of accretionary lapilli is specific for each event, varying from about 200 pm for small co-PF plumes (Ht = 2 km) to about 11 mm for the largest co-PF plumes (Ht = 15 km) (Table 1). These sizes are consistent with observations (Bonadonna et al. 2002). However, Models 2, 3 and 4 can only describe three size categories for each plume height (based on three different aggregation coefficients), whereas the whole distribution of accretionary lapilli sizes can be characterized by several more sizes, ranging from a few hundred micrometres to a few millimetres (Bonadonna et al. 2002). Too little is known about the dynamics of aggregation to allow the percentage of particles incorporated into the accretionary lapilli to be predicted a priori. To achieve better results, further studies on the interaction between atmospheric conditions, plume height and plume-mass loading are needed. The empirical Models 3 and 4 give adequate results for hazard- assessment purposes.
Differential fallout (combination of wind shear and simultaneous tephra dispersal from Vulcanian vent and co-PF plumes) is mainly due to differences in plume heights (Fig. 19). Wind direction and speed typically vary with height; therefore, the (higher) vent plume can be dispersed in very different ways from the co-PF plumes. Field data have shown that differential fallout can have significant effects on the resulting grain-size distribution pattern around the volcano, as the vent plume is typically characterized by coarser particles and is affected by different aggregation processes, mainly due to a thicker umbrella cloud and to different plume mass load- ings. The tephra-fallout deposit is predicted to vary from bimodal and fine-grained in the area of overlap, to unimodal and coarse- grained in the areas where only the vent-plume tephra deposits are present. This feature is commonly observed in tephra-fallout deposits from large Vulcanian explosions (Bonadonna et al. 2002).
Variations with distance from vent of the computed grain-size distributions agree with field data. Computed tephra-fallout deposits show variations of the computed accretionary-lapilli size distributions with distance from vent, with most of the accretionary lapilli falling in proximal areas. Aggregation is the most obvious interpretation for strong bimodality in grain-size distributions of fallout tephra from dome collapses, which in the tephra-fallout deposit from the 3 1 March 1997 dome collapse was observed within 5 km from the dome (Bonadonna et al. 2002). However, both com- puted results and field data from some distal samples are slightly bimodal (Fig. 18c), even though the computed deposit consists of non-aggregated particles only. Bimodality shown by field data in distal areas might be due to very small aggregates and crystal aggregates, which are often observed with SEM analysis (Bona- donna et al. 2002). However, bimodality shown by computed data is due to the fact that the assumed input grain size is already bimodal (Fig. 2a).
Individual probability maps show that tephra fallout from dome collapses and Vulcanian explosions on a Montserrat scale can accumulate a mass of fallout tephra above the threshold of 'minor damage to agriculture' (1 2 kg m-2) over large areas of the island, but cannot cause significant widespread damage to buildings and vegetation (> 120 kgmT2). However, persistent dome-collapse activ- ity (1996-1999) associated with Vulcanian explosions (August- October 1997) accumulated enough material on Montserrat to reach values of over 600 kgmT2 (partial survival of vegetation) in the southwestern part of the island, and up to 12kgm-2 (minor damage to vegetation) in the northern part (Bonadonna et al. 2002). We conclude that the use of cumulative probability maps, taking into account the cumulative effects of multiple eruptive events, is necessary in hazards assessment of fallout tephra generated during long-lasting eruptions.
There are large differences between the minimum-deposit and maximum-deposit cumulative probability maps computed on the basis of the July 1995-March 1998 period. For example, were fallout tephra washed away after every individual dome collapse and Vulcanian explosion (Fig. 22), the probability of reaching the first threshold for partial survival of vegetation (600 kgm-2) would be <lo% everywhere on the island. However, a continuous accumulation of fallout tephra with negligible erosion extends the area of 100% probability for such a threshold to a consistent area on the SW of the island (Fig. 24), in agreement with field data (Bonadonna et al. 2002). Which map is actually relevant depends on the effectiveness of erosion between events. During 1995-1998, erosion processes were more effective in the north, where deposits were thinner, whereas localities in the SW preserved much of the tephra-fallout deposits, even after several years. This shows that in long-lasting eruptions with many tephra-fallout events, an under- standing of erosion is required to produce accurate hazard maps.
Both probability maps of individual dome collapses and Vulcanian explosions, and cumulative probability maps show that the area on Montserrat that is most prone to tephra-fallout hazards is the WSW sector, with only minor damage to vegetation occurring up to St John's (Fig. 1). The north of the island (north of Woodlands; Fig. 1) receives little fallout tephra. Only combinations of unfortunate wind directions, high eruptive columns and vigorous activity can transport significant fallout tephra into northern Montserrat. Due to the wind direction and the decreasing distance from the dome, the currently populated areas in the NW (Wood- lalids; Fig. 1) and centre-west (Old Towne; Fig. 1) of the island are those where the chances of significant tephra fallout increase markedly. It is, however, unlikely that accumulation great enough to be life-threatening (e.g. roof collapse) will occur. Due to the pre- vailing wind directions, the Bramble Airport area (NNE of the island; Fig. 1) is very unlikely to be affected by tephra from plumes lower than 5 km a.s.l., which are typical of small dome collapses ( 5 2 x lo6 m3 DRE). Due to the rarer occurrence of higher plumes from large dome collapses and Vulcanian explosions, the prob- ability of accumulating up to 1 cm of fallout tephra at the airport in three years of activity (in Table 4) is still high (20-90%), but the probability of accumulation above lOcm is low (0.5-5%).
Conclusions
The HAZMAP model simulates tephra dispersal by solving for the diffusion, transport and sedimentation of particles in two dimen- sions from a distribution of source points. The model tested on the eruption of Soufriire Hills Volcano from 1995 to 1999 shows good agreement with observed data, allowing realistic probability maps for tephra-fallout hazard to be compiled.
Good agreement between observations and model results is obtained when:
(1) Vulcanian vent plumes and Vulcanian and dome-collapse co-PF plumes are simulated as instantaneous injections of thermals;

VNA ET AL.
(2) runouts of Vulcanian and dome-collapse pyroclastic flows are calculated as logarithmic functions of the pyroclastic- flow volume;
(3) co-PF plumes are simulated with a 1-km spacing along the parent pyroclastic flow;
(4) elutriated masses in Vulcanian and dome-collapse co-PF plumes decrease exponentially with distance from the dome base.
Comparison of field data with simulated tephra-fallout deposits from dome collapses and Vulcanian explosions shows best-fit results when:
( 5 ) mass distribution in volcanic thermals is uniform; (6) decrease of elutriation masses in successive co-PF plumes
follows a factor of exp(lO/PF runout); (7) diffusion coefficient is 2700m2 s-I; (8) particle aggregation is described considering a variation in
the aggregate-size range.
Some general features of tephra-fallout deposits from dome collapses and Vulcanian explosions also emerge from our modelling results.
(9) Simulation of tephra dispersal from dome collapses is signifi- cantly sensitive to inputs of total volumes and aggregation models used, whereas simulations of Vulcanian explosions are mainly sensitive to volume inputs. When particle aggrega- tion is considered, simulations of dome collapses and Vulcan- ian explosions are not very sensitive to grain-size distributions.
(10) Aggregation processes are a major factor in the modelling of tephra dispersal from dome-collapse co-PF plumes, which are rich in fine ash, representing a major cause of grain-size distribution bimodality in dome-collapse fallout tephra.
(1 1) Aggregate size and percentage of particles incorporated into aggregates exert an important control on tephra accumula- tion.
(12) Computed isomass maps for large Vulcanian explosions predict a diyerential fallout dispersal. This is due to the com- bination of plume height and wind shear when tephra fallout from the vent plume occurs simultaneously with that from co-PF plumes from fountain-collapse pyroclastic flows of large Vulcanian explosions. This has significant implications for the grain-size distributions of tephra-fallout deposits, as also confirmed by field data.
From the perspective of tephra-fallout hazards assessment, the following points emerge.
(13) Tephra fallout from individual dome collapses and indivi- dual Vulcanian explosions on a Montserrat scale does not produce deposits thick enough to cause widespread damage to vegetation and human activities.
(14) The amalgamation of tephra from many events of tephra fallout generated during a long-lasting eruption represents a significant hazard in terms of damage to agriculture, roof collapses, polluting effects and exposure to particulate pollution.
(15) Hazards of fallout tephra produced during long-lasting erup- tions need to be assessed using individual-probability maps together with cumulative-probability maps compiled for the minimum and maximum deposits.
In terms of hazards assessment on Montserrat, we finally make the following conclusions.
(16) Tephra fallout from dome collapses is the most hazardous of tephra-generation processes observed on Montserrat because: (i) dome-collapse activity was the most persistent processes during the whole 1995-1999 eruptive period; (ii) dome col-
lapses can also occur after the lava dome stops growing; (iii) fallout tephra from dome collapses contains more crystalline silica in the <10pm fraction than fallout tephra from other processes.
(17) The SW sector of Montserrat is the most prone to fallout tephra, experiencing damage to vegetation for fallout tephra from individual events and also serious damage to vegeta- tion and buildings as a consequence of three years of activity (of the 1995-1998 type). The north, NE and NW sectors d o receive some fallout tephra from individual dome collapses and Vulcanian explosions, but not enough to cause serious damage to vegetation and buildings. Three years of activity can also cause minor damage to vegetation in these sectors.
The authors would like to thank A. Longo, who initiated the model presented here, for her work on fallout hazard assessment in the Vesuvius area. Computer modelling was made easier by the helpful advice of R. Herd and H. Dixon. Many thanks also to A. Hogg for helpful discussions concerning parts of this study. T. Druitt and A. Woods are gratefully acknowledged for thorough and constructive reviews. Studies on Mon- tserrat were supported by the Department for International Development. C. Bonadonna is supported by an EC Marie Curie PhD Fellowship. R. S. J. Sparks is supported by a NERC Professorship.
References
ARASTOOPOUR, H., WANG, C. H. & WEIL, S. A. 1982. Particle-particle interaction force in a dilute gas-solid system. Chemical Engineering Sciences, 37, 1379-1386.
ARMIENTI, P., MACEDONIO, G. & PARESCHI, M. T. 1988. A numerical-model for simulation of tephra transport and deposition - applications to May 18 1980, Mount-St-Helens eruption. Journal of Geophysical Research, 93,6463-6476.
BARBERI, F., MACEDONIO, G., PARESCHI, M. T. & SANTACROCE, R. 1990. Mapping the tephra fallout risk: an example from Vesuvius, Italy. Nature, 344, 142-144.
BAXTER, P. J., BONADONNA, C., DUPREE, R. ET AL. 1999. Cristobalite in volcanic ash of the Soufriire Hills Volcano, Montserrat, British West Indies. Science, 283, 1142-1 145.
BLONG, R. J. 1984. Volcanic Hazards. A Sourcebook on the Effects of Eruptions. Academic Press, Sidney.
BONADONNA, C., MAYBERRY, G. C., CALDER, E. S. E T A L . 2002. Tephra fallout in the eruption of Soufrikre Hills Volcano, Montserrat. In: DRUIT~, T. H. & KOKELAAR, B. P. (eds) The Eruption of Soufrigre Hills Volcano, Montserrat, from 1995 to 1999. Geological Society, London, Memoirs, 21, 483-516.
BRAZIER, S., SPARKS, R. S. J., CAREY, S. N., SIGURDSSON, H. & WESTGATE, J. A. 1983. Bimodal grain-size distribution and secondary thickening in air-fall ash layers. Nature, 301, 115-1 19.
CALDER, E. S., SPARKS, R. S. J. & WOODS, A. W. 1997. Dynamics of co- ignimbrite plumes generated from pyroclastic flows of Mount St. Helens (7 August 1980). Bulletin of Volcanology, 58, 432-440.
CALDER, E. S., COLE, P. D., DADE, W. B. ET AL. 1999. Mobility of pyroclastic flows and surges at the Soufrikre Hills Volcano, Montserrat. Geophysical Research Letters, 26, 537-540.
CALDER, E. S., LUCKET~, R., SPARKS, R. S. J. & VOIGHT, B. 2002. Mechanisms of lava dome instability and generation of rockfalls and pyroclastic flows at Soufriire Hills Volcano, Montserrat. In: DRUIW, T. H, & KOKELAAR, B. P. (eds) The Eruption of Soufri$re Hills Volcano, Montserrat, from 1995 to 1999. Geological Society, London, Memoirs, 21, 173-190.
CAREY, S. N. & SIGURDSSON, H. 1982. Influence of particle aggregation on deposition of distal tephra from the May 18 1980, eruption of Mount St-Helens volcano. Journal of Geophysical Research, 87, 7061-7072.
CAREY, S. N., SIGURDSSON, H. & SPARKS. R. S. J. 1988. Experimental studies of particle-laden plumes. Journal of Geophysical Research, 93, 15 3 14-1 5 328.
COLE, P. D., CALDER, E. S., D R U I T ~ , T. H., HOBLITT, R., ROBERTSON, R. E. A,, SPARKS, R. S. J. & YOUNG, S. R. 1998. Pyroclastic flows generated by gravitational instability of the 1996-97 lava dome of Soufrikre Hills Volcano, Montserrat. Geophysical Research Letters. 25, 3425-3428.

MODELLING O F DOME-COLLAPSE AND VULCANIAN FALLOUT 537
COLE, P. D., CALDER, E. S., SPARKS, R. S. J. ET AL. 2002. Deposits from dome-collapse and fountain-collapse pyroclastic flows at Soufriire Hills Volcano, Montserrat. In: DRUIIT, T. H. & KOKELAAR, B. P. (eds) The Eruption of SoufriPre Hills Volcano, Montserrat. from 1995 to 1999. Geological Society, London, Memoirs, 21, 231-262.
CORNELL, W., CAREY, S. & SIGURDSSON, H. 1983. Computer-simulation of transport and deposition of the Campanian Y-5 Ash. Journal of Vol- canology and Geothermal Research, 17, 89-109.
DOBRAN, F., NERI, A. & MACEDONIO, G. 1993. Numerical-simulation of collapsing volcanic columns. Journal of Geophysical Research, 98, 423 1-4259.
DRUITT, T. H., YOUNG, S. R., BAPTIE, B. ET AL. 2002. Episodes of cyclic Vulcanian explosive activity with fountain collapse at Soufriire Hills Volcano, Montserrat. In: DRUI-IT, T. H. & KOKELAAR, B. P. (eds) The Eruption of Soufriire Hills Volcano, Montserrat, from 1995 to 1999. Geological Society, London, Memoirs, 21, 281-306.
GILBERT, J. S. & LANE, S. J. 1994. The origin of accretionary lapilli. Bulletin of Volcanology, 56, 398-41 1.
GLAZE, L. S. & SELF, S. 1991. Ashfall dispersal for the 16 September 1986, eruption of Lascar, Chile, calculated by a turbulent-diffusion model. Geophysical Research Letters, 18, 1237-1 240.
HARFORD, C. L., PRINGLE, M. S., SPARKS, R. S. J. & YOUNG, S. R. 2002. The volcanic evolution of Montserrat using " O ~ r p ~ A r geochronology. In: DRUI-IT, T. H. & KOKELAAR, B. P. (eds) The Eruption of Soufriire Hills Volcano, Montserrat, from 1995 to 1999. Geological Society, London, Memoirs, 21, 93-1 13.
HAY, R. L. 1959. Formation of the crystal-rich glowing avalanche deposits of the St. VINCENT, B. W. I. Journal of Geology, 67, 540-562.
HILDRETH, W. & DRAKE, R. E. 1992. Volcano Quizapu, Chilean Andes. Bulletin of Volcanology, 54, 93-125.
HOBLITT, R. P. 1986. Observations of the eruption of July 22 and August 7 1980, at Mount St. Helens. Washington. US Geological Survey Profes- sional Papers, 1335.
HUPPERT, H. E., TURNER, J. S., CAREY, S. N., SPARKS, R. S. J. & HALLWORTH, M. A. 1986. A laboratory simulation of pyroclastic flows down slopes. Journal of Volcanology and Geothermal Research, 30, 179-199.
LACROIX, A. 1904. La Montagne PelPe et ses eruptions. Masson, Paris. LEVINE, A. H. & KIEFFER, S. W. 1991. Hydraulics of the August 7, 1980,
pyroclastic flow at Mount St. Helens, Washington. Geology, 19, 1121-1 124.
LOUGHLIN, S. C., CALDER, E. S., CLARKE, A. B. ET AL. 2002. Pyroclas- tic flows and surges generated by the 25 June 1997 dome collapse, Soufriire Hills Volcano, Montserrat. In: DRUITT, T. H. & KOKELAAR, B. P. (eds) The Eruption of SoufriPre Hills Volcano, Montserrat, from 1995 to 1999. Geological Society, London, Memoirs, 21, 191-209.
MACEDONIO, G., PARESCHI, M. T. & SANTACROCE, R. 1988. A numer- ical simulation of the Plinian fall phase of 79 AD eruption of Vesuv- ius. Journal of Geophysical Research - Solid Earth and Planets, 93, 14817-14827.
MAYBERRY, G. C., ROSE, W. I. & BLUTH, G. J. S. 2002. Dynamics of volcanic and meteorological clouds produced on 26 December (Boxing Day) 1997 at Soufriire Hills Volcano, Montserrat. In: DRUITT, T. H. & KOKELAAR, B. P. (eds) The Eruption of SoufriPre Hills Volcano, Montserrat. from 1995 to 1999. Geological Society, London, Memoirs, 21, 539-555.
MOORE, K. R., DUFFELL, H., NICHOLL, A. & SEARL, A. 2002. Monitoring of airborne particulate matter during the eruption of Soufriire Hills Volcano, Montserrat. In: D R U I ~ T , T. H. & KOKELAAR, B. P. (eds) The Eruption of SoufriGre Hills Volcano. Montserrat, from 1995 to 1999. Geological Society, London, Memoirs, 21, 557-566.
NORTON, G. E., WATTS, R. B., VOIGHT, B. ETAL. 2002. Pyroclastic flow and explosive activity at Soufriire Hills Volcano, Montserrat, during a period of virtually no magma extrusion (March 1998 to November 1999). In: DRUI'IT, T. H. & KOKELAAR, B. P. (eds) The Eruption of SoufriPre Hills Volcano, Montserrat, from 1995 to 1999. Geological Society, London, Memoirs, 21, 467481.
PASQUILL, F. 1974. Atmospheric Drffusion. John Wiley, Chichester. ROBERTSON, R. E. A,, ASPINALL, W. P., HERD, R. A,, NORTON, G. E.,
SPARKS, R. S. J. & YOUNG, S. R. 2000. The 1995-1998 eruption of the Soufriere Hills volcano, Montserrat, WI. Philosophical Transactions of the Royal Society of London Series a - Mathematical Physical and Engineering Sciences, 358, 161 9-1637.
ROSS, S. M. 1989. A First Course in Probability. Macmillan, New York. SPARKS, R. S. J. & WALKER, G. P. L. 1977. The significance of vitric-
enriched air-fall ashes associated with crystal-enriched ignimbrites. Journal of Volcanology and Geothermal Research, 2, 329-34 I .
SPARKS, R. S. J., SELF, S. &WALKER, G. P. L. 1973. Products of ignimbrite eruptions. Geology, 1, 11 5-1 18.
SPARKS, R. S. J., MOORE, J. G. & RICE, C. J. 1986. The initial giant umbrella cloud of the May 18th 1980, explosive eruption of Mount St. Helens. Journal of Volcanology and Geothermal Research, 28, 257-274.
SPARKS, R. S. J., BONNECAZE, R. T., HUPPERT, H. E., LISTER, J. R., HALLWORTH, M. A., MADER, H. & PHILLIPS, J. 1993. Sediment-laden gravity currents with reversing buoyancy. Earth and Planetary Science Letters, 114, 243-257.
SPARKS, R. S. J., BURSIK, M. I., CAREY, S. N., WOODS, A. W. &GILBERT, J. S. 1994. The controls of eruption-column dynamics on the injection and mass loading of ash into the atmosphere. In: First International Sym- posium on Volcanic Ash and Aviation Safety, Seattle, Washington. US Government Printing Office, Washington, 81-86.
SPARKS, R. S. J., BURSIK, M. I., CAREY, S. N., GILBERT, J. S., GLAZE, L. S., SIGURDSSON, H. & WOODS, A. W. 1997. Volcanic Plumes. John Wiley, Chichester.
SPARKS, R. S. J., BARCLAY, J., CALDER, E. S. ETAL. 2002. Generation of a debris avalanche and violent pyroclastic density current on 26 Decem- ber (Boxing Day) 1997 at Soufriire Hills Volcano, Montserrat. In: DRUITT, T. H. & KOKELAAR, B. P. (eds) The Eruption ofSoufriPre Hills Volcano, Montserrat,from 1995 to 1999. Geological Society, London, Memoirs, 21, 409-434.
SUZUKI, T. 1983. A theoretical model for dispersion of tephra. In: SHIMOZURU, D. & YOKOYAMA, I. (eds) Arc Volcanism, Physics and Tectonics. Terra Scientific, Tokyo, 95-1 13.
THORARINSSON, S. 1944. Petrokronologista Studier pa Island. Geographes Annuales Stockholm, 26, 1-217.
WADGE: G. & ISAACS, M. C. 1988. Mapping the volcanic hazards from Soufriire Hills Volcano, Montserrat, West-lndies using an image- processor. Journal of the Geological Society. 145, 541-552.
WATTS, R. B., HERD, R. A., SPARKS, R. S. J. & YOUNG, S. R. 2001. Growth patterns and emplacement of the andesitic lava dome at Soufri6re Hills Volcano, Montserrat. In: DRUITT, T. H. & KOKELAAR, B. P. (eds) The Eruption of SoufriPre Hills Volcano. Montserrat, from 1995 to 1999. Geological Society, London, Memoirs, 21, 115-152.
WOODS, A. W. & BURSIK, M. I. 1994. A laboratory study of ash flows. Journal ofGeophysica1 Research - Solid Earth, 99, 4375-4394.
WOODS, A. W. & CAULFIELD, C. C. P. 1992. A laboratory study of explosive volcanic-eruptions. Journal of Geophysical Research - Solid Earth. 97, 6699-67 12.
WOODS, A. W. & KIENLE, J. 1994. The dynamics and thermodynamics of volcanic clouds - Theory and observations from the April 15 and April 21, 1990 eruptions of Redoubt volcano, Alaska. Journal of Volcanology and Geothermal Research, 62, 273-299.