Phenocryst-hosted melt inclusions record stalling of magma during ascent in the conduit and upper...
16
RESEARCH ARTICLE Phenocryst-hosted melt inclusions record stalling of magma during ascent in the conduit and upper magma reservoir prior to vulcanian explosions, Soufrière Hills volcano, Montserrat, West Indies Crystal P. Mann & Paul J. Wallace & John Stix Received: 30 August 2010 / Accepted: 27 November 2012 / Published online: 25 January 2013 # Springer-Verlag Berlin Heidelberg 2013 Abstract The mechanics of explosive eruptions influence magma ascent pathways. Vulcanian explosions involve a stop–start mechanism that recurs on various timescales, evacuating the uppermost portions of the conduit. During the repose time between explosions, magma rises from depth and refills the conduit and stalls until the overpressure is sufficient to generate another explosion. We have ana- lyzed major elements, Cl, S, H 2 O, and CO 2 in plagioclase- hosted melt inclusions, sampled from pumice erupted during four vulcanian events at Soufrière Hills volcano, Montserrat, to determine melt compositions prior to eruption. Using Fourier transform infrared spectroscopy, we measured val- ues up to 6.7 wt.% H 2 O and 80 ppm CO 2 . Of 42 melt inclusions, 81 % cluster between 2.8 and 5.4 wt.% H 2 O (57 to 173 MPa or 2–7 km), suggesting lower conduit to upper magma reservoir conditions. We propose two models to explain the magmatic conditions prior to eruption. In Model 1, melt inclusions were trapped during crystal growth in magma that was stalled in the lower conduit to upper magma reservoir, and during trapping, the magma was undergoing closed-system degassing with up to 1 wt.% free vapor. This model can explain the melt inclusions with higher H 2 O contents since these have sampled the upper parts of the magma reservoir. However, the model cannot explain the melt inclusions with lower H 2 O because the timescale for plagioclase crystallization and melt inclusion entrapment is longer than the magma residence time in the conduit. In Model 2, melt inclusions were originally trapped at deeper levels of the magma chamber, but then lost hydro- gen by diffusion through the plagioclase host during peri- odic stalling of the magma in the lower conduit system. In this second scenario, which we favor, the melt inclusions record re-equilibration depths within the lower conduit to upper magma reservoir. Keywords Vulcanian explosions . Melt inclusions . Fourier transform spectroscopy . Diffusive re-equilibration . Soufrière Hills volcano . Volatile elements Introduction Dissolved volatiles (H 2 O, CO 2 , S, Cl, and F) comprise only several weight percent of magma, yet volatile exsolution and expansion of the vapor phase provide the major driving force for magma ascent and explosive eruptions. Differences in eruptive style are controlled by the exsolution efficiency of dissolved volatiles and crystallization due to degassing of the magma, which when coupled have a major effect on magma properties such as rheologic stiffening. Modeling these coupled mechanisms places constraints on the main parameters that control these different processes and the transitions between eruptive styles (Eichelberger et al. 1986; Jaupart and Allègre 1991). However, a large number of parameters cannot be measured directly in natural sys- tems (e.g., viscosity, kinetics of crystallization, conduit Editorial responsibility: M.A. Clynne Electronic supplementary material The online version of this article (doi:10.1007/s00445-013-0687-4) contains supplementary material, which is available to authorized users. C. P. Mann : J. Stix (*) Department of Earth & Planetary Sciences, McGill University, 3450 University Street, Montreal, QC H3A 2A7, Canada e-mail: [email protected] P. J. Wallace Department of Geological Sciences, University of Oregon, Eugene, OR 97403-1272, USA Present Address: C. P. Mann De Beers Canada Inc., 900-250 Ferrand Drive, Toronto, ON M3C 3G8, Canada Bull Volcanol (2013) 75:687 DOI 10.1007/s00445-013-0687-4
Transcript of Phenocryst-hosted melt inclusions record stalling of magma during ascent in the conduit and upper...

RESEARCH ARTICLE
Phenocryst-hosted melt inclusions record stalling of magmaduring ascent in the conduit and upper magma reservoirprior to vulcanian explosions, Soufrière Hills volcano,Montserrat, West Indies
Crystal P. Mann & Paul J. Wallace & John Stix
Received: 30 August 2010 /Accepted: 27 November 2012 /Published online: 25 January 2013# Springer-Verlag Berlin Heidelberg 2013
Abstract The mechanics of explosive eruptions influencemagma ascent pathways. Vulcanian explosions involve astop–start mechanism that recurs on various timescales,evacuating the uppermost portions of the conduit. Duringthe repose time between explosions, magma rises fromdepth and refills the conduit and stalls until the overpressureis sufficient to generate another explosion. We have ana-lyzed major elements, Cl, S, H2O, and CO2 in plagioclase-hosted melt inclusions, sampled from pumice erupted duringfour vulcanian events at Soufrière Hills volcano, Montserrat,to determine melt compositions prior to eruption. UsingFourier transform infrared spectroscopy, we measured val-ues up to 6.7 wt.% H2O and 80 ppm CO2. Of 42 meltinclusions, 81 % cluster between 2.8 and 5.4 wt.% H2O(57 to 173 MPa or 2–7 km), suggesting lower conduit toupper magma reservoir conditions. We propose two modelsto explain the magmatic conditions prior to eruption. InModel 1, melt inclusions were trapped during crystal growthin magma that was stalled in the lower conduit to uppermagma reservoir, and during trapping, the magma was
undergoing closed-system degassing with up to 1 wt.% freevapor. This model can explain the melt inclusions withhigher H2O contents since these have sampled the upperparts of the magma reservoir. However, the model cannotexplain the melt inclusions with lower H2O because thetimescale for plagioclase crystallization and melt inclusionentrapment is longer than the magma residence time in theconduit. In Model 2, melt inclusions were originally trappedat deeper levels of the magma chamber, but then lost hydro-gen by diffusion through the plagioclase host during peri-odic stalling of the magma in the lower conduit system. Inthis second scenario, which we favor, the melt inclusionsrecord re-equilibration depths within the lower conduit toupper magma reservoir.
Keywords Vulcanian explosions . Melt inclusions . Fouriertransform spectroscopy . Diffusive re-equilibration .
Soufrière Hills volcano . Volatile elements
Introduction
Dissolved volatiles (H2O, CO2, S, Cl, and F) comprise onlyseveral weight percent of magma, yet volatile exsolutionand expansion of the vapor phase provide the major drivingforce for magma ascent and explosive eruptions. Differencesin eruptive style are controlled by the exsolution efficiencyof dissolved volatiles and crystallization due to degassing ofthe magma, which when coupled have a major effect onmagma properties such as rheologic stiffening. Modelingthese coupled mechanisms places constraints on the mainparameters that control these different processes and thetransitions between eruptive styles (Eichelberger et al.1986; Jaupart and Allègre 1991). However, a large numberof parameters cannot be measured directly in natural sys-tems (e.g., viscosity, kinetics of crystallization, conduit
Editorial responsibility: M.A. Clynne
Electronic supplementary material The online version of this article(doi:10.1007/s00445-013-0687-4) contains supplementary material,which is available to authorized users.
C. P. Mann : J. Stix (*)Department of Earth & Planetary Sciences, McGill University,3450 University Street,Montreal, QC H3A 2A7, Canadae-mail: [email protected]
P. J. WallaceDepartment of Geological Sciences, University of Oregon,Eugene, OR 97403-1272, USA
Present Address:C. P. MannDe Beers Canada Inc., 900-250 Ferrand Drive,Toronto, ON M3C 3G8, Canada
Bull Volcanol (2013) 75:687DOI 10.1007/s00445-013-0687-4

diameter, magma reservoir overpressure, and magma reser-voir depth, to cite several). Knowing the concentration ofdissolved volatiles and their associated melt compositionsprovides useful information with respect to the magma’sascent path to the surface, degassing mechanisms, and erup-tive styles.
A series of quenched glassy melt inclusions trapped inphenocrysts can provide reliable estimates of melt evolutionover time. These aliquots of melt are trapped in phenocrystsduring crystal growth and thus record melt compositionsand volatile contents at that time. Interpretation of meltinclusion compositions have associated difficulties anduncertainties, yet melt inclusions trapped at different timesduring evolution of a magma body can provide insight intothe changing magma system (e.g., Lowenstern 1995;Wallace et al. 1999; Danyushevsky et al. 2002; Metrichand Wallace 2008).
The current eruption of the Soufrière Hills volcano(SHV), Montserrat, has exhibited a wide variety of eruptivestyles and eruptive products: phreatic to phreatomagmaticexplosions, lava dome extrusion, dome collapse, and sub-plinian to vulcanian explosive eruptions (Robertson et al.2000). Vulcanian explosions commonly follow a large domecollapse and can demonstrate periodicity, with regularlyspaced explosions on the order of hours to days followingthe collapse (Druitt et al. 2002; Edmonds et al. 2006; Herdet al. 2005; Voight et al. 1999). Here, we present the volatile(H2O, CO2, Cl, and S) and major element compositions ofphenocryst-hosted melt inclusions from a suite of sampleserupted from the SHV during vulcanian explosions from1997 to 2004. We aim to use the variability observed inthese volatiles to assess pre-eruptive magmatic conditions(i.e., pressure and depth). Based on our results, we presenttwo models of magma storage appropriate for SHV.
Explosive activity at the Soufrière Hills volcano
The island of Montserrat, located in the northern section ofthe Lesser Antilles volcanic chain, comprises three volcanicmassifs, the youngest of which is the South Soufrière Hills–Soufrière Hills complex beginning at ∼230 ka (Harford et al.2002). On 18 July 1995, after ∼350 years of quiescence,phreatic explosions opened a new vent at the SHV (Younget al. 1998). The current activity has been characterized main-ly by lava dome growth, with associated collapses generatingabundant ash and pyroclastic density currents. On occasion,the lava dome growth has given way to explosive vulcanianeruptions, especially when the volumetric flow rate of themagma is high (Druitt et al. 2002). The eruption is stillongoing at the time of writing (August 2012).
We focus on vulcanian explosions which took placeimmediately after dome collapse. In 1997, ∼13 h after dome
collapse, a series of 13 vulcanian explosions occurred from4 to 12 August 1997, and ∼20 h after dome collapse, anotherseries of 75 vulcanian explosions took place from 22September to 21 October 1997 (Druitt et al. 2002;Robertson et al. 2000). In 2003, a series of five vulcanianexplosions took place from 13 to 15 July, the first during thefinal stages of dome collapse and the other four immediatelyafterwards (Edmonds et al. 2006). On 3 March 2004, oneexplosion occurred immediately after dome collapse fol-lowed by another smaller event on 5 March 2004 (G.Ryan, personal communication).
Working model of vulcanian explosions at the SoufrièreHills volcano
Vulcanian explosions are short (seconds to minutes), dis-crete, small volume explosions (<108m3) (Morrissey andMastin 2000), often occurring as pulsatory events.Vulcanian explosions occur when the conduit is suddenlydecompressed, such as after dome collapse or when gasoverpressure in a rising magma reaches a threshold valuefor explosive activity (Druitt et al. 2002; Robertson et al.1998). For example, a significant, large-volume failure ofthe lava dome beforehand results in rapid initial depressur-ization of the conduit system beneath. This sudden andsubstantial failure may serve as a trigger mechanism andmay be a necessary condition in many cases to allow deepmagma to flow upward, thereby initiating the sequence ofvulcanian eruptions. During decompression, a fragmenta-tion wave propagates down the conduit, tapping magma todepths of 0.5 to 2 km in a few tens of seconds and discharg-ing an average volume of 3×10⁵m3 dense rock equivalent(DRE) in the eruption column and as pyroclastic densitycurrents (Clarke et al. 2007; Druitt et al. 2002; Melnik andSparks 2002). After the initial explosion, magma refills theconduit, forming an impermeable plug of dense, partlysolidified, degassed magma at the top. Magmatic volatilesaccumulate below this plug; when the conduit overpressureexceeds the strength of the plug and surrounding rock, theplug fails resulting in another explosion (Druitt et al. 2002;Self et al. 1979; Voight et al. 1998). Magmatic productsfrom the explosions include ash, ballistic clasts, conduitrock, and pumice.
Methodology
Sampling
Due to their rapid cooling upon eruption, pumice clasts arelikely to preserve glassy phenocryst-hosted melt inclusionsthat are representative of the pre-ascent magma. We chose a
687, Page 2 of 16 Bull Volcanol (2013) 75:687

subset of pristine pumice clasts sampled from the fourevents described in the previous section: the 4–13 August1997 series, 22 September to 21 October 1997 series, 12–15July 2003 series, and 3 March 2004 series, for a total of fivesamples (Fig. 1a).
Melt inclusion selection and preparation
Melt inclusions from plagioclase crystals and a single quartzphenocryst were analyzed for H2O and CO2 by Fouriertransform infrared spectroscopy (FTIR) and for major ele-ments, Cl, F, and S by electron microprobe analysis(EMPA). Although the pumice phenocryst assemblage alsocontains amphibole, orthopyroxene, and Fe–Ti oxides(Murphy et al. 2000), plagioclase was the best choice for meltinclusion studies. Inclusions in the amphiboles were small(<10 μm in diameter; Buckley et al. 2006), making themunsuitable for FTIR analysis, whereas orthopyroxene, Fe–Tioxides, and quartz are present in small quantities (<5 %).
Sample preparation techniques for FTIR are described indetail by Wallace et al. (1999). Samples were lightly crushedand sieved, and plagioclase phenocrysts were separated byhand under a binocular microscope. The phenocrysts werehandpicked in a refractive index liquid to screen for cracksand re-entrant or hourglass features. Phenocrysts weremounted in Crystalbond 509 (an adhesive soluble in ace-tone) and polished on both sides. In the case of the smallermelt inclusions, many of the plagioclase wafers were inter-sected on only one side. We do not consider this to be aproblem because the fundamental OH stretching vibration(3,550 cm−1) used for the analysis of total H2O is not over-lapped by any Si–O or Al–O peaks in plagioclase (1,600 and1,800 cm−1). Inclusion thickness was measured by mount-ing the edge of the doubly polished plagioclase wafer onto aneedle using epoxy and immersing the wafer in a pool ofrefractive index liquid. The crystal was then rotated andviewed parallel to its flat side under a microscope with acalibrated eyepiece, allowing for a direct measurement ofthickness. Because the inclusion can be seen inside thewafer with this method, it is possible to measure the inclu-sion thickness even if it is only intersected on one side of thewafer.
We chose melt inclusions that were wholly enclosed (i.e.,no cracks or re-entrant features). The melt inclusion shapesrange from negative crystal to ellipsoidal with an averagesize of ∼30 μm (Fig. 1b). We analyzed melt inclusions thatwere found both in the crystal core and closer to the rim.Some phenocrysts contain more than one melt inclusion.The melt inclusions were pristine, clear, and glassy with theexception of one which was brown and glassy. Allplagioclase-hosted melt inclusions contained small shrink-age vapor bubbles (Fig. 1b).
Following FTIR analyses, a subset of the plagioclase-hosted melt inclusions and one quartz-hosted melt inclusionwere analyzed by EMPA. To accomplish this, the plagioclaseand quartz wafers were mounted onto double-sided sticky tapeand placed in epoxy (Araldite 502). Once hardened, the mountwas polished first with 6 μm and then 1 μm diamond paste toremove tape resin and expose the melt inclusion.
Fourier transform infrared spectroscopy
Transmission infrared spectra of the melt inclusions wereobtained using a Thermo Nicolet Nexus 670 Fourier trans-form infrared spectrometer (FTIR) interfaced with aContinuum IR microscope at the University of Oregon.The FTIR has a globar source, an extended KBr beamsplit-ter, and a liquid nitrogen-cooled MCT-A detector. The mi-croscope and region around the crystal wafer werecontinuously purged with dry, CO2-free air to eliminateany contribution from atmospheric CO2 to the spectra. Theinfrared beam was directed through an adjustable aperture
Fig. 1 a Photo of pumice used for this study from the 12 July 2003eruption of the Soufrière Hills volcano. b Microphotograph of typicalplagioclase-hosted melt inclusions analyzed for this study. Note thebubbles within the melt inclusions
Bull Volcanol (2013) 75:687 Page 3 of 16, 687

and manually focused on the melt inclusion. Band assign-ments for dissolved water and carbon dioxide in rhyoliticglass were taken from Newman et al. (1986) and Newman etal. (1988), respectively. Water is present as molecular H2Oat 5,200 and ∼1,630 cm−1, as hydroxyl at 4,500 cm−1, and astotal H2O (fundamental OH stretching vibration) at3,550 cm−1. When observed, CO2 is present as molecularCO2 at 2,350 cm−1. Absorbances (peak heights) were mea-sured with the Omnic software using a straight line back-ground in all cases where the peak could be distinguishedfrom background. As most of the melt inclusions analyzedin this study were thin, molecular H2O, OH
− and CO2 weredifficult to distinguish from spectral noise; hence, only theheight of the total water peak at 3,550 cm−1 was measured,and CO2 for these inclusions is reported as below detection(less than ∼50 ppm). Dissolved water and CO2 concentra-tions were calculated from peak heights using the Beer–Lambert law: C=(mw)(abs)/ρdε, where C is the concen-tration in weight fraction of the absorbing species, mwis the molecular weight of the volatile species (18.02 for totalH2O and 44.01 for CO2), abs is the absorbance, ρ is thedensity of the glass, d is the inclusion thickness (path length),and ε is the molar absorption coefficient. Glass densities werecalculated assuming an anhydrous density of 2,400 kgm−3,and correcting for the effect of H2O based on Skirius (1990).The molar absorption coefficients for the 3,550-cm−1 peakwere calculated using the method of Leschik et al. (2004). Themolar absorption coefficient for CO2 was taken fromBehrens et al. (2004). The accuracy of the FTIR anal-yses is limited primarily by (1) the peak height mea-surement, which decreases with decreasing inclusionthickness, and (2) inclusion thickness measurements.For H2O, we calculate a precision of better than 10 %(1σ) based on a minimum of two repeat measurements on thesame melt inclusion. For CO2, we calculate a precision ofbetter than 27 %. Thickness measurements are consideredaccurate to ±3 μm. We report a total error of ±10 % for H2Oand ±28 % for CO2. The FTIR data are reported in ElectronicSupplementary Material Table 1.
Electron microprobe analyses
A subset of the melt inclusion glasses were analyzed byelectron microprobe (EMPA). We analyzed major elements,Cl, F, and S at McGill University using a JEOL JXA-8900electron microprobe with five wavelength dispersive spec-trometers. Operating conditions were an accelerating volt-age of 15 kV, a beam current of 10 nA, and a beam diameterof 15 μm. For calibration, a series of glass standards werechosen which correspond closely to major element compo-sitions of the melt inclusion glass. Silica, Al, Na, and K werecalibrated with a hydrous synthetic standard (M6N), Fe withUTR2, and Mg, Ca, Ti, and P with BMAK (VG-A99)
(Devine et al. 1995; Stix et al. 1995; Jarosewich et al.1980). Mn was calibrated with spessartine, Ba with Ba-richalkali feldspar, Cl with KN9 (3,100 ppmCl) (Stix et al. 1995), Swith a pyrrhotite standard (No. 507: 38.25 wt.% S), and F withfluorite (48.66 wt.% F). Analytical techniques were optimizedto minimize loss of sodium while at the same time ensuringgood precision. Elements were analyzed in the same order andfor the same length of time for both standards and unknowns.For analysis of chlorine, fluorine, and sulfur, we increased thecount times to improve statistical precision. The counting timesfor S (100 s), Cl (100 s), and F (500 s) reduced detection limitsto ∼140 ppm for S, ∼70 ppm for Cl, and ∼200 ppm for F. Eachglass spot was analyzed once and the ZAF correction modelapplied. For major elements, precision for Si is better than0.3 %; Al, Ti, Ca, Mg, and Fe are better than 0.5 %; K is betterthan 1 %; Na is better than 5%; P is better than 6 %; andprecision for Ba is better than 1 %. Precision for Cl is betterthan 2 %. S and F were close to detection.
Using detailed back-scattered electron imaging (BSE),we looked for signs of post-entrapment crystallization(PEC) (Humphreys et al. 2010). We observed no change incolor contrast (i.e., a dark rind of sodic plagioclase or alighter rind of calcic plagioclase) around the edge of themelt inclusions and therefore consider changes in melt com-position due to PEC to be negligible.
Results
Dissolved H2O and CO2 concentrations
We report H2O and CO2 concentrations from 42 melt inclu-sions analyzed by FTIR. Dissolved H2O concentrations fromthe melt inclusions (39 from plagioclase and 3 from quartz)range from 1.2 to 6.7 wt.% H2O (Fig. 2 and Tables 1 and 2).CO2 concentrations are <80 ppm as measured in a total of fourmelt inclusions and below detection in 38 melt inclusions(Fig. 3). Most melt inclusions (81 %) have H2O contentsbetween 2.8 and 5.4 wt.% H2O. We interpret the low CO2
contents to reflect both partial degassing of the melts beforeinclusion entrapment, which would affect less soluble CO2
muchmore than H2O and Cl, and post-entrapment loss of CO2
to shrinkage bubbles (e.g., Metrich and Wallace 2008).Devine et al. (1998) used the volatile-by-difference meth-
od (VBD, where 100 wt.% minus the analytical total equalsthe volatile content) to estimate H2O contents from pumiceexplosively erupted in September of 1996. They report anaverage of 4.7 wt.% H2O for 26 plagioclase-hosted meltinclusions and 3.7 wt.% H2O for two quartz-hosted meltinclusions. Edmonds et al. (2001, 2002) report a mean watercontent in plagioclase-hosted melt inclusions, also using thevolatile-by-difference method, of 4.9 wt.% from densedome material and vesiculated blocks ejected by eruptions
687, Page 4 of 16 Bull Volcanol (2013) 75:687

in April–September 1996 and 21 September 1997. Barclayet al. (1998) analyzed six quartz-hosted melt inclusions fromthe July to December 1996 eruptions by FTIR and report anaverage of 4.3±0.5 wt.% H2O and CO2 contents of <50 ppmin two melt inclusions (total error of 12.5 % which includesthickness measurements and background fitting procedure).Buckley et al. (2006) report VBD totals from fourhornblende-hosted melt inclusions ranging from 3.8 to8.3 wt.% H2O in a sample that was erupted on 1 March1999. Humphreys et al. (2009) used SIMS techniques tomeasure a range of water contents ranging from 1.1 to6.2 wt.% in plagioclase-hosted melt inclusions from scoria-ceous pyroclastic flow material erupted on 8 January 2007.
Comparing volatile contents from different eruptions, wefind that our highest H2O concentrations and the broadestrange of H2O contents are observed in pumice from August1997, but all the vulcanian events show overlap in watercontents (Fig. 4). The H2O and CO2 contents we measureshow good agreement with previous studies (Figs. 2 and 3;Tables 1 and 2).
Chlorine, fluorine, and sulfur contents
Chlorine was analyzed by EMPA in one quartz-hosted meltinclusion and ten plagioclase-hosted melt inclusions(Table 1). The chlorine content of the quartz-hosted melt
Fig. 2 Histograms of H2Ocontents in melt inclusions andmatrix glasses. a Histogram ofour measured H2O contents inmelt inclusions compared toprevious studies. Data fromDevine et al. (1998), Edmondset al. (2001), Humphreys et al.(2009), Barclay et al. (1998),and Buckley et al. (2006) bHistogram of H2O contents inmatrix glasses from 1997 and2000 dome fragments inpyroclastic flow deposits(Edmonds et al. 2002) and from2007 scoriaceous pyroclasticflow deposits (Humphreys et al.2009)
Bull Volcanol (2013) 75:687 Page 5 of 16, 687

inclusion is 2,520 ppm Cl, whereas chlorine contents in theplagioclase-hosted melt inclusions cluster tightly from 2,855to 3,270 ppm Cl (Fig. 5a). For comparison, Cl in meltinclusions reported by Devine et al. (1998), Edmonds etal. (2002), and Humphreys et al. (2009) are 2,630–3,370,910–4,380, and 2,060–4,610 ppm, respectively. Fluorineand S were below detection in all the melt inclusions.
Major element compositions
Plagioclase-hosted melt inclusion compositions range from72.8 to 76.2 wt.% SiO2 (anhydrous), whereas the singlequartz-hosted melt inclusion has 78.7 wt.% SiO2
(anhydrous). Na2O, CaO, and Al2O3 decrease with increas-ing SiO2. TiO2 and FeO decrease slightly, and MgO isnearly constant at ∼0.3 wt.%. The quartz-hosted inclusioncontains the lowest values of Al2O3, CaO, and K2O and oneof the lowest Na2O concentrations. We observe K2O to beslightly compatible trending towards lower K2O in thequartz-hosted melt inclusion. The low K2O concentrationsin this study are most similar to the endmember rhyolite,which has not been enriched in K2O (Humphreys et al.2010). K2O constitutes ∼0.1–0.2 wt.% of plagioclase and∼0.1–0.2 wt.% of amphibole phenocrysts (Murphy et al.2000); therefore, we follow Harford et al. (2002) and sug-gest that the slight compatibility comes from some incorpo-ration of K into these phases.
Discussion
The melt inclusions from 1996 to 2004 are rhyolitic incomposition, with a significant cluster (81 %) having 2.8–5.4 wt.% H2O, low CO2 and S, and high and similar chlo-rine contents from 2,855 to 3,270 ppm Cl. We now discussthese volatile distributions and variability, then examineassociated pressures and depths implied by the water con-tents in magma beneath Soufrière Hills volcano.
Post-entrapment processes
Before interpreting magmatic processes, we assess the meltinclusions in terms of post-entrapment modification. Weconsider diffusive re-equilibration to be the most important(Metrich and Wallace 2008), although H2O degassingthrough microcracks is also a possibility. Diffusive re-equilibration of hydrogen can take place from the hostcrystal to the surrounding magma depending on (1) thespecies diffusion coefficient, (2) the partition coefficient ofthe species between the crystal and liquid, and (3) the ratioof melt inclusion size to host (Qin et al. 1992). Experimentalheating studies of quartz-hosted melt inclusions from theBishop Tuff at 800 °C and 100 MPa have shown that afterT
able
1Chemical
compo
sitio
nof
meltinclusions
Sam
plenu
mber
Sam
pledate
Hostmaterial
Hostmineral
SiO
2TiO
2Al 2O3
FeO
MnO
MgO
CaO
Na 2O
K2O
P2O5
H2O
(wt.%
)Cl(ppm
)
MONT1
1997
Pum
ice
Quartz
78.65
0.18
11.12
1.56
0.09
0.26
1.80
4.42
1.88
0.04
5.04
2,52
0
MONT1
1997
Pum
ice
Plagioclase
75.08
0.23
13.45
1.77
0.12
0.28
2.64
4.20
2.15
0.08
6.86
3,22
3
MONT3
July
2003
Pum
ice
Plagioclase
76.14
0.18
12.76
1.71
0.11
0.30
2.09
4.62
2.02
0.06
3.96
3,02
6
MVO94
2Octob
er19
97Pum
ice
Plagioclase
75.89
0.23
13.24
1.64
0.11
0.29
2.02
4.33
2.20
0.03
3.91
3,15
0
MVO28
3Aug
ust19
97Pum
ice
Plagioclase
74.95
0.24
13.51
1.74
0.09
0.32
2.39
4.55
2.15
0.05
2.82
3,27
0
MVO28
3Aug
ust19
97Pum
ice
Plagioclase
76.18
0.21
12.76
1.66
0.10
0.29
2.18
4.51
2.06
0.05
3.74
2,97
9
MVO28
3Aug
ust19
97Pum
ice
Plagioclase
74.36
0.25
14.11
1.57
0.07
0.31
2.53
4.39
2.36
0.05
2,96
0
MVO28
3Aug
ust19
97Pum
ice
Plagioclase
73.26
0.13
14.75
1.43
0.10
0.25
2.40
4.79
2.83
0.05
5.15
3,18
0
MVO28
3Aug
ust19
97Pum
ice
Plagioclase
74.46
0.20
14.00
1.40
0.10
0.24
2.13
4.58
2.78
0.11
4.80
3,26
0
MVO28
3Aug
ust19
97Pum
ice
Plagioclase
72.83
0.16
14.85
1.50
0.09
0.30
2.25
5.04
2.90
0.08
3,25
0
MVO12
43March
2004
Pum
ice
Plagioclase
76.06
0.21
12.97
1.53
0.08
0.26
1.99
4.77
2.09
0.03
3.81
2,85
5
Major
elem
entox
ides
inwt.%
repo
rted
as10
0%anhy
drou
s
687, Page 6 of 16 Bull Volcanol (2013) 75:687
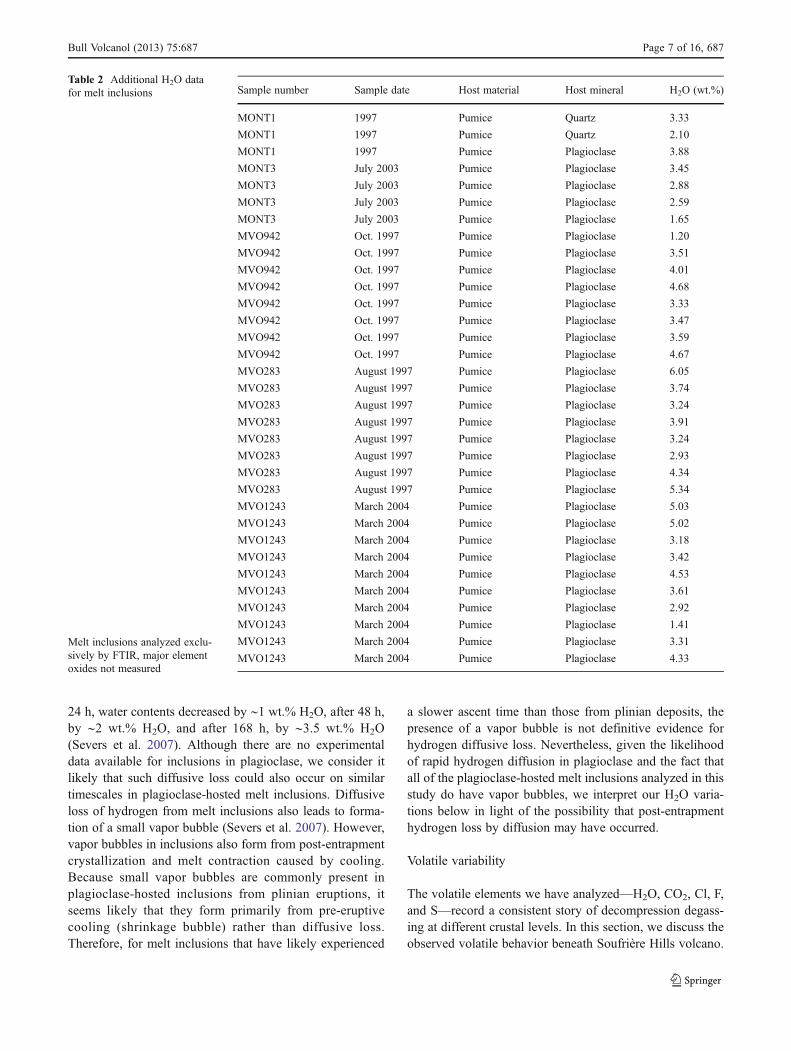
24 h, water contents decreased by ∼1 wt.% H2O, after 48 h,by ∼2 wt.% H2O, and after 168 h, by ∼3.5 wt.% H2O(Severs et al. 2007). Although there are no experimentaldata available for inclusions in plagioclase, we consider itlikely that such diffusive loss could also occur on similartimescales in plagioclase-hosted melt inclusions. Diffusiveloss of hydrogen from melt inclusions also leads to forma-tion of a small vapor bubble (Severs et al. 2007). However,vapor bubbles in inclusions also form from post-entrapmentcrystallization and melt contraction caused by cooling.Because small vapor bubbles are commonly present inplagioclase-hosted inclusions from plinian eruptions, itseems likely that they form primarily from pre-eruptivecooling (shrinkage bubble) rather than diffusive loss.Therefore, for melt inclusions that have likely experienced
a slower ascent time than those from plinian deposits, thepresence of a vapor bubble is not definitive evidence forhydrogen diffusive loss. Nevertheless, given the likelihoodof rapid hydrogen diffusion in plagioclase and the fact thatall of the plagioclase-hosted melt inclusions analyzed in thisstudy do have vapor bubbles, we interpret our H2O varia-tions below in light of the possibility that post-entrapmenthydrogen loss by diffusion may have occurred.
Volatile variability
The volatile elements we have analyzed—H2O, CO2, Cl, F,and S—record a consistent story of decompression degass-ing at different crustal levels. In this section, we discuss theobserved volatile behavior beneath Soufrière Hills volcano.
Table 2 Additional H2O datafor melt inclusions
Melt inclusions analyzed exclu-sively by FTIR, major elementoxides not measured
Sample number Sample date Host material Host mineral H2O (wt.%)
MONT1 1997 Pumice Quartz 3.33
MONT1 1997 Pumice Quartz 2.10
MONT1 1997 Pumice Plagioclase 3.88
MONT3 July 2003 Pumice Plagioclase 3.45
MONT3 July 2003 Pumice Plagioclase 2.88
MONT3 July 2003 Pumice Plagioclase 2.59
MONT3 July 2003 Pumice Plagioclase 1.65
MVO942 Oct. 1997 Pumice Plagioclase 1.20
MVO942 Oct. 1997 Pumice Plagioclase 3.51
MVO942 Oct. 1997 Pumice Plagioclase 4.01
MVO942 Oct. 1997 Pumice Plagioclase 4.68
MVO942 Oct. 1997 Pumice Plagioclase 3.33
MVO942 Oct. 1997 Pumice Plagioclase 3.47
MVO942 Oct. 1997 Pumice Plagioclase 3.59
MVO942 Oct. 1997 Pumice Plagioclase 4.67
MVO283 August 1997 Pumice Plagioclase 6.05
MVO283 August 1997 Pumice Plagioclase 3.74
MVO283 August 1997 Pumice Plagioclase 3.24
MVO283 August 1997 Pumice Plagioclase 3.91
MVO283 August 1997 Pumice Plagioclase 3.24
MVO283 August 1997 Pumice Plagioclase 2.93
MVO283 August 1997 Pumice Plagioclase 4.34
MVO283 August 1997 Pumice Plagioclase 5.34
MVO1243 March 2004 Pumice Plagioclase 5.03
MVO1243 March 2004 Pumice Plagioclase 5.02
MVO1243 March 2004 Pumice Plagioclase 3.18
MVO1243 March 2004 Pumice Plagioclase 3.42
MVO1243 March 2004 Pumice Plagioclase 4.53
MVO1243 March 2004 Pumice Plagioclase 3.61
MVO1243 March 2004 Pumice Plagioclase 2.92
MVO1243 March 2004 Pumice Plagioclase 1.41
MVO1243 March 2004 Pumice Plagioclase 3.31
MVO1243 March 2004 Pumice Plagioclase 4.33
Bull Volcanol (2013) 75:687 Page 7 of 16, 687

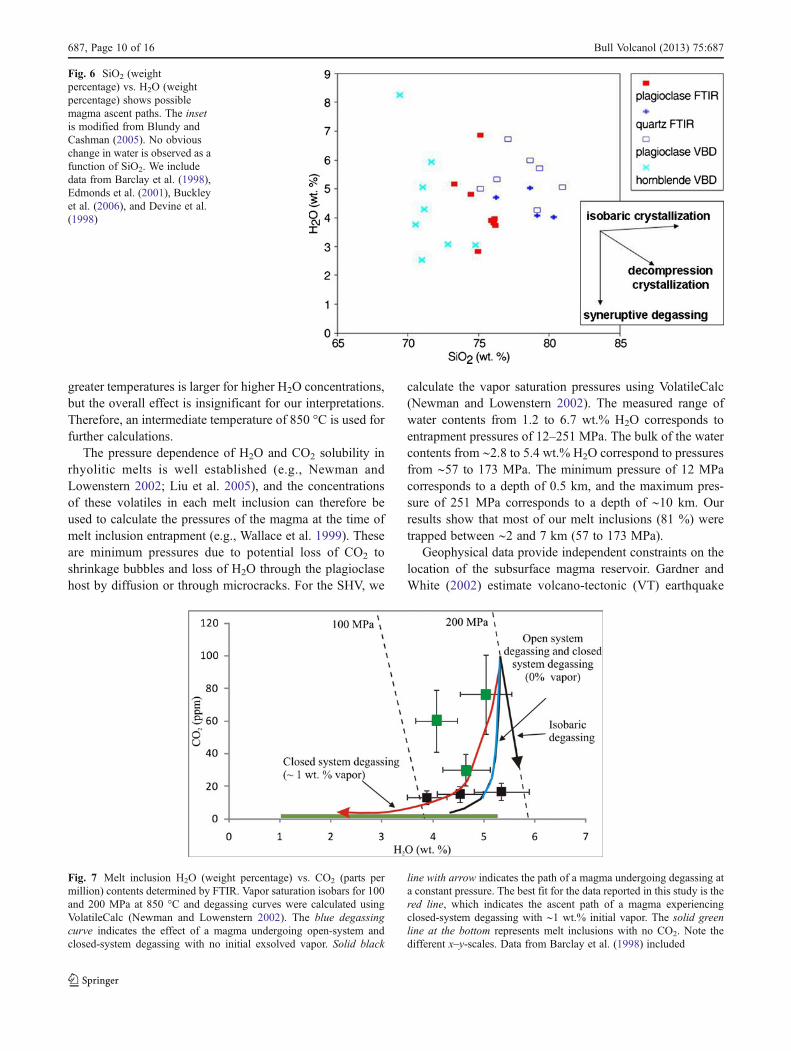
As discussed previously, the melt inclusion volatile con-tents either record conditions at the time of entrapment or, inthe case of H2O, they could represent conditions at the timeof last re-equilibration with the melt surrounding the crystals(or partial re-equilibration if there was insufficient time atlower pressure for full re-equilibration). In Fig. 6, the horn-blende data from Buckley et al. (2006) form a vertical array,suggesting they leaked badly during eruption. Our plagio-clase FTIR data similarly show a mainly vertical array. Thequartz-hosted and plagioclase VBD melt inclusions(Barclay et al. 1998; Devine et al. 1998; Edmonds et al.
2001) show more of a decompression degassing trend.Overall, the data suggest decompression degassing makinga diagonal swath at higher water contents, with hydrogenloss then occurring during the post-entrapment stage andmodifying these values along vertical arrays downward. Ourplot of H2O vs. CO2 generally supports this interpretation(Fig. 7). Here, the best fit to the data is a closed-systemdegassing model with ∼1 wt.% initial vapor present, thoughwe note that there is considerable scatter in the data (Fig. 7).These relationships suggest that the melt was decompress-ing and degassing when the melt inclusions were trapped.
The melt inclusions have relatively high chlorine con-tents for arc magmas (Fig. 5a), a characteristic of the SHVmagmas noted by previous studies (Edmonds et al. 2002;Humphreys et al. 2009). Signorelli and Carroll (2001) useda starting hydrous rhyolitic composition similar to thephenocryst-free pre-eruptive matrix of the SHV andesiteand determined chlorine solubility in the melt of 0.48 to0.68 wt.% Cl (25 to 250 MPa; 860 °C to 890 °C) in thepresence of a Cl-rich aqueous fluid or aqueous fluid+hydro-saline brine. The Cl contents in our melt inclusions, as wellas from other studies, are less than these saturation values(Fig. 5a). This suggests that if the melts were vapor saturat-ed before eruption, the vapor phase would have been Clpoor, and there was not a co-existing brine phase.
In Fig. 8, we have plotted Cl concentrations vs. H2Ocontents in melt inclusions. The most striking relationshipdisplayed on this plot is the constancy of our Cl contentscompared to the greater variability of water. Cl contentsaverage ∼3,000 ppm, whereas water varies from ∼5.5 to∼3 wt.%. The simplest explanation for this observation isthat decompression degassing causes H2O to be lost whileCl remains at near-constant values because of its relativelyhigh solubility. Indeed, Cl is lost in appreciable quantitiesonly at near-surface conditions, e.g., when magma in theshallow conduit is extruded as a lava dome as can be seen onFig. 8.
Melt inclusion data from Humphreys et al. (2009) dis-played on Fig. 8 show a decreasing Cl trend with waterwhich may be the result of temperature differences and/orCO2 additions to the system (Humphreys et al. 2009).Similar to our data, water shows significantly larger vari-ability compared to Cl.
Finally, our model of decompression degassing is alsoconsistent with the very low levels of dissolved carbondioxide that we have measured in the melt inclusions. Formost melt inclusions, CO2 was below detection limits.While we acknowledge that a portion of the initial CO2
could have been lost to the shrinkage bubbles observed inthe melt inclusions, the likely cause of the very low CO2
contents of the melt inclusions is that the magma had lostCO2 before melt inclusion entrapment. This loss likelyoccurred at deeper levels in the magmatic system and is
Fig. 4 Histogram of water contents in melt inclusions vs. frequencydemonstrates similar distribution over time. The pumice clast from1996 ranges from 3.52 to 5.05 wt.% H2O. A pumice clast eruptedbetween 4 August and 21 October 1997 ranges from 2.10 to 5.39 wt.%H2O, while pumice erupted in August 1997 ranges from 2.82 to6.74 wt.% H2O. Water contents in pumice erupted in October 1997range from 3.33 to 4.68 wt.% H2O. Pumice erupted in July 2003 rangesfrom 1.19 to 3.96 wt.% H2O, and water contents in pumice eruptedMarch 2004 range from 2.92 to 5.02 wt.% H2O
Fig. 3 Histogram of CO2 contents in melt inclusions from this workand from Barclay et al. (1998)
687, Page 8 of 16 Bull Volcanol (2013) 75:687

consistent with the low solubility of CO2 compared to waterand chlorine.
Pressure and depth determinations
Although volatile solubility is strongly pressure dependent,it is also weakly dependent on temperature; hence, weconsider a range of temperatures determined for SHV mag-mas. Phase equilibrium studies place a minimum tempera-ture of 780 °C for the magmatic system due to the observedabsence of biotite in the crystallizing assemblage and amaximum temperature of 850 °C based on the stability ofamphibole at 130 MPa (Barclay et al. 1998; Couch et al.
2003a; Rutherford and Devine 2003). Mafic enclaves sug-gest the presence of a more mafic contribution and thus alocalized increase in temperature to ∼900 °C (Murphy et al.2000). Therefore, we calculate the effect of temperature onour pressure calculations at 780 °C, 850 °C, and 900 °Cusing the VolatileCalc program (Newman and Lowenstern2002). The results show that an increase in temperature of120 °C has a relatively small effect on pressures calculatedfrom measured volatile contents. For example, an increasein temperature from 780 °C to 900 °C, at H2O contents of∼3 wt.%, only increases the calculated pressure from 55 to66 MPa. At H2O contents of ∼7 wt.%, calculated pressureincreases from 231 to 251 MPa. The increase in pressure at
Fig. 5 Histograms of Clcontents in melt inclusions andmatrix glasses. a Histogram ofour measured Cl contents inmelt inclusions compared toprevious studies. Data fromDevine et al. (1998), Edmondset al. (2001), and Humphreys etal. (2009). b Histogram of Clcontents in matrix glasses fromEdmonds et al. (2002) andHumphreys et al. (2009) asdescribed in Fig. 2b
Bull Volcanol (2013) 75:687 Page 9 of 16, 687
greater temperatures is larger for higher H2O concentrations,but the overall effect is insignificant for our interpretations.Therefore, an intermediate temperature of 850 °C is used forfurther calculations.
The pressure dependence of H2O and CO2 solubility inrhyolitic melts is well established (e.g., Newman andLowenstern 2002; Liu et al. 2005), and the concentrationsof these volatiles in each melt inclusion can therefore beused to calculate the pressures of the magma at the time ofmelt inclusion entrapment (e.g., Wallace et al. 1999). Theseare minimum pressures due to potential loss of CO2 toshrinkage bubbles and loss of H2O through the plagioclasehost by diffusion or through microcracks. For the SHV, we
calculate the vapor saturation pressures using VolatileCalc(Newman and Lowenstern 2002). The measured range ofwater contents from 1.2 to 6.7 wt.% H2O corresponds toentrapment pressures of 12–251 MPa. The bulk of the watercontents from ∼2.8 to 5.4 wt.% H2O correspond to pressuresfrom ∼57 to 173 MPa. The minimum pressure of 12 MPacorresponds to a depth of 0.5 km, and the maximum pres-sure of 251 MPa corresponds to a depth of ∼10 km. Ourresults show that most of our melt inclusions (81 %) weretrapped between ∼2 and 7 km (57 to 173 MPa).
Geophysical data provide independent constraints on thelocation of the subsurface magma reservoir. Gardner andWhite (2002) estimate volcano-tectonic (VT) earthquake
Fig. 6 SiO2 (weightpercentage) vs. H2O (weightpercentage) shows possiblemagma ascent paths. The insetis modified from Blundy andCashman (2005). No obviouschange in water is observed as afunction of SiO2. We includedata from Barclay et al. (1998),Edmonds et al. (2001), Buckleyet al. (2006), and Devine et al.(1998)
Fig. 7 Melt inclusion H2O (weight percentage) vs. CO2 (parts permillion) contents determined by FTIR. Vapor saturation isobars for 100and 200 MPa at 850 °C and degassing curves were calculated usingVolatileCalc (Newman and Lowenstern 2002). The blue degassingcurve indicates the effect of a magma undergoing open-system andclosed-system degassing with no initial exsolved vapor. Solid black
line with arrow indicates the path of a magma undergoing degassing ata constant pressure. The best fit for the data reported in this study is thered line, which indicates the ascent path of a magma experiencingclosed-system degassing with ∼1 wt.% initial vapor. The solid greenline at the bottom represents melt inclusions with no CO2. Note thedifferent x–y-scales. Data from Barclay et al. (1998) included
687, Page 10 of 16 Bull Volcanol (2013) 75:687

depths from 0 to ∼5 km below sea level (b.s.l.; August toSeptember 1995). Aspinall et al. (1998) relocate hypocen-ters from 1995 to 1997, suggesting VT earthquake at depthsfrom 0 to ∼8 km b.s.l. Roman et al. (2008) used the samevelocity model as Aspinall et al. (1998) to pick VT earth-quakes from 1995 to 2007, but only considered VT earth-quakes with high quality locations. In their study, out of∼10,000 VT earthquakes considered, 1,430 events had wellconstrained locations at depths from 1 to ∼3 km b.s.l.
Using a fixed latitude, longitude, and radius, GlobalPositioning System geodetic data collected from October1995 to July 1996 approximate a spherical deflating Mogipoint source located at ∼6 km b.s.l. (Mattioli et al. 1998).Based on dilatometer data captured during the July 2003 domecollapse, Voight et al. (2006) suggest two possible reservoirscenarios: (1) a spherical pressure source at ∼5.1 km b.s.l., and(2) an ellipsoid-shaped pressure source ranging from ∼5.1 to5.3 km b.s.l. Elsworth et al. (2008) propose a mid-crustalreservoir at ∼12 km and a shallow reservoir at ∼6 km, whileVoight et al. (2010) favor a single reservoir of considerablevertical extent (6–14 km). A recent seismic tomographic studyby Paulatto et al. (2012) indicates that the shallow reservoir issituated between 5.5 and at least 7.5 km.
To summarize, the geophysical data indicate movementof magma from 1 to ∼8 km b.s.l. and storage of magma in ashallow reservoir at ∼5–8 km depth. The significant cluster-ing of trapped melt inclusions at our calculated depths of 2–7 km overlaps with seismic activity and correlates with theestimates of reservoir depth, suggesting that the melt inclu-sions were trapped in the volcanic conduit and the uppermagma reservoir with the reservoir top estimated at ∼5 km.
Hence, the vulcanian eruptions at Montserrat that wehave studied were driven by magma originating in the upperreservoir and lower conduit, and the melt inclusions show
that the magma had elevated initial H2O and Cl. The highdischarge rates associated with the vulcanian events allowedmagma at deeper levels to be rapidly transported to shallowconduit levels where it lost H2O and vesiculated. Due toformation of a transient magma plug at the top of the conduitduring repose periods between vulcanian eruptions, the ve-siculating magma became significantly overpressured andfragmented efficiently when this overpressure exceeded thestrength of the plug (Druitt et al. 2002; Spieler et al. 2004).
Models for magma ascent and degassing at SoufrièreHills volcano
In this section, we describe two models that can explain thevariable H2O contents, low CO2 and S, and high Cl contentspresented in this study. The premise for Model 1 is that themelt inclusions were originally trapped over a wide range ofdepths and preserve a record of pressures at the time ofentrapment (Fig. 9a). The premise for Model 2 is that themelt inclusions were trapped during crystal growth at deeperlevels, but experienced post-entrapment modificationthrough diffusive loss and/or re-equilibration of H2O in themelt inclusions with the surrounding matrix melt at shal-lower levels (Fig. 9b). The magma batch that transported thephenocrysts to the surface experienced stop–start decom-pression, facilitating the diffusive loss of H2O from the hostphenocryst to the matrix.
Model 1: melt inclusion volatile contents representconditions during crystal growth
We first explore a model in which the melt inclusions werenot affected by any post-entrapment hydrogen loss. Thus,
Fig. 8 H2O contents plottedagainst Cl concentrations formelt inclusions and matrixglasses. The melt inclusionsexhibit significantly largervariability for water comparedto chlorine. Matrix glassesgenerally show low water andchlorine. Melt inclusion datafrom this work and Humphreyset al. (2009), matrix glass datafrom Edmonds et al. (2002) andHumphreys et al. (2009) where“dome matrix glass” refers tomatrix glasses from lava domesand “scoria matrix glass” refersto matrix glasses fromscoriaceous pyroclastic flowdeposits
Bull Volcanol (2013) 75:687 Page 11 of 16, 687

their H2O contents are representative of conditions at thetime of entrapment such that the lower H2O contents weretrapped in the conduit at lower pressure, and the higher H2Ocontents were trapped in the upper magma reservoir athigher pressure. The H2O–CO2 solubility model supports amelt undergoing closed system degassing with ∼1 wt.% ofexsolved vapor (Fig. 7). This suggests that crystals trapped
melt inclusions during growth in both the upper part of themagma reservoir and the lower parts of the conduit system.
Couch et al. (2003a) ran a series of decompressionexperiments on materials analogous to SHV bulk composi-tions and determined crystal growth during decompressionto be on the order of 10−8mms−1 at 125 MPa. At this rate, aplagioclase phenocryst 600 μm in length would take∼2 years to form, or a growth rim of 50 μm (the minimumwe observe) would take ∼60 days to form. Thus, the mini-mum amount of time the phenocrysts need to form and trapa melt inclusion in the conduit/upper reservoir would be onthe order of tens of days. Druitt et al. (2002) have calculatedthat each vulcanian eruption ejected, on average, a magmavolume of ∼3×10⁵m3. Applying their conduit radius of13.7 m and a depth to the reservoir of 5 km, we calculatea total volume of the conduit on the order of 3×10⁶m3.Hence, ten vulcanian eruptions are required on average totransport a batch of magma from the top of the reservoir tothe surface. Given a mean repose time of 10 h betweenvulcanian eruptions (Druitt et al. 2002), the residence timeof magma in the conduit is about 100 h or 4 days. Thus,there is insufficient time for plagioclase phenocrysts to growand entrap melt inclusions in the conduit system.
There is abundant evidence that the SHV is a long-livedmagmatic system possibly formed by diapirs of andesiterising through the crust and amalgamating (Annen 2009;Annen et al. 2006; Bachmann and Bergantz 2008; Murphyet al. 2000). SHV magmas erupted over the last 18 ka havesimilar mineral chemistry and a small range in bulk compo-sition (Murphy et al. 2000). Mass balance calculations be-tween phenocryst compositions and glass compositionsindicate a high crystallinity prior to eruption and a reservoirtemperature well below the experimentally determinedwater-saturated liquidus. Based on these observations,Murphy et al. (2000) suggest that the magma has experi-enced a protracted cooling history, which together with thesimilar mineral and bulk chemistry suggests that the erup-tions are tapping the same magma body. Harford et al.(2002) found xenocrystic plagioclase with apparent ages ofat least 400 ka from 40Ar/39Ar analysis of phenocryst sepa-rates. Zellmer et al. (2003) examined Sr and Ba profiles inplagioclase and observed complex zoning patterns, withrelatively flat Sr zonation. They conclude that crystalgrowth was relatively fast and occurred early followed byresidence times of ∼15 to ∼320 years at magmatic temper-atures of ∼850 °C. Therefore, the phenocrysts which com-prise the andesitic pumice are likely a mixture of newcrystals and old crystals from a partially to fully solidifiedroof rock/roof mush that became incorporated into the cur-rent batches of magma. This scenario can explain an abun-dance of plagioclase-hosted melt inclusions recordingpressures indicative of upper reservoir conditions.However, it cannot explain the lower-pressure melt
Fig. 9 Two models which explain the variation in volatile contents atSHV. a Volatiles are trapped during crystal growth and representconditions at the time of entrapment. b Melt inclusions undergo diffu-sive re-equilibration on ascent to the surface. Arrows represent diffu-sion of water from the melt inclusion to the matrix
687, Page 12 of 16 Bull Volcanol (2013) 75:687

inclusions from the conduit environment, as this materiallikely would have been erupted and not recycled within themagma reservoir.
In summary, this model can explain the higher watercontents in melt inclusions by a process of entrapment inthe upper part of the reservoir. However, it is not consistentwith the melt inclusions with lower H2O forming at shal-lower levels in the conduit because (a) there is insufficienttime for plagioclase crystallization and (b) older crystalscontaining low-H2O melt inclusions would have been erup-ted and not recycled nor preserved in the conduit.
Model 2: melt inclusions re-equilibrated with the surroundingliquid during storage in the lower conduit
In order for diffusive re-equilibration to take place, there mustbe a change in the chemical potential of water surrounding thephenocryst host (Qin et al. 1992). This could occur by ascentand degassing of magma or by the transport of phenocrysts toa different region of the magma reservoir through convectionor gravitational settling. We have established that most meltinclusions have between ∼2.8 and 5.4 wt.% H2O, and hencereflect a lower conduit to upper reservoir environment. Giventhe vulcanian eruption style, it seems plausible that phenoc-rysts formed in the magma reservoir experienced one or moresudden decreases of pressure as magma moved from thereservoir into the conduit system and stalled.
Decompression styles vary and are best quantified bynumber density and texture of groundmass crystals (e.g.,Nakada and Motomura 1999). Single-step decompression isa single decompression event that brings magma from aninitial pressure to a final pressure in one step, such as duringa plinian eruption. Multi-step decompression starts with aninitial pressure, bringing the magma to a final pressure inmultiple increments of decompression. During slower de-compression, tiny crystals <100 μm in length (microlites)develop in the groundmass of the pumice as magma ascendsfrom the magma reservoir to the surface (Cashman 1992).Couch et al. (2003b) used an analogue composition equiv-alent to the groundmass composition of the Soufrière Hillslava to determine the effects of degassing-induced crystalli-zation at pressures ranging from 130 to 50 MPa. The resultsshow that large changes in the degree of undercooling (ΔT),such as occur during single-step decompression, result innucleation-dominated crystallization, whereas smallerchanges in ΔT, such as occur during multi-step decompres-sion, result in growth-dominated crystallization. For largerΔT, microlite morphology will vary from tabular throughswallowtail to dendritic (Hammer and Rutherford 2002).Our pumice samples have low percentages of microlites;those observed are tabular in shape, consistent with multi-step decompression (Clarke et al. 2007; Couch et al. 2003b;Brugger and Hammer 2010).
During episodes of vulcanian activity as observed at theSHV, the ascending magma undergoes multiple decompres-sion events on its way to the surface. During each explosion,the non-erupted magma undergoes decompression approxi-mately equal to the explosion magnitude (∼24 MPa) (Clarkeet al. 2007; Jaquet et al. 2006; Couch et al. 2003b). Jaquet etal. (2006) applied a statistical study of explosion time seriesdata from the 22 September to 21 October 1997 series andsuggest that each batch of magma experienced six to eightepisodic decompressions recording 60–87 h of eruptivehistory. This would be equal to an overall decompressionof 144–192 MPa. The repose interval between explosionsfor the 4–13 August 1997 series varied from ∼10 to 63 h(Druitt et al. 2002). A plagioclase-hosted melt inclusionrising from deeper regions in the magma reservoir during aseries of vulcanian explosions (such as the 1997 series)would have time to undergo diffusive loss of hydrogenand, if loss rates were comparable to those from quartz-hosted inclusions based on experimental data, lose as muchas 2 wt.% water in 48 h (Severs et al. 2007). The significantcluster of H2O concentrations corresponding to the lowerconduit and upper magma reservoir suggests that melt inclu-sions that were trapped at reservoir pressures underwentdiffusive re-equilibration at shallower depths.
In this model, we argue that the re-equilibration of watertakes place during the repose intervals between the vulcani-an explosions (Fig. 9b). We suggest that the melt inclusionsare first trapped at deeper levels at higher pressures; uponascent, water diffusively re-equilibrates with the surround-ing matrix melt as the magma moves towards the surface.The amount of re-equilibration will depend partly on erup-tive dynamics. For example, a series of large vulcanianeruptions with short quiescent intervals between them wouldrapidly transport magma from comparatively deep levels tothe surface, minimizing the time available for diffusive re-equilibration in shallower environments. Hence, water con-tents in melt inclusions would be correspondingly high.Conversely, smaller eruptions with longer quiescent intervalswould extract magma more slowly, allowing for a greateramount of re-equilibration to occur between melt inclusionsand host magma at shallow levels. The result would be low-ered H2O contents in the melt inclusions.
To conclude, multi-step batch decompression during vul-canian explosions provides a reasonable mechanism for thediffusive loss of hydrogen from the melt inclusions as theyattempt to re-equilibrate with the surrounding melt. Thismodel explains the same range of H2O contents observedfrom each series of vulcanian eruptions. A population ofinclusions initially represents the range of pressures in thereservoir with subsequent diffusive re-equilibration as themagma moves incrementally upward. The re-equilibrationprocess results in a new range of pressures which overlapwith the top of the reservoir but is shifted upwards to also
Bull Volcanol (2013) 75:687 Page 13 of 16, 687
overlap with the lower conduit. An alternative explanation isthat the inclusions with higher H2O experience less hydro-gen loss, possibly because they were larger inclusions.
Conclusions
1. Plagioclase- and quartz-hosted melt inclusions sampledfrom pumice erupted during vulcanian explosions from1996 to 2004 are rhyolitic in composition (72.8 to78.7 wt.% SiO2). Dissolved H2O contents range from1.2 to 6.7 wt.%. Measured CO2 concentrations are<80 ppm in four melt inclusions and below detectionin all others. Chlorine contents range from 2,520 to3,270 ppm Cl, clustering at ∼3,000 ppm.
2. The significant cluster of data from 2.8 to 5.4 wt.% H2Oindicates pressures between 57 and 173 MPa and depthsof ∼2–7 km, which correspond to the lower conduitregion and upper magma reservoir based on geophysicaldata.
3. The variability in H2O contents could result from de-compression crystallization of a vapor-saturated magmaundergoing closed system degassing with up to ∼1 wt.%exsolved vapor. However, it is difficult to explain thelower water contents fully with this model, as the time-scale for crystal growth and melt inclusion entrapmentis longer than the magma residence time in the conduit.
4. Alternatively, the variability in H2O contents can beexplained by multi-step decompression, in which abatch of magma undergoes a series of decompressionsteps, resulting in hydrogen loss by diffusion from themelt inclusions to the surrounding melt. The Cl contentsrecord the initial entrapment of the melt inclusions,whereas the variable H2O data record the conditions asmelt inclusions attempt to re-equilibrate with the sur-rounding matrix melt. The melt inclusion H2O contentstherefore reflect stalling in the lower conduit and uppermagma reservoir, rather than initial entrapment atdeeper levels in the reservoir. We favor this model, asit can explain the range of water contents observed inthe melt inclusions, including high, intermediate, andlow values.
5. Vulcanian explosions may provide information regard-ing the path of magma ascent rather than the initialmagma conditions at the time of eruption.
Acknowledgements We would like to acknowledge the staff at theMontserrat Volcano Observatory for their assistance in sample collec-tion and continued hospitality. The students in the FTIR lab at theUniversity of Oregon, in particular Julie Roberge and Emily Johnson,are thanked for instructing CPM how to prepare and analyze meltinclusions. We are grateful to Ilya Bindeman for sharing his techniquein mounting melt inclusion wafers for the electron microprobe. JakeLowenstern and Roman Botcharnikov provided extremely useful and
insightful reviews which focused the paper and corrected some mis-conceptions. Mike Clynne as editor gave us useful guidance in ourrevision. CPM was supported by student grants from the GeologicalSociety of America and the Centre de Recherche en Géochimie et enGéodynamique (GEOTOP). JS acknowledges support from the NaturalSciences and Engineering Research Council of Canada.
References
Annen C (2009) From plutons to magma chambers: thermal constraintson the accumulation of eruptible silicic magma in the upper crust.Earth Planet Sci Lett 284:409–416
Annen C, Blundy JD, Sparks RSJ (2006) The genesis of intermediateand silicic magmas in deep crustal hot zones. J Petrol 47:505–539
Aspinall WP, Miller AD, Lynch L, Stewart RC, White RA, Power JA(1998) Soufrière Hills eruption, Montserrat 1995–1997: volcanicearthquake locations and fault plane solutions. Geophys Res Lett25:3397–3400
Bachmann O, Bergantz GW (2008) Rhyolites and their source mushesacross tectonic settings. J Petrol 49:2277–2285
Barclay J, Rutherford MJ, Carroll MR, Murphy MD, Devine JD,Gardner JE, Sparks RSJ (1998) Experimental phase equilibriaconstraints on pre-eruptive storage conditions of the SoufrièreHills magma. Geophys Res Lett 25:3437–3440
Behrens H, Ohlhorst S, Holtz F, Champenois M (2004) CO2 solubilityin dacitic melts equilibrated with H2O-CO2 fluids: implicationsfor modeling the solubility of CO2 in silicic melts. GeochimCosmochim Acta 68:4687–4703
Blundy J, Cashman K (2005) Rapid decompression-driven crystalliza-tion recorded by melt inclusions from Mount St. Helens volcano.Geology 33:793–796
Brugger CR, Hammer JA (2010) Crystallization kinetics in continuousdecompression experiments: implications for interpreting naturalmagma ascent processes. J Petrol 51:1941–1965
Buckley VJE, Sparks RSJ, Wood BJ (2006) Hornblende dehydrationreactions during magma ascent at Soufrière Hills volcano,Montserrat. Contrib Mineral Petrol 151:121–140
Cashman KV (1992) Groundmass crystallization of Mount St Helensdacite, 1980–1986: a tool for interpreting shallow magmatic pro-cesses. Contrib Mineral Petrol 109:431–449
Clarke AB, Stephens S, Teasdale R, Sparks RSJ, Diller K (2007)Petrologic constraints on the decompression history of magmaprior to vulcanian explosions at the Soufrière Hills volcano,Montserrat. J Volcanol Geotherm Res 161:261–274
Couch S, Harford CL, Sparks RSJ, Carroll MR (2003a) Experimentalconstraints on the conditions of formation of highly calcic plagio-clase microlites at the Soufrière Hills volcano, Montserrat. J Petrol44:1455–1475
Couch S, Sparks RSJ, Carroll MR (2003b) The kinetics of degassing-induced crystallization at Soufrière Hills volcano, Montserrat. JPetrol 44:1477–1502
Danyushevsky LV, Sokolov S, Falloon TJ (2002) Melt inclusions inolivine phenocrysts: using diffusive re-equilibration to determinethe cooling history of a crystal, with implications for the origin ofolivine-phyric volcanic rocks. J Petrol 43:1651–1671
Devine JD, Gardner JE, Brack HP, Layne GD, Rutherford MJ (1995)Comparison of microanalytical methods for estimating H2O con-tents of silicic volcanic glasses. Am Mineral 80:319–328
Devine JD, Murphy MD, Rutherford MJ, Barclay J, Sparks RSJ,Carroll MR, Young SR, Gardner JE (1998) Petrologic evidencefor pre-eruptive pressure-temperature conditions and recentreheating of andesitic magma erupting at the Soufrière Hillsvolcano, Montserrat W.I. Geophys Res Lett 25:3669–3672
687, Page 14 of 16 Bull Volcanol (2013) 75:687

Druitt TH, Young SR, Baptie B, Bonadonna C, Calder ES, Clarke AB,Cole PD, Harford CL, Herd RA, Luckett R, Ryan G, Voight B(2002) Episodes of cyclic vulcanian explosive activity with fountaincollapse at Soufrière Hills volcano, Montserrat. In: Druitt TH,Kokelaar BP (eds) The eruption of Soufrière Hills volcano,Montserrat, from 1995 to 1999. Geol Soc LondonMem 21:281–306
Edmonds M, Pyle D, Oppenheimer C (2001) A model for degassing atthe Soufrière Hills volcano, Montserrat, West Indies, based ongeochemical data. Earth Planet Sci Lett 186:159–173
Edmonds M, Pyle D, Oppenheimer C (2002) HCl emissions atSoufrière Hills volcano, Montserrat, West Indies, during a secondphase of dome building: November 1999 to October 2000. BullVolcanol 64:21–30
EdmondsM, Herd RA, Strutt MH (2006) Tephra deposits associated witha large lava dome collapse, Soufrière Hills volcano, Montserrat, 12–15 July 2003. J Volcanol Geotherm Res 153:313–330
Eichelberger JC, Carrigan CR, Westrich HR, Price RH (1986) Non-explosive silicic volcanism. Nature 323:598–602
Elsworth D, Mattioli G, Taron J, Voight B, Herd R (2008) Implicationsof magma transfer between multiple reservoirs on eruption cy-cling. Science 322:246–248
Gardner CA, White RA (2002) Seismicity, gas emission and deforma-tion from 18 July to 25 September 1995 during the initial phreaticphase of the eruption of Soufrière Hills volcano, Montserrat. In:Druitt TH, Kokelaar BP (eds) The eruption of Soufrière Hillsvolcano, Montserrat, from 1995 to 1999. Geol Soc LondonMem 21:567–581
Hammer JE, Rutherford MJ (2002) An experimental study of thekinetics of decompression-induced crystallization in silicic melt.J Geophys Res 107:2021. doi:10.1029/2001JB000281
Harford CL, Pringle MS, Sparks RSJ, Young SR (2002) The volcanicevolution of Montserrat using 40Ar/39Ar geochronology. In: DruittTH, Kokelaar BP (eds) The eruption of Soufrière Hills volcano,Montserrat, from 1995 to 1999. Geol Soc London Mem 21:93–113
Herd RA, Edmonds M, Bass VA (2005) Catastrophic lava dome failureat Soufrière Hills volcano, Montserrat, 12–13 July 2003. JVolcanol Geotherm Res 148:234–252
Humphreys MCS, Edmonds M, Christopher T, Hards V (2009)Chlorine variations in the magma of Soufrière Hills volcano,Montserrat: insights from Cl in hornblende and melt inclusions.Geochim Cosmochim Acta 73:5693–5708
Humphreys MCS, Edmonds M, Christopher T, Hards V (2010) Magmahybridisation and diffusive exchange recorded in heterogeneousglasses from Soufrière Hills volcano, Montserrat. Geophys ResLett 37:L00E06. doi:10.1029/2009GL041926
Jaquet O, Sparks RSJ, Carniel R (2006) Magma memory recorded bystatistics of volcanic explosions at the Soufrière Hills volcano,Montserrat. In: Mader HM, Coles SG, Connor CB, Connor LJ(eds) Statistics in volcanology. IAVCEI Spec Pub 1:175–184
Jarosewich E, Nelen JA, Norberg JA (1980) Reference samples forelectron microprobe analysis. Geostand Newslett 4:43–47
Jaupart C, Allègre CJ (1991) Gas content, eruption rate and instabilitiesof eruption regime in silicic volcanoes. Earth Planet Sci Lett102:413–429
Leschik M, Heide G, Frischat GH, Behrens H, Wiedenbeck M, WagnerN, Heide K, Geissler H, Reinholz U (2004) Determination of H2Oand D2O contents in rhyolitic glasses. Eur J Glas Sci Technol45B:238–251
Liu Y, Zhang Y, Behrens H (2005) Solubility of H2O in rhyolitic meltsat low pressures and a new empirical model for mixed H2O-CO2
solubility in rhyolitic melts. J Volcanol Geotherm Res 143:219–235Lowenstern JB (1995) Applications of silicate-melt inclusions to the
study of magmatic volatiles. In: Thompson JFH (ed) Magmas, fluidand ore deposits. Mineral Assoc Can Short Course Handbook23:71–99
Mattioli GS, Dixon TH, Farina F, Howell E, Jansma PE, Smith AL(1998) GPS measurement of surface deformation aroundSoufrière Hills volcano, Montserrat from October 1995 to July1996. Geophys Res Lett 25:3417–3420
Melnik O, Sparks RSJ (2002) Modelling of conduit flow dynamicsduring explosive activity at Soufrière Hills volcano, Montserrat.In: Druitt TH, Kokelaar BP (eds) The eruption of the SoufrièreHills volcano, Montserrat, from 1995 to 1999. Geol Soc LondonMem 21:307–317
Metrich N, Wallace PJ (2008) Volatile abundances in basaltic magmasand their degassing paths tracked by melt inclusions. Rev MineralGeochem 69:363–402
Morrissey MM, Mastin LG (2000) Vulcanian eruptions. In: SigurdssonH, Houghton B, McNutt S, Rymer H, Stix J (eds) Encyclopedia ofvolcanoes. Academic, San Diego, pp 463–475
Murphy MD, Sparks RSJ, Barclay J, Carroll MR, Brewer TS (2000)Remobilization of andesite magma by intrusion of mafic magmaat the Soufrière Hills volcano, Montserrat, West Indies. J Petrol41:21–42
Nakada S, Motomura Y (1999) Petrology of the 1991–1995 eruption atUnzen: effusion pulsation and groundmass crystallization. JVolcanol Geotherm Res 89:173–196
Newman S, Lowenstern JB (2002) VolatileCalc: a silicate melt-H2O-CO2 solution model written in Visual Basic for Excel. ComputGeosci 28:597–604
Newman S, Stopler EM, Epstein S (1986) Measurements of water inrhyolitic glasses: calibration of an infrared spectroscopic tech-nique. Am Mineral 71:1527–1541
Newman S, Epstein S, Stolper E (1988) Water, carbon dioxide, andhydrogen isotopes in glasses from the ca. 1340 A.D. eruptionof the Mono Craters, California: constraints on degassingphenomena and initial volatile content. J Volcanol GeothermRes 35:75–96
Paulatto M, Annen C, Henstock TJ, Kiddle E, Minshull TA, SparksRSJ, Voight B (2012) Magma chamber properties from integratedseismic tomography and thermal modeling at Montserrat. GeochemGeophys Geosys 13:Q01014. doi:10.1029/2011GC003892
Qin Z, Lu F, Anderson ATJ (1992) Diffusive re-equilibration of meltand fluid inclusions. Am Mineral 77:565–576
Robertson R, Cole P, Sparks RSJ, Harford C, Lejeune A-M, McGuireWJ, Miller AD, Murphy MD, Norton G, Stevens NF, Young SR(1998) The explosive eruption of the Soufrière Hills volcano,Montserrat, West Indies, 17 September 1996. Geophys Res Lett25:3429–3432
Robertson REA, Aspinall WP, Herd R, Sparks RSJ, Young SR (2000)The 1995–1998 eruption of the Soufrière Hills volcano, Montserrat,WI. Phil Trans Royal Soc London 358A:1619–1637
Roman DC, DeAngelis S, Latchman JL, White R (2008) Patterns ofvolcanotectonic seismicity and stress during the ongoing eruptionof the Soufrière Hills volcano, Montserrat (1995–2007). JVolcanol Geotherm Res 173:230–244
Rutherford MJ, Devine JD (2003) Magmatic conditions and magmaascent as indicated by hornblende phase equilibria and reactionsin the 1995–2002 Soufrière Hills magma. J Petrol 44:1433–1453
Self S, Wilson L, Nairn IA (1979) Vulcanian eruption mechanisms.Nature 277:440–443
Severs MJ, Azbej T, Thomas JB, Mandeville CW, Bodnar RJ (2007)Experimental determination of H2O loss from melt inclusionsduring laboratory heating: evidence from Raman spectroscopy.Chem Geol 237:358–371
Signorelli S, Carroll MR (2001) Experimental constraints on the originof chlorine emissions at the Soufrière Hills volcano, Montserrat.Bull Volcanol 62:431–440
Skirius CM (1990) Pre-eruptive H2O and CO2 content of plinian andash flow Bishop Tuff magma. Ph.D. thesis. University ofChicago, Chicago
Bull Volcanol (2013) 75:687 Page 15 of 16, 687
Spieler O, Dingwell DB, Scheu B, Taddeucci J, Kennedy B, KueppersU (2004) The fragmentation threshold of pyroclastic rocks. EarthPlanet Sci Lett 226:139–148
Stix J, Gauthier G, Ludden JN (1995) A critical look at quantitativelaser-ablation ICP-MS analysis of natural and synthetic glasses.Can Mineral 33:435–444
Voight B, Hoblitt RP, Clarke A, Lockhart AB, Miller AD, Lynch L,McMahon J (1998) Remarkable cyclic ground deformation mon-itored in real-time on Montserrat and its use in eruption forecast-ing. Geophys Res Lett 25:3405–3408
Voight B, Sparks RSJ, Miller AD, Stewart RC, Hoblitt RP, Clarke A,Ewart J, Aspinall WP, Baptie B, Calder ES, Cole P, Druitt TH,Harford C, Herd RA, Jackson P, Lejeune A-M, Lockhart AB,Loughlin SC, Luckett R, Lynch L, Norton GE, Robertson R,Watson IM, Watts R, Young SR (1999) Magma flow instabilityand cyclic activity at Soufrière Hills volcano, Montserrat, BritishWest Indies. Science 283:1138–1142
Voight B, Linde AT, Sacks S, Mattioli GS, Sparks RSJ, Elsworth D,Hidayat D, Malin PE, Shalev E, Widiwijayanti C, Young SR,Bass V, Clarke A, Dunkley P, Johnston W, McWhorter N,
Neuberg J, Williams P (2006) Unprecedented pressure increasein deep magma reservoir triggered by lava-dome collapse.Geophys Res Lett 33:L03312. doi:10.1029/2005GL024870
Voight B, Widiwijayanti C, Mattioli G, Elsworth D, Hidayat D, StruttM (2010) Magma-sponge hypothesis and stratovolcanoes: casefor a compressible reservoir and quasi-steady deep influx atSoufrière Hills volcano, Montserrat. Geophys Res Lett 37:L00E05. doi:10.1029/2009GL041732
Wallace PJ, Anderson AT, Davis AM (1999) Gradients in H2O, CO2
and exsolved gas in a large-volume silicic magma system: inter-preting the record preserved in melt inclusions from the BishopTuff. J Geophys Res 104:20097–20122
Young SR, Sparks R, Aspinall WP, Lynch L, Miller AD, Robertson R,Shepherd JB (1998) Overview of the eruption of the Soufrière Hillsvolcano, 18 July 1995 to December 1997. Geophys Res Lett25:3389–3392
Zellmer GF, Sparks RSJ, Hawkesworth CJ, Wiedenbeck M (2003)Magma emplacement and remobilization timescales beneathMontserrat: insights from Sr and Ba zonation in plagioclasephenocrysts. J Petrol 44:1413–1431
687, Page 16 of 16 Bull Volcanol (2013) 75:687