Rheological properties of magma from the 1538 eruption of Monte Nuovo (Phlegrean Fields, Italy): An...
14
Rheological properties of magma from the 1538 eruption of Monte Nuovo (Phlegrean Fields, Italy): An experimental study Luca Caricchi a, ⁎, Daniele Giordano b , Luigi Burlini a , Peter Ulmer a , Claudia Romano b a Department of Earth Sciences, ETH Zurich, Clausiusstrasse 25, CH-8092, Zurich, Switzerland b Dipartimento di Scienze Geologiche, università degli studi di Roma Tre, Largo San Leonardo Murialdo 1, 00146 Roma, Italy ABSTRACT ARTICLE INFO Article history: Received 18 December 2007 Received in revised form 22 May 2008 Accepted 18 June 2008 Keywords: Magma rheology Shear thinning Shear weakening Eruption dynamics The rheology of natural, partially crystallized samples from Monte Nuovo (1538 AD) eruption have been investigated using a high temperature, high pressure internally heated pressure vessel. Within the temperature interval of investigation the samples exhibited Newtonian rheology at deformation strain rates up to 10 − 4 s − 1 . At higher strain rates a decrease of viscosity with increasing strain rate (shear thinning), eventually terminating in a sudden viscosity drop (stress weakening), was observed. Stress weakening occurred at higher applied strain rates and stresses with increasing temperature. The microstructural analyses of the samples revealed that stress weakening resulted from strain localization, which occurred in brittle and viscous regimes at the lowest and highest temperatures investigated respectively. The different rheological behaviors of the investigated material is likely responsible for the changes in the dynamics of magma ascent within the volcanic conduit during the eruption of Monte Nuovo volcano. We infer that the occurrence of syn-eruptive decompression driven crystallization, observed in previous studies, induced strong variations in the rheological properties of magma, which in turn was responsible for the changes of eruptive style observed during the Monte Nuovo eruption. © 2008 Elsevier B.V. All rights reserved. 1. Introduction This study targets the investigation of the rheological properties of the trachytic magmas of the 1538 AD eruption of Monte Nuovo in the Phlegrean Fields. This event was characterized by two eruption phases with contrasting eruptive styles: a first stage of phreatomagmatic activity that produced a tuff cone, followed by a second, explosive phase that deposited Strombolian-type tephra on top of the tuff cone (DiVito et al., 1987; D'Oriano et al., 2005; Piochi et al., 2005). The second phase was distinctly more magmatic and despite similar bulk chemistry of the products, the textures of the scoria and the crystal contents (phenocrysts+microlites) were more variable, with crystal- linity reaching in some case up to 100 vol.% (D'Oriano et al., 2005). A detailed description of the eruption dynamics and chronology can be found in Piochi et al. (2005), D'Oriano et al. (2005) and references therein. The different crystallinities of the products most probably reflect changes in the conduit flow dynamics, which were in turn responsible for significant variations of the viscosity of the rising magma. Magma mixture viscosity mainly depends on the chemical composition of the residual liquid phase and the content of dissolved volatiles (e.g., H 2 O, CO 2 ), the temperature, and the bubble and crystal contents (e.g. Llewellin et al., 2002; Giordano et al., 2004; Caricchi et al., 2007). Since magma rheology exerts a strong control on the eruptive dynamics (Melnik and Sparks, 1999; Koyaguchi and Mitani, 2005; Melnik et al., 2005; Diller et al., 2006; Caricchi et al., 2007; Gonnermann and Manga, 2007), the lack of understanding of the rheological behavior of magmatic suspensions during the ascent inside the volcanic conduit seriously limits our ability to forecast eruptive scenarios. In densely populated regions such as the Phlegrean Fields area, where hazard assessment is a primary concern, the accurate characterization of the parameters governing eruption dynamics, above all magma rheology, is of critical importance to implement numerical simulations aiming to promote civil protection tasks (Piochi et al., 2008). Previous studies focused on the rheological characterization of crystal-bearing magmas (Lejeune and Richet, 1995; Caricchi et al., 2007) containing almost spherical particles. Yet it has been demon- strated that the rheological behavior of two-phase magmatic suspen- sions additionally depends on crystal shape (Saar et al., 2001) and crystal size distribution (Chong et al., 1971). Since the volcanic products of the Monte Nuovo eruption contain a large majority of elongated crystals with a relatively wide variety of crystal sizes (Fig. 1), the rheology of this material is likely to be different with respect to the behavior predicted by models currently present in the literature. In order to characterize the rheology of partially crystallized trachytic magmas characteristic of the second stage of activity of the 1538 AD Monte Nuovo eruption, we performed a series of controlled Chemical Geology 256 (2008) 158–171 ⁎ Corresponding author. Tel.: +41 44 63 27 824; fax: +41 44 63 21 636. E-mail addresses: [email protected] (L. Caricchi), [email protected] (D. Giordano), [email protected] (L. Burlini), [email protected] (P. Ulmer), [email protected] (C. Romano). 0009-2541/$ – see front matter © 2008 Elsevier B.V. All rights reserved. doi:10.1016/j.chemgeo.2008.06.035 Contents lists available at ScienceDirect Chemical Geology journal homepage: www.elsevier.com/locate/chemgeo
-
Upload
independent -
Category
Documents
-
view
0 -
download
0
Transcript of Rheological properties of magma from the 1538 eruption of Monte Nuovo (Phlegrean Fields, Italy): An...

Chemical Geology 256 (2008) 158–171
Contents lists available at ScienceDirect
Chemical Geology
j ourna l homepage: www.e lsev ie r.com/ locate /chemgeo
Rheological properties of magma from the 1538 eruption of Monte Nuovo (PhlegreanFields, Italy): An experimental study
Luca Caricchi a,⁎, Daniele Giordano b, Luigi Burlini a, Peter Ulmer a, Claudia Romano b
a Department of Earth Sciences, ETH Zurich, Clausiusstrasse 25, CH-8092, Zurich, Switzerlandb Dipartimento di Scienze Geologiche, università degli studi di Roma Tre, Largo San Leonardo Murialdo 1, 00146 Roma, Italy
⁎ Corresponding author. Tel.: +41 44 63 27 824; fax: +E-mail addresses: [email protected] (L. Cari
(D. Giordano), [email protected] (L. Burlini), pe(P. Ulmer), [email protected] (C. Romano).
0009-2541/$ – see front matter © 2008 Elsevier B.V. Adoi:10.1016/j.chemgeo.2008.06.035
A B S T R A C T
A R T I C L E I N F OArticle history:
The rheology of natural, pa Received 18 December 2007Received in revised form 22 May 2008Accepted 18 June 2008Keywords:Magma rheologyShear thinningShear weakeningEruption dynamics
rtially crystallized samples from Monte Nuovo (1538 AD) eruption have beeninvestigated using a high temperature, high pressure internally heated pressure vessel. Within thetemperature interval of investigation the samples exhibited Newtonian rheology at deformation strain ratesup to 10−4 s−1. At higher strain rates a decrease of viscosity with increasing strain rate (shear thinning),eventually terminating in a sudden viscosity drop (stress weakening), was observed. Stress weakeningoccurred at higher applied strain rates and stresses with increasing temperature. The microstructuralanalyses of the samples revealed that stress weakening resulted from strain localization, which occurred inbrittle and viscous regimes at the lowest and highest temperatures investigated respectively. The differentrheological behaviors of the investigated material is likely responsible for the changes in the dynamics ofmagma ascent within the volcanic conduit during the eruption of Monte Nuovo volcano. We infer that theoccurrence of syn-eruptive decompression driven crystallization, observed in previous studies, inducedstrong variations in the rheological properties of magma, which in turn was responsible for the changes oferuptive style observed during the Monte Nuovo eruption.
© 2008 Elsevier B.V. All rights reserved.
1. Introduction
This study targets the investigation of the rheological properties ofthe trachytic magmas of the 1538 AD eruption of Monte Nuovo in thePhlegrean Fields. This event was characterized by two eruption phaseswith contrasting eruptive styles: a first stage of phreatomagmaticactivity that produced a tuff cone, followed by a second, explosivephase that deposited Strombolian-type tephra on top of the tuff cone(DiVito et al., 1987; D'Oriano et al., 2005; Piochi et al., 2005). Thesecond phase was distinctly more magmatic and despite similar bulkchemistry of the products, the textures of the scoria and the crystalcontents (phenocrysts+microlites) were more variable, with crystal-linity reaching in some case up to 100 vol.% (D'Oriano et al., 2005). Adetailed description of the eruption dynamics and chronology can befound in Piochi et al. (2005), D'Oriano et al. (2005) and referencestherein. The different crystallinities of the products most probablyreflect changes in the conduit flow dynamics, which were in turnresponsible for significant variations of the viscosity of the risingmagma. Magma mixture viscosity mainly depends on the chemicalcomposition of the residual liquid phase and the content of dissolvedvolatiles (e.g., H2O, CO2), the temperature, and the bubble and crystal
41 44 63 21 636.cchi), [email protected]@erdw.ethz.ch
ll rights reserved.
contents (e.g. Llewellin et al., 2002; Giordano et al., 2004; Caricchiet al., 2007). Since magma rheology exerts a strong control on theeruptive dynamics (Melnik and Sparks, 1999; Koyaguchi and Mitani,2005; Melnik et al., 2005; Diller et al., 2006; Caricchi et al., 2007;Gonnermann and Manga, 2007), the lack of understanding of therheological behavior of magmatic suspensions during the ascentinside the volcanic conduit seriously limits our ability to forecasteruptive scenarios. In densely populated regions such as the PhlegreanFields area, where hazard assessment is a primary concern, theaccurate characterization of the parameters governing eruptiondynamics, above all magma rheology, is of critical importance toimplement numerical simulations aiming to promote civil protectiontasks (Piochi et al., 2008).
Previous studies focused on the rheological characterization ofcrystal-bearing magmas (Lejeune and Richet, 1995; Caricchi et al.,2007) containing almost spherical particles. Yet it has been demon-strated that the rheological behavior of two-phase magmatic suspen-sions additionally depends on crystal shape (Saar et al., 2001) andcrystal size distribution (Chong et al., 1971). Since the volcanicproducts of the Monte Nuovo eruption contain a large majority ofelongated crystals with a relatively wide variety of crystal sizes (Fig.1),the rheology of this material is likely to be different with respect to thebehavior predicted by models currently present in the literature. Inorder to characterize the rheology of partially crystallized trachyticmagmas characteristic of the second stage of activity of the 1538 ADMonte Nuovo eruption, we performed a series of controlled
Fig. 1. Characteristic X-ray distribution maps of experimental run product PO729; brighter areas represent higher concentrations of the respective elements. a) Calcium Kα X-raydistribution map; b) iron Kα X-ray distribution map; c) superposition of calcium and iron Kα X-ray distribution maps allowing identification of crystals and glassy matrixrespectively; d) binary, black and white image of the calcium and iron Kα X-ray distribution maps utilized for image analysis.
159L. Caricchi et al. / Chemical Geology 256 (2008) 158–171
deformation rate experiments using a Paterson-type deformationapparatus to investigate the rheological response of (vesicle-free)cylinders of natural samples.
2. Sample collection and characterization
A detailed description of the deposits can be found in previousstudies (D'Oriano et al., 2005; Piochi et al., 2005). Scoriaceousproducts of 10 to 50 cm in diameter were collected from the so calledUpper Member (UM; D'Oriano et al., 2005), distinctive for the secondstage of activity of the 1538 AD Monte Nuovo eruption. Sample colorvaries from light grey to black depending on textural features. Greyscorias are less porous and frequently angular in shape (Monte NuovoDense; sample MND), whereas the black scorias contain roundedvesicles and exhibit higher vesicularity values (UM2, UM2-1, UM2-2,UM2-3, UM4; Piochi et al., 2005; D'Oriano et al., 2005).
2.1. Density measurements
Sample cores of 22 mm diameter and 20–30 mm in lengths weredrilled from samples collected in the field. The faces of the cylinderswere parallelized by grinding to perform accurate geometricalmeasurements of the sample volumes. Open porosity was computed
by taking the difference between the calculated volume of thecylindrical samples and the volume measured for the same sampleusing a helium picnometer. The density was quantified from theweight of the sample and the volume measured by the heliumpicnometer and amounted for all analyzed specimens to 2.55±0.02 gcm−3. The experimental investigations were conducted on five coreswith a limited variation in open porosity ranging between 45 and 46%(UM2-1, UM2-2, UM2-3, UM4) and on one core exhibiting a lowerporosity of 40% (MND).
2.2. Chemistry of mineral phases and glassy matrix
The determination of the bulk and mineral chemical compositionsof the samples UM2 were performed with a JEOL-JXA-8200 electronmicroprobe using beam conditions of 15 kV acceleration voltage and20 and 5 nA beam current for minerals and glasses respectively. Theglassy matrix of the partially crystallized samples (UM2) was analyzedwith variable beam diameters ranging between 10 and 20 μmdepending on the size of the interstitial glass pockets. The bulkcomposition of the sample was determined by analyzing a glass thatwas prepared by melting of the collected scoria in a Pt80Rh20 crucibleat a temperature of 1600 °C and room pressure. Stirring of the moltenspecimen ensured bubble removal. The bulk and matrix glass
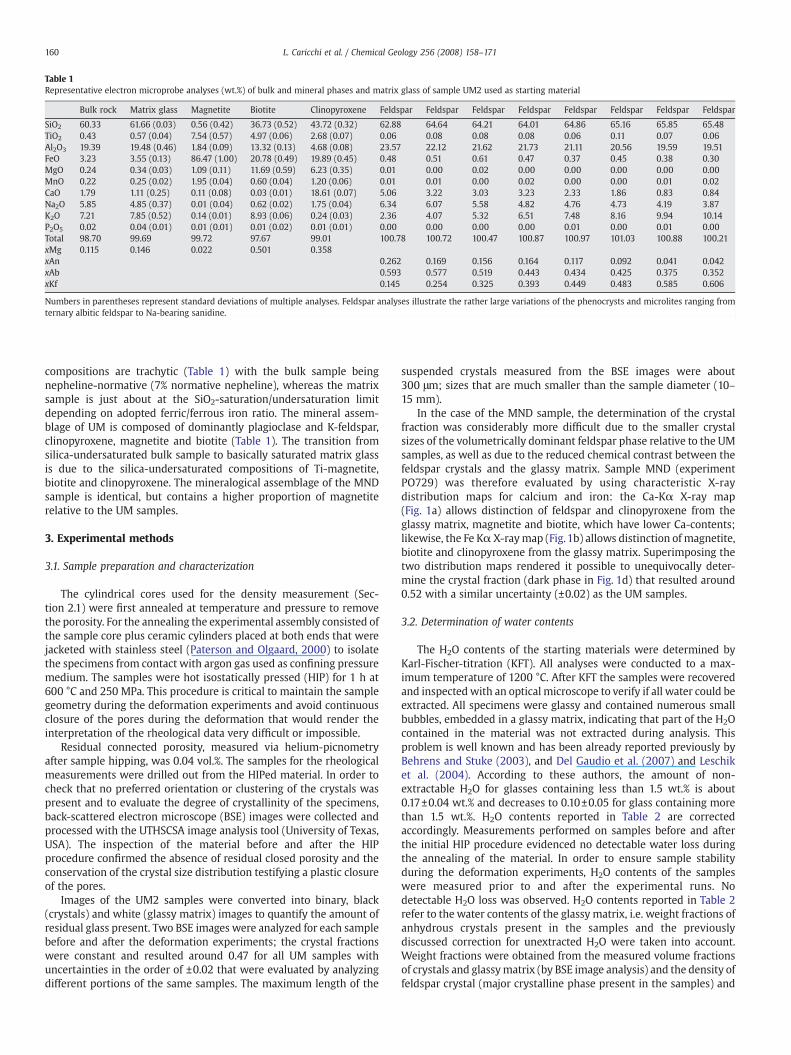
Table 1Representative electron microprobe analyses (wt.%) of bulk and mineral phases and matrix glass of sample UM2 used as starting material
Bulk rock Matrix glass Magnetite Biotite Clinopyroxene Feldspar Feldspar Feldspar Feldspar Feldspar Feldspar Feldspar Feldspar
SiO2 60.33 61.66 (0.03) 0.56 (0.42) 36.73 (0.52) 43.72 (0.32) 62.88 64.64 64.21 64.01 64.86 65.16 65.85 65.48TiO2 0.43 0.57 (0.04) 7.54 (0.57) 4.97 (0.06) 2.68 (0.07) 0.06 0.08 0.08 0.08 0.06 0.11 0.07 0.06Al2O3 19.39 19.48 (0.46) 1.84 (0.09) 13.32 (0.13) 4.68 (0.08) 23.57 22.12 21.62 21.73 21.11 20.56 19.59 19.51FeO 3.23 3.55 (0.13) 86.47 (1.00) 20.78 (0.49) 19.89 (0.45) 0.48 0.51 0.61 0.47 0.37 0.45 0.38 0.30MgO 0.24 0.34 (0.03) 1.09 (0.11) 11.69 (0.59) 6.23 (0.35) 0.01 0.00 0.02 0.00 0.00 0.00 0.00 0.00MnO 0.22 0.25 (0.02) 1.95 (0.04) 0.60 (0.04) 1.20 (0.06) 0.01 0.01 0.00 0.02 0.00 0.00 0.01 0.02CaO 1.79 1.11 (0.25) 0.11 (0.08) 0.03 (0.01) 18.61 (0.07) 5.06 3.22 3.03 3.23 2.33 1.86 0.83 0.84Na2O 5.85 4.85 (0.37) 0.01 (0.04) 0.62 (0.02) 1.75 (0.04) 6.34 6.07 5.58 4.82 4.76 4.73 4.19 3.87K2O 7.21 7.85 (0.52) 0.14 (0.01) 8.93 (0.06) 0.24 (0.03) 2.36 4.07 5.32 6.51 7.48 8.16 9.94 10.14P2O5 0.02 0.04 (0.01) 0.01 (0.01) 0.01 (0.02) 0.01 (0.01) 0.00 0.00 0.00 0.00 0.01 0.00 0.01 0.00Total 98.70 99.69 99.72 97.67 99.01 100.78 100.72 100.47 100.87 100.97 101.03 100.88 100.21xMg 0.115 0.146 0.022 0.501 0.358xAn 0.262 0.169 0.156 0.164 0.117 0.092 0.041 0.042xAb 0.593 0.577 0.519 0.443 0.434 0.425 0.375 0.352xKf 0.145 0.254 0.325 0.393 0.449 0.483 0.585 0.606
Numbers in parentheses represent standard deviations of multiple analyses. Feldspar analyses illustrate the rather large variations of the phenocrysts and microlites ranging fromternary albitic feldspar to Na-bearing sanidine.
160 L. Caricchi et al. / Chemical Geology 256 (2008) 158–171
compositions are trachytic (Table 1) with the bulk sample beingnepheline-normative (7% normative nepheline), whereas the matrixsample is just about at the SiO2-saturation/undersaturation limitdepending on adopted ferric/ferrous iron ratio. The mineral assem-blage of UM is composed of dominantly plagioclase and K-feldspar,clinopyroxene, magnetite and biotite (Table 1). The transition fromsilica-undersaturated bulk sample to basically saturated matrix glassis due to the silica-undersaturated compositions of Ti-magnetite,biotite and clinopyroxene. The mineralogical assemblage of the MNDsample is identical, but contains a higher proportion of magnetiterelative to the UM samples.
3. Experimental methods
3.1. Sample preparation and characterization
The cylindrical cores used for the density measurement (Sec-tion 2.1) were first annealed at temperature and pressure to removethe porosity. For the annealing the experimental assembly consisted ofthe sample core plus ceramic cylinders placed at both ends that werejacketed with stainless steel (Paterson and Olgaard, 2000) to isolatethe specimens from contact with argon gas used as confining pressuremedium. The samples were hot isostatically pressed (HIP) for 1 h at600 °C and 250 MPa. This procedure is critical to maintain the samplegeometry during the deformation experiments and avoid continuousclosure of the pores during the deformation that would render theinterpretation of the rheological data very difficult or impossible.
Residual connected porosity, measured via helium-picnometryafter sample hipping, was 0.04 vol.%. The samples for the rheologicalmeasurements were drilled out from the HIPed material. In order tocheck that no preferred orientation or clustering of the crystals waspresent and to evaluate the degree of crystallinity of the specimens,back-scattered electron microscope (BSE) images were collected andprocessed with the UTHSCSA image analysis tool (University of Texas,USA). The inspection of the material before and after the HIPprocedure confirmed the absence of residual closed porosity and theconservation of the crystal size distribution testifying a plastic closureof the pores.
Images of the UM2 samples were converted into binary, black(crystals) and white (glassy matrix) images to quantify the amount ofresidual glass present. Two BSE images were analyzed for each samplebefore and after the deformation experiments; the crystal fractionswere constant and resulted around 0.47 for all UM samples withuncertainties in the order of ±0.02 that were evaluated by analyzingdifferent portions of the same samples. The maximum length of the
suspended crystals measured from the BSE images were about300 μm; sizes that are much smaller than the sample diameter (10–15 mm).
In the case of the MND sample, the determination of the crystalfraction was considerably more difficult due to the smaller crystalsizes of the volumetrically dominant feldspar phase relative to the UMsamples, as well as due to the reduced chemical contrast between thefeldspar crystals and the glassy matrix. Sample MND (experimentPO729) was therefore evaluated by using characteristic X-raydistribution maps for calcium and iron: the Ca-Kα X-ray map(Fig. 1a) allows distinction of feldspar and clinopyroxene from theglassy matrix, magnetite and biotite, which have lower Ca-contents;likewise, the Fe Kα X-raymap (Fig.1b) allows distinction of magnetite,biotite and clinopyroxene from the glassy matrix. Superimposing thetwo distribution maps rendered it possible to unequivocally deter-mine the crystal fraction (dark phase in Fig. 1d) that resulted around0.52 with a similar uncertainty (±0.02) as the UM samples.
3.2. Determination of water contents
The H2O contents of the starting materials were determined byKarl-Fischer-titration (KFT). All analyses were conducted to a max-imum temperature of 1200 °C. After KFT the samples were recoveredand inspected with an optical microscope to verify if all water could beextracted. All specimens were glassy and contained numerous smallbubbles, embedded in a glassy matrix, indicating that part of the H2Ocontained in the material was not extracted during analysis. Thisproblem is well known and has been already reported previously byBehrens and Stuke (2003), and Del Gaudio et al. (2007) and Leschiket al. (2004). According to these authors, the amount of non-extractable H2O for glasses containing less than 1.5 wt.% is about0.17±0.04 wt.% and decreases to 0.10±0.05 for glass containing morethan 1.5 wt.%. H2O contents reported in Table 2 are correctedaccordingly. Measurements performed on samples before and afterthe initial HIP procedure evidenced no detectable water loss duringthe annealing of the material. In order to ensure sample stabilityduring the deformation experiments, H2O contents of the sampleswere measured prior to and after the experimental runs. Nodetectable H2O loss was observed. H2O contents reported in Table 2refer to the water contents of the glassy matrix, i.e. weight fractions ofanhydrous crystals present in the samples and the previouslydiscussed correction for unextracted H2O were taken into account.Weight fractions were obtained from the measured volume fractionsof crystals and glassymatrix (by BSE image analysis) and the density offeldspar crystal (major crystalline phase present in the samples) and
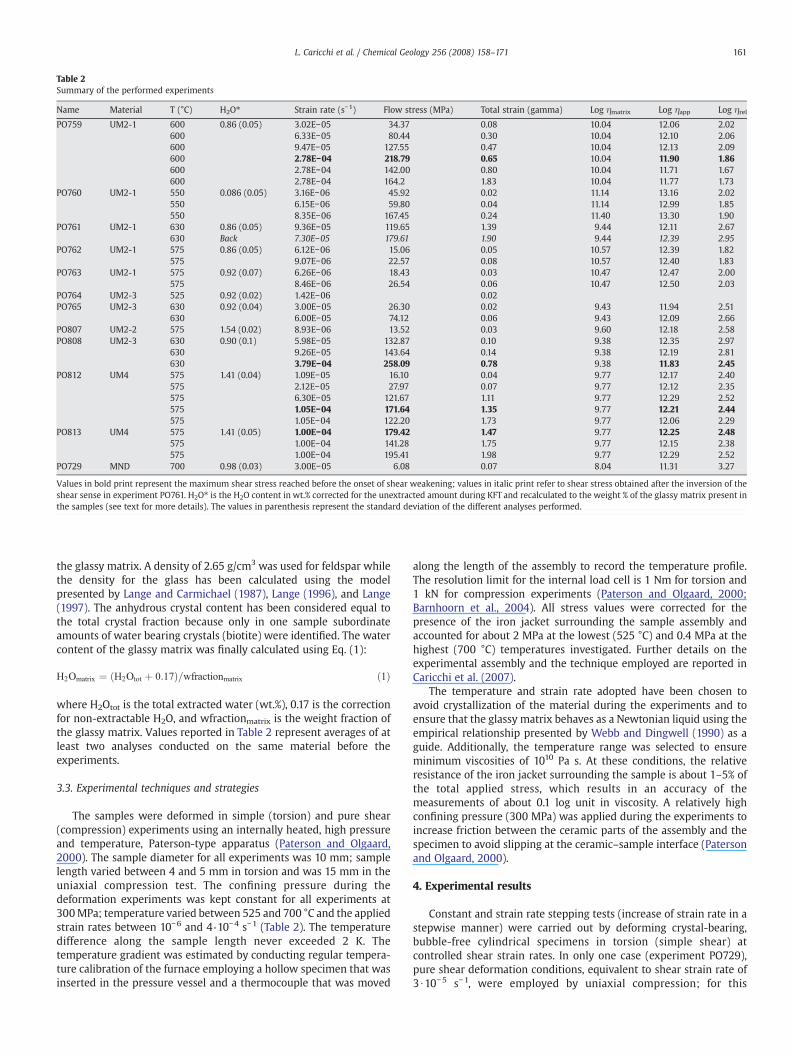
Table 2Summary of the performed experiments
Name Material T (°C) H2O⁎ Strain rate (s−1) Flow stress (MPa) Total strain (gamma) Log ηmatrix Log ηapp Log ηrel
PO759 UM2-1 600 0.86 (0.05) 3.02E−05 34.37 0.08 10.04 12.06 2.02600 6.33E−05 80.44 0.30 10.04 12.10 2.06600 9.47E−05 127.55 0.47 10.04 12.13 2.09600 2.78E−04 218.79 0.65 10.04 11.90 1.86600 2.78E−04 142.00 0.80 10.04 11.71 1.67600 2.78E−04 164.2 1.83 10.04 11.77 1.73
PO760 UM2-1 550 0.086 (0.05) 3.16E−06 45.92 0.02 11.14 13.16 2.02550 6.15E−06 59.80 0.04 11.14 12.99 1.85550 8.35E−06 167.45 0.24 11.40 13.30 1.90
PO761 UM2-1 630 0.86 (0.05) 9.36E−05 119.65 1.39 9.44 12.11 2.67630 Back 7.30E−05 179.61 1.90 9.44 12.39 2.95
PO762 UM2-1 575 0.86 (0.05) 6.12E−06 15.06 0.05 10.57 12.39 1.82575 9.07E−06 22.57 0.08 10.57 12.40 1.83
PO763 UM2-1 575 0.92 (0.07) 6.26E−06 18.43 0.03 10.47 12.47 2.00575 8.46E−06 26.54 0.06 10.47 12.50 2.03
PO764 UM2-3 525 0.92 (0.02) 1.42E−06 0.02PO765 UM2-3 630 0.92 (0.04) 3.00E−05 26.30 0.02 9.43 11.94 2.51
630 6.00E−05 74.12 0.06 9.43 12.09 2.66PO807 UM2-2 575 1.54 (0.02) 8.93E−06 13.52 0.03 9.60 12.18 2.58PO808 UM2-3 630 0.90 (0.1) 5.98E−05 132.87 0.10 9.38 12.35 2.97
630 9.26E−05 143.64 0.14 9.38 12.19 2.81630 3.79E−04 258.09 0.78 9.38 11.83 2.45
PO812 UM4 575 1.41 (0.04) 1.09E−05 16.10 0.04 9.77 12.17 2.40575 2.12E−05 27.97 0.07 9.77 12.12 2.35575 6.30E−05 121.67 1.11 9.77 12.29 2.52575 1.05E−04 171.64 1.35 9.77 12.21 2.44575 1.05E−04 122.20 1.73 9.77 12.06 2.29
PO813 UM4 575 1.41 (0.05) 1.00E−04 179.42 1.47 9.77 12.25 2.48575 1.00E−04 141.28 1.75 9.77 12.15 2.38575 1.00E−04 195.41 1.98 9.77 12.29 2.52
PO729 MND 700 0.98 (0.03) 3.00E−05 6.08 0.07 8.04 11.31 3.27
Values in bold print represent the maximum shear stress reached before the onset of shear weakening; values in italic print refer to shear stress obtained after the inversion of theshear sense in experiment PO761. H2O⁎ is the H2O content in wt.% corrected for the unextracted amount during KFT and recalculated to the weight % of the glassy matrix present inthe samples (see text for more details). The values in parenthesis represent the standard deviation of the different analyses performed.
161L. Caricchi et al. / Chemical Geology 256 (2008) 158–171
the glassy matrix. A density of 2.65 g/cm3 was used for feldspar whilethe density for the glass has been calculated using the modelpresented by Lange and Carmichael (1987), Lange (1996), and Lange(1997). The anhydrous crystal content has been considered equal tothe total crystal fraction because only in one sample subordinateamounts of water bearing crystals (biotite) were identified. The watercontent of the glassy matrix was finally calculated using Eq. (1):
H2Omatrix ¼ ðH2Otot þ 0:17Þ=wfractionmatrix ð1Þ
where H2Otot is the total extracted water (wt.%), 0.17 is the correctionfor non-extractable H2O, and wfractionmatrix is the weight fraction ofthe glassy matrix. Values reported in Table 2 represent averages of atleast two analyses conducted on the same material before theexperiments.
3.3. Experimental techniques and strategies
The samples were deformed in simple (torsion) and pure shear(compression) experiments using an internally heated, high pressureand temperature, Paterson-type apparatus (Paterson and Olgaard,2000). The sample diameter for all experiments was 10 mm; samplelength varied between 4 and 5 mm in torsion and was 15 mm in theuniaxial compression test. The confining pressure during thedeformation experiments was kept constant for all experiments at300MPa; temperature varied between 525 and 700 °C and the appliedstrain rates between 10−6 and 4·10−4 s−1 (Table 2). The temperaturedifference along the sample length never exceeded 2 K. Thetemperature gradient was estimated by conducting regular tempera-ture calibration of the furnace employing a hollow specimen that wasinserted in the pressure vessel and a thermocouple that was moved
along the length of the assembly to record the temperature profile.The resolution limit for the internal load cell is 1 Nm for torsion and1 kN for compression experiments (Paterson and Olgaard, 2000;Barnhoorn et al., 2004). All stress values were corrected for thepresence of the iron jacket surrounding the sample assembly andaccounted for about 2 MPa at the lowest (525 °C) and 0.4 MPa at thehighest (700 °C) temperatures investigated. Further details on theexperimental assembly and the technique employed are reported inCaricchi et al. (2007).
The temperature and strain rate adopted have been chosen toavoid crystallization of the material during the experiments and toensure that the glassy matrix behaves as a Newtonian liquid using theempirical relationship presented by Webb and Dingwell (1990) as aguide. Additionally, the temperature range was selected to ensureminimum viscosities of 1010 Pa s. At these conditions, the relativeresistance of the iron jacket surrounding the sample is about 1–5% ofthe total applied stress, which results in an accuracy of themeasurements of about 0.1 log unit in viscosity. A relatively highconfining pressure (300 MPa) was applied during the experiments toincrease friction between the ceramic parts of the assembly and thespecimen to avoid slipping at the ceramic–sample interface (Patersonand Olgaard, 2000).
4. Experimental results
Constant and strain rate stepping tests (increase of strain rate in astepwise manner) were carried out by deforming crystal-bearing,bubble-free cylindrical specimens in torsion (simple shear) atcontrolled shear strain rates. In only one case (experiment PO729),pure shear deformation conditions, equivalent to shear strain rate of3 ∙10−5 s−1, were employed by uniaxial compression; for this

162 L. Caricchi et al. / Chemical Geology 256 (2008) 158–171
experiment uniaxial strain rate and stress values were converted toshear strain rates and shear stresses using the conversion laws 38–42reported by Paterson and Olgaard (2000).
The adopted experimental conditions, measured H2O content(KFT) and resulting stress and viscosity values are reported in Table 2.Apparent viscosity (ηapp) is calculated as follows (Eq. (2)):
ηapp ¼ τ= �γ ð2Þ
where τ is the shear stress and γ is the shear strain rate.The relative viscosity (ηr) is computed by Eq. (3):
ηr ¼ ηapp=ηmelt ð3Þ
where ηmelt is the viscosity of the suspending (pure) melt phase,calculated according to the model proposed by Giordano et al. (2004).
4.1. Experiments at γb10−4 (Newtonian behavior)
Tests performed at relatively low strain rates (γb10−4) exhibitedan elastic response followed by strain hardening (increase of stresswith increasing strain) and final flow at constant stress (Fig. 2a). Theonly exception is represented by experiment PO764, where flow atconstant stress was not attained. These experiments are characterizedby an increase of the shear stress (τ) value at flow with increasingstrain rate (Fig. 2a). The apparent viscosity (ηapp) of the material is
Fig. 2. a) Diagram illustrating applied stresses plotted against strain (gamma) for aselection of experimental tests at low total strain. b) Variation of the apparent viscosity(ηapp) as a function of strain. The ηapp is calculated by dividing the applied stress (inPascal) by the strain rate (s−1). The value of ηapp becomes constant during flow atconstant stress of the material. The strain rates increase in both figures (a and b) fromleft to right (strain-stepping experiments).
Fig. 3. a) Plot of the stress values applied during the experiment as a function of strain(gamma) for a selection of experimental tests at high total strain; b) variation of theapparent viscosity (ηapp) as a function of strain. The strain rates increase in both figures(a and b) from left to right (strain-stepping experiments).
independent of strain rate for γ up to about 10−4 s−1 (Fig. 2b) testifyingNewtonian behavior of the material.
4.2. Experiments at γN10−4 (shear thinning and stress weakening)
Experiments performed at higher strain rates showed the samesequence of rheological responses but were additionally characterizedby shear thinning (decrease of viscosity with increasing strain rate)and in some cases by stress weakening (sudden decrease of the appliedshear stress value with increasing strain) at the highest applied strainrates (Fig. 3a). The stress at the onset of shear weakening is animportant value because beyond this threshold the application offixed stress to the material induces a strong acceleration of the flowprocess.
In experiments PO808 the increase of the strain rate from6 ∙10−5 s−1
to 9 ∙10−5 s−1 produced a decrease of the viscosity (shear thinning) thatwas followed by stress weakening at the highest applied strain rate of4 ∙10−4 s−1 (Fig. 3b). In all other experiments shear thinning was notobserved and the Newtonian behavior of the material at low strainrates (b10−4 s−1) was followed by stress weakening at the highestapplied strain rates (Fig. 3b). Stress weakening was observed inexperiments PO759, PO808, PO812 and PO813, all reported in Fig. 3aand b. Experiment PO808 was stopped after the onset of shearweakening while the others were run until failure of the iron jacket

Fig. 5. Diagram displaying the logarithmic value of the apparent viscosity plottedagainst the applied strain (gamma) for experiment PO761. During the course of thisexperiment, the shear sensewas inverted; at this stage, the stress decreases to zero untilloading on the opposite shear sense starts. The inversion causes an increase of theviscosity under flow condition and an increase of the applied strain required to reachflow at constant stress.
Fig. 4. Diagram illustrating stress (left axis) and strain rate (right axis) conditionsobtained at the onset of shear weakening as a function of temperature.
163L. Caricchi et al. / Chemical Geology 256 (2008) 158–171
made it impossible to continue the experiments. Runs PO759, PO808,and PO812 were performed with a series of strain rate stepping testsbefore the onset of the stress decreasewas observed (Fig. 3a,b). In orderto evaluate if stress weakening was affected by the strain rate steppingprocedure adopted during experiment PO812, a second experiment(PO813), not undergoing strain rate stepping procedure, was per-formed at the same T and applying γconditions for which stressweakening was observed in PO812 (i.e., γ=10−4 s−1). As shown in Fig.3a, comparable peak stress values (peak stress PO812=171.64 MPa;peak stress PO813=179.42) were observed after similar amount ofstrain (gamma PO812=1.35; gamma PO813=1.47) was achieved. Moredetailed inspection of the experiments reveals that in experimentsPO812 and PO813 stress weakening behavior produces a minimumstress value followed, upon further deformation, by an increase ofstress eventually reaching stress values close to those attained beforethe onset of weakening (Fig. 3a). For the other experiments, differentresults are obtained: for experiment PO759, stress weakening isobserved at γ=3·10−4 s−1 followed by a minimum value of flow stressthat only slight increases upon further increase of strain (Fig. 3a). Stressvalues for this experiment decrease from~218MPa to ~142MPa (strainbetween0.65 and0.80) followedbya successive slow increase to valuesof about 155 MPa at a total strain of 1.83.
The onset of stress weakening as a function of experimentaltemperature is a function of both the applied strain rate and theapplied stresses (Fig. 4).
4.3. Direct and inverse sense of shear experiment
In one experiment (PO761), the sense of shear was inverted onceflow at constant stress was reached (Fig. 5). The inversion of the shearsense first resulted in the complete unloading of the applied stress onthe specimen and subsequently the loading of the specimen started inthe opposite shear sense following the identical sequence of elasticresponse, strain hardening and finally flow at constant stress value.After the inversion of the shear sense, the total gamma required toreach flow at constant stress was higher than during the first stage ofthe experiment (Fig. 5). Additionally, the apparent viscosity increasedby about 0.3 log unit upon inversion of the deformation direction,corresponding to an increase on the peak stress during the flow ofabout 60 MPa (Table 2).
4.4. Macroscopic aspect of deformed samples and microstructures
Before the start of each deformation experiment the jacketsurrounding the sample assembly was marked with incisions alongthe length of the experimental assembly (see Fig. 6 for details). Thisallows quantification of the total amount and the distribution of strainundergone by the specimens after recovering the charges at the end of
the experiment. The deformed assemblies were investigatedby optical microscopy. Samples deformed at strain rates lower than10−4 s−1 show homogeneous deformation in the direction perpendi-cular to the shear direction (Fig. 6a). Conversely, the jacketssurrounding the samples of experiments PO812, PO813 and PO759(i.e. the samples where stress weakening was observed at high strainrates) show clear evidences of strain localization (concentration ofstrain in a discrete portion of thematerial). In PO812 and PO813 planarstructures (fractures) oriented at about 10° with respect to the shearplane accommodate a relative displacement between the two portionsof the sample separated by these planar features (Fig. 6b). In PO759,the markers on the iron jacket are continuous and do not show anyrelative displacement of the two sides of the planar structure (Fig. 6c).Yet the change in slope of the incisions in the iron jacket used as strainmarkers evidences strain localization on a plane with an orientationabout 10° with respect to the shear plane (Fig. 6c).
Samples deformed in torsion were investigated in sections cut fromthe external portion of the specimens. In this portion of the specimensthe simple shear geometry is best appreciated (Paterson and Olgaard,2000). A comparison of the BSE images taken from the startingmaterialwith those taken from samples PO759, PO762 and PO764 afterdeformation reveals no significant variation of the crystal size distribu-tion (Fig. 7). As illustrated in Fig. 8a, the startingmaterial did not presentany preferential orientation of crystals. In contrast, all samplesrecovered after the experiments show a tendency of the crystals toalign around 20–40° with respect to the shear plane (Fig. 8b, c). Theorientation of the crystals, however, is not a function of the total strainand/or the strain rate applied to the sample. Orientation of suspendedcrystals around 30° with respect to the shear plane, not related to thetotal applied strain, was already observed by Caricchi et al. (2007),Holtzman et al. (2003) and Holtzman et al. (2005) on different crystal-silicate liquid suspensions.
Fig. 8c clearly shows that the deformation is not homogeneouswithin the sample but is rather confined to discrete portions of thesample: the arrows labeled 1 in Fig. 8c highlight regions wherefeldspar crystals are monotonically aligned at an angle of about 30°with respect to the shear plane. In contrast, in the portion of thesample denoted by the arrow labeled 2, no evidence for a preferredorientation of the crystals is discernible.
The inspection of the BSE images of samples PO812 andPO813 (shear weakening; Fig. 6b) reveals a clear discontinuity in
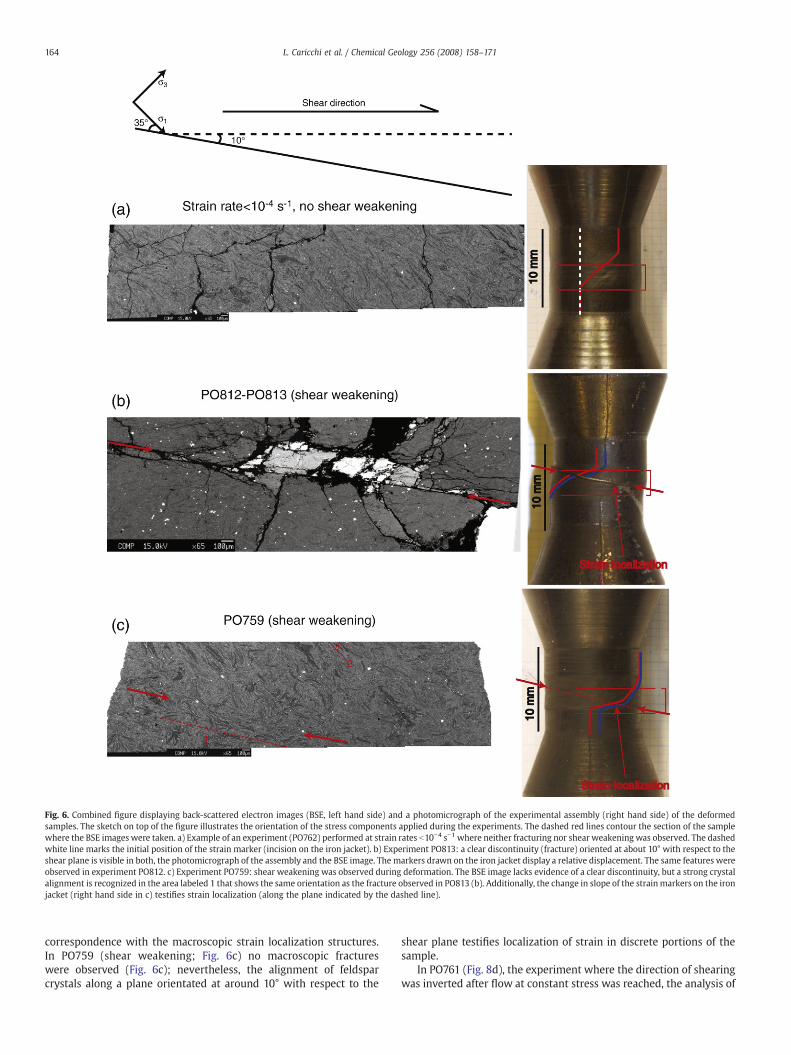
Fig. 6. Combined figure displaying back-scattered electron images (BSE, left hand side) and a photomicrograph of the experimental assembly (right hand side) of the deformedsamples. The sketch on top of the figure illustrates the orientation of the stress components applied during the experiments. The dashed red lines contour the section of the samplewhere the BSE images were taken. a) Example of an experiment (PO762) performed at strain rates b10−4 s−1 where neither fracturing nor shear weakening was observed. The dashedwhite line marks the initial position of the strain marker (incision on the iron jacket). b) Experiment PO813: a clear discontinuity (fracture) oriented at about 10° with respect to theshear plane is visible in both, the photomicrograph of the assembly and the BSE image. The markers drawn on the iron jacket display a relative displacement. The same features wereobserved in experiment PO812. c) Experiment PO759: shear weakening was observed during deformation. The BSE image lacks evidence of a clear discontinuity, but a strong crystalalignment is recognized in the area labeled 1 that shows the same orientation as the fracture observed in PO813 (b). Additionally, the change in slope of the strainmarkers on the ironjacket (right hand side in c) testifies strain localization (along the plane indicated by the dashed line).
164 L. Caricchi et al. / Chemical Geology 256 (2008) 158–171
correspondence with the macroscopic strain localization structures.In PO759 (shear weakening; Fig. 6c) no macroscopic fractureswere observed (Fig. 6c); nevertheless, the alignment of feldsparcrystals along a plane orientated at around 10° with respect to the
shear plane testifies localization of strain in discrete portions of thesample.
In PO761 (Fig. 8d), the experiment where the direction of shearingwas inverted after flow at constant stress was reached, the analysis of

Fig. 7. Crystal size distribution (CSD) of starting material and a selection of experimentalrun products. The crystal size is expressed as Feret diameter in micrometers. The Feretdiameter is the diameter of the circle with a surface equivalent to the surface of theanalyzed crystal.
165L. Caricchi et al. / Chemical Geology 256 (2008) 158–171
the crystal size distribution could not be performed by image analysisbecause the very fine grain size of the minerals rendered it verydifficult to separate single particles (crystals) from each other.Inspection of the BSE image clearly reveals that during deformationof this sample the crystal sizes considerably decreased resulting in ahomogenization of the crystal size distribution. Only a small numberof crystals did not break to form components of crystal aggregates.These few crystals were used in our image analysis to determine if anypreferential orientation could be recognized in the sample andrevealed that the aggregates and particles show an oppositealignment relative to the crystal orientation in the other experimentswhere a single shear direction was applied (Fig. 8b to d).
5. Discussion
The principal results of this study indicate that the Monte Nuovomagma behaves Newtonian up to strain rates of 10−4 s−1 (Fig. 2b).Higher strain rates induce non-Newtonian behavior, in particularshear thinning (decrease of viscosity with increasing strain rate) andstress weakening due to strain localization, both in brittle and viscousregime (Fig. 3b). Shear thinning was only observed in experimentPO808 at 630 °C and an applied strain rate of 9.3 ∙10−5 s−1 just beforethe onset of shear weakening at a strain rate of 3.8 ∙10−4 s−1. In allother experiments conducted at lower temperature, Newtonianbehavior (at strain rates lower than 10−4 s−1) was directly followedby shear weakening. In effect, PO808 was the only experimentperformed at 630 °C and relatively high strain rate. Experiment PO761,performed at the same conditions, resulted identical non-Newtonianviscosity as PO808 (Table 2). Provided that increasing temperatureexpands the viscous field relative to brittle behavior, Newtonianbehavior at low strain rates (lower than 10−4 s−1) followed by non-Newtonian and finally brittle behavior has to be expected withincreasing strain rates at magmatic temperature (~800 °C for theMonte Nuovo eruption).
At a temperature of 575 °C (experiments PO812 and PO813), thepresence of macroscopically observable fractures in the recoveredsamples (Fig. 6a) suggests a rheological changeover from plastic tobrittle behavior.
Experimental uncertainties in the viscosity measurements of theorder of 0.2–0.3 log unit have to be considered that are mainly relatedto sample inhomogeneities in H2O contents and crystal fractions andthe errors associated with the determination of the crystal fractions.Evidence for inhomogeneity of the crystal fractions and its effect onthe flow stresses can be recognized by comparing experiment PO765and PO808: both runs were performed at an identical temperature of630 °C using starting materials that nominally contain identical waterand crystal contents. Applying an identical strain rate of 6 ·10−5 s−1, themeasured flow stresses change from 74.12 MPa for PO765 to132.87 MPa for PO808, which, in turn, results in an increase of theapparent viscosity by 0.25 log unit. Application of the modelpresented by Caricchi et al. (2007) for magmatic, crystal-bearingsuspensions behaving Newtonian (i.e. applied strain rate are lowerthan 10−4 s−1), reveals that such a viscosity increase corresponds to anincrease of the crystal fraction from 0.47 to 0.49, i.e. within the errorinherent to the determination of the crystal fractions (see above).
5.1. Viscosity of pure melts
In order to evaluate the effect of crystals on the rheology of MonteNuovo magma our data had to be supplemented with data on theviscosity of the matrix present in our samples. The viscosity of theglassy matrix of the Monte Nuovo scoria was previously investigatedas function of temperature and water content by Giordano et al.(2004). Fig. 9 displays the calculated viscosity values of the glassymatrix for different water contents as a function of temperatureemploying their equation. While H2O leads to a general decrease ofviscosity, the effect is considerably more pronounced at lowertemperatures. The H2O contents used to calculate the viscositiescorrespond to the quantity measured by Karl-Fischer Titration (KFT)corrected for the weight fraction of the melt phase, plus the 0.17 wt.%H2O estimated by Behrens and Stuke (2003) and Del Gaudio et al.(2007), i.e. the non-extractable portion of H2O during KFT analysis.The strongest effect of H2O on the melt viscosity is observed betweennominally anhydrous melts (0.02 wt.% H2O) and 0.86 wt.% H2O.Further increase of H2O from 0.86 to 1.54 wt.% results in a smalleradditional decrease of the viscosity.
5.2. Strain rate lower than 10−4 s−1
The effects of temperature on the viscosity of the partiallycrystallized Monte Nuovo magma can be evaluated by comparingexperiments PO759, PO760, PO762, PO763, PO765, and PO808 thatwere conducted with starting materials containing nearly identicalwater contents: temperature increase results in an apparent viscositydecrease that is comparable with the temperature dependantdecrease of the viscosity of the glass matrix alone. However, at630 °C there is a larger difference between the viscosity of the meltphase and the apparent viscosity of the crystal-bearing melts, whichtranslates in a higher relative viscosity (Table 2; Fig. 10a). Interest-ingly, in all the experiments the highest relative viscosity values areassociated with the lowest viscosity of the melt phase (Fig. 10a). This,however, could be the result of inhomogeneity in the crystal fractionor water content of the samples or it could be related to theenhancement of the rheological difference between crystals andmatrix. Higher water contents of the matrix (e.g. in PO807) orincreasing temperature (e.g. in PO765) decrease the viscosity of thematrix while affecting much less significantly the flow resistance ofthe feldspar crystals (Rybacki and Dresen 2004). The enhancedviscosity difference between the matrix and the suspended crystalsin the samples with the lowest matrix viscosity could, therefore,

Fig. 8. Figure combining back-scattered electron (BSE) images of the starting material (a) and the deformed samples (b, c, d) on the left hand side and associated distributions ofcrystal orientations measured in the horizontal shear plane on the right hand side. Figures b) and c) are images of experiments performedwith a single sense of shear at different totalstrain, represented by the deformed rectangle on the bottom left side on the BSE images. Experiment PO764 (c) did not reach flow conditions during the experiment; nevertheless,the crystals show some preferential orientation around 20–40° with respect to the shear plane. The numbers in c) highlight portions of the sample where the crystals show strongpreferred orientation (1) and portions where no preferred orientation is visible (2). These microstructures testify that the strain is not homogeneously distributed in the deformingsamples. d) Image of experiment PO761 where the sense of shear was inverted after flow was reached during the first deformation stage.
166 L. Caricchi et al. / Chemical Geology 256 (2008) 158–171
result in an increase of the relative viscosity (ηr, Fig. 10a and b). Thedifference in rheological behavior between the suspending silicatemelt and the crystals can be quantified through the activation energyfor viscous flow: in our system, feldspar is the dominant crystallinephase having an activation energy (Q) for plastic flow, at the strainrate and temperature of interest, of 332±23 kJ mol−1(Rybacki andDresen, 2004). The activation energy for viscous flow of thesuspending melt was calculated from the data of Giordano et al.(2004) for the glassy matrix composition containing 0.86 wt.% H2O.Between 500 and 600 °C, Q results almost constant at about 303 kJ
mol−1 and decreases to 293 kJ mol−1 between 600 and 700 °C. Theactivation energy decrease is rather prominent between 500 and700 °C and thereafter decreases less markedly between 700 °C andthe eruptive temperature of Monte Nuovo (850±40 °C). Thesecalculations infer that the activation energies of the suspendedcrystals and the suspending melt are comparable thus implying thatthe deformation is not totally account for by the suspending meltalone, but partly by the suspended feldspar too. In fact, it is evidentfrom Figs. 6 and 8 that the feldspar crystals in the strained samplesare slightly deformed. The decrease in activation energy of the

Fig. 10. a) Logarithmic values of the relative viscosities as a function of temperature. Thegrey scale represents different viscosity ranges of the glassy matrix. The relativeviscosities are higher for the lowest viscosity of the glassy matrix. The data point at700 °C is for a sample with a crystal fraction of 0.52 while all other data are for materialwith a crystal fraction of 0.47. b) Logarithmic values of the relative viscosity (ηrel) as afunction of crystal fraction (/). Continuous lines represent Log ηrel variations calculatedwith the model presented by Caricchi et al. (2007) for strain rates of 10−6 s−1 (black;Newtonian behavior) and 10−4 s−1 (grey; shear thinning behavior). The filled symbolsindicate the range of relative viscosities obtained experimentally in this study forNewtonian-flow conditions. The grey scale represents different values of the glassymatrix viscosity. The elongated shape of the feldspar crystals present in the MonteNuovo magma is responsible for the shift of /max with respect to the data presented inCaricchi et al. (2007) where sub-spherical particles have been used. Grey arrowsindicate the effects of crystal shapes and homogeneity of crystal size distributions on/max. The spread of the data reflect the experimental errors due to sampleinhomogeneity and reproducibility.
Fig. 9. Plot of the logarithm of melt viscosity as function of temperature. Lines arecalculated according to the model presented in Giordano et al. (2004).
167L. Caricchi et al. / Chemical Geology 256 (2008) 158–171
suspending melt phase with increasing temperature implies that thedeformation becomes more focused to the melt phase than to thecrystals, which in turn enhances the effect of crystals in increasingthe relative viscosity with decreasingmelt viscosity. Consequently, atmagmatic conditions (T=850±40 °C for Monte Nuovo eruption;Piochi et al., 2005), the presence of 47 vol.% of crystals would inducesan increase of viscosity of about 2.5–3 orders of magnitude (values ofrelative viscosity for the samples UM with the lowest matrixviscosity) with respect to the viscosity of the pure melt phase. Thisvalues are 0.5–1 orders of magnitude higher than the values obtainedon magmatic solid–liquid suspensions containing non-elongatedcrystals (Lejeune and Richet, 1995; Caricchi et al., 2007; Costa et al.,2007; Fig. 10). It has previously been shown that solid–liquidsuspensions containing elongated particles reach the maximumpacking fraction (/max=solid fraction at which the viscosity begins toincrease exponentially (Krieger, 1972) at lower solid fraction thansuspensions containing spherical particles (Saar et al., 2001). A lower/max for Monte Nuovo magma with respect to suspensions contain-ing sub-spherical particles (Caricchi et al., 2007) would account forand explain the higher ηrel observed in our experiments (Fig. 10b).
The depressing effect of water on the viscosity of the partiallycrystallized samples, evidenced by comparing experiments PO762,PO763, PO807, and PO812, is less than the effect on the melt phasealone (Table 2), but this result could be related to a slightinhomogeneity in the crystallinity of the different sample whichcould mask the effect of H2O on the viscosity.
The higher relative viscosity measured on the MND sample (3.27;Table 2, Fig. 10a and b) is due to the higher crystallinity of the materialwith respect to UM (MND ϕ=0.52, UM ϕ=0.47). Fig. 11 illustrates theexistence of a direct relationship between applied strain rate andstress reached under flow conditions: for strain rates less than 10−4 s−1
the stress decreases linearly with decreasing strain rate to zero asexpected for Newtonian material and, thus, testifies to the absence ofany observable yield strength (Lejeune and Richet, 1995; Caricchiet al., 2007). The absence of yield strength indicates that Monte Nuovomagma does not exhibit Binghamian but rather “fictive Binghamian”behavior at high strain rates. This rheological concept has alreadybeen introduced in several studies on solid–liquid suspensions(Krieger, 1972; Dekruif et al., 1985; Brückner and Deubener, 1997;Deubener and Brückner, 1997; Barnes, 1999): the fictive Binghamianbehavior is characterized by the independence of viscosity from thestrain rate, as for Binghamian material, and the definition of yieldstress (stress that needs to be overcome to deformation irreversibly amaterial) is replaced by a fictive yield stress (inset Fig. 11). This valuecorresponds to the stress values at which a strong increase in the rateof deformation is observed. The concept can be clarified with anexample: the application of stress that is much lower than the fictive
yield stress value, will result in deformation at relatively lowdeformation rates (inset Fig. 11). Doubling the applied stress willinduce a small increase of the strain rate if the total applied stress isstill lower than the fictive yield stress. If the applied stress is increasedincrementally, the deformation rate will increase dramatically oncethe fictive yield stress is overcome (inset Fig. 11). While the concept ofyield stress implies that below this stress no deformation occurs, thefictive yield stress represents the stress at the transition from“microscopic” to “macroscopic” deformation.
5.3. Shear thinning
The deformation of crystal-bearing magmas with solid fractionshigher or very close to max, as it is the case for the Monte Nuovomagma, is only possible if a certain amount of local compaction anddilation occurs in the material (Holtzman et al., 2005; Rutter et al.,2006; Caricchi et al., 2007). In portions where compaction occurs, thepressure acting on the melt phase increases and vice versa for local
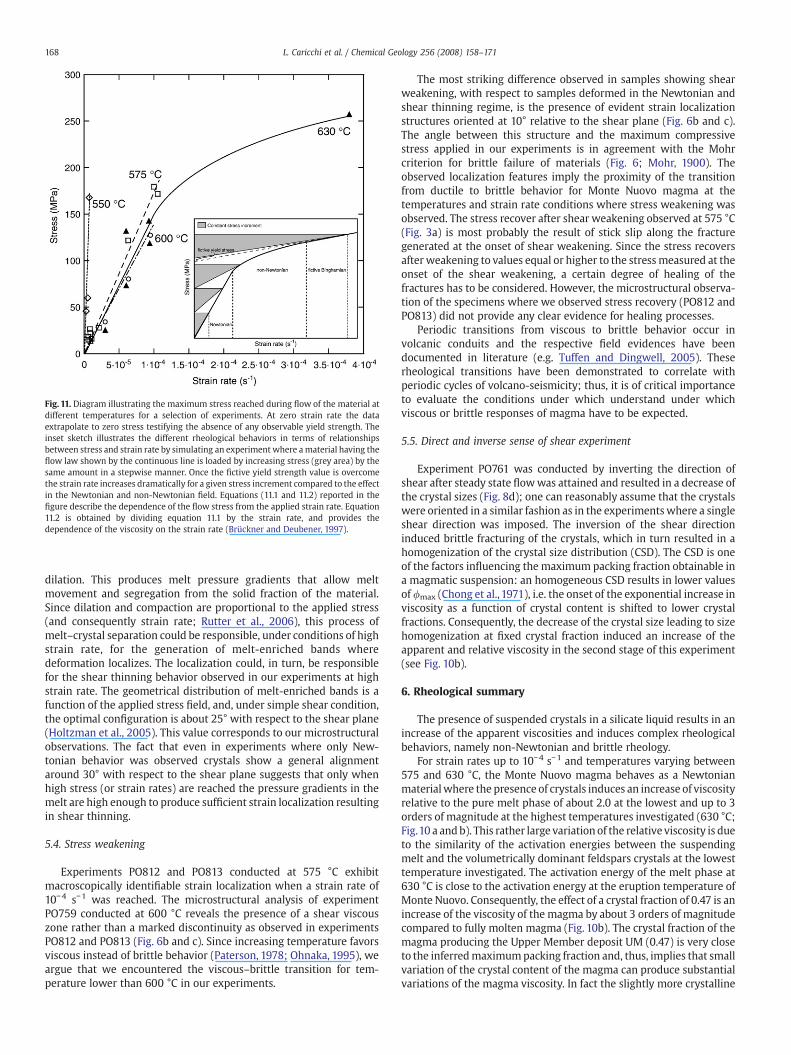
Fig. 11. Diagram illustrating the maximum stress reached during flow of the material atdifferent temperatures for a selection of experiments. At zero strain rate the dataextrapolate to zero stress testifying the absence of any observable yield strength. Theinset sketch illustrates the different rheological behaviors in terms of relationshipsbetween stress and strain rate by simulating an experiment where amaterial having theflow law shown by the continuous line is loaded by increasing stress (grey area) by thesame amount in a stepwise manner. Once the fictive yield strength value is overcomethe strain rate increases dramatically for a given stress increment compared to the effectin the Newtonian and non-Newtonian field. Equations (11.1 and 11.2) reported in thefigure describe the dependence of the flow stress from the applied strain rate. Equation11.2 is obtained by dividing equation 11.1 by the strain rate, and provides thedependence of the viscosity on the strain rate (Brückner and Deubener, 1997).
168 L. Caricchi et al. / Chemical Geology 256 (2008) 158–171
dilation. This produces melt pressure gradients that allow meltmovement and segregation from the solid fraction of the material.Since dilation and compaction are proportional to the applied stress(and consequently strain rate; Rutter et al., 2006), this process ofmelt–crystal separation could be responsible, under conditions of highstrain rate, for the generation of melt-enriched bands wheredeformation localizes. The localization could, in turn, be responsiblefor the shear thinning behavior observed in our experiments at highstrain rate. The geometrical distribution of melt-enriched bands is afunction of the applied stress field, and, under simple shear condition,the optimal configuration is about 25° with respect to the shear plane(Holtzman et al., 2005). This value corresponds to our microstructuralobservations. The fact that even in experiments where only New-tonian behavior was observed crystals show a general alignmentaround 30° with respect to the shear plane suggests that only whenhigh stress (or strain rates) are reached the pressure gradients in themelt are high enough to produce sufficient strain localization resultingin shear thinning.
5.4. Stress weakening
Experiments PO812 and PO813 conducted at 575 °C exhibitmacroscopically identifiable strain localization when a strain rate of10−4 s−1 was reached. The microstructural analysis of experimentPO759 conducted at 600 °C reveals the presence of a shear viscouszone rather than a marked discontinuity as observed in experimentsPO812 and PO813 (Fig. 6b and c). Since increasing temperature favorsviscous instead of brittle behavior (Paterson, 1978; Ohnaka, 1995), weargue that we encountered the viscous–brittle transition for tem-perature lower than 600 °C in our experiments.
The most striking difference observed in samples showing shearweakening, with respect to samples deformed in the Newtonian andshear thinning regime, is the presence of evident strain localizationstructures oriented at 10° relative to the shear plane (Fig. 6b and c).The angle between this structure and the maximum compressivestress applied in our experiments is in agreement with the Mohrcriterion for brittle failure of materials (Fig. 6; Mohr, 1900). Theobserved localization features imply the proximity of the transitionfrom ductile to brittle behavior for Monte Nuovo magma at thetemperatures and strain rate conditions where stress weakening wasobserved. The stress recover after shear weakening observed at 575 °C(Fig. 3a) is most probably the result of stick slip along the fracturegenerated at the onset of shear weakening. Since the stress recoversafter weakening to values equal or higher to the stressmeasured at theonset of the shear weakening, a certain degree of healing of thefractures has to be considered. However, the microstructural observa-tion of the specimens where we observed stress recovery (PO812 andPO813) did not provide any clear evidence for healing processes.
Periodic transitions from viscous to brittle behavior occur involcanic conduits and the respective field evidences have beendocumented in literature (e.g. Tuffen and Dingwell, 2005). Theserheological transitions have been demonstrated to correlate withperiodic cycles of volcano-seismicity; thus, it is of critical importanceto evaluate the conditions under which understand under whichviscous or brittle responses of magma have to be expected.
5.5. Direct and inverse sense of shear experiment
Experiment PO761 was conducted by inverting the direction ofshear after steady state flowwas attained and resulted in a decrease ofthe crystal sizes (Fig. 8d); one can reasonably assume that the crystalswere oriented in a similar fashion as in the experimentswhere a singleshear direction was imposed. The inversion of the shear directioninduced brittle fracturing of the crystals, which in turn resulted in ahomogenization of the crystal size distribution (CSD). The CSD is oneof the factors influencing the maximum packing fraction obtainable ina magmatic suspension: an homogeneous CSD results in lower valuesof /max (Chong et al., 1971), i.e. the onset of the exponential increase inviscosity as a function of crystal content is shifted to lower crystalfractions. Consequently, the decrease of the crystal size leading to sizehomogenization at fixed crystal fraction induced an increase of theapparent and relative viscosity in the second stage of this experiment(see Fig. 10b).
6. Rheological summary
The presence of suspended crystals in a silicate liquid results in anincrease of the apparent viscosities and induces complex rheologicalbehaviors, namely non-Newtonian and brittle rheology.
For strain rates up to 10−4 s−1 and temperatures varying between575 and 630 °C, the Monte Nuovo magma behaves as a Newtonianmaterialwhere the presence of crystals induces an increase of viscosityrelative to the pure melt phase of about 2.0 at the lowest and up to 3orders of magnitude at the highest temperatures investigated (630 °C;Fig.10 a andb). This rather large variation of the relative viscosity is dueto the similarity of the activation energies between the suspendingmelt and the volumetrically dominant feldspars crystals at the lowesttemperature investigated. The activation energy of the melt phase at630 °C is close to the activation energy at the eruption temperature ofMonte Nuovo. Consequently, the effect of a crystal fraction of 0.47 is anincrease of the viscosity of the magma by about 3 orders of magnitudecompared to fully molten magma (Fig. 10b). The crystal fraction of themagma producing the Upper Member deposit UM (0.47) is very closeto the inferredmaximumpacking fraction and, thus, implies that smallvariation of the crystal content of the magma can produce substantialvariations of the magma viscosity. In fact the slightly more crystalline

Fig. 12. Stress–strain rate diagram illustrating stress values obtained during flow for anygiven value of applied strain rate. Filled symbols represent minimum flow stress valuesreached after the onset of shear weakening. At 575 °C healing of fractures occurred;therefore, minimum values reached after shear weakening are plotted in the diagram(see also Fig. 3). At both experimental temperatures, 575 °C and 600 °C, flow stressesdecrease to similar values indicating that once shear weakening takes place therheology of the material becomes independent of strain rate.
169L. Caricchi et al. / Chemical Geology 256 (2008) 158–171
(0.52)MNDmaterial results a higher relative viscosity (0.3–0.5 log unitof viscosity higher) with respect to UM.
For strain rates higher than 10−4 s−1 a rheological transition fromviscous to viscoelastic behavior is observed (Fig. 12). This transitionhas been extensively discussed in literature on silicate melts (Webband Dingwell, 1990; Bottinga, 1994; Romano et al., 1996; Tuffen et al.,2003) and can conveniently be described by the Maxwell's equation(Maxwell, 1867): viscoelastic behavior characterizes magma rheologywhen the product of applied strain rate and viscosity exceeds thestrength of the magma (Eq. (4)):
�γηappNτs: ð4Þ
Where γ is the shear strain rate, ηapp is the apparent viscosity andτs is the shear strength of the magma. The product of ηapp and γ for
Fig. 13. Diagram depicting the onset of shear weakening described in terms of shearstrength of the material (τs; see Eq. (5)) as a function of temperature. The linearequation reported in the figure provides the relationship between τs and temperaturein °C (see text for more details).
which shear weakening was observed gives τs (shear strength) of thematerial. In our experiments the logarithm of τs can be fitted as alinear function of temperature (T, Eq. (5); Fig. 13):
Logτs ¼ 3:1 � 10−3dT ∘Cð Þ þ 6:4692: ð5ÞThe linear relation between temperature and τs can be utilized toestablish the relationship between temperature and the maximumpossible stress applicable before the onset of shear weakening. Theapparent viscosity can be calculated combining the Giordano et al.(2004) model for the viscosity of the melt phase with our relativeviscosity values (see Eq. (3)). The resultant apparent viscosity(viscosity of melt phase plus the relative effect due to the presenceof crystals) of the system at a given temperature is then used tocompute the critical strain rate required for shear weakening bysubstituting Eq. (5) into Eq. (4).
Fig. 12 reveals that the minimum stress reached after shearlocalization is insensitive to the applied strain rate, thus implying thatonce the stress condition for stress weakening is achieved and appliedstress is maintained at this level, the deformation rate will increaseindefinitely causing a strong acceleration of the flow rate that canresult in the fragmentation of magma. Though shear heating producedby sliding on portions of the material where shear localization occurs,could result in the healing of the fractures, which would terminate theacceleration of the magma toward catastrophic fragmentation.
The minimum stress reached after the onset of stress weakeningand the orientation of the fractures (10° with respect to the shearplane) can be used to calculate friction on the shear plane (Fig. 14). Ourcalculations provide values of 131 MPa at 300 MPa confining pressure,that reduces to 67MPa if confining pressure is lowered to 100 MPa. Tosummarize, Eqs. (4) and (5) allow calculating the onset of stressweakening, which is probably largely independent on the confiningpressure (Rutter et al., 2006), while the equation reported in Fig. 14provides the minimum shear stress required to move the materialalong the shear localization plane once fractures are established. Thedecrease of the shear stress with decreasing confining pressure(Fig. 14) could further accelerate the magma ascent velocity inside thevolcanic conduit.
We have neglected the presence of gas bubbles in the presentstudy. The bubble fraction of the erupted Monte Nuovo magma wasabout 0.4–0.5 (Piochi et al., 2005); for such bubble fractions therelative viscosity is estimated to increase or decrease by a factor 5 up
Fig. 14.Mohr circle diagram constructed for the conditions where shear weakening wasobserved. The minimum shear stress reached after the onset of shear weakening wasalways about 140 MPa (Mohr circle radius) and the strain localization planes wereoriented at about 10° (2/=20°) with respect to the shear plane. These constraints areutilized to recalculate the friction on the shear plane (131 MPa at 300 MPa confiningpressure), its dependence on confining pressure and the cohesive strength (shear stressat zero sigma=39.8 MPa). The inset indicates the orientation of the stresses in torsionexperiments (simple shear) and the orientation of the strain localization plane (/=10°).

170 L. Caricchi et al. / Chemical Geology 256 (2008) 158–171
to 70, depending on the strain rate conditions (Llewellin and Manga,2005). Thus, this effect is of second order compared to the effect ofcrystals on magma viscosity. However, the presence of bubbles couldfavor strain localization and reduce the stresses required for stressweakening. Additional studies should address the important aspect ofthe combined effects of crystals and bubbles on the rheologicalbehavior of magmas.
7. Summary and implications for the eruptive dynamics
The presented data demonstrate that crystals induce a strongincrease of magma viscosity. The effects of crystals on magmarheology is strongly non-linear and depends on several factors suchas applied stress and crystal size distribution (Lejeune and Richet,1995; Costa, 2005; Caricchi et al., 2007). Combining our data oncrystal-bearing magma with those of the viscosity of variouslyhydrated Monte Nuovo liquids as provided by previous study(Giordano et al., 2004) we have estimated the increase of viscositydue to increasing crystallinity (Fig. 10). Our data confirm that thepresence of elongated feldspar crystals induces a stronger viscosityincrease with respect to magmatic suspensions containing sub-spherical particles (Fig.10). The collected data can be used to constrainthe control that rheology exerted on the change of the eruptive style ofMonte Nuovo.
The initial stages of eruption at Monte Nuovo started with theopening of the vent that occurred between September 29 and 30,1538
Fig. 15. a) Logarithmic value of the magma ascent velocity as a function of overpressureinside a volcanic conduit of 15 m radius. Bold lines illustrate the variation of the ascentvelocity for magmas containing 0, 47 and 52 vol.% crystals. The dashed and continuousthin lines represent the conditions for strain rate induced transition from viscous tobrittle deformation (shear weakening). b) Effusion rates as a function of overpressure.The presence of 52 vol.% crystals induces a strong increase of magma viscosity that, inturn, results in the stagnation of magma inside the volcanic conduit (strong decrease ofthe effusion rates). The shaded area designates conditions, where magmatic over-pressure will cause explosion (fragmentation) of the plug.
and was characterized by hydromagmatic activity producing theLower Member Deposits (DiVito et al., 1987; D'Oriano et al., 2005;Piochi et al., 2005). In the following two days, Strombolian activity andmore vigorous fire fountaining took place (Upper Member 1; D'Orianoet al., 2005). After two days of quiescence the activity renewed andended on the 6th of October with a violent explosive phase (UpperMember 2; D'Oriano et al., 2005). The crystal fraction ( ) of the eruptedmaterial increased from less than 0.2–0.3 in the Lower Member and inthe Upper Member 1 deposits to around 0.4–0.6 in the Upper Member2 (D'Oriano et al., 2005). The water content of the products eruptedduring the second stage of activity (measured in this study) was lowerwith respect to the material erupted during the first phreatomagmaticphase (Piochi et al., 2005).
During the first stage of magmatic activity about 90% of the totalvolume of discharged magma was erupted (D'Oriano et al., 2005),testifying a decrease of the overpressure in the magma chamber. Thedecrease of the ascent rate, due to decreasing overpressurization,favored degassing-induced crystallization (Cashman, 1992; Blundyand Cashman, 2005).
Some basic calculations were conducted to quantify the possibleeffects of increasing crystallization on the last, strongly explosiveeruption that concluded the activity of Monte Nuovo. The calculationswere carried out by considering a magma containing 1 wt.% ofdissolved H2O at a temperature of 800 °C and a conduit diameter of30 m. Three different volume contents of crystals were considered:0.00, 0.47 and 0.52, characterizing the first (0.00) and the seconderuptive phase (0.47 and 0.52) respectively (Fig. 15a, b).
The viscosity of the melt phase was computed with the equationproposed by Giordano et al. (2004). The apparent viscosity of thepartially crystallized magmas at 800 °C was calculated by multiplyingthe relative viscosity (measured at the highest experimental tem-perature: 630 °C and 700 °C for the material containing 47 vol.% and52 vol.% crystals respectively) by the viscosity of the melt phase at800 °C and 1 wt.% H2O. The variation of stress and viscosity for thepartially crystallized samples as a function of the applied strain ratehas been quantified using Eqs. (6) and (7) respectively (Brückner andDeubener, 1997):
τ �γð Þ ¼ η∞�γ þ τ0 1− exp − �γ= �γcð Þ½ � ð6Þ
ηapp�γð Þ ¼ η∞ þ τ0= �γð Þ 1− exp − �γ= �γcð Þ½ � ð7Þ
where τ is the shear stress, η∞ is the viscosity at infinite applied strainrate, γ is the shear stress, τ0 is the fictive yield strength (see inset Fig.11 and Brückner and Deubener, 1997), γc is the strain rate at the onsetof shear thinning (non-Newtonian behavior, 10−4 s−1 for Monte Nuovomagma), and ηapp is the apparent viscosity of the partially crystallizedsystem. The parameters of the equations have been obtained by fittingthe data of experiments PO765 and PO808 (bold line in Fig. 11), bothperformed at 630 °C. The shear strain rate along the conduit walls wascomputed as: 4Q /πr3 (Tuffen et al., 2003) where Q is the effusion rate(m3/s) and r is the conduit radius (15 m). The ascent velocity of themagma has been calculated as follows: overpressure/ηapp. Q wasobtained by multiplying the ascent velocity by the surface area of theconduit. Thus, each ascent velocity corresponds to an effusion rate,which in turn converts to a shear strain rate along the conduit walls.
The results of the computation indicate that at eruptive tempera-ture the transition fromviscous to brittle behavior would not occur forthe magmas tested in the experiments (Fig. 15a) for overpressures upto 10 MPa. On the other hand, the strong increase of viscosity due tothe higher crystallinity of the magma erupted in the second stage ofactivity, results in a significant decrease of the eruptive rate therebyfavoring the stagnation of magma in the volcanic conduit (Fig. 15b).The generation of a high a viscosity magma-plug inside the conduitwas most probably responsible for increasing pressurization (Melnik,2000). Considering the experimental data of Spieler et al. (2003), 5–
171L. Caricchi et al. / Chemical Geology 256 (2008) 158–171
7 MPa overpressure would be sufficient to fragment a magmacontaining about 40 vol.% of connected porosity (as measured in theMonte Nuovo products).
In conclusion, the change in the eruptive style during the last stageof the 1538 Monte Nuovo eruption is presumably related to the twodays of magma residence at low pressure inside the volcanic conduit.Degassing-induced crystallization produced a strong increase of theviscosity of magma leading to the formation of a plug clogging theconduit exit. The overpressure generated inside the plug couldultimately be responsible for the final vulcanian explosion thatterminated the Monte Nuovo eruption (D'Oriano et al., 2005; Taitet al., 1989; Spieler et al., 2003).
Acknowledgements
This project has been funded by the Swiss National ScienceFoundation (grants 200021-103845 and 200020-111852) and by theItalian Dipartimento della Protezione Civile in the frame of the 2004–2006 agreement Istituto Nazionale Geofisica e Vulcanologia INGV(project V3-2/UR17). We would like to acknowledge Monica Piochi forassistance in fieldwork. Eric Reusser is acknowledged for his supportwith electron microprobe analyses. We are grateful to Roberto Morettifor the handling of the manuscript during the review process. Themanuscript profited from the thoughtful comments and suggestionsby Hugh Tuffen and an anonymous reviewer.
References
Barnes, H.A., 1999. The yield stress – a review or ‘παmτα ρει’ – everything flows? JournalOf Non-Newtonian Fluid Mechanics 81 (1–2), 133–178.
Barnhoorn, A., Bystricky, M., Burlini, L., Kunze, K., 2004. The role of recrystallization onthe deformation behaviour of calcite rocks: large strain torsion experiments onCarrara marble. Journal of Structural Geology 26 (5), 885–903.
Behrens, H., Stuke, A., 2003. Quantification of H2O contents in silicate glasses using IRspectroscopy—a calibration based on hydrous glasses analyzed by Karl-Fishertitration. Glass Science Technology 76 (4), 176–189.
Blundy, J., Cashman, K., 2005. Rapid decompression-driven crystallization by meltinclusions from Mount St. Helens Volcano. Geology 33 (10), 793–796.
Bottinga, Y., 1994. Non-Newtonian rheology of homogeneous silicate melts. Physics andChemistry of Minerals 20, 454–459.
Brückner, R., Deubener, J., 1997. Description and interpretation of the two phase flowbehavior of melts with suspended crystals. Journal of Non-Crystalline Solids 209,283–291.
Caricchi, L., et al., 2007. Non-Newtonian rheology of crystal-bearing magmas andimplications for magma ascent dynamics. Earth and Planetary Science Letters 264,402–419.
Cashman, K.V., 1992. Groundmass crystallization of Mount St Helens dacite. 1980–86 —
a tool for interpreting shallowmagmatic processes. Contribution toMineralogy andPetrology 109, 431–449.
Chong, J.S., Christiansen, E.B., Baer, A.D., 1971. Rheology of concentrated suspensions.Journal of applied polymer science 15, 2007–2021.
Costa, A., 2005. Viscosity of high crystal content melts: dependence on solid fraction.Geophysical Research Letters 32 (22).
Costa, A., Melnik, O., Sparks, R.S.J., Voight, B., 2007. Control of magma flow in dykes oncyclic lava dome extrusion. Geophysical Research Letters 34, L02303, doi:10.1029/2006GL027466.
D'Oriano, C., et al., 2005. Changes in eruptive style during the AD 1538 Monte Nuovoeruption (Phlegrean Fields, Italy): the role of syn-eruptive crystallization. BulletinOf Volcanology 67 (7), 601–621.
Dekruif, C.G., Vanlersel, E.M.F., Vrij, A., Russel, W.B., 1985. Hard-sphere colloidaldispersions — viscosity as a function of shear rate and volume fraction. Journal OfChemical Physics 83 (9), 4717–4725.
Del Gaudio, P., Behrens, H., Deubener, J., 2007. Viscosity and glass transitiontemperature of hydrous float glass. Journal Of Non-Crystalline Solids 353 (3),223–236.
Deubener, J., Brückner, R., 1997. Influence of nucleation and crystallization on therheological properties of lithium disilicate melt. Journal of Non-Crystalline Solids209, 96–111.
Diller, K., Clarke, A.B., Voight, B., Neri, A., 2006. Mechanisms of conduit plug formation:implications for vulcanian explosions. Geophysical Research Letters 33 (20) 6 pp.-6 pp.
DiVito, M., Lirer, L., Mastrolorenzo, G., Rolandi, G., 1987. The 1538Monte Nuovo eruption(Campi Flegrei, Italy). Bulletin Of Volcanology 49, 608–615.
Giordano, D., Romano, C., Papale, P., Dingwell, D.B., 2004. The viscosity of trachytes, andcomparison with basalts, phonolites, and rhyolites. Chemical Geology 213, 49–61.
Gonnermann, H.M., Manga, M., 2007. The fluid mechanics inside a volcano. AnnualReview Of Fluid Mechanics 39, 321–356.
Holtzman, B.K., Groebner, N.J., Zimmerman, M.E., Ginsberg, S.B., Kohlstedt, D.L., 2003.Stress-driven melt segregation in partially molten rocks. Geochemistry Geophysicsand Geosystems 4 (5).
Holtzman, B.K., Kohlstedt, D.L., Morgan, J.P., 2005. Viscous energy dissipation and strainpartitioning in partially molten rocks. Journal of Petrology 46 (12), 2569–2592.
Koyaguchi, T., Mitani, N.K., 2005. A theoretical model for fragmentation of viscousbubbly magmas in shock tubes. Journal of Geophysical Research-Part B-Solid Earth110 (B10) 21 pp.-21 pp.
Krieger, G.I., 1972. Rheology of monodispersed lattices. Advances in Colloidal andInterfacial Science 3, 111–136.
Lange, R.A., 1996. Temperature independent thermal expansivities of sodiumaluminosilicate melts between 713 and 1835 K. Geochimica et CosmochimicaActa 60, 4989–4996.
Lange, R.A., 1997. A revised model for the density and thermal expansivity of K2O–Na2O–CaO–MgO–Al2O3–SiO2 liquids from 700 to 1900 K: extension to crustalmagmatic temperatures. Contributions to Mineralogy and Petrology 130, 1–11.
Lange, R.A., Carmichael, I.S.E., 1987. Densities of Na2O–K2O–CaO–MgO–FeO–Fe2O3–Al2O3–TiO2–SiO2 liquids — new measurements and derived partial molar proper-ties. Geochimica et Cosmochimica Acta 51, 2931–2946.
Lejeune, A.M., Richet, P., 1995. Rheology of crystal-bearing silicate melts: anexperimental study at high viscosities. Journal of Geophysical Research 100 (B3),4215–4229.
Leschik, M., et al., 2004. Determination of H2O and D2O contents in rhyolitic glasses.Physics and Chemistry of Glasses 45 (4), 238–251.
Llewellin, E.W., Manga, A., 2005. Bubble suspension rheology and implications forconduit flow. Journal of Volcanology and Geothermal Research 143 (1–3), 205–217.
Llewellin, E.W., Mader, H.M., Wilson, S.D.R., 2002. The constitutive equation and flowdynamics of bubbly magmas. Geophysical Research Letters 29 (24), 2170.
Maxwell, M.C., 1867. On the dynamical theory of gases. Royal Society of LondonPhilosophical Transactions 157, 49–88.
Melnik, O., 2000. Dynamics of two-phase conduit flow of high-viscosity gas-saturatedmagma: large variations of sustained explosive eruption intensity. Bullettin ofVolcanology 62, 153–170.
Melnik, O., Sparks, R.S.J., 1999. Nonlinear dynamics of lava dome extrusion. Nature 402,37–41.
Melnik, O., Barmin, A.A., Sparks, R.S.J., 2005. Dynamics of magma flow inside volcanicconduits with bubble overpressure buildup and gas loss through permeablemagma. Journal Of Volcanology And Geothermal Research 143 (1–3), 53–68.
Mohr, O., 1900. Which circumstances determine the elastic limit and the rupture of amaterial? Zeitschrift Des Vereines Deutscher Ingenieure 44, 1524–1530.
Ohnaka, M., 1995. A shear failure strength law of rock in the brittle–plastic transitionregime. Geophysical Research Letters 22 (1), 25–28.
Paterson, M.S., 1978. Experimental Rock Deformation—The Brittle Field, 13. Springer-Verlag, Berlin–Heidelberg–New York.
Paterson, M.S., Olgaard, D.L., 2000. Rock deformation tests to large shear strains intorsion. Journal of Structural Geology 22, 1341–1358.
Piochi, M., Mastrolorenzo, G., Pappalardo, L., 2005. Magma ascent and eruptiveprocesses from textural and compositional features of Monte Nuovo pyroclasticproducts, Campi Flegrei, Italy. Bulletin of Volcanology 67 (7), 663–678.
Piochi, M., Polacci, M., De Astis, G., Zanetti, A., Mangiacapra, A., Vannucci, R., Giordano,D., 2008. Texture and composition of pumices and scoriae from the campi flegreicaldera (italy): implications on the dynamics of explosive eruptions. Geochem.Geophys. Geosyst., vol. 9, p. Q03013, doi:10.1029/2007GC001746.
Romano, C., Mungall, J.E., Sharp, T., Dingwell, D.B., 1996. Tensile strengths of hydrousvesicular glasses: an experimental study. American Mineralogist 81 (9–10),1148–1154.
Rutter, E.H., Brodie, K.H., Irving, D.H., 2006. Flow of synthetic, wet, partially molten“granite” under undrained conditions: an experimental study. Journal of Geophy-sical Research-Part B-Solid Earth 111 (B6) 17 pp.-17 pp.
Rybacki, E., Dresen, G., 2004. Deformation mechanism maps for feldspar rocks.Tectonophysics 382 (3–4), 173–187.
Saar, M.O., Manga, M., Cashman, K.V., Fremouw, S., 2001. Numerical models of the onsetof yield strength in crystal–melt suspensions. Earth and Planetary Science Letters187, 367–379.
Spieler, O., Dingwell, D.B., Alidibirov, M., 2003. Magma fragmentation speed: anexperimental determination. Journal of Volcanology and Geothermal Research 129,109–123.
Tait, S.R., Vergniolle, S., Jaupart, C., 1989. Pressure, gas content and eruption periodicityof a shallow crystallizing magma chamber. Earth and Planetary Science Letters 92,107–123.
Tuffen, H., Dingwell, D.B., 2005. Fault textures in volcanic conduits: evidence for seismictrigger mechanisms during silicic eruptions. Bulletin of Volcanology 67, 370–387.
Tuffen, H., Dingwell, D.B., Pinkerton, H., 2003. Repeated fracture and healing of silicicmagma generate flow banding and earthquakes? Geology 31 (12), 1089–1092.
Webb, S.L., Dingwell, D.B., 1990. Non-newtonian rheology of igneous melts at highstresses and strain rate: experimental results for rhyolite, andesite, basalt, andnephelinite. Journal of Geophysical Research 95 (B10), 15695–15701.