
Feeding system and magma storage beneath Mt. Etna as revealed by recent inflation/deflation cycles
13
Feeding system and magma storage beneath Mt. Etna as revealed by recent inflation/deflation cycles Alessandro Bonforte, 1 Alessandro Bonaccorso, 1 Francesco Guglielmino, 1 Mimmo Palano, 1 and Giuseppe Puglisi 1 Received 17 August 2007; revised 29 December 2007; accepted 21 January 2008; published 16 May 2008. [1] Ground deformation at Mt. Etna detected by three GPS surveys carried out in 2004, 2005, and 2006 is analyzed. The data set encompasses the 2004–2005 eruptions and foreruns those of 2006. A wide deflation of the entire volcano was detected from 2004 to 2005, accompanying the 2004 – 2005 eruption; conversely an evident inflation phase, from 2005 to 2006, followed this eruption and preceded the 2006 one. In both cases, the deflation-inflation cycle was accompanied by a continuous seaward motion of the eastern flank. We inverted both data sets (2004–2005 deflation and 2005–2006 inflation) using an optimization algorithm based on the Genetic Algorithm (GA) in order to detect the ground deformation sources. The wide contraction measured during the eruption reveals the drainage of a sill-shaped magma reservoir located by data inversions at a depth of about 4.5 km b.s.l. The pressurizing source modeled for the 2005–2006 time interval indicates a refilling of the shallower near-vertical plumbing system of the volcano. This could indicate a change in the geometry of the feeding system, active after the 2004–2005 eruption, with a new and shallower magma storage that could have enabled the resumption of volcanic activity that was observed at summit craters in 2006. These results improve the imaging of the plumbing system of Mt. Etna volcano. Citation: Bonforte, A., A. Bonaccorso, F. Guglielmino, M. Palano, and G. Puglisi (2008), Feeding system and magma storage beneath Mt. Etna as revealed by recent inflation/deflation cycles, J. Geophys. Res., 113, B05406, doi:10.1029/2007JB005334. 1. Introduction [2] At Mount Etna, a dense GPS network (Figure 1) is measured periodically (once a year, at least) and consists of about seventy benchmarks. The time series of ground motion measurements made using this network began in 1988; from then on, its configuration has been improved so that it now covers the entire volcanic area [Bonforte and Puglisi, 2003], with particular emphasis on the eastern flank [Puglisi et al., 2004]. After the 1991 – 1993 lateral eruption, accompanied by a significant contraction of the measured network, a continuous and fairly constant inflation phase started as shown by the cumulative areal dilatation of the network (Figure 2a). This inflation phase culminated with the 2001 and 2002–2003 lateral eruptions. [3] After these eruptions, in the period 2003–2006, the volcano showed two interesting phenomena: (1) a renewal of an overall inflation marked by two further eruptions (2004 – 2005 and 2006) during which the volcano showed a deflation and (2) a constant and marked eastward sliding of the eastern flank of the volcano. [4] The 2004–2005 eruption was a passive eruption induced by the exceptional sliding rate of the eastern flank of the volcano [Bonaccorso et al., 2006]. The magma outpouring provoked a general deflation of the volcano, as was well testified by the contraction of the GPS network. After the end of the 2004–2005 eruption, the GPS network recorded a renewal of the inflation that led to the 2006 eruption. Besides the deflation-inflation sequence, the east- ern flank of the volcano showed an absolutely independent dynamics, being affected by a fairly constant seaward motion [see Bonforte and Puglisi, 2003, 2006; Puglisi and Bonforte, 2004; Bonaccorso et al., 2006; Palano et al., 2007]. In fact, all stations lying on this side of the volcano show similar displacements during the 2004 – 2005 and 2005 – 2006 intervals. Here, we present original data from the July 2004 – June 2006 time interval, encompassing the 2004 – 2005 lateral eruption (deflation phase) and pre- ceding the July – December 2006 eruption (inflation phase). We inverted and modeled the ground deformation pattern of these two phases in order to infer the storage sources and improve the imaging of the plumbing system of Etna. 2. Structural Setting [5] Mt. Etna volcano is located within a complex regional tectonic setting in northern Sicily involving a compressive N–S stress regime and an E–W extensional regime, ob- servable along the eastern coast of Sicily (see Bousquet and Lanzafame [2004] for an overall review). In addition, the eastern flank of the volcano shows an eastward, shallow, sliding movement, probably due to the interrelationship between gravity instability and magma intrusion [e.g., JOURNAL OF GEOPHYSICAL RESEARCH, VOL. 113, B05406, doi:10.1029/2007JB005334, 2008 1 Istituto Nazionale di Geofisica e Vulcanologia, Catania, Italy. Copyright 2008 by the American Geophysical Union. 0148-0227/08/2007JB005334$09.00 B05406 1 of 13
Transcript of Feeding system and magma storage beneath Mt. Etna as revealed by recent inflation/deflation cycles
Feeding system and magma storage beneath Mt. Etna as revealed by
recent inflation/deflation cycles
Alessandro Bonforte,1 Alessandro Bonaccorso,1 Francesco Guglielmino,1
Mimmo Palano,1 and Giuseppe Puglisi1
Received 17 August 2007; revised 29 December 2007; accepted 21 January 2008; published 16 May 2008.
[1] Ground deformation at Mt. Etna detected by three GPS surveys carried out in 2004,2005, and 2006 is analyzed. The data set encompasses the 2004–2005 eruptions andforeruns those of 2006. A wide deflation of the entire volcano was detected from 2004 to2005, accompanying the 2004–2005 eruption; conversely an evident inflation phase, from2005 to 2006, followed this eruption and preceded the 2006 one. In both cases, thedeflation-inflation cycle was accompanied by a continuous seaward motion of the easternflank. We inverted both data sets (2004–2005 deflation and 2005–2006 inflation) usingan optimization algorithm based on the Genetic Algorithm (GA) in order to detect theground deformation sources. The wide contraction measured during the eruption revealsthe drainage of a sill-shaped magma reservoir located by data inversions at a depth ofabout 4.5 km b.s.l. The pressurizing source modeled for the 2005–2006 time intervalindicates a refilling of the shallower near-vertical plumbing system of the volcano. Thiscould indicate a change in the geometry of the feeding system, active after the2004–2005 eruption, with a new and shallower magma storage that could have enabledthe resumption of volcanic activity that was observed at summit craters in 2006.These results improve the imaging of the plumbing system of Mt. Etna volcano.
Citation: Bonforte, A., A. Bonaccorso, F. Guglielmino, M. Palano, and G. Puglisi (2008), Feeding system and magma storage
beneath Mt. Etna as revealed by recent inflation/deflation cycles, J. Geophys. Res., 113, B05406, doi:10.1029/2007JB005334.
1. Introduction
[2] At Mount Etna, a dense GPS network (Figure 1) ismeasured periodically (once a year, at least) and consists ofabout seventy benchmarks. The time series of groundmotion measurements made using this network began in1988; from then on, its configuration has been improved sothat it now covers the entire volcanic area [Bonforte andPuglisi, 2003], with particular emphasis on the eastern flank[Puglisi et al., 2004]. After the 1991–1993 lateral eruption,accompanied by a significant contraction of the measurednetwork, a continuous and fairly constant inflation phasestarted as shown by the cumulative areal dilatation of thenetwork (Figure 2a). This inflation phase culminated withthe 2001 and 2002–2003 lateral eruptions.[3] After these eruptions, in the period 2003–2006, the
volcano showed two interesting phenomena: (1) a renewalof an overall inflation marked by two further eruptions(2004–2005 and 2006) during which the volcano showed adeflation and (2) a constant and marked eastward sliding ofthe eastern flank of the volcano.[4] The 2004–2005 eruption was a passive eruption
induced by the exceptional sliding rate of the eastern flankof the volcano [Bonaccorso et al., 2006]. The magma
outpouring provoked a general deflation of the volcano,as was well testified by the contraction of the GPS network.After the end of the 2004–2005 eruption, the GPS networkrecorded a renewal of the inflation that led to the 2006eruption. Besides the deflation-inflation sequence, the east-ern flank of the volcano showed an absolutely independentdynamics, being affected by a fairly constant seawardmotion [see Bonforte and Puglisi, 2003, 2006; Puglisiand Bonforte, 2004; Bonaccorso et al., 2006; Palano etal., 2007]. In fact, all stations lying on this side of thevolcano show similar displacements during the 2004–2005and 2005–2006 intervals. Here, we present original datafrom the July 2004–June 2006 time interval, encompassingthe 2004–2005 lateral eruption (deflation phase) and pre-ceding the July–December 2006 eruption (inflation phase).We inverted and modeled the ground deformation pattern ofthese two phases in order to infer the storage sources andimprove the imaging of the plumbing system of Etna.
2. Structural Setting
[5] Mt. Etna volcano is located within a complex regionaltectonic setting in northern Sicily involving a compressiveN–S stress regime and an E–W extensional regime, ob-servable along the eastern coast of Sicily (see Bousquet andLanzafame [2004] for an overall review). In addition, theeastern flank of the volcano shows an eastward, shallow,sliding movement, probably due to the interrelationshipbetween gravity instability and magma intrusion [e.g.,
JOURNAL OF GEOPHYSICAL RESEARCH, VOL. 113, B05406, doi:10.1029/2007JB005334, 2008
1Istituto Nazionale di Geofisica e Vulcanologia, Catania, Italy.
Copyright 2008 by the American Geophysical Union.0148-0227/08/2007JB005334$09.00
B05406 1 of 13
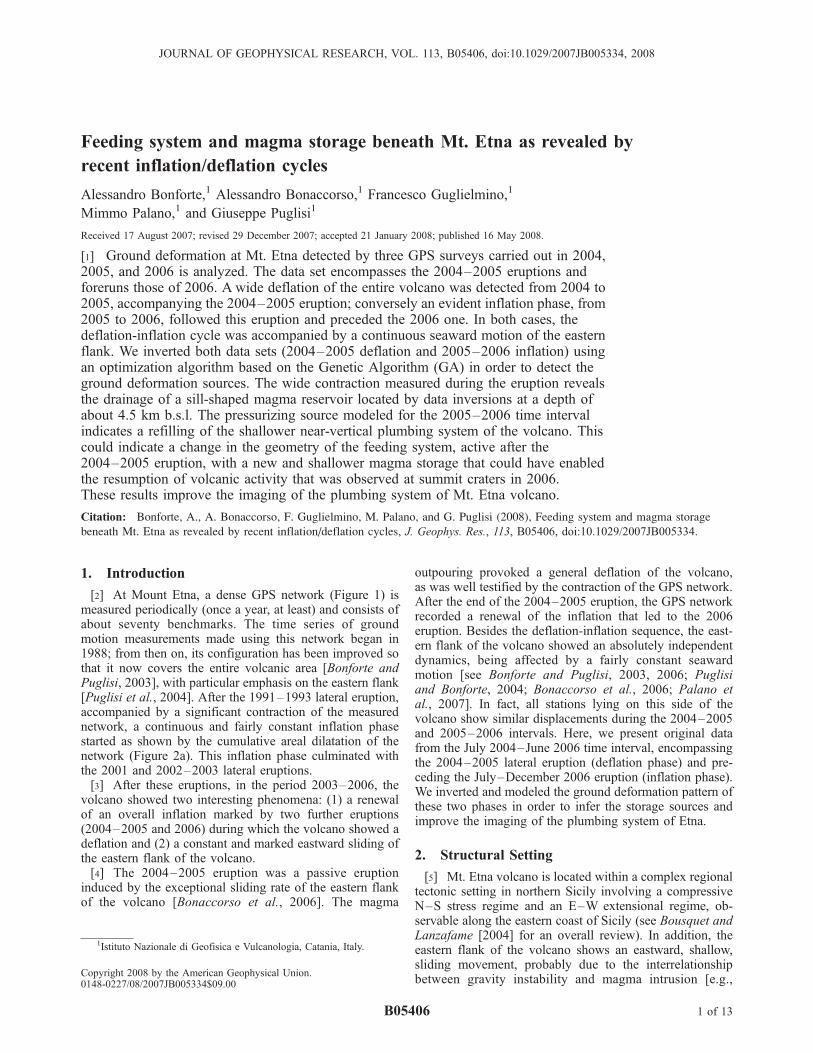
Borgia et al., 1992; Lo Giudice and Rasa, 1992; Rust andNeri, 1996; Bonforte and Puglisi, 2003, 2006; Rust et al.,2005]. The Pernicana fault system (Figure 1) represents thenorthern boundary of this unstable sector. Westward, thisfault joins the NE Rift, representing one of the most activevolcanic features (Figure 1). The southern part of thewestern boundary of the sector is demarcated by the S Rift[Rasa et al., 1996] joining, south-eastward, the Mascalucia-Tremestieri-Trecastagni fault system (Figure 1). This sectorof the volcano shows a greater complexity of flank motion,as revealed also by InSAR data [Borgia et al., 2000; Frogeret al., 2001; Lundgren et al., 2004]. This fault system ismade up of a number of NNW-SSE-striking faults showingevident right lateral displacement and is also characterizedby very shallow seismicity, with focal depths typically of1–2 km. It has been interpreted as the southern boundary ofthe sliding sector [Rasa et al., 1996].
3. Recent Eruptive Activity
3.1. The 2004–2005 Eruption
[6] After the 2002–2003 eruption, the volcano continuedto inflate and the eastern flank accelerated its downwardmovement toward the East [Bonaccorso et al., 2006]. On 7September 2004, volcanic activity resumed on Mt. Etna(Figure 2b) by the opening of an effusive vent at the base of
the SE summit crater (SEC) at about 3000 m above sea level(a.s.l.). In the following two days, the eruptive fissurepropagated downward toward the Valle del Bove (VdB)depression and the lava poured out inside this valley. Theeruption lasted until 12 March 2005 and, after three monthsof eruption, lava volumes were estimated between 18.5 and32 � 106 m3 [Burton et al., 2005]. This eruption onset wascompletely ‘‘silent’’ [Bonaccorso et al., 2006] in the sensethat there was no volcanic activity at the summit craters, nosignificant gas emission, no seismic tremor or seismicity(Figure 2c), no ground deformation which are usuallyobserved during intrusion processes. Bonaccorso et al.[2006] suggested that this peculiar eruption was caused bythe exceptional tension, created on the uppermost part of thevolcano by the high-rate of sliding of the eastern flank of thevolcano, which favored the opening of the fracture feedingthe magma drainage. Later on, the ground deformationrevealed a clear deflation during the course of the eruption(Figures 2a and 3), which will be analyzed in section 5.1.
3.2. The Eruptive Activity in 2006
[7] After the 2004 eruption, the ground deformationrecorded the onset of an inflation phase (Figures 2a and 4).Volcanic activity re-started at summit craters of Mt. Etnaduring the night of 14 July 2006, when a fissure opened onthe eastern flank of the SEC, with the same azimuth of the
Figure 1. Sketch map of Mt. Etna with main active faults and GPS network. 1: Pernicana fault; 2:‘‘Timpe’’ fault system; 3: Santa Venerina fault; 4: Mascalucia-Tremestieri-Trecastagni fault system; 5:Ragalna fault. Triangles and circles indicate permanent and periodically measured GPS stations,respectively. The area of the summit craters is detailed in the inset, where the lava flows are also reported;BN = Bocca Nuova, NEC = Northeast crater, VOR = Voragine, SEC= Southeast crater. The shadowedtriangle was used for computation of the areal dilatation of the western part of Mt. Etna. VdB, Valle delBove. Coordinates in UTM projection, zone 33N.
B05406 BONFORTE ET AL.: THE PLUMBING SYSTEM OF MT. ETNA FROM GPS
2 of 13
B05406
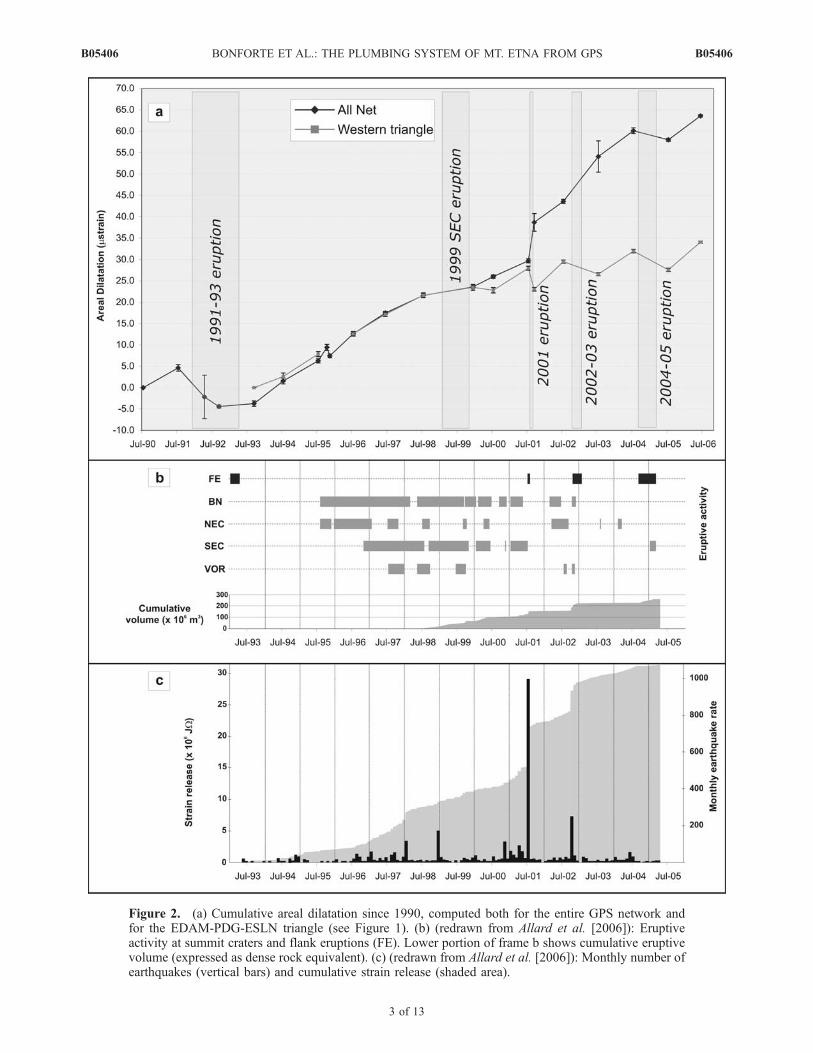
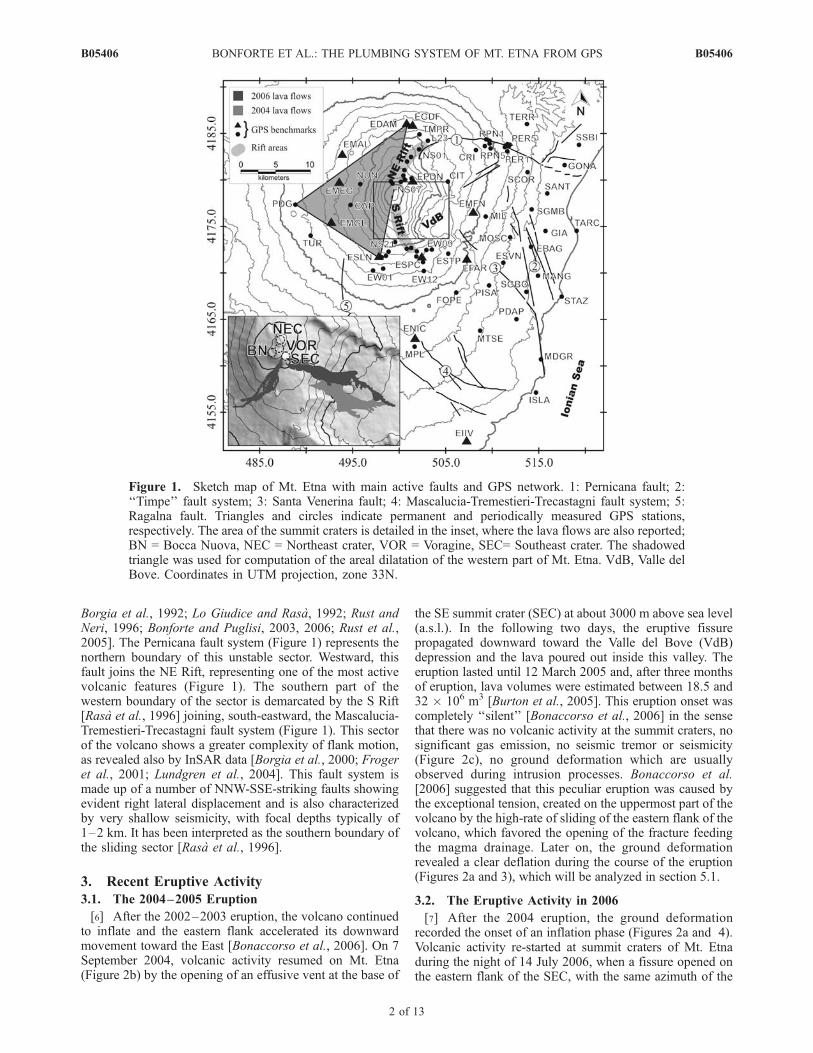
Figure 2. (a) Cumulative areal dilatation since 1990, computed both for the entire GPS network andfor the EDAM-PDG-ESLN triangle (see Figure 1). (b) (redrawn from Allard et al. [2006]): Eruptiveactivity at summit craters and flank eruptions (FE). Lower portion of frame b shows cumulative eruptivevolume (expressed as dense rock equivalent). (c) (redrawn from Allard et al. [2006]): Monthly number ofearthquakes (vertical bars) and cumulative strain release (shaded area).
B05406 BONFORTE ET AL.: THE PLUMBING SYSTEM OF MT. ETNA FROM GPS
3 of 13
B05406

2004 eruption. Three vents opened along the fissure field atabout 3000 m a.s.l., two of them emitting two lava flows(joining into one after a few hundred meters) propagatingeastward inside the VdB. Like the 2004 eruption, thiseruption onset was not accompanied by evident geophysicalparameter changes (seismicity and ground deformation re-lated to dyke intrusion and fissure opening), even if the 2006eruption was characterized by strong degassing from theuppermost vent, with strong Strombolian activity and, con-sequently, an increased tremor during the entire duration ofthe eruptive activity. This eruption lasted a little more thanone week, ending on 23 July 2006. The volcanic activityrestarted at SEC at the end of August 2006, with Strombolianactivity and the formation of new short lava flows expandingeastward for about 1 km; activity that lasted until midSeptember. A new eruptive fracture opened on 13 Octoberfrom the East base of the SEC, trending ESE-WNW andreaching an altitude of 2800 m a.s.l.; here, effusive activitystarted forming lava flows spreading eastward. Also thisfracture opened with no geophysical parameter changes, asa new fracture field formed on 26 October on the oppositeside of the SEC, involving also the southern flank of theBocca Nuova (BN) crater at 3050 m of altitude. Onlyepisodic increases in volcanic tremor accompanied the peri-ods characterized by more intense degassing and Strombo-lian activity at SEC. The eruption activity ended on 15December 2006.
4. GPS Data
[8] GPS surveys are carried out in static mode, withmeasurement sessions lasting from four to twenty-four hours(especially for the reference stations), and in semi-kinematicmode (stop-and-go) along two profiles crossing the upperpart of the volcano in N–S and E–W directions [Puglisi andBonforte, 2004; Bonforte et al., 2004]. All benchmarks alongthese profiles are self-centering (as most of the staticnetwork), to improve the measurement accuracy, and aremeasured twice, forward and backward, with 3-minuteoccupations. In 2005, the reference frame of the Mt. Etnanetwork was improved by the installation of new stations(CTNV, MONT, ECES) that allow 24-h sessions to becarried out during the entire duration of the survey. So,during the 2005 survey, both old and new reference stationswere measured; in 2006, only the new reference stationswere measured.[9] The data collected during the surveys, combined with
those coming from permanent stations, were processed inorder to obtain the vector components for each baseline. Thedata were processed using the L3 phase combination, forbaselines longer than 10 km, in order to eliminate the iono-spheric effect, and always using NGS (National GeodeticSurvey) antenna calibration models and precise ephemeredescomputed by the IGS (International Geodetic Service),adopting the usual procedure for the Etna network [Puglisiet al., 2001; Bonforte and Puglisi, 2003].[10] A free adjustment is performed after having pro-
cessed all (static and kinematic) GPS data. Finally, thenetwork is then fixed assuming an appropriate set ofcoordinates for the reference frame. The 2004 and 2005surveys were fixed to the same reference frame, through theEIIV, CES and ROC coordinates. A second adjustment
process was performed for the 2005 survey in order toobtain a precise set of coordinates for the new referencestations in the ITRF2000 frame, including NOT1, MATE,CAGL and LAMP IGS stations and fixing their positions atthe epoch 2005.6, calculated by using the IGS stationvelocities. Then, the 2006 survey solution is referred tothe same frame of the 2005 survey, by fixing the coordinatesof MONT, ECES and EIIV resulting from the 2005 secondadjustment. Final results of the processing are the stationcoordinates, with associated errors (2-sigma) of the order of3–4 mm for the horizontal components and 6–7 mm for thevertical one, for all three surveys. A complete list of themeasured displacements for the 2004–2005 and 2005–2006 periods is provided in Tables 1 and 2, respectively.
5. Ground Deformation Pattern
[11] The overall ground deformation pattern is well sum-marized by the areal dilatation of the network (Figure 2a).This is a parameter of the strain tensor, computed by using aleast squares algorithm based on the approach suggested byLivieratos [1980], which takes into account the strain cal-culated for all ellipsoid distances between GPS stations. Inorder to guarantee homogeneity in the strain tensor compu-tation over time and to exclude the bias due to the volcanosliding dynamics, the areal dilatation is calculated excludingmost of the benchmarks lying on the eastern flank. Inparticular, we excluded the stations initially belonging tothe ‘‘Ionica’’ network, [see Bonforte and Puglisi, 2006] thatwere included in the Mt. Etna GPS surveys since 2001.[12] A constant inflation phase is evident after the 1991–
1993 lateral eruption. This inflation shows a fairly constantrate until the beginning of the activity leading to the violentlateral 2001 and 2002– 2003 eruptions. The 2002–2003 eruption, characterized by two intrusions along the Sand NE Rifts (Figure 1), provoked an acceleration of arealdilatation. The main contribution to this came from the 2002NE dike, which induced bigger displacements and alsopushed the eastern flank, accelerating its sliding [Bonaccorsoet al., 2006; Bonforte et al., 2007b]. The first evidentcontraction episode, involving the entire GPS network,occurred only after the 2004–2005 eruption (Figure 2a).[13] In order to separately investigate the deformation of
the stable part of the volcano, unaffected by the slidingdynamics, the areal dilatation was computed also for theEDAM-PDG-ESLN triangle (see Figure 1 for benchmarksposition) covering the central-western area of the volcano.The areal dilatation of this triangle well matches the trend ofthe entire network until 1999, evidencing how the volcanowas affected by a uniform deformation (Figure 2a). Con-versely, Figure 2a illustrates the different behavior of thewestern side of the volcano since the beginning of the neweruptive phase marked by the 2001 eruption. In particular,the trend of the dilatation of the western flank clearly showscontraction due to the phase related to the deflation dueto the 2001 lava effusion and pressure discharge, whilethe dilatation of the whole network is greatly affected by theflank instability triggered by the intrusions that force thevolcano to spread laterally toward the east and southamplifying the overall dilatation.
B05406 BONFORTE ET AL.: THE PLUMBING SYSTEM OF MT. ETNA FROM GPS
4 of 13
B05406
5.1. 2004–2005 Deflating Phase
[14] By comparing the coordinates resulting from 2004and 2005 surveys, we can analyze the ground deformationaccompanying the entire 2004–2005 eruption; 3D displace-ments were obtained and are shown in Figure 3a. While thehorizontal displacements are reported by vectors at eachstation, the vertical motions measured at each station areinterpolated across the area, but constrained by the knownmain faults, as discontinuities in the gridding process. Theresulting pattern reveals a volcano-wide deflation. Amarked radial (centripetal) pattern of the displacementvectors is evident from Figure 3a on the western, southernand northern flanks of the volcano, where horizontal dis-placements of about 3 cm are detected, decreasing fromhigher to lower altitude. This radial pattern is disturbed onlyon the NE Rift, where the GPS stations show a generalsoutheastward motion, as does the entire eastern flank of thevolcano. All this sector of Mt. Etna, as previously detectedfrom GPS data by Bonforte and Puglisi [2003], shows anindependent behavior, with an overall seaward motion. Theabrupt decay of the displacements on the northern part alongthe Pernicana fault confirms the key role played by thisstructure in decoupling the sliding sector from the stablepart of the volcano. The magnitude of the horizontaldisplacements apparently decreases from more than 6 cmalong the coastline to almost zero on the upper part of theeastern flank and this gradient could be due to the strongereffect of the contraction in the central part of the volcanothat on this flank acts in the opposite direction to that of thesliding. The different motion affecting the stations lying ondifferent sides of the main faults on the eastern flankconfirms the segmentation of this sector of the volcano into
several blocks, as inferred by Walter et al. [2005] fromgeological data, showing different deformation styles andvelocities, and confirming the patterns detected by Bonforteand Puglisi [2006] from geodetic data. In synthesis, theperiod astride the 2004–2005 event shows a contractionassociated with the eruption and a continuous and indepen-dent sliding movement of the eastern sector.
5.2. 2005–2006 Inflating Phase
[15] By comparing the 2005 and 2006 GPS surveys(Figure 3b), the ground deformation following the 2004–2005 eruption and preceding the resumption of activity in2006 can be studied. It is evident that this is a rechargingphase where the volcano began to inflate, showing anopposite ground deformation pattern to that detected forthe previous year. In fact, a radial (centrifugal) pattern of thehorizontal displacements from a center located very close tothe summit craters, on their northern sector, is clearlyvisible. The height variations show a general uplift of theedifice, with a maximum of about 8 cm on the uppermostnortheastern flank. Conversely, the eastern flank continuesto show a significant seaward motion, with displacementsup to 5 cm along the coastline. As for the previous year, thedisplacement vectors on this side of the volcano generallyincrease from south to north, reaching a maximum of morethan 8 cm along the Pernicana fault, but the pattern of thedeformation is quite different from the previous compari-son. In fact, the horizontal motion is much stronger on thenorthernmost part of the sliding flank; conversely, thelowermost stations show smaller displacements and anopposite vertical motion with respect to the previous year.In addition, the north-easternmost block shows an anoma-lous uplift (more than 8 cm) and a horizontal motion similar
Figure 3. Displacement vectors and height variations from the comparison between (a) July 2004–July2005 and (b) July 2005–June 2006. The arrows represent the horizontal displacement vectors, while thevertical displacement is presented by a color map obtained by interpolating the measurements relevant toeach benchmark. The values are gridded by taking into account the main known faults as discontinuitiesin the interpolation. The error ellipses of the displacements calculated at the confidence interval of 95%are in the order of a few millimeters, and for this reason they are not shown in the figures.
B05406 BONFORTE ET AL.: THE PLUMBING SYSTEM OF MT. ETNA FROM GPS
5 of 13
B05406

Table 1. Displacements Measured From 2004 to 2005a
Station Long. Lat. East North Up Err. East Err. North Err. Up Inverted
CAP 494784 4177300 0.028 �0.005 �0.032 0.001 0.001 0.003 XCAS 523288 4191440 �0.002 0.001 0.034 0.002 0.002 0.007CES 474743 4188987 0.000 0.000 0.000 Fixed Fixed FixedCIT 505242 4179808 0.007 �0.014 �0.016 0.001 0.001 0.005 XCRI 508252 4183202 0.040 �0.022 �0.012 0.002 0.002 0.006CRP 480290 4164968 �0.010 0.003 �0.041 0.003 0.003 0.006EBAG 514170 4172804 0.041 �0.028 0.012 0.001 0.001 0.004 XEDAM 500818 4185976 0.001 �0.020 0.018 0.001 0.001 0.004 XEFAR 507276 4171590 0.004 �0.001 0.012 0.001 0.001 0.003 XEMAL 493939 4182689 0.012 �0.015 0.009 0.001 0.001 0.003 XEMEG 493585 4179668 0.024 �0.010 �0.016 0.001 0.001 0.003 XEMFN 507942 4176492 0.007 �0.018 �0.004 0.001 0.001 0.004 XEMGL 492816 4175439 0.024 0.004 �0.045 0.001 0.001 0.003 XENIC 501734 4162974 0.006 0.006 0.003 0.001 0.001 0.002 XEPDN 501478 4179831 0.011 �0.016 �0.088 0.001 0.002 0.004ESPC 502417 4171701 0.007 0.011 �0.006 0.001 0.001 0.003 XESTP 505280 4172062 0.002 �0.003 0.021 0.001 0.001 0.004 XESVN 511199 4171089 0.012 �0.012 0.005 0.001 0.001 0.005 XEW01 498296 4170453 0.009 0.016 �0.034 0.004 0.004 0.009 XEW02 498592 4171824 0.003 0.023 �0.030 0.005 0.006 0.012 XEW03 498134 4171672 0.004 0.031 �0.076 0.004 0.004 0.008EW04 498876 4172278 0.014 0.018 �0.043 0.005 0.006 0.011 XEW05 500827 4172590 0.004 0.021 �0.061 0.006 0.006 0.014 XEW06 501303 4172684 �0.001 0.037 �0.067 0.007 0.007 0.013 XEW07 501908 4172296 0.021 �0.025 0.047 0.018 0.015 0.037EW08 502933 4172455 �0.019 0.012 �0.018 0.007 0.007 0.011 XEW09 503520 4172506 �0.020 0.015 �0.019 0.006 0.006 0.010 XEW10 501860 4171758 0.000 0.020 �0.046 0.008 0.007 0.015 XEW11 502572 4171155 0.003 0.012 �0.008 0.006 0.006 0.013 XEW12 502658 4170200 0.002 0.007 0.015 0.006 0.006 0.010 XFOPE 506145 4167883 0.003 0.003 0.012 0.002 0.002 0.005 XGIA 515723 4174501 0.054 �0.035 0.063 0.003 0.003 0.007GONA 517774 4181581 0.011 �0.007 0.030 0.002 0.002 0.006 XINGV 507254 4151854 0.000 0.000 0.000 Fixed Fixed Fixed XISLA 514706 4157124 0.032 �0.010 0.023 0.001 0.001 0.003L23 503092 4184205 0.008 �0.027 �0.034 0.002 0.002 0.005 XLAM 501013 4185857 0.002 �0.019 �0.003 0.003 0.003 0.006 XMANG 514920 4169690 0.028 �0.024 0.000 0.002 0.002 0.006 XMDGR 515243 4160699 0.047 �0.009 �0.027 0.001 0.001 0.005MIL 509309 4176053 0.006 �0.038 0.002 0.001 0.001 0.006 XMOSC 511928 4173822 0.013 �0.031 0.001 0.002 0.002 0.007 XMPL 501671 4162063 0.005 �0.001 �0.011 0.002 0.002 0.004 XMTSE 508704 4163780 0.016 0.002 �0.019 0.002 0.002 0.005 XNS01 502153 4183269 0.014 �0.023 �0.047 0.004 0.004 0.008NS02 501283 4182458 0.019 �0.029 �0.052 0.004 0.004 0.007NS03 500860 4181959 0.016 �0.031 �0.071 0.004 0.004 0.008NS05 500575 4181049 0.021 �0.024 �0.114 0.004 0.004 0.007NS06 500462 4180451 0.018 �0.008 �0.122 0.004 0.004 0.008NS07 500609 4180037 0.014 �0.020 �0.116 0.004 0.004 0.010NS08 500188 4179785 0.035 �0.004 �0.109 0.005 0.005 0.012NS09 499284 4179619 0.031 �0.008 �0.085 0.004 0.005 0.010NS21 499579 4173308 0.008 0.030 �0.073 0.001 0.002 0.004 XNUN 495831 4179544 0.029 �0.018 �0.034 0.001 0.001 0.004 XOBS 501344 4180163 0.017 �0.006 �0.036 0.004 0.004 0.008 XPDAP 512604 4165017 0.013 �0.019 0.014 0.002 0.002 0.005 XPDG 488867 4177329 0.008 �0.006 �0.010 0.001 0.001 0.003 XPER1 511618 4183057 0.038 �0.037 0.034 0.001 0.001 0.005PER2 511359 4183505 0.038 �0.024 0.017 0.003 0.003 0.006PER3 511780 4183595 0.012 �0.009 0.030 0.003 0.003 0.006PER4 511894 4183775 �0.005 �0.003 0.037 0.003 0.003 0.006PER5 511632 4183833 �0.005 �0.005 0.041 0.003 0.003 0.006PER6 511529 4183719 �0.004 �0.009 0.023 0.003 0.003 0.006PISA 509666 4168643 0.008 �0.003 0.014 0.002 0.002 0.006 XPLU 499117 4179836 0.036 �0.010 �0.116 0.006 0.006 0.013ROC 500461 4200342 0.000 0.000 0.000 Fixed Fixed FixedRPN1 509697 4184197 �0.001 �0.011 �0.003 0.003 0.003 0.006RPN2 509349 4184345 0.002 �0.009 �0.005 0.003 0.003 0.006RPN3 509211 4183626 0.042 �0.026 �0.014 0.003 0.003 0.006RPN4 509727 4183889 0.041 �0.027 0.002 0.003 0.003 0.006RPN5 509827 4183375 0.046 �0.022 �0.019 0.003 0.003 0.006SANT 515920 4178538 0.043 �0.030 0.012 0.003 0.003 0.006 XSCOR 513800 4180818 0.060 �0.037 0.011 0.002 0.002 0.006SGBO 513674 4167958 0.020 �0.018 0.018 0.001 0.001 0.004 X
B05406 BONFORTE ET AL.: THE PLUMBING SYSTEM OF MT. ETNA FROM GPS
6 of 13
B05406

to that of the closer southern stations. Even this patternresults from the motion of only one station (GONA) lying inthis block. It is unlikely to be due to measurement errorsespecially for the horizontal component, thanks to the self-centering benchmarks that avoid station setup errors; fur-thermore, each station is usually measured at least twiceduring a GPS survey. The motion of this station in thisperiod could reasonably be due to the stronger displace-ments affecting the northernmost part of the sliding flank(along the Pernicana fault). Furthermore, while in 2004–2005 the displacements along the Pernicana fault show thesame ESE azimuth of its easternmost segment, in 2005–2006 they show a more pronounced eastward component,toward the fault. In this frame, the motion of the northeast-ern flank causes a compression on the WNW-ESE branch ofthe fault, pushing the triangular block that behaves like a‘‘flower structure’’, as already described by Bonforte et al.[2007a], and forcing it to move and uplift. Finally, theincrease of the displacements toward the upper part of theeastern flank in 2005–2006 is imputable to the inflation ofthe volcano.
6. Data Inversion and Modeling
[16] The 2004–2005 GPS observations on Mt. Etna showa centripetal contraction of the western flank and anindependent southeast movement of the eastern sector,requires a combination of two processes: a deflation due tothe contracting magma body and sliding of the eastern flank.[17] The 2004–2005 GPS observations on Mt. Etna, that
show a centripetal contraction of the western flank and anindependent southeast movement of the eastern sector,suggest a combination of two processes.[18] Conversely, the ground deformation pattern of the
2005–2006 period shows a dilating phase where the vol-cano restarted to inflate, also accompanied by the south-eastward motion of the eastern flank.[19] For this reason, we have chosen to model each of
these two periods with two different ground deformationsources: the first source was an Okada [1985] dislocationplane beneath the eastern flank common to both periods,and the second one was a Davis [1986] point-pressurizedcavity of ellipsoidal shape, arbitrarily oriented in the half-space, to model the opposite deflation-inflation mechanismacting during the 2004–2005 and 2005–2006 periodsrespectively.[20] We fixed the position and geometry of the disloca-
tion plane to those found by Bonaccorso et al. [2006] whoinverted GPS data from 2003–2004 time interval in order tomake the resulting kinematics comparable to that affectingthe volcano in the previous year.
[21] We inverted both GPS motion data sets (2004–2005and 2005–2006) using an optimization algorithm imple-mented by Nunnari et al. [2005] based on the GeneticAlgorithm (GA).[22] GA is generally better suited than typical gradient-
based techniques to find global minima for non-linearoptimization problems with many variables. Starting withan initial range of models, the GA progressively modifiesthe solution by incorporating the evolutionary behavior of‘‘biological’’ systems [e.g., Tiampo et al., 2004]. The searchprocess is stopped when d = 99% or when the maximumnumber of generation model (in our case 100000) isachieved. The goodness of each solution is measured bythe index of agreement (d)
d ¼ 1�
PN
i¼l
ðPi � OiÞ2
PN
i¼l
Pi � �Oj j þ Oi � �Oj jð Þ2
where N represents the number of measured points, Oi andPi the observed and predicted values, respectively, and �Otheir mean values [Nunnari et al., 2005].[23] We inverted our data sets, searching for both pressure
and planar sources together in a homogeneous elastic half-space. In this way, the inversion process was able to searchthe global minimum by adjusting all parameters of bothsources simultaneously.
6.1. The 2004–2005 Data Set
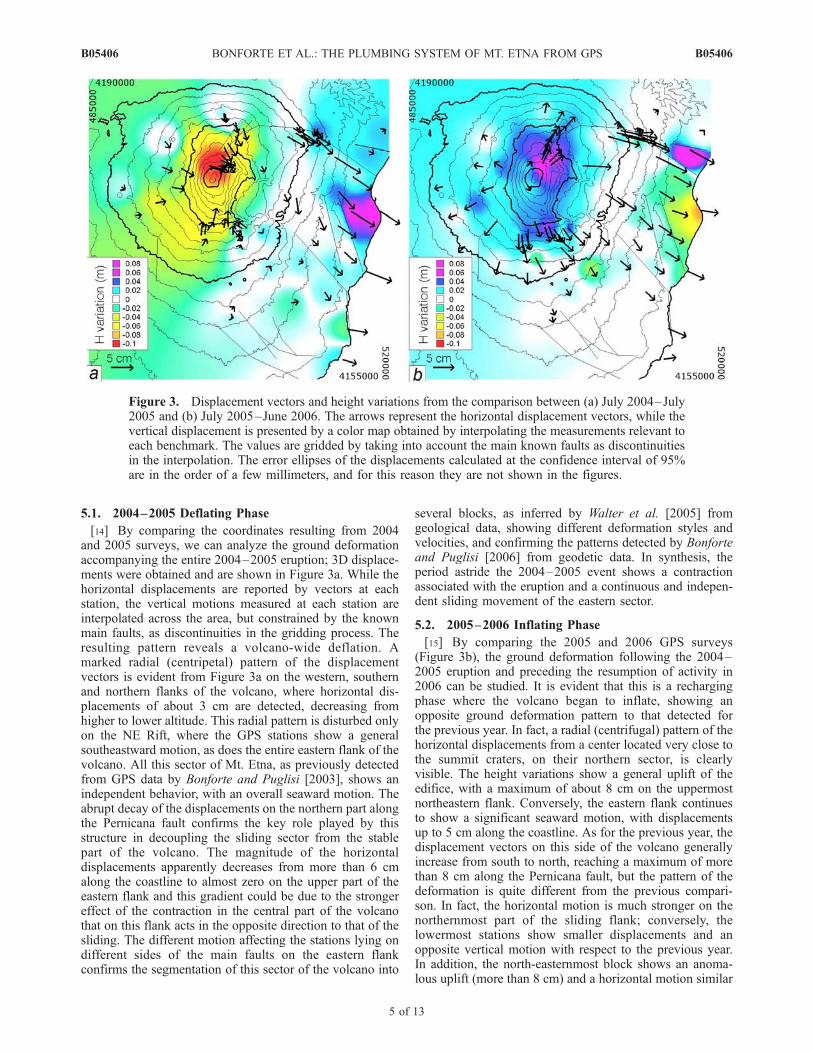
[24] A preliminary search was performed using the whole3-D displacement data set, but the large residuals observedon the NE Rift zone and on many of the easternmoststations of the network suggested excluding these pointsfrom the inversion procedure because the local structuralframework probably caused the observed anomalous defor-mation. Thus the inverted data set comprised 44 bench-marks. The search grid parameters and results of the GAsearch are summarized in Table 3. The solution convergedto a final fitness value of 84%, and the final result is inagreement with the effect produced by a deflating sourceelongated horizontally and located SE of the summit cratersat a depth of ~4.5 km below sea level (SX = 500701 m, SY =4175402 m, in UTM reference frame; SZ = 4562 m b.s.l.),with the semi-major axis length, a, comparable to that of theb axis, and semi axis c about 1/10 that of a. The three Eulerangles (indicating the ellipsoid orientation) show that theellipsoid dips about 26� toward NW (see Figure 4a).[25] The model sliding plane has normal and dextral
components of movement of 2.7 and 2.5 cm respectively.
Station Long. Lat. East North Up Err. East Err. North Err. Up Inverted
SGMB 514240 4176820 0.036 �0.041 0.038 0.002 0.002 0.007 XSSBI 519327 4183763 0.008 0.006 0.029 0.003 0.003 0.007STAZ 517466 4167441 0.059 �0.023 0.016 0.001 0.001 0.005TARC 519072 4174522 0.046 �0.030 0.072 0.001 0.002 0.006TERR 513733 4185997 �0.002 0.001 0.024 0.001 0.001 0.006TMPR 502194 4184888 0.004 �0.023 0.008 0.002 0.002 0.005 XTUR 490508 4174002 0.013 0.001 �0.031 0.001 0.001 0.004 X
aUnits in meters. Coordinates are in UTM projection, zone 33N. 2-sigma errors are also reported. The ‘‘X’’ in the last column indicates that the motion ofstation was used in the inversion.
Table 1. (continued)
B05406 BONFORTE ET AL.: THE PLUMBING SYSTEM OF MT. ETNA FROM GPS
7 of 13
B05406

Table 2. Displacements Measured From 2005 to 2006a
Station Long. Lat. East North Up Err. East Err. North Err. Up Inverted
CAP 494784 4177300 �0.027 �0.010 0.016 0.001 0.001 0.002 XCIT 505242 4179808 0.066 �0.004 0.024 0.002 0.002 0.005 XCRI 508252 4183203 0.072 �0.021 0.001 0.002 0.002 0.004CTNV 474654 4161001 �0.001 0.007 0.008 0.001 0.001 0.003 XEARS 495519 4168537 �0.008 �0.030 0.005 0.001 0.001 0.003 XEBAG 514170 4172804 0.030 �0.020 �0.009 0.001 0.001 0.001 XECES 475144 4188721 0.000 0.000 0.000 Fixed Fixed FixedECNL 499733 4169033 0.020 �0.039 �0.030 0.001 0.001 0.002 XECPN 498812 4177383 0.006 �0.010 0.025 0.001 0.001 0.001 XEDAM 500818 4185976 0.005 0.023 0.011 0.001 0.001 0.001 XEFAR 507276 4171590 0.021 �0.022 �0.001 0.001 0.001 0.001 XELEO 515207 4171699 0.037 �0.018 �0.014 0.001 0.001 0.002 XEMAL 493939 4182689 �0.007 0.014 0.004 0.001 0.001 0.002 XEMEG 493585 4179668 �0.021 0.003 0.012 0.001 0.001 0.001 XEMFN 507942 4176492 0.043 �0.029 0.001 0.001 0.001 0.001 XEMGL 492816 4175439 �0.027 �0.015 0.038 0.001 0.001 0.001 XEMIR 495213 4173307 �0.028 �0.034 0.018 0.001 0.001 0.003 XEMSL 498778 4167212 0.000 �0.027 0.008 0.001 0.001 0.004 XENIC 501734 4162974 0.005 �0.014 �0.002 0.001 0.001 0.001 XEPDN 501478 4179831 0.029 0.022 0.037 0.001 0.001 0.001 XEPEL 503358 4165274 0.009 �0.014 0.010 0.001 0.001 0.003 XEPLU 498743 4179754 0.011 0.009 0.027 0.001 0.001 0.001 XESLN 497737 4171800 0.001 �0.036 0.015 0.001 0.001 0.002 XESPC 502417 4171701 0.013 �0.018 0.004 0.001 0.001 0.001 XESTP 505280 4172062 0.017 �0.014 �0.009 0.001 0.001 0.003 XESVN 511199 4171089 0.018 �0.025 0.000 0.001 0.001 0.004 XETAR 502729 4168544 0.010 �0.020 0.001 0.001 0.001 0.004 XEVRS 491489 4170313 �0.015 �0.014 0.007 0.001 0.001 0.003 XEW01 498296 4170453 0.010 �0.041 0.026 0.003 0.003 0.006 XEW02 498592 4171824 0.011 �0.038 0.035 0.004 0.005 0.009 XEW03 498134 4171672 0.004 �0.044 0.048 0.005 0.005 0.010 XEW04 498876 4172278 0.000 �0.042 0.042 0.005 0.006 0.011 XEW05 500827 4172590 0.012 �0.035 0.051 0.006 0.006 0.011 XEW06 501303 4172684 0.011 �0.030 0.052 0.004 0.005 0.010 XEW07 501908 4172296 0.019 �0.028 0.039 0.007 0.008 0.013 XEW08 502933 4172455 0.019 �0.028 0.011 0.005 0.006 0.009 XEW09 503520 4172506 0.038 �0.040 0.048 0.007 0.009 0.014 XEW10 501860 4171758 0.011 �0.017 0.043 0.009 0.008 0.022 XEW11 502572 4171155 0.030 �0.027 0.012 0.007 0.007 0.017 XEW12 502658 4170200 0.030 �0.031 0.023 0.005 0.005 0.010 XFOPE 506145 4167883 0.013 �0.021 �0.033 0.001 0.001 0.004 XGIA 515723 4174501 0.036 �0.012 �0.037 0.002 0.002 0.007 XGONA 517774 4181581 0.056 �0.031 0.084 0.001 0.001 0.006INGV 507254 4151854 0.000 0.000 0.000 Fixed Fixed Fixed XISLA 514706 4157124 0.029 0.004 0.000 0.001 0.001 0.002 XL23 503093 4184205 0.024 0.025 0.035 0.002 0.002 0.004 XMANG 514920 4169690 0.032 �0.019 �0.017 0.002 0.002 0.005 XMDGR 515243 4160699 0.041 �0.018 0.001 0.002 0.002 0.006 XMIL 509310 4176053 0.043 �0.030 0.000 0.001 0.001 0.005 XMONT 501231 4208427 0.000 0.000 0.000 Fixed Fixed FixedMOSC 511928 4173822 0.030 �0.029 �0.016 0.001 0.001 0.005 XMPL 501671 4162063 0.003 �0.013 �0.005 0.001 0.001 0.004 XNS01 502153 4183269 0.022 0.022 0.035 0.004 0.004 0.008 XNS02 501283 4182458 0.023 0.039 0.046 0.005 0.005 0.010 XNS03 500860 4181959 0.025 0.040 0.055 0.004 0.005 0.010 XNS05 500575 4181049 0.017 0.038 0.041 0.005 0.005 0.011 XNS06 500462 4180451 0.016 0.036 0.070 0.006 0.006 0.012 XNS07 500610 4180037 0.015 0.033 0.082 0.006 0.006 0.013 XNS21 499579 4173308 0.014 �0.037 0.032 0.002 0.002 0.004 XNUN 495831 4179544 �0.018 0.013 0.037 0.001 0.001 0.004 XOBS 501344 4180163 0.027 0.030 0.080 0.003 0.003 0.005 XPDAP 512604 4165017 0.021 �0.019 �0.001 0.001 0.001 0.004 XPDG 488867 4177329 �0.019 �0.005 0.018 0.001 0.001 0.002 XPER1 511618 4183057 0.075 �0.032 �0.025 0.002 0.002 0.004PER2 511359 4183505 0.074 �0.032 �0.008 0.003 0.003 0.004PER3 511780 4183595 0.035 0.002 0.003 0.003 0.003 0.005PER4 511894 4183775 0.009 0.003 0.008 0.003 0.003 0.005PER5 511632 4183833 0.009 0.003 �0.019 0.003 0.003 0.005PER6 511529 4183719 0.007 0.007 0.007 0.003 0.003 0.005PISA 509666 4168643 0.023 �0.020 �0.010 0.002 0.002 0.006 XRPN1 509697 4184197 0.000 0.006 0.017 0.003 0.003 0.006RPN2 509349 4184345 0.001 0.012 0.007 0.003 0.003 0.005RPN3 509211 4183626 0.083 �0.019 0.013 0.003 0.003 0.006
B05406 BONFORTE ET AL.: THE PLUMBING SYSTEM OF MT. ETNA FROM GPS
8 of 13
B05406
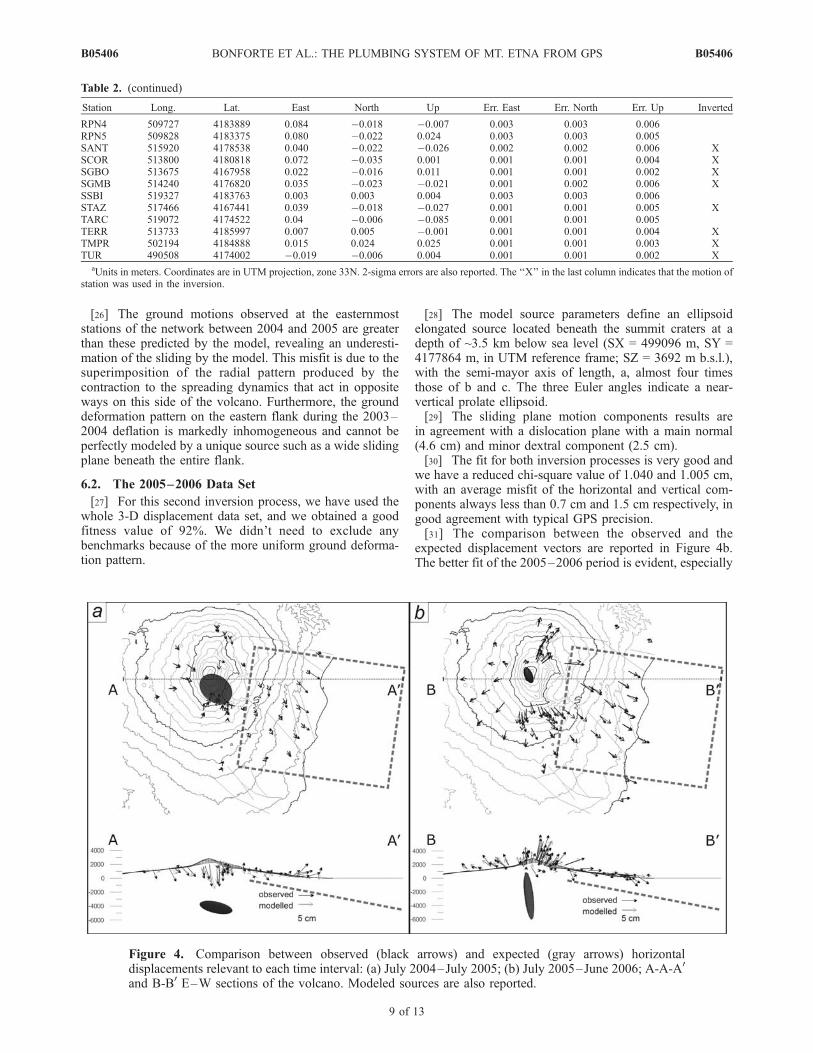
[26] The ground motions observed at the easternmoststations of the network between 2004 and 2005 are greaterthan these predicted by the model, revealing an underesti-mation of the sliding by the model. This misfit is due to thesuperimposition of the radial pattern produced by thecontraction to the spreading dynamics that act in oppositeways on this side of the volcano. Furthermore, the grounddeformation pattern on the eastern flank during the 2003–2004 deflation is markedly inhomogeneous and cannot beperfectly modeled by a unique source such as a wide slidingplane beneath the entire flank.
6.2. The 2005–2006 Data Set
[27] For this second inversion process, we have used thewhole 3-D displacement data set, and we obtained a goodfitness value of 92%. We didn’t need to exclude anybenchmarks because of the more uniform ground deforma-tion pattern.
[28] The model source parameters define an ellipsoidelongated source located beneath the summit craters at adepth of ~3.5 km below sea level (SX = 499096 m, SY =4177864 m, in UTM reference frame; SZ = 3692 m b.s.l.),with the semi-mayor axis of length, a, almost four timesthose of b and c. The three Euler angles indicate a near-vertical prolate ellipsoid.[29] The sliding plane motion components results are
in agreement with a dislocation plane with a main normal(4.6 cm) and minor dextral component (2.5 cm).[30] The fit for both inversion processes is very good and
we have a reduced chi-square value of 1.040 and 1.005 cm,with an average misfit of the horizontal and vertical com-ponents always less than 0.7 cm and 1.5 cm respectively, ingood agreement with typical GPS precision.[31] The comparison between the observed and the
expected displacement vectors are reported in Figure 4b.The better fit of the 2005–2006 period is evident, especially
Table 2. (continued)
Station Long. Lat. East North Up Err. East Err. North Err. Up Inverted
RPN4 509727 4183889 0.084 �0.018 �0.007 0.003 0.003 0.006RPN5 509828 4183375 0.080 �0.022 0.024 0.003 0.003 0.005SANT 515920 4178538 0.040 �0.022 �0.026 0.002 0.002 0.006 XSCOR 513800 4180818 0.072 �0.035 0.001 0.001 0.001 0.004 XSGBO 513675 4167958 0.022 �0.016 0.011 0.001 0.001 0.002 XSGMB 514240 4176820 0.035 �0.023 �0.021 0.001 0.002 0.006 XSSBI 519327 4183763 0.003 0.003 0.004 0.003 0.003 0.006STAZ 517466 4167441 0.039 �0.018 �0.027 0.001 0.001 0.005 XTARC 519072 4174522 0.04 �0.006 �0.085 0.001 0.001 0.005TERR 513733 4185997 0.007 0.005 �0.001 0.001 0.001 0.004 XTMPR 502194 4184888 0.015 0.024 0.025 0.001 0.001 0.003 XTUR 490508 4174002 �0.019 �0.006 0.004 0.001 0.001 0.002 X
aUnits in meters. Coordinates are in UTM projection, zone 33N. 2-sigma errors are also reported. The ‘‘X’’ in the last column indicates that the motion ofstation was used in the inversion.
Figure 4. Comparison between observed (black arrows) and expected (gray arrows) horizontaldisplacements relevant to each time interval: (a) July 2004–July 2005; (b) July 2005–June 2006; A-A-A0
and B-B0 E–W sections of the volcano. Modeled sources are also reported.
B05406 BONFORTE ET AL.: THE PLUMBING SYSTEM OF MT. ETNA FROM GPS
9 of 13
B05406
in the eastern part of the network where the inhomogeneouspattern during 2004–2005 prevents a simple modeling witha unique dislocation source in a homogeneous elastic half-space.
7. Discussion
[32] During the 2004–2006 interval, two main features ofthe ground deformation pattern of Mt. Etna have beendetected: a deflation-inflation cycle between two (2004–
2005 and 2006) eruptions, in both cases accompanied by aseaward motion of the eastern flank.[33] During the 2004–2005 eruption, a degassed magma
was emitted, that was already residing inside the volcanoafter previous eruptions, and that intruded passively due tothe exceptional extension on the summit area caused by thehigh sliding rate of the eastern flank of the volcano (almost9 cm of slip on the modeled source from 2003 to 2004)[Bonaccorso et al., 2006]. The wide contraction measuredduring the eruption (Figure 3a) testifies how the emptyingof this shallow magma storage also caused a drainage of a
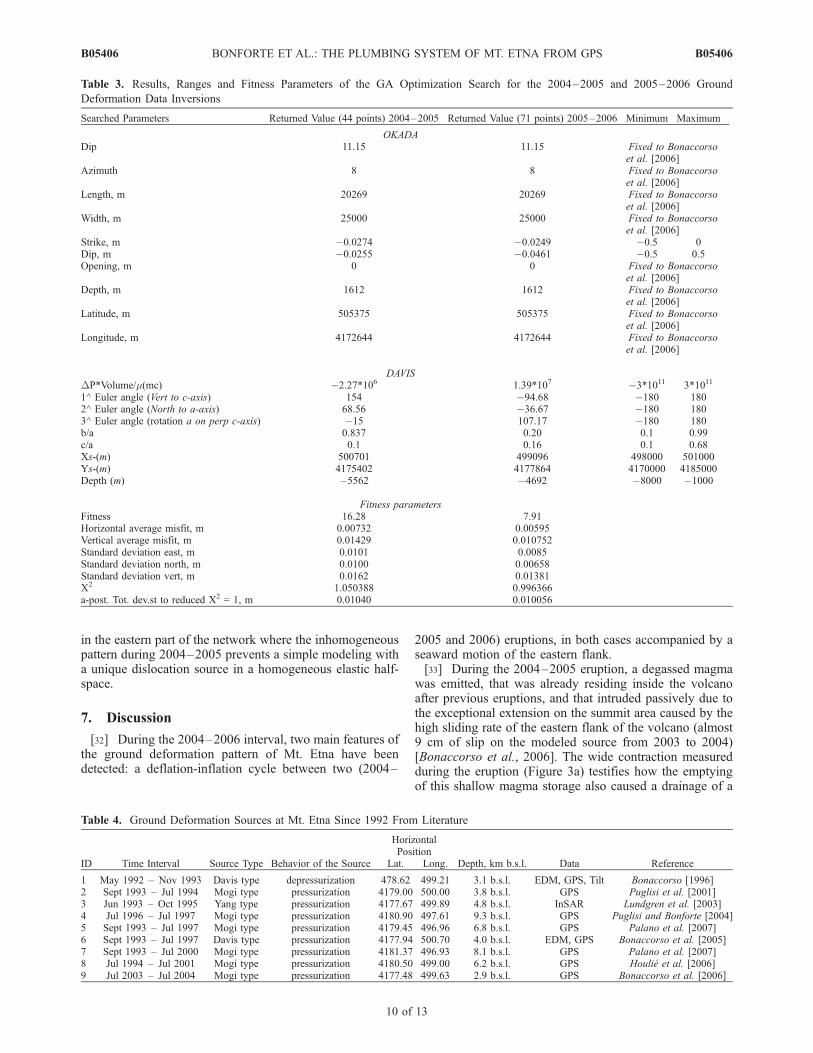
Table 3. Results, Ranges and Fitness Parameters of the GA Optimization Search for the 2004–2005 and 2005–2006 Ground
Deformation Data Inversions
Searched Parameters Returned Value (44 points) 2004–2005 Returned Value (71 points) 2005–2006 Minimum Maximum
OKADADip 11.15 11.15 Fixed to Bonaccorso
et al. [2006]Azimuth 8 8 Fixed to Bonaccorso
et al. [2006]Length, m 20269 20269 Fixed to Bonaccorso
et al. [2006]Width, m 25000 25000 Fixed to Bonaccorso
et al. [2006]Strike, m �0.0274 �0.0249 �0.5 0Dip, m �0.0255 �0.0461 �0.5 0.5Opening, m 0 0 Fixed to Bonaccorso
et al. [2006]Depth, m 1612 1612 Fixed to Bonaccorso
et al. [2006]Latitude, m 505375 505375 Fixed to Bonaccorso
et al. [2006]Longitude, m 4172644 4172644 Fixed to Bonaccorso
et al. [2006]
DAVISDP*Volume/m(mc) �2.27*106 1.39*107 �3*1011 3*1011
1^ Euler angle (Vert to c-axis) 154 �94.68 �180 1802^ Euler angle (North to a-axis) 68.56 �36.67 �180 1803^ Euler angle (rotation a on perp c-axis) �15 107.17 �180 180b/a 0.837 0.20 0.1 0.99c/a 0.1 0.16 0.1 0.68Xs-(m) 500701 499096 498000 501000Ys-(m) 4175402 4177864 4170000 4185000Depth (m) �5562 �4692 �8000 �1000
Fitness parametersFitness 16.28 7.91Horizontal average misfit, m 0.00732 0.00595Vertical average misfit, m 0.01429 0.010752Standard deviation east, m 0.0101 0.0085Standard deviation north, m 0.0100 0.00658Standard deviation vert, m 0.0162 0.01381X2 1.050388 0.996366a-post. Tot. dev.st to reduced X2 = 1, m 0.01040 0.010056
Table 4. Ground Deformation Sources at Mt. Etna Since 1992 From Literature
ID Time Interval Source Type Behavior of the Source
HorizontalPosition
Depth, km b.s.l. Data ReferenceLat. Long.
1 May 1992 – Nov 1993 Davis type depressurization 478.62 499.21 3.1 b.s.l. EDM, GPS, Tilt Bonaccorso [1996]2 Sept 1993 – Jul 1994 Mogi type pressurization 4179.00 500.00 3.8 b.s.l. GPS Puglisi et al. [2001]3 Jun 1993 – Oct 1995 Yang type pressurization 4177.67 499.89 4.8 b.s.l. InSAR Lundgren et al. [2003]4 Jul 1996 – Jul 1997 Mogi type pressurization 4180.90 497.61 9.3 b.s.l. GPS Puglisi and Bonforte [2004]5 Sept 1993 – Jul 1997 Mogi type pressurization 4179.45 496.96 6.8 b.s.l. GPS Palano et al. [2007]6 Sept 1993 – Jul 1997 Davis type pressurization 4177.94 500.70 4.0 b.s.l. EDM, GPS Bonaccorso et al. [2005]7 Sept 1993 – Jul 2000 Mogi type pressurization 4181.37 496.93 8.1 b.s.l. GPS Palano et al. [2007]8 Jul 1994 – Jul 2001 Mogi type pressurization 4180.50 499.00 6.2 b.s.l. GPS Houlie et al. [2006]9 Jul 2003 – Jul 2004 Mogi type pressurization 4177.48 499.63 2.9 b.s.l. GPS Bonaccorso et al. [2006]
B05406 BONFORTE ET AL.: THE PLUMBING SYSTEM OF MT. ETNA FROM GPS
10 of 13
B05406
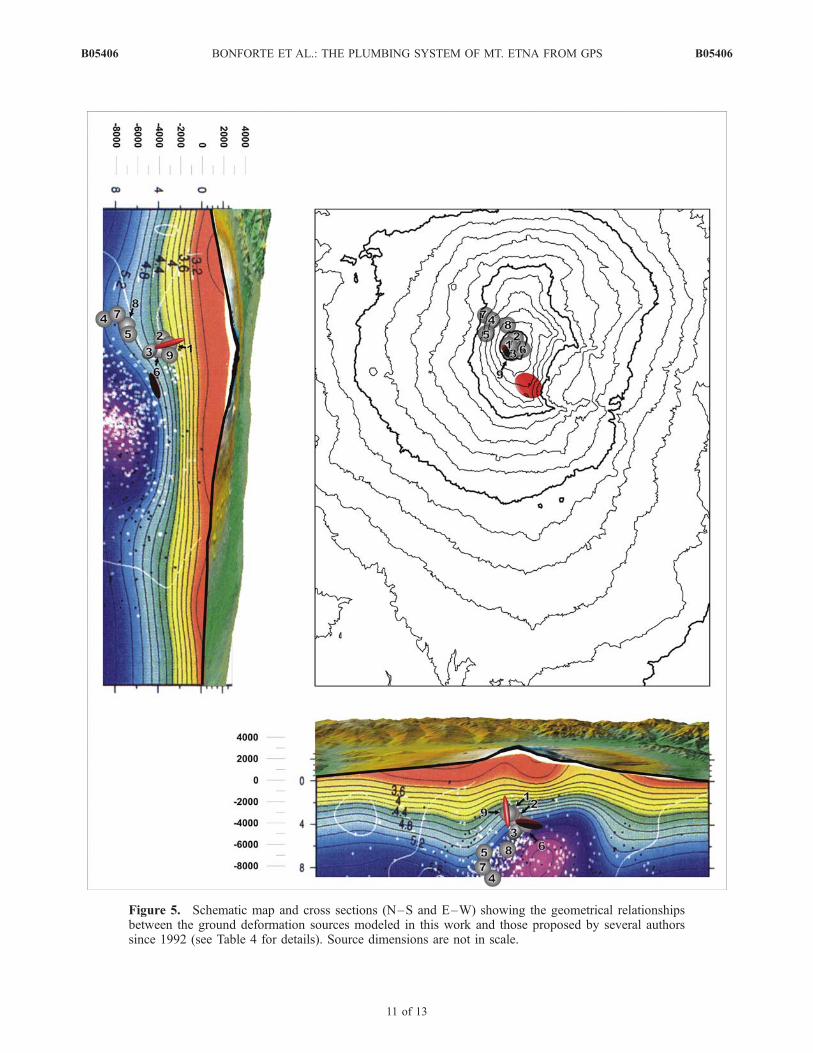
Figure 5. Schematic map and cross sections (N–S and E–W) showing the geometrical relationshipsbetween the ground deformation sources modeled in this work and those proposed by several authorssince 1992 (see Table 4 for details). Source dimensions are not in scale.
B05406 BONFORTE ET AL.: THE PLUMBING SYSTEM OF MT. ETNA FROM GPS
11 of 13
B05406
deeper magma reservoir that data inversions define as a sill-shaped source (Figure 4a and Table 3) located at a depth ofabout 4.5 km b.s.l. beneath the upper south-eastern flank ofthe volcano. The depressurizing source is located in the zonewhere both the inflating source detected by Bonaccorso etal. [2005] during the 1993–1997 inflation period and thepoint pressure source active before the 2004–2005 eruption[Bonaccorso et al., 2006] were already located by previousmodeling of GPS data (Figure 5 and Table 4). Also themodeling of the deflation phase which accompanied thelong 1992–1993 eruption showed a depressurizing sourcelocated in that position [Bonaccorso, 1996]. All the pressuresources active during the last decade (Table 4) are located atthe NW top of the high density body (Figure 5) detectedfrom seismic tomography by Chiarabba et al. [2000]. Thedistribution of the ground deformation sources modeledover time since 1993, would confirm that the magmaprevalently rises along the north-western border of a bodywith high seismic velocities (Vp) and that the upper part ofthe high Vp body is a region of magma storage as inferredby Patane et al. [2003]. In addition, the ground deformationsources clearly define a volume of intermediate storage (5 ±2 km b.s.l.) which characterized the feeding system of thevolcano during the last decade, as shown in Figure 5 andTable 4. In this context, the diking of 2001 and 2002–2003lateral eruptions were consistent with an over-pressuring inthis intermediate storage source, which fractured its upperlimit at about 3 km b.s.l and caused the magma intrusionalong eccentric dikes, provoking violent explosive-effusiveeruptions. The eccentric dike intrusions accompanying thesetwo eruptions induced an exceptional stress on the Mt. Etnaedifice, inducing an acceleration of the sliding of theunstable eastern side of the volcano. From the 2002–2003eruption on, in fact, the sliding of the eastern flank showedan exceptionally high velocity that continued during theyears following the eruption even with a minor slip rate. Infact, the total slip calculated on the same Okada model,decreased from almost 9 cm during 2003–2004 [Bonaccorsoet al., 2006] to 5 cm in 2005–2006. The upper part ofthe volcano edifice underwent the maximum tension thatfavored the opening of tensile fracture from which theresident magma poured out passively in the 2004–2005eruption [Bonaccorso et al., 2006]. This mechanism wasnew and unusual for the volcano but the deflation accom-panying the 2004–2005 eruption confirms a depressurizingsource (Figure 4a) located in a similar zone to the previousmodeled sources (Figure 5). Therefore we can conclude thatalso for the 2004 eruption, even if the final fracturingmechanism was different from the classic previous intru-sions, the intermediate storage maintained its previousposition.[34] It is interesting to note that the areal dilatation
accumulated by the entire GPS network (see Figure 2a),after a very long inflation period since 1992, has neverreturned to the initial value, showing an ever increasingtrend, with strong accelerations during the 2001 and2002–2003 eruptions. This contrasts with the contractionsmeasured during the same periods, calculated over a triangleformed by three stations lying on the northern (EDAM)western (PDG) and south-southwestern (ESLN) flanks, onthe stable part of the volcano (that is not affected by slidingdynamics). This is mainly due to the effect of the sliding
eastern flank of the volcano that produces a continuingdilatation of this part of the network. However, even con-sidering only the stable part of the volcano, the contractionepisodes do not entirely recover the dilatation accumulatedsince 1992. During the eruptive phase that started in 1999,the areal dilatation on the stable part continues to show aslightly ascending trend overall (with a much lower rate withrespect to the entire network), because the contractionperiods do not recover even the immediately preceding shortterm dilatation. This would imply that a fraction of the newmagma pressurizing the plumbing system during the longrecharging phase from 1992 to 1999 and, with a lower rate,from 2001 to 2006, was permanently stored, probablysolidifying along the western border of the high Vpbody, as suggested by Laigle et al. [2000]. Consequently,during the depressurizations of the magmatic sources, thevolcano only partially recovers the deformation accumulatedbeforehand.[35] The different trends between the cumulative areal
dilatation on the total network and on the stable trianglesince 2001, confirms the decoupling of the eastern flankfrom the rest of the volcano. The apparently slower slidingdynamics during the 2004–2005 deflation, reveals thedisarrangement of the eastern side of the volcano intodifferent moving blocks with different behaviors, as alreadyevidenced in Bonforte and Puglisi [2006], controlled bycomplex local fault systems.[36] After the end of the 2004–2005 eruption, the volca-
no started to re-inflate and a vertically elongated pressuriz-ing source was located by GPS data inversion at a depth ofabout 3 km b.s.l. The center of the inflation source (Figure 4band Table 3) shifted slightly north-westward (beneath thesummit craters) and is rather shallower than the previousones. The pressurizing source modeled for the 2005–2006time interval indicates a re-filling of the shallower plumbingsystem of the volcano by magma rising up from depth. Infact, the ellipsoidal pressurization source is vertically elon-gated, well reproducing a vertical path from the western sideof the high Vp body toward the summit craters. This couldindicate a change in the geometry of the feeding systemafter the 2004–2005 eruption, with a new and shallowermagma storage that reasonably allowed the resumption ofvolcanic activity at summit craters in 2006.
8. Conclusions
[37] In this work the ground deformation of Mt. Etnafrom 2004 to 2006 was analyzed. This period was accom-panied by the September 2004 to March 2005 eruption andby a re-charging phase leading to an eruption starting inJune 2006. During this period, an entire deflation-inflationcycle was detected, and the models obtained by invertingground deformation data confirm and improve the imagingof the feeding system of the volcano.[38] All the pressuring/depressuring storage sources mod-
eled for the previous eruptions are positioned along thewestern side of the high Vp body revealed by seismictomography. In this study the deflation source indicatesthe depletion of a horizontal sill-shaped source, located inthe upper part of this body. Instead, the inflation reveals arefilling of the shallower vertical plumbing system of Mt.
B05406 BONFORTE ET AL.: THE PLUMBING SYSTEM OF MT. ETNA FROM GPS
12 of 13
B05406
Etna, reasonably related with the resumption of volcanicactivity at the summit craters in 2006.[39] The general trend of the areal dilatation of the GPS
network since 1990, indicates that the spreading induced bythe pressurizing of the plumbing system is mainly accumu-lated in a non-elastic behavior. The eastern flank is affectedby a continuous eastward sliding, which became moremarked after the NE intrusion of the 2002–2003 eruption.However, the more stable western sector also shows that thedeformation accumulated during the long-lasting inflationphase from 1992 to 2001 was not recovered during thefollowing eruptive phases, indicating a permanent deforma-tion of the volcano and, consequently a permanent storageof non-erupted magma in the plumbing system.
[40] Acknowledgments. Authors are grateful to B. Puglisi,M. Cantarero, F. Calvagna, O. and S. Consoli, G. Brischetti, and R. Carusothat allowed the GPS surveys to be carried out. We thank M. Mattia and allthe permanent GPS task force of INGV, section of Catania, for providing thedata of the permanent network. Thanks are also due to S. Conway for hishelpful revision of the English language and to G. Wadge and P. Lundgrenfor their critical review that helped us to profoundly improve the manuscript.
ReferencesAllard, P., B. Behncke, S. D’Amico, M. Neri, and S. Gambino (2006),Mount Etna 1993–2005: Anatomy of an evolving eruptive cycle, EarthSci. Rev., 78, 85–114, doi:10.1016/j.earscirev.2006.04.002.
Bonaccorso, A. (1996), Dynamic inversion of ground deformation data formodelling volcanic sources (Etna 1991–93), Geophys. Res. Lett., 23(5),451–454.
Bonaccorso, A., S. Cianetti, C. Giunchi, E. Trasatti, M. Bonafede, andE. Boschi (2005), Analytical and 3-D numerical modelling of Mt. Etna(Italy) volcano inflation, Geophys. J. Int., 163, 852–862, doi:10.1111/j.1365-246X.2005.02777.x.
Bonaccorso, A., A. Bonforte, F. Guglielmino, M. Palano, and G. Puglisi(2006), Composite ground deformation pattern forerunning the 2004–2005 Mount Etna eruption, J. Geophys. Res., 111, B12207, doi:10.1029/2005JB004206.
Bonforte, A., and G. Puglisi (2003), Magma uprising and flank dynamicson Mount Etna volcano studied using GPS data (1994–1995), J. Geo-phys. Res., 108(B3), 2153, doi:10.1029/2002JB001845.
Bonforte, A., and G. Puglisi (2006), Dynamics of the eastern flank ofMt. Etna volcano (Italy) investigated by a dense GPS network, J. Volcanol.Geotherm. Res., 153(3–4), 357–369, doi:10.1016/jvolgeores.2005.12.005.
Bonforte, A., F. Guglielmino, M. Palano, and G. Puglisi (2004), A syn-eruptive ground deformation episode measured by GPS, during the 2001eruption on the upper southern flank of Mt Etna, Bull. Volcanol., 66(4),341–366.
Bonforte, A., S. Branca, and M. Palano (2007a), Geometric and kinematicvariations along the active Pernicana fault: Implication for the dynamicsof Mount Etna NE flank (Italy), J. Volcanol. Geotherm. Res., 160,210–222, doi:10.1016/j.jvolgeores.2006.08.009.
Bonforte, A., D. Carbone, F. Greco, and M. Palano (2007b), Intrusivemechanism of the 2002 NE-rift eruption at Mt. Etna (Italy) modelledusing GPS and gravity data, Geophys. J. Int., 169, doi:10.1111/j.1365-246X.2006.03249.x.
Borgia, A., L. Ferrari, and G. Pasquare (1992), Importance of gravitationalspreading in the tectonic and volcanic evolution of Mount Etna, Nature,357, 231–235.
Borgia, A., R. Lanari, E. Sansosti, M. Tesauro, P. Berardino, G. Fornaro,M. Neri, and J. B. Murray (2000), Actively growing anticlines beneathCatania from the distal motion of Mount Etna’s decollement measuredby SAR interferometry and GPS, Geophys. Res. Lett., 27(20), 3409–3412.
Bousquet, J. C., and G. Lanzafame (2004). The tectonics and geodynamicsof Mt. Etna: Synthesis and interpretation of geological and geophysicaldata, in Etna Volcano Laboratory, Geophys. Monogr. Ser., vol. 143,edited by A. Bonaccorso, S. Calvari, M. Coltelli, C. Del Negro, andS. Falsaperla, pp. 29–47, AGU, Washington, D.C.
Burton, M. R., et al. (2005), Etna 2004–2005: An archetype for geodyna-mically-controlled effusive eruptions, Geophys. Res. Lett., 32, L09303,doi:10.1029/2005GL022527.
Chiarabba, C., A. Amato, E. Boschi, and F. Barberi (2000), Recent seismi-city and tomographic modeling of the Mount Etna plumbing system,J. Geophys. Res., 105(B5), 10923–10938.
Davis, P. M. (1986), Surface deformation due to inflation of an arbitrarilyoriented triaxial elipsoidal cavity in an elastic half-space, with referenceto Kilauea volcano, Hawaii, J. Geophys. Res., 91(B7), 7429–7438.
Froger, J.-L., O. Merle, and P. Briole (2001), Active spreading and regionalextension at Mount Etna imaged by SAR interferometry, Earth Planet.Sci. Lett., 187, 245–258.
Houlie, N., P. Briole, A. Bonforte, and G. Puglisi (2006), Large scaleground deformation of Etna observed by GPS between 1994 and 2001,Geophys. Res. Lett., 33, L02309, doi:10.1029/2005GL024414.
Laigle, M., A. Hirn, M. Sapin, J. C. Lepine, J. Diaz, J. Gallart, andR. Nicolich (2000), Mount Etna dense array local earthquake P and Stomography and implications for volcanic plumbing, J. Geophys. Res.,105(B9), 21633–21646.
Livieratos, E. (1980), Crustal strains using geodetic methods, QuaternionesGeodaesiae, 3, 191–211.
Lo Giudice, E., and R. Rasa (1992), Very shallow earthquakes and brittledeformations in active volcanic areas: The Etnean region as an example,Tectonophysics, 202, 257–268.
Lundgren, P., P. Berardino, M. Coltelli, G. Fornaro, R. Lanari, G. Puglisi,E. Sansosti, and M. Tesauro (2003), Coupled Megma chamber andsector collapse slip observed with synthetic aperture radar interferome-try on Mt. Etna volcano, J. Geophys. Res., 108(B5), 2247, doi:10.1029/2001JB000657.
Lundgren, P., F. Casu, M. Manzo, A. Pepe, P. Berardino, E. Sansosti, andR. Lanari (2004), Gravity and magma induced spreading of Mount Etnavolcano revealed by satellite radar interferometry, Geophys. Res. Lett.,31, L04062, doi:10.1029/2003GL018736.
Nunnari, G., G. Puglisi, and F. Guglielmino (2005), Inversion of SAR datain active volcanic areas by optimization techniques, Nonlin. Proc. Geo-phys., 12, 863–870.
Okada, Y. (1985), Surface deformation due to shear and tensile fault in half-space, Bull. Seismol. Soc. Am., 75, 1135–1154.
Palano, M., G. Puglisi, and S. Gresta (2007), Ground deformation atMt. Etna: A joint interpretation of GPS and InSAR data from 1993 to2000. Boll. Geofis. Teor. Appl., 48(2), 81–98.
Patane, D., P. De Gori, C. Chiarabba, and A. Bonaccorso (2003), Magmaascent and the pressurization of Mount Etna’s volcanic system, Science,299, 2061–2063.
Puglisi, G., and A. Bonforte (2004), Dynamics of Mount Etna volcanoinferred from static and kinematic GPS measurements, J. Geophys.Res., 109, B11404, doi:10.1029/2003JB002878.
Puglisi, G., A. Bonforte, and S. R. Maugeri (2001), Ground deformationpatterns on Mt. Etna, between 1992 and 1994, inferred from GPS data,Bull. Volcanol., 62, 371–384.
Puglisi, G., P. Briole, and A. Bonforte (2004), Twelve years of grounddeformation studies on Mt. Etna volcano based on GPS surveys, inEtna Volcano Laboratory, Geophys. Monogr. Ser., vol. 143, edited byA. Bonaccorso, S. Calvari, M. Coltelli, C. Del Negro, and S. Falsaperla,pp. 321–341, AGU, Washington, D.C.
Rasa, R., R. Azzaro, and O. Leonardi (1996), Aseismic creep on faults andflank instability at Mt. Etna volcano, in Volcano Instability on the Earth andOther Planets, edited byW.M.McGuire, A. P. Jones, and J. Neuberg,Geol.Soc. Lon.-Spec. Publ., 110, 179–192, doi:10.1144/GSL.SP.1996.110.01.14,Geological Society of London, London.
Rust, D., and M. Neri (1996). The boundaries of large-scale collapse on theflanks of Mount Etna, Sicily, in Volcano Instability on the Earth and OtherPlanets, edited by W. M. McGuire, A. P. Jones, and J. Neuberg, Geol. Soc.Lon.-Spec. Publ., 110, 193–208, doi:10.1144/GSL.SP.1996.110.01.15,Geological Society of London, London.
Rust, D., B. Behncke, M. Neri, and A. Ciocanel (2005), Nested zones ofinstability in the Mount Etna volcanic edifice, Sicily, J. Volcanol.Geotherm., 144, 137–153, doi:10.1016/j.jvolgeores.2004.11.021.
Tiampo, K. F., J. Fernandez, G. Gentzsch, M. Charco, and J. B. Rundle(2004), Inverting for the parameters of a volcanic source using a geneticalgorithm and a model for magmatic intrusion in elastic-gravitationallayered Earth models, Comput. Geosci., 30(9 – 10), 985 – 1001,doi:10.1016/j.cageo.2004.07.005.
Walter, T. R., V. Acocella, M. Neri, and F. Amelung (2005), Feedbackprocesses between magmatic events and flank movement at Mount Etna(Italy) during the 2002–2003 eruption, J. Geophys. Res., 110, B10205,doi:10.1029/2005JB003688.
�����������������������A. Bonaccorso, A. Bonforte, F. Guglielmino, M. Palano, and G. Puglisi,
Istituto Nazionale di Geofisica e Vulcanologia, Sezione di Catania–PiazzaRoma, 2–95123, Catania, Italy. ([email protected])
B05406 BONFORTE ET AL.: THE PLUMBING SYSTEM OF MT. ETNA FROM GPS
13 of 13
B05406