Relationship between caldera collapse and magma chamber withdrawal: an experimental approach
12
Relationship between caldera collapse and magma chamber withdrawal: An experimental approach A. Geyer ⁎ , A. Folch, J. Martí Institute of Earth Sciences Jaume Almera (IJA-CSIC), Lluís Solé Sabarís s/n, 08028 Barcelona, Spain Received 25 October 2005; received in revised form 10 April 2006; accepted 1 May 2006 Available online 3 July 2006 Abstract Collapse calderas have received considerable attention due to their link to Earth's ore deposits and geothermal energy resources, but also because of their tremendous destructive potential. Although calderas have been investigated through fieldwork, numerical models and experimental studies, some important aspects on their formation still remain poorly understood. One key issue concerns the volume of magmas involved in caldera-forming eruptions. We perform analogue experiments to correlate the structural evolution of a collapse with the erupted magma chamber volume fraction. The experimental device consists of a transparent box (60 × 60 × 40 cm) filled with dry quartz sand and a water-filled latex balloon as a magma chamber analogue. Evacuation of water through a pipe causes a progressive deflation of the balloon that leads to a collapse of the overlying structure. The experimental design allows to record the temporal evolution of the collapse and to track the evolution of fractures and faults. We study the appearance and development of specific brittle structures, such as surface fractures or internal reverse faults, and correlate each different structure with the corresponding removed magma chamber volume fraction. We also determine the critical conditions for caldera onset. Experimental results show that, at any stage of caldera developments, the experimental relationship between volume fraction and chamber roof aspect ratio fits a logarithmic curve. It implies that volume fractions required to trigger caldera collapse are lower for chambers with low aspect ratios (shallow and wide) than for chambers with high aspect ratios (deep and small). These results are in agreement with natural examples and previous theoretical studies. © 2006 Elsevier B.V. All rights reserved. Keywords: volcanology; caldera collapse; analogue models; ring faults 1. Introduction It is generally accepted that collapse calderas form by subsidence of the roof of a magma chamber, commonly during the course of an eruptive event (e.g. Williams, 1941; Druitt and Sparks, 1984; Lipman, 1997; Martí et al., 2000; Roche and Druitt, 2001). Although collapse calderas have been the subject of multiple studies due to its huge destructive potential and to their link to many of the Earth's ore deposits and geothermal energy resources (e.g. Lipman, 1992; Guillou-Frottier et al., 2000), some important aspects on caldera dynamics and structure still remain uncertain and controversial. Experimental studies have improved notably the knowledge of the different collapse mechanisms and have explained the origin of different caldera morphol- ogies observed in nature (e.g. Komuro et al., 1984; Journal of Volcanology and Geothermal Research 157 (2006) 375 – 386 www.elsevier.com/locate/jvolgeores ⁎ Corresponding author. Fax: +34 934011112. E-mail address: [email protected] (A. Geyer). 0377-0273/$ - see front matter © 2006 Elsevier B.V. All rights reserved. doi:10.1016/j.jvolgeores.2006.05.001
-
Upload
independent -
Category
Documents
-
view
3 -
download
0
Transcript of Relationship between caldera collapse and magma chamber withdrawal: an experimental approach

al Research 157 (2006) 375–386www.elsevier.com/locate/jvolgeores
Journal of Volcanology and Geotherm
Relationship between caldera collapse and magma chamberwithdrawal: An experimental approach
A. Geyer ⁎, A. Folch, J. Martí
Institute of Earth Sciences Jaume Almera (IJA-CSIC), Lluís Solé Sabarís s/n, 08028 Barcelona, Spain
Received 25 October 2005; received in revised form 10 April 2006; accepted 1 May 2006Available online 3 July 2006
Abstract
Collapse calderas have received considerable attention due to their link to Earth's ore deposits and geothermal energy resources,but also because of their tremendous destructive potential. Although calderas have been investigated through fieldwork, numericalmodels and experimental studies, some important aspects on their formation still remain poorly understood. One key issue concernsthe volume of magmas involved in caldera-forming eruptions. We perform analogue experiments to correlate the structuralevolution of a collapse with the erupted magma chamber volume fraction. The experimental device consists of a transparent box(60×60×40 cm) filled with dry quartz sand and a water-filled latex balloon as a magma chamber analogue. Evacuation of waterthrough a pipe causes a progressive deflation of the balloon that leads to a collapse of the overlying structure. The experimentaldesign allows to record the temporal evolution of the collapse and to track the evolution of fractures and faults. We study theappearance and development of specific brittle structures, such as surface fractures or internal reverse faults, and correlate eachdifferent structure with the corresponding removed magma chamber volume fraction. We also determine the critical conditions forcaldera onset. Experimental results show that, at any stage of caldera developments, the experimental relationship between volumefraction and chamber roof aspect ratio fits a logarithmic curve. It implies that volume fractions required to trigger caldera collapseare lower for chambers with low aspect ratios (shallow and wide) than for chambers with high aspect ratios (deep and small). Theseresults are in agreement with natural examples and previous theoretical studies.© 2006 Elsevier B.V. All rights reserved.
Keywords: volcanology; caldera collapse; analogue models; ring faults
1. Introduction
It is generally accepted that collapse calderas form bysubsidence of the roof of a magma chamber, commonlyduring the course of an eruptive event (e.g. Williams,1941; Druitt and Sparks, 1984; Lipman, 1997;Martí et al.,2000; Roche and Druitt, 2001).
⁎ Corresponding author. Fax: +34 934011112.E-mail address: [email protected] (A. Geyer).
0377-0273/$ - see front matter © 2006 Elsevier B.V. All rights reserved.doi:10.1016/j.jvolgeores.2006.05.001
Although collapse calderas have been the subject ofmultiple studies due to its huge destructive potential andto their link to many of the Earth's ore deposits andgeothermal energy resources (e.g. Lipman, 1992;Guillou-Frottier et al., 2000), some important aspectson caldera dynamics and structure still remain uncertainand controversial.
Experimental studies have improved notably theknowledge of the different collapse mechanisms andhave explained the origin of different caldera morphol-ogies observed in nature (e.g. Komuro et al., 1984;
376 A. Geyer et al. / Journal of Volcanology and Geothermal Research 157 (2006) 375–386
Komuro, 1987; Martí et al., 1994; Roche et al., 2000…).Their main goal has been to study the effects of shape,volume, depth, internal pressure, previous deformationhistory, and rate of deflation of the magma chamber. Ingeneral terms, results obtained show that calderacollapses have an initial down-sag phase followed bya piston-like subsidence bounded by nearly vertical ringfaults. A group of outward dipping reverse ring faults(“bell-shaped”) appear at the interior of the collapsingstructure (Martí et al., 1994; Roche et al., 2000).Furthermore, experimental results, in agreement withmining studies, pointed out that a caldera collapsestructure has three different zones at surface: extension-al, compressional, and non-deformed (Roche et al.,2000). Moreover, the comparison of mining subsidencestudies with caldera collapse processes, introduces theroof aspect ratio r, defined as the quotient between thechamber depth to chamber horizontal extension (Rocheet al., 2000), a relevant parameter controlling miningsubsidence and caldera collapse. Experiments confirmthe existence of two different collapse regimes: coherentpiston-like subsidence (r≤1) and non-coherent subsi-dence through the fragmentation of the overlying roof inwedges (r>1) (Roche et al., 2000). These results are inagreement with previous mining subsidence studieswhich predicted three different collapse regimesdepending on the value of r: subcritical (r<0.7),supercritical (r>0.7), and intermediate or critical(r≈0.7) (Whittaker and Reddish, 1989). The maindiscrepancy is the slight difference in the thresholdvalue between the subcritical and the supercriticalregime. It depends indirectly on the material rheology(Whittaker and Reddish, 1989; Branney, 1995) and isnormally in the range 0.7< r<1. The control of the roofaspect ratio on the type of collapse has been confirmedby successive experiments (e.g. Roche and Druitt, 2001;Roche et al., 2001; Kennedy et al., 2004).
Subsequent studies have investigated the structure ofcalderas and resurgent domes (Acocella et al., 2000), theperipheral caldera faults and their relationship to magmachamber dynamics (Walter and Troll, 2001), and theinfluence of a pre-existing topography on the calderacollapse process (Walter and Troll, 2001; Lavallée et al.,2004). Recent experimental studies on caldera collapseare mainly focused on evaluating the role of pre-existingextensional structures and the effects of far-fieldstresses, i.e. regional tectonics (Acocella et al., 2004;Holohan et al., 2005).
Analogue models have improved notably the com-prehension of caldera formation mechanisms. However,no previous work correlates the different stages of acaldera collapse with the volumes of magma withdrawn
from the underlying reservoir, a subject addressed onlyin part by some theoretical models (Druitt and Sparks,1984; Bower and Woods, 1997; Martí et al., 2000;Roche and Druitt, 2001). This link between magmavolume and collapse extent is crucial in terms of hazard,as it might predict when an eruption may evolve into acaldera-forming one. The main goal of this paper is toevaluate, through analogue modelling, the fraction ofmagma that is necessary to be removed in order to createthe different set of fractures and faults that will lead tocaldera subsidence. To determine the structural evolu-tion of collapse calderas is relevant to understand therelationship between the volume of extruded magmaand the total volume of the magma chamber.
2. Methodology
2.1. Experimental device
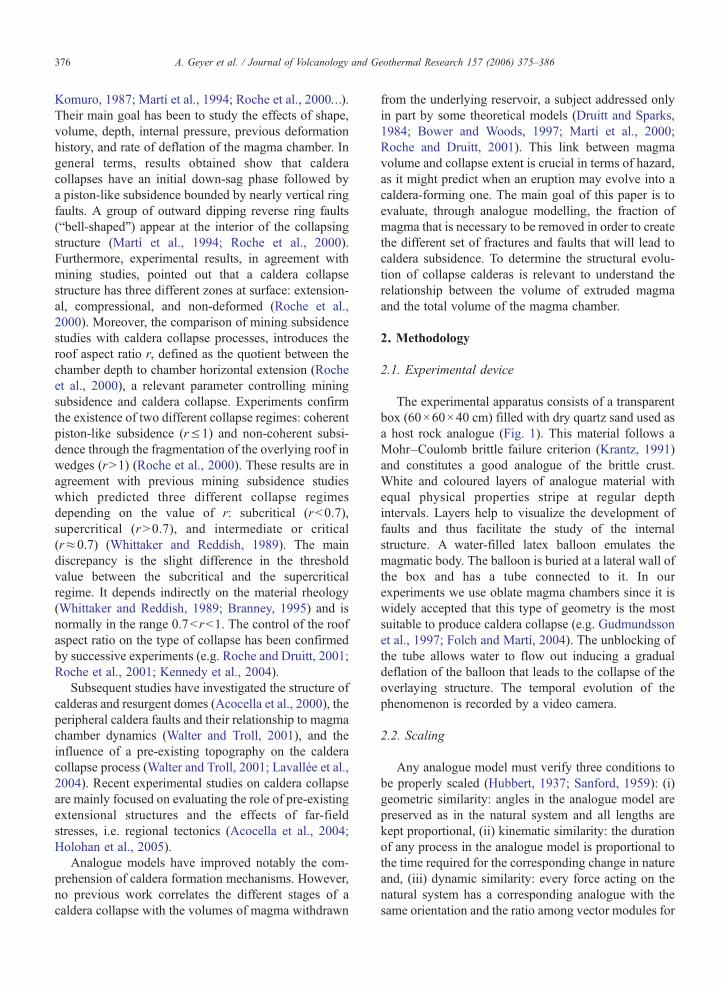
The experimental apparatus consists of a transparentbox (60×60×40 cm) filled with dry quartz sand used asa host rock analogue (Fig. 1). This material follows aMohr–Coulomb brittle failure criterion (Krantz, 1991)and constitutes a good analogue of the brittle crust.White and coloured layers of analogue material withequal physical properties stripe at regular depthintervals. Layers help to visualize the development offaults and thus facilitate the study of the internalstructure. A water-filled latex balloon emulates themagmatic body. The balloon is buried at a lateral wall ofthe box and has a tube connected to it. In ourexperiments we use oblate magma chambers since it iswidely accepted that this type of geometry is the mostsuitable to produce caldera collapse (e.g. Gudmundssonet al., 1997; Folch and Martí, 2004). The unblocking ofthe tube allows water to flow out inducing a gradualdeflation of the balloon that leads to the collapse of theoverlaying structure. The temporal evolution of thephenomenon is recorded by a video camera.
2.2. Scaling
Any analogue model must verify three conditions tobe properly scaled (Hubbert, 1937; Sanford, 1959): (i)geometric similarity: angles in the analogue model arepreserved as in the natural system and all lengths arekept proportional, (ii) kinematic similarity: the durationof any process in the analogue model is proportional tothe time required for the corresponding change in natureand, (iii) dynamic similarity: every force acting on thenatural system has a corresponding analogue with thesame orientation and the ratio among vector modules for
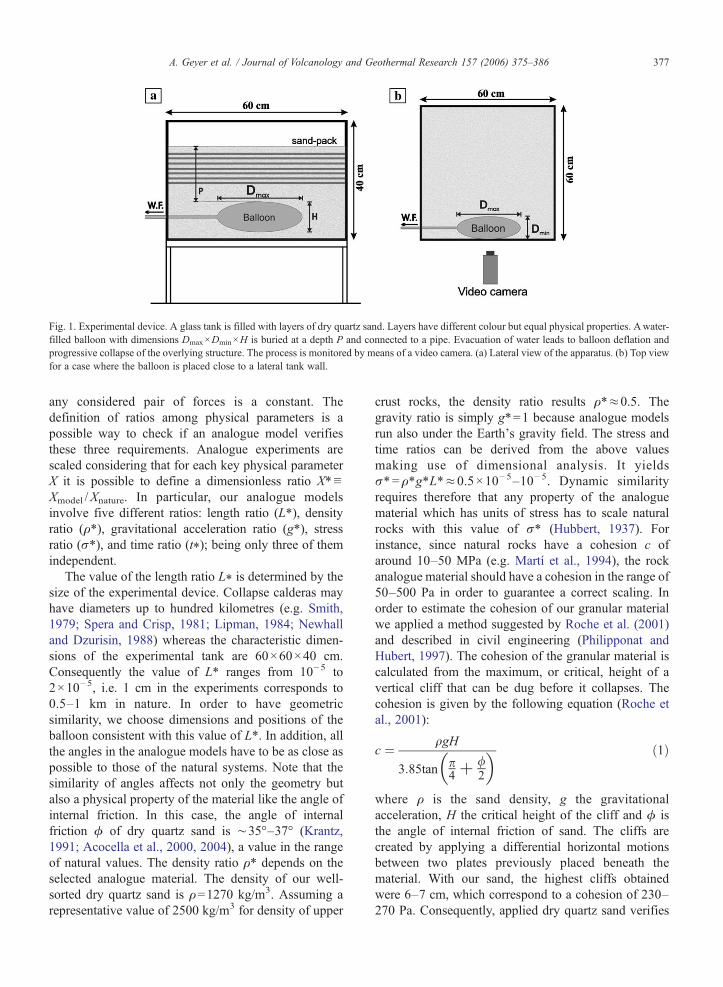
Fig. 1. Experimental device. A glass tank is filled with layers of dry quartz sand. Layers have different colour but equal physical properties. Awater-filled balloon with dimensions Dmax×Dmin×H is buried at a depth P and connected to a pipe. Evacuation of water leads to balloon deflation andprogressive collapse of the overlying structure. The process is monitored by means of a video camera. (a) Lateral view of the apparatus. (b) Top viewfor a case where the balloon is placed close to a lateral tank wall.
377A. Geyer et al. / Journal of Volcanology and Geothermal Research 157 (2006) 375–386
any considered pair of forces is a constant. Thedefinition of ratios among physical parameters is apossible way to check if an analogue model verifiesthese three requirements. Analogue experiments arescaled considering that for each key physical parameterX it is possible to define a dimensionless ratio X⁎≡Xmodel /Xnature. In particular, our analogue modelsinvolve five different ratios: length ratio (L⁎), densityratio (ρ⁎), gravitational acceleration ratio (g⁎), stressratio (σ⁎), and time ratio (t⁎); being only three of themindependent.
The value of the length ratio L⁎ is determined by thesize of the experimental device. Collapse calderas mayhave diameters up to hundred kilometres (e.g. Smith,1979; Spera and Crisp, 1981; Lipman, 1984; Newhalland Dzurisin, 1988) whereas the characteristic dimen-sions of the experimental tank are 60×60×40 cm.Consequently the value of L⁎ ranges from 10−5 to2×10−5, i.e. 1 cm in the experiments corresponds to0.5–1 km in nature. In order to have geometricsimilarity, we choose dimensions and positions of theballoon consistent with this value of L⁎. In addition, allthe angles in the analogue models have to be as close aspossible to those of the natural systems. Note that thesimilarity of angles affects not only the geometry butalso a physical property of the material like the angle ofinternal friction. In this case, the angle of internalfriction ϕ of dry quartz sand is ∼35°–37° (Krantz,1991; Acocella et al., 2000, 2004), a value in the rangeof natural values. The density ratio ρ⁎ depends on theselected analogue material. The density of our well-sorted dry quartz sand is ρ=1270 kg/m3. Assuming arepresentative value of 2500 kg/m3 for density of upper
crust rocks, the density ratio results ρ⁎≈0.5. Thegravity ratio is simply g⁎=1 because analogue modelsrun also under the Earth's gravity field. The stress andtime ratios can be derived from the above valuesmaking use of dimensional analysis. It yieldsσ⁎=ρ⁎g⁎L⁎≈0.5×10⁻⁵–10− 5. Dynamic similarityrequires therefore that any property of the analoguematerial which has units of stress has to scale naturalrocks with this value of σ⁎ (Hubbert, 1937). Forinstance, since natural rocks have a cohesion c ofaround 10–50 MPa (e.g. Martí et al., 1994), the rockanalogue material should have a cohesion in the range of50–500 Pa in order to guarantee a correct scaling. Inorder to estimate the cohesion of our granular materialwe applied a method suggested by Roche et al. (2001)and described in civil engineering (Philipponat andHubert, 1997). The cohesion of the granular material iscalculated from the maximum, or critical, height of avertical cliff that can be dug before it collapses. Thecohesion is given by the following equation (Roche etal., 2001):
c ¼ qgH
3:85tan p4 þ /
2
� � ð1Þ
where ρ is the sand density, g the gravitationalacceleration, H the critical height of the cliff and ϕ isthe angle of internal friction of sand. The cliffs arecreated by applying a differential horizontal motionsbetween two plates previously placed beneath thematerial. With our sand, the highest cliffs obtainedwere 6–7 cm, which correspond to a cohesion of 230–270 Pa. Consequently, applied dry quartz sand verifies

Table 1Summary of the experiments P, balloon depth; H, balloon height;Dmax, balloon maximum diameter; Dmin, balloon minimum diameter;r, mean roof aspect ratio value calculated as r=0.5×(P /Dmin+P /Dmax); t, duration of the experiment; V, total water removed beforeexperiment stop
Experiment P(cm)
H(cm)
Dmax
(cm)Dmin
(cm)r t
(s)V(in %)
E-1 6 14 20 16 0.34 160 50E-2 9 14.3 22 19 0.44 350 100E-3 9.3 13 20 18.5 0.48 330 100E-4 12.5 15.5 25 23 0.52 290 64E-5 17.5 15 22 20 0.84 310 86E-6 17.9 13 16 15.5 1.14 250 76E-7 25.7 10 13 9.5 2.34 240 100
378 A. Geyer et al. / Journal of Volcanology and Geothermal Research 157 (2006) 375–386
dynamic similarity. Finally, the time ratio yieldst* ¼
ffiffiffiffiffiffiffiffiffiffiffiffiffiL*=g*
pc3� 10−3−4:5� 10−3. It constrains
the duration of the experiments in order to verifykinematic similarity. Typically, the duration of ouranalogue experiments is 160–350 s implying that thesimulated natural collapses have durations between 10and 32 h approximately. The duration of the collapseprocess is poorly constrained, but values from few hoursto few days are generally accepted (Lavallée et al.,2004). Consequently, our experiments are also correctlyscaled in time.
2.3. Experimental restrictions
Before discussing the experimental results and theirgeological implications, it is necessary to determine therestrictions of the experimental device and, if possible,try to minimize its effects. Analogue experiments thatuse dry quartz sand do commonly show grain flowprocesses that introduce unrealistic deformation struc-tures (e.g. Martí et al., 1994; Kennedy et al., 2004). Weintended to minimize this undesirable effect by using avery fine grain size sand (40 μm of mean diameter). Finegrain sand allows vertical scarps to form in cases whereprevious experimental models presented grain flowprocesses. A second obvious restriction of the experi-ments comes from the use of a latex balloon as achamber analogue. The elastic walls of the balloongenerate forces that do not have a counterpart in thenatural systems and, in consequence, violate theprinciple of dynamic similarity. Some authors interpretthese forces as representative for the rheologic behaviourin the crystal-mush transition zone between the magmachamber and the host rock (Lavallée et al., 2004) but,even if true, this boundary is not correctly scaled. Finally,one could expect that a balloon placed close to the tankwall may alter the structures developed during thecollapse process. In order to evaluate the importance ofthis perturbation we have performed two sets ofexperiments using the samemagma chamber parameters.In the first set the balloon is placed in the centre of thetank, while in the second it is buried close to the tankwalls. Results show that edge effects are of second order,a conclusion already reached by previous studies thatused a similar configuration (e.g. Martí et al., 1994;Walter and Troll, 2001). Furthermore, due to theexperimental set-up, none of the previously publishedanalogue model of caldera collapse process takes intoaccount thermal effects of the reservoir on the countryrock and the eruption dynamics, although these factorsmay play an important role. Thermal effects of themagmatic reservoir may alter the host rock rheology,
creating a brittle–ductile transition zone between theliquid chamber and the solid host rock (Burov andGuillou-Frottier, 1999). Except some major faults orfractures, brittle structures will not penetrate inside thisboundary, but structures at shallower levels are unaf-fected by the thermal effect. In our analogue modelsstructures located close or in contact to the magmachamber analogue are not considered as realistic becauseof the existence of the latex boundary. Consequently,since the thermal effects of the magma chamber areconstrained to the material around the reservoir it doesnot affect our experimental results. However, futureworks may study the possibility of including thermaleffects of the magmatic reservoir in order to improveexisting experimental set-ups. Separately, the eruptivestyle is not as significant because fracture formation isdirectly related to host rock mechanics and not to magmadischarge rate. We conclude, consequently, that the mainexperimental restriction in our experiments comes fromthe elastic properties of the balloon.
Furthermore, it is important to remark that in allexperiments water is able to flow out interruptedlyleading to a complete caldera collapse. This is notnecessarily the case of a natural system, for whichremoval of magma may stop at any instant if no furtherchamber decompression is possible (e.g. Wilson et al.,1980; Macedonio et al., 1994; Martí et al., 2000). Ourconcern is to assess the fraction of magma that would benecessary to be removed from the chamber in order toform the different set of faults that will control calderacollapse but without considering whether this with-drawal is plausible or not for any particular case.
3. Experimental results
Table 1 lists the set of experiments performed in thisstudy. Experimental results are consistent with previous
379A. Geyer et al. / Journal of Volcanology and Geothermal Research 157 (2006) 375–386
studies (e.g. Martí et al., 1994; Acocella et al., 2000;Roche et al., 2000; Lavallée et al., 2004) and can besummarized as follows. For low aspect ratios (r<0.7–0.85), the collapse is piston-like. The subsiding piston isbounded by circular, vertical or sub-vertical (90°–70°)faults that dip slightly outwards or inwards. In somecases, the fault dip angle is not constant but decreasestowards the surface. A second internal group of reversefaults dip outwards with angles between 40° and 70°.These “bell-shaped” faults appear at depth and some ofthem may not reach the surface. In contrast, for highaspect ratios (r>0.7–0.85), the collapse does not occuras a coherent block, but as several pieces trough anumber of reverse faults. The higher the ratio r, thelarger the number of faults. Plane view observationsallow to define two different regions at surface for anyvalue of r (see Fig. 2): a non-deformed central area (N)and an annular zone of flexure and extension encirclingthe former. This external region can be subdivided, inturn, into a zone where strata are tilted towards the
Fig. 2. Results for experiments E-1 and E-5. (a) Scheme of surface fractures inthe corresponding fracture segment. Different fill patterns show the tilted (Tphotographs. Surface fractures are clearly visible at the extensional zone. Blacvertical ring faults and will delimit the piston subsidence during the last stagethose of (a) indicate the order of appearance of fractures. TMC is the top of
depression (T) and a horizontal area with extensivesurface fractures (E).
Caldera collapse is a continuous process that evolvesthrough the appearance of certain sets of fractures andfaults. Therefore, we cannot consider the formation ofthese distinctive sets of brittle features as discrete eventsin a continuous caldera-forming process. Their appear-ance and development is intimately related to thedecompression of the magma chamber, which willdetermine the different phases of a caldera collapseprocess.
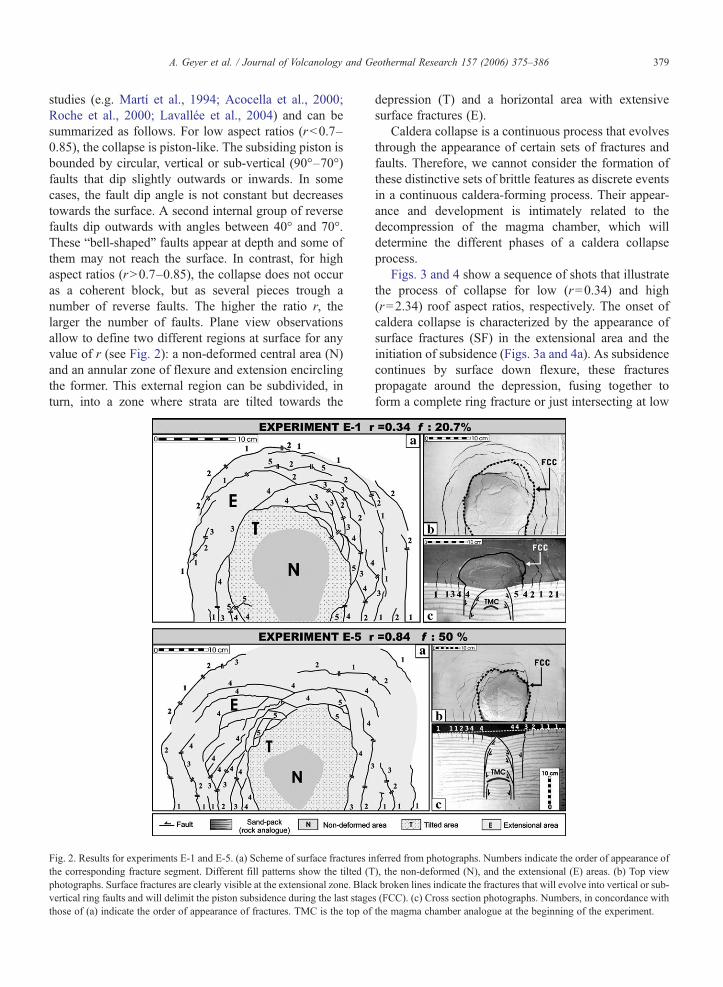
Figs. 3 and 4 show a sequence of shots that illustratethe process of collapse for low (r=0.34) and high(r=2.34) roof aspect ratios, respectively. The onset ofcaldera collapse is characterized by the appearance ofsurface fractures (SF) in the extensional area and theinitiation of subsidence (Figs. 3a and 4a). As subsidencecontinues by surface down flexure, these fracturespropagate around the depression, fusing together toform a complete ring fracture or just intersecting at low
ferred from photographs. Numbers indicate the order of appearance of), the non-deformed (N), and the extensional (E) areas. (b) Top viewk broken lines indicate the fractures that will evolve into vertical or sub-s (FCC). (c) Cross section photographs. Numbers, in concordance withthe magma chamber analogue at the beginning of the experiment.
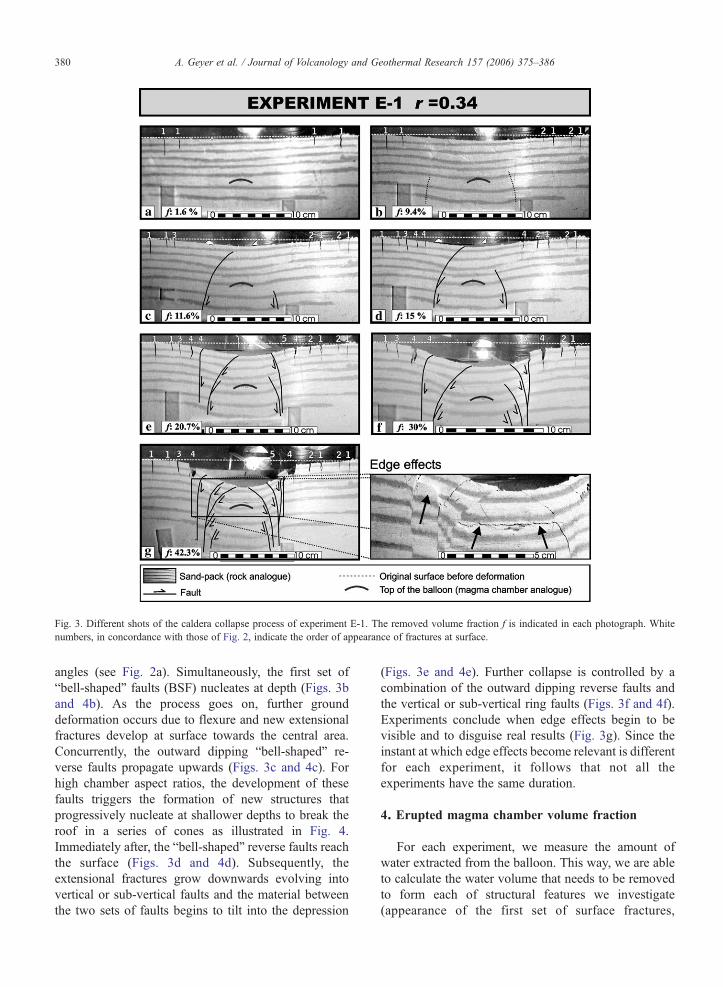
Fig. 3. Different shots of the caldera collapse process of experiment E-1. The removed volume fraction f is indicated in each photograph. Whitenumbers, in concordance with those of Fig. 2, indicate the order of appearance of fractures at surface.
380 A. Geyer et al. / Journal of Volcanology and Geothermal Research 157 (2006) 375–386
angles (see Fig. 2a). Simultaneously, the first set of“bell-shaped” faults (BSF) nucleates at depth (Figs. 3band 4b). As the process goes on, further grounddeformation occurs due to flexure and new extensionalfractures develop at surface towards the central area.Concurrently, the outward dipping “bell-shaped” re-verse faults propagate upwards (Figs. 3c and 4c). Forhigh chamber aspect ratios, the development of thesefaults triggers the formation of new structures thatprogressively nucleate at shallower depths to break theroof in a series of cones as illustrated in Fig. 4.Immediately after, the “bell-shaped” reverse faults reachthe surface (Figs. 3d and 4d). Subsequently, theextensional fractures grow downwards evolving intovertical or sub-vertical faults and the material betweenthe two sets of faults begins to tilt into the depression
(Figs. 3e and 4e). Further collapse is controlled by acombination of the outward dipping reverse faults andthe vertical or sub-vertical ring faults (Figs. 3f and 4f).Experiments conclude when edge effects begin to bevisible and to disguise real results (Fig. 3g). Since theinstant at which edge effects become relevant is differentfor each experiment, it follows that not all theexperiments have the same duration.
4. Erupted magma chamber volume fraction
For each experiment, we measure the amount ofwater extracted from the balloon. This way, we are ableto calculate the water volume that needs to be removedto form each of structural features we investigate(appearance of the first set of surface fractures,
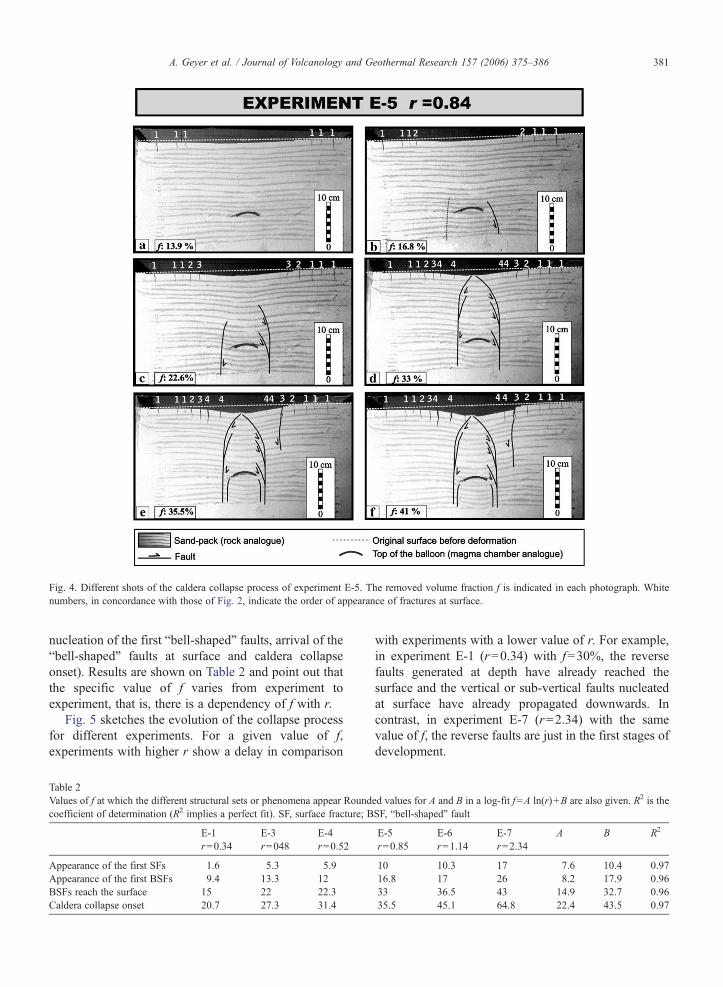
Fig. 4. Different shots of the caldera collapse process of experiment E-5. The removed volume fraction f is indicated in each photograph. Whitenumbers, in concordance with those of Fig. 2, indicate the order of appearance of fractures at surface.
381A. Geyer et al. / Journal of Volcanology and Geothermal Research 157 (2006) 375–386
nucleation of the first “bell-shaped” faults, arrival of the“bell-shaped” faults at surface and caldera collapseonset). Results are shown on Table 2 and point out thatthe specific value of f varies from experiment toexperiment, that is, there is a dependency of f with r.
Fig. 5 sketches the evolution of the collapse processfor different experiments. For a given value of f,experiments with higher r show a delay in comparison
Table 2Values of f at which the different structural sets or phenomena appear Roundcoefficient of determination (R2 implies a perfect fit). SF, surface fracture; B
E-1r=0.34
E-3r=048
E-4r=0.52
Appearance of the first SFs 1.6 5.3 5.9Appearance of the first BSFs 9.4 13.3 12BSFs reach the surface 15 22 22.3Caldera collapse onset 20.7 27.3 31.4
with experiments with a lower value of r. For example,in experiment E-1 (r=0.34) with f=30%, the reversefaults generated at depth have already reached thesurface and the vertical or sub-vertical faults nucleatedat surface have already propagated downwards. Incontrast, in experiment E-7 (r=2.34) with the samevalue of f, the reverse faults are just in the first stages ofdevelopment.
ed values for A and B in a log-fit f=A ln(r)+B are also given. R2 is theSF, “bell-shaped” fault
E-5r=0.85
E-6r=1.14
E-7r=2.34
A B R2
10 10.3 17 7.6 10.4 0.9716.8 17 26 8.2 17.9 0.9633 36.5 43 14.9 32.7 0.9635.5 45.1 64.8 22.4 43.5 0.97
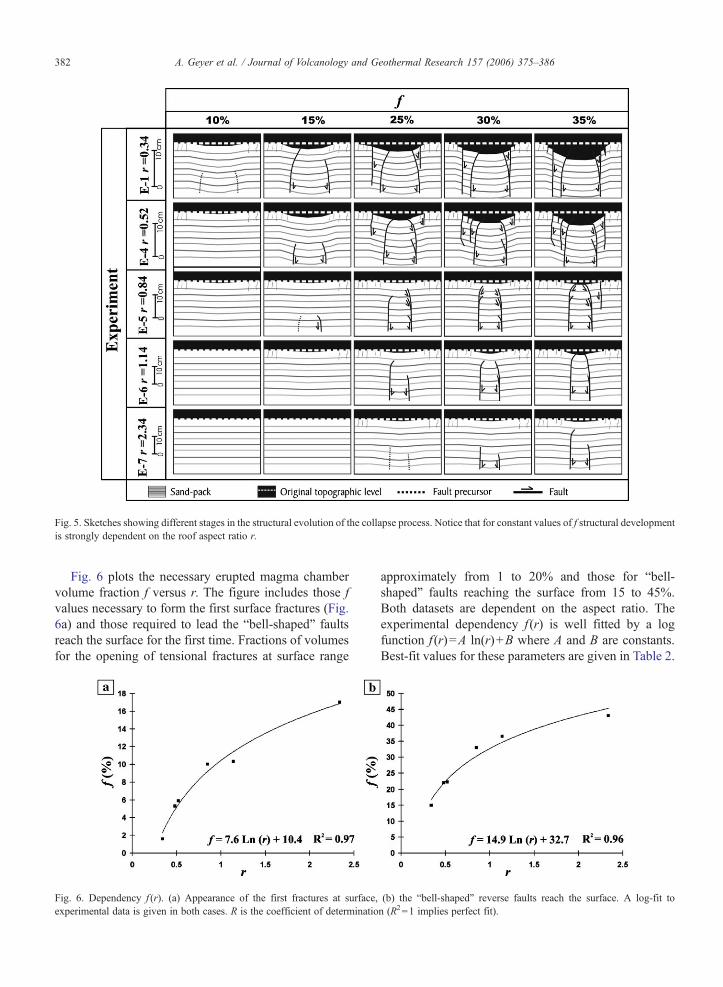
Fig. 5. Sketches showing different stages in the structural evolution of the collapse process. Notice that for constant values of f structural developmentis strongly dependent on the roof aspect ratio r.
382 A. Geyer et al. / Journal of Volcanology and Geothermal Research 157 (2006) 375–386
Fig. 6 plots the necessary erupted magma chambervolume fraction f versus r. The figure includes those fvalues necessary to form the first surface fractures (Fig.6a) and those required to lead the “bell-shaped” faultsreach the surface for the first time. Fractions of volumesfor the opening of tensional fractures at surface range
Fig. 6. Dependency f (r). (a) Appearance of the first fractures at surface,experimental data is given in both cases. R is the coefficient of determinatio
approximately from 1 to 20% and those for “bell-shaped” faults reaching the surface from 15 to 45%.Both datasets are dependent on the aspect ratio. Theexperimental dependency f (r) is well fitted by a logfunction f (r)=A ln(r)+B where A and B are constants.Best-fit values for these parameters are given in Table 2.
(b) the “bell-shaped” reverse faults reach the surface. A log-fit ton (R2=1 implies perfect fit).
383A. Geyer et al. / Journal of Volcanology and Geothermal Research 157 (2006) 375–386
4.1. Values of f for caldera onset
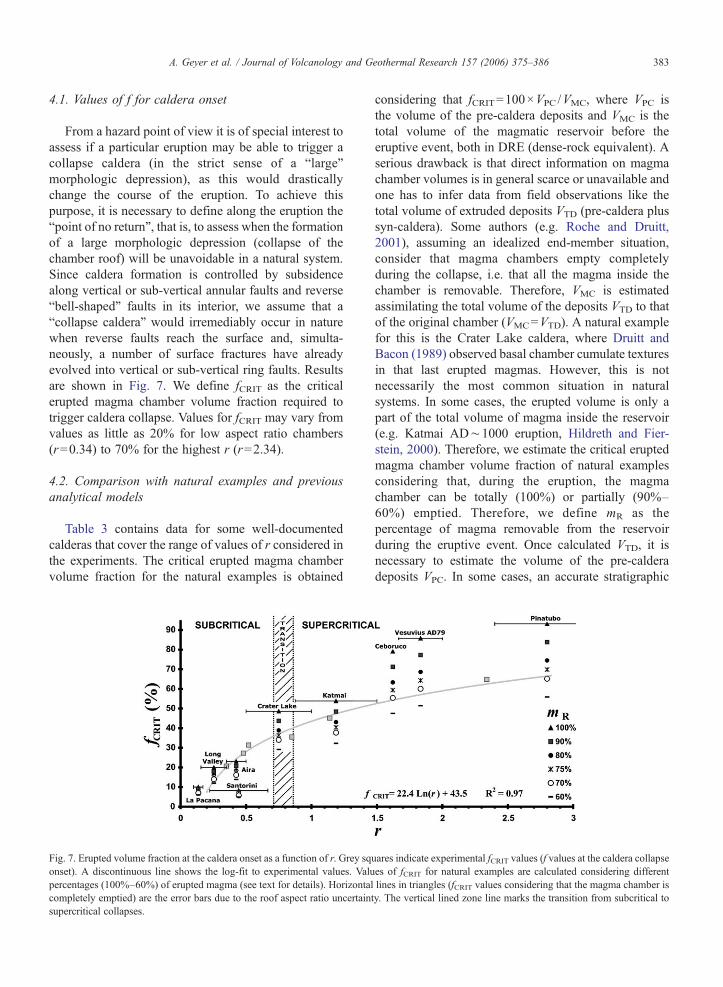
From a hazard point of view it is of special interest toassess if a particular eruption may be able to trigger acollapse caldera (in the strict sense of a “large”morphologic depression), as this would drasticallychange the course of the eruption. To achieve thispurpose, it is necessary to define along the eruption the“point of no return”, that is, to assess when the formationof a large morphologic depression (collapse of thechamber roof) will be unavoidable in a natural system.Since caldera formation is controlled by subsidencealong vertical or sub-vertical annular faults and reverse“bell-shaped” faults in its interior, we assume that a“collapse caldera” would irremediably occur in naturewhen reverse faults reach the surface and, simulta-neously, a number of surface fractures have alreadyevolved into vertical or sub-vertical ring faults. Resultsare shown in Fig. 7. We define fCRIT as the criticalerupted magma chamber volume fraction required totrigger caldera collapse. Values for fCRIT may vary fromvalues as little as 20% for low aspect ratio chambers(r=0.34) to 70% for the highest r (r=2.34).
4.2. Comparison with natural examples and previousanalytical models
Table 3 contains data for some well-documentedcalderas that cover the range of values of r considered inthe experiments. The critical erupted magma chambervolume fraction for the natural examples is obtained
Fig. 7. Erupted volume fraction at the caldera onset as a function of r. Grey sqonset). A discontinuous line shows the log-fit to experimental values. Valupercentages (100%–60%) of erupted magma (see text for details). Horizontalcompletely emptied) are the error bars due to the roof aspect ratio uncertaintsupercritical collapses.
considering that fCRIT=100×VPC /VMC, where VPC isthe volume of the pre-caldera deposits and VMC is thetotal volume of the magmatic reservoir before theeruptive event, both in DRE (dense-rock equivalent). Aserious drawback is that direct information on magmachamber volumes is in general scarce or unavailable andone has to infer data from field observations like thetotal volume of extruded deposits VTD (pre-caldera plussyn-caldera). Some authors (e.g. Roche and Druitt,2001), assuming an idealized end-member situation,consider that magma chambers empty completelyduring the collapse, i.e. that all the magma inside thechamber is removable. Therefore, VMC is estimatedassimilating the total volume of the deposits VTD to thatof the original chamber (VMC=VTD). A natural examplefor this is the Crater Lake caldera, where Druitt andBacon (1989) observed basal chamber cumulate texturesin that last erupted magmas. However, this is notnecessarily the most common situation in naturalsystems. In some cases, the erupted volume is only apart of the total volume of magma inside the reservoir(e.g. Katmai AD∼1000 eruption, Hildreth and Fier-stein, 2000). Therefore, we estimate the critical eruptedmagma chamber volume fraction of natural examplesconsidering that, during the eruption, the magmachamber can be totally (100%) or partially (90%–60%) emptied. Therefore, we define mR as thepercentage of magma removable from the reservoirduring the eruptive event. Once calculated VTD, it isnecessary to estimate the volume of the pre-calderadeposits VPC. In some cases, an accurate stratigraphic
uares indicate experimental fCRIT values (f values at the caldera collapsees of fCRIT for natural examples are calculated considering differentlines in triangles (fCRIT values considering that the magma chamber isy. The vertical lined zone line marks the transition from subcritical to

Table 3Natural examples. VTD, total volume of deposits given in DRE (dense-rock equivalents); VPC, volume of the pre-caldera deposits given in DRE; P(Pmin–Pmax), magma chamber depth; D (Dmin×Dmax) caldera diameter, i.e. magma chamber diameter; r, roof aspect ratio
Caldera, Formation VTD (km3) VPC (km3) P (km) D (km) r a
La Pacana b, Atana Ignimbrite 1600 <160 6 60×35 0.1–0.17Long Valley c, Bishop Tuff 750 150 5–6 17×32 0.16–0.35Santorini d, Minoan Tuff 27–33 2–3 2–3 6×9 0.22–0.67Aira e, Ito Tuff 143 33 7–10 20 0.35–0.5Katmai f 13 7 3.5–4.5 3×4 0.88–1.5Crater Lake g, Climactic 40–64 17–35 5–8 8×10 0.5–1Ceboruco h, Jala Pumice 3–4 2.5–3 >6 3.7 1.62Vesuvius i, Pompeii Pumice 1.2–1.7 1–1.5 5–6 3 1.67–2Pinatubo e 3.7–5.3 3.4–5 6–8 2.5 2.4–3.2
a Assuming Pmin /Dmax≤ r≤Pmax /Dmin.b Lindsay et al., 2001; Schmitt et al., 2002.c Roche and Druitt, 2001; Newman et al., 2006 and references therein.d Bond and Sparks, 1976; Druitt and Francaviglia, 1992; Roche and Druitt, 2001 and references therein.e Roche and Druitt, 2001 and references therein.f Hildreth, 1991; Hildreth and Fierstein, 2000; Hildreth et al., 2003.g Bacon, 1983; Druitt and Bacon, 1989; Roche and Druitt, 2001 and references therein.h Roche and Druitt, 2001; Browne and Gardner, 2004 and references therein.i Macedonio et al., 1994; Roche and Druitt, 2001 and references therein.
384 A. Geyer et al. / Journal of Volcanology and Geothermal Research 157 (2006) 375–386
and lithologic work makes possible the volumeestimation. Commonly, caldera onset in the stratigraphicrecord is clearly identifiable, for example, by asignificant increase and large variations in nature, sizeand grading of lithics in the pyroclastic deposits (e.g.Suzuki-Kamata et al., 1993; Gardner and Tait, 2000;Browne and Gardner, 2004). Moreover, monitoringinformation such as the record of large earthquakeclusters (e.g. Hildreth and Fierstein, 2000) may be usedas an additional way to detect collapse onset and tocalculate VPC. However, in some cases, caldera collapsestarts very early in the eruption thus producing very littlepre-caldera deposits (e.g. La Pacana, Lindsay et al.,2001).
Fig. 7 plots the values of fCRIT for the naturalexamples depending on mR together with thoseexperimentally obtained.
Experimental and natural datasets present a similarbehaviour. Values of fCRIT of the natural examples arestrongly dependent on the value of mR considered,especially at high roof aspect ratios. Values of criticalerupted magma chamber volume fraction of naturalexamples fit the experimental curve particularly at lowroof aspect ratios (r<0.7–0.85), e.g., Aira, LongValley and La Pacana caldera. In contrast, for calderaswith high roof aspect ratios (r>0.7–0.85), fCRITvalues match notably the log-fit only if a partialemptying of the magma chamber is considered, e.g.Crater Lake (mR∼80%), Ceboruco (mR∼70%), Vesu-vius (mR∼70%), Pinatubo (mR∼75%).
Apart from the influence of mR we argue thatdiscrepancies between natural and experimental valuesmay have at least two additional origins. First,experimental measures of the fCRIT are obtained whenthe ring fault system is not completely developed(extensional fractures have just begin to propagatedownwards and to evolve into vertical or sub-verticalfaults). In contrast, in a natural case, the value of fCRIT isinferred from the volume of the pre-caldera depositsVPC. The limit between pre- and syn-caldera deposits ismarked, for example, by a sudden large increase on thelithic contents due to the opening of ring faults (Rocheand Druitt, 2001), or by changes observed in theeruptive style, e.g. a Plinian phase followed by largevolumes of pyroclastic flows during the Minoaneruption of Santorini volcano (Bond and Sparks,1976) or the climactic eruption of Mount Mazama(Bacon, 1983). Both datasets may have, therefore, asmall “temporal” shift that implies that fCRIT values forexperiments may be underestimated with respect tonatural examples. A second source of discrepancy maycome from the wide error bar related to the calculationof the roof aspect ratio in natural examples (e.g. CraterLake r=0.5–1, Pinatubo r=2.4–3.2). For example, thefCRIT value for Crater Lake caldera assuming r=0.81(value within the range proposed by Roche and Druitt,2001) matches perfectly the experimental curve whenmR=80%. In contrast, if r=1 the chamber could beemptied up to 90% in volume and the fCRIT value wouldstill match the experimental log-fit.
385A. Geyer et al. / Journal of Volcanology and Geothermal Research 157 (2006) 375–386
A number of analytical models based on physicalproperties of magmas have correlated extruded volumesto magma chamber pressure drops. Despite these studiesdo not focus on the structural evolution that they canroughly predict the erupted volume at the onset ofcollapse by assuming a chamber underpressure equal tothe strength of the embedding rocks. Druitt and Sparks(1984) estimated values of fCRIT between 10 and 30%,whereas Martí et al. (2000) came up with values rangingfrom a few percent for deep, gas-poor reservoirs, to 40%for shallow, gas-rich chambers. On the other hand,Roche and Druitt (2001) proposed variations in fCRITfrom less than 10% to the whole chamber volumedepending on the roof aspect ratio. Our experimentalresults constrain fCRIT to values lower than 55% exceptfor very high aspect ratio chambers r>2.
5. Summary and conclusions
We have performed analogue experiments on theformation of collapse calderas. The experimentalapparatus allows us to track the temporal evolution ofthe experiments. From a structural point of view, we havedistinguished four specific events during the process thatleads to the initiation of caldera collapse:
1) Appearance of surface fractures in the extensionalarea.
2) Nucleation at depth of the first “bell-shaped” faults.3) Propagation to the surface of the “bell-shaped” faults.4) Downward propagation of the extensional surface
fractures, evolving into vertical or sub-vertical faults,so collapse onset is controlled by a combination ofthe internal reverse faults and these vertical or sub-vertical ring faults.
We have measured the erupted magma chambervolume fraction f required to achieve each structuralevent during the collapse process. For any phenomenon,it is possible to establish a relationship between f and theroof aspect ratio of the experimental system. Note that innatural systems f is also dependent on the magma massfraction of volatiles. Notwithstanding this, this experi-mental dependency f(r) is well reproduced by a log-function. The obtained results of fCRIT values (criticalerupted magma chamber fraction necessary to triggercaldera onset) are in agreement with natural examplesand previous analytical models based on properties ofmagmas. The determination of fCRIT in the collapse onsetis of particular interest for volcanic hazard assessmentand for interpretation of volcanic deposits and volcanoevolution. If we know the volume of extruded deposits
during the pre-caldera phase and are able to establish thecritical erupted magma chamber fraction required for thecaldera onset, there will be a possibility to calculate thetotal volume of the magmatic reservoir before thecompletion of the eruptive event, and furthermore, theremaining magma inside the chamber. This informationis crucial in order to determine the eruptive evolution ofthe volcano and to forecast future eruptions of thevolcanic system.
Acknowledgements
This work has been partially funded by theEXPLORIS project (EVR1-2001-00047). We thankYan Lavallée, an anonymous referee and the editor Dr.Herman Engelen for their thorough and constructivereview and comments on the manuscript.
References
Acocella, V., Cifelli, F., Funiciello, R., 2000. Analogue models ofcollapse calderas and resurgent domes. Journal of Volcanology andGeothermal Research 104, 81–96.
Acocella, V., Funiciello, R., Marotta, E., Orsi, G., de Vita, S., 2004.The role of extensional structures on experimental calderas andresurgence. Journal of Volcanology and Geothermal Research 129,199–217.
Bacon, C.R., 1983. Eruptive history of Mount Mazama and CraterLake Caldera, Cascade Range, U.S.A. Journal of Volcanology andGeothermal Research 18, 57–115.
Bond, A., Sparks, R.S.J., 1976. The Minoan eruption of Santorini,Greece. Journal of the Geological Society (London) 312, 1–16.
Bower, S.M., Woods, A.W., 1997. Control of magma volatile contentand chamber depth on the mass erupted during explosive volcaniceruptions. Journal of Geophysical Research 102, 10273–10290.
Burov, E.B., Guillou-Frottier, L., 1999. Thermomechanical behaviourof large ash flow calderas. Journal of Geophysical Research 104,23081–23109.
Branney, M.J., 1995. Downsag and extension at calderas: newperspectives on collapse geometries from ice-melt, mining, andvolcanic subsidence. Bulletin of Volcanology 57, 303–318.
Browne, B.L., Gardner, J.E., 2004. The nature and timing of calderacollapse as indicated by accidental lithic fragments from the AD-1000 eruption of Volcán Ceboruco, Mexico. Journal of Volcanol-ogy and Geothermal Research 130, 93–105.
Druitt, T.H., Bacon, C.R., 1989. Petrology of the zone calc-alkalinemagma chamber of Mount Mazama, Crater Lake, Oregon.Contributions to Mineralogy and Petrology 101, 245–259.
Druitt, T.H., Francaviglia, V., 1992. Caldera formation on Santoriniand the physiography of the islands in the late Bronze Age.Bulletin of Volcanology 54, 484–493.
Druitt, T.H., Sparks, R.S.J., 1984. On the formation of calderas duringignimbrite eruptions. Nature 310, 679–681.
Folch, A., Martí, J., 2004. Geometrical and mechanical constraints onthe formation of ring-fault calderas. Earth and Planetary ScienceLetters 221, 215–225.
Gardner, J.E., Tait, S., 2000. The caldera-forming eruption of VolcánCeboruco, Mexico. Bulletin of Volcanology 62, 34–52.
386 A. Geyer et al. / Journal of Volcanology and Geothermal Research 157 (2006) 375–386
Gudmundsson, A., Martí, J., Turón, E., 1997. Stress fields generatingring faults in volcanoes. Geophysical Research Letters 24,1559–1562.
Guillou-Frottier, L., Burov, E.B., Milési, J.-P., 2000. Genetic linksbetween ash-flow calderas and associated ore deposits as revealedby large-scale thermo-mechanical modeling. Journal of Volcanol-ogy and Geothermal Research 102, 339–361.
Hildreth, W., 1991. The timing of caldera collapse at Mount Katmai inresponse to magma withdrawal toward Novarupta. GeophysicalResearch Letters 18, 1541–1544.
Hildreth, W.F., Fierstein, J., 2000. Overview: Katmai volcanic clusterand the great eruption of 1912. Geological Society of AmericaBulletin 112, 1594–1620.
Hildreth, W., Lanphere, M.A., Fierstein, J., 2003. Geochronology anderuptive history of the Katmai volcanic cluster, Alaska Peninsula.Earth and Planetary Science Letters 214, 93–114.
Holohan, E.P., Troll, V.R., Walter, T.R., Münn, S., McDonnell, S.,Shipton, Z.K., 2005. Elliptical calderas in active tectonic settings:an experimental approach. Journal of Volcanology and GeothermalResearch 144, 119–136.
Hubbert, M.K., 1937. Theory of scale models as applied to the study ofgeologic structures. Geological Society of America Bulletin 48,1459–1520.
Kennedy, B., Stix, J., Vallance, J.W., Lavallée, Y., Longpré, M.-A.,2004. Controls on caldera structure: results from analogue sandboxmodeling. Geological Society of America Bulletin 116, 515–524.
Komuro, H., 1987. Experiments on cauldron formation: a polygonalcauldron and ring fractures. Journal of Volcanology and Geother-mal Research 31, 139–149.
Komuro, H., Fujita, Y., Kodama, K., 1984. Numerical andexperimental models on the formation mechanism of collapsebasins during the Green Tuff orogenesis of Japan. Bulletin ofVolcanology 47, 649–666.
Krantz, R.W., 1991. Measurements of friction coefficients andcohesion for faulting and fault reactivation in laboratory modelsusing sand and sand mixtures. In: Cobbold, P.R. (Ed.), Experi-mental and Numerical Modelling of Continental Deformation:Tectonophysics, vol. 188, pp. 203–207.
Lavallée, Y., Stix, J., Kennedy, B., Richer, M., Longpré, M.-A., 2004.Caldera subsidence in areas of variable topographic relief: resultsfrom analogue modeling. Journal of Volcanology and GeothermalResearch 129, 219–236.
Lindsay, J.M., de Silva, S., Trumbull, R., Emmermann, R., Wemmer,K., 2001. La Pacana caldera, N. Chile: a re-evaluation of thestratigraphy and volcanology of one of the world's largestresurgent caldera. Journal of Volcanology and GeothermalResearch 106, 145–173.
Lipman, P.W., 1984. The roots of ash flow calderas in western NorthAmerica: windows into the tops of granitic batholiths. Journal ofGeophysical Research 89, 8801–8841.
Lipman, P.W., 1992. Ash-flow calderas as structural controls of oredeposits-recent work and future problems. U.S. Geological SurveyBulletin 2012, L1–L12.
Lipman, P.W., 1997. Subsidence of ash-flow calderas: relation tocaldera size and magma-chamber geometry. Bulletin of Volcanol-ogy 59, 198–218.
Macedonio, G., Dobran, F., Neri, A., 1994. Erosion processes involcanic conduits and application to the AD 79 eruption ofVesuvius. Earth and Planetary Science Letters 121, 137–152.
Martí, J., Ablay, G.J., Redshaw, L.T., Sparks, R.S.J., 1994.Experimental studies of collapse calderas. Journal of theGeological Society (London) 151, 919–929.
Martí, J., Folch, A., Macedonio, G., Neri, A., 2000. Pressure evolutionduring caldera-forming eruptions. Earth and Planetary ScienceLetters 175, 275–287.
Newhall, C.G., Dzurisin, D., 1988. Historical unrest at large calderasof the world. U.S. Geological Survey Bulletin 1855, 1–1108.
Newman, A.V., Dixon, T.H., Gourmelen, N., 2006. A four-dimensional viscoelastic deformation model for Long ValleyCaldera, between 1995 and 2000. Journal of Volcanology andGeothermal Research 150, 244–269.
Philipponat, G., Hubert, B., 1997. Fondations et ouvrages en terre.GéotechniqueEyrolles, Paris. 548 pp.
Roche, O., Druitt, T.H., 2001. Onset of caldera collapse duringignimbrite eruptions. Earth and Planetary Science Letters 191,191–202.
Roche, O., Druitt, T.H., Merle, O., 2000. Experimental study ofcaldera formation. Journal of Geophysical Research 105, 395–416.
Roche, O., van Wyk de Vries, B., Druitt, T.H., 2001. Sub-surfacestructures and collapse mechanisms of summit pit craters. Journalof Volcanology and Geothermal Research 105, 1–18.
Sanford, A.L., 1959. Analytical and experimental study of simplegeologic structures. Geological Society of America Bulletin 70,19–52.
Schmitt, A.K., Lindsay, J.M., de Silva, S., Trumbull, R., 2002. U–Pbzircon chronostratigraphy of early-Pliocene ignimbrites from LaPacana, north Chile: implications for the formation of stratifiedmagma chambers. Journal of Volcanology and GeothermalResearch 120, 43–53.
Smith, R.L., 1979. Ash-flow magmatism. Special Paper - GeologicalSociety of America 180, 5–27.
Spera, F., Crisp, J.A., 1981. Eruption volume, periodicity, and calderaarea: relationships and inferences on development of composi-tional zonation in silicic magma chambers. Journal of Volcanologyand Geothermal Research 11, 169–187.
Suzuki-Kamata, K., Kamata, H., Bacon, C.R., 1993. Evolution of thecaldera-forming eruption at Crater Lake, Oregon, indicated bycomponent analysis of lithic fragments. Journal of GeophysicalResearch 98, 14059–14074.
Walter, T.R., Troll, V.R., 2001. Formation of caldera periphery faults:an experimental study. Bulletin of Volcanology 63, 191–203.
Whittaker, B.N., Reddish, D.J., 1989. Subsidence. Occurrence,Prediction and Control. Developments in Geotechnical Engineer-ing, vol. 56. Elsevier, Amsterdam. 528 pp.
Williams, H., 1941. Calderas and their origin. University of CaliforniaPublications in Geological Sciences 25, 239–346.
Wilson, L., Sparks, R.S.J., Walker, G., 1980. Explosive volcaniceruptions-IV. The control of magma properties and conduitgeometry on eruption column behaviour. Geophysical Journal ofthe Royal Astronomical Society 63, 117–148.