Scenario Earthquake Hazards for the Long Valley Caldera ...
96
U.S. Department of the Interior U.S. Geological Survey Open-File Report 2014–1045 CGS Special Report 233 Version 2.0, January 2018 Scenario Earthquake Hazards for the Long Valley Caldera-Mono Lake Area, East-Central California
-
Upload
khangminh22 -
Category
Documents
-
view
0 -
download
0
Transcript of Scenario Earthquake Hazards for the Long Valley Caldera ...

U.S. Department of the InteriorU.S. Geological Survey
Open-File Report 2014–1045CGS Special Report 233Version 2.0, January 2018
Scenario Earthquake Hazards for the Long Valley Caldera-Mono Lake Area, East-Central California

Cover. Map showing ground motion intensity of an M6.7 earthquake on Hartley Springs Fault.

Scenario Earthquake Hazards for the Long Valley Caldera-Mono Lake Area, East-Central California
By Rui Chen, David M. Branum, Chris J. Wills, and David P. Hill
Open-File Report 2014–1045CGS Special Report 233Version 2.0, January 2018
U.S. Department of the InteriorU.S. Geological Survey

U.S. Department of the InteriorRYAN K. ZINKE, Secretary
U.S. Geological SurveyWilliam H. Werkheiser, Deputy Director exercising the authority of the Director
U.S. Geological Survey, Reston, VirginiaFirst release: 2014Revised: January 2018 (ver. 2.0)
For more information on the USGS—the Federal source for science about the Earth, its natural and living resources, natural hazards, and the environment—visit https://www.usgs.gov or call 1–888–ASK–USGS.
For an overview of USGS information products, including maps, imagery, and publications, visit https://store.usgs.gov.
Any use of trade, firm, or product names is for descriptive purposes only and does not imply endorsement by the U.S. Government.
Although this information product, for the most part, is in the public domain, it also may contain copyrighted materials as noted in the text. Permission to reproduce copyrighted items must be secured from the copyright owner.
Suggested citation:Chen, R., Branum, D.M., Wills, C.J., and Hill, D.P., 2018, Scenario earthquake hazards for the Long Valley Caldera-Mono Lake area, east-central California (ver. 2.0, January 2018): U.S. Geological Survey Open-File Report 2014–1045, and California Geological Survey Special Report 233, 84 p., https://doi.org/10.3133/ofr20141045.
ISSN 2331-1258 (online)

iii
STATE OF CALIFORNIAEDMUND G. BROWN JR.
GOVERNOR
THE NATURAL RESOURCES AGENCY
CALIFORNIA GEOLOGICAL SURVEY
DEPARTMENT OF CONSERVATION
SECRETARY FOR NATURAL RESOURCESJOHN LAIRD
DAVID BUNN
JOHN G. PARRISH
DIRECTOR
STATE GEOLOGIST

iv
AcknowledgmentsThis work was sponsored by the U.S. Geological Survey. We thank Art Frankel for his
computer program; Vincent Quitoriano and David Wald for their assistance in preparing ShakeMap files for liquefaction and landslide analysis; and Chuck Real, Tim McCrink, and William Bryant for providing photographs of rockfall, liquefaction, and surface rupture. The authors benefited from discussions with Margaret Mangan, and constructive review comments from David Shelly, Chuck Real, Timothy Dawson, and Tom Hanks. We thank Bill Bryant for providing fault and seismicity geographic information systems data.

v
ContentsAbstract ...................................................................................................................................................................1Introduction ............................................................................................................................................................2Scenario Earthquake Hazard Estimation Methods ........................................................................................6
Scenario Earthquake Magnitudes and Recurrence Intervals ............................................................7Ground Shaking Hazards............................................................................................................................8Deterministic Fault Displacement Hazards ..........................................................................................10Landslide Hazards .....................................................................................................................................11Liquefaction Hazards ................................................................................................................................15
Scenario Earthquake Hazard Results .............................................................................................................16Fish Slough M6.7 Scenario ......................................................................................................................17Hartley Springs M6.5 Scenario ...............................................................................................................21Hilton Creek M6.5 Scenario .....................................................................................................................27Mono Lake M6.7 Scenario .......................................................................................................................31Round Valley M7.0 Scenario ....................................................................................................................37White Mountains M7.35 Scenario ..........................................................................................................42Comparison of Scenario Earthquake Hazard Results ........................................................................46
Summary ...............................................................................................................................................................48References Cited .................................................................................................................................................51Appendix A. Distributed Fault Displacement and Probabilistic Fault Displacement Hazard
Analyses Methodology and Results ..................................................................................................54Appendix B. Results for Hartley Springs M6.7 Scenario .............................................................................67Appendix C. Results for Hilton Creek M6.8 Scenario ...................................................................................73Appendix D. Results for Hilton Creek M6.6 Scenario ..................................................................................79

vi
Figures
1. Map showing distribution of Quaternary faults in the Long Valley Caldera-Mono Lake area ........................................................................................................................................................3
2. Map showing distribution of faults considered in the 2008 National Seismic Hazard Maps in the Long Valley Caldera-Mono Lake study area ...........................................................4
3. Seismicity map showing epicenters of M≥ 3 earthquakes ........................................................5 4. Photograph showing surface rupture on normal faults can occur on multiple nearly-
parallel strands ....................................................................................................................................6 5. Photograph showing fault displacement in the 2010 M7.2 Sierra Cucapah earthquake in
Baja California ......................................................................................................................................6 6. Map showing rupture traces of three Hilton Creek and two Hartley Springs earthquake
scenarios ..............................................................................................................................................9 7. Map showing average shear wave velocity in the uppermost 30 meters .............................10 8. Diagram of parameters used in fault displacement hazard analysis .....................................11 9. Photograph showing earthquake-triggered landslides ............................................................12 10. Photograph showing rockfalls triggered by the Mammoth Lakes earthquakes of
May 1980 .............................................................................................................................................12 11. Geologic map compilation ...............................................................................................................14 12. Map showing rock friction angles .................................................................................................15 13. Photograph showing damage to Drew Road at the bridge over the New River, Imperial
County California, in the 2010 Sierra Cucapah earthquake ......................................................16 14. Maps showing ground motion hazards of an M6.7 earthquake on Fish Slough Fault ........17 15. Map showing median deterministic principal fault displacement along fault strike for
the Fish Slough M6.7 scenario .......................................................................................................20 16. Map showing potential liquefaction and landslide areas for the Fish Slough M6.7
scenario ..............................................................................................................................................21 17. Maps showing ground motion hazards of an M6.5 earthquake on Hartley Springs
Fault ......................................................................................................................................................22 18. Map showing median deterministic principal fault displacement along fault strike for
the Hartley Springs M6.5 scenario ................................................................................................25 19. Map showing potential liquefaction and landslide areas for the Hartley Springs M6.5
scenario ..............................................................................................................................................26 20. Maps showing ground motion hazards of an M6.5 earthquake on Hilton Creek Fault .......27 21. Map showing median deterministic principal fault displacement along fault strike for
the Hilton Creek M6.5 scenario ......................................................................................................30 22. Map showing potential liquefaction and landslide areas for the Hilton Creek M6.5
scenario ..............................................................................................................................................31 23. Maps showing ground motion hazards of an M6.8 earthquake on Mono Lake Fault .........32 24. Map showing median deterministic principal fault displacement along fault strike for
the Mono Lake M6.7 scenario ........................................................................................................35 25. Map showing potential liquefaction and landslide areas for the Mono Lake M6.7
scenario ..............................................................................................................................................36 26. Maps showing ground motion hazards of an M7.0 earthquake on Round Valley Fault......37 27. Map showing median deterministic principal fault displacement along fault strike for
the Round Valley M7.0 earthquake scenario ...............................................................................40 28. Map showing potential liquefaction and landslide areas for the Round Valley M7.0
scenario ..............................................................................................................................................41 29. Maps showing ground motion hazards of an M7.35 earthquake on White Mountains
Fault Zone ...........................................................................................................................................42
vii
30. Map showing median deterministic principal fault displacement along fault strike for the White Mountains M7.35 scenario ...........................................................................................45
31. Map showing potential liquefaction and landslide areas for the White Mountains M7.35 scenario ..................................................................................................................................46
32. Graph showing comparison of median deterministic principal fault displacements along fault strike for all scenario earthquakes ...........................................................................48
33. Map of median deterministic principal fault displacement along fault strike for all faults ....................................................................................................................................................49
A-1. Percentile deterministic principal fault displacements for an M7.35 earthquake on the White Mountains Fault Zone ...........................................................................................................57
A-2. Percentile deterministic distributed fault displacement for an M7.35 earthquake on the White Mountains Fault Zone ...........................................................................................................57
A-3. Percentile deterministic principal fault displacements for an M6.5 earthquake on the Hilton Creek ........................................................................................................................................58
A-4. Percentile deterministic distributed fault displacement for an M6.5 earthquake on the Hilton Creek ........................................................................................................................................59
A-5. Distribution of deterministic fault rupture displacement along the hypothesized main traces of the Hilton Creek Fault ......................................................................................................60
A-6. Distribution of deterministic fault rupture displacement partitioned among multiple mapped fault traces for the Hilton Creek Fault ...........................................................................63
A-7. Calculated fault displacement hazards along a line perpendicular to fault strike at two selected locations .............................................................................................................................65
A-8. Calculated fault displacement hazards for the Hilton Creek M6.8 scenario recurring every 273 years along a line perpendicular to fault strike at two selected locations .........65
A-9. Comparison of calculated fault displacement hazards for the Hilton Creek M6.8 scenario, recurring every 273 years, in the hanging-wall and footwall regions along a line perpendicular to fault strike at two selected locations .....................................................66
B-1. Maps showing ground motion hazards of an M6.7 earthquake on Hartley Springs Fault ......................................................................................................................................................68
B-2. Map showing median deterministic principal fault displacement along fault strike for the Hartley Springs M6.7 scenario ................................................................................................71
B-3. Map showing potential liquefaction and landslide areas for the Harley Springs M6.7 scenario ..............................................................................................................................................72
C-1. Ground motion hazards of an M6.8 earthquake on the Hilton Creek Fault 2008 National Seismic Hazard Maps scenario .....................................................................................................74
C-2. Potential liquefaction and landslide areas for the Hilton Creek M6.8 earthquake scenario based on the 2008 National Seismic Hazard Maps ...................................................77
C-3. Percentile deterministic principal fault displacements for an M6.8 earthquake on the Hilton Creek Fault as part of the scenario based on the 2008 National Seismic Hazard Maps ....................................................................................................................................................78
C-4. Percentile deterministic distributed fault displacement for an M6.8 earthquake on the Hilton Creek Fault as part of the scenario based on the 2008 National Seismic Hazard Maps ....................................................................................................................................................78
D-1. Ground motion hazards of an M6.6 earthquake on the Hilton Creek Fault (alternative 1) .....................................................................................................................................80
D-2. Potential liquefaction and landslide areas for the Hilton Creek M6.6 scenario (alternative 1) ......................................................................................................................................83
D-3. Percentile deterministic principal fault displacements for an M6.6 earthquake on the Hilton Creek Fault (alternative 1) ....................................................................................................84
D-4. Percentile deterministic distributed fault displacement for an M6.6 earthquake on the Hilton Creek Fault (alternative 1) ....................................................................................................84

viii
Tables
1. Summary of earthquake scenarios and parameters ...................................................................7 2. Correlation of various ground motion parameters .......................................................................8 3. Slope categories and high end values used in calculation ......................................................13 4. Angle of friction for geologic units ................................................................................................14 5. Summary of scenario ground motions ..........................................................................................47 6. Ground motion hazards at the town of Mammoth Lakes ..........................................................47 7. Summary of estimated rupture displacement at highway crossings .....................................48 A-1. Summary of location uncertainty for strike-slip faults ..............................................................55 A-2. Summary of deterministic principal rupture displacements for the earthquake scenarios ....56 A-3. Summary of deterministic distributed rupture displacements at 1 kilometer from the
fault for the earthquake scenarios ................................................................................................58

AbstractAs part of the U.S. Geological Survey’s (USGS) multi-
hazards project in the Long Valley Caldera-Mono Lake area, the California Geological Survey (CGS) developed several earthquake scenarios and evaluated potential seismic hazards, including ground shaking, surface fault rupture, liquefaction, and landslide hazards associated with these earthquake scenarios. The results of these analyses can be useful in estimating the extent of potential damage and economic losses because of potential earthquakes and also for preparing emergency response plans.
The Long Valley Caldera-Mono Lake area has numerous active faults. Five of these faults or fault zones are considered capable of producing magnitude ≥6.7 earthquakes according to the Uniform California Earthquake Rupture Forecast, Version 2 (UCERF 2) developed by the 2007 Working Group on California Earthquake Probabilities (WGCEP) and the USGS National Seismic Hazard Mapping Program. These five faults are the Fish Slough, Hartley Springs, Hilton Creek, Mono Lake, and Round Valley Faults. CGS developed earthquake scenarios for these five faults in the study area and for the White Mountains Fault Zone to the east of the study area.
In this report, an earthquake scenario is intended to depict the potential consequences of significant earthquakes. A scenario earthquake is not necessarily the largest or most damaging earthquake possible on a recognized fault. Rather it is both large enough and likely enough that emergency planners should consider it in regional emergency response plans. In particular, the ground motion predicted for a given scenario earthquake does not represent a full probabilistic hazard assessment, and thus it does not provide the basis for hazard zoning and earthquake-resistant building design.
Earthquake scenarios presented here are based on fault geometry and activity data developed by the WGCEP, and are consistent with the 2008 Update of the United States National Seismic Hazard Maps (NSHM). Alternatives to the NSHM scenario were developed for the Hilton Creek and Hartley Springs Faults to account for different opinions in how far these two faults extend into Long Valley Caldera. For each scenario, ground motions were calculated using the current standard practice: the deterministic seismic hazard analysis program developed
Scenario Earthquake Hazards for the Long Valley Caldera-Mono Lake Area, East-Central California
By Rui Chen,1 David M. Branum,1 Chris J. Wills,1 and David P. Hill2
1California Geological Survey.2U.S. Geological Survey.
by Art Frankel of USGS and three Next Generation Ground Motion Attenuation (NGA) models. Ground motion calculations incorporated the potential amplification of seismic shaking by near-surface soils defined by a map of the average shear wave velocity in the uppermost 30 m (VS30) developed by CGS.
In addition to ground shaking and shaking-related ground failure such as liquefaction and earthquake induced landslides, earthquakes cause surface rupture displacement, which can lead to severe damage of buildings and lifelines. For each earthquake scenario, potential surface fault displacements are estimated using deterministic and probabilistic approaches. Liquefaction occurs when saturated sediments lose their strength because of ground shaking. Zones of potential liquefaction are mapped by incorporating areas where loose sandy sediments, shallow groundwater, and strong earthquake shaking coincide in the earthquake scenario. The process for defining zones of potential landslide and rockfall incorporates rock strength, surface slope, and existing landslides, with ground motions caused by the scenario earthquake.
Each scenario is illustrated with maps of seismic shaking potential and fault displacement, liquefaction, and landslide potential. Seismic shaking is depicted by the distribution of shaking intensity, peak ground acceleration, and 1.0-second spectral acceleration. One-second spectral acceleration correlates well with structural damage to surface facilities. Acceleration greater than 0.2 g is often associated with strong ground shaking and may cause moderate to heavy damage. The extent of strong shaking is influenced by subsurface fault dip and near surface materials. Strong shaking is more widespread in the hanging wall regions of a normal fault. Larger ground motions also occur where young alluvial sediments amplify the shaking. Both of these effects can lead to strong shaking that extends farther from the fault on the valley side than on the hill side.
The effect of fault rupture displacements may be localized along the surface trace of the mapped earthquake fault if fault geometry is simple and the fault traces are accurately located. However, surface displacement hazards can spread over a few hundred meters to a few kilometers if the earthquake fault has numerous splays or branches, such as the Hilton Creek Fault. Faulting displacements are estimated to be about 1 meter along normal faults in the study area and close to 2 meters along the White Mountains Fault Zone.
All scenarios show the possibility of widespread ground failure. Liquefaction damage would likely occur in the areas of

2 Scenario Earthquake Hazards for the Long Valley Caldera-Mono Lake Area, East-Central California
higher ground shaking near the faults where there are sandy/silty sediments and the depth to groundwater is 6.1 meters (20 feet) or less. Generally, this means damage is most common near lakes and streams in the areas of strongest shaking. Landslide potential exists throughout the study region. All steep slopes (>30 degrees) present a potential hazard at any level of shaking. Lesser slopes may have landslides within the areas of the higher ground shaking. The landslide hazard zones also are likely sources for snow avalanches during winter months and for large boulders that can be shaken loose and roll hundreds of feet down hill, which happened during the 1980 Mammoth Lakes earthquakes.
Whereas methodologies used in estimating ground shaking, liquefaction, and landslides are well developed and have been applied in published hazard maps; methodologies used in estimating surface fault displacement are still being developed. Therefore, this report provides a more in-depth and detailed discussion of methodologies used for deterministic and probabilistic fault displacement hazard analyses for this project.
IntroductionThe Long Valley Caldera-Mono Lake volcanic chain
in east-central California is a geologically youthful volcanic system capable of future volcanic activity as well as recurring earthquakes (Hill and others, 2001). Some historical earthquakes were large enough to have caused ground failure and damage to infrastructure. The 1980 earthquake swarms included four magnitude (M) ≈6 earthquakes that produced extensive surface rupture (Taylor and Bryant, 1980) and widespread rockfalls (Bryant, 1980), causing property damage and injuries. With continuing volcanic unrest and regional tectonic activity, medium to large-size earthquakes are likely to continue in the region. Quantifying potential earthquake hazards for realistic earthquake scenarios can be useful in estimating the extent of potential damage and economic losses from future earthquakes and in preparing emergency management and response plans.
As part of a multi-hazards project in the Long Valley Caldera-Mono Lake area sponsored by the U.S. Geological Survey (USGS), the California Geological Survey (CGS) developed several earthquake scenarios and evaluated seismic hazards, including potential ground shaking, surface fault displacement, liquefaction, and landslides associated with these earthquake scenarios. An earthquake scenario is developed assuming that a particular fault ruptures over a certain length, producing a certain magnitude earthquake. The earthquake magnitude that a fault is capable of producing and its average recurrence interval are estimated based on fault dimensions, slip rate, and rupture style (strike-slip, normal, or reverse faulting). Once an earthquake scenario is developed, median ground motions are predicted at all locations in a selected region surrounding the fault using ground motion prediction equations (GMPE). Surface rupture associated with the earthquake scenario is evaluated in the vicinity of the fault using methodologies and empirical equations established
in seismological literature. Liquefaction and landslide potentials are then assessed using established methodologies and predicted scenario ground motions as input. Ground motions predicted for a given scenario earthquake do not represent a full probabilistic hazard assessment, and thus do not provide the basis for hazard zoning and earthquake-resistance design.
The Long Valley Caldera-Mono Lake area has numerous active faults as shown in figures 1 and 2. These faults are part of a fault system that forms the boundary between the Sierra Nevada and the Basin and Range geomorphic provinces. Tectonic activity in the region reflects the combined influence of dextral slip along the boundary of the Pacific Plate and North American Plate, and the westward crustal extension of the Basin and Range Province. Delineations of the boundaries of the focus study area and extended study area specified by USGS for this project also are shown in figures 1 and 2. Five fault zones in the focus study area are considered capable of producing M≥6.7 earthquakes according to the Uniform California Earthquake Rupture Forecast, Version 2 (UCERF 2) developed by the 2007 Working Group on California Earthquake Probabilities (WGCEP) and the National Seismic Hazard Mapping Program (NSHMP) (2007 Working Group on California Earthquake Probabilities, 2008); these are the Fish Slough Fault, Hartley Springs Fault, Hilton Creek Fault, Mono Lake Fault, and Round Valley Fault. In addition, the White Mountains Fault Zone, Death Valley Fault Zone, and Deep Springs Fault in the extended study area are considered capable of producing M≥6.7 earthquakes (fig. 2). CGS developed earthquake scenarios for all five major faults in the focus study area and for the White Mountains Fault Zone. The Death Valley Fault Zone and Deep Springs Fault are not included because of their large distances from the Long Valley Caldera. Faults in the focus study area are predominantly normal faults with relatively clear surface expressions. Faults in the eastern part of the extended study area are predominantly strike-slip faults. Most of these faults are included within Alquist-Priolo earthquake fault zones (A-P zones) determined by CGS based on the Alquist-Priolo Earthquake Fault Zoning Act enacted in 1972 by the California State Legislature following the destructive February 9, 1971, M6.6 San Fernando earthquake. New construction for human occupancy is prohibited across active faults within these mapped zones (see description of the Act and implementation at http://www.conservation.ca.gov/cgs/rghm/ap/).
Although the 1980 earthquake swarms triggered minor offsets along the Hilton Creek Fault, these earthquakes did not originate on the Hilton Creek Fault. Focal mechanisms of the four M≈6 earthquakes are predominantly strike-slip with a northeast-southwest extensional component (Cramer and Toppozada, 1980; Hill, 2006). According to Cramer and Toppozada (1980) and Hill (2006), the 1980 earthquakes appear to align with northeast-southwest trending lineaments located 2–3 kilometers (km) south of the Long Valley Caldera. These lineaments were not mapped as active faults prior to the earthquakes and are not shown in figure 2.
The region south of Long Valley Caldera has experienced persistent moderate to strong earthquakes dating from the 1860s in eastern California (Ryall and Ryall, 1980; Hill and others, 1985), including the 1872 M7.6 Lone Pine earthquake in Owens Valley

Introduction 3
Bishop
Benton
Big Pine
Lee Vining
Mammoth Lakes
(/6
(/395
Ã120
Ã168
Ã167
Ã270
Ã203
Ã266
Ã168
Ã120
Ã168
118°0'W
118°0'W
118°30'W
118°30'W
119°0'W
119°0'W
38°0
'N
38°0
'N
37°3
0'N
37°3
0'N
0 10 20 30Kilometers Fault Activity Map
Older Faults
Fault AgeHistoric
Holocene
Late Quaternary
Quaternary
Focus study area
Extended study area
Ü
6
395
Long Valley Caldera
Mono Lake
Nevada
California
Figure 1. Map showing distribution of Quaternary faults in the Long Valley Caldera-Mono Lake area. Faults are color coded according to the age of their most recent activity. Focus study area and extended study area also are shown as defined for this study by the project team. Base map credit: National Elevation Dataset.
with a surface rupture that extended to within 60 km of the caldera (Hill, 2006). From 1910 to 1970, about 20 M5 to M6 earthquakes occurred within 50 km of the southern margin of the Long Valley Caldera (Hill, 2006). With the increasing ability of regional seismic networks to record and accurately locate small magnitude earthquakes, the earthquake catalog has become more populated with small earthquakes in the last few decades. Patterns of recorded M≥3 earthquakes in the extended study area are shown in figure 3. Seismic activity in the region shows complex temporal-spatial clustering and is often correlated with episodic unrest in Long Valley Caldera and subsurface magma activity in Mono-Inyo domes volcanic field (Hill, 2006). The high-resolution double difference catalog reveals distinctive west-northwest striking seismicity lineations south of the resurgent dome within the Long Valley Caldera and north-northeast striking lineations south of the Long Valley Caldera in the Sierra Nevada block (fig. 3 inset map). Focal mechanisms indicate that these lineations reflect a conjugate
set of west-northwest striking dextral faults and north-northeast striking sinistral faults that are dominant seismogenic sources of the recorded seismic activity. This pattern, along with the focal mechanisms of a subset of M5 to M6 earthquakes, suggests a regional northeast-east extensional tectonic stress field that also controls the activity of large-range-front normal faults, such as the Hilton Creek Fault, despite the fact that none of these faults appear to have participated in the seismic activity in any significant way during the short history of earthquake records.
For this project, the development of earthquake scenarios is based on fault geometry and activity data developed by the 2007 Working Group on California Earthquake Probabilities (2008), and is consistent with the 2008 update of the National Seismic Hazard Maps (NSHM) (Petersen and others, 2008). We developed two additional scenarios for the Hilton Creek Fault and one for the Hartley Springs Fault to account for differing opinions regarding their respective extensions into

4 Scenario Earthquake Hazards for the Long Valley Caldera-Mono Lake Area, East-Central California
Long Valley Caldera (Hill and Montgomery-Brown, 2015). For each scenario, ground motions were calculated using the USGS deterministic seismic hazard analysis program developed by Art Frankel (U.S. Geological Survey, written commun., 2009) and the same three ground motion prediction equations (Boore and Atkinson, 2008; Campbell and Bozorgnia, 2008; Chiou and Youngs, 2008) used in the 2008 NSHM. Ground motion calculations incorporated the amplification effect of site soil conditions defined by a map of the average shear wave velocity in the uppermost 30 m (VS30), which was developed by CGS (Wills and Clahan, 2006). Ground motion hazards for each scenario are illustrated in seismic shaking potential maps using the distribution of shaking intensity, peak ground acceleration (PGA), and 1.0-second spectral accelerations (SA).
Evaluation of potential earthquake-induced ground failure is important because buildings and lifelines can be severely damaged by ground failure during a seismic
event. Evaluation of fault displacement hazards uses the methodologies and regression relations developed by Petersen and others (2011) for strike-slip faults and Youngs and others (2003) for normal faults. For each earthquake scenario, potential surface fault displacements are estimated using deterministic and probabilistic approaches. The probabilistic approach incorporates uncertainties in both fault displacement amplitude and rupture location; it estimates the likelihood and severity of principal and distributed fault displacements on and near each earthquake fault. Potential displacements at selected hazard levels are calculated along multiple profiles oriented perpendicular to a fault. The deterministic approach considers only uncertainties in fault displacement amplitude. A methodology is developed to partition predicted deterministic fault displacement among multiple branches of the northern extension of Hilton Creek Fault. Calculated displacements with 2 percent probability of exceedance in 50 years are presented
Bishop
Benton
Big Pine
Lee Vining
Mammoth Lakes
(/6
(/395
Ã120
Ã168
Ã167
Ã270
Ã203
Ã266
Ã168
Ã120
Ã168
White M
ountains
Round Valley
Death Valley (N of Cucamongo)
Mono Lake
Fish
Slo
ugh
Deep
Spr
ings
118°0'W
118°0'W
118°30'W
118°30'W
119°0'W
119°0'W
38°0
'N
38°0
'N
37°3
0'N
37°3
0'N
Ü0 10 20 30
Kilometers 2008 WGCEP Faults Other Faults
Fault NamesFish Slough
Hartley Springs
Hilton Creek
Mono Lake
Round Valley
Death Valley
Deep Springs
White Mountains
Focus study area
Extended study area6
395Long Valley Caldera
Mono Lake
Nevada
California
Hilton Creek
Death Valley
Hartley Springs
Figure 2. Map showing distribution of faults considered in the 2008 National Seismic Hazard Maps in the Long Valley Caldera-Mono Lake study area. The focus study area, and the extended study area also are shown as defined for this study by the project team. Base map credit: National Elevation Dataset.

Introduction 5
Mono Lake
118°0'W
118°0'W
118°30'W
118°30'W
119°0'W
119°0'W
38°0
'N
38°0
'N
37°3
0'N
37°3
0'N
Ü
0 10 20 30Kilometers
Magnitude3.0 - 4.0
4.0 - 4.5
4.5 - 5.0
5.0 - 5.5
5.5 - 6.4
M >= 5.5
(/395
Ã203
119°0'W
37°3
0'N
37°3
0'N
0 3 6 9Kilometers
Figure 3. Seismicity map showing epicenters of M≥ 3 earthquakes. Earthquakes recorded from 1984 to 2009 are downloaded from the Double Difference Earthquake Catalog for Northern California (http://www.ldeo.columbia.edu/~felixw/NCAeqDD/) and are shown in orange. The rest are downloaded from the U.S. Geological Survey/National Earthquake Information Center catalog (http://earthquake.usgs.gov/earthquakes/eqarchives/epic/epic_rect.php) and are shown in yellow. Circle sizes represent earthquake magnitude as indicated by the explanation. The high-resolution Double Difference catalog reveals distinctive west-northwest striking seismicity lineations south of the resurgent dome within the Long Valley Caldera and north-northeast striking lineations south of the Long Valley Caldera in the Sierra Nevada block as shown in the insert. Base map credit: National Elevation Dataset.
as displacement hazard maps for the Hilton Creek and White Mountains scenarios.
Numerous slopes in the Long Valley-Mono Lake area may become unstable during an earthquake. Areas of potential landslides are delineated using a modified version of the landslide hazard mapping method developed by the CGS Seismic Hazards Mapping Program (McCrink and Real, 1996) that incorporates rock strength, surface gradient, existing landslides, and ground motions caused by earthquake scenarios. Liquefaction occurs when saturated sediments lose their cohesion because of ground shaking. Assuming that groundwater is less than 6.1 meters from the ground surface, zones of potential liquefaction are mapped by incorporating areas that are probably underlain by loose sandy
sediments, have shallow groundwater, and will experience strong ground motions caused by the earthquake scenarios. Zones of potential landslides and liquefaction are presented as a landslide and liquefaction hazards map for each earthquake scenario.
This report documents the methodologies for estimating hazards, presents scenario earthquake hazard results, summarizes major findings, and discusses practical implications and remaining issues. Probabilistic fault displacement hazard analysis methodology (PFDHA) and results for selected faults, and additional deterministic fault displacement hazard results are presented in appendix A. Additional hazard results for the Hilton Creek Fault are documented in appendixes B and C.

6 Scenario Earthquake Hazards for the Long Valley Caldera-Mono Lake Area, East-Central California
Scenario Earthquake Hazard Estimation Methods
The faults in the focus study area are short (<50 km) compared to faults in the eastern part of the extended study area (fig. 1), which usually are greater than 100-km long. Consequently, the potential earthquake magnitude is smaller for the faults in the Long Valley-Mono Lake area than for the longer White Mountains or Death Valley Fault Zones. Fault traces generally have clear surface expressions in this area. The normal faults often have complicated geometries, and consist of multiple subparallel strands or branches that spread over tens of kilometers. Surface rupture on normal faults can occur on multiple parallel traces (fig. 4). In contrast to normal faults, the White Mountain and Death Valley Fault Zones are primarily strike-slip faults and have simpler geometries, similar to the Sierra Cucapah Fault shown in figure 5. Fault traces in figure
1 are color coded by their age (that is, the latest surface offset). There is a group of widespread, predominantly normal faults with Holocene activity on the volcanic tablelands near the southeast boundary of the focus area. These faults are too small to have produced significant earthquake events, but they have experienced triggered slip from earthquakes on adjacent faults such as the White Mountains Fault Zone to the east and Owens Valley Fault to the south (Taylor and Bryant, 1980).
Faults and fault zones that are considered significant seismic sources in the 2008 NSHM are shown in figure 2. Simplified fault traces modeled in the 2008 NSHM are plotted as thick straight-line segments on top of the mapped Alquist-Priolo (A-P) earthquake fault zone fault traces. Although Death Valley Fault Zone and Deep Springs Fault are considered significant seismic sources in the 2008 NSHM, we excluded them in our study because they are rather far from the focus area and pose lesser earthquake hazards than the closer faults.
Figure 4. Photograph showing surface rupture on normal faults can occur on multiple nearly parallel strands as it did on this section of the fault that ruptured during the 1983 M7.3 Borah Peak, Idaho earthquake. Photograph by K. Haller, U.S. Geological Survey.
Figure 5. Photograph showing fault displacement in the 2010 M7.2 Sierra Cucapah earthquake in Baja California was oblique, with more than 2 meters of lateral, and a lesser amount of vertical displacement. In this image, the gully in the center has been offset to the right, as well as vertically, across the fault. This amount and style of displacement could occur in a major earthquake on the White Mountains Fault Zone. Photograph by T. Rockwell from Brandenberg and others (2010).

Scenario Earthquake Hazard Estimation Methods 7
Scenario Earthquake Magnitudes and Recurrence Intervals
We developed scenario earthquakes based on fault geometry and activity data from the 2007 WGCEP and relevant information in geologic literature. Some pertinent data are presented in table 1. For each earthquake scenario, magnitude is calculated based on the fault area using equations of Ellsworth (Working Group on California Earthquake Probabilities, 2003, equation 4.5) and Hanks and Bakun (2008). Both equations estimate magnitudes based on regressions of magnitude (m) and rupture area (A) as shown below:
(1)
for Ellsworth-B magnitude, and
(2)
for Hanks and Bakun magnitude. The magnitude used for the scenarios is the average of the two equations, as is done in the UCERF 2 and 2008 NSHM. The White Mountains Fault Zone is capable of producing the largest earthquake among the earthquake faults considered in this study. Applying the Ellsworth-B relation to M<7 earthquakes lead to high stress-drop earthquakes. Consequently, high-frequency ground motion (Tom Hanks, U.S. Geological Survey, oral commun., 2012) and fault displacements may be higher than if only the Hanks and Bakun (2008) relation is used. The frequency of earthquakes is expressed as a recurrence interval (T), calculated as
(3)
where v is fault slip rate and Dave is the average displacement for a given magnitude. Dave is estimated using the Wells and Coppersmith (1994) regressions between average displacement and earthquake magnitude, m:
(4)
where Dave is in meters. Regression coefficients are a = −6.32, b = 0.90 for strike-slip faults; and a = −4.45, b = 0.63 for normal faults. The standard deviation, ε, is 0.28 for strike-slip faults and 0.33 for normal faults in log10 units. The Wells and Coppersmith (1994) regression equation is consistent with the average displacement data from recent earthquakes, such as those used in Wesnousky (2008) and Petersen and others (2011). Among the faults considered, the Hilton Creek and Mono Lake Faults are the most active (with the highest slip rates) and, consequently, have the highest rate of potential earthquake occurrences.
With two exceptions, our estimates of scenario ground motion hazards are based on the fault geometry defined by coordinates used in the 2008 NSHM (thick straight-line segments in fig. 2). The two exceptions are the Hartley Springs Fault and the Hilton Creek Fault. Under the NSHM geometry, both of these Sierra Nevada range-front faults extend well into Long Valley Caldera with a left-stepping overlap within the caldera of some 10 km. Evidence cited by Hill and Montgomery-Brown (2015), however, indicates that this geometry violates both geologic and kinematic constraints. They conclude that significant post-caldera slip on both faults terminates at the north and south caldera boundary, respectively. The oblique link between the offset faults corresponds to the dextral South-Moat Seismic Zone (SMSZ), which is the kinematic analog of a leaky transform
Name Fault type1 M 230-yr probability
(M≥6.7)3
(percent)
Slip rate(mm/yr)3
Recur-rence
(years)4
Rupture length(km)1,2
Rupture area
(sq. km)1,2
Fish Slough Normal 6.7 0.16 0.20 2,951 26 441
HartleySprings
NSHM scenarioNormal
6.70.40 0.50
1,180 25 418Alternative5 6.5 883 14 238
Hilton CreekNSHM scenario
Normal6.8
2.55 2.50273 29 497
Alternative 15 6.6 204 21 357Alternative 25 6.5 177 15 255
Mono Lake Normal 6.7 2.12 2.50 236 26 436Round Valley Normal 7.0 1.38 1.00 912 43 735White Mountains Strike-Slip 7.35 1.18 1.00 1,972 111 1,438
Table 1. Summary of earthquake scenarios and parameters.
[NSHM, National Seismic Hazard Maps; mm/yr, millimeters per year; sq. km, square kilometers; GIS; geographic information system]
1Dataset from the U.S. Geological Survey 2008 update of the United States National Seismic Hazard Maps, except noted otherwise in the text.2Average of Hanks and Bakun (2008) and Ellsworth-B (Working Group on California Earthquake Probabilities, 2003, equation 4.5b) magnitudes.3Uniform California Earthquake Rupture Forcast Version 2 (UCERF-2) supplementary excel spreadsheet, sheet 12-B-fault data, except noted otherwise.4Calculated based on slip rate and average displacement for a given magnitude using regression equations of Wells and Coppersmith (1994).5Rupture lengths are calculated using GIS coordinates of fault traces.
m = log10 (A)+ 4.2
m = log10 (A)+ 3.98 A < 537 km2
m =1.333log10 (A)+ 3.07 A > 537 km2
⎡
⎣⎢⎢
T = Dave / v
log10 (Dave )= a+bm±ε

8 Scenario Earthquake Hazards for the Long Valley Caldera-Mono Lake Area, East-Central California
fault. The SMSZ has been the locus of recurring earthquake swarms within the caldera over several decades. Hazard estimates for versions of the Hartley Springs and Hilton Creek Faults that terminate at the caldera boundary as proposed by Hill and Montgomery-Brown (2015) are presented in the main text. Hazard estimates based on the NSHM depiction of these faults are presented in appendixes B and C, respectively. An intermediate version of the Hilton Creek Fault that extends 7 km into the caldera is presented in appendix D. The surface traces of three Hilton Creek and two Hartley Springs earthquake scenarios are shown in figure 6.
The 2007 WGCEP and NSHMP estimated the mean probability of an M≥6.7 earthquake occurring in a 30-year period for all major faults in California and presented their estimates in the UCERF 2 report (2007 Working Group on California Earthquake Probabilities, 2008). Based on their estimate, the Hilton Creek Fault has the highest 30-year probability (2.55 percent) for an M≥6.7 earthquake in the Long Valley Caldera-Mono Lake area (table 1). The total mean 30-year probability for an M≥6.7 earthquake is 6.6 percent (range is 3.8–9.9 percent) in focus area and 30.4 percent (range is 23.6–43.3 percent) in the extended study area (including the Death Valley Fault Zone).
Ground Shaking Hazards
Ground motions for earthquake scenarios are estimated using ground motion prediction equations (GMPE) of Boore and Atkinson (2008), Campbell and Bozorgnia (2008), and Chiou and Youngs (2008). These empirical attenuation relations predict earthquake ground shaking as PGA, peak ground velocity (PGV), and SA at various periods at a given site-to-fault distance, magnitude, site VS30 value, and so on. For ground motion calculations, we used the deterministic seismic hazard analysis (DSHA) program developed by Art Frankel (U.S. Geological Survey, written commun., 2009). Ground
motions were calculated on a 0.01-degree grid. Selected parameters were contoured and presented as ground motion hazard maps. The calculations incorporated the amplification effects of site soil conditions. Site condition is approximated by a simplified map of the average shear wave velocity in the uppermost 30 m (VS30) developed for California by CGS (Wills and Clahan, 2006). Ground motion amplification is achieved by GMPE scaling using VS30 values extracted from the VS30 map of Wills and Clahan (2006) (fig. 7).
Both instrumental intensity and accelerations are calculated. Accelerations are contoured in units of percent g (where g is acceleration due to gravity and is equal to 981 centimeters per second squared [cm/s2]). Instrumental intensity is an estimation of the Modified Mercalli Intensity (MMI) based on a combined regression of recorded PGA and PGV amplitudes versus observed intensity for eight California earthquakes that have instrumental ground motion recordings (Wald and others, 1999). The regression is based on PGV for MMI greater than VII, on PGA for MMI less than V, and on a linear combination of PGV and PGA for MMI between V and VII. A table describing MMI ratings is available from the Association of Bay Area Governments website (http://www.abag.ca.gov/bayarea/eqmaps/doc/mmi.html). Instrumental intensity is consistent with the concept that low intensities are determined by felt accounts (sensitive to ground acceleration), and high intensities are associated with damage in flexible structures (sensitive to ground velocity) (Wald and others, 1999). Instrumental intensity is correlated with perceived shaking, potential damage to structures, PGA, and PGV in table 2. Spectral acceleration at 1.0 second portrays the maximum response of a single-degree-of-freedom (SDOF) oscillator with 1.0 second of natural period and 0.5 percent damping ratio to an input ground motion. Consequently, it reflects potential response of structures with natural periods near 1.0 second to earthquake ground motions and correlates well with structural damage of medium height buildings.
Table 2. Correlation of various ground motion parameters.
[Based on Wald and others (1999) and U.S. Geological Survey ShakeMap website (http://earthquake.usgs.gov/earthquakes/shakemap/). PGV, peak ground velocity; % g, percent of acceleration because of gravity (equal to 981 cm/s2); cm/s, centimeters per second; >, greater than; <, less than]
Perceived shakingNotfelt Weak Light Moderate Strong Very strong Severe Violent Extreme
Potential damage None None None Very light Light Moderate Moderate/Heavy Heavy Very heavy
Peak acceleration (% g)
<0.17 0.17–1.4 1.4–3.9 3.9–9.2 9.2–18 18–34 34–65 65–124 >124
PGV(cm/s)
<0.1 0.1–1.1 1.1–3.4 3.4–8.1 8.1–16 16–31 31–60 60–116 >116
Instrumental intensity
I II–III IV V VI VII VIII IX X+

Scenario Earthquake Hazard Estimation Methods 9
Figure 6. Map showing rupture traces of three Hilton Creek and two Hartley Springs earthquake scenarios. Thick red line segments show the 2008 U.S. Geological Survey National Seismic Hazard Maps (NSHM) scenario. Base map credit: National Elevation Dataset.

10 Scenario Earthquake Hazards for the Long Valley Caldera-Mono Lake Area, East-Central California
Deterministic Fault Displacement Hazards
Evaluations of fault displacement hazards used methodologies and regression relations developed in Petersen and others (2011) for strike-slip faults, and Youngs and others (2003) for normal faults. Both studies consider displacement on the fault as principal fault displacement and displacement off the fault as distributed fault displacement. Only the methodologies and results for deterministic principal fault displacement hazard are presented in this report. The probabilistic methodologies and results for principal and distributed fault displacement hazards are documented in appendix C.
Fault displacement hazard analysis of Petersen and others (2011) considers a fault and site (x, y). Figure 8 shows the location of a site relative to the fault and illustrates the significance of the variables used in the analysis. The dimension of the area in which hazard is calculated is z. The area is located a distance r from the
6
395
Long Valley Caldera
Nevada
California
Figure 7. Map showing average shear wave velocity (in meters per second) in the uppermost 30 meters (VS30). Base map credit: National Elevation Dataset.
potential rupture and distance l measured from the nearest point on the rupture to the closest end of the rupture of total length L. In the hazard calculation, displacement on the fault is denoted as D, and displacement at a site off the fault as d. The location on the fault closest to the site is identified by l/L, the ratio of distance from the closest end divided by the total rupture length.
A number of uncertainties are important in fault displacement hazard assessment, including uncertainties in earthquake magnitude, frequency, and location; in the amount and distribution of offset an earthquake of a given magnitude would produce; and in location of surface rupture from future earthquakes. Whereas probabilistic fault displacement hazard analyses are capable of quantifying most of these uncertainties, deterministic fault displacement hazards are calculated considering only uncertainty in fault displacement amplitudes for a given earthquake magnitude. Deterministic fault displacement hazard analyses also neglect how often a scenario earthquake occurs.

Scenario Earthquake Hazard Estimation Methods 11
z
Site (x, y) l
r
Rupture
l/L = 0
l/L = 0
l/L = 0.5
Figure 8. Diagram of parameters used in fault displacement hazard analysis (after Petersen and others, 2011).
Deterministic fault displacements are the median and percentile displacement values calculated using empirical equations that represent the statistical distribution of fault displacement data. In studies by Youngs and others (2003) and Peterson and others (2011), fault displacement data are assumed to have a log normal distribution. For strike-slip faults, Petersen and others (2011) derived the following elliptical regression with respect to (l/L) and linear regression with respect to earthquake magnitude, m:
(5)
where l is distance to the closest end of rupture, L is the length of rupture. The standard deviation of this regression is 1.1348 in natural log units. l/L takes a value between 0 at the end of rupture and 0.5 at the middle of rupture. Displacement calculated using equation 1 is the median displacement value. Percentile displacement is the displacement value that has the probability of the given percentile not being exceeded if the scenario earthquake happens. The percentile displacement value is calculated by integrating the lognormal distribution with a mean calculated using equation 1 and a standard deviation of 1.1348. The median displacement is also the 50th percentile displacement.
For normal faults, Youngs and others (2003) fitted the principal fault displacement data from historical normal faulting earthquakes using the following gamma distribution:
(6)
where y = D/Dave and Γ () is the gamma function. Parameters a and b are functions of location on the fault:
(7)
Dave can be calculated using the Wells and Coppersmith (1994) average displacement and magnitude (m) regression:
(8)
where Dave is in meters (m). For normal faults, a is -4.45 and b is 0.63. This regression has a standard deviation of 0.33 in log10 units.
For each of the scenarios, we calculated the amount of displacement that could occur along the fault based on the earthquake magnitude and type of faulting. The amount of displacement is greater for longer faults that generate larger magnitude earthquakes. The longer White Mountain Fault Zone therefore is projected to have more fault displacement than the shorter faults in the focus study area.
Landslide Hazards
Landslide hazards are important to consider in the Long Valley Caldera region because there are a large number of slopes that may become unstable and cause injuries and property damage during an earthquake. Earthquake-triggered landslides generally are rockslides and rockfalls, as defined by Keefer (1984) and Cruden and Varnes (1996). Rockslides involve bedrock, which remains largely intact for at least a portion of the movement. Rockslides can range in size from small and thin to very large and thick. The sliding occurs at the base of the rock mass along relatively thin zones of weakness (fig. 9). Rockfalls involve a mass of rock that detaches from a steep slope by sliding, spreading, or toppling, and descends primarily through the air by falling, bouncing, or rolling. Rockfalls can range from a single boulder to a mass of numerous boulders falling at the same time. Major earthquakes may trigger large numbers of rockfalls, and a much smaller number of large landslides. Rockfalls also can be triggered by earthquake shaking over a broad area. Glacially deposited erratics at high elevations along steep canyon walls were jarred loose and rolled downslope during the May 1980 earthquakes near Mammoth Lakes. Nine earthquake-related injuries occurred, almost all caused by rockfalls (fig. 10; Sylvester, 1980).
Earthquake-triggered snow avalanches present an added hazard during winter months with heavy snow cover and during heavy snow storms (Podolskiy and others, 2010). Shaking from an M>6 earthquake somewhere in the region has the potential for triggering simultaneous avalanches over broad areas at high elevations. The triggering potential depends on a number of factors, including cumulative snow-fall history, state of the current snow pack, the strength and duration of shaking, and current weather (triggering potential increases during heavy snow storms; Bair and others, 2012). Although triggering potential depends only weakly on slope angle, the avalanche hazard increases in correlation with slope angle and thickness of the detached snow slab (Bair and others, 2012; Bair, 2013).
ln(D)= 3.3041 1− 10.52
[(l / L)− 0.5]2 +1.7927m−11.2192
F(y)= 1r(a)
ya−1e−y dy0
y/b∫
a = exp[−0.193+1.628(l / L)]b = exp[0.009− 0.476(l / L)]
log(Dave )=−a+bm

12 Scenario Earthquake Hazards for the Long Valley Caldera-Mono Lake Area, East-Central California
Figure 9. Photograph showing that earthquake-triggered landslides can include large masses of rock that break away from steep canyon walls and begin to slide as an intact mass before breaking up. “The Slide” in Slide Canyon in Yosemite National Park slid down the steep canyon wall and across the flat valley floor. It is not known if an earthquake triggered this pre-historic landslide.
Figure 10. Photograph showing rockfalls triggered by the Mammoth Lakes earthquakes of May 1980. Rockfalls triggered by these earthquakes included single large boulders that broke away from steep slopes and rolled or bounced across lower slopes (left), and areas where numerous boulders and smaller rocks fell down steep gullies and spread out across gentler slopes below (across the snow field in the photograph at right). Photographs by C. Real, California Geological Survey, May 1980.

Scenario Earthquake Hazard Estimation Methods 13
Little research exists on earthquake-triggered snow avalanches, and we do not pursue the issue further except to note that, although the chances of an M>6 earthquake occurring in the region during periods of high triggering potential are small, the hazard is real and should be taken into account in emergency response planning. The spatial extent of avalanche hazards will correspond approximately to the landslide hazard zones mapped in this study. Both Mammoth Mountain Ski Area and the U.S. Forest Service track avalanche potential during the winter months.
A modified version of the landslide hazard mapping method developed by the CGS Seismic Hazards Mapping Program (California Geological Survey, 2004) was used to determine areas of potential landslide. The CGS method is based on the Newmark method (Newmark, 1965). The mapped hazard zones show areas where there is a possibility of land failure because of earthquake shaking. These hazard zones also indicate possible source zones for rockfalls or rockslides because of steep slope and the type of deposits. Newmark (1965) recognized the limitations of a factor of safety approach to dynamic slope stability analyses and devised a method of estimating the magnitude of ground displacement caused by a given earthquake ground motion. The Newmark method calculates the amount of ground displacement due to ground motion considering slope and rock strength. The USGS tested the Newmark method on a landslide triggered by the 1979 Coyote Lake earthquake (Wilson and Keefer, 1983), and pioneered the application of the Newmark analysis for mapping earthquake-induced landslide hazard potential in San Mateo County, California (Wieczorek and others, 1985). McCrink and Real (1996) calibrated and validated the San Mateo County mapping methodology using landslides and near-field strong-motion records from the 1989 Loma Prieta earthquake. They developed parameters and specific procedures allowing the method to be run on a geographic information system (GIS) to map earthquake-induced landslide zones on a regional basis. The following assumptions apply to the McCrink and Real (1996) GIS-based mapping method: (1) failure is an infinite-slope type failure (that is, a relatively shallow failure that has a failure surface parallel to the ground surface); (2) only unsaturated slope conditions are considered; and (3) the response of geologic materials to earthquake shaking, in terms of landslide failure potential, is characterized by the materials’ shear strength properties.
McCrink and Real (1996) recommended using the most appropriate combination of strength parameters available for the
hazard map area. They also indicated that the internal angle of friction (φ) alone is adequate for regional mapping of earthquake-induced landslide potential. Where appropriate, adverse bedding conditions (out-of-slope bedding) should be identified, and shear strength values of weaker materials (such as shale interbeds in a predominantly sandstone formation) should be applied. If geotechnical shear test data are insufficient or lacking for a mapped geologic unit, such a unit should be grouped with lithologically and stratigraphically similar units for which shear strength data are available. Published shear strength values can be used if necessary. The result of the shear strength characterizations should be a geologic material strength map, wherein the areas depicted on the map no longer represent “formations,” but areas of similar shear strength.
The McCrink and Real (1996) procedure for slope stability calculations consists of (1) a calculation of a static factor of safety (FS), followed by (2) a calculation of the yield acceleration (ay) from the Newmark equation (Newmark, 1965):
(9)
where g is acceleration because of gravity, and α is the direction of movement of the slide mass, in degrees measured from the horizontal, when displacement is initiated (Newmark, 1965). FS is estimated from static stability analysis. For an infinite-slope failure model, α is the same as the slope angle. Yield acceleration is the horizontal ground acceleration required to cause FS to equal 1.0. FS is calculated in this case as (tan φ / tan α).
McCrink and Real (1996) recommend the use of the most accurate and up-to-date terrain data available to derive slope and aspect maps. Digital terrain data should have a minimum vertical accuracy of 7 m, and a minimum horizontal resolution of 10 m. The slope map used for the study area was derived from a 10-m digital elevation model. Slope angles were grouped into eight categories (table 3). The high end of each category was used in the calculation.
An earthquake-induced landslide-potential map is prepared by combining and comparing (overlaying) the geologic material strength map with a slope gradient map. Hazard potential is evaluated and classified into four categories based on the amount of calculated Newmark displacement and corresponding slope angle for each geologic unit caused by the selected strong-motion record: (1) very low: displacements
ay = (FS −1)gsinα
Table 3. Slope categories and high-end values used in calculation.
[<, less than; >, greater than]
Slope group (degrees) <3 3–5 5–10 10–15 15–20 20–30 30–40 >40
High-end slope (degrees) 3 5 10 15 20 30 40 50

14 Scenario Earthquake Hazards for the Long Valley Caldera-Mono Lake Area, East-Central California
Figure 11. Geologic map compilation. Map sources include the 2003 U.S. Geological Survey Long Valley Caldera geographic information system database, the 2006 National Park Service’s Digital Yosemite Map, and the Wills and Clahan (2006) site conditions map. Base map credit: National Elevation Dataset.
less than 5 cm, (2) low: displacements from 5 to 15 cm, (3) moderate: displacements from 15 to 30 cm, and (4) high: displacements of 30 cm or greater. Using Newmark’s equation, all areas with slopes greater than 30 degrees are considered at risk during even minimum ground shaking. Additional hazard zones are due to the combined effects of scenario ground motion, slope, and shear strength of the geologic material.
The geologic map used for the study area (figs. 11 and 12) was created by combining the USGS Long Valley Caldera digital geology map (Battaglia and others, 2003) with the National Park Service Yosemite map (Kuhn, 2006, in the northwest corner of the study area). The remaining area was filled in with the Wills and Clahan (2006) statewide site conditions map. The geologic units from the maps were divided into eight groups: Holocene alluvium (Qal), Pleistocene alluvium (Qoa), Quaternary volcanic (Qv), Tertiary sedimentary (Tss), Tertiary volcanic (Tv), pre-Cenozoic metamorphic (meta), pre-Cenozoic crystalline (xtaline), and talus/landslide deposits (Tal/Qls). These geologic units were further grouped by general shear strength (quantified by φ). The φ values (table 4) were assigned using published data for comparable geologic units used in CGS landslide hazard zone mapping (California Division of Mines and Geology, 1998).
Table 4. Angle of friction for geologic units.
[φ, internal angle of friction; Qal, Holocene alluvium; Qoa, Pleistocene alluvium; Qv, Quaternary volcanic; Tss, Tertiary sedimentary; Tv, Tertiary volcanic; meta, pre-Cenozoic metamorphic; xtaline, pre-Cenozoic crystalline; Tal/Qls, talus/landslide deposits]
Geologic unit ϕ (degrees)
Qal, Qoa, Qv 32Tss, Tv 34Meta, xtaline 37Tal/Qls 14
A maximum φ of 37 degrees was used because areas mapped as very hard rock (pre-Cenozoic crystalline and metamorphic) are often covered by soil or other materials that would likely trigger a landslide at a lower ground motion than a solid unit of rock (that is, it is more likely that surficial materi-als will break loose and be displaced than that large pieces of solid, crystalline rock will shear apart and be displaced). Geo-logic units with lower φ values are more likely to fail during earthquake shaking.

Scenario Earthquake Hazard Estimation Methods 15
Figure 12. Map showing rock friction angles (ϕ in degrees). Base map credit: National Elevation Dataset.
- Phi 37 (granitics and metamorphics)
- Phi 34 (Tertiary volcanic and sedimentary)
- Phi 32 (Quaternary volcanic and alluvium)
- Phi 14 (previous landslides and talus)
To create the landslide hazard map, the geologic map was combined with the slope map. This map was then merged with each of the scenario PGA maps. The resulting map consisted of thousands of polygons, each containing values of slope angle, φ, and PGA. Values of slope angle and magnitude for the scenario event were then entered into the Newmark equation, and if the resulting ground motion required for possible failure was equal to or lower than the scenario ground motion for the polygon, the area was selected as a possible landslide hazard zone. This mapping criterion is very conservative, because research on the Newmark approach has demonstrated that triggered-failure threshold should be based on mass displacement of at least 5–10 cm. Simply reaching a factor of safety of 1 does not mean the slide will move. The displacement threshold will vary for different shaking levels, which is why the Newmark method requires double integration of an accelerogram above prescribed acceleration levels (exceedance of critical acceleration).
Liquefaction Hazards
Liquefaction occurs when unconsolidated, saturated soils are subject to significant ground shaking. Four key types of
information generally are required to map zones of potential liquefaction (California Geological Survey, 2004): (1) geologic maps that characterize depositional environments and relative ages of Quaternary sedimentary deposits; (2) groundwater data used to estimate depths to saturated soils; (3) geotechnical borehole data that describe the lithology and engineering properties of subsurface deposits; and (4) seismic data that provide ground-motion parameters (liquefaction opportunity) used in quantitative liquefaction analyses.
The vast majority of liquefaction hazard areas are underlain by recently deposited sand and silt. These deposits are not randomly distributed, but occur within a narrow range of sedimentary and hydrologic environments. Investigators commonly use geologic criteria to establish boundaries of areas susceptible to liquefaction (Youd, 1991). Useful information includes Quaternary geologic maps that show relative age estimates of depositional units, stratigraphic relations, soil profile descriptions, and age reported in literature. In addition to maps, analysis of historical aerial photographs and other remote sensing imagery may reveal areas of flooding, recent sediment accumulation, or evidence of past liquefaction.
Saturation reduces the effective normal stress of near-surface sediment, thereby increasing the likelihood of earthquake-induced

16 Scenario Earthquake Hazards for the Long Valley Caldera-Mono Lake Area, East-Central California
liquefaction (Youd, 1973). Areas with near-surface saturated soil, or areas that are anticipated to have near-surface saturated soil in the future, can be identified by compiling and interpreting groundwater data. “Near-surface” implies a depth of less than 12.2 meters (40 feet). Natural hydrologic processes and human activities can cause groundwater levels to fluctuate over time. Therefore, it is impossible to predict depths to saturated soils during future earthquakes. One method of addressing time-variable depths to saturated soils is to establish an anticipated high groundwater level based on historical groundwater data. Geotechnical information useful for liquefaction analyses includes available geotechnical reports and information on the engineering properties of late Quaternary sediment.
The scope of this project and its regional scale did not allow for collection of geotechnical data, so a simpler method was used to produce the liquefaction hazard zones for the six scenarios in the Long Valley Caldera-Mono Lake area owing to lack of groundwater and geotechnical data. The zones were created by first determining areas with Quaternary (alluvium and older alluvium) deposits and slopes less than 3 degrees. Then Holocene alluvial areas (Qal) where scenario ground motions (PGA) were equal to or greater than 0.20 g and Pleistocene alluvial areas (Qoa) where scenario ground motions were equal to or greater than 0.28 g were mapped as liquefaction hazard zones (California Geological Survey, 2004). California Geological Survey (2004) recommends using a ground motion of 0.30 g for Pleistocene alluvial areas, but our scenario ground motion contours prepared with the ShakeMap utility did not include a 0.30 g contour so we used 0.28 g instead. Because of the lack of groundwater data, groundwater is assumed to be 0–6.1 meters below ground surface.
Not all areas that could be subject to liquefaction will experience the same level of damage, because damage depends on the severity of surface ground deformation, which generally increases with increasing thickness of liquefiable sediments, and is highly variable. Liquefaction can cause settlement of the ground surface, cracking, and lateral spreading, a form of landsliding that can occur on very gentle slopes owing to liquefaction of a soil layer. Liquefaction damage to structures typically is related to differential settlement. Liquefaction damage to roads is common at bridges and bridge approaches. Settlement of bridge approach fills can be damaging enough to close a road, even without structural damage to the bridge (fig. 13).
Scenario Earthquake Hazard ResultsPertinent hazard results from ground shaking, fault
displacement, landslide, and liquefaction hazard analyses are presented for most of the scenarios given in table 1. Results for M6.5 earthquakes for versions the Hartley Springs and Hilton Creek Faults that terminate at the caldera boundary are presented in the main text below. Results for the NSHM scenario M6.7 and M6.8 earthquakes on the Hartley Springs and Hilton Creek Faults are in appendixes B and C respectively. The intermediate M6.6 scenario for the Hilton Creek Fault is presented in appendix D. Only the median deterministic fault displacement hazard results are presented here. Fractile fault displacement results and probabilistic fault displacement results are in appendix A.
Figure 13. Photograph showing damage to Drew Road at the bridge over the New River, Imperial County California, in the 2010 Sierra Cucapah earthquake. Liquefaction has led to slumping and settlement of approach fills and cracking between the fills and the bridge. Photograph by T. McCrink, California Geological Survey, April 2010.

Scenario Earthquake Hazard Results 17
Fish Slough M6.7 Scenario
An M6.7 earthquake on the Fish Slough Fault would produce strong ground shaking in an area centered on Fish Slough but include parts of the Chalfant Valley (along U.S. Route 6) and northern Owens river valley (along U.S. Route 395 south of Bishop). Instrumental intensity, median PGA, and median SA for this scenario are shown in figure 14. The maximum MMI is 8.7, corresponding to severe to violent perceived shaking, and moderate to heavy potential damage. The maximum PGA and SA at 1.0 second are 0.57 g and 0.69 g, respectively. The maximum shaking occurs in the immediate vicinity of the southern portion of Fish Slough Fault in the Bishop area, where the loose near-surface soil amplifies the shaking. The affected areas with at least strong perceived shaking and light potential damage (that is, intensity ≥6.0) extend as far as 23 km from the fault trace. The areas with at least very strong perceived shaking and moderate potential damage (that is, intensity ≥7.0) extend to about 13 km
in the hanging wall regions and 10 km in the footwall regions. Severe perceived shaking and moderate to heavy potential damage (intensity ≥8.0) are limited to the southern part of the fault near Bishop and along U.S. Route 6 in Chalfant Valley. Although the affected areas with PGA greater than 0.1 g extend 34 km in the hanging wall from the modeled fault traces, the areas with PGA greater than 0.4 g are limited to the immediate vicinity of the fault (11 km in the hanging wall). Areas with PGA greater than 0.5 g are limited to the hanging-wall side only, extending approximately 6 km away from the fault. The distribution of SA at 1.0 second is similar to that of MMI, showing irregular shapes, apparently an effect of local site conditions.
The median principal displacements along a simplified fault trace are shown in figure 15. The maximum fault displacement is 72 cm, occurring in the middle of the fault. Predicted displacement values decrease toward the rupture ends. U.S. Route 6 crosses the south end of Fish Slough Fault, where the estimated displacement is about 38 cm. At the northern end, the mapped fault terminates
Bishop
6
395
Nevada
California
Death Valley
Hartley Springs
Hilton Creek
A
Figure 14. Maps showing ground motion hazards of an M6.7 earthquake on Fish Slough Fault. A, Modified Mercalli Intensity (MMI), B, median peak ground acceleration (PGA), and C, median spectral acceleration (SA) at 1.0 second. Base map credit: National Elevation Dataset. % g, percent acceleration due to gravity.

18 Scenario Earthquake Hazards for the Long Valley Caldera-Mono Lake Area, East-Central California
6
395
Bishop
Nevada
California Death Valley
Hartley Springs
Hilton Creek
B
Figure 14.—Continued

Scenario Earthquake Hazard Results 19
Figure 14.—Continued
6
395
Bishop
Nevada
California
Death Valley
Hartley Springs
Hilton Creek
C
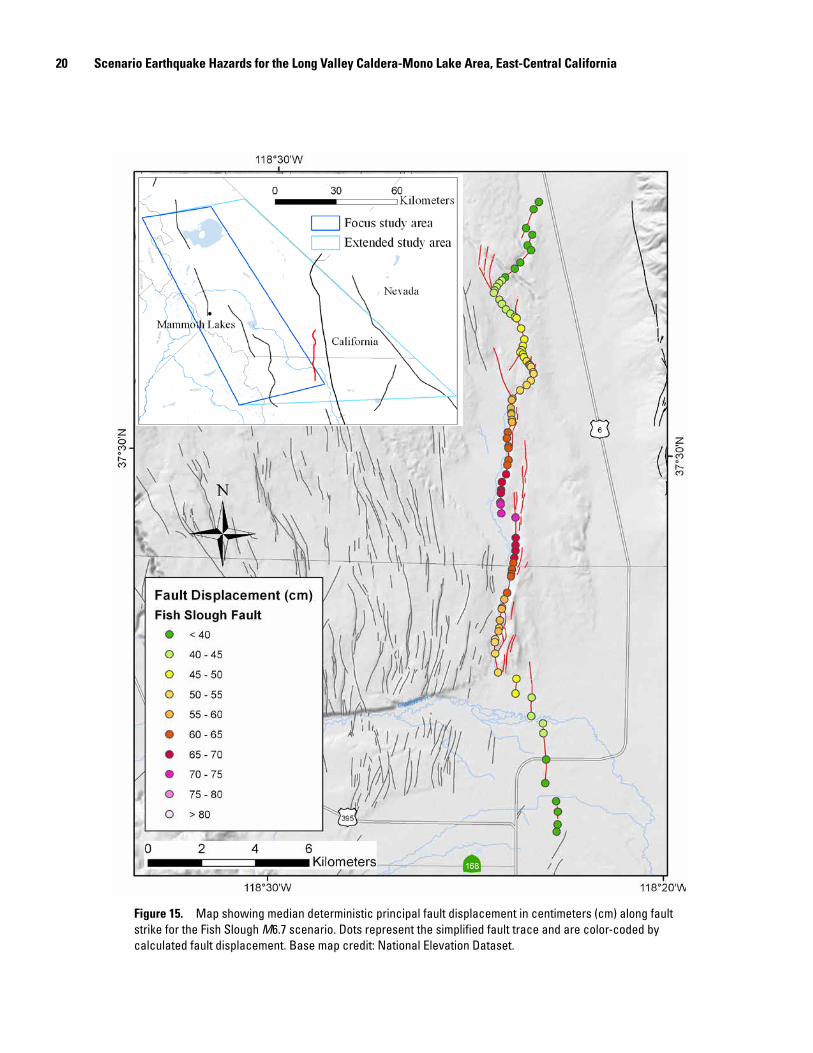
20 Scenario Earthquake Hazards for the Long Valley Caldera-Mono Lake Area, East-Central California
Figure 15. Map showing median deterministic principal fault displacement in centimeters (cm) along fault strike for the Fish Slough M6.7 scenario. Dots represent the simplified fault trace and are color-coded by calculated fault displacement. Base map credit: National Elevation Dataset.

Scenario Earthquake Hazard Results 21
about 500 m south of U.S. Route 6. At the northern fault terminus, the estimated displacement is about 30 cm. U.S. Route 395 does not cross the seismogenic portion of the Fish Slough Fault. However, it crosses some smaller faults that could be splays of Fish Slough Fault or step-over features between the Fish Slough and Owens Valley Faults, and could have triggered slip should an earthquake happen on either of these faults.
Landslide and liquefaction hazards are shown in figure 16. All areas with slopes greater than 30 degrees are considered at risk during even minimum ground shaking. Additional landslide hazard zones are mapped according to combined effects of scenario ground motion, slope, and shear strength of the geologic materials. These zones include the steep slopes of the White Mountains, east of Bishop and U.S. Route 6, and southwest of State Route 168. As expected, the flat, alluvial areas along U.S. Route 6 in the northern part of Owens river valley and near Bishop appear as possible liquefaction hazard zones. A map or dataset of historical high groundwater depth could be combined with the liquefaction hazard map in order to refine the hazard zones.
Hartley Springs M6.5 Scenario
This scenario for an M6.5 earthquake on the Hartley Springs Fault with rupture stopping at the north boundary of the caldera is an alternative to the NSHM M6.7 scenario with rupture extending southward through the caldera to the north flank of Mammoth Mountain described in appendix D (see Hill and Montgomery-Brown, 2015). Both scenarios for the Hartley Springs Fault would produce strong ground shaking in the highlands between Long Valley and Mono Lake. Instrumental intensity, median PGA, and median SA at 1.0 second for the M6.5 scenario are shown in figure 17. The maximum MMI is 7.5, corresponding very strong to severe perceived shaking and moderate potential damage. The maximum PGA and SA at 1.0 second are ~0.45 g. The maximum shaking occurs in the immediate vicinity of the fault. The affected areas with at least strong perceived shaking and light potential damage (that is, intensity ≥6.0) extend as far as 20 km from the fault trace in the hanging wall regions and ~10 km in the footwall regions. The areas with at least very strong perceived shaking
Figure 16. Map showing potential liquefaction (green) and landslide areas for the Fish Slough M6.7 scenario. All areas with slopes greater than 30 degrees (orange) are considered at risk during even minimum ground shaking. Additional landslide hazard zones owing to the combined effects of scenario ground motion, slope, and shear strength of the geologic materials are shown in red. Contours are peak ground accelerations in 0.04-g interval. Base map credit: National Elevation Dataset. PGA, peak ground acceleration.

22 Scenario Earthquake Hazards for the Long Valley Caldera-Mono Lake Area, East-Central California
Bishop
6
395
Mono Lake
Crowley LakeMammoth Lakes
203
Nevada
California
Death Valley
Hartley Springs
Hilton Creek
Long Valley CalderaJune Lake
Hartley Springs M6.5A
Figure 17. Maps showing ground motion hazards of an M6.5 earthquake on Hartley Springs Fault. A, Modified Mercalli Intensity (MMI), B, median peak ground acceleration (PGA), and C, median spectral acceleration (SA) at 1.0 second. Base map credit: National Elevation Dataset. % g, percent acceleration due to gravity.

Scenario Earthquake Hazard Results 23
Bishop
6
395
Mono Lake
Crowley LakeMammoth Lakes
203
Nevada
California
Death Valley
Hartley Springs
Hilton Creek
Long Valley CalderaJune Lake
Hartley Springs M6.5B
Figure 17.—Continued

24 Scenario Earthquake Hazards for the Long Valley Caldera-Mono Lake Area, East-Central California
Bishop
6
395
Mono Lake
Crowley LakeMammoth Lakes
203
Nevada
California
Death Valley
Hartley Springs
Hilton Creek
Long Valley CalderaJune Lake
Hartley Springs M6.5C
Figure 17.—Continued
and moderate potential damage (that is, intensity ≥7.0) extend to about 10 km in the hanging wall regions and ~4 km in the footwall regions. The latter would include the June Lake community. The extent of the area of very strong perceived shaking is smaller than the Hilton Creek M6.5 scenario, primarily because of areas near the Hartley Springs Fault being underlain by older sediments and bedrock. The areas of strong shaking extend farther to the south near Lake Crowley, along Round Valley, and along Fish Slough. Although the affected areas with PGA greater than 0.1 g extend ~30 km in the hanging wall from the modeled fault traces, the areas with PGA greater than 0.4 g are limited to about 10 km from the fault in the hanging wall. Areas with PGA greater than 0.5 g are limited to the hanging-wall side only, extending approximately 6 km away from the fault. The distribution of SA at 1.0 second is affected by local site conditions, showing irregular shapes and distribution similar to that of MMI.
The median principal displacements along a simplified fault trace are shown in figure 18. The maximum fault
displacement is 54 cm, occurring in the middle of the fault. Predicted displacement values decrease toward rupture ends. U.S. Route 395 crosses the Hartley Springs Fault south of the junction with State Highway 158 (June Lake Junction) north of Mount Downs. Under this scenario, the fault would produce a vertical offset across the highway of ~43 cm down to the southeast. In addition, shaking from the earthquake could produce minor instances of triggered slip on numerous smaller faults west of Mammoth Lakes.
Landslide and liquefaction hazards are shown in figure 19. Potential hazard zones include a broad area from south of Mammoth Lakes to Mono Lake, and span the width of the focus study area. Road-cuts along Highway 203 between Mammoth Lakes and the Mammoth Mountain may be susceptible to local slumping across the roadway. The flat, alluvial areas in the northern part of the caldera, south of Mono Lake, and along the stream valley from Grant Lake to Mono Lake appear as possible liquefaction hazard zones

Scenario Earthquake Hazard Results 25
Mt. Downs
Mammoth Lakes
June Lake
Fault Displacement (cm)Hartley Springs Fault M6.5
Figure 18. Map showing median deterministic principal fault displacement in centimeters (cm) along fault strike for the Hartley Springs M6.5 scenario. Dots represent the simplified fault trace and are color-coded by calculated fault displacement. Base map credit: National Elevation Dataset.

26 Scenario Earthquake Hazards for the Long Valley Caldera-Mono Lake Area, East-Central California
Figure 19. Map showing potential liquefaction (green) and landslide areas for the Hartley Springs M6.5 scenario. All areas with slopes greater than 30 degrees (orange) are considered at risk during even minimum ground shaking. Additional landslide hazard zones owing to the combined effects of scenario ground motion, slope, and shear strength of the geologic materials are shown in red. Base map credit: National Elevation Dataset. PGA, peak ground acceleration.

Scenario Earthquake Hazard Results 27
Hilton Creek M6.5 Scenario
An M6.5 earthquake on the Hilton Creek Fault with rupture stopping just inside the caldera boundary would produce strong ground shaking in the southern part of the Long Valley Caldera and upper Rock Creek areas. Instrumental intensity, median PGA, and median SA at 1.0 second for this scenario are shown in figure 20.
The maximum MMI is 8.1, corresponding to severe to violent perceived shaking and moderate to heavy potential damage. The maximum PGA and SA at 1.0 second are 0.55 and 0.59 g, respectively. The maximum shaking occurs along the fault, primarily to the east of the fault (in the hanging wall areas) and around Crowley Lake. The affected areas with at least strong perceived shaking and light potential damage (that is, intensity ≥6.0) extend as far as 22 km from the fault trace. The areas with at least severe to violent perceived shaking and moderate to heavy potential damage (intensity ≥7.0) extend to about 12 km in the hanging wall regions and 4 km in the footwall regions. Although the affected areas with PGA greater than 0.1 g extend 37 km in the
hanging wall from the modeled fault traces, the areas with PGA greater than 0.4 g are limited to the immediate vicinity of the fault (11 km in the hanging wall). Areas with PGA greater than 0.5 g are limited to the hanging-wall side only, extending approximately 7 km away from the fault. The distribution of SA at 1.0 second is apparently affected by local site conditions (VS30 values), showing irregular shapes with high SA values in low and flat areas between the fault and Crowley Lake and around Crowley Lake, and low values on in the hills, including the hills south of Crowley Lake.
The median principal displacements along a simplified fault trace are shown in figure 21. The maximum fault displacement is 54 cm, occurring in the middle of the fault. Predicted displacement values decrease toward the ends of the rupture. U.S. Route 395 crosses the northern end of Hilton Creek Fault, south of Whitmore Hot Springs. Estimated offset displacement at the crossing is 29 cm.
Landslide and liquefaction hazards are shown in figure 22. The landslide hazard zones occur in the hills south and southwest of Long Valley Caldera and in a small triangular area northeast of the caldera. Liquefaction zones appear in flat, alluvial areas north
Bishop
6
395
Mono Lake
Crowley Lake
Mammoth Lakes
203
Rock
Cre
ek
Nevada
California
Death Valley
Hartley Springs
Hilton Creek
Long Valley Caldera
CreekHilton Creek M6.5 MMIA
Figure 20. Maps showing ground motion hazards of an M6.5 earthquake on Hilton Creek Fault. A, Modified Mercalli Intensity (MMI), B, median peak ground acceleration (PGA), and C, median spectral acceleration (SA) at 1.0 second. Base map credit: National Elevation Dataset. % g, percent acceleration due to gravity.

28 Scenario Earthquake Hazards for the Long Valley Caldera-Mono Lake Area, East-Central California
Bishop
6
395
Mono Lake
Crowley Lake
Mammoth Lakes
203
Rock
Cre
ek
Nevada
California
Hilton Creek M6.5 PGAB
Figure 20.—Continued

Scenario Earthquake Hazard Results 29
Bishop
6
395
Mono Lake
Crowley Lake
Mammoth Lakes
203
Rock
Cre
ek
Nevada
California
Hilton Creek M6.5 SAC
Figure 20.—Continued

30 Scenario Earthquake Hazards for the Long Valley Caldera-Mono Lake Area, East-Central California
Hilton Creek Fault M6.5
Figure 21. Map showing median deterministic principal fault displacement in centimeters (cm) along fault strike for the Hilton Creek M6.5 scenario. Dots represent the simplified fault trace and are color-coded by calculated fault displacement. Base map credit: National Elevation Dataset.

Scenario Earthquake Hazard Results 31
and northeast of Crowley Lake. Sediments with the potential for liquefaction in this earthquake scenario underlie U.S. Route 395 west of Crowley Lake as well as the Mammoth Yosemite Airport.
Mono Lake M6.7 Scenario
An M6.7 earthquake on the Mono Lake Fault would produce strong ground shaking in the Mono Basin and Conway Summit areas. Instrumental intensity, median PGA, and median SA at 1.0 second for this scenario are shown in figure 23. The maximum MMI is 8.5, corresponding to severe to violent perceived shaking and moderate to heavy potential damage. The maximum PGA and SA at 1.0 second are 0.55 and 0.65 g, respectively. The maximum shaking occurs in the immediate vicinity of the fault. The affected areas with at least strong perceived shaking and light potential damage (intensity ≥6.0) extend as far as 32 km from the fault trace, farther than other scenarios with similar magnitudes owing to younger deposits
along the stream valley and around Mono Lake. The areas with at least severe to violent perceived shaking and moderate to heavy potential damage (intensity ≥7.0) extend to about 17 km in the hanging wall regions and 6 km in the footwall regions. Although the affected areas with PGA greater than 0.1 g extend 38 km in the hanging wall from the modeled fault traces, the areas with PGA greater than 0.4 g are limited to immediate vicinity of the fault (12 km in the hanging wall). Areas with PGA greater than 0.5 g are limited to the hanging-wall side only, extending approximately 8 km away from the fault. The distribution of SA at 1.0 second also is affected by local site conditions.
The median principal displacements along a simplified fault trace are shown in figure 24. The maximum fault displacement is 72 cm, occurring in the middle of the fault. For approximately 7 km from Lee Vining Airport to southwest of Mono Lake Park (just south of Mono Inn Road and Cemetery Road junction), U.S. Route 395 runs along the Mono Lake Fault. Estimated offset along this stretch is 40–70 cm from south to north. Predicted displacement values decrease toward rupture ends.
Figure 22. Map showing potential liquefaction (green) and landslide areas for the Hilton Creek M6.5 scenario. All areas with slopes greater than 30 degrees (orange) are considered at risk during even minimum ground shaking. Additional landslide hazard zones owing to the combined effects of scenario ground motion, slope, and shear strength of the geologic materials are shown in red. Base map credit: National Elevation Dataset. PGA, peak ground acceleration.

32 Scenario Earthquake Hazards for the Long Valley Caldera-Mono Lake Area, East-Central California
Bishop
6
395
Mono Lake
Crowley Lake
Mammoth Lakes
203
Conway Summit
Nevada
California Death Valley
Hartley Springs
Hilton Creek
Long Valley Caldera
A
Figure 23. Maps showing ground motion hazards of an M6.8 earthquake on Mono Lake Fault. A, Modified Mercalli Intensity (MMI), B, median peak ground acceleration (PGA), and C, median spectral acceleration (SA) at 1.0 second. Base map credit: National Elevation Dataset. % g, percent acceleration due to gravity.
Landslide and liquefaction hazard zones are shown in figure 25. These zones are in the range front southwest of Mono Lake. As expected, the flat, alluvial areas around Mono Lake
appear as possible liquefaction hazard zones. Sediments with the potential for liquefaction in this scenario earthquake underlie U.S. Route 395 and State Route 120 south of Lee Vining.

Scenario Earthquake Hazard Results 33
Bishop
6
395
Mono Lake
Crowley Lake
Mammoth Lakes
203
Conway Summit
Nevada
California Death Valley
Hartley Springs
Hilton Creek
Long Valley Caldera
B
Figure 23.—Continued

34 Scenario Earthquake Hazards for the Long Valley Caldera-Mono Lake Area, East-Central California
Bishop
6
395
Mono Lake
Crowley Lake
Mammoth Lakes
203
Conway Summit
Nevada
California Death Valley
Hartley Springs
Hilton Creek
Long Valley Caldera
C
Figure 23.—Continued

Scenario Earthquake Hazard Results 35
Lee Vining Airport
Mono Lake Park
Figure 24. Map showing median deterministic principal fault displacement in centimeters (cm) along fault strike for the Mono Lake M6.7 scenario. Dots represent the simplified fault trace and are color-coded by calculated fault displacement. Base map credit: National Elevation Dataset.

36 Scenario Earthquake Hazards for the Long Valley Caldera-Mono Lake Area, East-Central California
Figure 25. Map showing potential liquefaction (green) and landslide areas for the Mono Lake M6.7 scenario. All areas with slopes greater than 30 degrees (orange) are considered at risk during even minimum ground shaking. Additional landslide hazard zones owing to the combined effects of scenario ground motion, slope, and shear strength of the geologic materials are shown in red. Base map credit: National Elevation Dataset. PGA, peak ground acceleration.

Scenario Earthquake Hazard Results 37
Bishop
6
395
Mono Lake
Crowley Lake
Mammoth Lakes203
Ow
ens River Valley
Nevada
California Death Valley
Hartley Springs
Hilton Creek
Long Valley Caldera
A
Figure 26. Maps showing ground motion hazards of an M7.0 earthquake on Round Valley Fault. A, Modified Mercalli Intensity (MMI), B, median peak ground acceleration (PGA), and C, median spectral acceleration (SA) at 1.0 second. Base map credit: National Elevation Dataset. % g, percent acceleration due to gravity.
Round Valley M7.0 Scenario
An M7.0 earthquake on the Round Valley Fault would produce strong ground shaking in the southern Long Valley, Round Valley, and Bishop Creek areas. Instrumental intensity, median PGA, and median SA at 1.0 second for this scenario are shown in figure 26.
The maximum MMI is 8.9, corresponding to severe to violent perceived shaking and moderate to heavy potential damage. The maximum PGA and SA at 1.0 second are 0.59 and 0.76 g, respectively. The maximum shaking occurs in the immediate vicinity of the fault, particularly to the east of the fault (in the hanging wall regions). The affected areas with at least strong perceived shaking and light potential damage (intensity ≥6.0) extend as far as 35 km from the fault trace, extending to the foothills of the White Mountains. The areas with at least severe to violent perceived shaking and moderate to heavy potential damage (intensity ≥7.0) extend to about 23 km in the hanging wall regions
(east) and 8 km in the footwall regions (west). These areas extend farther along Owens river valley and in lakebeds where there are younger deposits and leave islands of lower shaking intensity on hills and mountain ridges where there are older deposits and bedrock. Although the affected areas with PGA greater than 0.1 g extend 39 km in the hanging wall from the modeled fault traces, the areas with PGA greater than 0.4 g are limited to the immediate vicinity of the fault (13 km in the hanging wall). Areas with PGA greater than 0.5 g are limited to the hanging-wall side only, extending approximately 9 km away from the fault. The distribution of SA at 1.0 second also is affected by local site conditions and shows irregular shapes.
The median principal displacements along a simplified fault trace are shown in figure 27. The maximum fault displacement is 112 cm, occurring in the middle of the fault. Predicted displacement values decrease toward rupture ends. Round Valley Fault runs around the range front of Mt. Humphreys, Mt. Tom, Mt. Morgan, and Wheeler Crest. No

38 Scenario Earthquake Hazards for the Long Valley Caldera-Mono Lake Area, East-Central California
Bishop
6
395
Mono Lake
Crowley Lake
Mammoth Lakes203
Ow
ens River Valley
Nevada
California Death Valley
Hartley Springs
Hilton Creek
Long Valley Caldera
B
Figure 26.—Continued

Scenario Earthquake Hazard Results 39
Figure 26.—Continued
Bishop
6
395
Mono Lake
Crowley Lake
Mammoth Lakes203
Ow
ens River Valley
Nevada
California Death Valley
Hartley Springs
Hilton Creek
Long Valley Caldera
C

40 Scenario Earthquake Hazards for the Long Valley Caldera-Mono Lake Area, East-Central California
Mt. Humphreys
Mt. Tom
Mt. Morgan
Wheeler Crest
Lower Rock Creek
Figure 27. Map showing median deterministic principal fault displacement in centimeters (cm) along fault strike for the Round Valley M7.0 earthquake scenario. Dots represent the simplified fault trace and are color-coded by calculated fault displacement. Base map credit: National Elevation Dataset.

Scenario Earthquake Hazard Results 41
major highways or roads cross the fault. The northern part of the fault runs about 2.5–4.5 km south of the U.S. Route 395, approximately parallel to the highway. However, U.S. Route 395 crosses a number of smaller, secondary faults near Lower Rock Creek. These faults could experience triggered slip should an M7.0 earthquake happen on Round Valley Fault.
Landslide and liquefaction hazards are shown in figure 28. The potential landslide zones are scattered throughout the
region south of Long Valley Caldera. Liquefaction zones are seen in a broad area at the junction of U.S. Routes 6 and 395 and State Route 168, and extend into the stream valleys along these highways. Potential liquefaction zones also are seen north and northwest of Crowley Lake. Sediments with the potential for liquefaction in this earthquake scenario underlie U.S. Route 395 west of Crowley Lake, in Round Valley, and in the northern Owens river valley.
Figure 28. Map showing potential liquefaction (green) and landslide areas for the Round Valley M7.0 scenario. All areas with slopes greater than 30 degrees (orange) are considered at risk during even minimum ground shaking. Additional landslide hazard zones owing to the combined effects of scenario ground motion, slope, and shear strength of the geologic materials are shown in red. Base map credit: National Elevation Dataset. PGA, peak ground acceleration.

42 Scenario Earthquake Hazards for the Long Valley Caldera-Mono Lake Area, East-Central California
White Mountains M7.35 Scenario
An M7.35 earthquake on the White Mountains Fault Zone would produce strong ground shaking throughout the Chalfant and northern Owens river valley. Instrumental intensity, median PGA, and median SA at 1.0 second for this scenario are shown in figure 29. The maximum MMI is 9.1, corresponding to violent and extreme perceived shaking and heavy to very heavy potential damage. The maximum PGA and SA at 1.0 second are 0.58 and 0.80 g, respectively. The maximum shaking occurs in the immediate vicinity of the fault and extends farther away from the
Bishop
6
395
Mono Lake
Crowley Lake
Mammoth Lakes203
Ow
ens River Valley
Chalfant Valley
Long Valley Caldera
Nevada
California Death Valley
Hartley Springs
Hilton Creek
A
fault on the valley side (west). The affected areas with at least strong perceived shaking and light potential damage (intensity ≥6.0) extend as far as 40 km from the fault trace, well into the Long Valley Caldera and Mammoth Lakes to the west and Nevada to the east. The areas with at least severe to violent perceived shaking and moderate to heavy potential damage (intensity ≥7.0) extend about 15 km on either side of the fault. The affected areas with PGA greater than 0.1 g extend 40 km from the modeled fault traces, the areas with PGA greater than 0.4 g and PGA greater than 0.5 g are limited to the immediate vicinity of the fault (4 and 2 km, respectively). The distribution of SA at 1.0 second also is affected
Figure 29. Maps showing ground motion hazards of an M7.35 earthquake on White Mountains Fault Zone. A, Modified Mercalli Intensity (MMI), B, median peak ground acceleration (PGA), and C, median spectral acceleration (SA) at 1.0 second. Base map credit: National Elevation Dataset. % g, percent acceleration due to gravity.
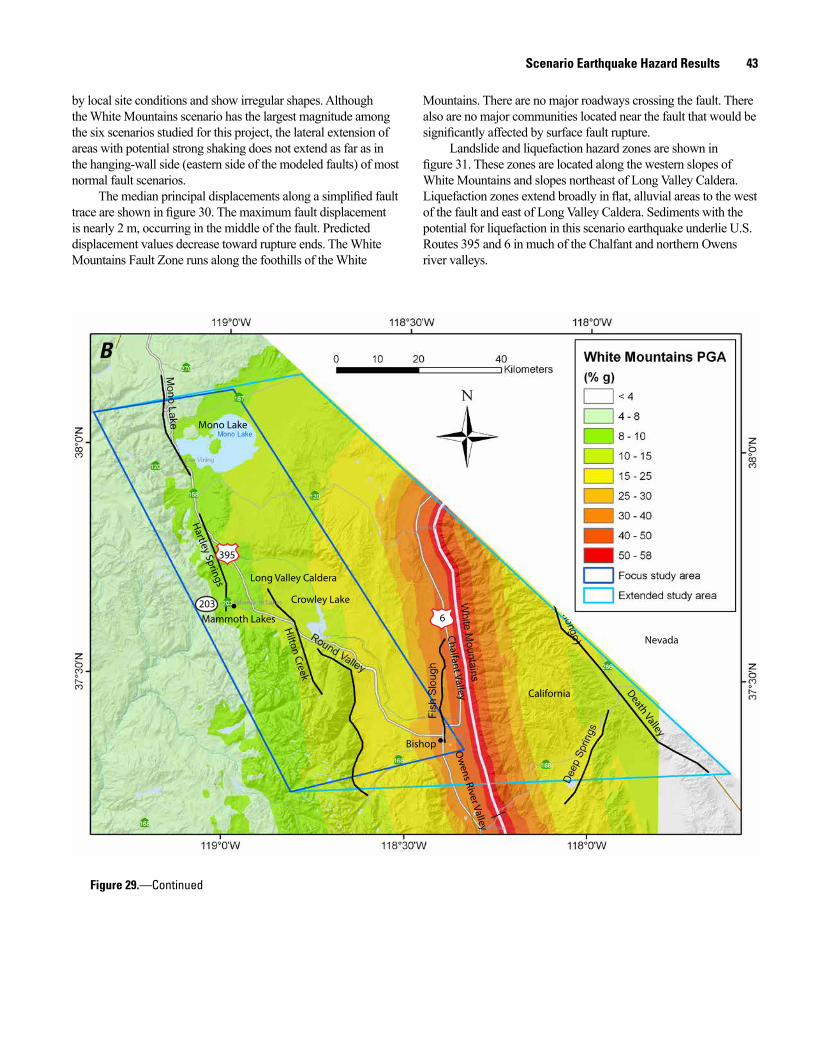
Scenario Earthquake Hazard Results 43
by local site conditions and show irregular shapes. Although the White Mountains scenario has the largest magnitude among the six scenarios studied for this project, the lateral extension of areas with potential strong shaking does not extend as far as in the hanging-wall side (eastern side of the modeled faults) of most normal fault scenarios.
The median principal displacements along a simplified fault trace are shown in figure 30. The maximum fault displacement is nearly 2 m, occurring in the middle of the fault. Predicted displacement values decrease toward rupture ends. The White Mountains Fault Zone runs along the foothills of the White
Mountains. There are no major roadways crossing the fault. There also are no major communities located near the fault that would be significantly affected by surface fault rupture.
Landslide and liquefaction hazard zones are shown in figure 31. These zones are located along the western slopes of White Mountains and slopes northeast of Long Valley Caldera. Liquefaction zones extend broadly in flat, alluvial areas to the west of the fault and east of Long Valley Caldera. Sediments with the potential for liquefaction in this scenario earthquake underlie U.S. Routes 395 and 6 in much of the Chalfant and northern Owens river valleys.
Bishop
6
395
Mono Lake
Crowley Lake
Mammoth Lakes203
Ow
ens River Valley
Chalfant Valley
Long Valley Caldera
Nevada
California Death Valley
Hartley Springs
Hilton Creek
B
Figure 29.—Continued

44 Scenario Earthquake Hazards for the Long Valley Caldera-Mono Lake Area, East-Central California
Bishop
6
395
Mono Lake
Crowley Lake
Mammoth Lakes203
Ow
ens River Valley
Chalfant ValleyLong Valley Caldera
Nevada
California Death Valley
Hartley Springs
Hilton Creek
C
Figure 29.—Continued

Scenario Earthquake Hazard Results 45
Benton
Bishop
Figure 30. Map showing median deterministic principal fault displacement in centimeters (cm) along fault strike for the White Mountains M7.35 scenario. Dots represent the simplified fault trace and are color-coded by calculated fault displacement. Base map credit: National Elevation Dataset.

46 Scenario Earthquake Hazards for the Long Valley Caldera-Mono Lake Area, East-Central California
Figure 31. Map showing potential liquefaction (green) and landslide areas for the White Mountains M7.35 scenario. All areas with slopes greater than 30 degrees (orange) are considered at risk during even minimum ground shaking. Additional landslide hazard zones owing to the combined effects of scenario ground motion, slope, and shear strength of the geologic materials are shown in red. Base map credit: National Elevation Dataset. PGA, peak ground acceleration.
Comparison of Scenario Earthquake Hazard Results
Summaries and comparisons of pertinent ground motion values for all scenarios are shown in table 5. The maximum ground shaking from the normal fault scenario earthquakes is nearly identical because the magnitudes are similar. The maximum MMI is from 8.1 to 9.1, corresponding to severe to violent perceived shaking and moderate to heavy potential damage. The maximum PGA ranges from 0.55 to 0.59 g. The maximum SA at 1.0 second ranges from 0.59 to 0.80 g. The maximum shaking occurs in the immediate vicinity of the fault that produces the earthquake, particularly in the hanging wall regions (or to the east of the model faults because all of these faults dip to the east). The affected areas with strong perceived shaking and light potential damage extend as far as 30 km from the modeled fault traces for normal faulting scenarios and as far as 50 km for the White Mountains scenario.
The areas with severe to violent perceived shaking and moderate to heavy potential damage generally are limited to the immediate vicinity of the fault (as much as about 10 km), mostly in the hanging wall regions for normal faulting scenarios and on the valley side of the White Mountains Fault Zone. These areas extend farther along river valleys and in lakebeds where there are younger deposits. Shaking intensity is lower on hills and mountain ridges where there are older deposits and bedrock. The pattern of PGA maps for all normal fault scenarios is rather similar. Although the affected areas with PGA greater than 0.1 g extend 20–40 km from the modeled fault traces, the areas with PGA greater than 0.3 g generally are limited to the immediate vicinity of the fault (4–7 km), except on the hanging wall, where it extends 14–15 km from the fault. Areas with PGA greater than 0.5 g are limited to the hanging-wall side, extending 8–9 km away from the fault. The distribution of SA at 1.0 second also is affected by local site conditions. The areas of SA at 1.0 second greater than 0.3 g are often irregular in shape

Scenario Earthquake Hazard Results 47
Name Fault typeEarthquake magnitude
Maximum MMI
Maximum PGA(% g)
Maximum SAat 1 second (% g)
Fish Slough Normal 6.7 8.7 57 69Hartley Springs WGCEP Trace Normal 6.7 8.5 57 66
Alternative 6.5 8.1 55 58Hilton Creek WGCEP Trace Normal 6.8 8.7 58 68
Alternative 1 6.6 8.3 56 63
Alternative 2 6.5 8.1 55 59
Mono Lake Normal 6.7 8.5 55 65
Round Valley Normal 7.0 8.9 59 76White Mountains Strike-slip 7.35 9.1 58 80
Table 5. Summary of scenario ground motions.
[Earthquake magnitude: The average of Hanks and Bakun and Ellsworth-B magnitudes as defined by the second footnote in table 1. PGA, peak ground acceleration; MMI, Modified Mercalli Intensity; SA, spectral acceleration; % g, percent of acceleration because of gravity (equal to 981 cm/s2); WGCEP, Working Group on California Earthquake Probabilities]
with high values along river valleys and in lakebeds. For the White Mountains Fault Zone, the PGA distribution is nearly symmetrical on both sides of the fault. The areas with PGA greater than 0.3 and 0.5 g extend 8–10 and 1–2 km, respectively, on either side. Again, the distribution of SA at 1.0 second is more affected by site conditions and shows greater affected area on the valley side of the fault than on the mountain side, forming an asymmetric distribution about the fault.
The scenario-earthquake ground-motion intensities and amplitudes for the Town of Mammoth Lakes (latitude and longitude: 37.648 and -118.983, in decimal degrees) for the scenario earthquakes analyzed in this study are summarized in table 6. The strongest predicted ground motions are those associated with the M6.7 and M6.8 scenario earthquakes based on the NSHM depictions for the Hartley Springs and Hilton Creek Faults, respectively (appendixes B and C). These, however, should be considered as unlikely “worse-case” scenarios (see Hill and Montgomery-Brown, 2015).
More likely are the ground motion hazards associated with the alternative depictions of these two faults as described in the main text. Under these scenarios, the strongest shaking hazards are produced by the M6.5 scenario earthquake on the Hartley Springs Fault, with rupture stopping at the north boundary of the caldera. Note that these hazard levels are comparable to those for the M6.8 Hilton Creek Fault NSHM scenario earthquake in appendix C; a larger but more distant earthquake.
Calculated median principal rupture displacements are compared in figure 32 for an M7.35 earthquake in the White Mountains Fault Zone; an M7.0 earthquake on Round Valley Fault; M6.5, M6.6, and M6.8 earthquakes on Hilton Creek Fault; and an M6.7 earthquake on Fish Slough, Hartley Springs, and Mono Lake Faults. Because the White Mountains Fault Zone is the only predominantly strike-slip fault, potential displacement tapers off more rapidly towards the ends of the fault than on the normal faults.
Table 6. Ground motion hazards at the town of Mammoth Lakes.
[MMI, Modified Mercalli Intensity; WGCEP, Working Group on California Earthquake Probabilities; PGA, peak ground acceleration; SA, spectral acceleration; % g, percent of acceleration because of gravity (equal to 981 cm/s2)]
Scenario nameEarthquake magnitude
MMIPGA (% g)
SA at 1 second (% g)
Fish Slough 6.7 4.5–5.0 4–8 4–8Hartley Springs WGCEP Trace 6.7 7.5–8.2 50–57 50–66
Alternative 6.5 6.0–6.5 15–25 15–25Hilton Creek WGCEP Trace 6.8 6.5–7.0 4–8 4–8
Alternative 1 6.6 6.0–6.5 15–25 15–25
Alternative 2 6.5 5.5–6.0 15–25 10–15
Mono Lake 6.7 5.0–5.5 4–8 4–8
Round Valley 7.0 5.5–6.0 10–15 10–15
White Mountains 7.35 5.5–6.0 8–10 8–10

48 Scenario Earthquake Hazards for the Long Valley Caldera-Mono Lake Area, East-Central California
Map view of calculated median fault displacements (dots) is shown in figure 33. For the Hilton Creek Fault, only the second alternative scenario displacements are plotted. There are a few locations where highways may be disrupted by surface rupture (numbers, fig. 33). The estimated median rupture displacements at these locations are summarized in table 7. These displacements may be exceeded because of large uncertainty in the amount of displacement. In addition, U.S. Route 395 may be displaced by triggered slip from the Fish Slough M6.7 and Round Valley M7.0 scenarios.
1
10
100
1000
0 0.05 0.1 0.15 0.2 0.25 0.3 0.35 0.4 0.45 0.5
Prin
cipa
l Fa
ultin
g D
ispl
acem
ent (
cm)
On Fault Distance Ratio (l/L)
M6.5 Hilton Creek and Hartley Springs Alternatives
M6.6 Hilton Creek Alternative
M6.7 Fish Slough, Hartley Springs, Mono Lake
M6.8 Hilton Creek
M7.0 Round Valley
M7.35 White Mountains
1,000
Figure 32. Graph showing comparison of median deterministic principal fault displacements in centimeters (cm) along fault strike for all scenario earthquakes.
SummaryWe developed earthquake scenarios for all five faults or fault
zones in the focus study area considered capable of producing M≥6.7 earthquakes by the 2007 Working Group on California Earthquake Probabilities (2008). These are the Fish Slough Fault (M6.7), Hartley Springs Fault (M6.7 NSHM scenario and an M6.5 alternative), Hilton Creek Fault (the M6.8 NSHM scenario and two alternative scenarios), Mono Lake Fault (M6.7), and Round Valley Fault (M7.0). These faults are predominantly normal faults.
Table 7. Summary of estimated rupture displacement at highway crossings.
[M, magnitude; cm, centimeter]
Location Highway and roadway ScenarioDisplacement
(cm)
1 Highway 6 Fish Slough M6.7 38
2 Highway 6 Fish Slough M6.7 30
3 Highway 395 Hartley Springs M6.5 43
4 Highway 395 Hilton Creek M6.5 29
5–6 Highways 395 and 120 Mono Lake M6.7 40–70

Summary 49
!
(/6
(/395
Ã120
Ã168
Ã167
Ã270
Ã203
Ã266
Ã168
Ã120
Ã168
118°0'W
118°0'W
118°30'W
118°30'W
119°0'W
119°0'W
38°0
'N
38°0
'N
37°3
0'N
37°3
0'N
Fault Displacement(cm)
< 35
35 - 40
40 - 45
45 - 50
50 - 60
60 - 70
70 -80
80 - 90
90 - 100
100 - 110
110 - 120
120 - 140
140 - 160
160 - 180
180 - 193
Focus study area
Extended study area
0 10 20 30Kilometers
ÜRound Valley
65
3
4
1
2
White M
ountains
Fish Slough
Hilton Creek
Hartley Springs
Mono Lake
Figure 33. Map of median deterministic principal fault displacement in centimeters (cm) along fault strike for all faults. Dots represent simplified fault traces and are color-coded by calculated fault displacement. Circled numbers indicate potential highway offsets at fault crossings (see table 7). Base map credit: National Elevation Dataset.
In addition, a scenario was developed for the White Mountains Fault Zone, a predominantly strike-slip fault, in the extended study area because of its proximity to the focus study area and its potential for producing large magnitude earthquakes (M7.35). We then evaluated potential earthquake hazards associated with these scenario earthquakes, including ground shaking, surface fault rupture, liquefaction, and landslide hazards.
Our results show that the maximum MMI ranges from 8.5 to 8.9 for normal fault scenarios, and is 9.1 for the White Mountains scenario. These MMI levels correspond to violent perceived shaking and moderate to heavy potential damage, and generally are limited to the immediate vicinity of the causative fault (within about 10 km), mostly in the hanging wall regions of normal faults and on the valley side (west) of the White Mountains Fault Zone. The maximum PGA ranges from 0.55 to 0.59 g for normal fault scenarios, and is 0.58 g for the White Mountains scenario. The maximum SA at 1.0 second ranges from 0.65 to 0.76 g for normal
fault scenarios, and is 0.80 g for the White Mountains scenario. Areas with strong perceived shaking and light potential damage extend as far as 30 km from the modeled fault traces for normal fault scenarios and 50 km for the White Mountains scenario. The patterns of MMI and 1.0-second SA distribution are apparently affected by local site conditions (VS30 values). Higher shaking intensity and SA occur along river valleys and in lakebeds where there are younger deposits. Areas of lower shaking intensity and SA occur on hills and mountain ridges where there are older deposits and bedrock.
Fault displacement hazards were estimated deterministically for all scenarios and probabilistically for the Hilton Creek and White Mountains scenarios. Deterministic results show that the estimated maximum median principal displacement is nearly 2 m for the White Mountains scenario and ranges from 0.75 m to more than 1 m for the normal fault scenarios according to the models used herein. Maximum

50 Scenario Earthquake Hazards for the Long Valley Caldera-Mono Lake Area, East-Central California
displacement is in the middle of the rupture and tapers off toward the ends of the rupture for both strike-slip and normal faults, but tapers off more rapidly for a strike-slip fault. The maximum principal fault displacement, estimated as the 84th percentile displacement for the magnitude, could be more than 6 m for the White Mountains Fault, and ranges from 1.5 m to more than 2 m for the normal faults. Estimated distributed fault displacements are presented in appendix A. They generally are on the scale of tens of centimeters, and are smaller for a strike-slip fault than for a normal fault for a given magnitude. For normal faults, distributed displacements are more than twice as large in the hanging wall region than in the footwall region at the same fault distance. Both the deterministic and probabilistic approaches consider variability in surface fault displacement. In addition, the probabilistic approach also considers uncertainty in rupture location from future earthquakes and earthquake recurrence rate. Because uncertainty in rupture location is approximated by a normal distribution centered on the mapped fault, calculated probabilistic fault displacements across a fault show a bell-shaped profile rather than a spike on the mapped fault. A displacement profile perpendicular to the fault strike is symmetric about the mapped trace for the White Mountains scenario and asymmetric for the Hilton Creek scenario with larger displacement in hanging wall regions. For both normal and strike-slip faults, the narrowest zone of predicted displacement is along the stretches where fault traces are accurately located, usually narrower than the mapped A-P zones. Larger widths of the predicted displacement zone correspond to greater fault trace complexity and poorer mapping accuracy, and may exceed the width of the corresponding A-P zones.
All scenarios show the possibility of widespread landslides, whereas liquefaction hazard is limited to the higher shaking zones closer to the modeled fault rupture. The actual liquefaction damage would likely only be in areas where the depth to groundwater is 6.1 meters or less, which probably would be limited to areas near lakes and streams. The landslide potential exists throughout the study region. All steep slopes (>30 degrees) present a potential hazard at any level of shaking; less steep slopes only present a possible hazard within the areas of the higher ground shaking. During winter months, this extends to snow-avalanche hazard, which will vary depending on the seasonal snow-fall history and conditions at the time of an earthquake (Podolskiy and others, 2010). The landslide hazard zones are also potential sources for widespread snow avalanches in winter months as well as for large boulders, which, as seen in May 1980, can be shaken loose and roll hundreds of feet down slope.
Whereas methodologies used in estimating ground-shaking hazards, liquefaction potential, and landslide potentials have been well developed and applied in published
statewide hazard maps, methodologies used in estimating surface rupture displacement are still being developed. Numerous empirical equations used in fault displacement hazard assessments are likely to be modified as more measured surface displacement data become available. Mapping fault displacement hazard is a relatively new endeavor. It has proven to be technically challenging when applied to faults with complicated geometry (including numerous parallel/subparallel strands and splays, and frequently changing orientations), such as the Hilton Creek Fault. The current methodology, which is based on calculation of multiple profiles across the fault, needs to be developed to allow grid-based calculation to improve accuracy and efficiency. Our results show that fault location uncertainty plays an important role in fault displacement hazard assessment. Efforts should be made to reduce and (or) quantify uncertainties in rupture location at important lifeline fault locations so that fault displacement hazards can be more realistically estimated. Many other input parameters and assumptions affect the calculated displacements. Selection of input parameters is critical and requires careful considerations, particularly if small displacements—on the order of less than 1 m—have engineering consequences.
We reiterate that scenario earthquakes are intended to depict the potential consequences of significant earthquakes. They are not necessarily the largest or most damaging earthquakes possible. Earthquake scenarios are both large enough and likely enough that emergency planners should consider them in regional emergency response plans. In particular, the ground motion predicted for a given scenario earthquake does not represent a full probabilistic hazard assessment, and thus it does not provide the basis for hazard zoning and earthquake-resistant building design.
With the exception of the Hartley Springs and Hilton Creek Fault alternative scenarios, the scenario earthquakes presented here are based on fault geometry and activity data developed by the WGCEP and are consistent with the 2008 update of the United States National Seismic Hazard Maps. We consider all these scenarios significant enough to be considered in our seismic hazard analyses. However, as indicated in table 1, some scenarios have much longer recurrence intervals than others because some faults are less active than others. Most notably, the Fish Slough and White Mountains scenarios are both rare events, having recurrence intervals of nearly 3,000 and 2,000 years, respectively. Other scenarios, such as the Hilton Creek scenario, are more likely to occur, having recurrence intervals of around 200 years. The likelihood of a scenario should be an important factor in emergency response planning. However, considering rare scenarios, such as the Fish Slough and White Mountains scenarios, in emergency planning may be warranted because we know very little of these faults’ paleoseismic histories.

References Cited 51
References Cited
2007 Working Group on California Earthquake Probabilities, 2008, The Uniform California Earthquake Rupture Forecast—version 2 (UCERF 2): U.S. Geological Survey Open-File Report 2007–1437, California Geological Survey Special Report 203, and Southern California Earthquake Center Contribution No. 1138, accessed September 6, 2017, at http://pubs.usgs.gov/of/2007/1437/.
Bair, E.H., 2013, Forecasting artificially-triggered avalanches in storm snow at a large ski area: Cold Regions Science and Technology, v. 85, p. 261–269.
Bair, E.H., Simenhois, R., Birkeland, K., and Dozier, J., 2012, A field study on failure of storm snow slab avalanches: Cold Regions Science and Technology, v. 79–80, p. 20–28.
Battaglia, M., Williams, M.J., Venezky, D.Y., Hill, D.P., Langbein, J.O., Farrar, C.D., Howle, J.F., Sneed, M., and Segall, P., 2003, Long Valley Caldera GIS Database: U.S. Geological Survey Digital Data Series DDS–81, accessed September 6, 2017, at http://pubs.usgs.gov/dds/dds-81/.
Boore, D.M., and Atkinson, G.M., 2008, Ground-motion prediction equations for the average horizontal component of PGA, PGV, and 5%-damped PSA at spectral period between 0.01 and 10.0 s: Earthquake Spectra, v. 24, no. 1, p. 99–138.
Brandenberg, S.J., Fletcher, J., Gingery, J.R., Hudnut, K.W., McCrink, T., Meneses, J.F., Murbach, D., Rockwell, T., Stewart, J.P., and Tinsley, J., 2010, Preliminary report on seismological and geotechnical engineering aspects of the April 4 2010 Mw 7.2 El Mayor-Cucapah (Mexico) earthquake: Report for Web Dissemination, Geotechnical Earthquake Engineering Reconnaissance, GEER Association Report No. GEER-023, version 1, accessed December 9, 2013, at http://www.geerassociation.org/GEER_Post%20EQ%20Reports/Baja%20California_2010/Baja_Index_2010.html.
Bryant, W.A., 1980, Rockfalls generated by the Mammoth Lakes earthquakes of May 25 and 27, 1980, in Sherburne, R.W., ed., Mammoth Lakes, California Earthquakes of May 1980: California Division of Mines and Geology Special Report 150, 69 p.
California Division of Mines and Geology, 1998, Seismic hazard zone report for the Pasadena 7.5-minute quadrangle, Los Angeles County, California: Seismic Hazard Zone Report 014, 63 p., accessed January 27, 2014, at ftp://ftp.consrv.ca.gov/pub/dmg/shezp/eval_rpts/pasa_eval.pdf.
California Geological Survey, 2004, Recommended criteria for delineating seismic hazard zones in California: California Geological Survey Special Publication 118, 12 p.
Campbell, K.W., and Bozorgnia, Y., 2008, NGA ground motion model for the geometric mean horizontal component of PGA, PGV, PGD and 5% damped linear elastic response spectra for periods ranging from 0.01 to 10 s: Earthquake Spectra, v. 24, no. 1, p. 139–172.
Chiou, B.S.-J. and Youngs, R.R., 2008, An NGA model for the average horizontal component of peak ground motion and response spectra: Earthquake Spectra, v. 24, no. 1, p. 173–216.
Cramer, C.H., and Toppozada, T.R., 1980, A seismological study of the May, 1980, and earlier earthquake activity near Mammoth Lakes, California, in Mammoth Lakes: California Earthquakes of May 1980, California Division of Mines and Geology Special Report 150, 69 p.
Cruden, D.M., and Varnes, D.L., 1996, Landslide types and processes, chap. 3 of Turner, A.K., and Schuster, R.I., eds., Landslides—Investigation and Mitigation, Special Report 247: Transportation Research Board, 40 p.
Hanks, T.C., and Bakun, W.H., 2008, M-logA observations for recent large earthquakes: Bulletin of the Seismological Society of America, v. 98, no. 1, p. 490–494.
Hill, D.P., 2006, Unrest in Long Valley Caldera, California, 1978–2004, in Troise, C., De Natale, G., and Kilburn, C.R.J., eds., Mechanisms of activity and unrest at large calderas: Geological Society, London, Special Publications, v. 269, p. 1–24.
Hill, D.P., Bailey, R.A., and Ryall, A.S., 1985, Active tectonic and magmatic processes beneath Long Valley Caldera, eastern California—An overview: Journal of Geophysical Research, v. 95, p. 11,111–11,120.
Hill, D.P., Dzurisin, D., Ellsworth, W.L., Endo, E.T., Galloway, D.L., Gerlach, T.M., Johnston, M.J.S., Langbein, J., McGee, K.A., Miller, C.D., Oppenheimer, D., and Sorey, M.L., 2001, Response plan for volcano hazards in the Long Valley Caldera and Mono Craters region California: U.S. Geological Survey Bulletin 2185, 57 p., accessed September 6, 2017, at http://pubs.er.usgs.gov/publication/b2185.
Hill, D.P., and Montgomery-Brown, E., 2015, Long Valley Caldera and the UCERF depiction of Sierra Nevada range-front faults: Bulletin of Seismological Society of America, v. 105, no. 6, p. 3189–3195.
Keefer, D.K., 1984, Landslides caused by earthquakes: Geological Society of America Bulletin, v. 95, p. 406–421.
Kuhn, B., 2006, Yosemite geology: National Park Service Geologic Resources Evaluation Program, Geospatial Dataset-1047771.

52 Scenario Earthquake Hazards for the Long Valley Caldera-Mono Lake Area, East-Central California
McCrink, T.P., and Real, C.R., 1996, Evaluation of the Newmark method for mapping earthquake-induced landslide hazards in the Laurel 7.5’ quadrangle, Santa Cruz County, California: California Division of Mines and Geology Final Technical Report for U.S. Geological Survey Contract 143-93-G-2334, 31 p.
National Park Service, 2006, Digital Yosemite map: National Park Service web page, accessed September 13, 2017, at https://irma.nps.gov/DataStore/Reference/Profile/1041506.
Newmark, N.M., 1965, Effects of earthquakes on dams and embankments: Geotechnique, v. 15, no. 2, p. 139–160.
Petersen, M.D., Dawson, T., Chen, R., Cao, T., Frankel, A.D., Wills, C.J., and Schwartz, D., 2011, Fault displacement hazard for strike-slip faults: Bulletin of the Seismological Society of America, v. 101, no. 2, p. 805–825.
Petersen, M.D., Frankel, A.D., Harmsen, S.C., Mueller, C.S., Haller, K.M., Wheeler, R.L., Wesson, R.L., Zeng, Y., Boyd, O.S., Perkins, D.M., Luco, N., Field, E.H., Wills, C.J., and Rukstales, K.S., 2008, Documentation for the 2008 update of the United States national seismic hazard maps: U.S. Geological Survey Open-File Report 2008–1128, accessed September 6, 2017, at http://pubs.usgs.gov/of/2008/1128/.
Podolskiy, E.A., Nishimura, K., Abe, O., and Chernous, P.A., 2010, Earthquake-induced snow avalanches—1. Historical case studies: Journal of Glaciology, v. 56, p. 431–446.
Ryall, A.S., Jr., and Ryall, F., 1980, Spatial-temporal variations in the seismicity preceding the May, 1980, Mammoth Lakes, California earthquakes, in Sherburne, R.W., ed., Mammoth Lakes, California earthquakes of May 1980: California Division of Mines and Geology Special Report 150, p. 27–39.
Sylvester, A.G., 1980, The Mammoth Lakes, California, earthquakes—25–31 May, 1980: Earthquake Engineering Research Institute Newsletter, v. 14, no. 4, p. 93–102.
Taylor, G.C., and Bryant, W.A., 1980, Surface rupture associated with the Mammoth Lakes earthquakes of 25 and 27 May, 1980—Mammoth Lakes: California Earthquake of May 1980, California Division of Mines and Geology, Special Report 150, p. 49–67.
U.S. Geological Survey, 2003, The Long Valley Caldera GIS database: U.S. Geological Survey Digital Data Series DDS-81, version 1.0, accessed September 13, 2017, at https://pubs.usgs.gov/dds/dds-81/.
U.S. Geological Survey and California Geological Survey, 2010, Quaternary fault and fold database of the United States, accessed December 9, 2013, at http://earthquakes.usgs.gov/regional/qfaults.
Wald, D.J., Quitoriano, V., Heaton, T.H., and Kanamori, H., 1999, Relationship between peak ground acceleration, peak ground velocity, and Modified Mercalli Intensity in California: Earthquake Spectra, v. 15, no. 3, p. 557–564.
Wells, D.L., and Coppersmith, K.J., 1993, Likelihood of surface rupture as a function of magnitude [abs.]: Seismological Research Letters, v. 64, no. 1, p. 12.
Wells, D.L., and Coppersmith, K.J., 1994, New empirical relationships among magnitude, rupture length, rupture width, rupture area, and surface displacement: Bulletin of the Seismological Society of America, v. 84, p. 974–1002.
Wesnousky, S.G., 2008, Displacement and geometrical characteristics of earthquake surface ruptures: Bulletin of the Seismological Society of America, v. 98, p. 1609–1632.
Wieczorek, G.F., Wilson, R.C., and Harp, E.L., 1985, Map of slope stability during earthquakes in San Mateo County, California: U.S. Geological Survey Miscellaneous Investigations Map I-1257-E, scale 1:62,500, accessed September 6, 2017, at http://pubs.er.usgs.gov/publication/i1257E.
Wills, C.J., and Clahan, K.B., 2006, Developing a map of geologically defined site-condition categories for California: Bulletin of the Seismological Society of America, v. 96, p. 1483–1501.
Wilson, R.C., and Keefer, D.K., 1983, Dynamic analysis of a slope failure from the 6 August 1979 Coyote Lake, California, Earthquake: Bulletin of the Seismological Society of America, v. 73, no. 3, p. 863–877.
Wong, I.G., and Stepp, J.C., eds., 1998, Probabilistic seismic hazard analyses for fault displacement and vibratory ground motion Yucca Mountain, Nevada: Report by Civilian Radioactive Waste Management System Management and Operating Contractor for U.S. Department of Energy.
Working Group on California Earthquake Probabilities (WGCEP), 2003, Earthquake probabilities in the San Francisco Bay Region: 2002–2031: U.S. Geological Survey Open-File Report 2003–214, accessed September 6, 2017, at http://pubs.usgs.gov/of/2003/of03-214/.
Youd, T.L., 1973, Liquefaction, flow, and associated ground failure: U.S. Geological Survey Circular 688, 12 p., accessed September 6, 2017, at http://pubs.er.usgs.gov/publication/cir688.
Youd, T.L., 1991, Mapping of earthquake-induced liquefaction for seismic zonation: Proceedings of the Fourth International Conference on Seismic Zonation, Stanford, California, v. 1, p. 111–138.
Youngs, R.R., Arabasz, W.J., Anderson, R.E., Ramelli, A.R., Ake, J.P., Slemmons, D.B., McCalpin, J.P., Doser, D.I., Fridrich, C.J., Swan, F.H., III, Rogers, A.M., Yount, J.C., Anderson, L.W., Smith, K.D., Bruhn, R.L., Knuepfer, L.K., Smith, R.B., dePolo, C.M., O’Leary, K.W., Coppersmith, K.J., Pezzopane, S.K., Schwartz, D.P., Whitney, J.W., Olig, S.S., and Toro, G.R., 2003, A methodology for probabilistic fault displacement hazard analysis (PFDHA): Earthquake Spectra, v. 19, p. 191–219.

Appendixes

54 Scenario Earthquake Hazards for the Long Valley Caldera-Mono Lake Area, East-Central California
quality (categorized as accurately located, approximately located, inferred, or concealed) and complexity (simple or complex) of the fault strands for the inferred and concealed categories (table A-1). Complexity was not considered for the accurately and approximately located categories when the displacement data were collected. This density function for r includes both aleatory and epistemic components. The aleatory portion of the uncertainty accounts for the possibility that future earthquakes may occur on different traces and not necessarily along the mapped fault. The epistemic portion of the uncertainty accounts for inaccuracies in the mapped fault trace.
The standard deviations in table A-1 were derived for strike-slip faults. Their applicability to normal faults needs is yet to be examined. Such data have not been collected and examined for normal or reverse faults. The analyses of fault rupture hazards demand much more detailed fault geometry. The fault traces for fault displacement hazard analyses are, therefore, obtained from the digital dataset of the 2010 California Geological Survey (CGS) fault activity map (http://www.conservation.ca.gov/cgs/cgs_history/Pages/2010_faultmap.aspx) using geographic information system (GIS) tools.
Conditional Probability of Slip
For both strike-slip and normal faults, we use the logistic regression model and parameters derived by Youngs and others (2003) based on 276 worldwide earthquakes of Wells and Coppersmith (1993, 1994) for the probability of principal fault displacement a given earthquake magnitude (m):
(A-3)
with f(x) = −12.51 + 2.053m.
To determine probability of distributed fault displacement, Petersen and others (2011) collected and analyzed probability data for ruptures to occur in a given cell area located off the principal fault. The probability of rupture is assessed by calculating the number of cells that contain ruptures and the total number of cells using a variety of square cell sizes that range from 25×25 to 200×200 m2. A fault-distance power function is used to regress the rupture probability data. The regression form is independent of magnitude, but is dependent on cell sizes. The footprint size (or cell size) is critical in calculating the probability of rupture at a site. Smaller footprints have lower probabilities for rupture occurring within their boundaries than larger
The equations that describe fault displacement hazard used in this project are simplified from Petersen and others (2011). For a given scenario magnitude (m):
(A-1)
for primary-faulting contributions, and (A-2)
for distributed fault displacement contributions. Where α is the annual rate of the m event (1/α is the recurrence interval of the m event), fR(r) characterizes perpendicular distance from the site to all potential ruptures. For probabilistic assessment of fault rupture hazard, a number of probability terms are defined. P[D≠0] and P[d≠0] are conditional probability of slip. P[D≠0] is the probability of having surface rupture on the fault given that a magnitude m earthquake occurs. P[d≠0] is the ratio of cells that have rupture off the principal fault to the total number of cells. This ratio represents the probability of having surface rupture in an area z2 that is off the fault. Therefore, it is related to the footprint size of a structure to be placed on the site. P[D≥D0|l /L,m] and P[d ≥d0|r,m,d≠0] are conditional probabilities of exceedance for principal and distributed fault displacements, respectively. P[D≥D0|l /L,m] is the probability for non-zero displacement greater than or equal to a given value (D0) at a site on or near the mapped fault. It is a conditional probability given a relative location of the closest point on the fault (l/L), a distance to the potential rupture (r) of future earthquakes, and a scenario earthquake magnitude (m). P[d≥d0|r,m,d≠0] is the conditional probability for non-zero displacement greater than or equal to a given value (d0) at a site off the fault, given distance to the future rupture (r), a scenario earthquake magnitude (m), and distributed fault displacement not equal to zero. For a given mean and standard deviation, the exceedance probability is the complement of the cumulative lognormal displacement distribution function.
The density function fR(r) accounts for the variability in rupture location. It denotes the perpendicular range of distances, r, from the site to all potential ruptures, and accounts for uncertainties in the locations of surface ruptures from a potential earthquake. In the Petersen and others (2011) study, the location uncertainty is characterized by a normal distribution centered at the mapped surface fault (zero mean). Consequently, the calculated principal fault displacement also resembles a normal distribution (with truncation), exhibiting a bell-shaped profile centered on the mapped fault. The standard deviation depends on the fault mapping
λ(D ≥ D0 )xyz =α P[D ≠ 0 |m]P[D ≥ D0 | l / L,m] fR(r)drr∫
λ(d ≥ d0 )xyz =α P[d ≠ 0 | r,z]P[d ≥ d0 | r,m,d ≠ 0] fR(r)drr∫
Appendix A. Distributed Fault Displacement and Probabilistic Fault Displacement Hazard Analyses Methodology and Results
[D ≠ 0 |m]= e f (x )
1+ e f (x )

Appendix A. Distributed Fault Displacement and Probabilistic Fault Displacement Hazard Analyses Methodology and Results 55
The exceedance probability for distributed fault displacement is obtained by integrating the lognormal distribution with a mean calculated by using equation A-6 and a standard deviation of 1.1193.
For normal faults, Youngs and others (2003) obtained the exceedance probability for principal fault displacement by convolving the gamma distribution for D/Dave (eq. 6) and the lognormal distribution of Dave (eq. 8) which yields (Wong and Stepp, 1998):
(A-7)
or
(A-8)
where coefficients a and b are defined in equation 7 and Dave is given in equation 8. The bracketed term in equation A-7 is known as the incomplete gamma function that is equivalent to the cumulative gamma distribution of the bracketed term in equation A-8.
For distributed displacement data, Youngs and others (2003) constrained the 85th to 95th percentile distribution of the ratio of distributed fault displacement (d) and the maximum principal fault displacement (Dmax) by the following equations for the hanging wall and footwall regions, respectively: (A-9)
where r is the closest distance to the rupture, based on regressions of Dmax and earthquake magnitude derived in Wells and Coppersmith (1994). Actual distribution is found by specifying a probability distribution form (for example, gamma distribution) and anchoring the appropriate percentile of that distribution to the percentile given in equation A-9. For example, Youngs and others (2003) found that a gamma distribution (as shown in eq. A-7) with a shape parameter, a, of about 2.5 to be an adequate description of distributed fault displacement (in terms of d/Dmax). The 95th percentile of a gamma distribution with a equal to 2.5 occurs at y/b = 5.535. Thus, setting y = d/Dmax, the value of b can be obtained by dividing d/Dmax
Table A-1. Summary of location uncertainty for strike-slip faults.
[Modified from Petersen and others (2011). WGCEP, Working Group on California Earthquake Probabilities; m, meters]
Category based on mapping accuracy Category based on complexity
Mapping accuracy Standard deviation (m) Complexity Standard deviation (m)
All 52.9 Simple – concealed 61.9Accurately located 26.9 Simple – inferred 49.6Approximately located 43.8 Complex – concealed 116.2Inferred 65.5 Complex – inferred 116.4
footprints. In this study we assume a structure footprint size of 200×200 m2 and use the following equation for distributed rupture probability for a strike-slip fault (White Mountains Fault Zone):
(A-4)
This regression has a standard deviation of 1.0177. As stated in Petersen and others (2011), this function does not extrapolate well in areas within a few hundred meters of the fault. Therefore, for these areas, rupture probability is linearly interpolated using the average rupture probability on the fault and the first two distributed-fault average rupture probability measurements.
For normal faulting, we used the following equation developed by Youngs and others (2003) based on digitized data using a 0.5×0.5 km2 grid size:
(A-5)
with f(x) = 2.06 + (−4.62 + 0.118m + 0.682h) × ln(r + 3.32),where m is earthquake magnitude, r is distance to the principal rupture in kilometers, and h is an indicator variable taking the value of 1 for the hanging wall side and 0 for the footwall side of the rupture.
Probability Distribution for Distributed Fault Displacement and Conditional Probability of Exceedance
Conditional probability of exceedance is calculated by integrating probability distributions of surface fault displacement data. Probability distributions for principal fault displacement for strike-slip faults and normal faults are described in the Deterministic Fault Displacement Hazards section of this report.
For distributed fault displacement associated with strike-slip faults, Petersen and others (2011) developed the following regression model with a standard deviation of 1.1193 in natural log units:
(A-6)
P[d ≠ 0]= exp[−1.1538 ln(r)+ 4.2342]
P[d ≠ 0 |m,h,r]= e f (x )
1+ e f (x )
ln(d)=1.4016M − 0.1671ln(r)− 6.7991
P(D > D0 | l / L,m)=1− f (Dave∫ ) 1r(a)
ya−1e−y dy0
D0bDave∫
⎡
⎣⎢
⎤
⎦⎥d(Dave )
P(D > D0 | l / L,m)=1− f (Dave∫ ) 1bar(a)
ya−1e−y/b dy0
D0Dave∫
⎡
⎣⎢
⎤
⎦⎥d(Dave )
dhangingwall /Dmax = 0.35exp(−0.091r)d footwall /Dmax = 0.16exp(−0.137r)
⎧⎨⎪
⎩⎪

56 Scenario Earthquake Hazards for the Long Valley Caldera-Mono Lake Area, East-Central California
determined from equation A-9 by 5.535. Dmax can be calculated using Wells and Coppersmith (1994) maximum displacement and magnitude regression for normal fault:
(A-10)
This regression has a standard deviation of 0.38 in log10 units. Again, the exceedance probability can be calculated by convolving the lognormal distribution and gamma distributions:
(A-11)
Deterministic Fault Displacement Hazards for Scenario Earthquakes
Deterministic fault displacement hazards are computed considering only uncertainty in fault displacement data and neglecting all other uncertainties. The analyses also neglect how often the scenario earthquake occurs. For the White Mountains Fault Zone (a predominantly strike-slip fault zone), the median deterministic principal fault displacement is calculated along the fault strike using equation 1 and the 5th, 15th, 85th, and 95th percentile displacements are calculated by integrating a lognormal distribution. Percentile displacement is the displacement value that has the probability of the given percentile of not being exceeded if the scenario earthquake happens. Results are shown in figure A-1. At the center of the rupture (l/L = 0.5), the predicted median displacement is about 190 cm, and the 5th, 15th, 85th and 95th percentile displacements are 30, 59, 625, and 1,246 centimeters (cm), respectively. These numbers are summarized in table A-2, along with results for other faults. Displacement is greatest at the center of the rupture and decreases toward the ends
of the rupture. Figure A-2 shows percentile displacements as a function of fault distance on either side of the fault for distributed rupture along the White Mountains Fault Zone calculated using equation A-4 and a lognormal integration. The median displacement is more than 20 cm close to the fault and decreases gradually to about 10 cm at about 1 kilometer (km) from the rupture. At the 95th percentile level, displacement of more than 1 meter (m) is predicted for rupture distances less than 80 m. Distributed fault displacement at 1 km to the fault is summarized in table A-3 for all scenarios.
For normal faults, the median deterministic principal fault displacement is calculated along fault strike by integrating equation 6, with Dave calculated using equation 8, ignoring uncertainty in the magnitude and average displacement regression. As an example, figure A-3 shows the calculated median and percentile principal fault displacements for an M6.5 scenario earthquake on the Hilton Creek Fault (the second alternative Hilton Creek scenario). The predicted median displacement in the middle of the rupture is 54 cm, and the 5th, 15th, 85th, and 95th percentile displacements are 11, 21, 112, and 159 cm, respectively. For the M6.8 Hilton Creek scenario (the NSHM scenario), the predicted median displacement in the middle of the rupture is 84 cm, and the 5th, 15th, 85th, and 95th percentile displacements are 16, 33, 172, and 245 cm, respectively (see table A-1). Similar to the strike-slip fault, displacement is the largest in the middle of the rupture and tapers off towards rupture ends. Distributed fault displacement for normal faults is calculated by integrating a gamma distribution and using equations A-9 and A-10. Again, the uncertainty in maximum displacement and earthquake magnitude regression is ignored. Figure A-4 shows percentile distributed rupture displacements for an M6.5 earthquake on the Hilton Creek Fault (the alternative Hilton Creek scenario). The median displacement is about 60 cm close to the rupture and decreases gradually to about 9 cm about 20 km from the rupture
log(Dmax )= −5.9+ 0.89m
P(d > d0 | r,m)=1− f (Dmax )∫ 1r(a)
ya−1e−y dy0
d0bDmax∫
⎡
⎣⎢
⎤
⎦⎥d(Dmax )
Table A-2. Summary of deterministic principal rupture displacements for the earthquake scenarios.
[Earthquake magnitude is the average of Hanks and Bakun and Ellsworth-B magnitudes given in footnote of table 1. Median D, median displacement; cm, centimeter; Alt, alternative; WGCEP, Working Group on California Earthquake Probabilities]
1Strike-slip fault uses elliptical model of Petersen and others (2011).
NameEarthquake magnitude
Median D(cm)
5th percentile(cm)
15th percentile(cm)
85th percentile(cm)
95th percentile(cm)
Fish Slough 6.7 72 14 28 149 212Hartley Springs WGCEP Trace 6.7 72 14 28 149 212
Alternative 6.5 54 11 21 112 159Hilton Creek WGCEP Trace 6.8 84 16 33 172 245
Alternative 1 6.6 63 12 24 129 183
Alternative 2 6.5 54 11 21 112 159
Mono Lake 6.7 72 14 28 149 212
Round Valley 7.0 112 22 44 230 328White Mountains1 7.35 193 30 59 625 1,246

Appendix A. Distributed Fault Displacement and Probabilistic Fault Displacement Hazard Analyses Methodology and Results 57
Figure A-1. Percentile deterministic principal fault displacements in centimeters (cm) for an M7.35 earthquake on the White Mountains Fault Zone.
Figure A-2. Percentile deterministic distributed fault displacement in centimeters (cm) for an M7.35 earthquake on the White Mountains Fault Zone.

58 Scenario Earthquake Hazards for the Long Valley Caldera-Mono Lake Area, East-Central California
1,000
Table A-3. Summary of deterministic distributed rupture displacements at 1 kilometer from the fault for the earthquake scenarios.
[Earthquake magnitude is the average of Hanks and Bakun and Ellsworth-B magnitudes given in footnote of table 1. Median D, median displacement; cm, centimeter; WGCEP, Working Group on California Earthquake Probabilities]
NameEarthquake magnitude
Location relative to fault
Median D(cm)
5th percentile(cm)
15th percentile(cm)
85th percentile(cm)
95th percentile(cm)
Fish Slough 6.7 Hanging wall 80 21 37 150 204
Footwall 35 9 16 65 89Hartley Springs WGCEP Trace 6.7 Hanging wall 80 21 37 150 204
Footwall 35 9 16 65 89
Alternative 6.5 Hanging wall 53 14 24 99 136
Footwall 23 6 11 43 59Hilton Creek WGCEP Trace 6.8 Hanging wall 99 26 45 184 251
Footwall 43 11 20 80 110
Alternative 1 6.6 Hanging wall 65 17 30 122 167
Footwall 29 8 13 53 73
Alternative 2 6.5 Hanging wall 53 14 24 99 136
Footwall 23 6 11 43 59
Mono Lake 6.7 Hanging wall 80 21 37 150 204
Footwall 35 9 16 65 89
Round Valley 7.0 Hanging wall 149 39 68 277 378
Footwall 65 17 30 121 165White Mountains 7.35 – 10 1.6 3.3 33 66
Figure A-3. Percentile deterministic principal fault displacements in centimeters (cm) for an M6.5 earthquake on the Hilton Creek Fault (also applicable to the M6.5 Hartley Springs scenario).

Appendix A. Distributed Fault Displacement and Probabilistic Fault Displacement Hazard Analyses Methodology and Results 59
Dis
tribu
ted
Faul
ting
Dis
plac
emen
t (cm
)
100
10
Figure A-4. Percentile deterministic distributed fault displacement in centimeters (cm) for an M6.5 earthquake on the Hilton Creek Fault (also applicable to the M6.5 Hartley Springs scenario).
on the hanging wall side. For an M6.8 earthquake on the Hilton Creek Fault (the NSHM scenario), the median displacement is more than 100 cm close to the rupture, and decreases gradually to about 20 cm about 20 km from the rupture on the hanging wall side. In the footwall region, predicted displacements are smaller in magnitude and decreases faster away from the fault.
There are notable differences in the way Petersen and others (2011) and Youngs and others (2003) characterize principal and distributed rupture displacements. Petersen and others (2011) excluded slip on secondary faults as distributed rupture, whereas Youngs and others (2003) included them in distributed rupture. In Petersen and others (2011) analyses, distributed fault displacements are off the principal faults and typically are discontinuous on hidden ruptures or shears located several tens of meters to a few kilometers from the principal fault trace. In Youngs and others (2003) study, distributed rupture displacements include slip on secondary traces that, in some cases, are tens of kilometers from the main fault trace.
As summarized in table A-2, predicted median principal rupture displacement is 72 cm for the Fish Slough, Hartley Springs, and Mono Lake scenarios, and 112 cm for the Round Valley scenario. The 85th percentile displacements are 1.2–2.5 m on normal faults and more than 6 m on the White Mountains Fault Zone. As shown in table A-3, at a distance of 1 km from the fault, the predicted displacements on the hanging walls of normal faults are more than twice the displacements on the footwalls. The predicted distributed rupture displacement is much smaller for the White Mountains Fault Zone, a strike-slip fault, than for normal faults because it
does not include slips on secondary faults in the methodology of Petersen and others (2011), whereas the methodology of Youngs and others (2003) for normal faults included slips on secondary faults in the calculation of distributed rupture.
Figure A-5 compares the distribution of principal median deterministic fault displacement along the Hilton Creek Fault for the NSHM scenario (fig. A-5A) and the second alternative scenario (fig. A-5B). Fault trace coordinates used in fault displacement hazard analysis are shown by dots that are color-coded by the estimated displacement along the mapped main fault trace. For the NSHM scenario, the main fault trace is chosen as the longest continuous surface trace on the CGS Fault Activity Map (U.S. Geological Survey and California Geological Survey, 2010). For the second alternative Hilton Creek scenario, the main fault trace is determined based on the experience of the project scientists who are familiar with the geology in the Long Valley Caldera area and available geologic literature. The mapped fault traces of the Hilton Creek Fault show complex geometry. South of the Long Valley Caldera, the fault has a relatively simple, predominant main trace. This portion of the fault dips to the east, shows evidence of as much as 25-m down-to-the east post-glacial displacement, and has the largest observed surface rupture of 27-cm in the vertical direction from the May 1980 earthquake swarms (Taylor and Bryant, 1980). Near the south boundary of Long Valley Caldera, the Hilton Creek Fault begins to splinter into a complicated pattern of splays and parallel/subparallel strands that spread over tens of kilometers. In this northern portion of the fault in the Long Valley Caldera, measured 1980 surface rupture displacements are a few centimeters with

60 Scenario Earthquake Hazards for the Long Valley Caldera-Mono Lake Area, East-Central California
A
Figure A-5. Distribution of deterministic fault rupture displacement in centimeters (cm) along the hypothesized main traces of the Hilton Creek Fault. A, Working Group on California Earthquake Probabilities scenario; B, second alternative scenario. Base map credit: National Elevation Dataset. AP zones, Alquist-Priolo Earthquake Fault Zones.

Appendix A. Distributed Fault Displacement and Probabilistic Fault Displacement Hazard Analyses Methodology and Results 61
Hilton Creek M6.5Displacement (cm)
B
Figure A-5.—Continued

62 Scenario Earthquake Hazards for the Long Valley Caldera-Mono Lake Area, East-Central California
inconsistent direction of slip: both east side down and west side down offsets. To account for this complicated geometry, we partitioned the calculated deterministic fault displacement among the multiple traces by assigning percent slip to each modeled trace. Figure A-6 compares partitioned deterministic fault displacement map for the NSHM and alternative Hilton Creek scenarios. Again, dots are color coded by the amount of estimated displacement. For the NSHM scenario, partitioning is based on these assumptions: (1) the main fault trace is the longest continuous, mapped fault trace; (2) the main trace is assigned the largest proportion of the total predicted displacement and that proportion decreases from south to north (100 percent south of Long Valley Caldera and approximately 55, 45, and 35 percent, respectively, for the three sections of the fault indicated in fig. A-6A); (3) longer secondary branches are assigned a larger proportion of the total slip than shorter branches; (4) percent slips assigned to all branches (including main trace) add to approximately 100 percent; (5) the rupture initiates south of the Long Valley Caldera and propagates northward, therefore, the south end of each branch has displacement value that is the assigned percentage of the calculated displacement value at the closest point on the main branch; and (6) displacement on branches tapers off toward the end of the branch following the same trend as the main trace. For the second alternative scenario, the main trace is assumed to terminate near the south boundary of the caldera and is essentially on single trace. We assume, however, that triggered slip occurs along splays inside the caldera. The triggered offsets are estimated based on these assumptions: (1) triggered offset is the maximum at the location where the main fault trace terminates and, at that location, the total amount of displacement is equal to the estimated principal displacement at the end of the main rupture; (2) the total amount of triggered offset decreases northward, similar to the way principal fault displacement tapers off toward the rupture end; and (3) the total amount of triggered slip is partitioned among various traces, longer branches have larger displacement; and (4) displacements on all branches at a given fault location add toapproximately 100 percent.
Whether the predicted displacement should be partitioned, and how it should be partitioned among multiple branches of a fault zone, is an important decision that should be made based on fault- and site-specific geological studies. In this analysis, we allow the displacement to be partitioned on parallel/subparallel fault branches and splays based mainly on relative length of these branches and the pattern of surface rupture during the 1980 earthquake swarm (Taylor and Bryant, 1980). However, it is difficult to infer if slip in future earthquakes will be partitioned in a similar pattern, particularly because virtually all observed 1980 slips on the Hilton Creek Fault are triggered slips. The Hilton Creek Fault was not the causative fault; rather, most earthquakes occurred on previously unmapped features. However, we have analyzed the effect of partitioning and found that it makes a significant difference in the hazard values and produces a more realistic slip pattern for the Hilton Creek Fault (for example, maximum displacement would occur south of the caldera with partitioning; without partitioning, it would occur
inside the caldera) for the NSHM scenario. Slip partitioning in a displacement hazard analysis should reflect the results of geological studies on the distribution of slip among fault branches and can be improved if additional geological studies become available.
Probabilistic Fault Displacement Hazards for Scenario Earthquakes
We performed probabilistic fault displacement hazard analyses (PFDHA) for the Hilton Creek Fault and White Mountains Fault Zone. PFDHA analyses require detailed fault traces and the occurrence rate of the scenario earthquake for each fault. Fault traces are simplified from the CGS Fault Activity Map (http://www.quake.ca.gov/gmaps/FAM/faultactivitymap.html), which uses the same mapping accuracy categories (that is, accurately mapped, approximately mapped, concealed, and inferred) used in PFDHA. The occurrence rate for a given magnitude (m) is the inverse of return period (see table 1). Dave is the average principal slip for the given m and is calculated using equation 3. For a strike-slip fault, the parameters in equation 3 are a = -6.32, b = 0.90, and ε = 0.28 in log10 units. For normal faults, these are a = -4.45, b = 0.63, and ε = 0.33 in log10 units.
Figure A-7 shows calculated fault displacements with a 2 percent probability of being exceeded in 50 years across the White Mountains Fault Zone at two fault locations: near rupture center (l/L = 0.5) and near rupture end (l/L = 0.1). The results are for an M7.35 earthquake recurring every 1,972 years. Because uncertainty in rupture location is accounted for in PFDHA by a normal distribution centered on the mapped fault, the calculated fault displacement across the fault shows a bell-shaped profile across the mapped fault rather than a spike on the mapped fault, which is the case from deterministic analyses. For strike-slip faults, such as the White Mountains Fault Zone, the profile is symmetric about the mapped fault. Calculated displacement is much higher at the rupture center than near rupture end. The displacement profile at rupture center is narrower than near rupture end, because the White Mountains Fault Zone has a single, accurately located trace at the chosen location near rupture center and an inferred, complex trace near the end of the rupture.
Figure A-8 shows calculated fault displacements with 10 and 2 percent probability of being exceeded in 50 years across the Hilton Creek Fault at two fault locations: near the center of rupture (l/L = 0.5) and near the end of the rupture (l/L = 0.1). The results are for an M6.7 earthquake recurring once every 273 years. Again, because uncertainty in rupture location is accounted for in the PFDHA by a normal distribution centered on the mapped fault, the calculated fault displacement across the fault shows an approximately bell-shaped profile across the mapped fault. Naturally, displacement with 2 percent probability of being exceeded is much larger than displacement with 10 percent probability of being exceeded. Similar to the White Mountains scenario, calculated displacement is much higher at the rupture center than near rupture end. Unlike the White Mountains scenario, displacement profiles are asymmetric about the mapped

Appendix A. Distributed Fault Displacement and Probabilistic Fault Displacement Hazard Analyses Methodology and Results 63
A
Figure A-6. Distribution of deterministic fault rupture displacement in centimeters (cm) partitioned among multiple mapped fault traces for the Hilton Creek Fault. A, Working Group on California Earthquake Probabilities scenario; B, second alternative scenario. Base map credit: National Elevation Dataset. AP zones, Alquist-Priolo Earthquake Fault Zones.

64 Scenario Earthquake Hazards for the Long Valley Caldera-Mono Lake Area, East-Central California
Hilton Creek M6.5Displacement (cm)
B
Figure A-6.—Continued

Appendix A. Distributed Fault Displacement and Probabilistic Fault Displacement Hazard Analyses Methodology and Results 65
Figure A-8. Calculated fault displacement hazards for the Hilton Creek M6.8 scenario recurring every 273 years along a line perpendicular to fault strike at two selected locations: middle of the fault (l/L=0.5) and near end of the fault (0.1); using 200×200 square meter cells and actual mapping accuracy and complexity at each location. M, meters; cm, centimeters; %, percent.
Figure A-7. Calculated fault displacement hazards along a line perpendicular to fault strike at two selected locations: middle of the fault (l/L=0.5) and near end of the fault (0.1); using 200×200 square meter cells and actual mapping accuracy and complexity at each location for the White Mountains scenario. M, meters; cm, centimeters; %, percent.

66 Scenario Earthquake Hazards for the Long Valley Caldera-Mono Lake Area, East-Central California
fault. The displacement is higher and attenuates more slowly in the hanging wall regions than in the footwall regions. This phenomenon is further illustrated in figure A-9 by comparing the displacements in hanging wall and footwall regions for the Hilton Creek scenario. It is noted that the asymmetric feature of the fault displacement profile is a result of the contribution of distributed
fault displacement. Also, the two locations examined for the Hilton Creek scenario have the same mapping accuracy, both are accurately located. Displacement profiles are wider at a lower exceedance probability level (in other words, 2% in 50 years), showing more significant contributions from distributed fault displacement.
Figure A-9. Comparison of calculated fault displacement hazards for the Hilton Creek M6.8 scenario, recurring every 273 years, in the hanging-wall and footwall regions along a line perpendicular to fault strike at two selected locations: middle of the fault (l/L=0.5) and near end of the fault (0.1); using 200×200 square meter cells and actual mapping accuracy and complexity at each location. M, meters; cm, centimeters; %, percent.

Appendix B. Results for Hartley Springs M6.7 Scenario (2008 National Seismic Hazard Maps Scenario) 67
An M6.7 earthquake on the 2008 National Seismic Hazard Maps (NSHM) depiction of the Hartley Springs Fault would produce strong ground shaking in the Long Valley Caldera and the highlands between Long Valley and Mono Lake. Instrumental intensity, median peak ground acceleration (PGA), and median spectral acceleration (SA) at 1.0 second for this scenario are shown in figure B-1. The maximum Modified Mercalli Intensity (MMI) is 8.5, corresponding to severe to violent perceived shaking and moderate to heavy potential damage. The maximum PGA and SA at 1.0 second are 0.57 and 0.66 g (percent of acceleration due to gravity), respectively. The maximum shaking occurs in the immediate vicinity of the fault. The affected areas with at least strong perceived shaking and light potential damage (that is, intensity ≥6.0) extend as far as 28 kilometers (km) from the fault trace. The areas with at least very strong perceived shaking and moderate potential damage (that is, intensity ≥7.0) extend to about 17 km in the hanging wall regions and 7 km in the footwall regions. The area of severe perceived shaking (intensity ≥8.0) and moderate to heavy potential damage is limited to a small area northeast of June Lake Junction and an even smaller area near Mammoth Lakes at the south end of the Hartley Springs Fault. The extent of the area of severe perceived shaking is much smaller than the Fish Slough scenario, primarily because areas near the Hartley Springs Fault are underlain by older sediments and bedrock. The areas of strong shaking extend farther to the south near Lake Crowley, along Round Valley, and along Fish Slough. Although
Appendix B. Results for Hartley Springs M6.7 Scenario (2008 National Seismic Hazard Maps Scenario)
the affected areas with PGA greater than 0.1 g extend 35 km in the hanging wall from the modeled fault traces, the areas with PGA greater than 0.4 g are limited to about 12 km from the fault in the hanging wall. Areas with PGA greater than 0.5 g are limited to hanging wall side only, extending approximately 8 km away from the fault. The distribution of SA at 1.0 second is affected by local site conditions, showing irregular shapes and distribution similar to that of MMI.
The median principal displacements along a simplified fault trace are shown with color-coded dots in figure B-2. The maximum fault displacement is 72 centimeters (cm), occurring in the middle of the fault. Predicted displacement value decreases toward rupture ends. U.S. Route 395 crosses the Hartley Springs Fault south of the junction with State Highway 158 (June Lake Junction) north of Mount Downs. At this highway crossing, the estimated fault displacement is 46 cm. The Hartley Springs scenario could offset State Highway 203 between the town of Mammoth Lakes and the Mammoth Mountain ski lodge by about 33 cm. In addition, it could produce triggered slips on numerous smaller faults west of Mammoth Lakes.
Landslide and liquefaction hazards are shown in figure B-3. Potential hazard zones include a broad area from Crowley Lake in the south to Mono Lake in the north, and across the width of the focus study area. The flat, alluvial areas north and northwest of Crowley Lake, south of Mono Lake, and along stream valley from Grant Lake to Mono Lake appear as possible liquefaction hazard zones.

68 Scenario Earthquake Hazards for the Long Valley Caldera-Mono Lake Area, East-Central California
Figure B-1. Maps showing ground motion hazards of an M6.7 earthquake on Hartley Springs Fault. A, Modified Mercalli Intensity (MMI), B, median peak ground acceleration (PGA), and C, median spectral acceleration (SA) at 1.0 second. Base map credit: National Elevation Dataset. % g, percent acceleration due to gravity.
Bishop
6
395
Mono Lake
Crowley Lake
Mammoth Lakes203
Nevada
California
Death Valley
Hartley Springs
Hilton Creek
Long Valley CalderaJune Lake
A

Appendix B. Results for Hartley Springs M6.7 Scenario (2008 National Seismic Hazard Maps Scenario) 69
Figure B-1.—Continued
Bishop
6
395
Mono Lake
Crowley Lake
Mammoth Lakes203
Nevada
California
Death Valley
Hartley Springs
Hilton Creek
Long Valley CalderaJune Lake
B

70 Scenario Earthquake Hazards for the Long Valley Caldera-Mono Lake Area, East-Central California
Figure B-1.—Continued
Bishop
6
395
Mono Lake
Crowley Lake
Mammoth Lakes203
Nevada
California
Death Valley
Hartley Springs
Hilton Creek
Long Valley CalderaJune Lake
C

Appendix B. Results for Hartley Springs M6.7 Scenario (2008 National Seismic Hazard Maps Scenario) 71
Figure B-2. Map showing median deterministic principal fault displacement in centimeters (cm) along fault strike for the Hartley Springs M6.7 scenario. Dots represent the simplified fault trace and are color-coded by calculated fault displacement. Base map credit: National Elevation Dataset.
Mt. Downs
Mammoth Lakes
June Lake

72 Scenario Earthquake Hazards for the Long Valley Caldera-Mono Lake Area, East-Central California
Figure B-3. Map showing potential liquefaction (green) and landslide areas for the Harley Springs M6.7 scenario. All areas with slopes greater than 30 degrees (orange) are considered at risk during even minimum ground shaking. Additional landslide hazard zones owing to the combined effect of scenario ground motion, slope, and shear strength of the geologic material are shown in red. Base map credit: National Elevation Dataset. PGA, peak ground acceleration.

Appendix C. Results for Hilton Creek M6.8 Scenario (2008 National Seismic Hazard Maps Scenario) 73
Two alternative scenarios (M6.8 and M6.6) were developed for the Hilton Creek Fault to account for different opinions in how far the fault extends into Long Valley Caldera. For each scenario, ground motions were calculated using the same approaches used for other scenarios in the main text, including the deterministic seismic hazard analysis program developed by Art Frankel of the U.S. Geological Survey and three Next Generation Ground Motion
Appendix C. Results for Hilton Creek M6.8 Scenario (2008 National Seismic Hazard Maps Scenario)
Attenuation (NGA) models. Ground motion calculations incorporated the potential amplification of seismic shaking by near-surface soils defined by a map of the average shear wave velocity in the uppermost 30 meters (VS30) developed by California Geological Survey.
Results for the M6.8 scenario are shown in figures C-1 through C-4 in this appendix. Results for the M6.6 scenario are shown in appendix D.

74 Scenario Earthquake Hazards for the Long Valley Caldera-Mono Lake Area, East-Central California
Figure C-1. Ground motion hazards of an M6.8 earthquake on the Hilton Creek Fault 2008 National Seismic Hazard Maps scenario. A, Modified Mercalli Intensity (MMI), B, median peak ground acceleration (PGA), and C, median spectral acceleration (SA) at 1.0 second. Base map credit: National Elevation Dataset. % g, percent acceleration due to gravity.
A

Appendix C. Results for Hilton Creek M6.8 Scenario (2008 National Seismic Hazard Maps Scenario) 75
B
Figure C-1.—Continued

76 Scenario Earthquake Hazards for the Long Valley Caldera-Mono Lake Area, East-Central California
Figure C-1.—Continued
C

Appendix C. Results for Hilton Creek M6.8 Scenario (2008 National Seismic Hazard Maps Scenario) 77
Figure C-2. Potential liquefaction (green) and landslide areas (red and orange) for the Hilton Creek M6.8 earthquake scenario based on the 2008 National Seismic Hazard Maps. Base map credit: National Elevation Dataset. PGA, peak ground acceleration.

78 Scenario Earthquake Hazards for the Long Valley Caldera-Mono Lake Area, East-Central California
Figure C-3. Percentile deterministic principal fault displacements in centimeters (cm) for an M6.8 earthquake on the Hilton Creek Fault as part of the scenario based on the 2008 National Seismic Hazard Maps.
Figure C-4. Percentile deterministic distributed fault displacement for an M6.8 earthquake on the Hilton Creek Fault as part of the scenario based on the 2008 National Seismic Hazard Maps. Km, kilometer; cm, centimeter.

Appendix D. Results for Hilton Creek M6.6 Scenario (Alternative 1) 79
Two alternative scenarios (M6.8 and M6.6) were developed for the Hilton Creek Fault to account for different opinions in how far the fault extends into Long Valley Caldera. For each scenario, ground motions were calculated using the same approaches used for other scenarios in the main text, including the deterministic seismic hazard analysis program developed by Art Frankel of the U.S. Geological Survey and three Next Generation Ground Motion
Appendix D. Results for Hilton Creek M6.6 Scenario (Alternative 1)
Attenuation (NGA) models. Ground motion calculations incorporated the potential amplification of seismic shaking by near-surface soils defined by a map of the average shear wave velocity in the uppermost 30 meters (VS30) developed by California Geological Survey.
Results for the M6.6 scenario are shown in figures D-1 through D-4 in this appendix. Results for the M6.8 scenario are shown in appendix C.

80 Scenario Earthquake Hazards for the Long Valley Caldera-Mono Lake Area, East-Central California
Figure D-1. Ground motion hazards of an M6.6 earthquake on the Hilton Creek Fault (alternative 1). A, Modified Mercalli Intensity (MMI), B, median peak ground acceleration (PGA), and C, median spectral acceleration (SA) at 1.0 second. Base map credit: National Elevation Dataset. % g, percent acceleration due to gravity.
Bishop
395
Mono Lake
Crowley Lake
Mammoth Lakes
Long Valley Caldera
Nevada
California Death Valley
Hartley Springs
Hilton Creek
Hilton Creek M6.6 MMIA
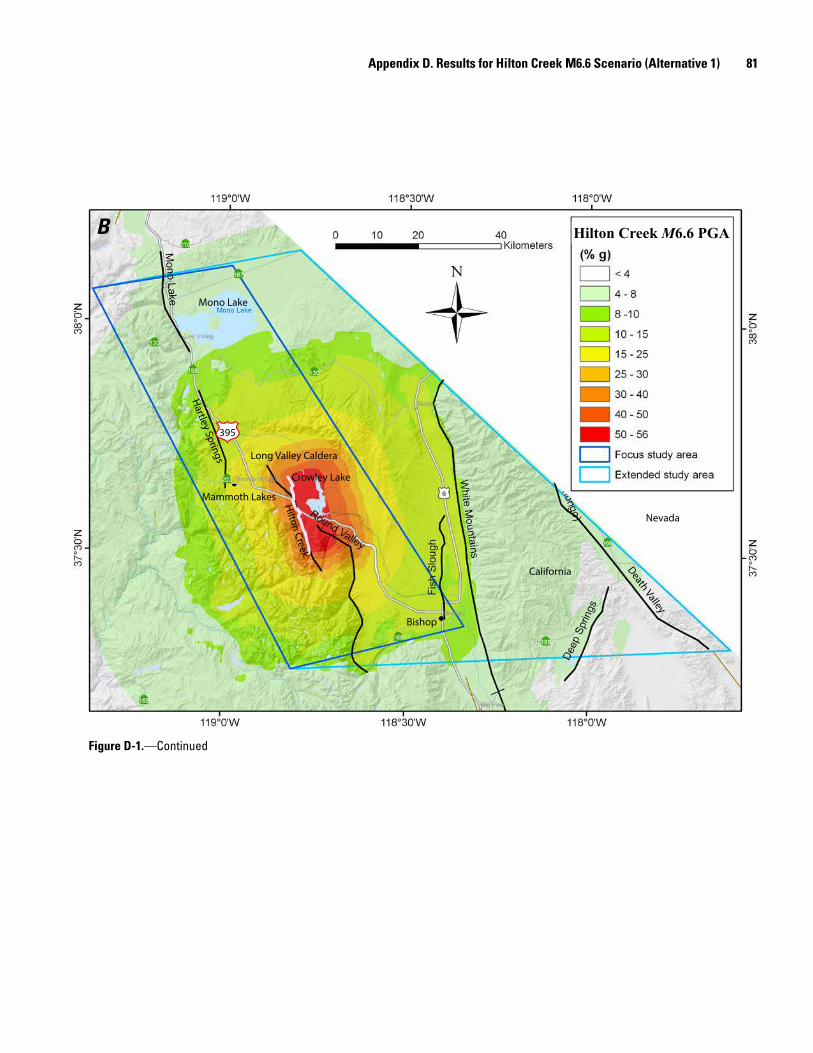
Appendix D. Results for Hilton Creek M6.6 Scenario (Alternative 1) 81
Figure D-1.—Continued
Bishop
395
Mono Lake
Crowley Lake
Mammoth Lakes
Long Valley Caldera
Nevada
California Death Valley
Hartley Springs
Hilton Creek
Hilton Creek M6.6 PGAB

82 Scenario Earthquake Hazards for the Long Valley Caldera-Mono Lake Area, East-Central California
Figure D-1.—Continued
Bishop
395
Mono Lake
Crowley Lake
Mammoth Lakes
Long Valley Caldera
Nevada
California Death Valley
Hartley Springs
Hilton Creek
Hilton Creek M6.6 SAC

Appendix D. Results for Hilton Creek M6.6 Scenario (Alternative 1) 83
Figure D-2. Potential liquefaction (green) and landslide areas (red and orange) for the Hilton Creek M6.6 scenario (alternative 1). Base map credit: National Elevation Dataset. PGA, peak ground acceleration.

84 Scenario Earthquake Hazards for the Long Valley Caldera-Mono Lake Area, East-Central California
Figure D-3. Percentile deterministic principal fault displacements in centimeters (cm) for an M6.6 earthquake on the Hilton Creek Fault (alternative 1).
Figure D-4. Percentile deterministic distributed fault displacement for an M6.6 earthquake on the Hilton Creek Fault (alternative 1). Km, kilometer; cm, centimeter.

Menlo Park Publishing Service Center, CaliforniaManuscript approved for publication October 27, 2017Edited by Katherine JacquesLayout and design by Cory D. Hurd

Chen and others—Scenario Earthquake Hazards for the Long Valley Caldera-M
ono Lake Area, East-Central California—Open-File Report 2014–1045, ver. 2.0
ISSN 2331-1258 (online)https://doi.org/10.3133/ofr20141045v2