Seismic source mechanism inversion from a linear array of receivers reveals non-double-couple...
10
Seismic source mechanism inversion from a linear array of receivers reveals non-double-couple seismic events induced by hydraulic fracturing in sedimentary formation Zuzana Jechumtálová a, ⁎, Leo Eisner b,c a Geophysical Institute, Ac. Sci. of Czech Rep., Boční II 1401, Prague 4, 141 31, Czech Republic b Formerly Schlumberger Cambridge Research, High Cross, Madingley Road, Cambridge, CB3 0EL, United Kingdom c MicroSeismicinc, Inc., 800 Tully Road, Houston, TX 77079, United States abstract article info Article history: Received 14 September 2007 Received in revised form 17 June 2008 Accepted 14 July 2008 Available online 20 July 2008 Keywords: Moment tensor inversion Non-double-couple mechanisms Hydraulic fracturing Induced seismicity We developed a new method to invert source mechanisms of seismic events observed from a single (vertical or near vertical) array of receivers. This method was tested on a synthetic dataset and applied to a seismic dataset acquired during hydraulic fracturing of a sedimentary formation. We show that a crack-opening seismic event recorded on a single vertical array can be inverted as a pure shear seismic event, indicating that the best fitting shear mechanisms inverted from seismic data acquired along a vertical borehole provide misleading information. We found that the majority of the analyzed source mechanisms of the induced events are not consistent with pure shear faulting as previously thought. The non-shear source mechanisms are required even when seismic noise, location uncertainty, and uncertainty in the attenuation structural model are considered. © 2008 Elsevier B.V. All rights reserved. 1. Introduction Hydraulic fracturing is an operation in which a fluid is pumped down a well and into a formation under high enough pressure to cause the formation to open a new fracture. At injection intervals the pressure of the injected fluid usually exceeds the minimum stress thus allowing tensile opening. This procedure is routinely used to increase connectivity and conductivity of the oil and gas bearing reservoirs (usually sedimentary formations, e.g., Phillips et al., 1998) or to create flow paths in geothermal reservoirs (usually volcanic or other non-sedimentary formations, e.g., Pearson, 1981). Furthermore, to keep these fractures conductive solid particles known as proppant are pumped with the fluid into the treated formation. These particles are up to a few millimeters in size, and usually several tens of cubic meters are injected into the formation during a given treatment. The hydraulic fracture treatments induce weak seismic events (commonly known as microearthquakes). However, it is still poorly understood how the injected fluids induce microearthquakes. A key step in resolving this issue is to invert for the source mechanisms of the induced microearthquakes. This can be done by inverting full waveforms or amplitudes of the seismic phases (e.g., Dahm et al., 1999; Jechumtálová and Šílený, 2001) or amplitude ratios of the body-wave phases (e.g., Foulger et al., 2004). The waveform or amplitude inversion is suitable for receivers situated in boreholes or where usually velocity model of the medium is well constrained. However, considering the everlasting uncertainty in knowledge of the medium, source duration, hypocenter location, etc. (which may result in inability to reproduce waveforms), it is more robust to parameterize these waveforms by amplitudes and invert the amplitudes of seismic phases. The moment tensor inversion of amplitude ratios is more suitable for surface stations. It is not only robust to velocity model as long as P- and S-waves travel along the same paths, but also is more sensitive to good receiver coverage of the focal sphere (boreholes provide a very poor focal coverage). The focal coverage is a significant problem because the induced microearthquakes are very weak and observation points are limited (usually to only one observation borehole). Furthermore, the range of induced source mechanisms is much larger than for tectonic earthquakes as the tensile opening may interact with shear faulting. The focal coverage is usually limited to only the closest monitoring borehole as other boreholes are too distant, and signals reaching them are considerably attenuated. Nolen-Hoeksema and Ruff (2001) numerically showed that a single (vertical) array of receivers (i.e., single-azimuth dataset) does not allow for the inversion of the volumetric component of the source mechanism. Therefore, they constrained the inversion to deviatoric mechanisms (i.e., non- volumetric). Vavryčuk (2007) theoretically demonstrated that a single-azimuth dataset cannot resolve the dipole perpendicular to the plane of stations and the hypocenter, i.e. plane of single azimuth. Thus, the deviatoric constraint numerically stabilizes the source mechanism inversion. However, it provides an unphysical result. In this study we exclude the unresolvable component of the source Tectonophysics 460 (2008) 124–133 ⁎ Corresponding author. E-mail address: [email protected] (Z. Jechumtálová). 0040-1951/$ – see front matter © 2008 Elsevier B.V. All rights reserved. doi:10.1016/j.tecto.2008.07.011 Contents lists available at ScienceDirect Tectonophysics journal homepage: www.elsevier.com/locate/tecto
Transcript of Seismic source mechanism inversion from a linear array of receivers reveals non-double-couple...
Tectonophysics 460 (2008) 124–133
Contents lists available at ScienceDirect
Tectonophysics
j ourna l homepage: www.e lsev ie r.com/ locate / tecto
Seismic source mechanism inversion from a linear array of receivers revealsnon-double-couple seismic events induced by hydraulic fracturing insedimentary formation
Zuzana Jechumtálová a,⁎, Leo Eisner b,c
a Geophysical Institute, Ac. Sci. of Czech Rep., Boční II 1401, Prague 4, 141 31, Czech Republicb Formerly Schlumberger Cambridge Research, High Cross, Madingley Road, Cambridge, CB3 0EL, United Kingdomc MicroSeismicinc, Inc., 800 Tully Road, Houston, TX 77079, United States
⁎ Corresponding author.E-mail address: [email protected] (Z. Jechumtálová).
0040-1951/$ – see front matter © 2008 Elsevier B.V. Aldoi:10.1016/j.tecto.2008.07.011
a b s t r a c t
a r t i c l e i n f oArticle history:
We developed a new method Received 14 September 2007Received in revised form 17 June 2008Accepted 14 July 2008Available online 20 July 2008Keywords:Moment tensor inversionNon-double-couple mechanismsHydraulic fracturingInduced seismicity
to invert source mechanisms of seismic events observed from a single (vertical ornear vertical) array of receivers. This method was tested on a synthetic dataset and applied to a seismic datasetacquired during hydraulic fracturing of a sedimentary formation. We show that a crack-opening seismic eventrecorded on a single vertical array can be inverted as a pure shear seismic event, indicating that the best fittingshear mechanisms inverted from seismic data acquired along a vertical borehole provide misleadinginformation. We found that the majority of the analyzed source mechanisms of the induced events are notconsistent with pure shear faulting as previously thought. The non-shear source mechanisms are required evenwhen seismic noise, location uncertainty, and uncertainty in the attenuation structural model are considered.
© 2008 Elsevier B.V. All rights reserved.
1. Introduction
Hydraulic fracturing is anoperation inwhich afluid is pumpeddownawell and into a formation under high enough pressure to cause theformation to open a new fracture. At injection intervals the pressure of theinjected fluid usually exceeds the minimum stress thus allowing tensileopening. This procedure is routinely used to increase connectivity andconductivity of the oil and gas bearing reservoirs (usually sedimentaryformations, e.g., Phillips et al., 1998) or to create flow paths in geothermalreservoirs (usually volcanic or other non-sedimentary formations, e.g.,Pearson, 1981). Furthermore, to keep these fractures conductive solidparticles known as proppant are pumped with the fluid into the treatedformation. These particles are up to a fewmillimeters in size, and usuallyseveral tens of cubicmeters are injected into the formation during a giventreatment.
The hydraulic fracture treatments induce weak seismic events(commonly known as microearthquakes). However, it is still poorlyunderstoodhow the injectedfluids inducemicroearthquakes. A key stepin resolving this issue is to invert for the source mechanisms of theinducedmicroearthquakes. This canbedoneby inverting fullwaveformsor amplitudes of the seismic phases (e.g., Dahm et al., 1999;Jechumtálová and Šílený, 2001) or amplitude ratios of the body-wavephases (e.g., Foulger et al., 2004). The waveform or amplitude inversionis suitable for receivers situated in boreholes or where usually velocity
l rights reserved.
model of the medium is well constrained. However, considering theeverlasting uncertainty in knowledge of the medium, source duration,hypocenter location, etc. (which may result in inability to reproducewaveforms), it is more robust to parameterize these waveforms byamplitudes and invert the amplitudes of seismic phases. The momenttensor inversion of amplitude ratios ismore suitable for surface stations.It is not only robust to velocity model as long as P- and S-waves travelalong the same paths, but also is more sensitive to good receivercoverage of the focal sphere (boreholes provide a very poor focalcoverage). The focal coverage is a significant problem because theinduced microearthquakes are very weak and observation points arelimited (usually to only one observation borehole). Furthermore, therange of induced source mechanisms is much larger than for tectonicearthquakes as the tensile opening may interact with shear faulting.
The focal coverage is usually limited to only the closest monitoringborehole as other boreholes are too distant, and signals reaching themare considerably attenuated. Nolen-Hoeksema and Ruff (2001)numerically showed that a single (vertical) array of receivers (i.e.,single-azimuth dataset) does not allow for the inversion of thevolumetric component of the source mechanism. Therefore, theyconstrained the inversion to deviatoric mechanisms (i.e., non-volumetric). Vavryčuk (2007) theoretically demonstrated that asingle-azimuth dataset cannot resolve the dipole perpendicular tothe plane of stations and the hypocenter, i.e. plane of single azimuth.Thus, the deviatoric constraint numerically stabilizes the sourcemechanism inversion. However, it provides an unphysical result. Inthis study we exclude the unresolvable component of the source
125Z. Jechumtálová, L. Eisner / Tectonophysics 460 (2008) 124–133
mechanism in a suitable coordinate system and determine the class ofsource mechanisms constrained by the data. While this inversion doesnot allow getting the complete source mechanisms, it provides themaximum information obtainable from the seismic data acquiredalong a single azimuth. Moreover, for the selected dataset the class ofthe source mechanisms constrained by the data excludes the shearmechanisms, this observation provides an important insight into theinduction process of these microearthquakes.
Most researchers (hot dry rock projects e.g., Pearson, 1981; Fehler,1989; oil and gas industry e.g., Warpinski, 1997; Phillips et al., 1998)observed high S/P-wave amplitude ratios which “could not beexplained by tensile opening” (Pearson, 1981) concluding that theinduced events are shear failure along pre-existing joints in rockssurrounding hydraulic fracture due to elevated pore pressure. Thus,Rutledge and Phillips (2003) used Snoke's constrained (pure shearmechanism) amplitude inversion (Snoke et al., 1984). Their sourcemechanisms were pure strike-slip faulting with vertical fault planestrending close to the maximum horizontal stress orientation. How-ever, there is no shear stress on vertical planes parallel to maximumhorizontal stress. In this studywe show that the sourcemechanisms ofthe events induced by another hydraulic fracturing treatment are notconsistent with pure shear mechanisms.
2. Method
Microseismic-monitoring datasets are frequently limited to asingle array of geophones in a borehole. If this borehole is verticaland the medium is laterally homogeneous [isotropic or anisotropicwith a vertical axis of symmetry, e.g., a 1D Vertically TransverselyIsotropic (VTI) velocity model of a sedimentary basin], then seismicwaves arrive along a single azimuth from source to all receivers. In thiscase, Vavryčuk (2007) showed that this single-azimuth dataset cannotresolve the dipole perpendicular to the plane of stations and thehypocenter. Thus, moment tensor inversion for all six components ofthe general source mechanism is underdetermined. Deviatoric (i.e., novolumetric component) constraint distorts the inverted momenttensor to account for the volumetric component of the source (eitherreal or due to noise in the data, e.g., Jechumtálová and Šílený, 2005). Asolution to this problem is to invert for the moment tensorcomponents that are constrained by the observed data.
Without restriction on generality we can rotate all seismograms to anew coordinate system in which the hypocentral location of the sourceand all receivers are in the plane (x2, x3). In this coordinate system (andin the velocity model described in the above paragraph) all raysbetween the source and any receiver are constrained to the plane (x2,x3). Thus the moment tensor in this coordinate system has thecomponent M11 undeterminable and only five components (M12, M13,M22, M23 and M33) can be inverted by linear least-squares inversion ofamplitudes of three-component seismograms (Šílený et al., 1992;Jechumtálová and Šílený, 2001). Using Green's function of direct P- andS-waves (computed with the assistance of Asymptotic Ray Theory byprogram package ANRAY— Gajewski and Pšenčík, 1989) representing aresponse of a medium in this coordinate system we invert fivecomponents of the moment tensor. The component M11 can varybetween a single imploding and exploding dipole along the x1-axisrepresenting crack closing and opening (along x1-axis). To find the classof source mechanisms constrained by the data we analyze sourcemechanisms composed of the inverted five components completedwith a chosen value of theM11 component. Numerically we test theM11
value between −10M5 and 10M5, where M5 is the maximum absolutevalue of the five inverted components. Note that a seismic event withmoment tensor of any M11 component will have the same syntheticseismograms at all receivers in the (x2, x3) plane. Thus all such eventshave the same normalized residual sum. Consequently, we obtain a setof source mechanisms fitting the data with the same fit. Finally, werotate these moment tensors to the geographical coordinate system.
Moment tensor M can be decomposed into the volumetric (V),compensated linear vector dipole (CLVD) and double-couple (DC)components. Any decomposition of amoment tensor is non-unique. Inthis paper we chose to use decomposition of a moment tensor definedby Vavryčuk (2001). The sum of the CLVD and DC components is thedeviatoric momentMdev (i.e., themoment tensor with zero volumetriccomponent), with eigenvalues λ1
dev, λ2dev and λ3
dev, which correspondto the relation
jλdev1 jV jλdev
2 jV jλdev3 j: ð1Þ
Parameter εdev is introduced to measure the size of DC relative toCLVD:
edev ¼ −λdev1
jλdev3 j : ð2Þ
For pure DC, εdev=0, and for a pure CLVD, εdev=±0.5. Parameterεdev is positive for tensile sources and negative for compressivesources. The proportional representation of individual component isdone in compliance with the following formulas:
pV ¼ 13tr Mð Þjλmaxj 100k; ð3Þ
pCLVD ¼ 2edev 100k−jpVj� �; ð4Þ
pDC ¼ 100k − jpVj − jpCLVDj; ð5Þ
where λmax is that eigenvalue of moment tensor M, which has themaximum absolute value, and εdev is defined by Eq. (2). The V andCLVD percentages are positive for tensile sources and negative forcompressive sources. The DC percentage is always positive. The sum ofabsolute values of the pV, pCLVD and pDC is 100%.
2.1. Synthetic tests
First we tested the above technique on a synthetic dataset. Wegenerated synthetic seismograms for two microseismic events withdifferent source mechanisms (strike-slip and tensile dipole). Thesynthetic seismograms were simulated in a similar geometry to aseismic monitoring of hydraulic fracturing with a single monitoringborehole (Fig. 1). The synthetic seismograms were computed at eightthree-component geophones in a single vertical monitoring well. Theborehole is located at approximately 250 m horizontal distance inazimuth 335° from the source hypocenter. The lowest geophone is10 m above the hypocentre depth of the simulated microseismicevents, and the geophone spacing is 30m (i.e., the highest geophone is220 m above the source).
The first tested source model is strike-slip (i.e., dip 90° and rake 0°)with strike 0°. The upper plot of Fig. 2 shows the ratio of the DC (i.e.,shear part of the mechanism), V, and CLVD components of themoment tensor composed of the five constrained componentscompleted with the various values of the M11 component between−10M5 and 10M5 as explained in the methodology section of thispaper. The moment tensor is decomposed using the Vavryčuk (2001)definition in which the source mechanism of a pure crack isrepresented by 33% volumetric and 67% CLVD components (notethat left and right ends of the plot represent closing and openingcrack, respectively). Note that the maximumDC component occurs forzero CLVD and volumetric components of the moment tensor. This isconsistent with the input data which contained also zero CVLD and avolumetric component of the moment tensor, thus this choice of M11
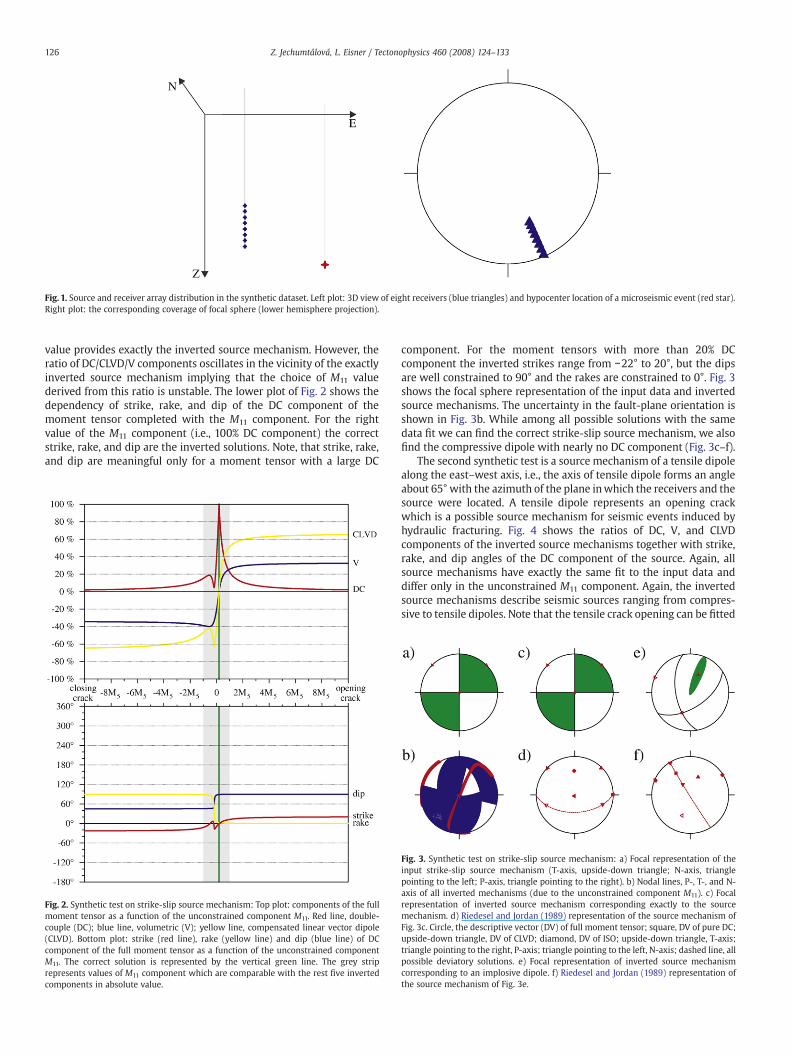
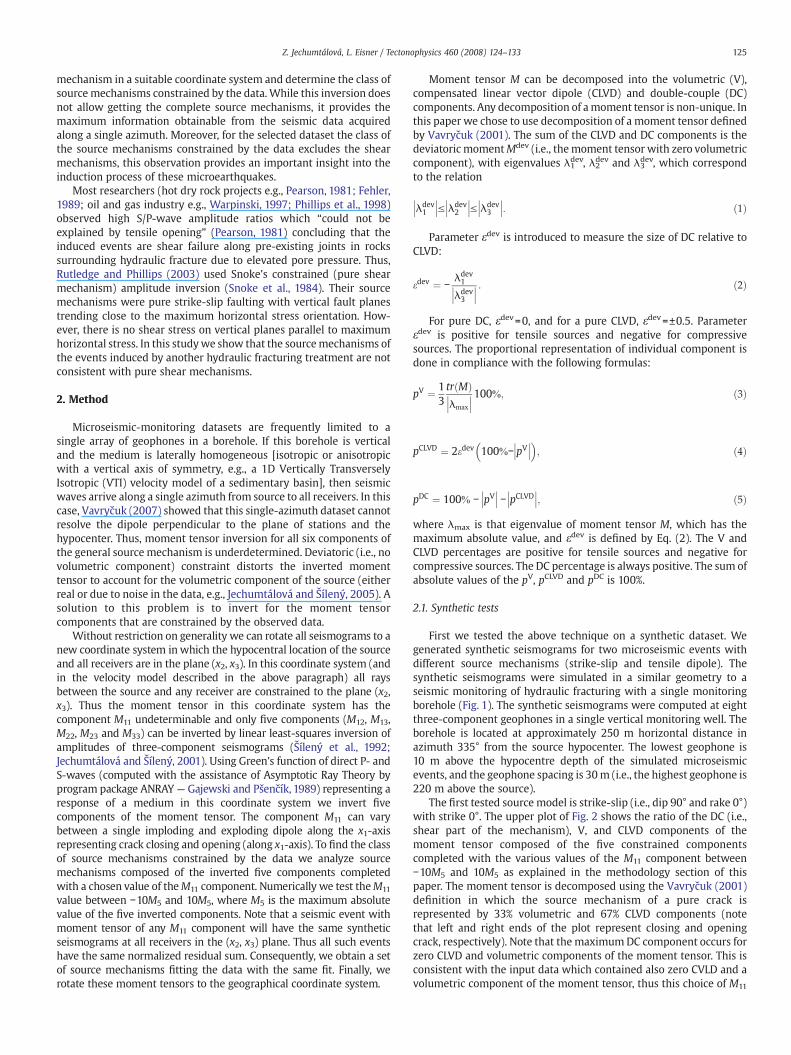
Fig. 1. Source and receiver array distribution in the synthetic dataset. Left plot: 3D view of eight receivers (blue triangles) and hypocenter location of a microseismic event (red star).Right plot: the corresponding coverage of focal sphere (lower hemisphere projection).
126 Z. Jechumtálová, L. Eisner / Tectonophysics 460 (2008) 124–133
value provides exactly the inverted source mechanism. However, theratio of DC/CLVD/V components oscillates in the vicinity of the exactlyinverted source mechanism implying that the choice of M11 valuederived from this ratio is unstable. The lower plot of Fig. 2 shows thedependency of strike, rake, and dip of the DC component of themoment tensor completed with the M11 component. For the rightvalue of the M11 component (i.e., 100% DC component) the correctstrike, rake, and dip are the inverted solutions. Note, that strike, rake,and dip are meaningful only for a moment tensor with a large DC
Fig. 2. Synthetic test on strike-slip source mechanism: Top plot: components of the fullmoment tensor as a function of the unconstrained component M11. Red line, double-couple (DC); blue line, volumetric (V); yellow line, compensated linear vector dipole(CLVD). Bottom plot: strike (red line), rake (yellow line) and dip (blue line) of DCcomponent of the full moment tensor as a function of the unconstrained componentM11. The correct solution is represented by the vertical green line. The grey striprepresents values of M11 component which are comparable with the rest five invertedcomponents in absolute value.
component. For the moment tensors with more than 20% DCcomponent the inverted strikes range from −22° to 20°, but the dipsare well constrained to 90° and the rakes are constrained to 0°. Fig. 3shows the focal sphere representation of the input data and invertedsource mechanisms. The uncertainty in the fault-plane orientation isshown in Fig. 3b. While among all possible solutions with the samedata fit we can find the correct strike-slip source mechanism, we alsofind the compressive dipole with nearly no DC component (Fig. 3c–f).
The second synthetic test is a source mechanism of a tensile dipolealong the east–west axis, i.e., the axis of tensile dipole forms an angleabout 65° with the azimuth of the plane inwhich the receivers and thesource were located. A tensile dipole represents an opening crackwhich is a possible source mechanism for seismic events induced byhydraulic fracturing. Fig. 4 shows the ratios of DC, V, and CLVDcomponents of the inverted source mechanisms together with strike,rake, and dip angles of the DC component of the source. Again, allsource mechanisms have exactly the same fit to the input data anddiffer only in the unconstrained M11 component. Again, the invertedsource mechanisms describe seismic sources ranging from compres-sive to tensile dipoles. Note that the tensile crack opening can be fitted
Fig. 3. Synthetic test on strike-slip source mechanism: a) Focal representation of theinput strike-slip source mechanism (T-axis, upside-down triangle; N-axis, trianglepointing to the left; P-axis, triangle pointing to the right). b) Nodal lines, P-, T-, and N-axis of all inverted mechanisms (due to the unconstrained component M11). c) Focalrepresentation of inverted source mechanism corresponding exactly to the sourcemechanism. d) Riedesel and Jordan (1989) representation of the source mechanism ofFig. 3c. Circle, the descriptive vector (DV) of full moment tensor; square, DV of pure DC;upside-down triangle, DV of CLVD; diamond, DV of ISO; upside-down triangle, T-axis;triangle pointing to the right, P-axis; triangle pointing to the left, N-axis; dashed line, allpossible deviatory solutions. e) Focal representation of inverted source mechanismcorresponding to an implosive dipole. f) Riedesel and Jordan (1989) representation ofthe source mechanism of Fig. 3e.
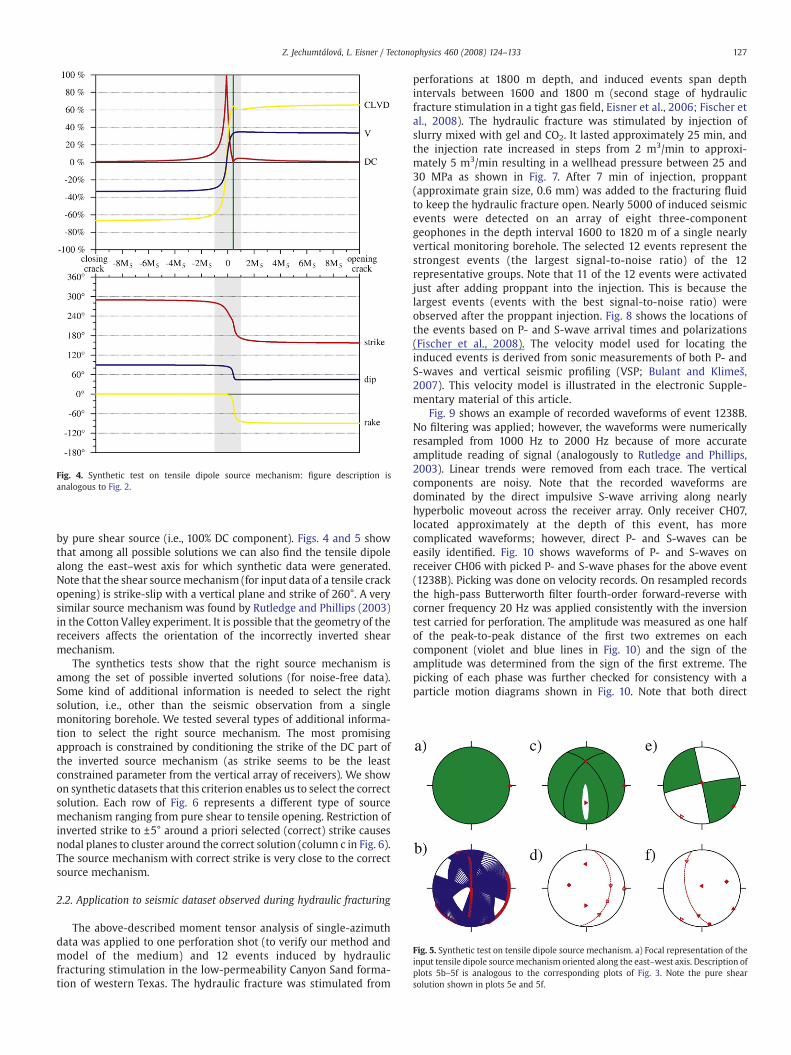
Fig. 5. Synthetic test on tensile dipole source mechanism. a) Focal representation of theinput tensile dipole sourcemechanism oriented along the east–west axis. Description ofplots 5b–5f is analogous to the corresponding plots of Fig. 3. Note the pure shearsolution shown in plots 5e and 5f.
Fig. 4. Synthetic test on tensile dipole source mechanism: figure description isanalogous to Fig. 2.
127Z. Jechumtálová, L. Eisner / Tectonophysics 460 (2008) 124–133
by pure shear source (i.e., 100% DC component). Figs. 4 and 5 showthat among all possible solutions we can also find the tensile dipolealong the east–west axis for which synthetic data were generated.Note that the shear sourcemechanism (for input data of a tensile crackopening) is strike-slip with a vertical plane and strike of 260°. A verysimilar source mechanism was found by Rutledge and Phillips (2003)in the Cotton Valley experiment. It is possible that the geometry of thereceivers affects the orientation of the incorrectly inverted shearmechanism.
The synthetics tests show that the right source mechanism isamong the set of possible inverted solutions (for noise-free data).Some kind of additional information is needed to select the rightsolution, i.e., other than the seismic observation from a singlemonitoring borehole. We tested several types of additional informa-tion to select the right source mechanism. The most promisingapproach is constrained by conditioning the strike of the DC part ofthe inverted source mechanism (as strike seems to be the leastconstrained parameter from the vertical array of receivers). We showon synthetic datasets that this criterion enables us to select the correctsolution. Each row of Fig. 6 represents a different type of sourcemechanism ranging from pure shear to tensile opening. Restriction ofinverted strike to ±5° around a priori selected (correct) strike causesnodal planes to cluster around the correct solution (column c in Fig. 6).The source mechanism with correct strike is very close to the correctsource mechanism.
2.2. Application to seismic dataset observed during hydraulic fracturing
The above-described moment tensor analysis of single-azimuthdata was applied to one perforation shot (to verify our method andmodel of the medium) and 12 events induced by hydraulicfracturing stimulation in the low-permeability Canyon Sand forma-tion of western Texas. The hydraulic fracture was stimulated from
perforations at 1800 m depth, and induced events span depthintervals between 1600 and 1800 m (second stage of hydraulicfracture stimulation in a tight gas field, Eisner et al., 2006; Fischer etal., 2008). The hydraulic fracture was stimulated by injection ofslurry mixed with gel and CO2. It lasted approximately 25 min, andthe injection rate increased in steps from 2 m3/min to approxi-mately 5 m3/min resulting in a wellhead pressure between 25 and30 MPa as shown in Fig. 7. After 7 min of injection, proppant(approximate grain size, 0.6 mm) was added to the fracturing fluidto keep the hydraulic fracture open. Nearly 5000 of induced seismicevents were detected on an array of eight three-componentgeophones in the depth interval 1600 to 1820 m of a single nearlyvertical monitoring borehole. The selected 12 events represent thestrongest events (the largest signal-to-noise ratio) of the 12representative groups. Note that 11 of the 12 events were activatedjust after adding proppant into the injection. This is because thelargest events (events with the best signal-to-noise ratio) wereobserved after the proppant injection. Fig. 8 shows the locations ofthe events based on P- and S-wave arrival times and polarizations(Fischer et al., 2008). The velocity model used for locating theinduced events is derived from sonic measurements of both P- andS-waves and vertical seismic profiling (VSP; Bulant and Klimeš,2007). This velocity model is illustrated in the electronic Supple-mentary material of this article.
Fig. 9 shows an example of recorded waveforms of event 1238B.No filtering was applied; however, the waveforms were numericallyresampled from 1000 Hz to 2000 Hz because of more accurateamplitude reading of signal (analogously to Rutledge and Phillips,2003). Linear trends were removed from each trace. The verticalcomponents are noisy. Note that the recorded waveforms aredominated by the direct impulsive S-wave arriving along nearlyhyperbolic moveout across the receiver array. Only receiver CH07,located approximately at the depth of this event, has morecomplicated waveforms; however, direct P- and S-waves can beeasily identified. Fig. 10 shows waveforms of P- and S-waves onreceiver CH06 with picked P- and S-wave phases for the above event(1238B). Picking was done on velocity records. On resampled recordsthe high-pass Butterworth filter fourth-order forward-reverse withcorner frequency 20 Hz was applied consistently with the inversiontest carried for perforation. The amplitude was measured as one halfof the peak-to-peak distance of the first two extremes on eachcomponent (violet and blue lines in Fig. 10) and the sign of theamplitude was determined from the sign of the first extreme. Thepicking of each phase was further checked for consistency with aparticle motion diagrams shown in Fig. 10. Note that both direct

Fig. 6. Synthetic test of constrained moment tensor inversion with additional information on the strike of the DC component of the full moment tensor. Each row represents onesynthetic test and each column represents results. Column a) Source model for which synthetic data were generated. Column b) All possible solutions fitting the data.Column c) Solutions corresponding to ±5° about an a priori known strike in traditional fault-plane solution and the display of the solutions following Riedesel and Jordan (1989).Column d) Solution corresponding to one with an a priori known strike in traditional fault-plane solution display.
128 Z. Jechumtálová, L. Eisner / Tectonophysics 460 (2008) 124–133
waves (P- and S-waves) have approximate duration of 0.01 s, thusthe original sampling was approximately 10 points per period. Theresampling to 2000 Hz using a finite-impulse-response (FIR) filterenabled more accurate amplitude reading. Interpolation improvedthe visual correlation by removing apparent waveform differencescaused by the relatively coarse, initial sampling rate (see alsoRutledge and Phillips, 2003; Rutledge et al., 2004). Because the datawere properly anti-alias filtered in the field, the FIR-filter interpola-tion is a band-limited signal reconstruction, with initial datasampling representing a data compression; no unsubstantiated
Fig. 7. Injection data of the experiment at Canyon Sand formation. Circles represent achronological succession of the selected 12 induced events: 1213A, 1227A, 1228A,1229A, 1229B, 1230C, 1230A, 1231A, 1233A, 1234, 1237A, 1238B.
information is added in the interpolation process. Note that theinversion for the moment tensor is linear if amplitudes of all threecomponents are used as discussed in the Methodological Section.
Fig. 8.Geometrical representation of the experiment at Canyon Sand formation. Upside-down triangles represent position of eight receivers. Circles, hypocentral locations ofthe selected 12 induced events; asterisks, the injection points.

Fig. 9.Waveform of the event 1238B recorded along a nearly linear array of receivers (CH01, top, to CH08, bottom). All traces are normalized to unit amplitude. Z is vertical (positivedown), N is north, and E is east component.
Fig. 10.Waveform of the event 1238B at receiver CH06 (see Fig. 9). The violet lines show the first extremes of the P- and S-waves. The blue line shows second extreme of theS-wave. S-wave particle motion diagrams are shown on right-hand side. The green line shows measured polarization azimuth of the P-wave.
129Z. Jechumtálová, L. Eisner / Tectonophysics 460 (2008) 124–133
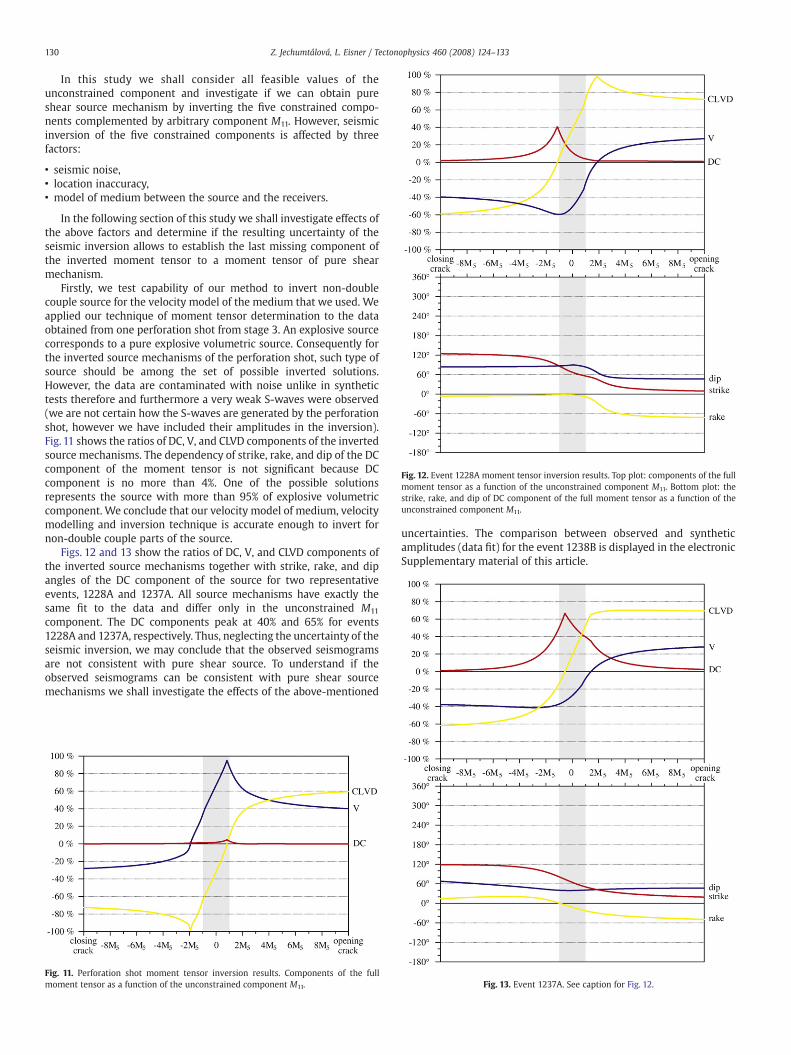
Fig. 12. Event 1228A moment tensor inversion results. Top plot: components of the fullmoment tensor as a function of the unconstrained component M11. Bottom plot: thestrike, rake, and dip of DC component of the full moment tensor as a function of theunconstrained component M11.
130 Z. Jechumtálová, L. Eisner / Tectonophysics 460 (2008) 124–133
In this study we shall consider all feasible values of theunconstrained component and investigate if we can obtain pureshear source mechanism by inverting the five constrained compo-nents complemented by arbitrary component M11. However, seismicinversion of the five constrained components is affected by threefactors:
• seismic noise,• location inaccuracy,• model of medium between the source and the receivers.
In the following section of this study we shall investigate effects ofthe above factors and determine if the resulting uncertainty of theseismic inversion allows to establish the last missing component ofthe inverted moment tensor to a moment tensor of pure shearmechanism.
Firstly, we test capability of our method to invert non-doublecouple source for the velocity model of the medium that we used. Weapplied our technique of moment tensor determination to the dataobtained from one perforation shot from stage 3. An explosive sourcecorresponds to a pure explosive volumetric source. Consequently forthe inverted source mechanisms of the perforation shot, such type ofsource should be among the set of possible inverted solutions.However, the data are contaminated with noise unlike in synthetictests therefore and furthermore a very weak S-waves were observed(we are not certain how the S-waves are generated by the perforationshot, however we have included their amplitudes in the inversion).Fig. 11 shows the ratios of DC, V, and CLVD components of the invertedsource mechanisms. The dependency of strike, rake, and dip of the DCcomponent of the moment tensor is not significant because DCcomponent is no more than 4%. One of the possible solutionsrepresents the source with more than 95% of explosive volumetriccomponent. We conclude that our velocity model of medium, velocitymodelling and inversion technique is accurate enough to invert fornon-double couple parts of the source.
Figs. 12 and 13 show the ratios of DC, V, and CLVD components ofthe inverted source mechanisms together with strike, rake, and dipangles of the DC component of the source for two representativeevents, 1228A and 1237A. All source mechanisms have exactly thesame fit to the data and differ only in the unconstrained M11
component. The DC components peak at 40% and 65% for events1228A and 1237A, respectively. Thus, neglecting the uncertainty of theseismic inversion, we may conclude that the observed seismogramsare not consistent with pure shear source. To understand if theobserved seismograms can be consistent with pure shear sourcemechanisms we shall investigate the effects of the above-mentioned
Fig. 11. Perforation shot moment tensor inversion results. Components of the fullmoment tensor as a function of the unconstrained component M11.
uncertainties. The comparison between observed and syntheticamplitudes (data fit) for the event 1238B is displayed in the electronicSupplementary material of this article.
Fig. 13. Event 1237A. See caption for Fig. 12.
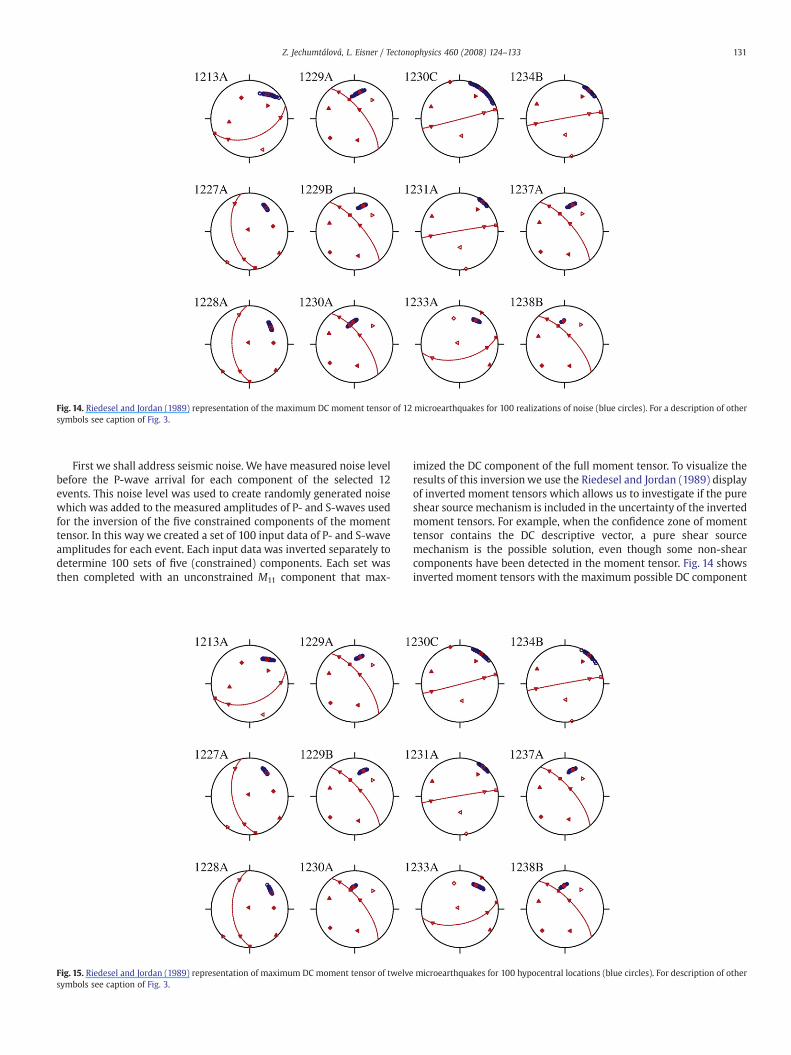
Fig. 14. Riedesel and Jordan (1989) representation of the maximum DC moment tensor of 12 microearthquakes for 100 realizations of noise (blue circles). For a description of othersymbols see caption of Fig. 3.
131Z. Jechumtálová, L. Eisner / Tectonophysics 460 (2008) 124–133
First we shall address seismic noise. We have measured noise levelbefore the P-wave arrival for each component of the selected 12events. This noise level was used to create randomly generated noisewhich was added to the measured amplitudes of P- and S-waves usedfor the inversion of the five constrained components of the momenttensor. In this way we created a set of 100 input data of P- and S-waveamplitudes for each event. Each input data was inverted separately todetermine 100 sets of five (constrained) components. Each set wasthen completed with an unconstrained M11 component that max-
Fig. 15. Riedesel and Jordan (1989) representation of maximum DC moment tensor of twelvesymbols see caption of Fig. 3.
imized the DC component of the full moment tensor. To visualize theresults of this inversionwe use the Riedesel and Jordan (1989) displayof inverted moment tensors which allows us to investigate if the pureshear source mechanism is included in the uncertainty of the invertedmoment tensors. For example, when the confidence zone of momenttensor contains the DC descriptive vector, a pure shear sourcemechanism is the possible solution, even though some non-shearcomponents have been detected in the moment tensor. Fig. 14 showsinverted moment tensors with the maximum possible DC component
microearthquakes for 100 hypocentral locations (blue circles). For description of other

132 Z. Jechumtálová, L. Eisner / Tectonophysics 460 (2008) 124–133
of 12 events together with their confidence zones. Only event 1230Amay have pure shear slip mechanism as its confidence zone contains aDC descriptive vector. Thus we can conclude that the seismic noise inthe observed seismograms does not cause inconsistency with pureshear source mechanism for 11 out of 12 induced events.
Second, we have investigated the uncertainty of the momenttensor constraint due to error in hypocenter location. Fischer et al.(2008) estimated a relative location error (with respect to the velocitymodel used) of up to 15 m (personal communication, 2007; theestimate is based on random perturbation of the phase detection).Thus we perturbed the original locations of the selected events bymoving the hypocenter randomly up to 15 m in any direction. Thiswaywe have created a set of 100 locations for each event and invertedthe observed data for each location. Thus we inverted 100 sets of 5(constrained) components for each event. Analogous to the noisesensitivity study we used an unconstrained M11 component thatmaximized the DC component of the full moment tensor. Themomenttensors are displayed in a Riedesel and Jordan (1989) representation inFig. 15. Only event 1230A can have a pure shear mechanism. However,for the other 11 events, even considering the error in the hypocenterlocation, the observed seismograms are not consistent with a pureshear source mechanism because their confidence zones do notcontain a DC descriptive vector.
Finally, we investigated the effect of the velocity model used in theinversion of the source mechanisms. We used a 1D gradient model ofthe medium (Bulant and Klimeš, 2007) optimally smoothed for raytracing from sonic logs and vertical sonic profiling (Bulant, 2002). Aswe wanted to use a correctly smoothed 1D velocity model for raytheory (Klimeš, 2002) we have restricted model testing to changes ofthe attenuation models only. Fig. 16 shows the ratios of DC, V, andCLVD components of the inverted source mechanisms of the events
Fig. 16. Moment tensor components of Event 1228A (top) and event 1237A (bottom).Components of full moment tensor as a function of the unconstrained component M11.The different colours of curves represent different attenuation models — see text.
1228A and 1237A for four different attenuation models. The fourdifferent attenuation models are the following:
• No attenuation;• Homogeneous attenuation with QP=1000 and QS=100 (Qualityfactors of P- and S-waves respectively); the value of QP=1000 isestimated from VSP measurements (Bulant and Klimeš, personalcommunication);
• Homogeneous attenuation with QP=30 and QS=60, which wasdetermined by Rutledge and Phillips (2003) in a similar geologicalformation;
• Homogeneous attenuation with QP=100 and QS=100.
The DC component of the inverted moment tensors does notexceed 75% for any attenuation model. Analogous results wereobtained for the other selected events in this study. We have notincluded the variation of the velocity structure as the inversion of theperforation shot gave us reasonable confidence in the accuracy of themedium model.
3. Discussion
We have derived a new methodology for inverting maximuminformation about source mechanisms from seismic data acquiredalong a vertical array (or line of symmetry of a medium). While theseismic data acquired in such configuration does not provide sufficientinformation to characterize a full moment tensor, i.e., general sourcemechanisms which include non-shear failure, it is possible to find outif the observed data are consistent with pure shear source mechan-isms. Furthermore, we show that if the amplitude inversion for theconstrained part of the moment tensor is linear we can easily assessuncertainty due to noise, hypocenter locations, and velocity model.
Note that seismograms observed from a seismic event with pureshear mechanism must be possible to invert to obtain pure shearmechanism. However, seismograms from a single vertical boreholedue to non-shear seismic events can be inverted as pure shear sourcemechanism as shown in Figs. 3 and 4. In this study we have appliedthis newly developed technique to a dataset acquired in a single nearlyvertical monitoring well. Surprisingly, the observed seismograms ofonly one of the studied events (1230A) were consistent with pureshear source mechanism. Because the back azimuths of the selectedevents do not significantly differ from each other the orientation of theunconstrained component M11 is nearly the same. Therefore thepossibility of shear mechanism for event 1230A is not caused by thegeometry of the source–receiver configuration, but rather this eventseems to have a different source mechanism from the other events.
We have verified that the requirement of non-shear mechanism isnot an artefact of noise in the data, location uncertainty, or theattenuationmodel. Ideally, we should combine all effects together andtest for robustness of the inversion, combining, for example, effects ofhypocenter uncertainty and noise. However, such inversion becomescomputationally too expensive. Furthermore, the individual testsseem to consistently show that pure shear source mechanism liesoutside the range of uncertainty of the inverted moment tensorsindicating that even a combination of errors would not make the dataconsistent with pure shear failure. Perhaps the most questionablefactor is the effect of the medium model which may introduce asystematic bias into the moment tensor inversion. To test for a largenumber of velocity models is again very difficult, but we have testedsensitivity to various attenuation models, which usually significantlyaffect moment tensor inversion, and have found our observation ofnon-shear source mechanisms robust. Thus we can conclude thatmajority of the observed seismic events have non-shear mechanisms.
While we are not able to determine the exact source mechanism ofthe induced seismic events, the indication of non-shear mechanismsseems to overturn the previously widely accepted view that micro-seismic events induced by hydraulic fracturing are caused by shear
133Z. Jechumtálová, L. Eisner / Tectonophysics 460 (2008) 124–133
failure along pre-existing natural fractures in the vicinity of thehydraulic fracture (Pearson, 1981; Warpinski, 1997; Phillips et al.,1998; Rutledge and Phillips, 2003). Whether this observation is validonly for this dataset, or only for sedimentary formations, we do notwish to generalize based on this dataset, but we believe this is animportant observation which may allow better understanding offracture propagation. The non-shear mechanisms would imply thatthe microseismic events are part of the hydraulic fracture.
4. Conclusions
While a vertical array of receivers in a 1D isotropic medium doesnot allow a full moment tensor inversion (i.e. all six components), wecan determine five components of the moment tensor in a speciallyorientated coordinate system. Then the full moment tensor for eachevent can be obtained by adding an arbitrary value of for the sixthcomponent, resulting in a set of equally possible source mechanisms.Wemay test if a class of a sourcemechanism is consistent with the fiveconstrained components of the moment tensor, i.e., if such sourcemechanism is part of a set of possible source mechanisms. Inparticular, we have shown in synthetic test that crack openingobserved in a vertical borehole can be fitted with pure shearmechanism. This implies that the best fitted pure shear sourcemechanism does not provide any information about the sourcemechanism if the source mechanism is not shear.
The technique of inverting only constrained components of themoment tensor was applied to a dataset of seismic events induced byhydraulic fracturing of sedimentary rocks. We have found that nearlyall of the representative events have significant non-shear compo-nents, and their source mechanisms are not consistent with pureshear failure as previously thought. This conclusion is robust withrespect to noise in the data, hypocentral location.
Acknowledgements
This study was supported by the EU Project IMAGES “Inducedmicroseismics applications from global earthquake studies”, ContractNo.MTKI-CT-2004-517242, by the Czech Academy of Sciences GrantAgency, Projects No. KJB300120504 and No. IAA300120502.Wewouldlike to cordially thank Joel Le Calvez, the scientists of the IMAGESproject, in particular to Petr Bulant and Luděk Klimeš for their helpwith building of the velocity model, Alena Boušková for pickingamplitudes and selecting events, Tomáš Fischer for locating events,and Jan Šílený for general guidance. We are grateful to DominionExploration Company for releasing the dataset for this study.
Appendix A. Supplementary data
Supplementary data associated with this article can be found, inthe online version, at doi:10.1016/j.tecto.2008.07.011.
References
Bulant, P., 2002. Sobolev scalar products in the construction of velocity models:application to model Hess and to SEG/EAGE Salt Model. Pure Appl. Geophys. 159,1487–1506.
Bulant, P., Klimeš, L., 2007. Comparison of VSP and sonic log data in non-vertical wells ina heterogeneous structure. Seismic Waves in Complex 3-D Structures, Report 17,Dep. Geophys. Charles Univ., Prague.
Dahm, T., Manthei, G., Eisenblätter, J., 1999. Automated moment tensor inversion toestimate source mechanisms of hydraulically induced micro-seismicity in salt rock.Tectonophysics 306, 1–17.
Eisner, L., Fischer, T., Le Calvez, J.H., 2006. Detection of repeated hydraulic fracturing(out-of-zone growth) by microseismic monitoring. Leading Edge 25 (5), 548–555.
Fehler, M.C., 1989. Stress control of seismicity patterns observed during hydraulicfracturing experiments at the Fenton hill hot dry rock geothermal energy site, NewMexico. Int. J. Rock Mech. Min. Sci. Geomech. Abstr. 26, 211–219.
Fischer, T., Hainzl, S., Eisner, L., Shapiro, S., Le Calvez, J.H., 2008. Microseismic signaturesof hydraulic fracture growth in sediment formations: observations and modeling. J.Geophys. Res. 113, B02307.
Foulger, G.R., Julian, B.R., Hill, D.P., Pitt, A.M., Malin, P.E., Shalev, E., 2004. Non-double-couple microearthquakes at Long Valley caldera, California, provide evidence forhydraulic fracturing. J. Volcanol. Geotherm. Res. 132, 45–71.
Gajewski, D., Pšenčík, I., 1989. Ray synthetic seismograms in 3-D laterally inhomoge-neous anisotropic structures — Program ANRAY89. Internal Report Centre forComputational Seismology, LBL, Berkeley.
Jechumtálová, Z., Šílený, J., 2001. Point-source parameters from noisy waveforms: errorestimate by Monte Carlo simulation. Pure Appl. Geophys. 158, 1639–1654.
Jechumtálová, Z., Šílený, J., 2005. Amplitude ratios for complete moment tensorretrieval. Geophys. Res. Lett. 32, L22303.
Klimeš, L., 2002. Lyapunov exponents for 2-D ray tracing without interfaces. Pure Appl.Geophys. 159, 1465–1485.
Nolen-Hoeksema, R.C., Ruff, L.J., 2001. Moment tensor inversion of microseims from theB-sand propped hydrofracture, M-site, Colorado. Tectonophysics 336, 163–181.
Pearson, C.,1981. The relationship betweenmicroseismicity andhighpore pressures duringhydraulic stimulations experiments in low permeability granitic rocks. J. Geophys. Res.86 (B9), 7855–7864.
Phillips, W.S., Fairbanks, T.D., Rutledge, J.T., Anderson, D.W., 1998. Induced micro-earthquake patterns and oil-producing fracture systems in Austin chalk. Tectono-physics 289, 153–169.
Riedesel, M.A., Jordan, T.H., 1989. Display and assessment of seismic moment tensors.Bull. Seismol. Soc. Am. 79, 85–100.
Rutledge, J.T., Phillips, W.S., 2003. Hydraulic stimulation of natural fractures as revealedby induced microearthquakes, Carthage Cotton Valley gas field, east Texas.Geophysics 68, 441–452.
Rutledge, J.T., Phillips, W.S., Mayerhofer, M.J., 2004. Faulting induced by forced injectionand fluid flow forced by faulting: an interpretation of hydraulic-fracture micro-seismicity, Carthage Cotton Valley gas field:. Bull. Seismol. Soc. Am. 94, 1817–1830.
Snoke, J.A., Munsey, J.W., Eague, A.G., Bollinger, G.A., 1984. A program for focalmechanism determination by combined use of polarity and SV-P amplitude ratiodata. Earthq. Notes 55, 15.
Šílený, J., Panza, G.F., Campus, P.,1992.Waveform inversion for point sourcemoment tensorretrieval with variable hypocentral depth and structural model. Geophys. J.Int. 109,259–274.
Vavryčuk, V., 2001. Inversion for parameters of tensile earthquakes. J. Geophys. Res. 106(B8), 16339–16355.
Vavryčuk, V., 2007. On the retrieval of moment tensors from borehole data. Geophys.Prospect. 55 (3), 381–391.
Warpinski, 1997. Microseismic and deformation imaging of hydraulic fracture growthand geometry in the C sand interval, GRI/DOEM-Site Project. Proceedings 1997 Soc.Petro. Eng. Ann. Tech. Conf., San Antonio, Texas. Paper 38573.