Characteristics of seismic waves composing Hawaiian volcanic tremor and gas-piston events observed...
11
JOURNAL OF GEOPHYSICAL RESEARCH, VOL. 96, NO. B4, PAGES 6199-6209, APRIL 10, 1991 CHARACTERISTICS OF SEISMIC WAVES COMPOSING HAWAIIAN VOLCANIC TREMOR AND GAS-PISTON EVENTS OBSERVED BY A NEAR-SOURCE ARRAY Valerie Ferrazzini and Keiiti Aki Department of Geological Sciences, Universityof SouthernCalifornia, Los Angeles Bernard Chouet U.S. Geological Survey, Menlo Park, California Abstract. A correlation method, specifically designed for describingthe characteristics of a complex wave field, is appliedto volcanic tremor and gas-piston events recorded by a semicircular array of GEOS instruments set at the foot of the Puu Oo crater on the east rift of Kilauea volcano, Hawaii. The spatial patterns of corre- lation coefficients obtained as functions of frequency for the three components of motion over the entire array are similarfor gas-piston events and tremor, and clearly de- pict dispersive waves propagating across the array from the direction of Puu Oo. The wavefields are composed of comparable amounts of Rayleigh and Lovewaves propa- gating with similar and extremely slowphase velocities ranging from 700 m/s at 2 Hz to 300 m/s at 8 Hz. The highly cracked solidified lavaflow on whichthe array was deployed, and subjacent structure of alternating lava and ash layers formed during repeatederuptions of Puu Oo since 1983, appear to be responsible for the low veloci- ties observed. The results from Puu Oo stand in sharp contrast to those obtained in an experiment conducted in 1976 on the partially solidified lava lake of Kilauea Iki. Rayleigh waveswere not observed in Kilauea Iki, but well-developed trains of Love waves were seen to propagate there with velocitiestwice as high as those observed near Puu Oo. Thesedifferences in the propaga- tion characteristicsof surface waves at the two sites may be attributed to the presence of a soft horizontal layer of molten rock in Kilauea Iki, which may have loweredthe phasevelocityof Rayleighwaves more drasticallythan that of Love waves, resultingin severe scatteringof the Rayleigh wave mode. On the other hand, the thin super- ficial pahoehoe flow under our array at Puu Oo may have favored the developmentof vertical columnarjoints more extensively at this location than at Kilauea Iki, which may havereduced the shear moduli controlling the Love wave mode. The average phase velocities in the frequency bandfrom 2 to 5 Hz foundat Puu Oo are roughly similar to thosedetermined for tremor at Klyuchevskoy volcano, Kamchatka, but the frequency dependence appears much stronger at Puu Oo. Introduction Volcanic tremor has been a difficult subject of study for seismologists for many reasons. For example,in some Copyright 1991by the American Geophysical Union. Paper number 90JB02781. 0148-0227/91/90J B-02781 $05.00 casessustained tremor may persist over many months •vith only small variations in amplitude and without no- ticeable changes in frequencies, while in other casesit may last only a few minutes and show erratic spectral variations. The first arrivals of tremoraregenerally emer- gent and the distinct phases that are commonly identified in earthquakes cannot be recognized. Records obtained at two locations rapidly losecoherency with increasing station separation. Thus the traditional methodsof seis- mology generallycannot be applied to volcanictremor and most tremor studies have been restricted to spec- tral analyses. Volcanic tremor is usually characterized by a sharply peaked spectrum with one dominant and several subdominant peaks. The complexity of tremor spectra has led seismologists to polarized views on the origin of the spectral peaks. Some investigators attribute thesepeaksto wavepropagation effects in complex geo- logical structures [Omer,1950; Minakami,1974;Gordeev et al., 1990], while othersfavor an interpretation based on source processes [Sassa, 1935; Kubotera, 1974; Aki and Koyanagi,1981; Chouet, 1988, 1990]. Our observa- tions at the Puu Oo crater on the east rift of Kilauea volcano, Hawaii, suggest that shallow tremor at this site is generated by a volume source involving complex solid, fluid, and gasmotions in an extremely heterogeneous and anisotropic medium [Dietel et al., 1989; Ferrazziniand Aki, 1990]. Because of this complexitythe basic sepa- rability of source, propagation, and recordir•g site effects that hasbeenso useful in earthquake seismology may not apply to the interpretation of tremor. Due to the lack of adequate data, little is known about the fundamental properties of volcanictremor suchas its wave type, polarization, and phase velocity. Sassa [1935] made a first attempt in that direction.He distinguished four kinds of tremor at Aso volcano, Japan, which he in- terpretedas due to Loveor Rayleigh waves, or a mixture of both types of waves, basedon the dominantfrequen- cies and particle motions he observed. From the phase arrival times measured at two stations located at dis- ta.nces of 1 and 7 km from the central vent of Aso, Sassa estimated the local phase velocity to be 1.25 and 0.98 km/s for P and S waves, respectively, and 0.9 km/s for Rayleigh waveswith dominant periodsbetween3 and 7 s. In a more recent analysis of particle motion conducted on tremor from Pavlov volcano, Alaska,McNutt [1986] also concluded that tremor at this volcano is dominated by surfacewaves. However, his data did not allow an estimation of the phase velocity. Gordeev et al. [1990] made a detailed study of the spario-temporal character- istics of volcanictremor at Klyuchevskoy volcano,Kam- chatka,usinga linear array of 10 stations spaced 0.2 to 1 km apart, and located at a distance of 12 km from 6199
Transcript of Characteristics of seismic waves composing Hawaiian volcanic tremor and gas-piston events observed...

JOURNAL OF GEOPHYSICAL RESEARCH, VOL. 96, NO. B4, PAGES 6199-6209, APRIL 10, 1991
CHARACTERISTICS OF SEISMIC WAVES COMPOSING HAWAIIAN VOLCANIC TREMOR
AND GAS-PISTON EVENTS OBSERVED BY A NEAR-SOURCE ARRAY
Valerie Ferrazzini and Keiiti Aki
Department of Geological Sciences, University of Southern California, Los Angeles
Bernard Chouet
U.S. Geological Survey, Menlo Park, California
Abstract. A correlation method, specifically designed for describing the characteristics of a complex wave field, is applied to volcanic tremor and gas-piston events recorded by a semicircular array of GEOS instruments set at the foot of the Puu Oo crater on the east rift of
Kilauea volcano, Hawaii. The spatial patterns of corre- lation coefficients obtained as functions of frequency for the three components of motion over the entire array are similar for gas-piston events and tremor, and clearly de- pict dispersive waves propagating across the array from the direction of Puu Oo. The wave fields are composed of comparable amounts of Rayleigh and Love waves propa- gating with similar and extremely slow phase velocities ranging from 700 m/s at 2 Hz to 300 m/s at 8 Hz. The highly cracked solidified lava flow on which the array was deployed, and subjacent structure of alternating lava and ash layers formed during repeated eruptions of Puu Oo since 1983, appear to be responsible for the low veloci- ties observed. The results from Puu Oo stand in sharp contrast to those obtained in an experiment conducted in 1976 on the partially solidified lava lake of Kilauea Iki. Rayleigh waves were not observed in Kilauea Iki, but well-developed trains of Love waves were seen to propagate there with velocities twice as high as those observed near Puu Oo. These differences in the propaga- tion characteristics of surface waves at the two sites may be attributed to the presence of a soft horizontal layer of molten rock in Kilauea Iki, which may have lowered the phase velocity of Rayleigh waves more drastically than that of Love waves, resulting in severe scattering of the Rayleigh wave mode. On the other hand, the thin super- ficial pahoehoe flow under our array at Puu Oo may have favored the development of vertical columnar joints more extensively at this location than at Kilauea Iki, which may have reduced the shear moduli controlling the Love wave mode. The average phase velocities in the frequency band from 2 to 5 Hz found at Puu Oo are roughly similar to those determined for tremor at Klyuchevskoy volcano, Kamchatka, but the frequency dependence appears much stronger at Puu Oo.
Introduction
Volcanic tremor has been a difficult subject of study for seismologists for many reasons. For example, in some
Copyright 1991 by the American Geophysical Union.
Paper number 90JB02781. 0148-0227/91/90J B-02781 $05.00
cases sustained tremor may persist over many months •vith only small variations in amplitude and without no- ticeable changes in frequencies, while in other cases it may last only a few minutes and show erratic spectral variations. The first arrivals of tremor are generally emer- gent and the distinct phases that are commonly identified in earthquakes cannot be recognized. Records obtained at two locations rapidly lose coherency with increasing station separation. Thus the traditional methods of seis- mology generally cannot be applied to volcanic tremor and most tremor studies have been restricted to spec- tral analyses. Volcanic tremor is usually characterized by a sharply peaked spectrum with one dominant and several subdominant peaks. The complexity of tremor spectra has led seismologists to polarized views on the origin of the spectral peaks. Some investigators attribute these peaks to wave propagation effects in complex geo- logical structures [Omer, 1950; Minakami, 1974; Gordeev et al., 1990], while others favor an interpretation based on source processes [Sassa, 1935; Kubotera, 1974; Aki and Koyanagi, 1981; Chouet, 1988, 1990]. Our observa- tions at the Puu Oo crater on the east rift of Kilauea
volcano, Hawaii, suggest that shallow tremor at this site is generated by a volume source involving complex solid, fluid, and gas motions in an extremely heterogeneous and anisotropic medium [Dietel et al., 1989; Ferrazzini and Aki, 1990]. Because of this complexity the basic sepa- rability of source, propagation, and recordir•g site effects that has been so useful in earthquake seismology may not apply to the interpretation of tremor.
Due to the lack of adequate data, little is known about the fundamental properties of volcanic tremor such as its wave type, polarization, and phase velocity. Sassa [1935] made a first attempt in that direction. He distinguished four kinds of tremor at Aso volcano, Japan, which he in- terpreted as due to Love or Rayleigh waves, or a mixture of both types of waves, based on the dominant frequen- cies and particle motions he observed. From the phase arrival times measured at two stations located at dis-
ta.nces of 1 and 7 km from the central vent of Aso, Sassa estimated the local phase velocity to be 1.25 and 0.98 km/s for P and S waves, respectively, and 0.9 km/s for Rayleigh waves with dominant periods between 3 and 7 s. In a more recent analysis of particle motion conducted on tremor from Pavlov volcano, Alaska, McNutt [1986] also concluded that tremor at this volcano is dominated
by surface waves. However, his data did not allow an estimation of the phase velocity. Gordeev et al. [1990] made a detailed study of the spario-temporal character- istics of volcanic tremor at Klyuchevskoy volcano, Kam- chatka, using a linear array of 10 stations spaced 0.2 to 1 km apart, and located at a distance of 12 km from
6199

6200 Ferrazzini et al.' Seismic Waves Composing Hawaiian Volcanic Tremor
the crater. They again found surface waves as the main component of the wave field of tremor and were able to es- timate the dispersion characteristics of these waves. The phase velocities in the frequency range between I and 5 Hz show strong dispersion on the vertical and radial com- ponents of motion, varying from 0.825 km/s at I Hz to 0.675 km/s at 5 Hz. The phase velocity estimated from the tangential component is 0.9 km/s at I Hz.
The continuing activity of Kilauea volcano since 1983 provided a unique opportunity to carry out detailed seis- mic experiments at the Puu Oo crater on the east rift of the volcano. This crater became the focus of fountaining and degassing activities following the fissure eruption of January 1983. Successive episodes of fountaining grad- ually built a spatter cone which, at its present height of 230 m above the surrounding lava fields, represents the tallest feature on the east rift. Volcanic tremor has
been observed at Puu Oo practically continuously since 1983, providing an ideal situation for data acquisition. In January-February 1988 we deployed two dense, short- aperture, arrays of short-period instruments at the foot of Puu Oo to analyze the properties of tremor and gas- piston events originating within this crater. Our first objective was to quantify the properties of the observed xvave fields using a method designed by Aki [1957, 1965] specifically for the analysis of stationary stochastic waves and which has been applied to the volcanic tremor on Mt. Aso by Wada and Oho [1965]. Our second goal was to de- terlnine the spatial extent of the Puu Oo sources through detailed frequency - wave number spectrum analyses of the array data [Capon, 1969]. The results from this lat- ter study will be presented in a separate paper. Here we focus on the first approach, which is based on measure- lnents of the spatial correlation functions of a wave field,
•1 bll•b tt• t •t p• w•ves 11U
constitute the field, along with their polarizations and phase velocities. In the following, we first describe our data and review the correlation method. We then apply this 1nethod to determine the wave types, polarizations, and phase velocities of the waves constituting the tremor and gas-piston events at Puu Oo. Finally, we invert the phase velocity results to obtain a model for the P - and S - wave velocity structures under the array.
Data
The purpose of the Puu Oo experiments was to record details of the tremor wave field as a function of space and time. To carry out this objective, we used 12 General Earthquake Observation System (GEOS) digital seismo- graphs [Borcherdt et al., 1985], each consisting of a six- channel, 16-bit recorder attached to three-component or vertical-component velocity sensors. Mark Products L- 22-3D geophones with a natural frequency of 2 Hz and sensitivity of 0.5 V/cm/s were selected to record three- component data, and Mark Products L-4A geophones with a natural frequency of 2 Hz and sensitivity of 1 V/cm/s were used to record vertical-component data. All GEOS recorded data at 200 samples/s/channel and op- erated with a common time base, achieving an accuracy of I ms among all channels. Details of the field set up, instrumentation, timing scheme, and data format can be found in the work by Dietel et al. [1989].
We first set up the array of geophones in the configu-
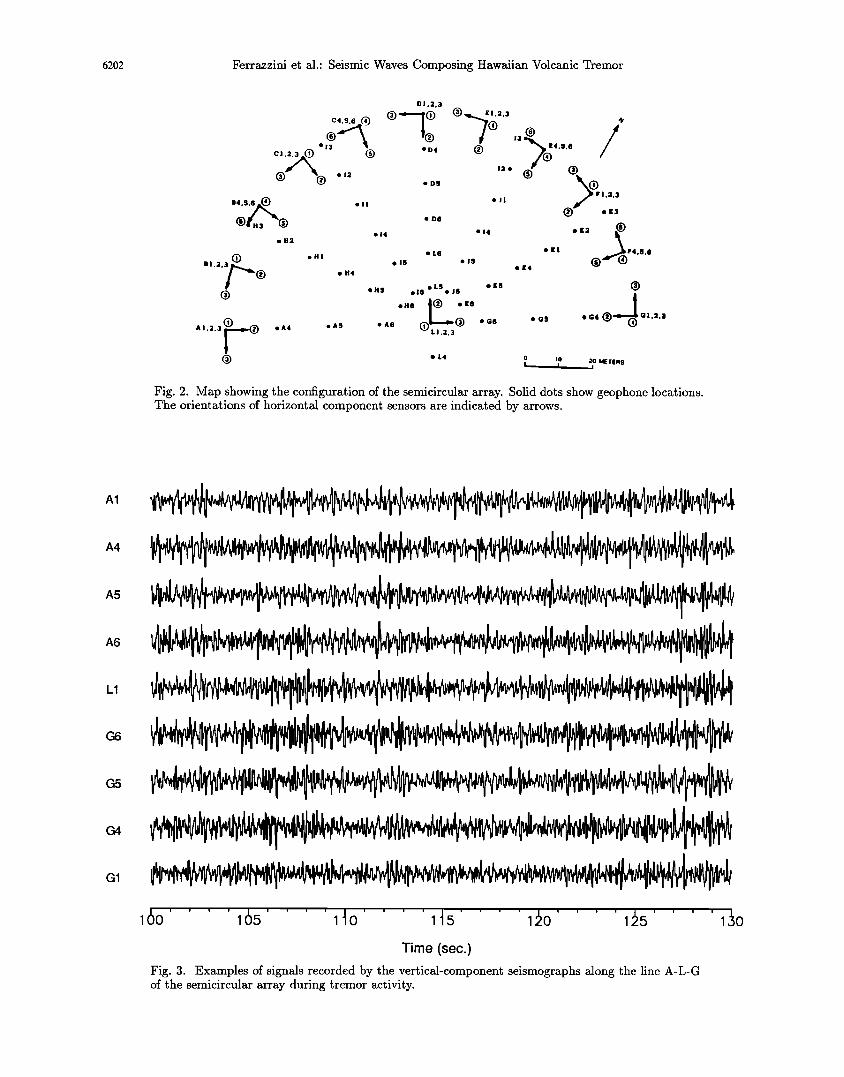
ration labelled array 1 in Figure 1. The site selected •for deployment consisted of a fiat expanse of densely cracked ponded lava flow eraplaced in 1986 during episode 35 of the Puu Oo eruption, and covering an area of approxi- mately 0.5 km 2 northwest of Puu Oo. Spacing between individual components of the array ranged from 25 to 150 m (Figure 1). This array was operated only from January 18 through 27, 1988, because we soon realized that signal coherency was very poor at the station spacing of 100 m. This lack of coherency led us to reduce the array aper- ture to 120 m and use a semicircular configuration specif- ically designed for the application of a statistical analysis method developed by Aki [1957, 1958, 1959]. This set up is shown as array 2 in Figures I and 2. The array is com- posed of a three-component geophone set at the center of the semicircle, 11 three-component geophones placed on the circumference, and 36 vertical-component geophones distributed on seven radial lines. The spacing of 10 m between the vertical-component sensors represents a dis- tance for which good coherence between pairs of signals was consistently observed. The array radius of 60 m was selected so as to sample roughly a half wavelength of Love xvave at a frequency of 5 Hz, assuming propagation char- acteristics similar to those observed in Kilauea Iki [Aki et al., !978].
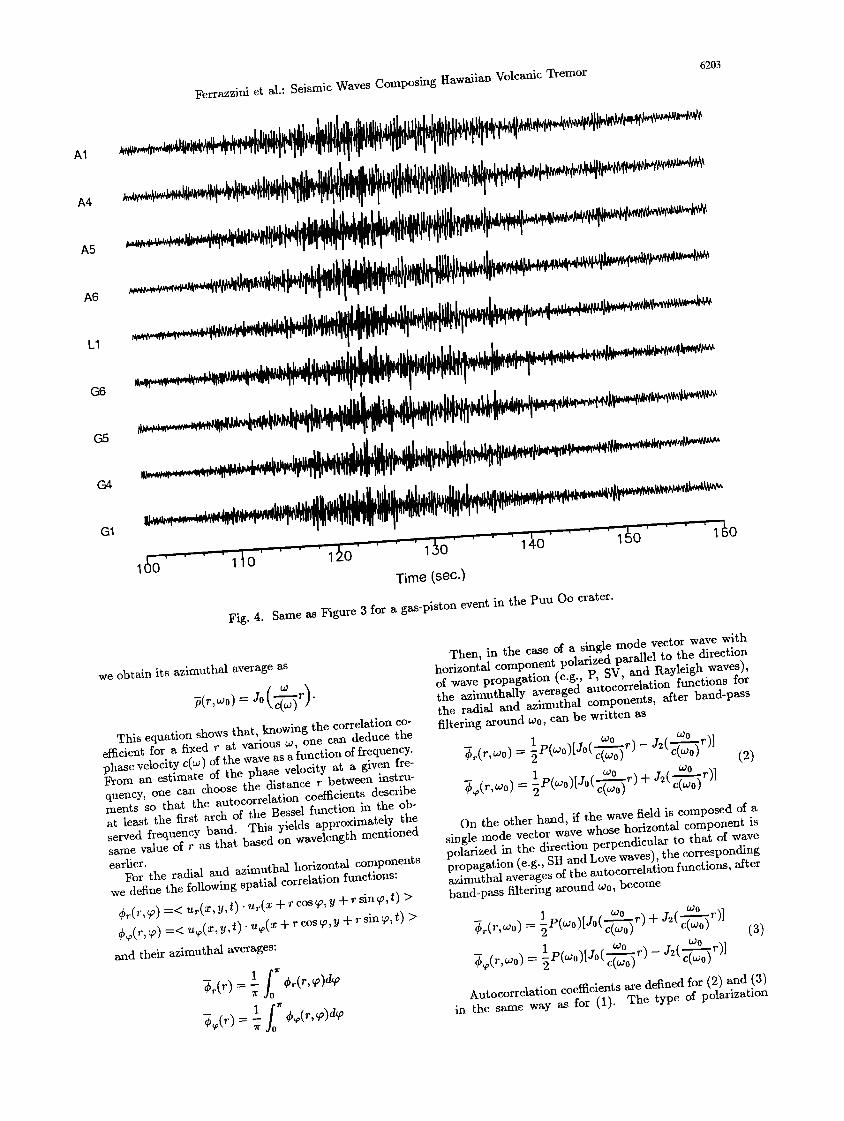
Array 2 was set up at a distance of 0.9 km from the crater of Puu Oo and remained in operation from Jan- uary 30 through February 20, 1988. During this time it recorded various kinds of seismic activities ranging from sustained tremor to a more episodic signal called gas- piston by Swanson et al. [1979]. Figures 3 and 4 show typical examples of the seismograms of tremor and of a gas-piston event, both recorded on February 4, 1988.
Gas-piston events occur repeatedly at nearly regular intervals of about 10 to 20 rain over a period of several hours and have a unique seismic signature with a spindle- shaped amplitude envelope with a duration of about 80 s. Visual observations of gas-piston events from the crater rim confirmed that they are related to degassing and drainback of lava in volcanic conduits beneath the Puu
Oo crater floor. Between two gas-piston events a shallow lava pond is formed in the crater, presumably pushed by the accumulation of gases in the underlying conduit. The onset of a gas-piston event is signalled by the appearence of small isolated gas bubbles bursting at the surface of the pond. Increasing amplitudes of the seismic signal corre- spond to an accelerating rate of degassing manifested by bubble bursts increasing in size and number. The peak seismic amplitude corresponds to the paroxysmal phase of the degassing, which completes the release of gases, immediately follo•ved by the rapid drainback of the lava pond into the conduits beneath the crater. A detailed description of the complete cycle of a gas-piston event is given by Dietel et al. [1989].
During the period when the GEOS array was in oper- ation, we also operated an array of six broadband, three- component, digital instruments that had a nearly fiat re- sponse in the range of 0.1 to 40 Hz [Ferrazzini and Aki, 1990]. This array covered the area of Kilauea extending from the summit and south flank to the east rift zone
down to Puu Oo, where one of the instruments (located at the site marked as P UO in Figure 1) allowed us to ver- ify that the actual range of frequencies of the gas-piston events and tremor energy did not extend below 2 Hz.

Ferrazzini et al.' Seismic Waves Composing Hawaiian Volcanic Tremor 6201
155'20' 1551'10' i i i i
ARRAY !
/x MoA /•YNG
/•MOB
Hvoj•=•KILAUEA CALDERA ' PU U O O ARRAYS AND f
• o • ./ •__c • • . •
o•*•. • • •' • • ,•zo•
JAN I ERUPTION
&l
&4
•,,•.•00 METERS
i
Pu'u Kamoamoa
EP, œE'•; ;RU.T,O.F; ' 11.2.3 J
o lo KM
Pu'u O'o Crater
Fig. 1. Map of the Puu Oo site showing the configuration of the two GEOS arrays.
Method of Analysis
We now give a brief review of the method used to de- termine the characteristics of the wave fields of the tremor
and gas-piston events. In our method we look for a re- lation between the spectrum in time and the spectrum in space, assuming that the waves are stationary in both domains. Under this assumption we define a spatial cor- relation function for a distance r:
½(•, •) =< •(•, y, t). •(x + • •os•, y + • si• •, t) >,
where < > represent the averaging over time and take the azimuthal average of this function:
/0 _ • •(•, •)•.
Aki [1957] demonstrated that in the case of single- mode scal• wave with phase velocity c(•), the az- imuthally averaged autocorrelation function •(r) of the
wave field is related to the temporal power spectrum by
- 1 ½'½:)J0 •: r • where J0 is the Bessel function of zeroth order. Filtering the wave through a narrow-band filter around the fre- quency •0 allows us •o express the spectrum density of the filtered wave •
•(•) = P(•0)•(• - •0), • > 0, in which P(w0) is the spectral power density at the fre- quency w0 and ¾w) is the Dirac delta function. This yields the following form of the spatial autocorrelation function:
Then, defining the autocorrelation coefficient as
½(•,E•0) p(•, •, •0 ) - ½(0, •, •0 ) '
6202 Ferrazzini et al.: Seismic Waves Composing Hawaiian Volcanic Tremor
DI.2,3
• .,2 eD5 I .•.3
ß II ß il • ß K3 ß 14 ß J4 ß
.,2 ß HI ß L6 ß [i F4,B.6 ß 15 ß
oK4
B4.5.6
""='31• © ©
oH4
•,.2.3 •,.© ©
oA4 ß AS ß A6
eLS ß 16 ß
ß He 1(•) ß re L! .2,3
ß L4 0 L I•) 20 METERS
Fig. 2. Map showing the configuration of the semicircular array. Solid dots show geophone locations. The orientations of horizontal component sensors are indicated by arrows.
A1
A4
A5
A6
L1
G6
G5
G1
160 .... 1•5 .... 140 .... 145 .... 1•0 .... 1•5 .... 1•0
Time (sec.)
Fig. 3. Examples of signals recorded by the vertical-component seismographs along the line A-L-G of the semicircular array during tremor activity.
^5
^6
L1
G6
G5
Ferrazzini et al.' Seismic Waves Composing Hawaiian Volcanic Tremor 6203
0
Time (sec.)
Fig. 4. Same as Figure 3 for a gas-piston event in the Puu Oo crater.
we obtain its azimuthal average as
•(•, •0) = J0 • '
This equation shows that, knowing the correlation co- one can deduce the efficient for a fixed r at various co, phase velocity c(co) of the wave as a function of frequency. From an estimate of the phase velocity at a given fre- quency, one can choose the distance r between instru- ments so that the autocorrelation coefficients describe at least the first arch of the Bessel function in the ob- served frequency band. This yields approximately the same value of r as that based on wavelength mentioned
earlier. For the radial and azimuthal horizontal components we define the following spatial correlation functions: •(•, •) =< •(x, •,•). •(x + • •os•, • + • •i•,•) > •(•, •) =< •(x, •,t)- •(x + • •o•,• + • si•,t) > and their azimuthal averages:
•(•) = =
Then, in the case of a single mode vector wave with horizontal component polarized parallel to the direction of wave propagation (e.g., P, SV, and Rayleigh waves), the azimuthally averaged autocorrelation functions for the radial and azimuthal components, after band-pass filtering around coo, can be written as
1 coo c••0) •(•, •ø) = 5 •(•0)[J0(•-T•0) •) - J•( •)l (2)
On the other h•d, if the wave field is composed of a single mode vector wave whose horizontM component is polarized in the direction perpendicular to that of wave propagation (e.g., SH and Love waves), the corresponding azimuthal averages of the autocorrelation functions, •ter band-pass filtering around •0, become
_ •o •)+ j•( •o
1 c•r) A•tocorrd•tion •oemci•nt• •r• defined for (2) and (3) in the same way as for (1). The type of polarization

6204 Ferrazzini et al.: Seismic Waves Composing Hawaiian Volcanic Tremor
of a complex wave field can thus be identified by mea- suring these autocorrelation functions. When the wave field is composed of two or more coexisting modes, the correlation functions are represented by the sum of the individual contributions under the assumption that these contributions are statistically independent.
Aki [1957] applied this method successfully to back- ground seismic noise generated by traffic in Tokyo. Fig- ure 5 compares the theoretical and observed correlation
0.75 Jo(2:) q- J2(2:) Jo(2:)-
0.25
Fig. 5. Azimuthal and radial correlation coefficients p•(r, coo) and pr(r, co0) (see equation (3)) for r - 25 m obtained by Aki [1957] for the background seismic noise at Tokyo University (top), compared with the theoretical curves of (3) (bottom).
functions, which allowed him to identify the predomi- nant wave in the horizontal component of seismic noise as a Love wave. From the deduced phase velocity c(co), Aki was able to determine the shear-wave velocity dis- tribution with depth under the experiment site. More recently, Okada et al. [1987] applied the same method to microseisms in the frequency range from 0.2 to 1 Hz recorded by an array of a few kilometers in aperture to determine the shear-wave velocity distribution as a func- tion of depth.
Data Analysis
We analyzed the records obtained from 2200 to 2240 (GMT) on February 4. This time window includes both tremor and gas-piston events, and is representative of the seismic activity at Puu Oo during February 1988. The length of signal used for analysis was 180 s for tremor and 60 s for a gas-piston event. Several window lengths were tested, and we found that the correlation coefHcients as a function of frequency became stable when the signal duration exceeded 10 s. To compute the correlation coef- ficients, we first band-pass filtered all the signals around a given frequency COo. The band-pass filtering was done by (1) computing the discrete Fourier transform of the time domain signal, (2) windowing the amplitude spec- trum with a boxcar having a bandwidth of 0.5 Hz, and (3) computing the inverse discrete Fourier transform. We then computed the correlation coefHcients for pairs of fil- tered signals obtained from a station located on the semi- circle and the station located at the center of the semi-
circle. The correlation coefficients were computed sepa- rately for the vertical components, the radial horizontal
v R T
Fig. 6. Contour maps of the correlation coefHcients p(r, •,co0) between the geophones located on the semicircle with radius 60 m and the geophone located at the center of the semicircular array, obtained as functions of the band-pass filter frequency and azimuth. The three figures correspond, from left to right, to the vertical, radial and transverse components of motion. The frequency axis is taken along the radius of the circle, with the origin at the center and outermost circle corresponding to 8 Hz. The correlation coefHcients are computed from a tremor record of 180-s duration. The lower half of the plots is obtained from the upper half by symmetry.

Ferrazzini et al.: Seismic Waves Composing Hawaiian Volcanic Tremor 6205
V R T
Fig. 7. Same as Figure 6 for a gas-piston event of 60-s duration.
O-
Verticol Components a
Frequency (Hz)
component (measured from the center station), and the transverse horizontal component. The correlation func- tions given in equations (1), (2) and (3) were then formed by averaging the results over the stations located on the semicircle. The method and algorithm were successfully tested on synthetic data corresponding to plane stochas- tic waves generated by random numbers.
The correlation coefficients p(r, •0,w0) for the semicir- cle with radius 60 m are shown as functions of azimuth
and frequency in Figure 6 for tremor, and in Figure 7 for the gas-piston event. In all cases the correlation drops most rapidly with increasing frequency along the east- west direction, indicating that the wave fronts are ori- ented predominantly north-south, corresponding to ar- rivals from the direction of Puu Oo. At first, we were surprised by the similarity of the correlation functions for different components because Aki's results obtained by the same method showed marked differences among them (see Figure 5). This similarity between components will be explained below.
The similarity between tremor and gas-piston events confirms a previous interpretation made by Ferrazzini and Aki [1990] that tremor and gas-piston events share the same source. As gas-piston events are generated by the rise and burst of gas slugs in the crater of Puu Oo, it is natural to think of the tremor as representing a con- tinuous mode of degassing activity of lesser intensity.
To determine the phase velocities of the observed waves using (1), (2), and (3), we computed the azimuthal average of the correlation coefficients p(r, •0,w0) for each component of motion. Figure 8a shows the results ob-
Fig. 8. (a) Azimuthally averaged correlation coefficients as functions of frequency for the vertical components of motion at distances r ranging from 10 to 60 m. (b) Az- imuthally averaged correlation coefficients as functions of frequency at r = 60 m for the vertical, radial, and trans- verse components of motion.

6206 Ferrazzini et al.: Seismic Waves Composing Hawaiian Volcanic Tremor
rained for the vertical component of tremor for semicir- cles with radii r ranging from 10 to 60 m. Figure 8b shows similar results obtained for the vertical, radial, and az- imuthal components for the semicircle with radius 60 m. The curves for the gas-piston event are identical to those for the tremor, and we only consider the tremor results in the following.
From the theory for scalar waves the azimuthally av- eraged correlation function for the vertical component of motion should follow the zeroth-order Bessel function
Jo(wr/c(w)) given by (1). The azimuthally averaged cor- relation functions for the horizontal components of mo- tion should be described either by (2) or by (3)if hori- zontal motion is composed of a single mode wave, as in the case of traffic noise observed in Tokyo (Figure 5) by Aki [1957]. Instead, we observed nearly the same results for the transverse and radial components as shown in Fig- ure 8b. The similarity between these two components can be explained if the waves are composed of a comparable amount of Rayleigh and Love waves with similar veloci- ties. In such a case the predicted correlation curve will be approximately expressed by the sum of equations (2) and (3), with the net effect of cancelling J2.
In order to determine the exact fraction of power carried by Rayleigh and Love waves, and to determine the phase velocities for both waves, we first estimated the phase velocity of the Rayleigh waves from the az- imuthally averaged correlation coefficients obtained at different radii for the vertical component of motion. Fig- ure 9 shows the dispersion curves obtained over the range of 2 to 5 Hz by fitting the observed correlation curves of Figure 8a with the Bessel function J0. The disper- sion curves obtained for different distances between 10
and 60 m agree well. These dispersion curves were then smoothed by least squares fitting a function of the form Af -B, which was found to best describe the observed dis- persion by trial and error. Once the Rayleigh-wave dis- persion curve was determined, the dispersion curve for Love waves and the fraction of power carried by both types of waves which was assumed frequency indepen- dent, were then estimated by minimizing the sum of the
squared residuals between the observed and predicted correlation functions shown in Figure 8b. We adopted a similar expression c*(f) - A*f -B* for Love wave dis- persion as for Rayleigh waves.
Figure 10 compares the observed and predicted corre- lation curves for each component of motion for the best fit parameters. The dispersion curves obtained for the Rayleigh and Love waves are shown in the lower right corner. The phase velocities are extremely low for both types of waves. The Rayleigh waves contain 60% of the power, which is consistent with the observed relative am- plitudes of Love and Rayleigh waves if we consider that both are propagating as plane waves from the direction of the Puu Oo crater. As shown in Figure 11, the amplitude of particle motion parallel to the direction of propagation is roughly 1.2 times the amplitude of motion in the trans- verse direction and is nearly constant over the frequency range analyzed. This observation is in good agreement with the power ratio of 1.5 determined from the correla- tion analysis.
To estimate the error in the velocity measurement, we used the following statistical variable, which closely fol- lows the normal distribution [Pugachev, 1984]:
Z -ln( 1 nu/9) 1-p
where p is the correlation coefficient. The number of independent data samples used in estimating the corre- lation coefficient is roughly equal to the product of the length of the time window by the bandwidth of the fil- ter. A data window of 180 s and bandwidth of 0.5 Hz
yield 90 independent data samples. The error estimate of the correlation coefficients for this sample size is about 0.2 near the zero crossing [Pugachev, 1984, p. 233]. Av- eraging the correlation function over the stations on a semicircle reduces the error by a factor of about 3. The resultant error of 0.06 for the first zero of the correlation
coefficient corresponds to an error of 5% in the estimated frequency and phase velocity. The error in phase velocity for frequencies apart from the zero crossing may amount to 10%.
r = 50rn r -- 40rn
....... r = 30rn ....... r = 20m
r -- lorn
Fig. 9.
c)
> 0
f'l
o o-
o
Frequency (Hz) Frequency (Hz)
Dispersion curves for Rayleigh waves (right) obtained from the correlation curves (left) calculated for distances ranging from 10 to 60 m.

Ferrazzini et al.' Seismic Waves Composing Hawaiian Volcanic Tremor 6207
c0.5 .-- ß
.2
o
.9
•0.5
Pr /(Pt+P,) : .60
1-
0.5' .
-0..%
o o
Rayleigh Waves Love Waves
Frequency (Hz) Frequency (Hz)
Fig. 10. Fits of theoretical correlation coefficients with the correlation coefficients observed on the vertical, radial, and transverse components of motion. The dispersion curves obtained for the phase velocities of Rayleigh and Love waves are shown at the lower right corner.
1 - 2 Hz ' •t 4- 5 Hz •1• ß
2 - 3 Hz 5 - 6 Hz ß !• ß
I• 3-4 Hz 6- 7 Hz
Fig. 11. Particle motion in the horizontal plane obtained from geophones located on the outer ring and at the cen- ter of the semicircular array for a 60-s record of tremor filtered in six frequency bands.
We used a trial-and-error method in our search for
structural models that produce phase velocities in agreee- ment with those observed. Figure 12 shows a two-layer over a half-space model that explains both Rayleigh and
Love wave data within the error bars. We used this struc- ture as initial model for an iterative linearized inversion
but did not obtain any significant improvement. Our best model consists of a surficial layer with thickness of 30 m, compressional velocity of 0.65 kin/s, and shear velocity of 0.35 kin/s, and a second layer with thickness of 75 m, compressional velocity of 1.25 kin/s, and shear velocity of 0.72 kin/s, underlain by a half-space with compressional and shear velocities of 2.50 and 1.44 kin/s, respectively.
Topographic maps of the area before 1983 [Wolfe, 1988] show a difference of 30 m in elevation between the summit of Puu Kamoamoa (Figure 1) and the area where the semicircular array was set up. At present that differ- ence is about 7 m. This indicates that the surficial layer formed since the beginning of the eruption in 1983, con- sisting of a layer of pumice covered by ponded pahoehoe, has a total thickness of 23 m. This may correspond to the first layer in our model. The second layer of our model may then correspond to the surface layer present in the area prior to 1983.
Discussion
The results from Puu Oo present a surprising contrast to those obtained at the partially solidified lava lake of Kilauea Iki by Aki et al. [1978], in spite of an appar- ent visual similarity between the two sites. The Kilauea Iki lava lake was formed during the 1959 eruption of Ki- lauea, which filled the original pit crater of Kilauea Iki with lava to a depth of 110 m. In 1976, at the time of the experiments conducted by Aki et al. [1978], the

6208 Ferrazzini et al.: Seismic Waves Composing Hawaiian Volcanic Tremor
E 50 _r:l O0
gso
200 1
o
E
'5 0.6 o
•0.4
i
'1'
S Waves
P Waves
Velocity (km/s) 1 2
I ' ' ' ' I
I
i i i i [ i i
Love Waves-••_ Rayleigh Waves • - '
3
0.2 ' I , I , I , I , 0 2 4 6 8 10
Frequency (Hz)
Fig. 12. Observed (thin line) and calculated (thick line) phase velocities of Rayleigh and Love waves. The cal- culated dispersion curves correspond to the fundamental modes of Rayleigh and Love waves. The velocity struc- tures corresponding to the calculated curves are shown at the top of the figure.
lake had partially solidified from above and below, leav- ing a residual lens of molten rock of unknown thickness at a depth of 45 m. Figure 13 compares the phase ve- locities obtained at Kilauea Iki and Puu Oo. The most
striking difference between the two sites is the absence of Rayleigh waves in Kilauea Iki and their strong presence at Puu Oo. Aki et al. [1978] attributed the absence of Rayleigh waves to either, or both, of the following two ef- fects: (1) the presence of a soft thin layer of molten rock, which may have drastically lowered the phase velocity of Rayleigh waves without so much affecting Love waves (see, e.g., Aki [1968]), resulting in shorter wavelengths and severe scattering of the Rayleigh wave mode; and (2) an anisotropy in the distribution of vertical and horizon- tal cracks in the solidified lava, which may have affected the shear moduli controlling the Rayleigh wave mode but not those controlling the Love wave mode, again resulting in incoherent Rayleigh propagation.
Another significant difference between the two sites is found in the phase velocity of Love waves in the range of 6 to 8 Hz, which is lower by a factor of 2 at Puu Oo compared to Kilauea Iki. This suggests that the den- sity of vertical cracks controlling the SH wavespeed is higher at Puu Oo than at Kilauea Iki. The shallowness of the pahoehoe flow on which our array was deployed near Puu Oo may have favored the development of nu- merous columnar joints, resulting in low shear moduli controlling the Love wave mode.
u
ß I.O
0.5
SHEAR VELOCITY IN KM/S 0.5 0.5 i
I L Ii !
0•0 :
Loves Waves--,.
Rayleigh waves
O. 12 0.14 0.16
PERIO0 IN $EC
Pig. 13. Comparison of the dispersion curves obtained by Aki et al. [1978] for Love waves in Kilauea Iki with those of Love and Rayleigh waves obtained at Puu Oo. The shear velocity structures derived by Aki et al. [1978] for Kilauea Iki are reproduced at the top. The structures labeled A, B, and C correspond to the dispersion curves labeled by the same letters in the lower plot.
Gordeev et al. [1990] measured the phase veloc- ity of waves from volcanic events recorded in 1986 at Klyuchevskoy volcano, a 4800 m-high basaltic cone in the Kamchatka peninsula. The visual observations they reported and the seismograms shown in their paper sug- gest a strong similarity between their events and our gas- piston events. Gordeev et al. made no direct observation of activity inside the vent of Klyuchevskoy, however. As mentioned earlier, their data were recorded at a distance of 12 km from the active crater using a linear array of 10 three-component geophones spaced 0.2 to 1 km apart. For each component of motion, they calculated the phase delays in the range of 1 to $ Hz from a phase cross- spectrum of simultaneous samples of tremor recorded at pairs of stations. The phase velocities for the vertical and radial components were found to be about 0.75 km/s at 2 Hz and 0.675 km/s at $ Hz. The transverse component showed a slightly higher velocity of 0.85 km/s at 2 Hz and 0.75 km/s at $ Hz. Apparently, both Rayleigh and Love waves were observed in this case, as at Puu Oo. For comparison, the phase velocity of Rayleigh waves at Puu Oo is about 1 km/s at 2 Hz and 0.45 km/s at $ Hz, and the phase velocity of Love waves is 0.73 km/s at 2 Hz and 0.$0 km/s at $ Hz. Thus the average phase velocity in the frequency band of 2 to $ Hz is roughly the same at Puu Oo and Klyuchevskoy, but the frequency dependence appears much stronger at Puu Oo.
Acknowledgments. We would like to thank Pe- ter Roberts, Chris Dietel, Robert Koyanagi, Michelle Robertson, and Aaron Martin for their invaluable help in the field experiment and John McRaney who provided all the logistics. We also acknowledge Tom Wright, Reg-

Ferrazzini et al.: Seismic Waves Composing Hawaiian Volcanic Tremor 6209
gie Okamura, Christina Heliker, James Griggs, and many others at the Hawaiian Volcano Observatory for their as- sistance in the experiment. Beverly and Dallas Jackson provided excellent accommodations. Special thanks are due to David Okita of Hilo, Hawaii, who always provided us with superb helicopter assistance, advice concerning the conditions at Puu Oo and a constant helping hand during our experiment. The present work was supported by the National Science Foundation under grants EAR- 8618107 and EAR-8904220.
References
Aki, K., Space and time spectra of stationary stochastic waves, with special reference to microtremors, Bull. Earthq. Res. Inst. Tokyo Univ., 25, 415-457, 1957.
Aki, K., Correlational study of near earthquake waves, Bull. Earthquake Res. Inst. Tokyo Univ., 37, 207-232, 1959.
Aki, K., A note on the use of microscisms in determining the shallow structures of the earth's crust, Geophysics, 30, 665-666, 1965.
Aki, K., Seismological evidences for the existence of soft thin layers in the upper mantle under Japan, J. Geo- phys. Res., 73,585-594, 1968.
Aki, K., and R. Y. Koyanagi, Deep volcanic tremor and magma ascent mechanism under Kilauca, Hawaii, J. Geophys. Res., 86, 7095-7109, 1981.
Aki, K., M. Tsujiura, M. Hori, and K. Goto, Spectral study of near earthquake waves, Bull. Earthq. Res. Inst. Tokyo Univ., 36, 71-98, 1958.
Aki, K., B. Chouct, M. Fchlcr, G. Zandt, R. Koyanagi, J. Colp, and R. G. Hay, Seismic properties of a shallow magma reservoir in Kilauca Iki by active and passive experiments, J. Geophys. Res., 83, 2273-2282, 1978.
Borchcrdt, R. D., J. Fletcher, E. Jensen, G. Maxwell, J. Van Schaack, R. Warrick, E. Cranswick, M. John- ston, and R. McClcarn, A General Earthquake Obser- vation System (GEOS), Bull. $eismol. Soc. Am., 75, 1783-1823, 1985.
Capon, J., High-resolution frequency- wavenumber spec- trum analysis, Proc. IEEE, 57, 1408-1418, 1969.
Chouct, B., Resonance of a fluid-driven crack: Radia- tion properties and implications for the source of long- period events and harmonic tremor, J. Geophys. Res., 93, 4373-4400, 1988.
Chouct, B., A seismic model for the source of long-period events and harmonic tremor, Proceedings of the Inter- national Workshop on Volcanic Seisinology, Springer- Verlag, in press, 1990.
Dietel, C., B. Chouet, K. Aki, V.Ferrazzini, P. Roberts, and R.Koyanagi, Data summary for dense GEOS ar- ray observations of seismic activity associated with magma transport at Kilauea Volcano, Hawaii, U. $. Geol. Surv. Open-File Rep., 89-113, 1-171, 1989.
Ferrazzini, V., and K. Aki, Preliminary results from a field experiment on volcanic events at Kilauea using an array of digital seismographs, Proceedings of the Inter- national Workshop on Volcanic Seisinology, Springer- Verlag, in press, 1990.
Gordeev, E. I., V. A. Saltykov, V. I. Sinitsin, and V. N. Chebrov, Temporal and spatial characteristics of volcanic tremor wave fields, J. Volcanol. Geotherm. Res., 40, 89-101, 1990.
Kubotera, A., Volcanic tremors at Aso volcano, in Physi- cal Volcanology, edited by L. Civetta et al., pp. 29-47, Elsevier, New York, 1974.
McNutt, S. R., Observations and analysis of B-type earthquakes, explosions, and volcanic tremor at Parlor volcano, Alaska, Bull. Setstool. Soc. Am., 76, 153-175, 1986.
Minakami, T., Seismology of volcanoes in Japan, in Phys- ical Volcanology, edited by L. Civetta et al., pp. 1-28, Elsevier, New York, 1974.
Okada, H., T. Matsushima, and E. Hikada, Compari- son of spatial autocorrelation method and frequency - wavenumber spectral method of estimating the phase velocity of Ray-leigh waves in long-period mi- crotremors, Geophys. Bull. Hokkaido Univ., 49, 53-62, 1987.
Omer, G. C., Volcanic tremor, Bull. Setstool. Soc. Am., 40, 175-194, 1950.
Pugachev, V. S., Probability Theory and Mathematical Statistics for Engineers, Pergamon, New York, 1984.
Sassa, K., Volcanic micro-tremors and eruption earth- quakes, Mere. Coil. Sci. Univ. Kyoto, 18, 255-293, 1935.
Swanson, D. A., W. Dufiqeld, D. Jackson, and D. Peter- son, Chronological narrative of the 1969-71 Mauna Ulu eruption, Kilauea Volcano, Hawaii, U.S. Geol. Surv. Prof. Pap., 1056, 1-55, 1979.
Wada, T., and H. Oho, Spectral stusy of volcanic micro- tremors (1) propagation of the micro-tremors of the first kind observed at volcano Aso, Specila contribu- tions, Geophysical Institute, Kyoto Univ. 5, 169-178, 1965.
Wolfe, E. W., The Puu Oo eruption of Kilauea Volcano, episodes 1-20, January 3, 1983, to June 8, 1984, U.S. Geol. Surv. Prof. Pap., 1463, 1-251, 1988.
K. Aki and V. Ferrazzini, Department of Geological Sciences, University of Southern California, Los Angeles, CA 90089-0740.
B. Chouet, US Geological Survey, 345 Middlefield Road, MS 977, Menlo Park CA 94025.
(Received June 1, 1990; revised November 28, 1990;
accepted December 19, 1990.)