Seismotectonic and stress distribution in the central Chile subduction zone
Upload
khangminh22Category
view
4download
0
1
A new seismotectonic model approach
to Nicaragua
Un nuevo enfoque de modelo sismotectónico
para Nicaragua
M.O. Cotilla-Rodríguez, L. Álvarez-Gómez, D. Córdoba-Barba and A. Muñoz-Guerrero
Madrid, 2021
2
FOREWORD
This book is one of some results obtained by the authors as part of the Scientific Research ProjectKUK-AHPAN RTI2018-094827-B-C21. The authors are a multidisciplinary team with extensiveexperience in Earth Sciences, and have collaborated for several years in other scientificpublications.
The title perfectly describes the content and purpose of the book. The language used in thepresentation is appropriate and conforms to contemporary scientific terminology. The structure ofthe text is harmoniously justified and includes 54 figures, 33 tables and 199 references, in 99pages. Authors sustain the idea of St. Francis of Assisi (Italy, ¿?-1226): “La verdadera enseñanzaque transmitimos es lo que vivimos; y somos buenos predicadores cuando ponemos enpráctica lo que decimos”.
For the first time, a seismotectonic model for Central America is proposed and argued, subdividingit into two Seismotectonic Provinces: America Central I (El Salvador, Guatemala, Honduras andNicaragua) and America Central II (Costa Rica and Panama). Significant differences appear inthese regions with respect to the existing models in Chile, México and Peru; where CentralAmerica's lower hazard is highlighted. This is very important at the time of making hazard and riskestimates, especially when the limited monetary resources of Central American countries areknown.
The authors undertook an extensive review of all the materials available to them, and the use ofseveral bibliography (in different languages) reflected in the book demonstrates it. An element ofconsideration has been the argumentation about the fragmentation of active structures, thetransmission of stresses and the corresponding deformations; as well as the hierarchy of all tectonicelements. Highlights the novel proposal of a set of active tectonic knots in Central America, andNicaragua in particular. In this sense, in the vicinity of the Managua City, a knot is defined thatjustifies its unique seismic activity. It is hoped, mainly, in Nicaragua, and that it will allow them toquestion, with critical eyes and minds, the dogmas and models that are accepted by the majority ofthe scientific community. In this regard, the following reasoning is given: “Cualquier ayudainnecesaria es un obstáculo para el desarrollo” (María Tecla Artemisa Montessori/ Italy, 1870-Netherlands, 1952).
Finally, the use of several languages for the presentation of the work and the different covers iscommendable. This should be an incentive for the new generations [“The limits of my languageare the limits of my world” (Ludwig Josef Johann Wittgensteine/ Austria, 1889-United Kingdom,1951)].
3
DEDICATORY
This work is a deep and sincere recognition to the Nicaraguan people whohave been affected throughout their history by strong and damagingearthquakes, tsunamis and volcanic eruptions.
“…Desde acá mis bendicionesa esa hermosa población
la bella Nicaraguaque respeta la vida,
y pide paz en su nación.”Oda a Nicargua (Renny Krieger)
4
INDEX
Abstract/ Resumen 5INTRODUCTION 61-NEOTECTONICS 9Alignments, fractures and geometrical arrangement 162-SEISMICITY 28Macroseismic data 44Isoseismal maps and alignments 48Special maps and seismicity profiles 52Released energy and density maps 583-MORPHOTECTONIC ANALYSIS 644-SEISMOTECTONIC 73DISCUSSION AND CONCLUSIONS 77Acknowledgments 81References 82Tables Relationship 94Figures Relationship 96Acronyms 98Authors 99
“Nada en el mundo es más peligroso que la ignorancia sincera yla estupidez concienzuda”.
Martin Luther King, Jr. (U.S.A., 1929-1968)
5
A new seismotectonic model approach to Nicaragua
Un nuevo enfoque de modelo sismotectónico para Nicaragua
M.O. Cotilla-Rodríguez1, L. Álvarez-Gómez2, D. Córdoba-Barba1 and A. Muñoz-Guerrero3 1-Universidad Complutense de Madrid. Facultad de Ciencias Físicas. Departamento de Física de la
Tierra y Astrofísica. Plaza de Ciencias 1. 28040, Madrid. Españ[email protected]; [email protected]
2- Ministerio de Transporte e Infraestructuras, Managua. Nicaragua [email protected];3- Consultora privada, Nicaragua [email protected]
Autor para contacto: [email protected]
ABSTRACT: Nicaragua is a seismic-active structure of Central America in the Caribbean Plate.
Central America has two well-differentiated types of seismicity (intraplate and interplate). In this
geodynamic context there are some plates interacting (Caribbean, Cocos, Nazca, Northamerican,
and Southamerican) and transferring efforts. The determined regionalization shows that El
Salvador, Guatemala, Honduras and Nicaragua constitute a Seismotectonic Province, AC-I. Central
America has another Province (AC-II) that includes Costa Rica and Panama. In Northern Province,
AC-I, there is a set of Seismotectonic Units of lower order, with associated linear and knot
structures. AC-I's main seismogenic source is the Mesoamerican Trench-Fore Volcanic Arc-
Volcanic Arc parallel system (Mmax=8,1). Many important cities are located in this active band.
Nicaragua has two active knots on its borders with El Salvador and Costa Rica. The applied
seismotectonic method of Russian origin, with modifications of the authors, allows to sustain that
AC-I has the largest seismic hazard with more than 60.000 deaths. Managua is located in an active
seismic knot of less category.
Keywords: Central America, morphotectonic, neotectonics, seismicity, tectonic knot
RESUMEN: Nicaragua es una estructura sismo activa de América Central en la Placa Caribe.
América Central tiene dos tipos de sismicidad (interior de placa y entre placas). En este marco
geodinámico hay algunas placas interactuando (Caribe, Cocos, Nazca, Norteamericana y
Suramericana) y transfiriendo esfuerzos. La regionalización determinada muestra que El Salvador,
Guatemala, Honduras y Nicaragua constituyen una Provincia Sismotectónica, AC-I. Se argumenta
que América Central tiene otra Provincia, AC-II, que incluye a Costa Rica y Panamá. En la
Provincia Septentrional, AC-I, existe un conjunto de Unidades Sismotectónicas de menor orden,
con estructuras lineales y de nudos asociados. La principal fuente sismogénica de AC-I es el

6
sistema paralelo de Fosa Mesoamericana-Ante Arco Volcánico-Arco Volcánico (Mmáx=8,1). En esa
banda activa están localizadas muchas ciudades importantes. Nicaragua tiene dos nudos activos
en sus fronteras con El Salvador y Costa Rica. El método sismotectónico aplicado de origen ruso
con modificaciones de los autores permite definir la zona AC-I como la de mayor peligro sísmico
con más de 60.000 muertos. Managua está localizada en un nudo de articulación sismoactivo de
menor nivel.
Palabras clave: América Central, morfotectónica, neotectónica, sismicidad, nudo tectónico
INTRODUCTION
7
“Me gusta la gente que vibra, que no hay que empujarla, que nohay que decirle que haga las cosas, sino que sabe lo que hay
que hacer y que lo hace”.Mario Benedetti (Uruguay, 1920-2009)
INTRODUCTION
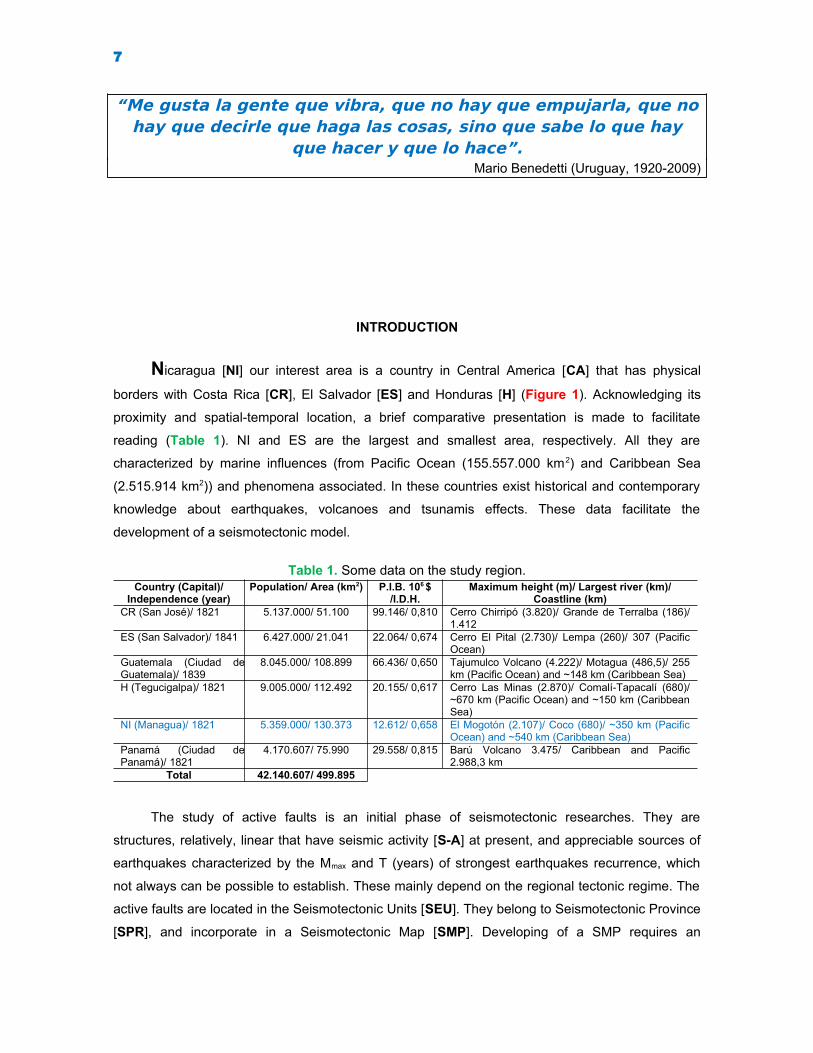
Nicaragua [NI] our interest area is a country in Central America [CA] that has physical
borders with Costa Rica [CR], El Salvador [ES] and Honduras [H] (Figure 1). Acknowledging its
proximity and spatial-temporal location, a brief comparative presentation is made to facilitate
reading (Table 1). NI and ES are the largest and smallest area, respectively. All they are
characterized by marine influences (from Pacific Ocean (155.557.000 km2) and Caribbean Sea
(2.515.914 km2)) and phenomena associated. In these countries exist historical and contemporary
knowledge about earthquakes, volcanoes and tsunamis effects. These data facilitate the
development of a seismotectonic model.
Table 1. Some data on the study region.Country (Capital)/
Independence (year)Population/ Area (km2) P.I.B. 106 $
/I.D.H.Maximum height (m)/ Largest river (km)/
Coastline (km)CR (San José)/ 1821 5.137.000/ 51.100 99.146/ 0,810 Cerro Chirripó (3.820)/ Grande de Terralba (186)/
1.412ES (San Salvador)/ 1841 6.427.000/ 21.041 22.064/ 0,674 Cerro El Pital (2.730)/ Lempa (260)/ 307 (Pacific
Ocean)Guatemala (Ciudad deGuatemala)/ 1839
8.045.000/ 108.899 66.436/ 0,650 Tajumulco Volcano (4.222)/ Motagua (486,5)/ 255km (Pacific Ocean) and ~148 km (Caribbean Sea)
H (Tegucigalpa)/ 1821 9.005.000/ 112.492 20.155/ 0,617 Cerro Las Minas (2.870)/ Comalí-Tapacalí (680)/~670 km (Pacific Ocean) and ~150 km (CaribbeanSea)
NI (Managua)/ 1821 5.359.000/ 130.373 12.612/ 0,658 El Mogotón (2.107)/ Coco (680)/ ~350 km (PacificOcean) and ~540 km (Caribbean Sea)
Panamá (Ciudad dePanamá)/ 1821
4.170.607/ 75.990 29.558/ 0,815 Barú Volcano 3.475/ Caribbean and Pacific2.988,3 km
Total 42.140.607/ 499.895
The study of active faults is an initial phase of seismotectonic researches. They are
structures, relatively, linear that have seismic activity [S-A] at present, and appreciable sources of
earthquakes characterized by the Mmax and T (years) of strongest earthquakes recurrence, which
not always can be possible to establish. These mainly depend on the regional tectonic regime. The
active faults are located in the Seismotectonic Units [SEU]. They belong to Seismotectonic Province
[SPR], and incorporate in a Seismotectonic Map [SMP]. Developing of a SMP requires an

8
exhaustive and in-depth study of the results (geology, geomorphology, tectonics and seismicity). All
these implies time, effort and at first use of published results, correctly referenced, to avoid
duplication. Thus geological researches, in broad sense of the term, allow to configure a stable
base to face the Seismotectonics. SMP is not an eclectic or static entity. The main utility of the SMP
is the seismic hazard; therefore it is necessary to value, in depth, the seismotectonic structures.
These are subject to complex processes of accumulation and release of energy, which do not
always conform to perfect cycles. These processes are independent; therefore it is quite important
to consider that: 1) political-administrative limits always reduce the scope of research; 2) the SMP of
a region implies knowledge of the: 2.1) crustal structure; 2.2) neotectonics; 2.3) seismicity; 2.4)
experience of specialists from other countries in tasks of this type. Obviously, the SMP must be
improved periodically with the accuracy of new data. That scientific material is our main goal for NI
and a first step about seismotectonic knowlodge in the region, because there are great connections
between each and all components.
Figure 1. Basic scheme of Central America and its surroundings.Appear: 1) Basins (COB=Colombia, VB=Venezuela, YB=Yucatán); 2) CA=Central America stages or steps(number in red); 3) CS=Caribbean; 4) Countries (B=Bahamas, BE=Belice, C=Cuba, CO=Colombia, H=Haití,CIS=Cayman Islands, J=Jamaica, RD=Dominican Republic); 5) Deeps (OD=Oriente, Pacific(MAT=Mesoamerican)); 6) Escarpments (CE=Campeche, FE=Florida, HE=Hess); 7) Gulf of (GC=California,GD=Darién, GF=Fonseca, GH=Honduras, GM=Mexico, GMO=Mosquito, GP=Panama, GT=Tehuantepec); 8)Mainland (America: 8.1) of the North [NA]; 8.2) of the South [SA]; 8.3) Middle [CA]); 9) Peninsulas(CAPE=California, FPE=Florida, NPE=Nicoya, YPE=Yucatán); 10) Rises of (BR=Beata, NIR=Nicaragua); 11)Oceans (AO=Atlantic, PO=Pacific); 12) PA=predominant alignment (red line), SM=Sierra Madre, TP=TripleTectonic Point (circle and acronym red).

9
1-NEOTECTONICS
10
“Lo que hace falta es someter a las circunstancias no sometersea ellas”.
Quinto Horacio Flaco (Italia, 65 a.C.-8 a.C.)
1-NEOTECTONICS
In the Caribbean-CA region (Figure 2), where NI is located, there are well-defined tectonic
alignments: 1) two of them are extensive and approximately transversal, and related to the
seismicity: 1.1) E-NW to NE-SW (associated with the plate boundary fault system, Caribbean-
Northamerican); 1.2) NW-SE (from the southern border of Mexico to Panama, related to the
convergence of the Caribbean-Cocos and Caribbean-Cocos-Nazca Plates). This group determines
the location of ES, Guatemala, H and NI. These countries are in the mountainous area of the Sierra
Madre del Norte (which extends south from Mexico to the vicinity of Guatemala City, NW-SE) and
the Andes at south, where the main directions of the relief are N-S; 2) at least two other quasi-
parallel zones extend from the mainland to the Caribbean Sea area (the Guayape Fault and the
Hess Escarpment).
The following reference were used: Alvarado et al. (2011); Álvarez-Gómez (2010); Álvarez et
al. (2018); Anderson and Schmidt (1983); Aurger et al. (2004); Bergoing and Protti (2009); Brown
Jr. et al. (1973); Burbach et al. (1984); Burkart and Self (1985); Calix-Matute (2011); Cheal and
Steward (1982); Christesen et al. (1999); Correa et al. (2009); Corti et al. (2005); Cotilla et al. (2017,
2019); Cowan et al. (2002); Cruz (1999); Deaton and Bukart (1984); DeMets (2001); DeMets et al.
(2010); Dengo (1968, 1969, 1973); Dengo et al. (1970); Dewey and Algermissen (1974); Donnelly
et al. (1990); Ellis et al. (2018, 2019); Finch and Ritchie (1991); Fisher et al. (2003); Franco et al.
(2012); French et al. (2010); Frez and Gámez (2008); Frischbutter (2002); Giunta et al. (2002);
Gordon (1987); Gordon and Muehlberger (1994); Guzmán-Speziale (2001); Harlow and White
(1985); Hey (1977); Hodgson (1978); INETER (1995, 2004, 2015); James (2015); Kobayashi et al.
(2014); Kolarsky and Mann (1995); Kolarsky et al. (1995); La Femina et al. (2002, 2009); Lilljequist
and Hodson (1983); Luna et al. (2008); Malfait and Dinkelman (1972); Mann (2007); Mann et al.
(1990, 2002); Marshall and Vannuchi (2007); Martínez (1993); Martínez and Noguera (1992);
McBirney and Williams (1965); McIntoch et al. (1993, 2007); Meschede and Backhausen (2000);
Meyer-Abich (1955); Molina et al. (2009); Monterroso and Kulhánek (2003); Montan (1987);
11
Muehlberg and Ritchie (1975); Pindell and Kennan (2001); Plafker and Brown Jr. (1975); Plank et
al. (2002); Protti et al. (1995); Ritchie (1976); Rogers (2000); Rubí-Tellez (2006); Satake et al.
(1994); Sthaler-Vásquez (2014); Simkin and Siebert (1994); Stoiber and Carr (1973); Strauch
(2005); Suárez (1991); Turner et al., 2007; Vela-Velázquez (2009); von Huene et al. (2000);
Walther et al. (2000); Ward et al. (1974); Weinberg (1992); Weyl (1980); White (1991); White and
Harlow (1993); Wiesemann (1975); Williams (1955); Williams and Meyer-Abich (1955) and World
Stress Map (2016) in order to develop the epigraph. We assure that in CA: 1) geological formations
have Paleozoic-Holocene age, but the Tertiary-Quaternary age prevails. The oldest are
metamorphic types (Paleozoic-Mesozoic); 2) mountains are of three types: tectonic, volcano-
tectonic and volcanic. The tectonic ones are located in the center of Guatemala, the West of Belice,
the NW and center of H, and the north of NI. They constitute the oldest geological nucleus in the
region. While the volcano-tectonic reliefs are: 1) in SE of Guatemala, south of H, and center and
north of ES; 2) located widely in the center and south of NI; 3) in the west and south of CR; 4) form
the mountains of Panama. Table 2 shows the highest altitudes in Belice, CR, ES, H and NI; 5) NI is
characterized by oblique subduction (~60º) of the Cocos Plate under the Caribbean Plate, through
the Mesoamerican Oceanic Trench [MAT]. Subduction gave rise to the Volcanic Arc that parallels
the MAT. This process produces: 5.1) a general clockwise rotation; 5.2) fragmentation of the
Volcanic Arc; 5.3) short transverse faults and small blocks; 6) the oblique collision is not exclusive
to CA but also to the NE Caribbean; 7) the Volcanic Chain (Guatemala-Panama) has approximately
1.500 km long; 8) the Volcanic Chain in ES has a width of 15-30 km/ direction WNW-ESE; 9) ES is
located in the fourth tectonic segment of CA, which has a length of approximately 230 km; 10) the
structural interpretation of this tectonic segment allowed to define three fault systems: WNW-ESE,
NNW-SSE, and NE-SW; 11) Eastern ES has three active Quaternary volcanic zones (Berlin-
Usulután, Pacayal and San Miguel, and Gulf of Fonseca). San Miguel volcano is one of the most
active in CA.
In two figures (F-1 and F-2 by Pindell and Kennan, 2001) a set of structures and tectonic
elements of the region around Gulf of Mexico (15º-35º N 75º-105º W) (F-1) and Caribbean Sea (5º-
25º N 55º-90º W) (F-2) can be seen. They assured that CA is in the western part of Caribbean Plate
and is affected by differential movements of Cocos, Nazca, Northamerican and Southamerican
Plates (Figure 2). In that setting there is a subduction process with S-A and volcanism, where the
Cocos Plate undergone Caribbean Microplate in MAT. The convergence is N25º-30º and with a
relative speed of 10,2+/-0,5 to 7,2+/-0,3 cm/year.
Table 2. Maximum altitudes.Country Mountain range/ Altitude (m) Country Mountain range/ Altitude (m)
CR Cordillera de Talamanca/ Cerro Chirripó (3.820) H Cordillera de Celaque/ Pico Celaque(2.730)
ES Cinturón Volcánico/ Volcán Santa Ana (2.362) NI Sierra de Dipilto/ Mogotón (2.107)
12
The general consensus among specialists about CA is the existence of four large tectonic
blocks (Figure 2): 1) Maya (on the Northamerican Plateau); 2) Chortis; 3) Chorotega (bordering the
Hess Escarpment); 4) Choco (to the east and south of Panama)). But much of it belongs to two
blocks: Chortis and Chorotega. Chortis was active in CrEarly and is located to west and limits with the
active Motagua Fault and to SW with MAT. The south is covered by Cenozoic volcanic products;
and east limit is not well defined. Figures of Sthaler-Vázquez (2014) for CA: 1) No. 2.2 shows main
tectonic elements where mentioned blocks are located and a very heterogeneous fault system; 2)
No. 2.4 (Conceptual model of forces and displacements) presents a tectonic interpretation for
Chortis Block and its immediate surrounding. Thus, there are three main interaction zones
(boundaries) in the plates: 1) Caribbean-Northamerican (active fault system, Polochic-Motagua).
Both sides of the structure had a same past in the Mesozoic. The system is also in the Caribbean
Sea and related to Swan Fault. They have left lateral movement. In it, a pull-apart basin was
formed, called Cayman, which extends to the east up to Eastern Cuba); 2) Caribbean-Cocos (El
Salvador and Guayape Faults); 3) Caribbean-Cocos-Northamerican forming a Triple Tectonic Point
[PTT] on the Pacific side. In Dengo (1973) there are delimited, for CA, various Morphotectonic
Units: 1) Pacific Volcanic Chain and Nicaraguan Depression (NW-SE trending (wide~75 km/
longitude~600/ km h of 35-50 m)); 2) Costera Planicie of: 2.1) Gulf of Mexico, 2.2) Caribbean, 2.3)
Pacific; 3) Ranges of the North of CA; 4) Range and Volcanic Plateau; 5) Mountain System of South
of CA; 6) Peten Lowlands and Yucatan Peninsula.
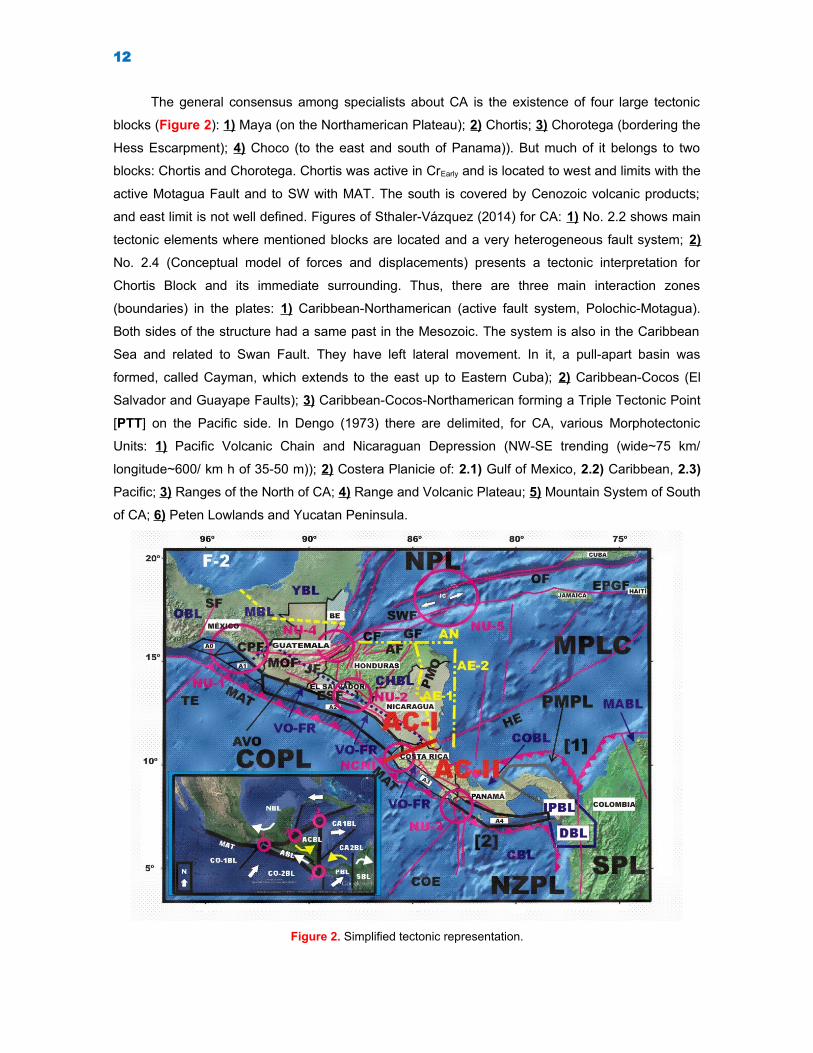
Figure 2. Simplified tectonic representation.
13
Appear: 1) Alignments (dashed yellow lines with two interleaved points: AN=North, AE-1=East-1, AE-2=East-2); 2) Alignment intersections (knots (circle with acronym in red, NU-1); 3) Blocks (purple with acronym:CBL=Choco, CHBL=Chortis, COBL=Choroteca, DBL=Darién, MABL=Maracaibo, MBL=Maya, OBL=Oaxaca,IPBL=Planicie-Istmo de Panama, YBL=Yucatán); 4) Deformed of Panama (lines with black triangles (North [1],South [2])); 5) Countries (BE=Belice); 6) Escarpment of (CE=Cocos, HE=Hess, TE=Tehuantepec); 7) Fore-arc[A0-A4]; 8) Faults (red line (AF=Aguán, AAF=Atrato-Aruba, CF=Ceiba, CHAF=Chamelecón, CPF=Chixoy-Polochic, ESF=El Salvador, EPGF=Enriquillo-Plantain Garden, GF=Guayape, JF=Jocotán-Chamalecón,PAF=Panama, MOF=Motagua, OF=Oriente, SF=Cruz-Salina, SWF=Swan); 9) MAT=Mesoamerican Trench;10) Microplates (CMPL=Caribbean, PMPL=Panama); 11) Plates (NPL=Northamerican, SPL=Southamerican,COPL=Cocos, NZPL=Nazca); 12) Territorial Units (orange thick line, AC-I); 13) AVO=Volcanic Arc; 14)Volcanic Front [indicated by purple arrow, VO-FR]. Box of the Figure 2. Morphotectonic regionalization: Appear: 1) Block limits (black continuous line); 2) Blockrotation (curved arrows: 2.1) white=clockwise, 2.2) yellow=counterclockwise); 3) Main blocks (White letters:ABL=Fore-arc; ACBL=Central America, CO-1BL=Cocos-1, CO-2BL=Cocos-2, CA-1BL=Caribbean-1, CA-2BL=Caribbean-2, NBL=North America, PBL=Panama, SBL=South America); 4) Main knots (circles withnumber in red); 5) sense of movement of blocks (white thick arrow).
On the other hand there are two results on the structural segmentation in American region: 1)
Luna et al. (2008) propose in their figure 5 a seismotectonic model for the surroundings of
Tehuantepec Fracture Zone and its relation with MAT and Polochic-Motagua Faults, in Cocos
subduction area. The proposal considers that there is reactivation of structures by gravitational
processes associated with subduction; 2) Vela-Velásquez (2009) holds that the Nazca Plate is
divided into three parts (North, Central and South). These divisions produce the plate segmentation
and are associated with two active transverse fault systems to the trench (Gulf of Guayaquil and
Paracas). This obviously gives to the mentioned faults a less seismogenic category.
The location analysis, geological characteristics and geodynamic position of the region in
actual plate system, allows to support for the mentioned Blocks (Maya (southern Mexico), Chortis
(Guatemala, ES, NI and H), Chorotega (CR and Northern Panama) and Choco (Panama and
Northern Colombia)) a coherent kinematics with seismicity. Thus movement of Maya Block could be
clockwise.
For CA the limit of Caribbean Plate by the west is: 1) located at Cocos Plate, in the Pacific
Ocean; 2) convergent and mainly characterized by subduction process; 3) where it configures an
active Volcanic Chain (L~1.100 km), arranged approximately parallel to the coast and at a distance
of ~110 km and associated with MAT. Here the subduction is oblique with respect to the collision
line and there are variations of: 1) angle of 25º-85º; 2) depth of 100-200 km; 3) speed of 70-80
mm/year. There are segments 100-300 km long and with differences in direction and dip in
subduction. Focal mechanisms indicate three types of faulting: 1) normal (h~10 km from subduction
zone, from MAT to the coast); 2) reverse (h=15-50 km); 3) normal with sub-vertical planes (h=50-
280 km). The earthquakes in this latter zone are of the intra-plate type. All these data justify the
segmentation of Volcanic Chain.
NI is limited by three large tectonic units of the: 1) Pacific Ocean (the Continental Shelf, MAT,
and Cocos and Nazca Plates); 2) Caribbean Sea (Caribbean Plate and the Rise (or Bank) of NI); 3)
inland (Nicaraguan Graben and Highlands). This Graben is a young regional tectonic structure
(Quaternary) that extends parallel to the Pacific (Gulf of Fonseca-CR). It is wedged between: the

14
Rivas Anticline to the west and Interior Highlands to east. There exist a set of volcanoes from
Circum-Pacific Ring of Fire (Example: San Francisco/ 1.745 m). It is considered to be an elongated
structure, under a tectonic regime of the transpressive type, of NW-SE direction (L~300 km/ A~70
km). It is arranged parallel to Pacific coast, and has two fault systems: 1) normal and open
directional fractures N-S; 2) left side displacement and direction NE-NNE. Comparison of faults and
fractures (NW direction with right lateral displacement and NE direction of left lateral displacement)
of Volcanic Chain in NI with those of CR, ES and Guatemala shows that, only in NI the NE are
active. It has been assured a set of minor blocks in rotation (clockwise) with left lateral failure that
obeys to the system of oblique stresses by the action of the subduction process. Nevertheless, the
authors has other point of view.
The location of Volcanic Chain includes a greater surface extension (ES- northern CR) and
conforms a NW basin that widens ~40 km in ES and -75 km in the SE of NI. In Managua the
Depression is 50 km wide and is occupied by the Managua and Nicaragua Lakes. It has two main
faults: 1) Mateare (parallel to the Depression/ 900 m high escarpment); 2) Tiscapa (perpendicular to
the graben/ fault, NE-SW direction/ 3 km of displacement/ associated to the 1972 earthquake, in
Managua). SW limit of the depression is the above mentioned Mateare Fault escarpment. A
displacement of 3 km was estimated for this one. Hess Escarpment is an alignment (L~1.000 km) in
Caribbean Sea that divides two regions with opposing tectonic regimes: 1) compression to the north
(Nicaragua Rise); 2) distension to the south (Colombia Basin). It extends between the Caribbean
Coast of NI and southern Jamaica, and it is the eastern limit of Chortis Block. This area of the
Caribbean Sea has a triangular shape and is situated to the south of Jamaica. Towards the
continent (to SW) the alignment is in Lowlands of Caribbean coast of NI at southern of Nicaraguan
Depression.
There is in CA a set of results from GPS measurements. Among them are: 1) Correa-Mora et al.
(2009) that for ES-H-NI proposed: 1.1) in Pacific zone convergence speeds of 72-79 mm/year and a
defined displacement of volcanic arc to NW from NI to ES (their figure 1); 1.2) for 1964-2006 period
the existence of reverse and normal faults from MAT to the coast line (their figure 2); 2) Alvarado et
al. (2011) argued that: 2.1) Cocos-Caribbean Plates have convergence speeds of 78-84 mm/year;
2.2) tendency of displacement of the volcanic arc is to NW with 15 mm/year; 2.3) a possible tectonic
deformation at Gulf of Fonseca and develop a pull-apart basin model with right-hand movements; 3)
Ellis et al. (2018, 2019) in two extensive works argue that: 3.1) convergence speeds are 75-76
mm/year; 3.2) there is displacement to the NW parallel to Pacific coast of the volcanic arc; 3.3)
there is a block in Gulf of Fonseca; 3.4) a total of eight internal blocks are deformed by plates
action.
It is very important to consider that the authorship of volcanic arc displacement to NW and
parallel to Pacific coast by GPS measurements, ~14 mm/year, belong to Lyon-Caen et al. (2006)
Turner et al. (2007) and Alvarado (2008). The authors have some doubts about this model of
activity with displacement from volcanic arc to NW.

15
From another part it is interesting and significant for the development of our exposition
indicate that: 1) the majority of the focal mechanism solutions at Nicaraguan Depression are left
lateral; 2) in this region, some earthquakes have occurred with normal type solutions associated
with transverse faults (NE-SW). These facts gave way to two different neotectonic models based on
Frischbutter (2002) tectonic model proposal in the surrounding of Managua Lake. Such model
argues for transverse displacement with a system of short faults that establish a turning cell. They
are: 1) bookshelf faulting (LaFemina et al., 2002); 2) card game (Álvarez et al., 2018). The main
difference between these models is in the definition of internal blocks and strong earthquakes
occurrence. Furthermore, it must be considered that both models lead to the gradual and
progressive closure of the Depression and the configuration of a main fault system parallel to
Pacific coast. At this point it is necessary consider crust anisotropy and the lateral and transversal
differentiation of Nicaraguan region. Also, fault kinematics is of great importance in these cases.
When two fault systems intersect or intercept each other, it is necessary to decide which of them is
the youngest. The field tasks can help to establish the seismicity pattern associated with these
systems and especially the active and inactive (i.e., Bankwitz et al., 2003; Cotilla, 1988; Cotilla and
Álvarez, 2001; Cotilla et al., 1993, 1998; Cosgrove and Hudson, 2016; Gokhale, 2011; Machette,
2000; Scholz, 2019). On these elements we consider that it is not feasible to assume the presence
of small blocks and a perfect internal rotation, when the linking faults are inactive. We maintain that
there is a succession of differential movements that produce the clockwise rotation, but as a
regional tendency. For the successive and differential rotation (as spin) several elements must be
considered, such as: 1) the difference in velocity from G-CR of the Cocos Plate; 2) the different
collision-contact zone between the Nicaraguan Depression and the large northern block. A fuller
discussion of the matter is given below.
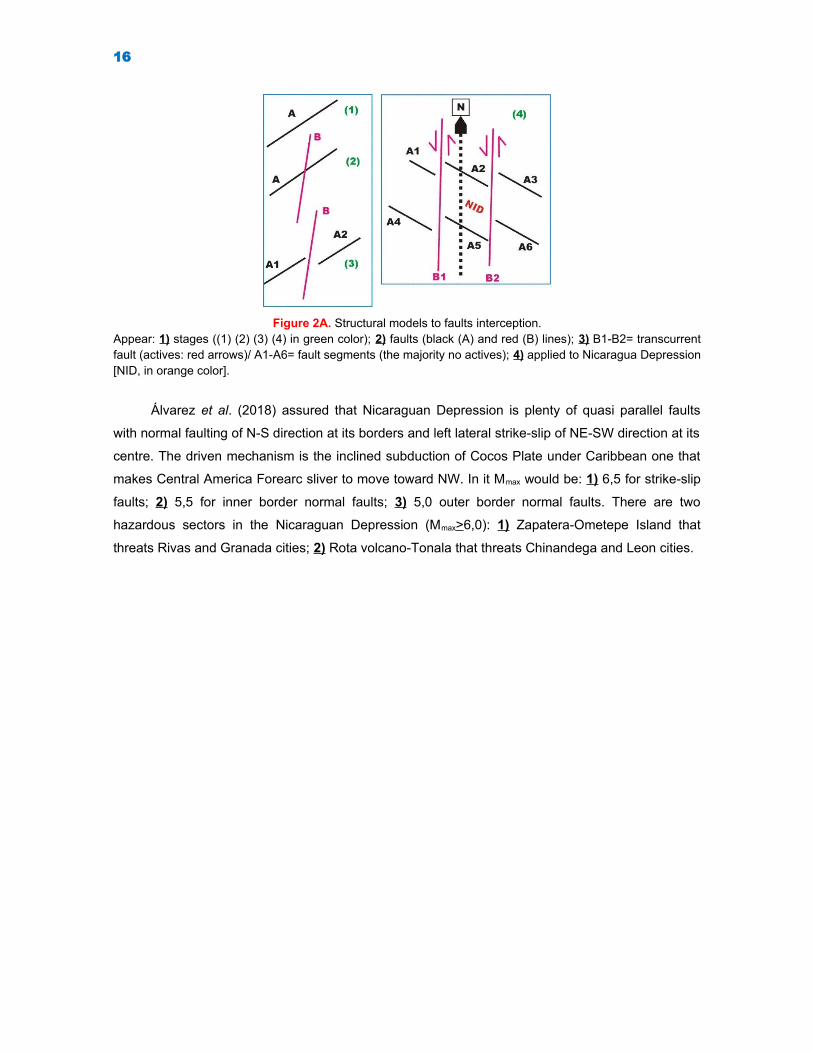
We consider that the fault intersections are active structures. They are junctions between
normal (or reverse) faults and either transversely oriented strike-slip or oblique-slip faults. In that
areas there are subsurface fluid movement enhanced by some minor faults connecting the major
intersecting structures, forming highly fractured zones or extension quadrants with increased
permeability. In figure 2A we present a simplified model of this type of structure to Nicaragua
Depression.
16
Figure 2A. Structural models to faults interception.Appear: 1) stages ((1) (2) (3) (4) in green color); 2) faults (black (A) and red (B) lines); 3) B1-B2= transcurrentfault (actives: red arrows)/ A1-A6= fault segments (the majority no actives); 4) applied to Nicaragua Depression[NID, in orange color].
Álvarez et al. (2018) assured that Nicaraguan Depression is plenty of quasi parallel faults
with normal faulting of N-S direction at its borders and left lateral strike-slip of NE-SW direction at its
centre. The driven mechanism is the inclined subduction of Cocos Plate under Caribbean one that
makes Central America Forearc sliver to move toward NW. In it Mmax would be: 1) 6,5 for strike-slip
faults; 2) 5,5 for inner border normal faults; 3) 5,0 outer border normal faults. There are two
hazardous sectors in the Nicaraguan Depression (Mmax>6,0): 1) Zapatera-Ometepe Island that
threats Rivas and Granada cities; 2) Rota volcano-Tonala that threats Chinandega and Leon cities.
17
Alignments, fractures and geometrical arrangement
“Dejaría en este libro toda mi alma”.Federico García Lorca (España, 1896-1936)
Alignments, fractures and geometrical arrangement
The processing and analysis of published materials (Ward et al., 1974; Weyl, 1980; INETER,
1995, 2004, 2015; Frischbutter, 2002; Rubí-Tellez, 2006) allowed to obtain for NI a fracture
statistical differentiation. This is a stage that has demonstrated usefulness in the cases of Cuba,
Mexico and Spain to distinguish areas of greater weakness of the crust. The process execution was
very simple: 1) capture, arrangement, adjustment and transformation at the same scale and
digitalization; 2) classification. All it was made using a GIS (Cotilla and Córdoba, 2004). The result
of classification process in the third iteration (85% confidence) shows five zones: NE (35%), NW
(29%), N-S (19%), E-W (10%), and mixture (7%). The NW direction is mostly associated with
Pacific coast line, Volcanic Depression and east band of it. The NE fracture zone is practically
concentrated in north and associated with H structures. The N-S and E-W zones are located east of

18
Nicaraguan Depression. The interpretation of this result allows us to consider the primacy of the
NW structures that are related to the process of push and pull from Pacific to Caribbean. The rest of
structures correspond to secondary fracturing processes. These data will be contrasted with those
of seismicity and morphotectonics in order to determine the most active areas and delimit the main
seismic sources. In an analogous way it was established for Managua Lake (12º-13ºN/ 86º-87ºW)
there are four sectors differentiated in quadrants with the following data of fractures: First=40%,
Second=12%, Third=24%, and Fourth=34%. It is observed that the greatest number of fractures are
in first and fourth quadrants. That is, in eastern part of Managua Lake.
The studies derived from the 1972 Managua earthquake have supported among other things
that: 1) the earthquake is related to Tiscapa Fault; 2) the fault has left lateral movement; 3) the fault
is linked to right lateral displacement of Volcanic Chain and consequently would be of a
transformative type; 4) the main maximum stress in CA are: N-S and N-NW; 5) the existence of
grabens and depressions similar to Managua in CA suggest the influence on them of Cocos-
Caribbean Plates; 6) Tiscapa Fault and their parallel system and parallel to Managua Depression
are conjugated faults; 7) Cofradía Fault south (L~37 km N-S) of normal type, constitute the eastern
limit of Managua Graben. Frischbutter (2002) presented in its figure 4 a principal stress model that
differs from Rubí-Tellez (2006) in figure 1-20. The first one has a couple of perpendicular stress
sets with N-S compression and E-W extension, in the vicinity of Managua Lake.
Other specialists like the mentioned above with local studies defined the seismic-active zone
of Managua. Nevertheless, the authors consider that delimitation of seismogenic structures have a
regional approach (macro and meso order). With these data is possible to get the local level
(micro). All it is in a geodynamic frame with the plates interaction, mainly, Caribbean-Cocos. The
stress transmission, and rupture-strain distribution in the relief allows a hierarchical classification of
seismic-active zones. That's the path used here.
It is known that Managua Lake (1.025 km2/ Longitude=65 km/ Wide=58 km/ Depthmax=20 m/
Altitudemax=20 m/ Perimeter=135 km) and Nicaragua Lake (8.624 km2/ Longitude=148 km/
Wide=90/ Depthmax=45 m/ Altitudemax=33 m/ Perimeter=250 km/ 2 volcanoes) are depressed
volcanic structures within Nicaraguan Graben. Similar volcanic structures are recognized in ES and
CR. Despite its immediate proximity, the same genesis and arrangement in the neotectonic plane
has a different shape and dimension. We determined shape index and sinuosity coefficients, Ks, of
both lakes (Table 3). Also, we determined the different values of the Ks north of the Nicaragua
Depression for two segments: 1) Río Grande-Managua Lake (0,77); 2) Nicaragua Lake-Costa Rica
(0,93). All these data allow us to sustain that there is significant anisotropic lateral variation of the
crust under the influence of plates’ interaction.
Table 3. Data from the Lakes.Lake Ks (N) Ks (S) IS
Managua 0,63 0,68 0,45Nicaragua 0,96 0,54 0,72

19
Notes: 1) Ks=Sinuosity coefficient; 2) IS=Shape index.
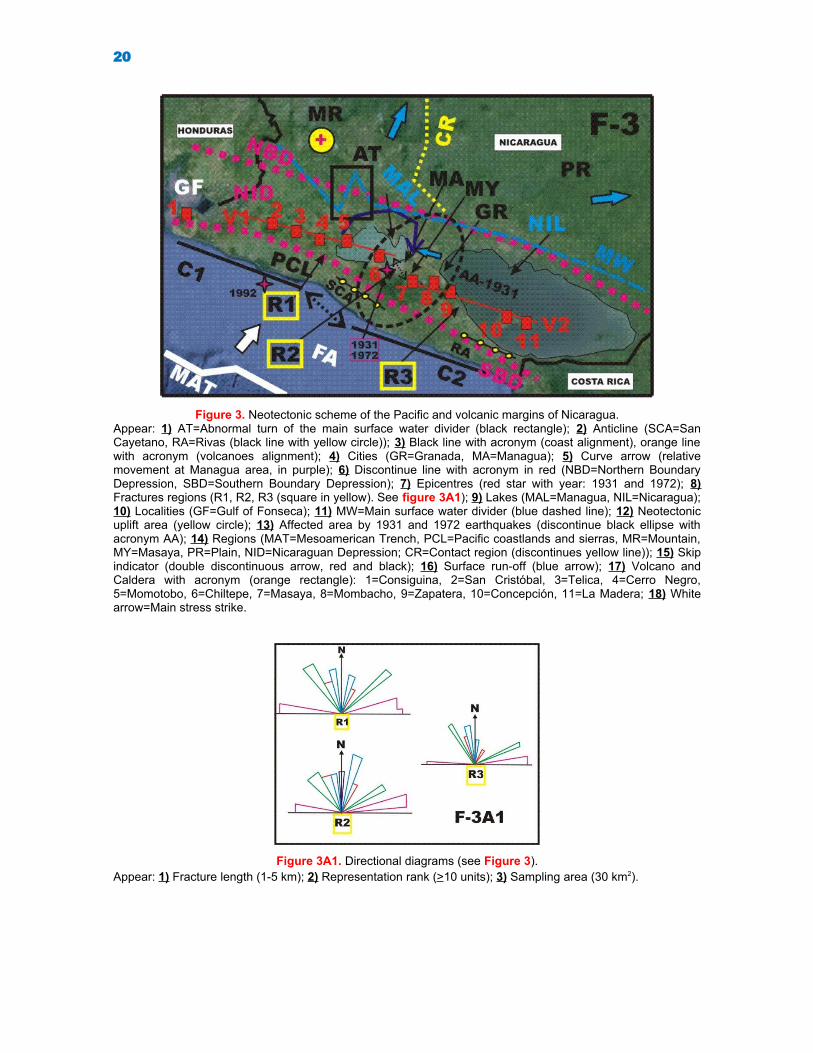
Figure 3 shows the main macro and meso elements of the region bordering the Nicaraguan
Pacific. In this neotectonic plane, Nicaraguan Depression stands out with two distinctive meso
elements: Managua and Nicaragua Lakes. The diagonal transverse deformation of Managua Lake
is related to deformations and rupture processes. The areas of volcanic and coastline alignments
with their lateral displacements are quite relevant as well as the presence toward northern Managua
Lake of an area of strong neotectonic uplifts. According to Annex XXV of CAPRA (2008), Masaya-
Gulf of Fonseca segment is the one with most volcanic activity. The arrangement of drainage
surface and hypsometric differentiation of the relief in four parts: mountains, two pairs of plains and
a tectonic depression confirm the importance of the mentioned plate interaction. A SW-NE ellipse
has been plotted in the vicinity of Managua. It represents the area of the maximum common seismic
intensities of the 1931 and 1972 earthquakes.
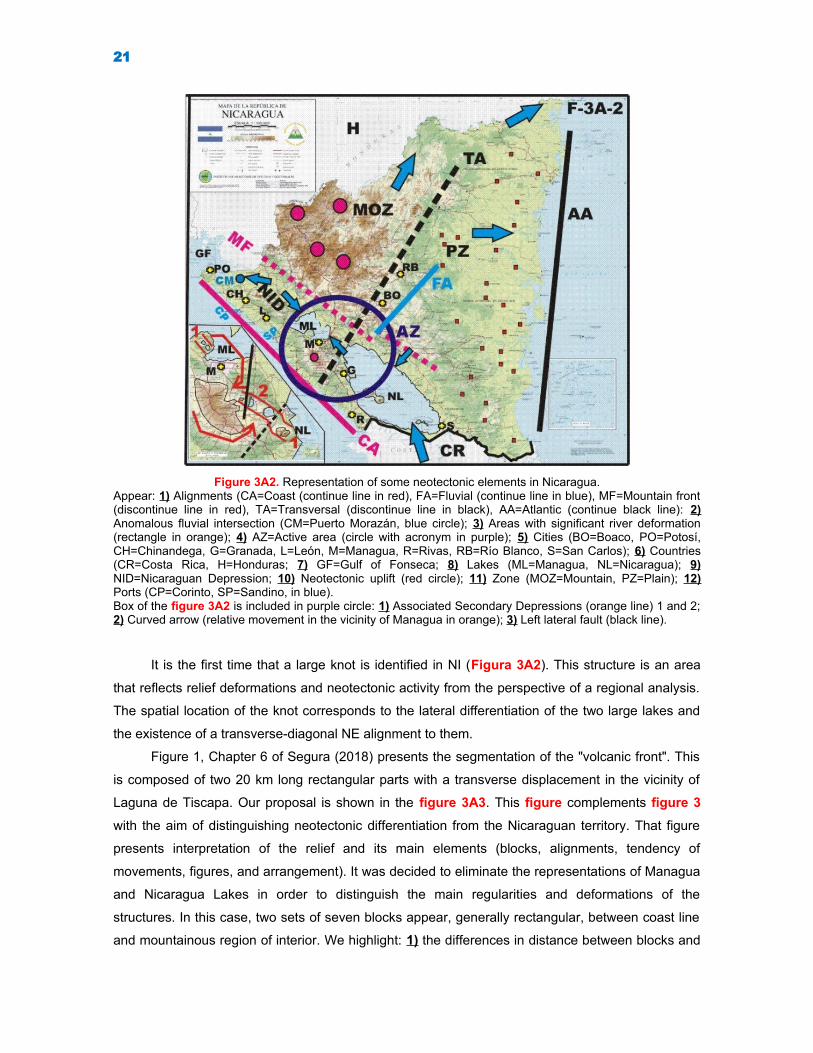
From topographic and relief maps and satellite images it is possible to sustain that Managua
Lake has a greater neotectonic deformation than that of Nicaragua as a whole due to the collision to
the north with the higher elevations of the territory (Figure 3A2). The SW-NE transverse alignment -
AT- to east of Managua Lake corresponds to the main alignment represented in figure 16 (Compiled
outline of geological maps) of Lilljequist and Hodson (1983). In the Managua surroundings, there is
an intersection of structures that constitutes an active knot. That is a structure equivalent to those
indicated in figure 2. An analysis of surface fracturing have been done for three small regions (R1,
R2 and R3 showed in figure 3) and corresponding rose diagrams are presented in figure 3A1.
They are altimetrically different zones and have been delimited and are joined to Volcanic Arc. The
figures generally follow the same pattern; however, there are quite a few differences between them.
The R2 region has a marked N-S pattern that is not identified in the other two. The main directions
of surface runoff indicate different tipping and in particular from Nicaragua Lake with respect to
Managua one.
20
Figure 3. Neotectonic scheme of the Pacific and volcanic margins of Nicaragua.Appear: 1) AT=Abnormal turn of the main surface water divider (black rectangle); 2) Anticline (SCA=SanCayetano, RA=Rivas (black line with yellow circle)); 3) Black line with acronym (coast alignment), orange linewith acronym (volcanoes alignment); 4) Cities (GR=Granada, MA=Managua); 5) Curve arrow (relativemovement at Managua area, in purple); 6) Discontinue line with acronym in red (NBD=Northern BoundaryDepression, SBD=Southern Boundary Depression); 7) Epicentres (red star with year: 1931 and 1972); 8)Fractures regions (R1, R2, R3 (square in yellow). See figure 3A1); 9) Lakes (MAL=Managua, NIL=Nicaragua);10) Localities (GF=Gulf of Fonseca); 11) MW=Main surface water divider (blue dashed line); 12) Neotectonicuplift area (yellow circle); 13) Affected area by 1931 and 1972 earthquakes (discontinue black ellipse withacronym AA); 14) Regions (MAT=Mesoamerican Trench, PCL=Pacific coastlands and sierras, MR=Mountain,MY=Masaya, PR=Plain, NID=Nicaraguan Depression; CR=Contact region (discontinues yellow line)); 15) Skipindicator (double discontinuous arrow, red and black); 16) Surface run-off (blue arrow); 17) Volcano andCaldera with acronym (orange rectangle): 1=Consiguina, 2=San Cristóbal, 3=Telica, 4=Cerro Negro,5=Momotobo, 6=Chiltepe, 7=Masaya, 8=Mombacho, 9=Zapatera, 10=Concepción, 11=La Madera; 18) Whitearrow=Main stress strike.
Figure 3A1. Directional diagrams (see Figure 3).Appear: 1) Fracture length (1-5 km); 2) Representation rank (>10 units); 3) Sampling area (30 km2).
21
Figure 3A2. Representation of some neotectonic elements in Nicaragua.Appear: 1) Alignments (CA=Coast (continue line in red), FA=Fluvial (continue line in blue), MF=Mountain front(discontinue line in red), TA=Transversal (discontinue line in black), AA=Atlantic (continue black line): 2)Anomalous fluvial intersection (CM=Puerto Morazán, blue circle); 3) Areas with significant river deformation(rectangle in orange); 4) AZ=Active area (circle with acronym in purple); 5) Cities (BO=Boaco, PO=Potosí,CH=Chinandega, G=Granada, L=León, M=Managua, R=Rivas, RB=Río Blanco, S=San Carlos); 6) Countries(CR=Costa Rica, H=Honduras; 7) GF=Gulf of Fonseca; 8) Lakes (ML=Managua, NL=Nicaragua); 9)NID=Nicaraguan Depression; 10) Neotectonic uplift (red circle); 11) Zone (MOZ=Mountain, PZ=Plain); 12)Ports (CP=Corinto, SP=Sandino, in blue). Box of the figure 3A2 is included in purple circle: 1) Associated Secondary Depressions (orange line) 1 and 2;2) Curved arrow (relative movement in the vicinity of Managua in orange); 3) Left lateral fault (black line).
It is the first time that a large knot is identified in NI (Figura 3A2). This structure is an area
that reflects relief deformations and neotectonic activity from the perspective of a regional analysis.
The spatial location of the knot corresponds to the lateral differentiation of the two large lakes and
the existence of a transverse-diagonal NE alignment to them.
Figure 1, Chapter 6 of Segura (2018) presents the segmentation of the "volcanic front". This
is composed of two 20 km long rectangular parts with a transverse displacement in the vicinity of
Laguna de Tiscapa. Our proposal is shown in the figure 3A3. This figure complements figure 3
with the aim of distinguishing neotectonic differentiation from the Nicaraguan territory. That figure
presents interpretation of the relief and its main elements (blocks, alignments, tendency of
movements, figures, and arrangement). It was decided to eliminate the representations of Managua
and Nicaragua Lakes in order to distinguish the main regularities and deformations of the
structures. In this case, two sets of seven blocks appear, generally rectangular, between coast line
and mountainous region of interior. We highlight: 1) the differences in distance between blocks and

22
mountainous front; 2) the arrangement of alignments set that fit the spaces between blocks; 3) the
evident rotations of some blocks; 4) the blocks staggering; 5) differentiation of the magnitude of
convergence stresses.
Figure 3A3. Structural analysis in the Central Nicaragua Depression.Appear: 1) Block movement with clockwise tendency (curve yellow arrows, curve orange arrow); 2) VolcanicBlocks (yellow with numbers); 3) Coastal Bolcks (orange with letters); 4) Coastal alignments (discontinue blueline); 5) GF=Gulf of Fonseca, PO=Pacific Ocean; 6) Main alignments (discontinue red lines); 7) Morphotectonicregions (Roman letters in green: discontinue green lines, purple lines); 8) Stress (red arrows); 9) Intenseuplifting area (white circle with red cross); 10) ZTW=Zone of tectonic weakness (black ellipse).
Between Lakes Nicaragua and Managua runs the Tipitapa River (SE-NW/ L~35 km)
(FigureS 3A4 and 3A4-1). On its way it crosses the Tisma Lagoon (14,11 km2). The river has a
Ks=0.77 and has in its initial and final segments two bends to the north. We indicated for first time
the Tisma alignment ([ALT] NW/ L~27 km) from N of Granada (Fortín II) to El Libano (to the W of
the Tisma Lagoon, and which is parallel to the villages of Tisma, San Juan de Tipitapa and La
Carbonera) (Figure 3A4). This structure is also parallel to: 1) the deviation of the volcanic chain (at
the distance of ~16 km); 2) the Mateare Fault at a distance of ~33 km). In the surroundings of this
natural fluvial transfer there is a set of hydrogeological indicators that allow us to sustain the
existence of two areas of different dimensions: 1) the zone of greater water deformation of the
Lakes (indicated with a dashed ellipse in blue); 2) the zone of the inner lagoons of the Depression
(indicated with a red rectangle). We also distinguish the very different distance between the
southern lakes and the Pacific coastline. We sustain that all these structures are under regional
tectonic control and the proposal of a left lateral transverse fault is feasible.

23
Figure 3A4. Morphotectonic scheme of the linking zone between the lakes.Appear: 1) Acronyms (ALT=Tisma alignment, LT=Tisma Lagoon, Mex=Mexico, SA=South America,USA=United States of America, PO=Pacific Ocean, CS=Caribbean Sea, CA=Central America); 2) Curvaturesto the N of the Tipitapa river (1=San Juan de Tipitapa-El Libano and 2=El Paso); 3) Direction of runoff fromLake Nicaragua to Lake Managua (orange arrow); 4) First Order Main Divide of the Fluvial Network (irregularline of black dots); 5) Fluvial deformation area (blue dashed ellipse); 6) Main affected area (red rectangle); 7)Surface runoff direction (blue arrow); 8) Volcanic alignments (black dashed lines with acronyms), L1 and L2);9) Width between the Pacific coastline and the Lakes (double pairs red arrows/ values in km: S of ManaguaLake= 25/ 35 and S of Nicaragua Lake= 52/ 19).
Figure 3A4-1. Detail of morphotectonic at Tisma area.Appear: 1) Acronyms (1= San Juan de Tipitapa-El Libano and 2=El Paso; ALT=Tisma alignment (red line);CL=Coastal line (green line); CP=Cocos Plate; LM=Managua Lake; MA=Main affected area (rectangle inblack); NL=Nicaragua Lake; PF=Probable fault (discontinue black line with arrows); RT=Tipitapa River (dashedblue line); TL=Tisma Lagoon (lakes and lagoon circular figures in blue); 2) Curve arrows=relative movements(in red); 3) Direction of runoff from Lake Nicaragua to Lake Managua (orange arrow); 4) Direction of plateconvergence (red arrow); 5) Surface runoff direction (blue arrow).

24
Figure 3B shows a geological differentiation of NI territory where the majority area is of
volcanic type. The youngest rocks are concentrated aligned as regular bands with Pacific coast line.
This representation shows: 1) the very great influence of plate convergence in NI; 2) the location of
Nicaraguan Depression between two large systems of quasi-parallel structures in relation to the
Pacific coastline: 2.1) Pacific Coastline and Sierras; 2.2) Ignimbrite Province. Analyzing the spatial
distribution of rock types, dimensions and configuration of Managua and Nicaragua Lakes, we
maintain that the greatest deformation is associated with the first one.
Figure 3B. Geological scheme of Nicaragua.Appear: 1) Rock types (see legend: A=Aluvial, B=Volcanic-Quaternary, C=Volcanic-Tertiary, D=Sedimentary-Marine); 2) Countries (in green: CR=Costa Rica, H=Honduras, NI=Nicaragua); 3) GF=Gulf of Fonseca,M=Managua, ML=Managua Lake, NL=Nicaragua Lake, PO=Pacific Ocean; 4) Alignment (discontinue blackline).
Cotilla (1984) determined from aerial photos and topographic maps analysis, in the vicinity of
the Masaya volcano (h635 m/ last eruption 2015) and the Masaya and Apoyo calderas, the
fractures pattern of predominant N-NNE direction. Taking it into account authors proposes a faults
and alignments set (Figure 3C). They are an active family of short structures in lateral and quasi-
parallel N-NNE arrangement. Specifically, Estadio and Tiscapa Faults are associated with strong
earthquakes of 31.03.1931 (M6,0) and 23.12.1972 (M6,2), respectively. Other earthquakes (2014
series and 2000) are located over well differentiate and laterally displaced lineaments. The
mentioned N-NNE faults set in Managua City area is framed by two largest faults: 1) Mateare (N-
NNW); 2) Cofradía (N-NNE). These two fault arrangements is spatially related to volcanoes
(Apoyeque and Masaya) and volcanic lagoons (Apoyo, Masaya and Tiscapa) in a segment beside
to the Managua Lake. In this setting, several tectonic weakness lines of different categories
converge, responding to Cocos-Caribbean Plates convergence. It is a very clear active volcanic

25
area (Figure 3C) where exists a joint knot (with low and high seismicity (Table 8) and volcanism),
Managua Knot. Such element is one of the three most active areas of NI. Figure 3, Chapter 6 of
Segura (2018) represents that area as the Nicaragua Graben discontinuity.
Tiscapa Fault has vertical and left lateral movement (Brown et al., 1973; Plafker, 1973).
Similar structures have been identified in: 1) CR (Tilaran Fault/ earthquake of 14.04.1973)
(Matumoto and Latham, 1973); 2) ES (earthquake of 3.05.1995) (Molnar and Sykes, 1968). Segura
(2018) assures that the Tiscapa fault is not a local structure but has a regional connotation. The
transverse faults system around Managua Lake cuts and displaces all structures of the SE-NW
direction (Figure 3D). This implies that: 1) it is active; 2) it does not allow the configuration of small
rotation and turning cells in the interior; 3) it justifies the differential clockwise rotation of the zone; 4)
rotational movements are staggered; 5) between the transverse faults there are only inactive
segments.
Figure 3C. Simplified neotectonic picture of Managua Lake (Block 2 yelow of Figure 3A3).Appear: 1) Alignment strike (blue arrow); 2) A=Apoyo Lake, Y=Apoyeque Volcano, M=Masaya Lake,V=Masaya Volcano; 3) Deformation fault areas (black circles); 4) Deflection of volcanic lines (double blackarrows); 5) Epicentre of 1972 (red star); 6) Epicentral area of 2014 serie [22.04.2014 (M5,2/ h=6 km),10.04.2014 (M5,0/ h=6,4 km), 10.04.2014 (M5,0/ h=1,5 km), 10.04.2014 (M6,2/ h=1,1 km)] (orange rectangularfigure); 6.1) red circle 13.04.2014 (M5,6/ h=5,4 km); 6.2) red circle 7.07.2000; 7) Faults (lines and acronym inred: 1=Mateare, 2=Nejapa, 3=Tiscapa, 4=Escuela, 5=Aeropuerto, 6=Cofradía, 7=Nubes); 8) K=Managua Knot(dashed circle and acronym in yellow); 9) B=Managua Microblock (white rectangle); 10) S=Managua step(discontinue blue line); 11) Relief deformation (green lines); 12) L=Volcanic alignments (discontinue black lines(L1, L2)); 13) Relative direction of clockwise rotation (curve purple arrow).
The regional process (first order) has produced the irregular deformation of the Nicaraguan
Depression. This can be seen in the disparate geometric configuration of the Depression and of
Lakes Managua and Nicaragua. The repeated and temporally irregular regional compressional
influence, in the form of pulses with different period and amplitude, is well appreciated in the shapes
26
of the mentioned lakes and their immediate surroundings (Figure 2). Effects of transcompression
can be distinguished in a transverse band from the coast to the continental interior (Figure 3A3).
This figure also includes the deformations and displacements of the blocks.
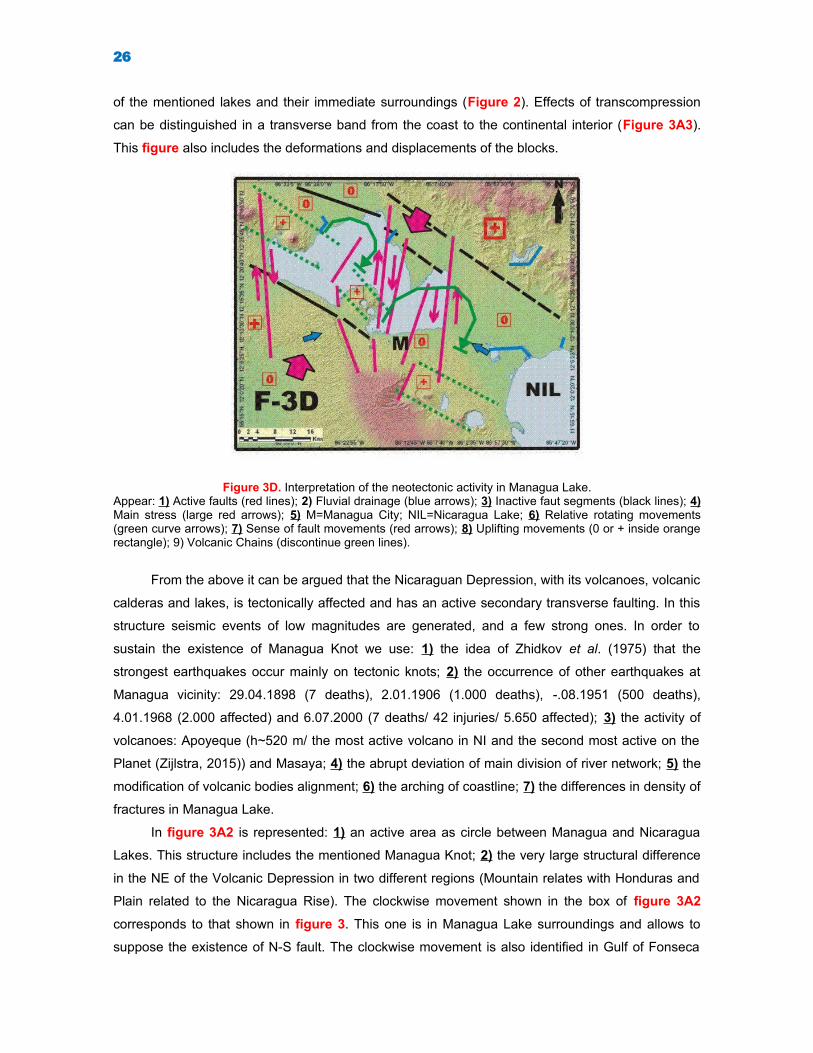
Figure 3D. Interpretation of the neotectonic activity in Managua Lake.Appear: 1) Active faults (red lines); 2) Fluvial drainage (blue arrows); 3) Inactive faut segments (black lines); 4)Main stress (large red arrows); 5) M=Managua City; NIL=Nicaragua Lake; 6) Relative rotating movements(green curve arrows); 7) Sense of fault movements (red arrows); 8) Uplifting movements (0 or + inside orangerectangle); 9) Volcanic Chains (discontinue green lines).
From the above it can be argued that the Nicaraguan Depression, with its volcanoes, volcanic
calderas and lakes, is tectonically affected and has an active secondary transverse faulting. In this
structure seismic events of low magnitudes are generated, and a few strong ones. In order to
sustain the existence of Managua Knot we use: 1) the idea of Zhidkov et al. (1975) that the
strongest earthquakes occur mainly on tectonic knots; 2) the occurrence of other earthquakes at
Managua vicinity: 29.04.1898 (7 deaths), 2.01.1906 (1.000 deaths), -.08.1951 (500 deaths),
4.01.1968 (2.000 affected) and 6.07.2000 (7 deaths/ 42 injuries/ 5.650 affected); 3) the activity of
volcanoes: Apoyeque (h~520 m/ the most active volcano in NI and the second most active on the
Planet (Zijlstra, 2015)) and Masaya; 4) the abrupt deviation of main division of river network; 5) the
modification of volcanic bodies alignment; 6) the arching of coastline; 7) the differences in density of
fractures in Managua Lake.
In figure 3A2 is represented: 1) an active area as circle between Managua and Nicaragua
Lakes. This structure includes the mentioned Managua Knot; 2) the very large structural difference
in the NE of the Volcanic Depression in two different regions (Mountain relates with Honduras and
Plain related to the Nicaragua Rise). The clockwise movement shown in the box of figure 3A2
corresponds to that shown in figure 3. This one is in Managua Lake surroundings and allows to
suppose the existence of N-S fault. The clockwise movement is also identified in Gulf of Fonseca
27
and on NI-CR border. The set of lateral displacements observed may correspond to the differences
in the interaction of the Cocos-Caribbean Plates. Clockwise rotation movements are slow,
sequential and differential.
The study of the main faults and alignments allows to determine, in a schematic way, the
kinematics that affect them. Some cases are shown in figure 4. We emphasize that, in general,
trans current kinematics prevails under a trans-compressional framework due to the action of the
Caribbean-Cocos-Northamerican Plates. Similar models and figures have been presented by other
specialists for the entire CA.
Other aspect of our analysis is reelected with the Apoyeque volcano. We consider it has a
high potential to cause a natural disaster in Managua City. Our rationale idea is by comparison with
the Mount Santa Helens Volcano (U.S.A.), which was dormant for many years. Santa Helens
Stratovolcano (h2.539 m) has a very high threat potential as demonstrated by the activity of
18.05.1980.
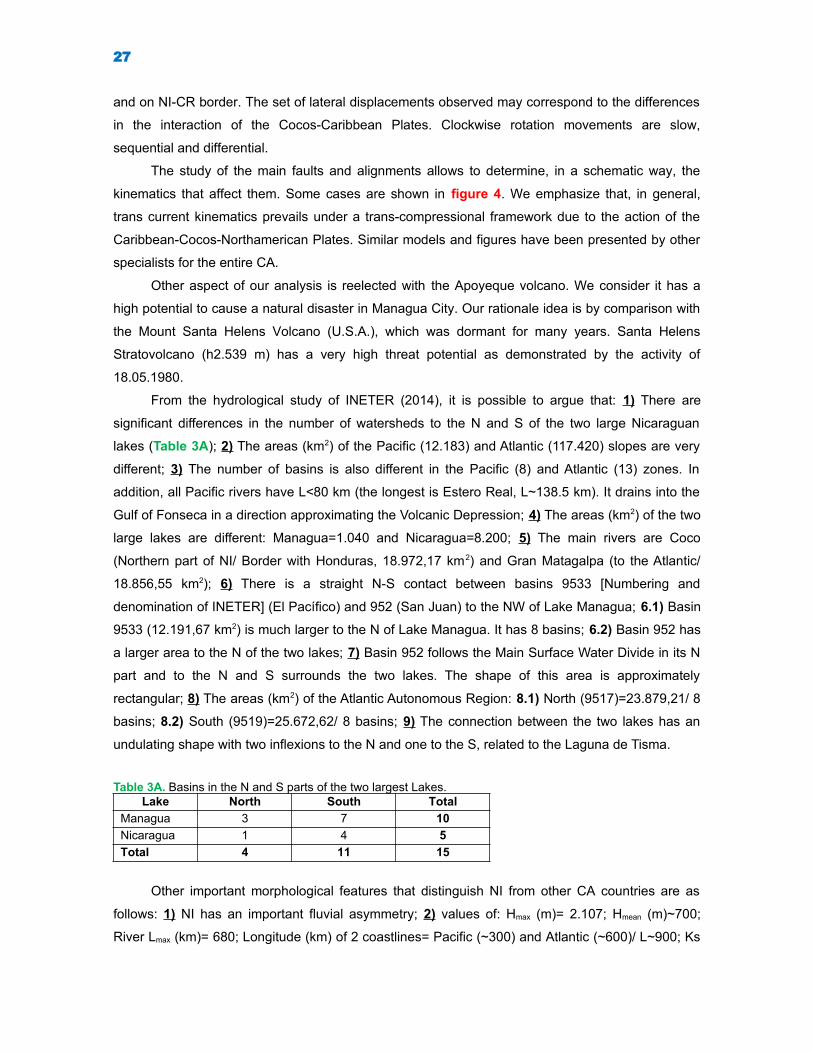
From the hydrological study of INETER (2014), it is possible to argue that: 1) There are
significant differences in the number of watersheds to the N and S of the two large Nicaraguan
lakes (Table 3A); 2) The areas (km2) of the Pacific (12.183) and Atlantic (117.420) slopes are very
different; 3) The number of basins is also different in the Pacific (8) and Atlantic (13) zones. In
addition, all Pacific rivers have L<80 km (the longest is Estero Real, L~138.5 km). It drains into the
Gulf of Fonseca in a direction approximating the Volcanic Depression; 4) The areas (km2) of the two
large lakes are different: Managua=1.040 and Nicaragua=8.200; 5) The main rivers are Coco
(Northern part of NI/ Border with Honduras, 18.972,17 km2) and Gran Matagalpa (to the Atlantic/
18.856,55 km2); 6) There is a straight N-S contact between basins 9533 [Numbering and
denomination of INETER] (El Pacífico) and 952 (San Juan) to the NW of Lake Managua; 6.1) Basin
9533 (12.191,67 km2) is much larger to the N of Lake Managua. It has 8 basins; 6.2) Basin 952 has
a larger area to the N of the two lakes; 7) Basin 952 follows the Main Surface Water Divide in its N
part and to the N and S surrounds the two lakes. The shape of this area is approximately
rectangular; 8) The areas (km2) of the Atlantic Autonomous Region: 8.1) North (9517)=23.879,21/ 8
basins; 8.2) South (9519)=25.672,62/ 8 basins; 9) The connection between the two lakes has an
undulating shape with two inflexions to the N and one to the S, related to the Laguna de Tisma.
Table 3A. Basins in the N and S parts of the two largest Lakes.Lake North South Total
Managua 3 7 10
Nicaragua 1 4 5
Total 4 11 15
Other important morphological features that distinguish NI from other CA countries are as
follows: 1) NI has an important fluvial asymmetry; 2) values of: Hmax (m)= 2.107; Hmean (m)~700;
River Lmax (km)= 680; Longitude (km) of 2 coastlines= Pacific (~300) and Atlantic (~600)/ L~900; Ks
28
of the main superficial water divider=0,81; 6) there is a set of inland water bodies subjected to
neotectonic deformations within the Volcanic Depression; 7) there are three spatially well
differentiated types of relief (volcanic, plains and mountainous) but integrated on the Caribbean
Plate; 8) the average distances (km) between the Pacific coastline and the southern lakes are
different: 8.1) Managua ~30; 8.2) Nicaragua <20.
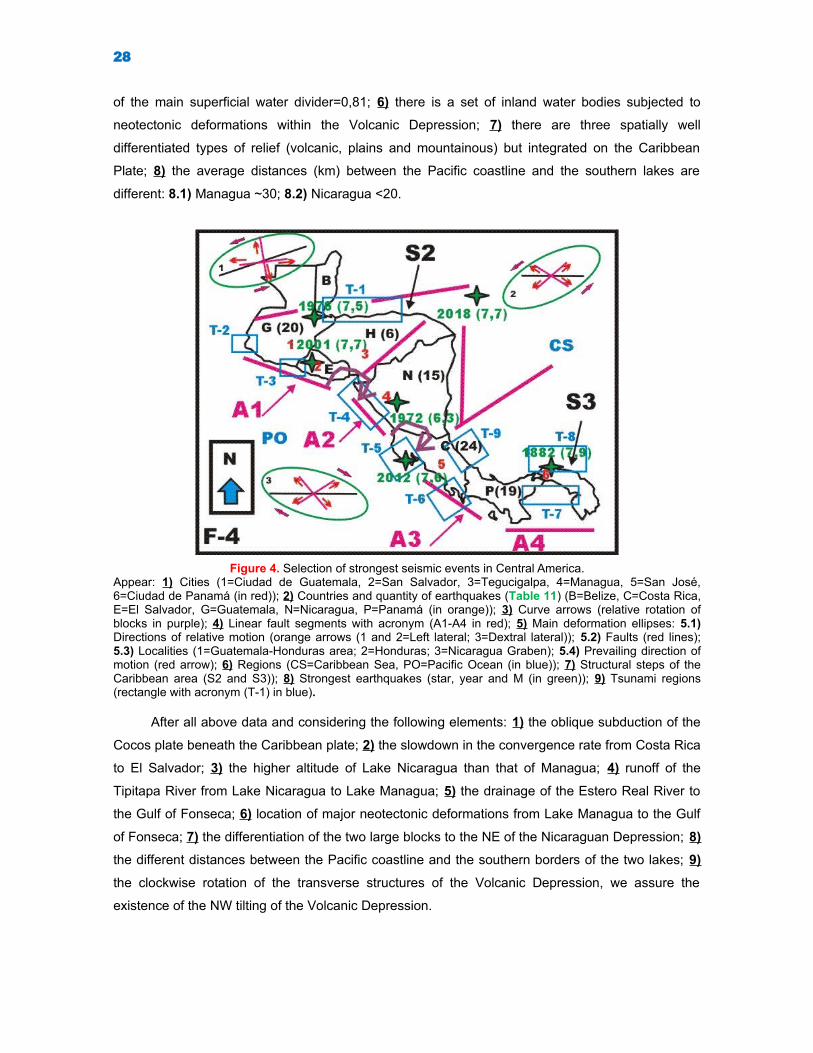
Figure 4. Selection of strongest seismic events in Central America.Appear: 1) Cities (1=Ciudad de Guatemala, 2=San Salvador, 3=Tegucigalpa, 4=Managua, 5=San José,6=Ciudad de Panamá (in red)); 2) Countries and quantity of earthquakes (Table 11) (B=Belize, C=Costa Rica,E=El Salvador, G=Guatemala, N=Nicaragua, P=Panamá (in orange)); 3) Curve arrows (relative rotation ofblocks in purple); 4) Linear fault segments with acronym (A1-A4 in red); 5) Main deformation ellipses: 5.1)Directions of relative motion (orange arrows (1 and 2=Left lateral; 3=Dextral lateral)); 5.2) Faults (red lines);5.3) Localities (1=Guatemala-Honduras area; 2=Honduras; 3=Nicaragua Graben); 5.4) Prevailing direction ofmotion (red arrow); 6) Regions (CS=Caribbean Sea, PO=Pacific Ocean (in blue)); 7) Structural steps of theCaribbean area (S2 and S3)); 8) Strongest earthquakes (star, year and M (in green)); 9) Tsunami regions(rectangle with acronym (T-1) in blue).
After all above data and considering the following elements: 1) the oblique subduction of the
Cocos plate beneath the Caribbean plate; 2) the slowdown in the convergence rate from Costa Rica
to El Salvador; 3) the higher altitude of Lake Nicaragua than that of Managua; 4) runoff of the
Tipitapa River from Lake Nicaragua to Lake Managua; 5) the drainage of the Estero Real River to
the Gulf of Fonseca; 6) location of major neotectonic deformations from Lake Managua to the Gulf
of Fonseca; 7) the differentiation of the two large blocks to the NE of the Nicaraguan Depression; 8)
the different distances between the Pacific coastline and the southern borders of the two lakes; 9)
the clockwise rotation of the transverse structures of the Volcanic Depression, we assure the
existence of the NW tilting of the Volcanic Depression.

29
2-SEISMICITY
“No aplicado, de nada sirve el saber”.Pedro Calderón de la Barca (España, 1600-1681)

30
2-SEISMICITY
An extensive list of references has been used for the development of this section (Álvarez,
2021; Álvarez et al., 2018; Ambraseys and Adams, 1996, 2001; Arce et al., 1998; Barquero, 1990;
Benito, 2008; Bergoing and Protti, 2009; Brown Jr. et al., 1973; Burbach and Frohlich, 1986;
Burbach et al., 1984; Burkart and Self, 1985; Byrne et al., 1993; Calix-Matute, 2011; CAPRA, 2008;
Chacón-Barrantes, 2015; Cheal and Stewart, 1982; Chuy (1984); Cruz, 1999; DeMets, 2001;
Dewey and Algermissen, 1974; Dewey et al., 1975; Durham, 1931; Fernández, 2002; Figueroa,
1970; French et al., 2010; Frez and Gámez, 2008; Hansen and Chávez, 1972; Ide et al., 1994;
INETER; IRIS; ISC; Kanamori and Kikuchi, 1993; LaFemina et al., 2004; Langer et al., 1974; Leeds,
1974; Martínez, 1993; Martínez-Díaz et al., 2004; Molina et al., 2009; Montero and Peraldo, 2004;
Monterroso and Kulhánek, 2003; NOAA, 1982; Peraldo-Huertas et al. (2006); Pindell and Kennan,
2001; Plafker and Brown Jr., 1975; Protti et al., 1995; Rojas et al., 1993; Rubí-Tellez, 2006;
Strauch, 2005; Sultán, 1931; Tanner and Shepherd, 1997; Tunner et al., 2007; UNESCO, 2018;
USGS; von Huene et al., 2000; Ward et al., 1974; White, 1991; White and Harlow, 1993; World
Stress Map, 2016; Ye et al., 2013). It is known that USGS catalog indicates that in CA (1973-2000)
19 earthquakes occurred (M>7,0). Most of the recorded S-A is shallow (<50 km) and is located in
subduction zone and Volcanic Chain. The seismicity at CA has, a very important, spatial
relationship with the largest number of human settlements (Examples: 1) NI (earthquake of 1972/
M6,2/ Managua); 2) CR (earthquake of 1910/ M6,4/ Cartago; 1973/ M6,5/ Tilaían; 1990/ M6,0/
Piriscal; 2012/ M7,9) (Figure 4). Also: 1) CR-Panama had ~14 earthquakes (fourteen with M>7,0),
and that in the Central American-Caribbean region (not CR or Panama) there are few earthquakes.
This implies the existence of a regime of neutral strengths; 1.1) this figure shows two
morphotectonic elements of relevance in CA (the two steps of the Caribbean and the four linear
modifications of the Pacific relief); 2) figures 5A and 6, and tables 4-11 illustrate the framework of
contemporary S-A and main tectonics in CA-Caribbean and NI; 3) the seismicity of NI has four
types of seismogenic sources (Subduction Zone (~90%/ Mmax7,7), Fore-arch Zone (M5,0), Volcanic
Arc Zone (M6,0), and Trans-arc Zone (M4-5)). They are located as quasi parallel bands.
Table 4. First information about earthquakes in Central America.
Early earthquakes
Country Date/ Locality Some earthquakes/ DeathsES 1524/ San Salvador 1902.09.15/ 400; 1917.06.7/ 1.050; 1951.05.6/ 400; 1986.10.10/ 1.500;
2001.01.13/ 944; 2001.02.13/ 300= ~4.600H 1539.11.24/ Cabo Higueras 1539/ <100NI 1609/ Volcán Momotombo 1931.03.31/ 2.500; 1951.08.2/ 1.000; 1972.12.2/ 20.000= ~14.000

31
Table 5. Summary of the approximate numbers of significant earthquakes and deaths.Earthquakes (Century)
Country XVI XVII XVIII XIX XX XXI Total DeathsNI 1 - 1 7 1 2 12 ~24.000ES 1 3 - 9 13 5 31 >4.000H 2 5 9 13 12 13 54 ~100
Total 4 8 10 29 26 20 97 >50.000
Table 6. Selection of earthquakes in America with more than a thousand deaths.Nº Date M Deaths Country Nº Date M Deaths Country1 2010.01.12 7,0 300.000 Haiti 6 1906.04.17 7,9-8,6 ~3.000 U.S.A.2 1970.05.31 7,9 50.000 Peru 7 1986.10.10 5,7 1.500 ES3 1939.01.24 7,8 30.000 Chile 8 1999.01.25 6,2 1.230 Colombia4 1976.02.4 7,5 23.000 Guatemala 9 1973.08.28 7,3 1.200 Mexico5 1985.09.19 8,1 3.150 Mexico
Table 7. Earthquakes of America (M>8,4) recorded by U.S.G.S.Country (Locality) Date/ Time M/ h (km) Coordinates
Chile (Bio-Bio/ Valdivia) 1960.05.22/ 19:11 9,5/ 35 38,44 S 73,41 WU.S.A. (Alaska) 1964.03.27/ 3:36 9,2/ 23 61,02 N 147,65 WEcuador-Colombia 1906.01.31/ 15:36 8,8/ 25 9,6 N 79,37 WChile (Atacama) 1922.11.11/ 4:33 8,5/ 120 28,295 S 69,85 WPeru (Arequipa) 2001.06.23/ 20:33 8,4/ 33 16,27 S 73,64 W
Table 8. Selection of strong earthquakes (instrumental stage) in the region of study.Country Date M/ h(km)/
I (MM)Characteristics Country Date M/ h(km)/ I
(MM)Characteristics
ES 1902.09.15 8,1/ 25/9 Tsunami/ 400 deaths H 2009.05.28 7,3/ 10 / - 1915.09.7 7,7/ 60/9 Salcoatitlán/ 5 deaths 2004.10.9 7,0/ 35/ -1982.06.19 7,3/ 73/7 The whole country/ 9 deaths NI 1992.09.2 7,4/ 44,8/ - Tsunami/ 116-178 deaths
H 1856.08.4 7,5/ -/ - 16,0 N 88,0 W 2014.04.10 7,3/ 10/ - León-Managua/ 2 deaths1910.01.1 7,5/ 60/ - 17,0 N 85,0 W 1972.12.23 6,2/ 5/ 8-9 3.000-10.000 deaths2016.06.9 7,5/ 10/ - 17,483 N 83,520W 1931.03.1 6,0/ 5/ - 1.500 deaths
Table 9. Recent earthquakes that significantly affected Central America.Date M/ h(km) Affected people (Countries)
1982.06.13 7,3/ 80 9 deaths/ 56 injured/ 5.000 affected (Mexico-CR)2001.01.13 7,7/ 60 827 deaths/ 4.000 injured (Guatemala-ES-H-NI)
.02.13 6,6/ 10 315 deaths/ 3.400 injured (Guatemala-ES-H-NI)2009.05.16 7,3/ 10 7 deaths (Guatemala-H-NI (Caribbean Sea))
.11.26 5,9/ 56,8 (ES-Guatemala)2012.11.7 7,4/ 24 44 deaths (Guatemala and the coast of Pacific Ocean)2014.04.10 7,3/ 10 2 deaths/ 40 injured (ES-NI)
Total ~1.300 deaths/ ~8.000 injured/ ~20.000 affected
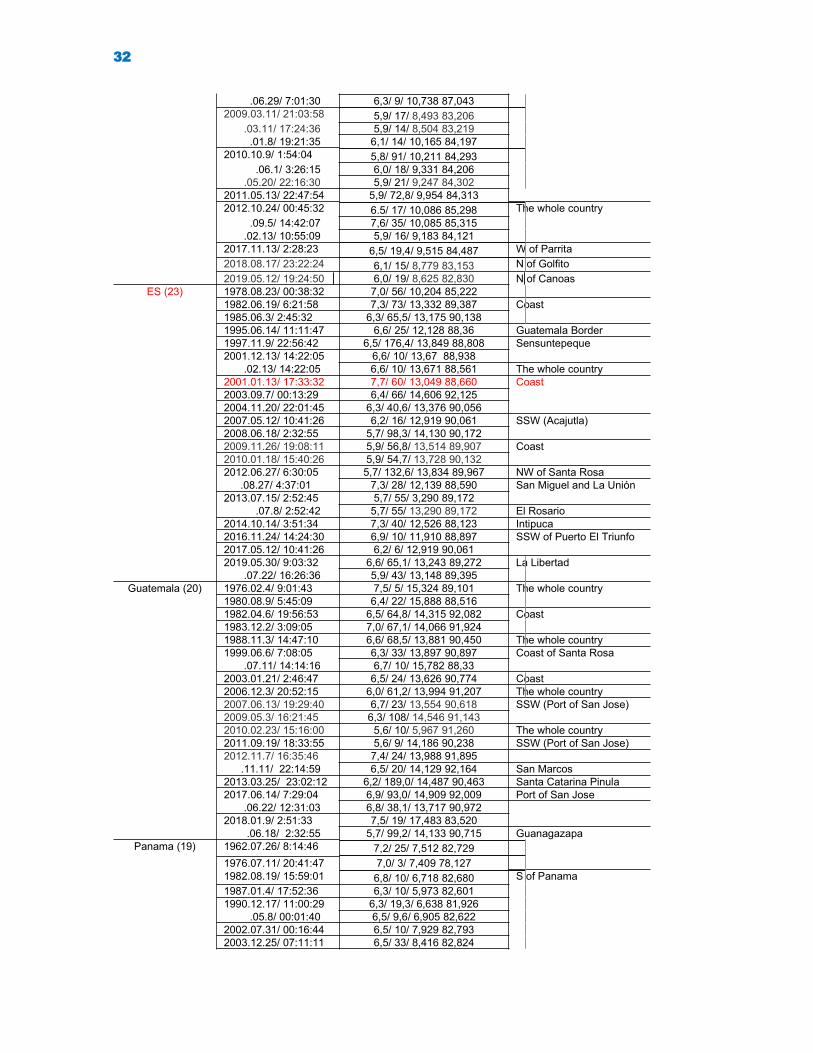
Table 10. Selection of U.S.G.S. earthquakes (periods: 1950-1990 and 2000-2019).Country (total) Date/ Time M/ h(km)/ Coordinates (N W) Site
CR (24) 1950.10.5/ 16:09:42 7,5/ 97,9/ 10,481 85,046 Coast
1973.04.14/ 08:34:00 6,5/ 33/ 10,679 84,759 Tilarán
1983.07.3/ 17:14:23 6,5/ 33/ 9,652 83,688 The whole country.04.3/ 2:50:01 7,1/ 37/ 8,717 83,123
1990.04.28/ 1:23:11 6,4/ 22,7/ 8,887 83,500.03.25/ 13:22:55 7,3/ 22,2/ 9,919 84,808
1991.04.22/ 21:56:31 7,6/ 10/ 9,685 83,0732000.07.21/ 1:53:35 6,4/ 33/ 9,416 85,329 Coast
2002.06.16/ 2:46:14 6,4/ 35/ 8,784 83,992 The whole country
2004.11.20/ 8:07:22 6,4/ 16/ 9,602 84,172 Coast
32
.06.29/ 7:01:30 6,3/ 9/ 10,738 87,0432009.03.11/ 21:03:58 5,9/ 17/ 8,493 83,206
.03.11/ 17:24:36 5,9/ 14/ 8,504 83,219.01.8/ 19:21:35 6,1/ 14/ 10,165 84,197
2010.10.9/ 1:54:04 5,8/ 91/ 10,211 84,293.06.1/ 3:26:15 6,0/ 18/ 9,331 84,206
.05.20/ 22:16:30 5,9/ 21/ 9,247 84,3022011.05.13/ 22:47:54 5,9/ 72,8/ 9,954 84,3132012.10.24/ 00:45:32 6.5/ 17/ 10,086 85,298 The whole country
.09.5/ 14:42:07 7,6/ 35/ 10,085 85,315.02.13/ 10:55:09 5,9/ 16/ 9,183 84,121
2017.11.13/ 2:28:23 6,5/ 19,4/ 9,515 84,487 W of Parrita
2018.08.17/ 23:22:24 6,1/ 15/ 8,779 83,153 N of Golfito
2019.05.12/ 19:24:50 6,0/ 19/ 8,625 82,830 N of CanoasES (23) 1978.08.23/ 00:38:32 7,0/ 56/ 10,204 85,222
1982.06.19/ 6:21:58 7,3/ 73/ 13,332 89,387 Coast1985.06.3/ 2:45:32 6,3/ 65,5/ 13,175 90,1381995.06.14/ 11:11:47 6,6/ 25/ 12,128 88,36 Guatemala Border1997.11.9/ 22:56:42 6,5/ 176,4/ 13,849 88,808 Sensuntepeque2001.12.13/ 14:22:05 6,6/ 10/ 13,67 88,938
.02.13/ 14:22:05 6,6/ 10/ 13,671 88,561 The whole country2001.01.13/ 17:33:32 7,7/ 60/ 13,049 88,660 Coast2003.09.7/ 00:13:29 6,4/ 66/ 14,606 92,1252004.11.20/ 22:01:45 6,3/ 40,6/ 13,376 90,0562007.05.12/ 10:41:26 6,2/ 16/ 12,919 90,061 SSW (Acajutla)2008.06.18/ 2:32:55 5,7/ 98,3/ 14,130 90,1722009.11.26/ 19:08:11 5,9/ 56,8/ 13,514 89,907 Coast2010.01.18/ 15:40:26 5,9/ 54,7/ 13,728 90,1322012.06.27/ 6:30:05 5,7/ 132,6/ 13,834 89,967 NW of Santa Rosa
.08.27/ 4:37:01 7,3/ 28/ 12,139 88,590 San Miguel and La Unión2013.07.15/ 2:52:45 5,7/ 55/ 3,290 89,172
.07.8/ 2:52:42 5,7/ 55/ 13,290 89,172 El Rosario2014.10.14/ 3:51:34 7,3/ 40/ 12,526 88,123 Intipuca2016.11.24/ 14:24:30 6,9/ 10/ 11,910 88,897 SSW of Puerto El Triunfo2017.05.12/ 10:41:26 6,2/ 6/ 12,919 90,0612019.05.30/ 9:03:32 6,6/ 65,1/ 13,243 89,272 La Libertad
.07.22/ 16:26:36 5,9/ 43/ 13,148 89,395Guatemala (20) 1976.02.4/ 9:01:43 7,5/ 5/ 15,324 89,101 The whole country
1980.08.9/ 5:45:09 6,4/ 22/ 15,888 88,5161982.04.6/ 19:56:53 6,5/ 64,8/ 14,315 92,082 Coast1983.12.2/ 3:09:05 7,0/ 67,1/ 14,066 91,9241988.11.3/ 14:47:10 6,6/ 68,5/ 13,881 90,450 The whole country1999.06.6/ 7:08:05 6,3/ 33/ 13,897 90,897 Coast of Santa Rosa
.07.11/ 14:14:16 6,7/ 10/ 15,782 88,332003.01.21/ 2:46:47 6,5/ 24/ 13,626 90,774 Coast2006.12.3/ 20:52:15 6,0/ 61,2/ 13,994 91,207 The whole country2007.06.13/ 19:29:40 6,7/ 23/ 13,554 90,618 SSW (Port of San Jose)2009.05.3/ 16:21:45 6,3/ 108/ 14,546 91,1432010.02.23/ 15:16:00 5,6/ 10/ 5,967 91,260 The whole country2011.09.19/ 18:33:55 5,6/ 9/ 14,186 90,238 SSW (Port of San Jose)2012.11.7/ 16:35:46 7,4/ 24/ 13,988 91,895
.11.11/ 22:14:59 6,5/ 20/ 14,129 92,164 San Marcos2013.03.25/ 23:02:12 6,2/ 189,0/ 14,487 90,463 Santa Catarina Pinula2017.06.14/ 7:29:04 6,9/ 93,0/ 14,909 92,009 Port of San Jose
.06.22/ 12:31:03 6,8/ 38,1/ 13,717 90,9722018.01.9/ 2:51:33 7,5/ 19/ 17,483 83,520
.06.18/ 2:32:55 5,7/ 99,2/ 14,133 90,715 GuanagazapaPanama (19) 1962.07.26/ 8:14:46 7,2/ 25/ 7,512 82,729
1976.07.11/ 20:41:47 7,0/ 3/ 7,409 78,1271982.08.19/ 15:59:01 6,8/ 10/ 6,718 82,680 S of Panama
1987.01.4/ 17:52:36 6,3/ 10/ 5,973 82,6011990.12.17/ 11:00:29 6,3/ 19,3/ 6,638 81,926
.05.8/ 00:01:40 6,5/ 9,6/ 6,905 82,6222002.07.31/ 00:16:44 6,5/ 10/ 7,929 82,7932003.12.25/ 07:11:11 6,5/ 33/ 8,416 82,824
33
2005.05.5/ 19:12:21 6,5/ 18/ 5,710 82,8452012.06.4/ 3:15:24 6,3/ 7/ 5,508 82,563
.06.4/ 00:45:15 6,3/ 7/ 5,305 82,629.05.30/ 00:45:15 6,3/ 7/ 5,305 82,692
2009.07.6/ 4:10:38 5,3/ 61,2/ 9,582 78,979.7/ 6:49:35 6,1/ 38/ 9,590 78,966
.03.12/ 23:23:34 6,3/ 9/ 5,686 82,7672014.12.8/ 8:54:52 6,6/ 20/ 7,940 82,687 ESE of Punta de Burica
.05.13/ 6:35:24 6,5/ 10/ 7,210 82,305 SE of Punta de Burica
.03.02/ 9:37:54 6,3/ 60/ 12,556 87,6882019.06.26/ 05:23:51 6,2/ 32,6/ 8,461 82,754
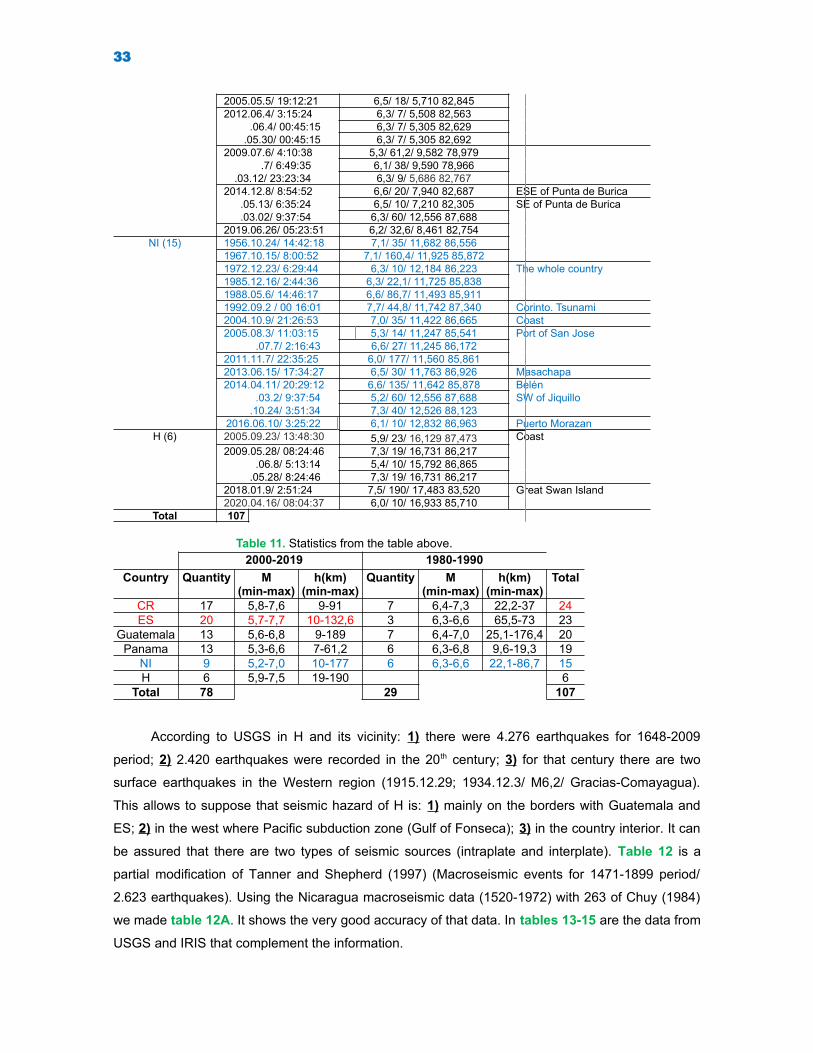
NI (15) 1956.10.24/ 14:42:18 7,1/ 35/ 11,682 86,5561967.10.15/ 8:00:52 7,1/ 160,4/ 11,925 85,8721972.12.23/ 6:29:44 6,3/ 10/ 12,184 86,223 The whole country1985.12.16/ 2:44:36 6,3/ 22,1/ 11,725 85,8381988.05.6/ 14:46:17 6,6/ 86,7/ 11,493 85,9111992.09.2 / 00 16:01 7,7/ 44,8/ 11,742 87,340 Corinto. Tsunami2004.10.9/ 21:26:53 7,0/ 35/ 11,422 86,665 Coast2005.08.3/ 11:03:15 5,3/ 14/ 11,247 85,541 Port of San Jose
.07.7/ 2:16:43 6,6/ 27/ 11,245 86,1722011.11.7/ 22:35:25 6,0/ 177/ 11,560 85,8612013.06.15/ 17:34:27 6,5/ 30/ 11,763 86,926 Masachapa2014.04.11/ 20:29:12 6,6/ 135/ 11,642 85,878 Belén
.03.2/ 9:37:54 5,2/ 60/ 12,556 87,688 SW of Jiquillo.10.24/ 3:51:34 7,3/ 40/ 12,526 88,123
2016.06.10/ 3:25:22 6,1/ 10/ 12,832 86,963 Puerto MorazanH (6) 2005.09.23/ 13:48:30 5,9/ 23/ 16,129 87,473 Coast
2009.05.28/ 08:24:46 7,3/ 19/ 16,731 86,217.06.8/ 5:13:14 5,4/ 10/ 15,792 86,865
.05.28/ 8:24:46 7,3/ 19/ 16,731 86,2172018.01.9/ 2:51:24 7,5/ 190/ 17,483 83,520 Great Swan Island2020.04.16/ 08:04:37 6,0/ 10/ 16,933 85,710
Total 107
Table 11. Statistics from the table above.2000-2019 1980-1990
Country Quantity M (min-max)
h(km) (min-max)
Quantity M (min-max)
h(km) (min-max)
Total
CR 17 5,8-7,6 9-91 7 6,4-7,3 22,2-37 24ES 20 5,7-7,7 10-132,6 3 6,3-6,6 65,5-73 23
Guatemala 13 5,6-6,8 9-189 7 6,4-7,0 25,1-176,4 20Panama 13 5,3-6,6 7-61,2 6 6,3-6,8 9,6-19,3 19
NI 9 5,2-7,0 10-177 6 6,3-6,6 22,1-86,7 15H 6 5,9-7,5 19-190 6
Total 78 29 107
According to USGS in H and its vicinity: 1) there were 4.276 earthquakes for 1648-2009
period; 2) 2.420 earthquakes were recorded in the 20th century; 3) for that century there are two
surface earthquakes in the Western region (1915.12.29; 1934.12.3/ M6,2/ Gracias-Comayagua).
This allows to suppose that seismic hazard of H is: 1) mainly on the borders with Guatemala and
ES; 2) in the west where Pacific subduction zone (Gulf of Fonseca); 3) in the country interior. It can
be assured that there are two types of seismic sources (intraplate and interplate). Table 12 is a
partial modification of Tanner and Shepherd (1997) (Macroseismic events for 1471-1899 period/
2.623 earthquakes). Using the Nicaragua macroseismic data (1520-1972) with 263 of Chuy (1984)
we made table 12A. It shows the very good accuracy of that data. In tables 13-15 are the data from
USGS and IRIS that complement the information.
34
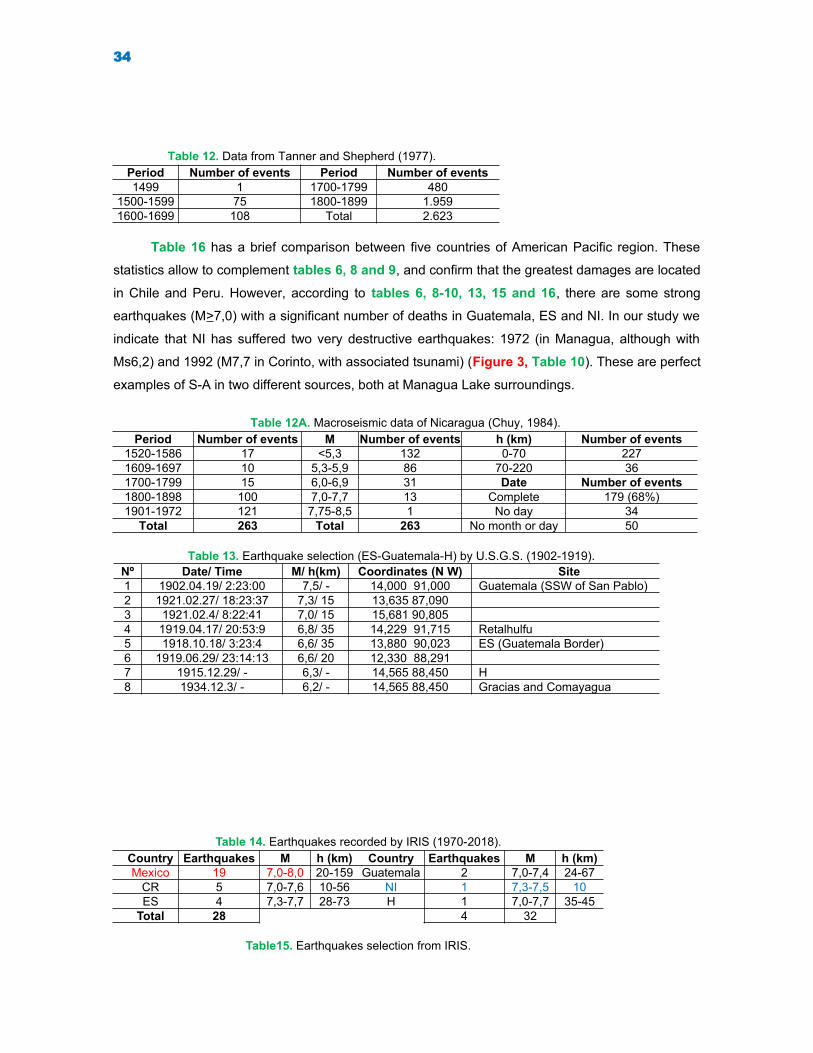
Table 12. Data from Tanner and Shepherd (1977).Period Number of events Period Number of events1499 1 1700-1799 480
1500-1599 75 1800-1899 1.9591600-1699 108 Total 2.623
Table 16 has a brief comparison between five countries of American Pacific region. These
statistics allow to complement tables 6, 8 and 9, and confirm that the greatest damages are located
in Chile and Peru. However, according to tables 6, 8-10, 13, 15 and 16, there are some strong
earthquakes (M>7,0) with a significant number of deaths in Guatemala, ES and NI. In our study we
indicate that NI has suffered two very destructive earthquakes: 1972 (in Managua, although with
Ms6,2) and 1992 (M7,7 in Corinto, with associated tsunami) (Figure 3, Table 10). These are perfect
examples of S-A in two different sources, both at Managua Lake surroundings.
Table 12A. Macroseismic data of Nicaragua (Chuy, 1984).Period Number of events M Number of events h (km) Number of events
1520-1586 17 <5,3 132 0-70 2271609-1697 10 5,3-5,9 86 70-220 361700-1799 15 6,0-6,9 31 Date Number of events1800-1898 100 7,0-7,7 13 Complete 179 (68%)1901-1972 121 7,75-8,5 1 No day 34
Total 263 Total 263 No month or day 50
Table 13. Earthquake selection (ES-Guatemala-H) by U.S.G.S. (1902-1919).Nº Date/ Time M/ h(km) Coordinates (N W) Site1 1902.04.19/ 2:23:00 7,5/ - 14,000 91,000 Guatemala (SSW of San Pablo)2 1921.02.27/ 18:23:37 7,3/ 15 13,635 87,0903 1921.02.4/ 8:22:41 7,0/ 15 15,681 90,8054 1919.04.17/ 20:53:9 6,8/ 35 14,229 91,715 Retalhulfu5 1918.10.18/ 3:23:4 6,6/ 35 13,880 90,023 ES (Guatemala Border)6 1919.06.29/ 23:14:13 6,6/ 20 12,330 88,2917 1915.12.29/ - 6,3/ - 14,565 88,450 H8 1934.12.3/ - 6,2/ - 14,565 88,450 Gracias and Comayagua
Table 14. Earthquakes recorded by IRIS (1970-2018).Country Earthquakes M h (km) Country Earthquakes M h (km)Mexico 19 7,0-8,0 20-159 Guatemala 2 7,0-7,4 24-67
CR 5 7,0-7,6 10-56 NI 1 7,3-7,5 10ES 4 7,3-7,7 28-73 H 1 7,0-7,7 35-45
Total 28 4 32
Table15. Earthquakes selection from IRIS.
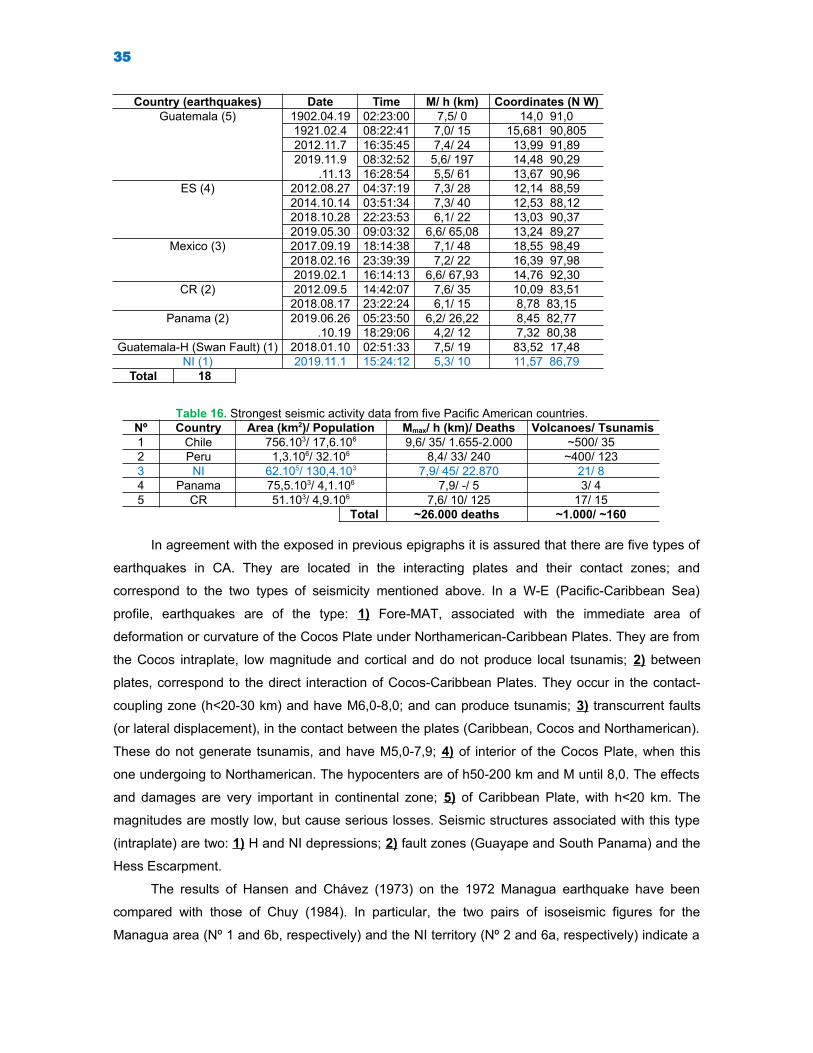
35
Country (earthquakes) Date Time M/ h (km) Coordinates (N W)Guatemala (5) 1902.04.19 02:23:00 7,5/ 0 14,0 91,0
1921.02.4 08:22:41 7,0/ 15 15,681 90,805 2012.11.7 16:35:45 7,4/ 24 13,99 91,892019.11.9 08:32:52 5,6/ 197 14,48 90,29
.11.13 16:28:54 5,5/ 61 13,67 90,96ES (4) 2012.08.27 04:37:19 7,3/ 28 12,14 88,59
2014.10.14 03:51:34 7,3/ 40 12,53 88,122018.10.28 22:23:53 6,1/ 22 13,03 90,372019.05.30 09:03:32 6,6/ 65,08 13,24 89,27
Mexico (3) 2017.09.19 18:14:38 7,1/ 48 18,55 98,492018.02.16 23:39:39 7,2/ 22 16,39 97,982019.02.1 16:14:13 6,6/ 67,93 14,76 92,30
CR (2) 2012.09.5 14:42:07 7,6/ 35 10,09 83,512018.08.17 23:22:24 6,1/ 15 8,78 83,15
Panama (2) 2019.06.26 05:23:50 6,2/ 26,22 8,45 82,77.10.19 18:29:06 4,2/ 12 7,32 80,38
Guatemala-H (Swan Fault) (1) 2018.01.10 02:51:33 7,5/ 19 83,52 17,48NI (1) 2019.11.1 15:24:12 5,3/ 10 11,57 86,79
Total 18
Table 16. Strongest seismic activity data from five Pacific American countries.Nº Country Area (km2)/ Population Mmax/ h (km)/ Deaths Volcanoes/ Tsunamis1 Chile 756.103/ 17,6.106 9,6/ 35/ 1.655-2.000 ~500/ 352 Peru 1,3.106/ 32.106 8,4/ 33/ 240 ~400/ 1233 NI 62.105/ 130,4.103 7,9/ 45/ 22.870 21/ 84 Panama 75,5.103/ 4,1.106 7,9/ -/ 5 3/ 45 CR 51.103/ 4,9.106 7,6/ 10/ 125 17/ 15
Total ~26.000 deaths ~1.000/ ~160
In agreement with the exposed in previous epigraphs it is assured that there are five types of
earthquakes in CA. They are located in the interacting plates and their contact zones; and
correspond to the two types of seismicity mentioned above. In a W-E (Pacific-Caribbean Sea)
profile, earthquakes are of the type: 1) Fore-MAT, associated with the immediate area of
deformation or curvature of the Cocos Plate under Northamerican-Caribbean Plates. They are from
the Cocos intraplate, low magnitude and cortical and do not produce local tsunamis; 2) between
plates, correspond to the direct interaction of Cocos-Caribbean Plates. They occur in the contact-
coupling zone (h<20-30 km) and have M6,0-8,0; and can produce tsunamis; 3) transcurrent faults
(or lateral displacement), in the contact between the plates (Caribbean, Cocos and Northamerican).
These do not generate tsunamis, and have M5,0-7,9; 4) of interior of the Cocos Plate, when this
one undergoing to Northamerican. The hypocenters are of h50-200 km and M until 8,0. The effects
and damages are very important in continental zone; 5) of Caribbean Plate, with h<20 km. The
magnitudes are mostly low, but cause serious losses. Seismic structures associated with this type
(intraplate) are two: 1) H and NI depressions; 2) fault zones (Guayape and South Panama) and the
Hess Escarpment.
The results of Hansen and Chávez (1973) on the 1972 Managua earthquake have been
compared with those of Chuy (1984). In particular, the two pairs of isoseismic figures for the
Managua area (Nº 1 and 6b, respectively) and the NI territory (Nº 2 and 6a, respectively) indicate a
36
very acceptable coincidence. We consider that the general figure of the Nicaraguan isoseismals
indicates two axes perpendicular to each other. One of them is quite well adjusted to the
Nicaraguan Depression and the other is of greater extension.
Tsunami threats in CA: 1) are associated with the regions: 1.1) of Pacific Ocean (the highest
level); 1.2) of Caribbean Sea; 2) for 1539-2001 period were 50 in total (10 of them are from Pacific
Ocean and Caribbean Sea (13)). In the Pacific there are two tsunamigenic segments: 1)
Guatemala-NI; 2) the central part of CR; while for Caribbean two other: 1) Gulf of Honduras; 2)
coast of CR-Panama. There is another segment in Mexico (California-Puerto Vallarta and Puerto
Vallarta-Guatemala). Table 17 has the summary statistics of these reports. Most of tsunamis have
produced waves with h<1 m and the largest were those of NI 1992 with 10 m waves and
approximately 500 deaths. Figure 4 shows that local tsunami areas are segmented and well
differentiated.
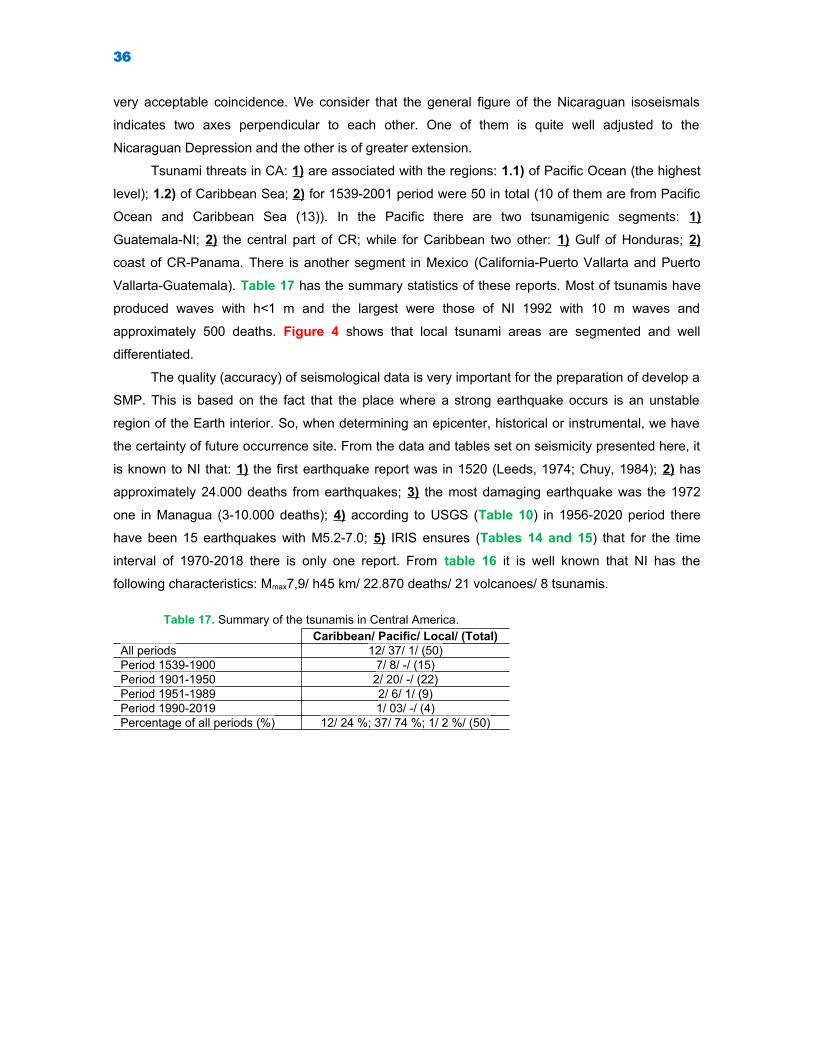
The quality (accuracy) of seismological data is very important for the preparation of develop a
SMP. This is based on the fact that the place where a strong earthquake occurs is an unstable
region of the Earth interior. So, when determining an epicenter, historical or instrumental, we have
the certainty of future occurrence site. From the data and tables set on seismicity presented here, it
is known to NI that: 1) the first earthquake report was in 1520 (Leeds, 1974; Chuy, 1984); 2) has
approximately 24.000 deaths from earthquakes; 3) the most damaging earthquake was the 1972
one in Managua (3-10.000 deaths); 4) according to USGS (Table 10) in 1956-2020 period there
have been 15 earthquakes with M5.2-7.0; 5) IRIS ensures (Tables 14 and 15) that for the time
interval of 1970-2018 there is only one report. From table 16 it is well known that NI has the
following characteristics: Mmax7,9/ h45 km/ 22.870 deaths/ 21 volcanoes/ 8 tsunamis.
Table 17. Summary of the tsunamis in Central America.Caribbean/ Pacific/ Local/ (Total)
All periods 12/ 37/ 1/ (50)Period 1539-1900 7/ 8/ -/ (15)Period 1901-1950 2/ 20/ -/ (22)Period 1951-1989 2/ 6/ 1/ (9)Period 1990-2019 1/ 03/ -/ (4)Percentage of all periods (%) 12/ 24 %; 37/ 74 %; 1/ 2 %/ (50)
37
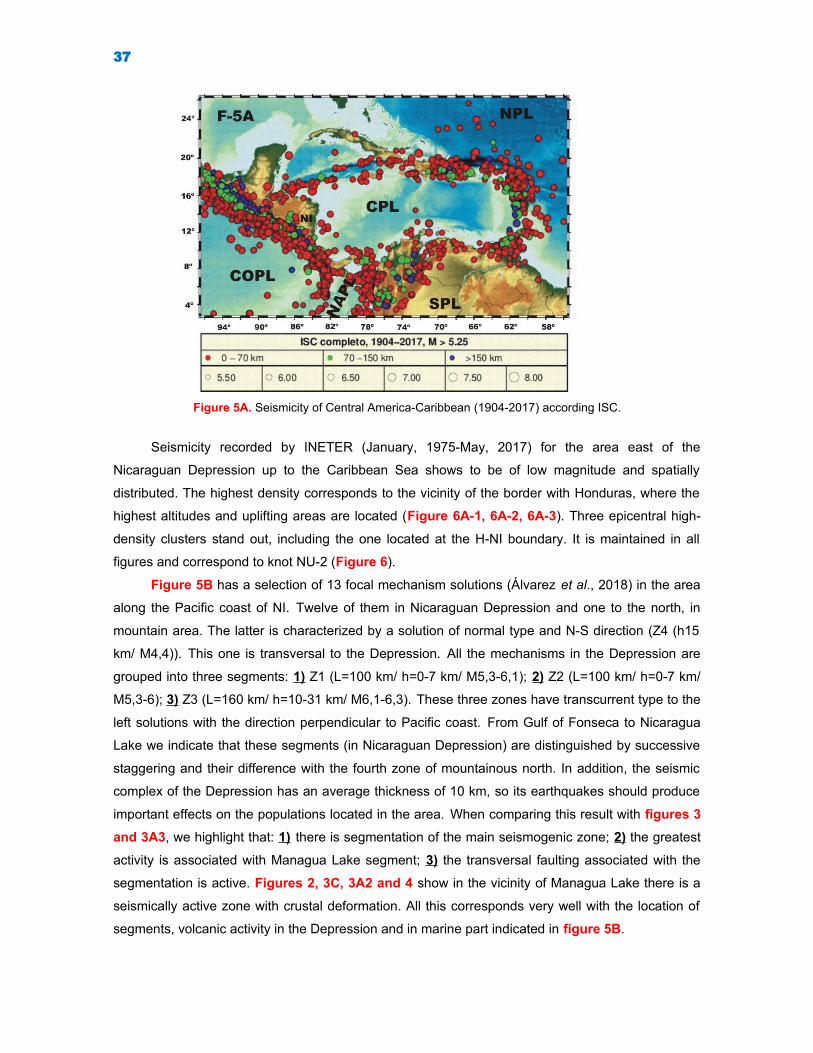
Figure 5A. Seismicity of Central America-Caribbean (1904-2017) according ISC.
Seismicity recorded by INETER (January, 1975-May, 2017) for the area east of the
Nicaraguan Depression up to the Caribbean Sea shows to be of low magnitude and spatially
distributed. The highest density corresponds to the vicinity of the border with Honduras, where the
highest altitudes and uplifting areas are located (Figure 6A-1, 6A-2, 6A-3). Three epicentral high-
density clusters stand out, including the one located at the H-NI boundary. It is maintained in all
figures and correspond to knot NU-2 (Figure 6).
Figure 5B has a selection of 13 focal mechanism solutions (Álvarez et al., 2018) in the area
along the Pacific coast of NI. Twelve of them in Nicaraguan Depression and one to the north, in
mountain area. The latter is characterized by a solution of normal type and N-S direction (Z4 (h15
km/ M4,4)). This one is transversal to the Depression. All the mechanisms in the Depression are
grouped into three segments: 1) Z1 (L=100 km/ h=0-7 km/ M5,3-6,1); 2) Z2 (L=100 km/ h=0-7 km/
M5,3-6); 3) Z3 (L=160 km/ h=10-31 km/ M6,1-6,3). These three zones have transcurrent type to the
left solutions with the direction perpendicular to Pacific coast. From Gulf of Fonseca to Nicaragua
Lake we indicate that these segments (in Nicaraguan Depression) are distinguished by successive
staggering and their difference with the fourth zone of mountainous north. In addition, the seismic
complex of the Depression has an average thickness of 10 km, so its earthquakes should produce
important effects on the populations located in the area. When comparing this result with figures 3
and 3A3, we highlight that: 1) there is segmentation of the main seismogenic zone; 2) the greatest
activity is associated with Managua Lake segment; 3) the transversal faulting associated with the
segmentation is active. Figures 2, 3C, 3A2 and 4 show in the vicinity of Managua Lake there is a
seismically active zone with crustal deformation. All this corresponds very well with the location of
segments, volcanic activity in the Depression and in marine part indicated in figure 5B.
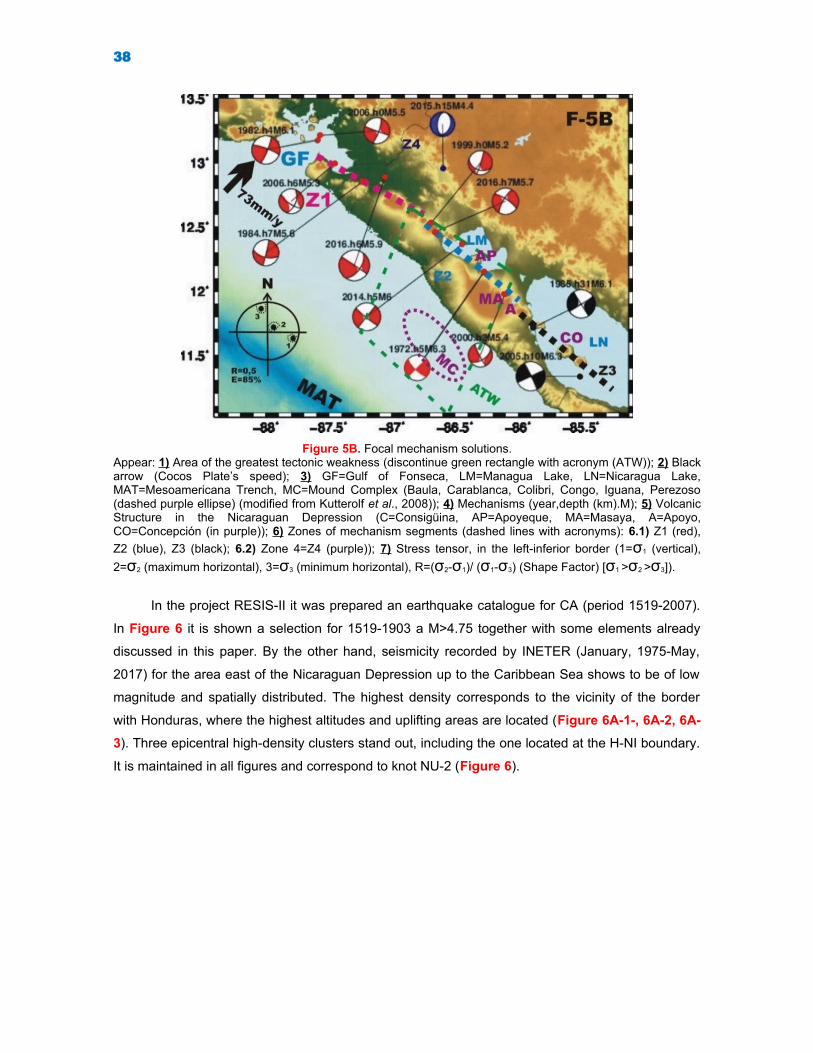
38
Figure 5B. Focal mechanism solutions.Appear: 1) Area of the greatest tectonic weakness (discontinue green rectangle with acronym (ATW)); 2) Blackarrow (Cocos Plate’s speed); 3) GF=Gulf of Fonseca, LM=Managua Lake, LN=Nicaragua Lake,MAT=Mesoamericana Trench, MC=Mound Complex (Baula, Carablanca, Colibri, Congo, Iguana, Perezoso(dashed purple ellipse) (modified from Kutterolf et al., 2008)); 4) Mechanisms (year,depth (km).M); 5) VolcanicStructure in the Nicaraguan Depression (C=Consigüina, AP=Apoyeque, MA=Masaya, A=Apoyo,CO=Concepción (in purple)); 6) Zones of mechanism segments (dashed lines with acronyms): 6.1) Z1 (red),
Z2 (blue), Z3 (black); 6.2) Zone 4=Z4 (purple)); 7) Stress tensor, in the left-inferior border (1=σ1 (vertical),
2=σ2 (maximum horizontal), 3=σ3 (minimum horizontal), R=(σ2-σ1)/ (σ1-σ3) (Shape Factor) [σ1 >σ2 >σ3]).
In the project RESIS-II it was prepared an earthquake catalogue for CA (period 1519-2007).
In Figure 6 it is shown a selection for 1519-1903 a M>4.75 together with some elements already
discussed in this paper. By the other hand, seismicity recorded by INETER (January, 1975-May,
2017) for the area east of the Nicaraguan Depression up to the Caribbean Sea shows to be of low
magnitude and spatially distributed. The highest density corresponds to the vicinity of the border
with Honduras, where the highest altitudes and uplifting areas are located (Figure 6A-1-, 6A-2, 6A-
3). Three epicentral high-density clusters stand out, including the one located at the H-NI boundary.
It is maintained in all figures and correspond to knot NU-2 (Figure 6).
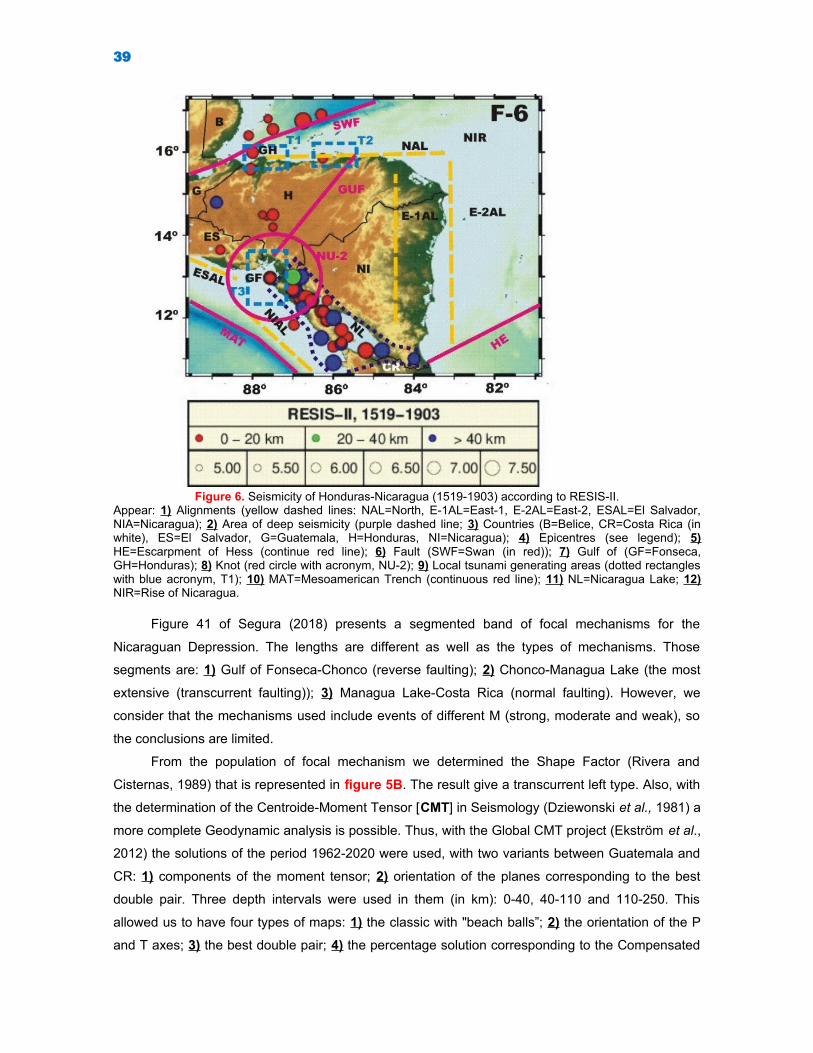
39
Figure 6. Seismicity of Honduras-Nicaragua (1519-1903) according to RESIS-II.Appear: 1) Alignments (yellow dashed lines: NAL=North, E-1AL=East-1, E-2AL=East-2, ESAL=El Salvador,NIA=Nicaragua); 2) Area of deep seismicity (purple dashed line; 3) Countries (B=Belice, CR=Costa Rica (inwhite), ES=El Salvador, G=Guatemala, H=Honduras, NI=Nicaragua); 4) Epicentres (see legend); 5)HE=Escarpment of Hess (continue red line); 6) Fault (SWF=Swan (in red)); 7) Gulf of (GF=Fonseca,GH=Honduras); 8) Knot (red circle with acronym, NU-2); 9) Local tsunami generating areas (dotted rectangleswith blue acronym, T1); 10) MAT=Mesoamerican Trench (continuous red line); 11) NL=Nicaragua Lake; 12)NIR=Rise of Nicaragua.
Figure 41 of Segura (2018) presents a segmented band of focal mechanisms for the
Nicaraguan Depression. The lengths are different as well as the types of mechanisms. Those
segments are: 1) Gulf of Fonseca-Chonco (reverse faulting); 2) Chonco-Managua Lake (the most
extensive (transcurrent faulting)); 3) Managua Lake-Costa Rica (normal faulting). However, we
consider that the mechanisms used include events of different M (strong, moderate and weak), so
the conclusions are limited.
From the population of focal mechanism we determined the Shape Factor (Rivera and
Cisternas, 1989) that is represented in figure 5B. The result give a transcurrent left type. Also, with
the determination of the Centroide-Moment Tensor [CMT] in Seismology (Dziewonski et al., 1981) a
more complete Geodynamic analysis is possible. Thus, with the Global CMT project (Ekström et al.,
2012) the solutions of the period 1962-2020 were used, with two variants between Guatemala and
CR: 1) components of the moment tensor; 2) orientation of the planes corresponding to the best
double pair. Three depth intervals were used in them (in km): 0-40, 40-110 and 110-250. This
allowed us to have four types of maps: 1) the classic with "beach balls”; 2) the orientation of the P
and T axes; 3) the best double pair; 4) the percentage solution corresponding to the Compensated

40
Linear Vectorial Dipole [CLVD]. For the calculation of the latter, the program "mopad" was used
(Krieger and Heimann, 2012). The sequence of figures 7A-C can be considered as a photographic
sequence of the lateral movement to the east where you can see the introduction of the Cocos
Plate under the Caribbean. That space-time distribution of earthquakes confirms for CA: 1) a first-
order seismotectonic alignment; 2) the active seismic differentiation of the segments.
Figure 6A-1. Seismicity from Nicaragua network, INETER (January, 1975-May, 2019).Appear: 1) CR=Costa Rica, CS=Caribbean Sea, ES=El Salvador, H=Honduras, MAT=Mesoamerican Trench,PO=Pacific Ocean; 2) Yellow circle=Epicentral high density area. They are applied to figures 6A-2 and 6A-3.
Figure 7B shows the case of depth interval [40, 110) km, which coincides with the [110-250)
(Figure 7C). It can be seen that: 1) the number of earthquakes decreases in the sequence; 2) there
are no strong earthquakes outside a narrow strip corresponding to subduction. The few
intermediate earthquakes are in the Chortis Block and the Caribbean. These must have erroneous
values of the depth; 3) the P and T axes have a preferential dip of 30°-60°, indicating the almost
vertical orientation of the subducting plate (Cocos); 4) increases the proportion of cases with high %
CLVD.
There are other significant differences between figures 7A-C that support research on
morphotectonics: 1) the S-A up to the limit of NI-CR is maintained, but from there to the south
disappears; 2) the depth profile of the Cocos-Caribbean subduction zone, from the above
mentioned sector, disappears in the range 110-250 km. The latter is located where there is a very
important change in the types of mechanisms from the vicinity of the NI-CR border.
We consider that it is interesting to analyze the results of World Stress Map Project (WSM,
2016) for our region (Figures 8 and 8A). We highlight: 1) that rectilinear alignment of

41
determinations (red colors), on the American side, is relevant for the Pacific in two segments:
Mexico and CA; 2) complexity determined in two PTTs, north and south of CA, is evident; 3) few
determinations inside Cocos and Caribbean Plates; 4) this data corresponds to that of the figures
5A and 6.
Figure 6A-2. Seismicity from Nicaragua network, INETER (January, 1975-May, 2019).Its is indicated a N-S alignment of epicentres (red discontinue ellipse).
Figure 6A-3. Seismicity from Nicaragua network, INETER (January, 1975-May, 2019). The epicentral alignment of the Hess Escarpment has been indicated (red discontinue ellipse).
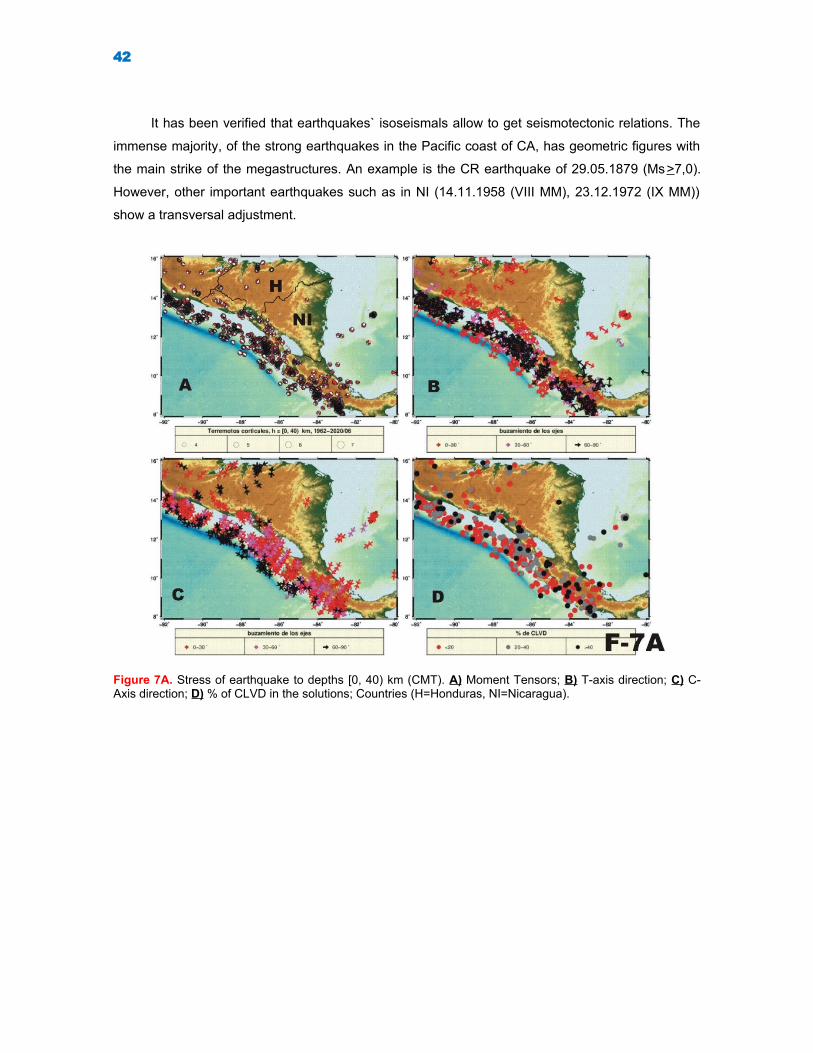
42
It has been verified that earthquakes` isoseismals allow to get seismotectonic relations. The
immense majority, of the strong earthquakes in the Pacific coast of CA, has geometric figures with
the main strike of the megastructures. An example is the CR earthquake of 29.05.1879 (Ms>7,0).
However, other important earthquakes such as in NI (14.11.1958 (VIII MM), 23.12.1972 (IX MM))
show a transversal adjustment.
Figure 7A. Stress of earthquake to depths [0, 40) km (CMT). A) Moment Tensors; B) T-axis direction; C) C-Axis direction; D) % of CLVD in the solutions; Countries (H=Honduras, NI=Nicaragua).

43
Figure 7B. Stress of earthquake to depths [40, 110) km (CMT). A-B-C-D=as in figure 7A.
Figure 7C. Stress of earthquake to depths [110, 250) km (CMT).Appear: 1) A-B-C-D=as in figure 7A; 2) A-AV=Fore volcanic arc, CPL=Caribbean Plate, COPL=Cocos Plate,HE=Hess Escarpment, VA=Volcanic Arc.

44
Figure 8. Legend of World Stress Map, 2016.
Figure 8A. Part of World Stress Map, 2016.Appear: 1) MDZ=Main Deformation Zone (orange discontinuous rectangle); 2) Plates (CPL=Caribbean,COPL=Cocos, NPL=Northamerican, NAPL=Nazca, PPL=Pacific, RPL=Rivera, SPL=Southamerican). Seefigure 8.

45
Macroseismic data

46
“Las ideas no deben ser de nadie”.Antonio Machado Ruiz (España, 1875-Francia, 1939)
Macroseismic data
The use of macroseismic data has two important outcomes. First of all, it allows to estimate
coordinates and magnitudes of pre instrumental earthquakes (or non-recorded in instrumental
period) and second, in case of constructing isoseismal maps it is possible to infer structural
characteristics of the affected region. In NI, first catalog of macroseismic data was prepared by
Leeds (1974) and first isoseimal maps were constructed by several authors after 1972 Managua
earthquakes (Hansen, 1965; Hansen and Chavez, 1973; Algermissen et al., 1974; White and
Harlow, 1993). Later on, Chuy (1984) prepared a revised macroseismic catalogue for NI and
included previous isoseismals maps with intensities converted to MSK-78 scale from original MMI
scale, and other prepared in a joint work IGA-INETER (1981). The compilation of macroseismic
data from earthquakes was continued by INETER from 1999 in advance with publication in some
cases of isoseismals or felt intensities maps (Morales et al., 2000, 2005, 2014). The general
characteristics of published isoseismals’ maps is that isolines were trace by eye fitting, and,
although there are felt intensity data, they were not added to the maps. For the three maps of
Morales et al. (2000) already mentioned there were constructed isoseismal maps by interpolating
contours with the Delaunay triangulation method (Shewchuk, 1996) included in GMT`s software
package (Wessel and Smith, 1998).
When using macroseismic data an important point is the precision of original and processed
data. There are several sources of uncertainty: 1) possible not exact description of observed
effects, 2) expert-dependent intensity evaluations, 3) estimated parameters dependent on the
model used, 4) eye fitting non-univocal isoline plotting. All that made necessary to use
macroseismic results with some care.
In our case, we have eight isoseismal maps from which we can made the following
inferences: 1) earthquakes with epicentres in the zones in the accretion sliver or subduction zone
have elongated isoseismals following NW-SE direction; 2) earthquakes in the Nicaraguan

47
Depression has isoseismals highly attenuated through the SW, and very elongated to the NE. No
other regularities can be deduced from present data taking into account their intrinsic uncertainty.
From published data by Morales et al. already mentioned, it was possible to
construct two isoseismal maps (Figure 9) by interpolation with the Delaunay triangulation method
(Shewchuk, 1996) included in GMT`s software package (Wessel and Smith, 1998).
When using macroseismic data an important point is the precision of original and processed
data. There are several sources of uncertainty: 1) possible not exact description of observed
effects; 2) expert-dependent intensity evaluations; 3) estimated parameters dependent on the
model used; 4) eye fitting non-univocal isoline plotting. All that made necessary to use
macroseismic results with some care.
48
Figure 9. Isoseismal maps of two Nicaraguan earthquakes. Appear: 1) CR=Costa Rica, CS=Caribbean Sea, ES=El Salvador, H=Honduras, PO=Pacific Ocean; 2)Intensities’ data are from Morales et al. (2005, 2014); see legend; 3) Isolines were calculated by Delaunaytriangulation method (Shewchuk,1996).
In our case, we have eight isoseismal maps from which we can made the following
inferences: 1) earthquakes with epicentres in the zones in the accretion sliver or subduction zone
have elongated isoseismals following NW-SE direction; 2) earthquakes in the Nicaraguan
Depression has isoseismals highly attenuated through the SW, and very elongated to the NE. No
other regularities can be deduced from present data taking into account their intrinsic uncertainty.
Also, from the figure 9 we can assure that: 1) the Nicaraguan Depression has high S-A; 2) the focal
mechanism solutions are similar; 3) there are at least two seismogenic sources; 4) active sources
are segmented. The 2005 and 2014 seismic events correspond to segments Z3 and Z2 (Figure
5B), respectively.
49
Isoseismal maps and alignments
50
“La ignorancia es la madre de todos los males”.Francoise Rabelais (Francia, 1494-1553)
Isoseismal maps and alignments
The scientific literature shows several studies on the relationships of the geometric figures,
which result from the intensities produced by earthquakes, with the alignments of the relief
(Medvedev, 1978; Chuy, 1984; Álvarez and Chuy, 1985; Herraiz, 1997). The alignments include
active faults. In our case we use isoseismal maps indicated in table 18. All they belong to
Nicaraguan Depression and its southern boundary. From our interpretation of the maps used, it is
feasible to argue that the seismogenic structures have two preferred strikes. These correspond to
the seismic sources recognized by other specialists.
Table 18. The used data. Date M/ h (km) Author (s) Alignments (main/ secondary)
*31.03.1931
6,0/ 5 The authors SW-NE
14.11.1958 5,8/ 72 Hansen and Chávez (1973); Chuy(1984)
SW-NE/ SE-NW
4.12.1958 -/ 100 Hansen (1965); Chuy (1984) SE-NW
23.05.1961 6,5/ 138 Hansen (1965); Chuy (1984) SE-NW
4.01.1968 4,6/ 5 Algermissen et al. (1974); Chuy (1984) SE-NW/ SW-NE
23.12.1972 6,3/ 10 Hansen and Chávez (1973); Chuy(1984)
SW-NE/ SE-NW
14.10.1981 -/ 15 IGA-INETER (1981); Chuy (1984) SE-NW
10.04.2014 7,3/ 10 Morales et al. (2014) No preference
Note: *The authors developed a seismic intensity perceptibility scheme (see Figure 3).
The study and reinterpretation of the 1931 earthquake data (Chapter XI: Other interesting
earthquake lessons from Nicaragua and New Zealand/ Earthquake at Managua, Nicaragua March
31, 1931-10.19 A.M. (589-595 pp.) of Freeman (1932) and Sultan (1931)) allows us to consider that
this event was processed, for this time, in a very good scientific style. The specialists who
developed it had engineering training and were logically familiar with the 18.04.1906 San Francisco
work (M7,9/ 10.000 deaths). The authors have indicated in bold and underlined fragments of the
original text to highlight important elements for the analysis.
51
From the texts consulted we have: “The City of Managua, was partially destroyed by an
earthquake which occurred at 10:19 a.m., local time, March 31, 1931…Fortunately, the
surveyors of the United States Army Engineers, who were in the immediate vicinity,
obtained unusually complete details of what happened, and took a very important part
in the relief work… this earthquake presents no important threat of danger to the
Nicaraguan Canal as planned…The earthquake at Managua occurred in very recent
volcanic strata, distinct from the older rock formation along the Canal line…This is
estimated to have a cost 1.000 lives, and a property loss of perhaps $15.000.000. The
greatest loss was in the penitentiary, a stone building which happened to stand over
the fault line (Figure 9A)…As illustrating current exaggeration, local had insisted that some
of the cracks were a foot wide, and elevation the elevation of 8 inches…In general, the zone
of the cracks is no more than 500 feet wide, and extends in a northeast-southwest direction
through the western half of the city of Managua, as shown by the preceding map…Damages
naturally were greatest along the fault line, but the zone of severe shocks was of very
small area…In the eastern section of the city, one mile from the fault, the damage was
slight. Apparently the serious disturbance did not extend more than 3 miles (~4,828 km) west
of the fault line…At Granada, 26 miles (~41,843 km) southeastern of Managua, there was no
damage…The same was true at Masaya, 18 miles (~28,968 km) from Managua…
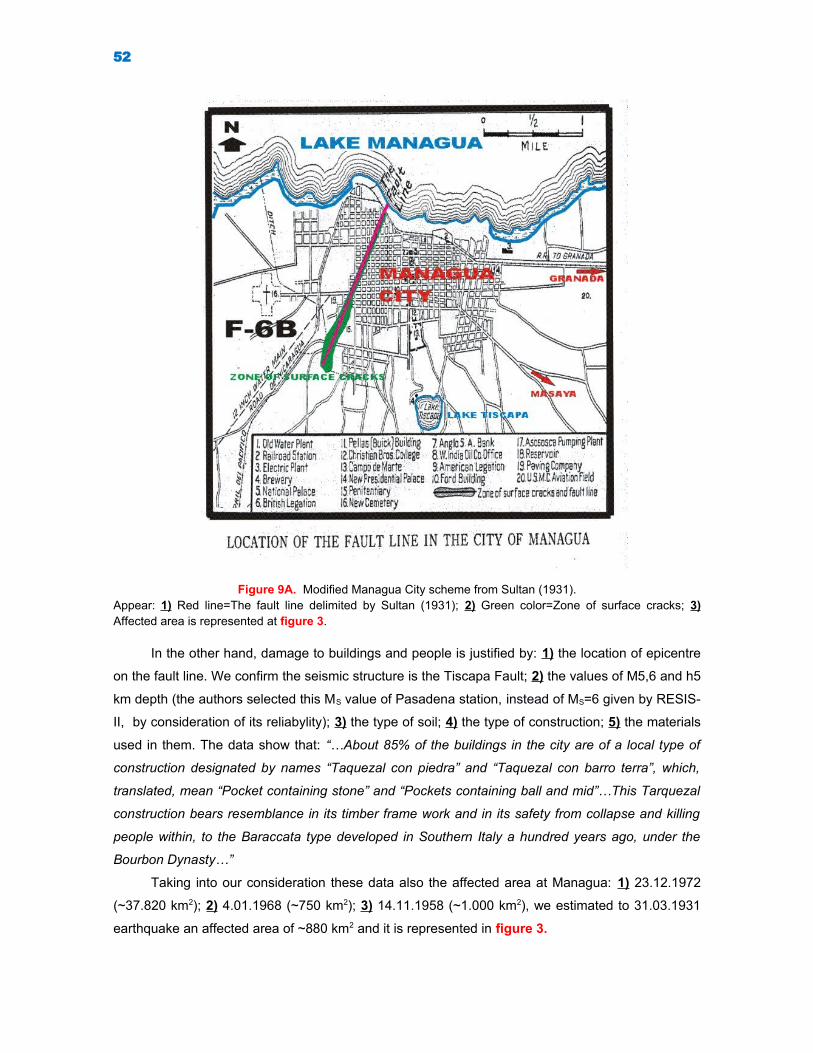
52
Figure 9A. Modified Managua City scheme from Sultan (1931).Appear: 1) Red line=The fault line delimited by Sultan (1931); 2) Green color=Zone of surface cracks; 3)Affected area is represented at figure 3.
In the other hand, damage to buildings and people is justified by: 1) the location of epicentre
on the fault line. We confirm the seismic structure is the Tiscapa Fault; 2) the values of M5,6 and h5
km depth (the authors selected this MS value of Pasadena station, instead of MS=6 given by RESIS-
II, by consideration of its reliabylity); 3) the type of soil; 4) the type of construction; 5) the materials
used in them. The data show that: “…About 85% of the buildings in the city are of a local type of
construction designated by names “Taquezal con piedra” and “Taquezal con barro terra”, which,
translated, mean “Pocket containing stone” and “Pockets containing ball and mid”…This Tarquezal
construction bears resemblance in its timber frame work and in its safety from collapse and killing
people within, to the Baraccata type developed in Southern Italy a hundred years ago, under the
Bourbon Dynasty…”
Taking into our consideration these data also the affected area at Managua: 1) 23.12.1972
(~37.820 km2); 2) 4.01.1968 (~750 km2); 3) 14.11.1958 (~1.000 km2), we estimated to 31.03.1931
earthquake an affected area of ~880 km2 and it is represented in figure 3.

53
54
Special maps and seismicity profiles
“La ignorancia puede ser temporal, la estupidez es para siempre”.Anónimo
Special maps and seismicity profiles
In order to analyze the behavior of earthquake occurrence as a function of recording period
and magnitude, several epicentral maps were prepared. It was used a catalog deveopled for NI
(Alvarez, 2021) for the period 1520-2018, with magnitudes converted to MW. The region covered by
the catalog is formed by a closed polygonal that includes NI, wide oceanic areas of Caribbean and
the Pacific and small parts of neighboring countries of NI. It is seen in the maps 1) the lack of data
55
for non-instrumental period (1520-1899, Figure 10); 2) that the majority of events in this period is
located in continental part, which is in contrast with the first period of instrumental recording (1900-
1950, Figure 11). It can be explained by different factors: 1) the main cities of NI are placed along
the volcanic chain, about 40-50 km from the coast; 2) there are very little historic earthquakes with
enough data for constructing isoseismal maps (Chuy, 1985), and their coordinates have been
associated to points close to the main cities; 3) earthquakes held in ocean, away from coast,
produce lower intensities in the inhabited localities that if they would held on land, and then, the
epicenter could be assigned to points in the interior of NI and their magnitude underestimated; 4)
the improvement of recording quality (1951-1972, Figure 12) is reflected in the increase of the
number of events with depths greater than 40 km. After that data the magnitude threshold of
recording events decreases (1973-1982, Figure 13). Nevertheless, this improvement is reverted in
the next analyzed period (1983-1992, Figure 14), with the closing of Nicaraguan network of seismic
stations because of the war. In this period most of reported events correspond to a bigger
magnitude threshold characteristic of global networks (Figure 15). After that there are two periods:
1) the previous recording level is recovered (1993-2005, Figure 16); 2) the level of detection
increases highly (2006-2018, Figure 17). In the last period, due to densification of Nicaraguan and
some neighboring countries networks, the magnitude detection threshold decreases also (Figure
18).
For the study of depth behavior (h (km)) of earthquake occurrence three profiles were
constructed (Figure 19). The events are projected over a vertical plane indicated by the center lines
that divide the area of profiles in figure. The center of profile is indicated by a star and the beginning
by a diamond. For these profiles were not used the catalog of NI, already mentioned, but the ISC
(2021) bulletin for the period 1900-2018, considered as the best of the global networks for this area.
Profiles’ longitude is 600 km, they cover depth interval 0-300 km y and the search for events is done
to a distance until 100 km from profiles’ planes. Two different magnitude ranges were analyzed
(MW>4 y MW>5). Profile were named as “noroeste”, “centro” and “sureste” for their relative position
in the map. The profiles for both magnitude ranges are presented in the three analyzed cases
(Figures 19.1, 19.2 and 19.3).
Figure 10-18. Seismicity map set
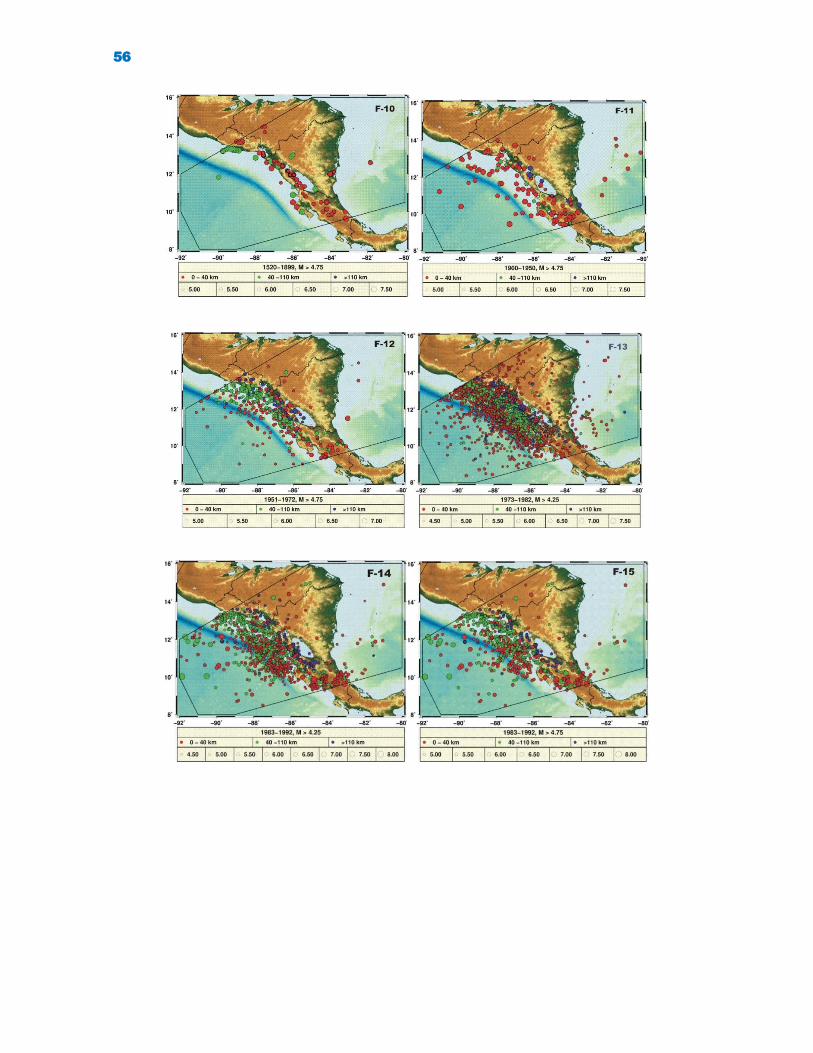
56

57
It is observed that the profiles, for both magnitude ranges follow the same trend with respect
to subduction. They have an inclination of Benioff zone close to vertical, but in the case “noroeste”
the zone is little wider in the upper part. This perhaps indicate the beginning of a transition of
subduction type from very inclined at center and south to a more elongated as moving toward
northwest in Central America (Cotilla et al., 2019). If should be remarked the presence of alignment
of epicenters at depths of 33, 50 y 100 km. This reflects a characteristic of the catalog, because in
the initial stage of instrumental recording these there were fixed and no intermediate values
estimated. Finally, the profiles for MW>4 show bigger dispersion that the corresponding to MW>5,
that reflects the fact that precision of hypocenter determination grows with the increase of
magnitude.
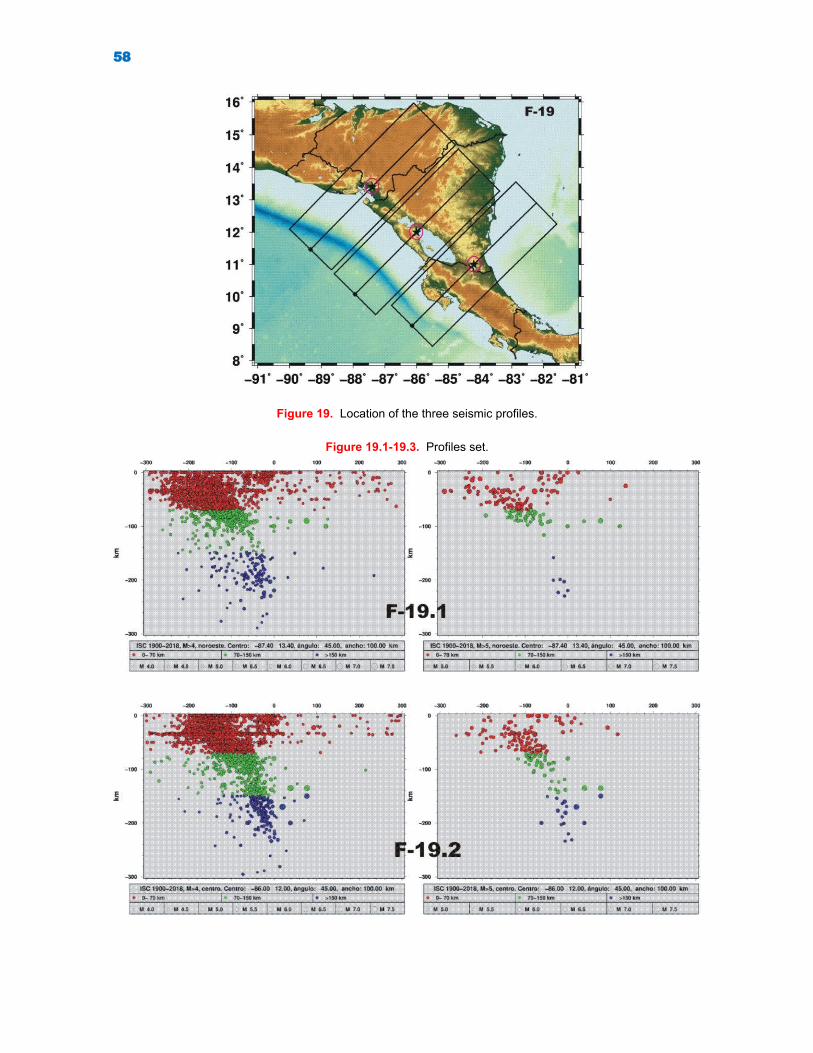
58
Figure 19. Location of the three seismic profiles.
Figure 19.1-19.3. Profiles set.
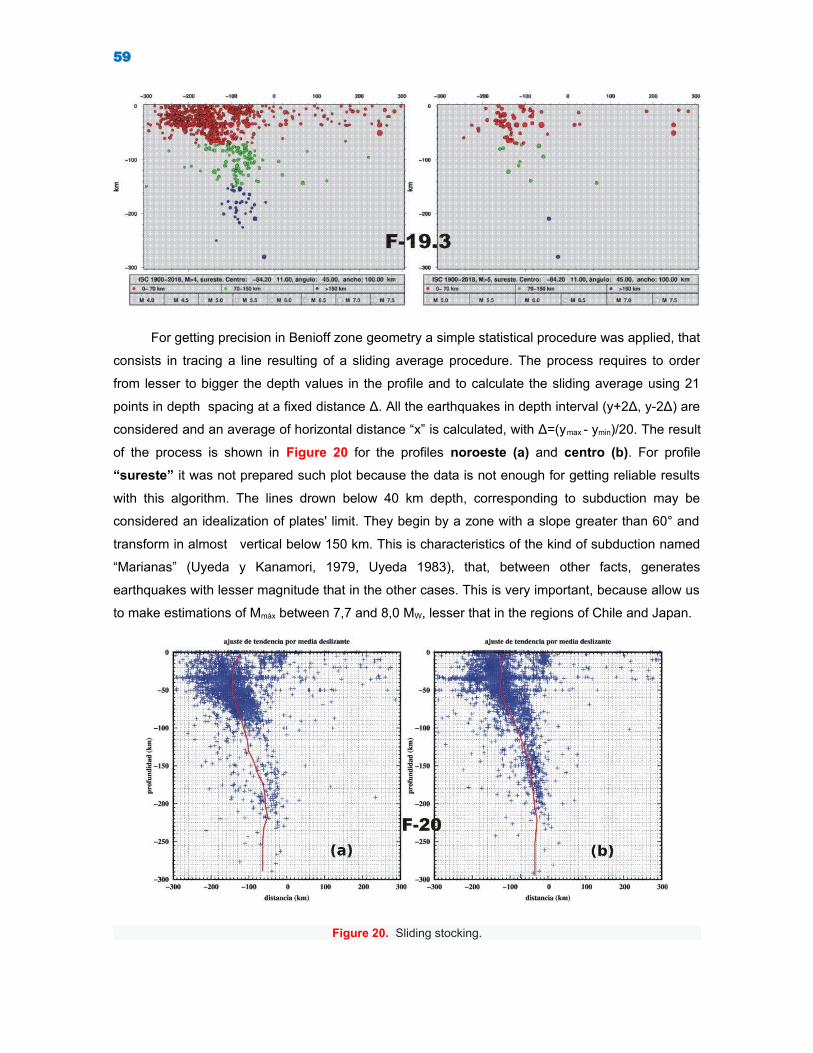
59
For getting precision in Benioff zone geometry a simple statistical procedure was applied, that
consists in tracing a line resulting of a sliding average procedure. The process requires to order
from lesser to bigger the depth values in the profile and to calculate the sliding average using 21
points in depth spacing at a fixed distance Δ. All the earthquakes in depth interval (y+2Δ, y-2Δ) are
considered and an average of horizontal distance “x” is calculated, with Δ=(ymax - ymin)/20. The result
of the process is shown in Figure 20 for the profiles noroeste (a) and centro (b). For profile
“sureste” it was not prepared such plot because the data is not enough for getting reliable results
with this algorithm. The lines drown below 40 km depth, corresponding to subduction may be
considered an idealization of plates' limit. They begin by a zone with a slope greater than 60° and
transform in almost vertical below 150 km. This is characteristics of the kind of subduction named
“Marianas” (Uyeda y Kanamori, 1979, Uyeda 1983), that, between other facts, generates
earthquakes with lesser magnitude that in the other cases. This is very important, because allow us
to make estimations of Mmáx between 7,7 and 8,0 MW, lesser that in the regions of Chile and Japan.
Figure 20. Sliding stocking.

60
Released energy and density maps
“Energía es deleite eterno”.William Blake (Reino Unido, 1757-1827)

61
Released energy and density maps
The Benioff’ zone geometry can be studied by using maps of density of
epicenters. They are prepared by averaging the number of events in areas, more
or less big, around a selected point. It is possible to delineate fault traces, over a
fuzzy seismicity pattern, by applying the following formula in calculating the density
of epicenters:
Dij=(δ N ij+ ∑k= j−m
j+m
∑i=i−m
i+m
N kl)/ [ (2m+1)2+δ ]
Where: Nkl = number of earthquakes in cell (k,l)Dij = density of epicenters in cell (i,j) m = quantity of cells at both sides of each direction used in average δ = 0 or 1 (the second corresponds to double central weight, used to increase the fault trace
contribution)
In order to highlight the fault traces it is calculated in a recurrent procedure, where
better results have been obtained in the 3rd iteration, substituting each time Nkl by the
calculated Dkl in the previous iteration. The algorithm was applied in cells of 0,1° x 0,1°
with m=1. Then there were made 20 maps of density of epicenters using all the data of
catalog NI in depth intervals of 10 km for the range 0-200 km. Each map was processed,
with the help of a GIS (qGIS 2020), by tracing axes that join the maximum values of
density (Figure 21A). The digitized lines were collected in text format and were plot in a
map (Figure 21B). From the last figure is seen that the Benioff zone begin in an inclined
way until 100 km depth and then pass to almost vertical behavior, as was pointed out in
the analysis of depth profiles.
Figures 21A-B. Density of epicenters maps with the axis of maximum value.

62
Other important line for studying the potential of different zones and to
estimating its maximum possible magnitude [Mmax] is the analysis of spatial
behavior of energy release. It requires to use representative events; i.e., those that
belong to intervals (T, M) where, with a high probability, all the held events have
been reported. Then for the study have been selected two temporal intervals:
1900-2018 and 1993-2018. Álvarez (2021) pointed out that for these intervals are
representative the events with M≥5,75 and M≥3,75, respectively. Energy release
maps were developed using the mentioned earthquake catalog of NI, with an
algorithm that sums the released energy in cells of 0,1° x 0,1° with a posterior
averaging with neighboring cells in a 9 cells square. This guaranties smoothing and
the possibility of delineating zones were energy have been released.
In the process they were used three depth intervals: 1) 0-40 km (Figures 22)
where it can be seen that the most of released energy since 1929 correspond to
the beginning of subduction zone. Nevertheless, since 1993 release process
moved to volcanic chain. It is due to events that have magnitudes Mw<6,3 which
contribution is hidden in the map for period since 1929 for the occurrence of higher
magnitudes at the beginning of subduction zone; 2) 40-110 km (Figures 23) where
the main activity moved towards the NW half of plates’ boundary and there is no
difference between both observation periods; 3) 110-250 km (Figures 24) where
there is a contribution in the center of subduction zone, that corresponds to a
MW6,6 event in 2014, coincident in time with shallow earthquakes’ activity in the
western part of Managua Lake.
Figures 22A-B – 24A-B. Mmax set maps.
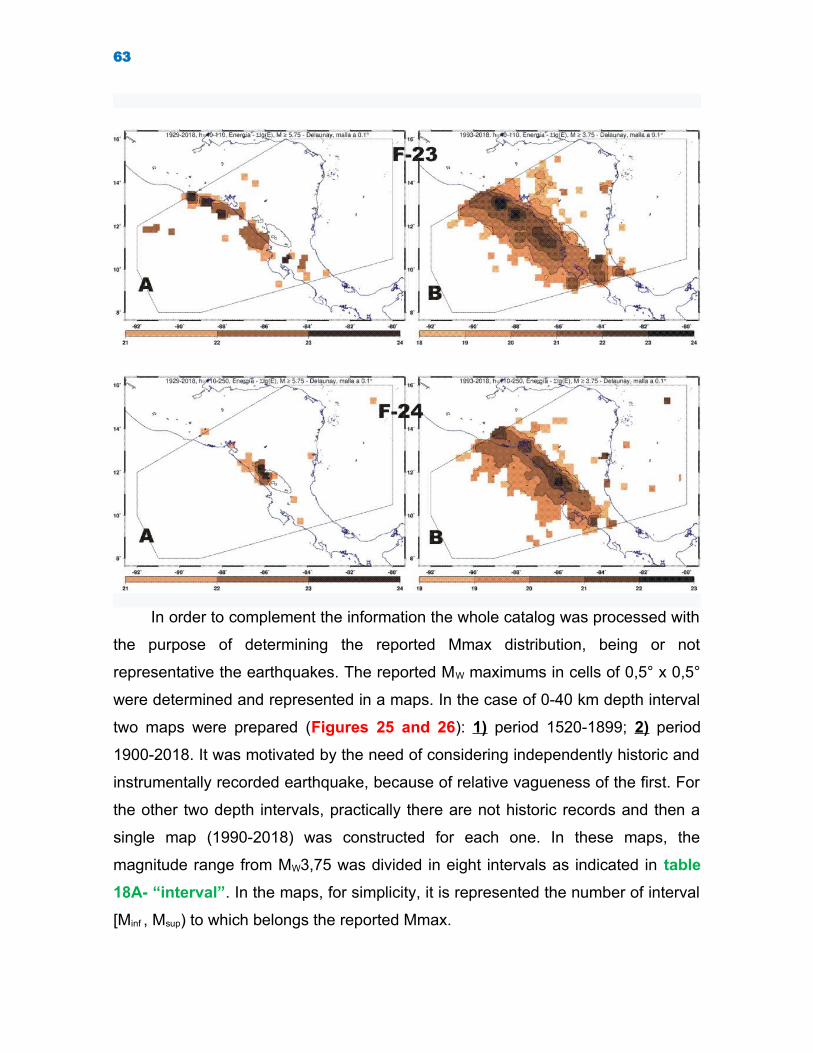
63
In order to complement the information the whole catalog was processed with
the purpose of determining the reported Mmax distribution, being or not
representative the earthquakes. The reported MW maximums in cells of 0,5° x 0,5°
were determined and represented in a maps. In the case of 0-40 km depth interval
two maps were prepared (Figures 25 and 26): 1) period 1520-1899; 2) period
1900-2018. It was motivated by the need of considering independently historic and
instrumentally recorded earthquake, because of relative vagueness of the first. For
the other two depth intervals, practically there are not historic records and then a
single map (1990-2018) was constructed for each one. In these maps, the
magnitude range from MW3,75 was divided in eight intervals as indicated in table
18A- “interval”. In the maps, for simplicity, it is represented the number of interval
[Minf , Msup) to which belongs the reported Mmax.
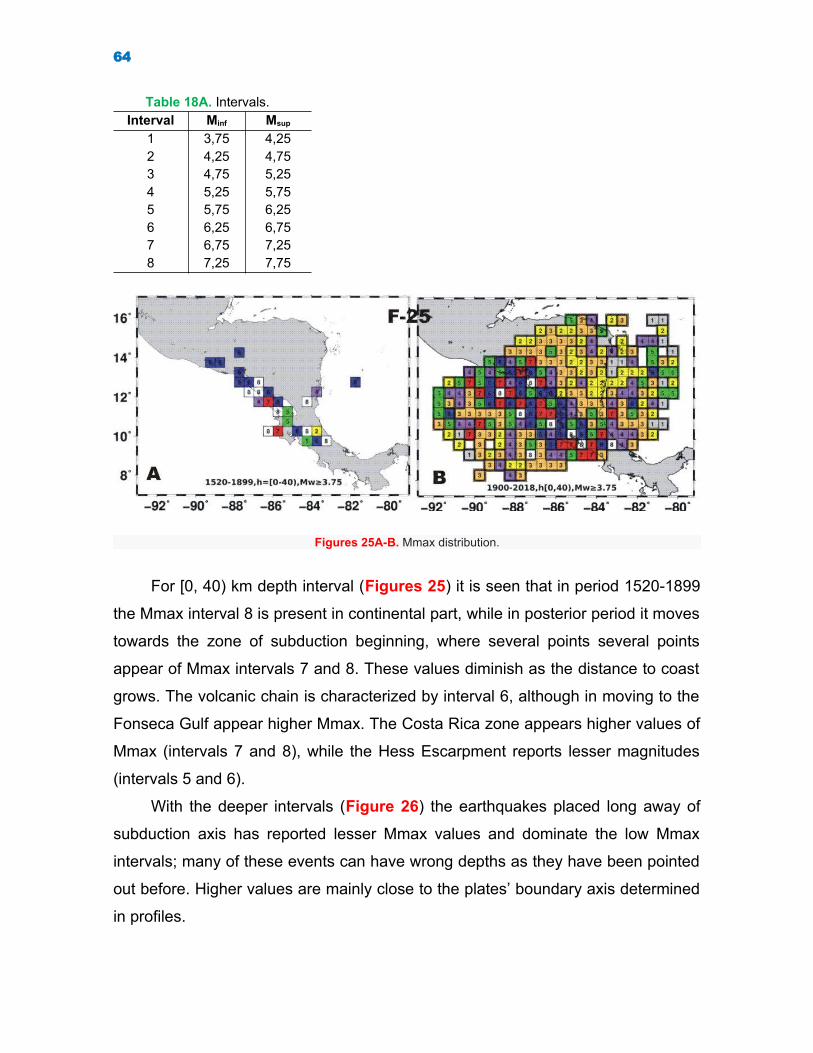
64
Table 18A. Intervals.Interval Minf Msup
1 3,75 4,252 4,25 4,753 4,75 5,254 5,25 5,755 5,75 6,256 6,25 6,757 6,75 7,258 7,25 7,75
Figures 25A-B. Mmax distribution.
For [0, 40) km depth interval (Figures 25) it is seen that in period 1520-1899
the Mmax interval 8 is present in continental part, while in posterior period it moves
towards the zone of subduction beginning, where several points several points
appear of Mmax intervals 7 and 8. These values diminish as the distance to coast
grows. The volcanic chain is characterized by interval 6, although in moving to the
Fonseca Gulf appear higher Mmax. The Costa Rica zone appears higher values of
Mmax (intervals 7 and 8), while the Hess Escarpment reports lesser magnitudes
(intervals 5 and 6).
With the deeper intervals (Figure 26) the earthquakes placed long away of
subduction axis has reported lesser Mmax values and dominate the low Mmax
intervals; many of these events can have wrong depths as they have been pointed
out before. Higher values are mainly close to the plates’ boundary axis determined
in profiles.

65
Figures 26A-B. Mmax distribution.

66
3-MORPHOTECTONIC ANALYSIS
“El que tiene imaginación, con que facilidad saca de la nada unmundo”.
Jorge Mario Pedro Vargas Llosa (Perú, 1936-)

67
3-MORPHOTECTONIC ANALYSIS
Alekseevskaya et al. (1977) developed a deep work of morphotectonics considering the
contributions of other specialists. Later on, Wesnousky and Scholz (1980) made an interesting
research about the tectonic and seismicity interaction for the Northamerican Craton. Among the
elements used was the structural configuration. Cotilla et al. (2017) applied the Russian
methodology, with modifications, to the territory of Mexico in order to get a seismotectectonic
regionalization. Such is the methodology that authors apply in NI. But, we have also taken into
account review of Dengo (1968). That author defined and represented eight morphotectonic units in
CA. Of these we indicate two: 1) the Pacific Volcanic Chain and the Nicaraguan Depression; 2)
Sierras and Volcanic Plains. They are placed according to the interaction of the Cocos-Caribbean
Plates. Figure 1 shows three stages or steps between the Yucatan Peninsula and Panama, of a
graphic morphic “staircase”. This figure maintains approximately the same interval between steps.
On the Pacific Ocean side, the linearity of the “staircase” can be seen. This configuration is
interpreted as a consequence of the plates influence (Cotilla and Udías, 1999). Schematically, for
CA, it is possible to ensure that the main fault and fracture systems are: Guatemala (E-W (northern)
and N-S/ NE, and NW (at Pacific)), H (E-W (northwestern) and N-S/ NE), ES (NW), NI (NW (at
Pacific), CR (NW (at Pacific)). The main alignments defined in Guatemala and H have significant
differences. For H these are: 1) SW-NE (Gulf of Fonseca-northern H)); 2) NW-SE (from Chiapas to
Nicaragua Lake and parallel to the Pacific coast).
Also, taking into consideration what is stated in our previous section -Alignments, fractures
and geometrical arrangement-, it can be added that the geometric figures on the neotectonic
plane of Nicaragua and Managua Lakes, as well as the data on their dimensions, orientation and
position are significantly different, despite being in the Nicaraguan Depression and separated by
only a few kilometers. Both depressed water bodies are areas that are influenced differently by the
Caribbean-Cocos plate interactions. The distances and velocities with respect to the convergence
front are also different, as well as the typically Caribbean trans-arc morphostructures. In the Lake
Managua area there are important neotectonic uplifts and mountain relief, while for Lake Nicaragua
its northern margin is rectilinear and contacts a zone of low altitudes and wide plains. All these
characteristics allow us to argue that both the dynamics and kinematics of both bodies are different,
and correspond to the deformation of the volcano alignment and the strong seismic activity
observed.
The authors have considered these morphotectonic elements and developed a new working
scheme. Our morphotectonic basis include some data as appear in tables 19-22. All they were
developed here for CA. Figures 27 and 27A show the main neotectonic features of ES and CA,
respectively. From another side, Figures 3 and 27 have a significant similarity in regards to the
arrangement of the morphostructural elements. Both figures reflect the Pacific margin tectonics of
NI and ES, respectively. The authors, when evaluating the regional features, determined the

68
presence in ES of several abrupt deviations of the river courses and significant modifications of the
drainage directions and alignments of the maximum altitudes. Examples are the Lempa and San
Miguel Rivers. In particular the first one borders from the north and east to the capital San Salvador
and Ilopango Lake. In Honduras study we determined that there is an area with a significant change
in direction of the main river basins. The area is located in a N-S direction and spatially related to
Cerrón Grande reservoir, in ES.
Table 19. Brief definitions of morphotectonic elements.Nº/ Element Definition
1/ Alignment (alignment=lineament) The boundary between the TU (see below). It is an expression oftectonic activity during the most recent orogenic period. It has different rank according to thestructures involved. It is possible to distinguish longitudinal and transverse types
2/ Zone of lineaments A set of lineaments3/ Lineament intersection (Lineament intersection=knot) Always is wider than the lineaments from which is former. It is
related with the rank of the structures involved4/ Territorial Unit (Territorial Unit=TU) Areas with the same geologic history5/ Megablock The largest TU of a region with the same geodynamic behavior in the current stage of
geological development6/ Macroblock It is a TU inside the megablock. It is differentiated by the type of orogenesis and/or a
large_scale tectonic features7/ Mesoblock The TU included in a macroblock. It differs either by the dominant type of relief or by average
parameters of the relief (such as height of peaks, dominant strikes, relative area occupied bybasins and ranges, etc.) or by the pattern of main elements of relief
8/ Block A TU inside a mesoblock. In it is necessary considering the neotectonic history9/ Microblock It is a TU within which the quantitative indexes of major elements of relief change little,
whereas across the limits of these areas a significant change in at least to quantitative indextakes place
10/ Nanoblock The most little TU. It is included in microblock. The quantitative indexes are taking inconsideration
11/ Main watershed A line over the top of heights that limit the fluvial basins
Table 19A. Main elements of the Central America-I Megablock.Boundary
1 Northamerican Plate (mega alignment of the Pacific) 2 Cocos Plate3 Caribbean Microplate 4 Mesoamerican Trench (Pacific Ocean)5 Polochic-Motagua Fault6 Swan Fault7 PTT (Caribbean-Cocos-Northamerican)8 Central America-II megablock
On a smaller scale are some other rivers such as Jiboa, in the vicinity of the aforementioned
Lake, and the La Paz River on the border of ES and Guatemala. These rivers run with affectations
of the volcanic axis of CA. Álvarez-Gómez et al. (2006) considered the presence of the El Salvador
Fault Zone when analyzing the lateral displacement of the Jiboa River in the vicinity of Ilopango
Lake. From the development of figure 28 we assure that contemporary morphostructural plane of
NI is heterogeneous and active. This highlights a major alignments system: NW-SE, NE-SW, N-S
and E-W. The most extensive and important are the NW. The NE are imposed in sectors cutting all
structures. Both systems are active. There are also three articulation knots, the most relevant being
the one associated to Gulf of Fonseca, where the arching of Volcanic Chain is determined. The
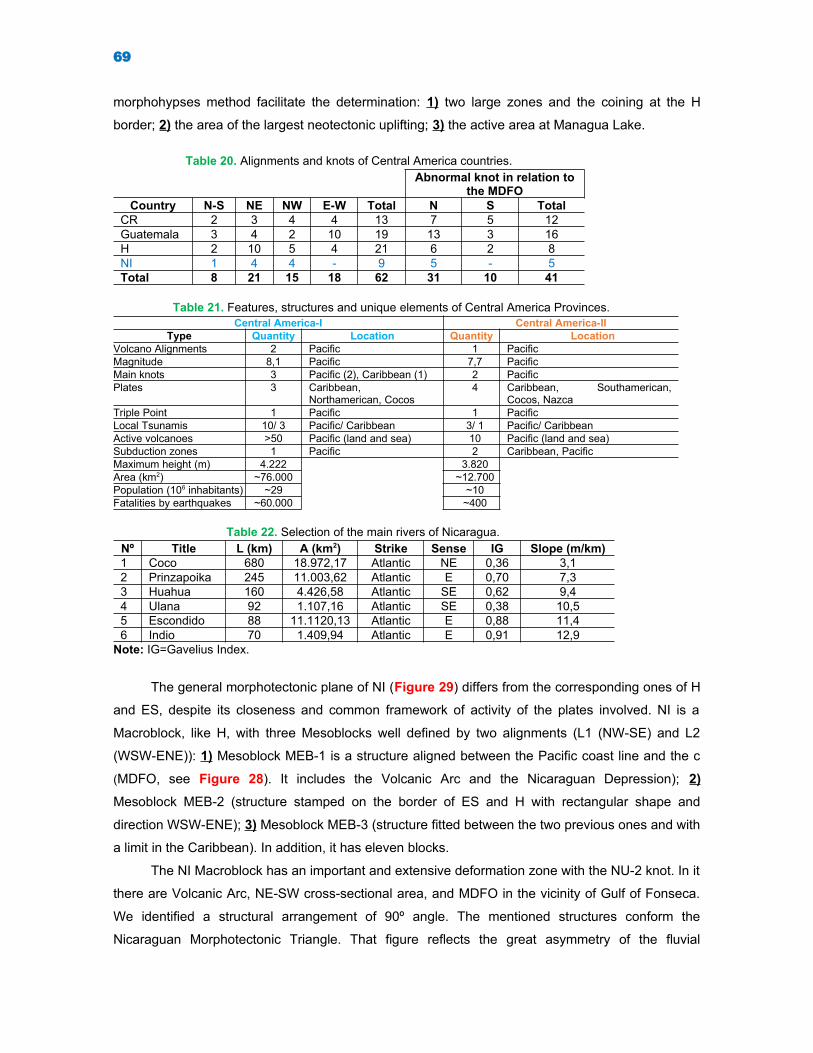
69
morphohypses method facilitate the determination: 1) two large zones and the coining at the H
border; 2) the area of the largest neotectonic uplifting; 3) the active area at Managua Lake.
Table 20. Alignments and knots of Central America countries.Abnormal knot in relation to
the MDFOCountry N-S NE NW E-W Total N S Total
CR 2 3 4 4 13 7 5 12Guatemala 3 4 2 10 19 13 3 16H 2 10 5 4 21 6 2 8NI 1 4 4 - 9 5 - 5Total 8 21 15 18 62 31 10 41
Table 21. Features, structures and unique elements of Central America Provinces.Central America-I Central America-II
Type Quantity Location Quantity LocationVolcano Alignments 2 Pacific 1 PacificMagnitude 8,1 Pacific 7,7 PacificMain knots 3 Pacific (2), Caribbean (1) 2 PacificPlates 3 Caribbean,
Northamerican, Cocos4 Caribbean, Southamerican,
Cocos, NazcaTriple Point 1 Pacific 1 PacificLocal Tsunamis 10/ 3 Pacific/ Caribbean 3/ 1 Pacific/ CaribbeanActive volcanoes >50 Pacific (land and sea) 10 Pacific (land and sea)Subduction zones 1 Pacific 2 Caribbean, PacificMaximum height (m) 4.222 3.820Area (km2) ~76.000 ~12.700Population (106 inhabitants) ~29 ~10Fatalities by earthquakes ~60.000 ~400
Table 22. Selection of the main rivers of Nicaragua.Nº Title L (km) A (km2) Strike Sense IG Slope (m/km)1 Coco 680 18.972,17 Atlantic NE 0,36 3,12 Prinzapoika 245 11.003,62 Atlantic E 0,70 7,33 Huahua 160 4.426,58 Atlantic SE 0,62 9,44 Ulana 92 1.107,16 Atlantic SE 0,38 10,55 Escondido 88 11.1120,13 Atlantic E 0,88 11,46 Indio 70 1.409,94 Atlantic E 0,91 12,9
Note: IG=Gavelius Index.
The general morphotectonic plane of NI (Figure 29) differs from the corresponding ones of H
and ES, despite its closeness and common framework of activity of the plates involved. NI is a
Macroblock, like H, with three Mesoblocks well defined by two alignments (L1 (NW-SE) and L2
(WSW-ENE)): 1) Mesoblock MEB-1 is a structure aligned between the Pacific coast line and the c
(MDFO, see Figure 28). It includes the Volcanic Arc and the Nicaraguan Depression); 2)
Mesoblock MEB-2 (structure stamped on the border of ES and H with rectangular shape and
direction WSW-ENE); 3) Mesoblock MEB-3 (structure fitted between the two previous ones and with
a limit in the Caribbean). In addition, it has eleven blocks.
The NI Macroblock has an important and extensive deformation zone with the NU-2 knot. In it
there are Volcanic Arc, NE-SW cross-sectional area, and MDFO in the vicinity of Gulf of Fonseca.
We identified a structural arrangement of 90º angle. The mentioned structures conform the
Nicaraguan Morphotectonic Triangle. That figure reflects the great asymmetry of the fluvial

70
networks of Pacific-Caribbean, and where there is the greatest density of fractures and faults
according to INETER (1995). NI is also distinguished by having some structural characteristics
similar to those determined in H and ES. Thus, we indicate that the Mesoblock: 1) MEB-1
corresponds structurally to the Mesoblock of ES; 2) MEB-2 has some features of H. However, the
MEB-3 only corresponds, with an inverse figure, to the east in the Nicaraguan Rise.
Figure 27. Morphotectonic scheme of El Salvador.Appear: 1) Alignments (continuous red lines); 2) Blocks (B1=San Salvador, B2=Gulf of Fonseca); 3)CV=Volcanic Active Chain; 4) DC=Central Depression; 5) Deformation axis: 5.1) Main in the Mesoblock(double black arrow with dotted line); 5.2) Secondary outside the Mesoblock (double yellow arrow with dottedline); 6) GF=Gulf of Fonseca; 7) Joint knots: 7.1) In the Mesoblock (green circles); 7.2) Outside the Mesoblock(yellow circles); 8) Neotectonic uplift area: 8.1) Intense (purple star); 8.2) Middle (orange star); 8.3) Low(square with the symbols +/-); 9) Rivers (Goascorán, Jiboa, San Miguel, La Paz, Lempa); 10) San SalvadorCity (square and acronym (SS) in red); 11) Sense of movement: 11.1) Relative lateral (red thick arrow); 11.2)Rotating (red curved arrow); 12 ) Surface drainage direction: 12.1) in the Mesoblock (blue arrow); 12.2) Outsidethe Mesoblock (yellow arrow); 13) Volcanic activity axis (double arrow with dotted line).
The segment with the highest structural deformation of ES and NI coincides with the zone of
highest convergence speed of Cocos Plate in relation to Caribbean Microplate. This explains why
the main S-A of these two countries is in the surroundings of the Volcanic Arc (Mesoblock ES and
MEB-1 of NI); and that it is higher than the one produced in H.
The main structural deformation in Central America is in Gulf of Fonseca. There is an arching
(15º) south of the Volcanic Arc and the coastline between ES and NI. We interpret this as the
predominance of mega order over lower orders. However, it is not excluded that strong earthquakes
may occur in lower orders, but always with a much longer period of recurrence.

71
H and NI territories prove to be two independent macroblocks and show the existence of
parallel alignments to Pacific coast. In NI the E-W and perpendicular to Caribbean coast prevails,
while in H it is to the NE. We consider, theoretically, the morphotectonic junction between Honduras
and El Salvador [HES]. From it we would see that the resulting morphostructural structure for HES
would be equivalent to that of Nicaragua. However, the stress transfer favors a higher S-A in the
offshore NI.
Figure 27A. Morphotectonic scheme of Central America.Appear: 1) Blocks (CHB=Chortis, COB=Chorotega, MB=Maya, OB=Oaxaca); 2) Countries (ES=El Salvador,H=Honduras, NI=Nicaragua; in pink letters); 3) Drainage Change Direction Zone (dashed rectangle withorange acronym, ZCD); 4) GRP= Pacific Gradient (purple discontinuous arrow); 5) Fore-arch area(discontinuous rectangle with green acronym, A0); 6) Knots (circle and acronym in red, NU-1); 7) Linear front(dashed line and blue acronym, LF-1); 8) LZNI=Lower Zone of Nicaragua; 9) Main faults (continuous blacklines) with sense of movement; 10) MDFO= First Order Main Watershed (yellow dashed line) (defined byCotilla et al., 2003); 11) Plates (COPL=Cocos, NPL=Northamerican, NZPL=Nazca, SPL=Southamerican) andMicroplates (CMPL=Caribbean, PMPL=Panama) with a sense of motion; 12) Relative speed in mm/year(numbers in purple); 13) Relative rotation (curve red arrow); 14) Structural Change Zone (dashed rectanglewith red acronym, CE1-Z); 15) Subduction front (SPFR=Pacific, FSC=Caribbean) thick black line withsubduction indication.
The CA-II TU study, with Costa Rica and Panama, is reflected as two Mesoblocks. They
show significant differences in relation to the structures delimited in the CA-I TU. We emphasize the
significant difference, as a jump or lateral-transverse deviation, of the Volcanic Arc Axis in
Nicaragua and Costa Rica. It is scenario that describes the Zone of Structural Change, CE1-Z,
represented in figure 27A. In both Mesoblocks: 1) there are two blocks in each of them. These are
transversal; 2) the boundaries between their respective blocks have different directions and link
Pacific Ocean and Caribbean Sea; 3) the areas of greatest intensity of neotectonical uplifitng are
linked at the border; 4) the MDFO in CR (0,85) is much less flexed than the one in Panama (0,52).
But, the deformation of this hydrographic element indicates an important anomaly of the relief in

72
San José. The tables 23A-B gather a set of data on characteristics that distinguish the
morphotectonics of five countries.
Figure 28. Morphoisohipses scheme of Nicaragua.Appear: 1) Alignments (thick lines): 1.1) N-S (purple color); 1.2) NE (yellow color); 1.3) NW (red color); 1.4) E-W (green color); 2) Localities (AU=Auasbila, GF=Gulf of Fonseca, M=Managua, RB=Río Blanco); 3) Mainwatershed (blue line); 4) Zone (Z-1); 5) Relief with isohipses (curved lines, see legend).
Table 23A. Main local morphotectonic data (Part 1).AC- MAC MES B MIC SZ TS AV NP AL ALT Mmax
CR II - 1 2 6 1 2 9 3 12 3.820 7,8ES I - 1 2 5 1 3 22 8 20 2.730 8,1H I 1 3 12 37 - 2 6 5 13 2.870 7,5NI I 1 3 7 21 1 8 20 3 20 2.107 7,9
Panama II - 1 2 5 2 1 3 4 24 3.474 7,9Tota
l2 9 25 74 5 10 60 23 89
Notes: 1) AC=Central America (I and II) Megablocks; 2) AL=main alignments; 3) ALT=highest altitude (m); 4)B=Block, MAC=Macroblock, MES=Mesoblock, MIC=Microblock; 5) Mmax=Maximum magnitude; 6) NP=Mainknot; 7) Active volcano; 8) TS=Tsunami; 9) SZ=Subduction zone.

73
Figure 29. Preliminary morphotectonic diagram of Nicaragua.Appear: 1) AT=Abnormal turn of the main surface water divider (blue rectangle); 2) Alignments (red line(HE=Hess Escarpment, NIA=of Nicaraguan Pacific, ESA=of El Salvador); 3) Articulation knot (circle withacronym (NU-2) in red); 4) Average direction of surface runoff to the: 4.1) Caribbean Sea (blue arrow); 4.2)Pacific (yellow arrow); 5) Blocks (B1=Managua, B2=Nicaragua); 6) Boundary of Mesoblocks (thick black line,and acronym L1); 7) Countries (CR=Costa Rica, ES=El Salvador, H=Honduras); 8) Main surface water dividerof: 8.1) First Order; 8.2) Second Order; 8.3) Third Order (see legend); 9) Mesoblocks (MEB-1=Pacific, MEB-2=Norte, MEB-3=Caribe); 10) Neotectonic uplifting area: 10.1) intense (purple star); 10.2) middle (red star);10.3) very weak or null (square with +/-); 11) relative sense of rotation in the: 11.1) Atlantic (blue curved arrow):11.2) Pacific (yellow arrow); 12) Transversal deformation area (rectangle with dotted line and two red points);13) Volcanic Axis (black line with double arrow).
Table 23B. Main local morphotectonic data (Part 2).Drainage Asymmetry Basins Ks (MDFO) KsL (Coasts)
CR Caribbean and Pacific 0,4 9/ 10 0,85 0,87/ 0,71ES Pacific - -/ 10 - -/ 0,87H Caribbean 0,5 6/ - 0,45 0,81/ -NI Caribbean and Pacific 0,8 13/ 8 0,81 0,80/ 0,74
Panama Caribbean and Pacific 0,4 18/ 34 0,52 0,40/ 0,41Total 46/ 62
Notes: 1) Asymmetry=Asymmetry of the surface basin; 2) Surface basins at the: 2.1) Caribbean; 2.2) Pacific;3) Drainage=Basin surface drainage Caribbean/ Pacific; 4) Ks=Sinuosity Coefficient of the Main DivisionWatershed of the First Order; 5) KsL=Coastline sinuosity coefficient: 5.1) Caribbean; 5.2) Pacific.
A distinguishing feature of AC morphotectonics is related to the plate segment kinematic
data. There is a slight increase in the subduction angle of Cocos Plate from 25º in Oaxaca to 35º in
the Isthmus of Tehuantepec and 40º beyond Chiapas. In the northern segment of Costa Rica the
angles vary from 15º to 75º, and in the central segment the values are 15º-40º. This is related to the
speed variation (68-90 cm/year), as a gradient, from northern Guatemala to Costa Rica (distance
~2.000 km) (Figure 27A). In this tectonic segment there are three active nodes (NU-1, NU-2, and
NU-3) that we believe justify the rotational articulation of the region. From this plate interaction it is

74
possible to distinguish two different geometric figures in the emerged continental part (a large
triangle (G-NI) and a small rectangle (Costa Rica)). Both figures conform to the quasi-linearity of the
MAT.

75
4-SEISMOTECTONIC
“Hay quienes no pueden imaginar un mundo sin pájaros; hayquienes no pueden imaginar un mundo sin agua; en lo que a mí
se refiere, soy incapaz de imaginar un mundo sin libros”.Jorge Luis Borges (Argentina, 1899-Suiza, 1986)
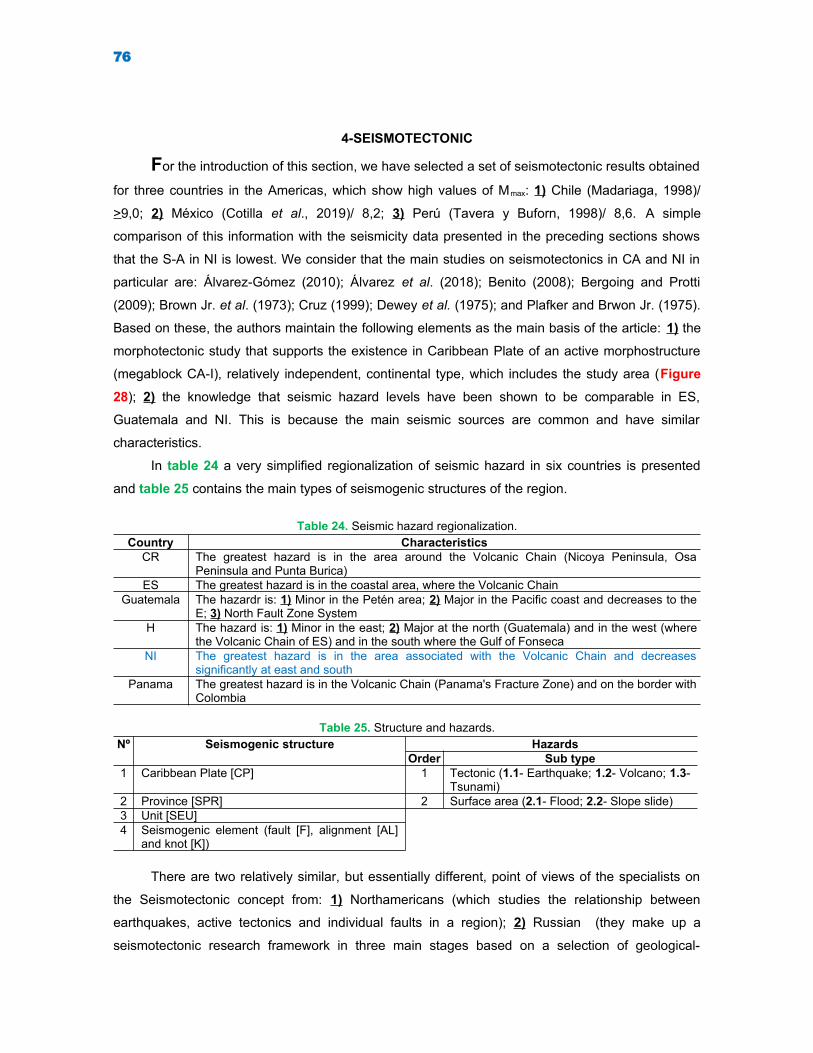
76
4-SEISMOTECTONIC
For the introduction of this section, we have selected a set of seismotectonic results obtained
for three countries in the Americas, which show high values of Mmax: 1) Chile (Madariaga, 1998)/
>9,0; 2) México (Cotilla et al., 2019)/ 8,2; 3) Perú (Tavera y Buforn, 1998)/ 8,6. A simple
comparison of this information with the seismicity data presented in the preceding sections shows
that the S-A in NI is lowest. We consider that the main studies on seismotectonics in CA and NI in
particular are: Álvarez-Gómez (2010); Álvarez et al. (2018); Benito (2008); Bergoing and Protti
(2009); Brown Jr. et al. (1973); Cruz (1999); Dewey et al. (1975); and Plafker and Brwon Jr. (1975).
Based on these, the authors maintain the following elements as the main basis of the article: 1) the
morphotectonic study that supports the existence in Caribbean Plate of an active morphostructure
(megablock CA-I), relatively independent, continental type, which includes the study area (Figure
28); 2) the knowledge that seismic hazard levels have been shown to be comparable in ES,
Guatemala and NI. This is because the main seismic sources are common and have similar
characteristics.
In table 24 a very simplified regionalization of seismic hazard in six countries is presented
and table 25 contains the main types of seismogenic structures of the region.
Table 24. Seismic hazard regionalization.Country Characteristics
CR The greatest hazard is in the area around the Volcanic Chain (Nicoya Peninsula, OsaPeninsula and Punta Burica)
ES The greatest hazard is in the coastal area, where the Volcanic ChainGuatemala The hazardr is: 1) Minor in the Petén area; 2) Major in the Pacific coast and decreases to the
E; 3) North Fault Zone System H The hazard is: 1) Minor in the east; 2) Major at the north (Guatemala) and in the west (where
the Volcanic Chain of ES) and in the south where the Gulf of FonsecaNI The greatest hazard is in the area associated with the Volcanic Chain and decreases
significantly at east and southPanama The greatest hazard is in the Volcanic Chain (Panama's Fracture Zone) and on the border with
Colombia
Table 25. Structure and hazards.Nº Seismogenic structure Hazards
Order Sub type1 Caribbean Plate [CP] 1 Tectonic (1.1- Earthquake; 1.2- Volcano; 1.3-
Tsunami)2 Province [SPR] 2 Surface area (2.1- Flood; 2.2- Slope slide)3 Unit [SEU]4 Seismogenic element (fault [F], alignment [AL]
and knot [K])
There are two relatively similar, but essentially different, point of views of the specialists on
the Seismotectonic concept from: 1) Northamericans (which studies the relationship between
earthquakes, active tectonics and individual faults in a region); 2) Russian (they make up a
seismotectonic research framework in three main stages based on a selection of geological-

77
geophysical indicators that lead to: 2.1) preparation of a SMP; 2.2) distinction and characterization
of potential active seismic zones; 2.3) development of seismic hazard materials. Among them are
maps of seismogenic zones and origin of earthquakes, which in Western literature are equivalent to
"seismotectonic corridors"). The Russian methodology was applied in Cuba (Cotilla et al., 1991) and
Mexico (Cotilla et al., 2019). In this last work is their figure 6 with the three SPR and eleven SEU
(1=North-Western (2); 2=Western (4); 3=Central Eastern (5)). The first two are narrow strips that
follow Pacific coast line; while the third is the largest area and reaches Gulf of Mexico. It is ensured
that the structures have a relationship and continuity with neighboring countries (north and south).
The North American model was applied for CA in: 1) Guendel and Protti (1998) presented in
their table 1 eight earthquake source zones (Polochic-Motagua, Coastal (Guatemala-ES and NI-
CR), Volcanic (Guatemala-ES and NI-CR), Panama Fracture, and Intermediate (Guatemala-ES and
NI-CR)); 2) Benito (2008) proposes a set of five figures (3.4-3.9) with the Seismic Zoning (Regional
and National). In them there are Seismogenic Zones: 2.1) 31 Cortical or superficial (h<25 km); 2.2)
nine Inter plate (Subduction, h60 km); 2.3) seven Intraplate (Subduction, h=5->60 km); 3) Guardiola
(2010) describes eight seismic zones (Subduction Zone (MAT), Volcanic Arc, Northamerican-
Caribbean Plate Boundary, Faults and Deformation Caribbean Plate, H Depression, Guayape Fault
System, and Hess Escarpment). While for H, Cruz (1999) assured that the main seismic sources
are outside the emerged territory; but that the Central Depression turns out to be a primary source
of S-A for the Central and NI.
Taking into consideration what is expressed in the previous paragraphs, the main
seismotectonic elements of NI are defined on the basis of the: 1) features: 1.1) tectonic
environment; 1.2) neotectonics; 2) main tectonic elements; 3) geographical spread; 4) composition
and configuration of the relief; 5) seismicity (historical and instrumental); 6) predominant focal
mechanisms; 7) structure of the lithosphere. Thus, the seismotectonic hierarchical structure of the
territory has been established; and it has been determined that the region is different in relation to
its immediate surroundings. Tables 26 and 27 show data from the SPR of CA (Figure 29).
Table 26. Overall ranking. Nº Province Countries Mmax/ Depthmax (km) Tsunamis / Volcanoes1 Central America I ES, Guatemala, H, NI 7,7/ 200 ~40/ 532 Central America II CR, Panama 7,6/ 100 ~30/ 83 Mesoamerican Trench Mexico-Panama 8,1/ 120 15/ >1004 Volcanic Chain Mexico-Panama 7,7/ 150 5/ 805 Interior Region Guatemala-NI 7,8/ 120 -/ 10
Table 27. Regional seismogenic linear structure.Order Type Mmax
1 Plate boundary: 1) Northern (Caribbean-Northamerican); 2) Southern (Caribbean-Southamerican); 3)Eastern (3.1) Caribbean-Cocos; 3.2) Caribbean-Nazca); 4) Western (Caribbean-Pacific)
<8,0
2 Limits and lines of weakness of the interior (faults: 1) actives; 2) potentially actives) <7,0
The authors, based on the morphotectonic study consider that NI is an active Seismotectonic
Unit mainly within the Caribbean Microplate. It is different from the neighboring territories and is in
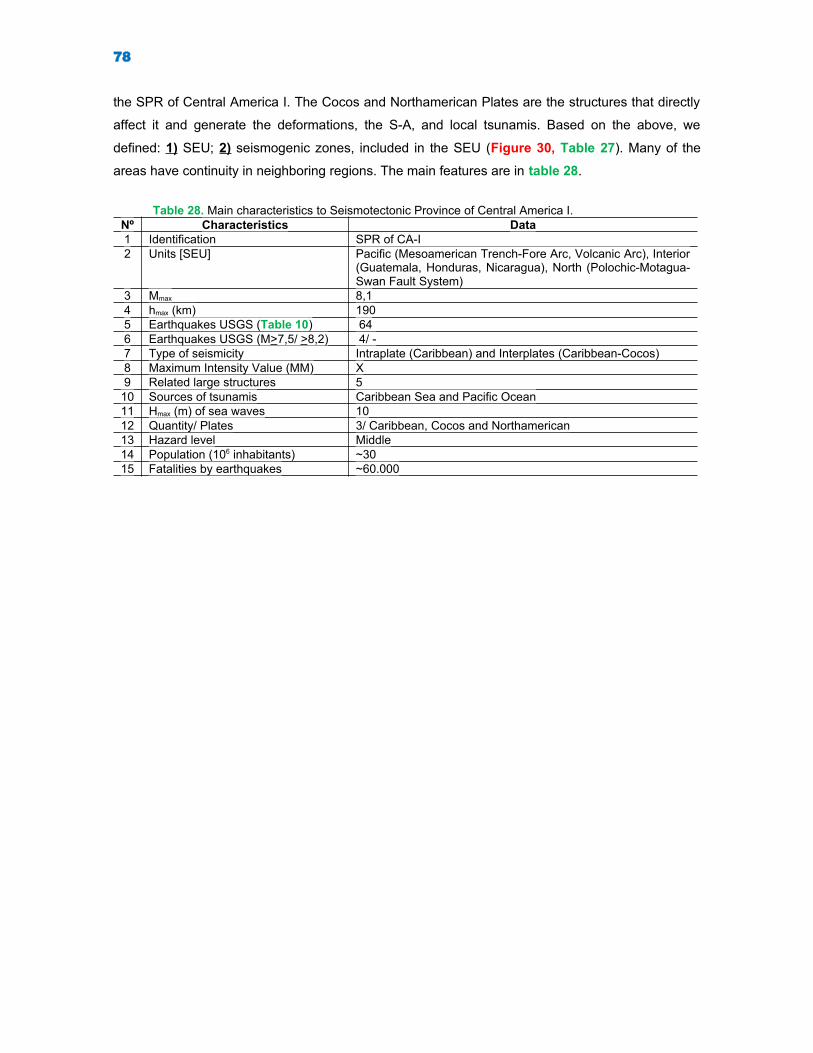
78
the SPR of Central America I. The Cocos and Northamerican Plates are the structures that directly
affect it and generate the deformations, the S-A, and local tsunamis. Based on the above, we
defined: 1) SEU; 2) seismogenic zones, included in the SEU (Figure 30, Table 27). Many of the
areas have continuity in neighboring regions. The main features are in table 28.
Table 28. Main characteristics to Seismotectonic Province of Central America I.Nº Characteristics Data1 Identification SPR of CA-I2 Units [SEU] Pacific (Mesoamerican Trench-Fore Arc, Volcanic Arc), Interior
(Guatemala, Honduras, Nicaragua), North (Polochic-Motagua-Swan Fault System)
3 Mmax 8,14 hmax (km) 1905 Earthquakes USGS (Table 10) 646 Earthquakes USGS (M>7,5/ >8,2) 4/ -7 Type of seismicity Intraplate (Caribbean) and Interplates (Caribbean-Cocos)8 Maximum Intensity Value (MM) X9 Related large structures 5
10 Sources of tsunamis Caribbean Sea and Pacific Ocean11 Hmax (m) of sea waves 1012 Quantity/ Plates 3/ Caribbean, Cocos and Northamerican13 Hazard level Middle14 Population (106 inhabitants) ~3015 Fatalities by earthquakes ~60.000
79
DISCUSSION AND CONCLUSIONS
“El terremoto más fuerte del mundo es chileno”.Joaquim Barañao-Díaz
22.08.2017
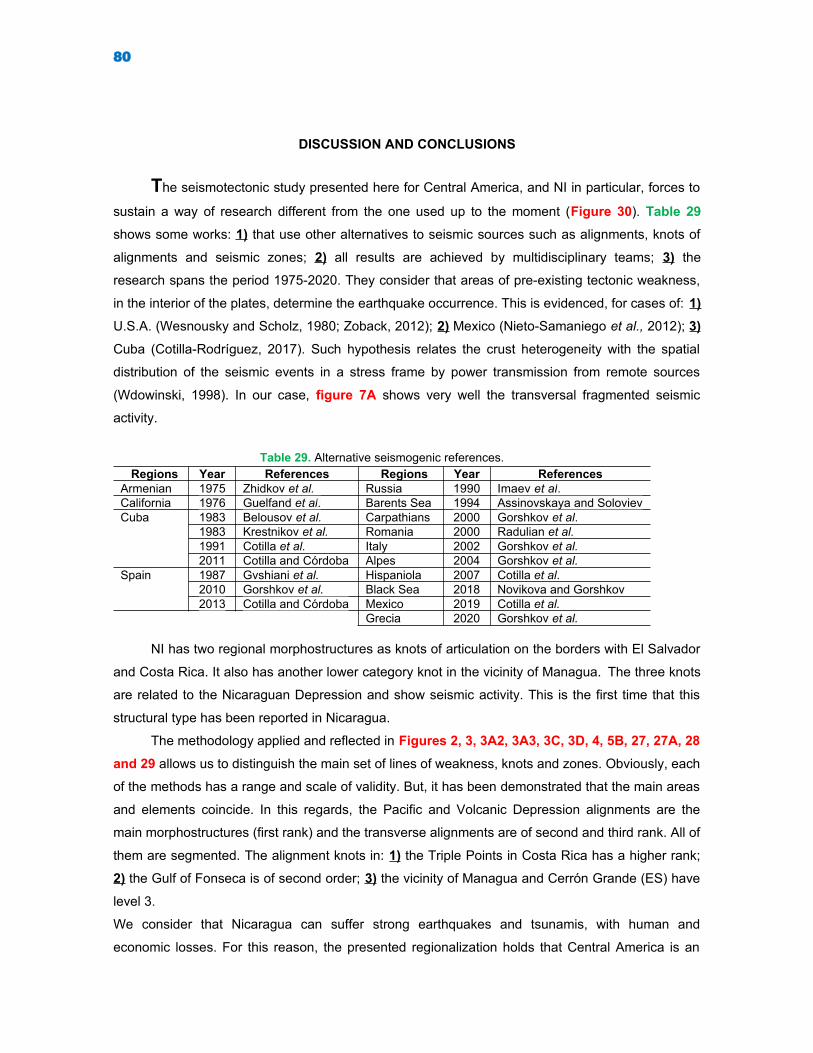
80
DISCUSSION AND CONCLUSIONS
The seismotectonic study presented here for Central America, and NI in particular, forces to
sustain a way of research different from the one used up to the moment (Figure 30). Table 29
shows some works: 1) that use other alternatives to seismic sources such as alignments, knots of
alignments and seismic zones; 2) all results are achieved by multidisciplinary teams; 3) the
research spans the period 1975-2020. They consider that areas of pre-existing tectonic weakness,
in the interior of the plates, determine the earthquake occurrence. This is evidenced, for cases of: 1)
U.S.A. (Wesnousky and Scholz, 1980; Zoback, 2012); 2) Mexico (Nieto-Samaniego et al., 2012); 3)
Cuba (Cotilla-Rodríguez, 2017). Such hypothesis relates the crust heterogeneity with the spatial
distribution of the seismic events in a stress frame by power transmission from remote sources
(Wdowinski, 1998). In our case, figure 7A shows very well the transversal fragmented seismic
activity.
Table 29. Alternative seismogenic references.Regions Year References Regions Year References
Armenian 1975 Zhidkov et al. Russia 1990 Imaev et al. California 1976 Guelfand et al. Barents Sea 1994 Assinovskaya and SolovievCuba 1983 Belousov et al. Carpathians 2000 Gorshkov et al.
1983 Krestnikov et al. Romania 2000 Radulian et al. 1991 Cotilla et al. Italy 2002 Gorshkov et al. 2011 Cotilla and Córdoba Alpes 2004 Gorshkov et al.
Spain 1987 Gvshiani et al. Hispaniola 2007 Cotilla et al. 2010 Gorshkov et al. Black Sea 2018 Novikova and Gorshkov2013 Cotilla and Córdoba Mexico 2019 Cotilla et al.
Grecia 2020 Gorshkov et al.
NI has two regional morphostructures as knots of articulation on the borders with El Salvador
and Costa Rica. It also has another lower category knot in the vicinity of Managua. The three knots
are related to the Nicaraguan Depression and show seismic activity. This is the first time that this
structural type has been reported in Nicaragua.
The methodology applied and reflected in Figures 2, 3, 3A2, 3A3, 3C, 3D, 4, 5B, 27, 27A, 28
and 29 allows us to distinguish the main set of lines of weakness, knots and zones. Obviously, each
of the methods has a range and scale of validity. But, it has been demonstrated that the main areas
and elements coincide. In this regards, the Pacific and Volcanic Depression alignments are the
main morphostructures (first rank) and the transverse alignments are of second and third rank. All of
them are segmented. The alignment knots in: 1) the Triple Points in Costa Rica has a higher rank;
2) the Gulf of Fonseca is of second order; 3) the vicinity of Managua and Cerrón Grande (ES) have
level 3.
We consider that Nicaragua can suffer strong earthquakes and tsunamis, with human and
economic losses. For this reason, the presented regionalization holds that Central America is an

81
extensive and complex Seismotectonic Province located, mostly, in the Caribbean Microplate and
has two types of seismicity (interplate and intraplate). From this point of view, there is an active and
interrelated hierarchical structure with Units and Seismogenetic Zones. It has become clear that its
main seismotectonic elements have a continuous relationship with other neighboring countries,
such as Costa Rica, El Salvador and Honduras. Also, it is confirmed that the Depression (Gulf of
Fonseca-Costa Rica) is the area of greatest seismic hazard in Nicaragua.
Figure 30. Seismotectonic model of Nicaragua.Appear: 1) Boundaries of Seismotectonic Provinces (yellow line); 2) Faults (red lines); 3) Plates(PCA=Caribbean, PCO=Cocos, PNA=North American, PNZ=Nazca, PSA=South American); 4) SeismotectonicProvinces (AC-I, AC-II (in yellow)); 5) SU=Seismotectonic Units (SU-1=Pacific (in black), SU-2=North (inpurple), SU-3=Interior (in green)); 6) Sub Units (1.1=Mesoamerican Trench, 1.2=Fore Arc, 1.3=Volcanic Arc).
Other conclusions are: 1) Central America is a territorial unit with two distinct segments:
Central America-I (El Salvador, Guatemala, Honduras and Nicaragua) and Central America-II
(Costa Rica and Panama) (Figure 30). The boundary is located between Nicaragua and Costa
Rica. These Units are defined by the interaction of the plates; 2) the highest altitude areas in
Central America are at their north (Guatemala=4.220 m) and south (Costa Rica=3.820 m) extremes.
They are linked to a single Main Division of First Order of the surface drainage network, in a straight
N-S direction and a Ks of 0,77; 3) the strong seismic activity of Central America is characterized for
being of distributed and self-organized type so that an asymmetric transference of stress can be
appreciated that favors the configuration of the main forms of the relief; 4) the morphotectonic

82
regionalization shows that the figure delimited for Central America has a triangular shape, with six
blocks, four knots and eight alignments (of first order) with relative movements of clockwise and
counterclockwise rotation; 5) the most active structure in the Central America-I segment is
Guatemala; 6) Honduras and Nicaragua are two macroblocks with different geometric shapes and
with the following elements: Mesoblocks (H (3)/ NI (3)), Blocks (H (12)/ NI (11)), Alignments (H (13)/
NI (23)) and Knots (H (18)/ NI (19)); 7) El Salvador and Nicaragua have more seismic activity than
Honduras; 8) local tsunami zones of Honduras (two to the north and one to the south), Nicaragua
(to the south); 9) Honduras has in the contemporary plane a zone of change of direction of the
transverse drainage (N-S) that connects with Gulf of Fonseca; 10) it is confirmed that the capitals
(Costa Rica, El Salvador, Guatemala, Honduras, and Nicaragua) are located at areas of greatest
seismic hazard; 11) AC-I has lower seismogenerator potential (earthquakes and tsunamis) than
Mexico and Peru-Chile.
Finally, from the humanitarian point of view, all highly developed societies in the world have a
moral obligation to help Nicaragua, among other things, in earthquake disaster prevention and
recovery plans.
83
ACKNOLODGMENTS
INETER allowed the use of the catalog of earthquakes recorded by its seismic network. Mostof the figures were made by Amador García-Sarduy. Salvador Crespillo-Maristegui collectedmuch of the data. The economic funds came mainly from the projects: KUK-AHPANRTI2018-094827-B-C21 and Normativa Sismorresistente para la Ciudad de Managua/Código del expediente: 2017DEA014/ Cooperante: AACID (Agencia Andaluza deCooperación Internacional para el Desarrollo).
“Saber para prever. Y prever para proteger”.Pilar Gallego
LYCHNOS, Cuadernos de la Fundación General CSIC, No. 4, 2010

84
REFERENCES
“San Francisco is devasted”.Los Angeles Herald, 1906
85
REFERENCES
Algermissen, S.T., Dewey, J.W., Dillinger, W.H. and Langer, C.J. “The Managua earthquake ofDecember 13, 1972: Location, focal mechanism, and intensity distribution”. Bulletin of theSeismological Society of America, 64 (1974) 993-1.003.
Alvarado, D., DeMets, C., Tikoff, B., Hernández, D., Wawrzyniec, T.F., Pullinger, C., Mattioli, G.,Turner, H.L., Rodríguez, M. and Correa-Mora, F. “Forearc motion and deformation betweenEl Salvador and Nicaragua: GPS, seismic, structural, and paleomagnetic observations”.Lithosphere, 3 (1) (2011) 3-21.
Álvarez, L. “Nueva estimación de la amenaza sísmica para Nicaragua”. Revista Tierra, (2021) (inpreess). https://revistatierra.unan.edu.ni [in Spanish].
Álvarez-Gómez, J.A. Tectónica activa y geodinámica en el norte de Centroamérica. Tesis doctoral,Universidad Complutense de Madrid, (2010) 227 pp. [in Spanish].
Álvarez, L. and Chuy, T. Isoseismal model for Greater Antilles. In Proceedings of the 3rd
International Symposium on the analysis of seismicity and on seismic risk. Liblice Castle,Czechoslovakia, June 17-22, 1985, 134-141 pp.
Álvarez-Gómez, J.A., Insua, J.M., Capote, R., Bejar, M., Canora-Catalán, C. and Hernández, W.“Evidencias morfotectónicas de actividad reciente de la zona de falla El Salvador en elsegmento Ilopango-San Vicente”. Geogaceta, 39 (2006) 3-6 [in Spanish].
Álvarez, L., Rodríguez, A.Mª, González, O., Moreno, B. and Cabrera, A. “Seismotectonics of theNicaraguan Depression from recent seismicity”. Journal of Geology and Geophysics, (2018)doi: 10.4172/2381-8719.1000446.
Alekseevskaya, M., Gabrielov, A., Gelfand, I., Gvishiani, A. and Rantsman, E. “Formalmorphostructural zoning in mountain territories”. Journal Geophysical Research, 43 (1977)227-233.
Ambraseys, N.N. and Adams, R.D. The seismicity of Central America: A descriptive catalogue1898-1995. Imperial College Press, London, (2001) 309 pp.
Ambraseys, N.N. and Adams, R.D. “Large-magnitude Central American earthquakes, 1898-1994”.Geophysical Journal International, 127 (1996) 665-692.
Anderson, T.H. and Schmidt, V.A. “The evolution of Middle America and the Gulf of Mexico-Caribbean Sea during Mesozoic time”. Geological Society of America Bulletin, 84 (1983) 941-966.
Arce, M.F., Molina, E., Havskov, J. and Atakan, K. Tsunamis in Central America. Tech. Rep., 11, 1-12 pp. Reduction of natural disasters in Central America. Earthquake preparedness andhazard mitigation. Institute of Solid Earth Physics, Bergen University, Norway, 1998.
Assinovskaya, B.A. and Soloviev, S.L. “Definition and description of the zones of potentialearthquake sources in the Barents Sea”. Izveztiya Physics of the Solid Earth, 29 (8) (1994)664-675.
Auger, L.S., Abers, G., Rossi, G., Plank, T., Fischer, K., Gonzalez, V., Protti, M. and Strauch, W.“Crustal thickness along the Central American Volcanic Arc”. EOS Transaction AmericaGeophysics Union 85 (2004) 47 p.
86
Bankwitz, P., Schneider, G., Kämpf, H. and Bankwitz, E. “Structural characteristics of epicentralareas in Central Europe: study case Cheb Basin (Czech Republic)”. Journal of Geodynamics,35 (1-2) (2003) 5-32.
Barquero, R. Sismicidad y tectónica de la región NW de Costa Rica, con énfasis en la zona delProyecto Geotérmico Miravalles. Tesis de Licenciatura, Escuela C.A. de Geología, Univ. deCosta Rica, 1990, 90 pp.
Belousov, T.P, Krestnikov, V.N. and Shebalin, N.V. Delimitación de zonas sismogeneradoras deCuba Central y estimación de su magnitud máxima. In: Investigación de la sismicidad de laszonas de baja actividad sísmica (Cuba Central). Editorial Nauka, Moscú, 1983 [in Russian].
Benito, B. Evaluación regional de la amenaza sísmica en Centro América (Al08‐pid‐038). InformeFinal, Universidad Politécnica de Madrid, (2008) 86 pp. [in Spanish].
Bergoing, J.P. and Protti, M. “Tectónica de placas y sismicidad de América Central”. RevistaGeofísica, 146 (2009) 153-169 [in Spanish].
Brown Jr., R.D., Ward, P.L. and Plafker, G. Geologic and seismologic aspects of the Managua,Nicaragua, earthquake of December, 1972. Geological Survey Professional Paper, 838.Washington D.C., 1973.
Burbach, G.V. and Frohlich, C. “Intermediate and deep seismicity and lateral structure of subductedlithosphere in the Circum-Pacific region”. Reviews of Geophysics, 24 (1986) 833-874.
Burbach, G.V., Frohlich, C., Pennington, W.D. and Matumoto, T. “Seismicity and tectonics of thesubducted Cocos plate”. Journal of Geophysical Research, 89 (B9) (1984) 7.719-7.735.
Burkart, B. and Self, B. “Extension and rotation of crustal block in northern Central America and itseffect upon the volcanic arc”. Geology, 13 (1985) 22-26.
Byrne, D.E., Suarez, E., Domínguez, J., Torres, M.A. and Segura, F. “The Nicaragua earthquakesequence: Source parameters and aftershocks study”. Seismological Research Letters, 64(1993).
Calix-Matute, R.F. Marco geológico del mapa metalogenético de Honduras. 2011, 44 pp. [inSpanish].
Chacón-Barrantes, S. “Sistema Nacional de monitoreo de tsunamis”. Revista Universidad enDiálogo, 5 (2) (2015) 101-111 [in Spanish].
Cheal, E. and Stewart, G. “Recent large earthquakes along the Middle American Trench and theirimplication for the subduction process”. Journal of Geophysical Research, 87 (1982) 329-338.
Christeson, G.L., McIntosh, K.D., Shipley, T.H., Flueh, E.R. and Goedde, H. “Structure of the CostaRica convergent margin, offshore Nicoya Peninsula”. Journal of Geophysical Research, SolidEarth, 104 (B11) (1999) 25.443-25.468.
Chuy, T. “Datos macrosísmicos de Nicaragua”. Revista Investigaciones Sismológicas en Cuba, 5(1984) 95-142 [in Spanish].
Correa-Mora, F., DeMets, C., Alvarado, D., Turner, H.L., Mattioli, G., Hernández, D., Pullinger, C.,Rodríguez, M. and Tenorio, C. “GPS-derived coupling estimates for the Central Americasubduction zone and volcanic arc faults: El Salvador, Honduras and Nicaragua”. GeophysicalJournal International, 179 (2009) 1.279-1.291.
Corti, G., Caminati, E., Mazzarini, F. and Oziel Garcia, M. “Active strike-slip faulting in El Salvador,Central America”. Geology, 33 (12) (2005) 989-992.
Cosgrove, J.W. and Hudson, J.A. Structural geology and rock engineering. 2016, 554 pp. ISBN-10:1783269561.
87
Cotilla, M.O. Caracterización geomorfológica y tectónica de la ciudad de Masaya y sus alrededores.Informe Científico-Técnico del Departamento de Sismología, Instituto de Geofísica yAstronomía, 1984, 32 pp. [in Spanish].
Cotilla, M. “El controvertido alineamiento Habana-Cienfuegos, Cuba”. Estudios Geológicos, 55(1999) 67-88 [in Spanish].
Cotilla-Rodríguez, M.O. “Evaluation of the recent intraplate seismic activity on Cochinos Bay,Cuba”. Revista Geográfica de América Central, 58 (2005) 195-222.
Cotilla, M. and Álvarez, J.L. “Regularidades sismogenéticas de la unidad neotectónica Occidentalde Cuba”. Revista Geológica de Chile, 28 (1) (2001) 3-24 [in Spanish].
Cotilla, M.O. and Córdoba, D. “Morphotectonics of the Iberian Peninsula”. Pure and AppliedGeophysics, 42 (4) (2004) 589-602.
Cotilla, M.O. and Córdoba, D. “Study of the earthquake of the January 23, 1880, in San Cristóbal,Cuba and the Guane fault”. Izvestiya Physics of the Solid Earth, 47 (6) (2011) 496-518.
Cotilla, M. and Córdoba, D. “El terremoto de Lorca-Murcia, España (2011): Interpretaciónmorfotectónica”. Revista Geográfica, 154 (2013) 115-131 [in Spanish].
Cotilla, M.O. and Udías, A. “Geodinámica del límite Caribe-Norteamérica”. Revista de la SociedadGeológica de España, 12 (2) (1999) 175-186 [in Spanish].
Cotilla, M.O., Córdoba, D. and Calzadilla, M. “Morphotectonic study of Hispaniola”. Geotectonics ,41 (5) (2007) 368-391.
Cotilla, M., Córdoba, D. and Núñez-Cornú, F. “Caracterización sismotectónica de México”. RevistaGeográfica de América Central, 2 (63) (2019) 103-139 [in Spanish].
Cotilla, M., González, E., Cañete, C., Díaz, J. and Carral, R. “La red fluvial de Cuba y suinterpretación morfoestructural”. (2003) doi:10.2307/40992852 [in Spanish].
Cotilla-Rodríguez, M.O., Córdoba-Barba, D., Núñez-Corú, F.J., Gómez-Hernández, A., Pinzón-López, J.I. and Rivera-Rodríguez, L.D. “Morfotectónica de Jalisco y Oaxaca (1), México”.Revista Geográfica de América Central, 59 (2017) 196-248 [in Spanish].
Cotilla, M., Bankwitz, P., Álvarez, L., Franzke, H.J., Rubio, M. and Pilarski, J. “Cinemáticaneotectónica de Cuba Oriental”. Revista de la Sociedad Geológica de España, 11 (1-2)(1998) 33-42 [in Spanish].
Cotilla, M.O., Bankwitz, P., Álvarez, L., Franzke, H.J., González, E., Grünthal, G., Pilarski, J., Díaz,J. and Arteaga, F. “Mapa sismotectónico de Cuba, escala 1:1.000.000”. ComunicacionesCientíficas sobre Geofísica y Astronomía, 3 (1991) 25 pp. [in Spanish].
Cotilla, M., Millán, G., Álvarez, L., González, D., Pacheco, M., and Arteaga, F. Elementos delesquema neotectogénico de Cuba. Informe Científico-Técnico, Instituto de Geofísica yAstronomía, Ministerio de Ciencia, Tecnología y Medio Ambiente de Cuba, 1993, 100 pp. [inSpanish].
Cowan, H., Prentice, C., Pantosti, D., de Martini, P. and Strauch, W. “Late Holocene earthquakeson the Aeropuerto Fault, Managua, Nicaragua”. Bulletin of the Seismological Society ofAmerica, 92 (5) (2002) 1.694-1.707.
Cruz, C. Notas generales sobre los estudios sismotectónicos y de riesgo sísmico en Honduras.Proyecto Regionalización Sismotectónica de América Central, Guatemala, SAREC, (1999)[in Spanish].
Deaton, B.C. and Burkart, B. “Time of sinistral slip along the Polochic fault of Guatemala”.Tectonophysics, 102 (1984) 297-313.
DeMets, C. “A new estimate for present-day Cocos-Caribbean plate motion: Implications for slipalong the Central American volcanic arc”. Geophysical Research Letters, 28 (2001) 4.043-4.046 doi:10.1029/2001GL013518.
DeMets, C., Gordon, R.G. and Argus, D.F. “Geologically current plate motions”. GeophysicalJournal International, 181 (1) (2010) 1-80 doi:10.1111/j.1365-246X.2009.04491.x
88
Dengo, G. Estructura geológica, historia tectónica y morfología de América Central. In: Agenciapara el Desarrollo Internacional, Soffer S. de R.L., México, 1968, 50 pp. [in Spanish].
Dengo, G. Problems of tectonic relations between Central America and the Caribbean.Transactions- Gulf Coast Association of Geological Society, 19 (1969) 311-320 pp.
Dengo, G. Estructura geológica, historia tectónica y morfológica de América Central. CentroRegional de Ayuda Técnica, Agencia para el Desarrollo Internacional. 2ª Edición, México,1973 [in Spanish].
Dengo, G., Bohnenberger, O. and Bonis, S. “Tectonics and igneous along the Pacific marginal zoneof Central America”. Geologische Rundschau, 59 (1970) 1.215-1.232.
Dewey, J.W. and Algermissen, S.T. “Seismicity of the Middle America arc-trench system nearManagua, Nicaragua”. Bulletin of the Seismological Society of America, 64 (1974) 1.033-1.048.
Dewey, J.W., Algermissen, S.T., Langer, C., Dillinger, W. and Hopper, M. The Managua earthquakeof 23 December 1972: Location, focal mechanism, aftershocks, relationships to recentseismicity of Nicaragua. Earthquake Engineering Research Institute, ConferenceProceedings VI, 1975.
Donnelly, T., Horne, G., Finch, R. and López-Ramos, E. Northern Central America: The Maya andChortis blocks. In: G.Dengo and J.Case (Editors), The Caribbean Region: Geological Societyof America, Geology of North America, H, 1990, 37-76 pp.
Durham, H.W. “Managua earthquake of 1931”. Engineering News Record, 22, 696-700. pr. 22, 696-700.
Dziewonski, A. M., Chou, T.A. and Woodhouse, J.H.” Determination of earthquake sourceparameters from waveform data for studies of global and regional seismicity”. JournalGeophysical Research, 86 (1981) 2.825-2.852.
Ekström, G., Nettles, M. and Dziewonski, A.M. “The global CMT project 2004-2010: Centroid-moment tensors for 13,017 earthquakes”. Physics Earth Planetary International, 200-201(2012) 1-9.
Ellis, A., DeMets, C., Briole, P., Cosenza, B., Flores, O., Graham, S., Guzman-Speziale, M.,Hernández, D., Kostoglodov, V., LaFemina, P., Lord, N., Lasserre, C., Lyon-Caen, H.,Rodríguez-Madariaga, M., McCaffrey, R., Molina, E., Rivera, J., Rogers, R. and Staller, A.“GPS constraints on deformation in northern Central America from 1999 to 2017, Part 1:Time-dependent modelling of large regional earthquakes and their post-seismic effects”.Geophysical Journal International, 214 (2018) 2.177-2.194.
Ellis, A., DeMets, C., McCaffrey, R., Briole, P., Cosenza-Muralles, B., Flores, O., Guzman-Speziale,M., Hernández, D., Kostoglodov, V., LaFemina, P., Lord, N., Lasserre, C., Lyon-Caen, H.,Rodríguez-Madariaga, M., Molina, E., Rivera, J., Rogers, R., Staller, A. and Tikoff, B. “GPSconstraints on deformation in northern Central America from 1999 to 2017, Part 2: Blockrotations and fault slip rates, fault locking and distributed deformation”. Geophysical JournalInternational, 218 (2019) 729-754.
Espinoza, F. Neotectónica de la Falla Nejapa, porción Oeste del Graben de Managua Nicaragua.Tesis de Maestría. Universidad Nacional Autónoma de México, 2007 [in Spanish].
Espinoza, V., Alcántara, G., Irasema, A., Santana, J.R. and Peña, R.J. “La zonificaciónmorfotectónica-volcánica en el análisis morfoestructural del relieve: El caso del municipio deManagua, Nicaragua”. Investigaciones Geográficas, Boletín del Instituto de Geografía, 87(2014) 118-140, dx.doi.org/10.14350/rig.43549 [in Spanish].
Fernández, M. “Daños, efectos y amenazas de tsunamis en América Central”. Revista Geológicade América Central, 26 (2002) 71-83 [in Spanish].
89
Figueroa J.A. “Catálogo de terremotos ocurridos en la República Mexicana”. Investigación yDesarrollo, 272 (1970).
Finch, R.C. and Ritchie, A.W. “The Guayape fault system, Honduras, Central America”. Journal ofSouth American Earth Sciences, 4 (1991) 43-60.
Fisher, A., Stein, C., Harris, R., Wang, K., Silver, E., Pfender, M., Hutnak, M., Cherkaoui, A., Bodzi, R. and Villinger, H. “Abrupt thermal transition reveals hydrothermal boundary and role of seamounts within the Cocos plate”. Geophysics Research Letters, 30 (11) (2003) 1.550 p.doi:10.1029/2002GLO16766.
Franco, A., Lasserre, C., Lyon-Caen, H., Kostoglodov, V., Molina, E., Guzman-Speziale, M.,Monterosso, D., Robles, V., Figueroa, C., Amaya, W., Barrier, E., Chiquin, L., Moran, S.,Flores, O., Romero, J., Santiago, J.A., Manea, M. and Manea, V.C. “Fault kinematics innorthern Central America and coupling along the subduction interface of the Cocos Plate,from GPS data in Chiapas (Mexico), Guatemala and El Salvador”. Geophysical JournalInternational, 189 (2012) 1.223-1.236.
Freeman, J. Earthquake damage and earthquake insurance. McGraw-Hill Book Company, NewYork, 1932, 907 pp.
French, S.W., Warren, L.M., Fischer, K.M., Abers, G.A., Strauch, W., et al. “Constraints on upperplate deformation in the Nicaraguan subduction zone from earthquake relocation anddirectivity analysis”. Geochemistry, Geophysics, Geosystems, 11 (2010) Q03S20.
Frez, J. and Gámez, E. “Aspectos de la sismotectónica de Nicaragua y su alrededor”. GEOS, 28 (2)(2008) 387-409 [in Spanish].
Frischbutter, A. “Structure of the Managua graben, Nicaragua, from remote sensing images”.Geofisica Internacional, 41 (2) (2002) 87-102.
Giunta, G., Beccaluva, L., Coltorti, M., Cutrupia, D., Dengo, C., Harlow, G.E., Mota, B., Padoa, E.,Rosenfeld, J. and Siena, F. “The Motagua suture zone in Guatemala”. Ofioliti, 27 (1) (2002)47-72.
Global Centroid-Moment-Tensor Project [CMT]. Global CMT Catalog Search, (2020).https://www.globalcmt.org/CMTsearch.html
Gokhale, N.W. A manual of problems in structural geology. 2011, Gordon, M.B. “The Guayape fault of Honduras: A major right-lateral fault cutting the Chortis block”.
EOS, 68, (1987), 423 pp., T41B-04, Poster.Gordon, M., and Muehlberger, W. “Rotation of the Chortis block causes dextral slip on the Guayape
fault”. Tectonics, 13 (1994) 858-872 doi:10.1029/94TC00923.Gorshkov, A.I., Novikova, O.V. and Gaudemer, Y. “Strong (M>7,0) earthquake-prone areas in
Hellenide Greece”. Izvestiya, Physics of the Solid Earth, 56 (1) (2020) 53-61. Gorshkov, A.I., Panza, G.F., Soloviev, A.A. and Aoudia, A. “Morphostructural zonation and
preliminary recognition of seismogenic nodes around the Adria margin in peninsular Italy andSicily”. Journal Seismology and Earthquake Engineering, 4 (1) (2002) 1-24.
Gorshkov, A.I., Soloviev, A.A., Jiménez, M.J., García-Fernández, M. and Panza, G.F. “Recognitionof earthquake-prone areas (M>5,0) in the Iberian Peninsula”. Rendiconti Lincei, 21 (2) (2010)131-162.
Gorshkov, A.I., Kuznetsov, I.V., Panza, G.F. and Soloviev, A.A. “Identification of future earthquakesources in the Carpatho-Balkan orogenic belt using morphostructural criteria”. Pure andApplied Geophysics, 157 (2000) 79-95.
Gorshkov, A.I., Panza, G.F., Soloviev, A.A. and Aoudia, A. “Identification of seismogenic nodes inthe Alps and Dynarides”. Bolletino della Società Geologica Italiana, 123 (2004) 3-18.
90
Guelfand, I.M., Guberman, S.A., Keylis-Borok, V.I., Knopoff, L., Press, F.S., Rantsman, E.Y.,Rotvain, I.M. and Skii, A.M. “Condiciones de surgimiento de terremotos fuertes (California yotras regiones)”. Vichislitielnaya Seismologiya, 9 (1976) 3-91 [in Russian].
Guendel, F. and Protti, M. “Sismicidad y sismotectónica”. Revista Física de la Tierra, 10 (1998) 19-51 [in Spanish].
Guzmán-Speziale, M. “Active seismic deformation in the grabens of northern Central America andits relationship to the relative motion of the North American-Caribbean plate boundary”.Tectonophysics, 337 (2001) 39-51.
Gvshiani, A.D., Gorshkov, A., Kosobokov, V., Cisternas, A., Philip, H. and Weber, C. Identificationof seismically dangerous zones in the Pyreness. Annales Geophysicae, 87 (1987) 681-690.
Hansen, F. Consideraciones sobre el establecimiento de un servicio sismológico instrumental en laRepública de Nicaragua. Tesis de la Universidad Nacional de Nicaragua, 1965 [in Spanish].
Hansen, F. and Chávez, V. Isoseismal maps of the Managua December 23, 1972 earthquake.Earthquake Engineering Research Institute, Conference Proceedings, California, 1973.
Harlow, D.H. and White, R.A. Shallow earthquakes along the volcanic chain in Central America:evidence for oblique subduction (abstract). Earthquake notes, 55 (1985) 28 p.
Herráiz-Sarachaga, M. Conceptos básicos de Sismología para Ingenieros. Universidad Nacional deIngeniería, Lima, Centro Peruano-Japonés de Investigaciones Sísmicas y Mitigación deDesastres, 1ª Edición 1997, 132 pp. [in Spanish].
Hey, R. “Tectonic evolution of the Cocos-Nazca spreading center”. Geological Society of AmericaBulletin, 88 (1977) 1.404-1.420.
Hodgson, V.G. Geología de Nicaragua. Servicio Geológico Nacional. Managua, Nicaragua, 1978,105 pp. [in Spanish].
Ide, S., Imamura, H., Yoshida, Y. and Abe, K. “Source mechanism of the Nicaraguan tsunamiearthquake of September”. Tsunami, 94 (1994) 637 pp.
Instituto de Geofísica y Astronomía-Instituto Nicaragüense de Estudios Territoriales [IGA-INETER].Estudio de factibilidad del Proyecto Agroindustrial Azucarero Tipitapa-Malacatoya. VolumenVI, para TECNOPLAN, S.A. Ministerio de Desarrollo Agropecuario y Reforma Agraria, 1981[in Spanish].
Imaev, V.S., Imaeva, L.P. and Koz’min, B.M. Active faults and seismotectonics of thenortheastern Yakutia. In: Yakutskii Nauchnyi Tsentr, 1990.
Instituto Nicaragüense de Estudios Territoriales [INETER]. Desplazamiento de actividadesvolcánicas durante el Terciario y la relación entre paleo-arcos volcánicos y depósitos deminerales en Nicaragua. 1983, 87 pp. [in Spanish].
INETER. Mapa geológico-minero de la República de Nicaragua, escala 1:500.000. (1995).INETER. Mapa geológico-minero de la República de Nicaragua, escala 1:750.000. (2004).INETER. Mapa de las fallas geológicas de Managua. Dirección de Geología Aplicada, Dirección
General de Geología y Geofísica [DGGG], (2015).INETER. Cuencas hidrográficas de Nicaragua bajo la metodología de Pfafstetter. Managua,
Nicaragua (2014) 36 pp. [in Spanish].INETER. Lista de tsunamis (maremotos) en América Central [in Spanish].
https://webserver2.ineter.gob.ni/tsunami/tsunami-list.htmlInternational Research Institute of Seismology [IRIS]. https://www.iris.edu/hq/International Seismological Centre [ISC]. ISC-EHB: Maps and cross sections, (2020).
http://www.isc.ac.uk/isc-ehb/regions/
91
James, K.H. Structural geology: From local elements to regional synthesis. Bubdschuh andAlvarado (Editor). In: Central America Geology Resources and Hazards, 2015, 46 pp.
Kanamori, H. and Kikuchi, M. “The 1992 Nicaragua earthquake: A slow tsunami earthquakeassociated with subducted sediments”. Nature, 361 (1993) 714-716.
Kobayashi, D., LaFemina, P., Geirsson, H., Chichaco, E., Abrego, A., et al. “Kinematics of theWestern Caribbean: Collision of the Cocos ridge and upper plate deformation”.Geochemistry, Geophysics and Geosystems 15 (2014) 1.671-1.683.
Kolarsky, R.A. and Mann, P. Structure and neotectonics of an oblique-subduction margin,southwestern Panama. In: P.Mann (Editor), Geologic and Tectonic Development of theCaribbean Plate Boundary in Southern Central America. Geological Society of AmericaSpecial Paper, 295 (1995) 131-158 pp.
Kolarsky, R.A., Mann, P. and Montero, W. Forearc deformation related to the subduction of theCocos ridge, southeastern Costa Rica. In: P.Mann (Editor), Geologic and tectonicdevelopment of the Caribbean Plate Boundary in southern Central America. GeologicalSociety of America, Special Paper, 295 (1995) 235-262.
Krestnikov, V.N., Frend, V.M. and Shebalin, V. Sobre la metodología de las investigacionesgeológicas y sismológicas para la estimación de la peligrosidad sísmica. In: Investigación dela sismicidad de las zonas de baja actividad sísmica (Cuba Central). Editorial Nauka, Moscú,1983 [in Russian].
Krieger, L. and Heimann, S. “MoPaD-Moment Tensor Plotting and Decomposition: A tool forgraphical and numerical analysis of Seismic Moment Tensors”. Seismological ResearchLetters, 83 (2012) 589-595.
Kutterolf, S., Liebetrau, V., Mörz, T., Freundt, A., Hammerich, T. and Garbe-Schönberg, D. “Lifetimeand cyclicity of fluid venting at forearc mound structures determined by tephrostratigraphyand radiometric dating of authigenic carbonates”. Geology, 36 (9) (2008) 707-710doi:10.1130/G24806A.1
La Femina, P.C., Dixon, T.H. and Strauch, W. “Bookshelf faulting in Nicaragua”. Geology, 30 (2002)751-754.
La Femina, P.C., Connor, Ch.B., Hill, B.E. and Strauch, W. “Magma-tectonic interactions inNicaragua: the 1999 seismic swarm and eruption of Cerro negro volcano”. Journal ofVolcanology and Geothermal Research, 137 (2004) 187-199.
La Femina, P.C., Dixon, T.H., Govers, R., Norabuena, E., Turner, H., Saballos, A., Mattioli, G.,Protti, M. and Strauch, W. “Fore-arc motion and Cocos Ridge collision in Central America”.Geochemestry, Geophysics, and Geosystems, 10(5) (2009) 21 pp. doi:10.1029/2008GC002181
Langer, C.J., Hooper, M.G., Algermissen, S.T. and Dewey, J.W. “Aftershocks of the ManaguaNicaragua, earthquake of December, 23 1972”. Bulletin of the Seismological Society ofAmerica, 64 (1974) 1.005-1.016.
Leeds, D. “Catalog of Nicaraguan earthquakes”. Bulletin of the Seismological Society of America,64 (4) (1974) 1.135-1.158.
Lilljequist, R. and Hodson, G. Desplazamiento de actividades volcánicas durante el Terciario y larelación entre Paleo-Arcos volcánicos depósitos minerales en Nicaragua. INETER, 87 pp.,Managua, Nicaragua, 1983 [in Spanish].
Luna, D.A., Alonso-Chaves, F.M., Fernández, C. and García-Navarro, E. “Análisis de la actividadsísmica en el Golfo de Tehuantepec (Fosa Mesoamericana, México): Terremotos demagnitudes elevadas en relación con fallas normales, réplicas e implicacionessismotectónicas”. Geogaceta, 64 (2008) 23-26 [in Spanish].

92
Machette, M.N. “Active, capable, and potentially active faults- a paleoseismic perspective”. Journalof Geodynamics, 29 (3-5) (2000) 387-392.
Madariaga, R. “Sismicidad de Chile”. Revista Física de la Tierra, 10 (1998) 221-258 [in Spanish].Malfait, B. and Dinkelman, M.G. “Circum-Caribbean tectonic and igneous activity and evolution of
the Caribbean plate”. Bulletin of the Geological Society of America, 83 (1972) 251-272.Mann, P. Overview of the tectonic history of northern Central America. In: P.Mann (Editor). Geologic
and Tectonic Development of the Caribbean Plate Boundary in Northern Central America.Geological Society of America Special Paper 42 (2007) 21 pp.
Mann, P., Schubert, C. and Burke, K. Review of Caribbean neotectonics. In: G.Dengo and J.E.Case(Editors): The Geology of North America, H. The Caribbean Region. Geological Society ofAmerica, Boulder, 1990, 307-338.
Mann, P., Calais, E., Ruegg, J.C., DeMets, C. and Jansma, P.E. “Oblique collision in thenortheastern Caribbean from GPS measurements and geological observations”. Tectonics, 2(6) (2002) 26 pp.
Manton, W.I. “Tectonic interpretation of the morphology of Honduras”. Tectonics, 6, 633-651, 1987.Marshall, J.S. and Vannuchi, P. “Forearc deformation influenced by subducting plate morphology
and upperplate discontinuity, Pacific Coast, Costa Rica”. Geological Society of AmericaBulletin, 33 (3) (2003).
Martínez, W. “The interrelationship between volcanic and seismic activity to subduction-relatedtectonics in Western Nicaragua”. Geological Society of Japan, 99 (1993) 185-194.
Martínez, W. and Noguera, L. “Geological framework of earthquake occurrence in Nicaragua,Central America”. Geological Society of Japan, 98 (2) (1992) 165-176.
Martinez-Díaz, J.J., Álvarez, J.A., Benito, B. and Hernández, D. “Triggering of destructiveearthquakes in El Salvador”. Geology, 32 (1) (2004) 65-68.
Matumoto, T. and Latham, G. “Aftershocks and intensity of the Managua earthquake of 23December 1972”. Science, 181 (4099) (1973) 545-547.
McBirney, A.R. and Williams, H. Volcanic history of Nicaragua. Publication of the GeologicalSociety, 55 (1965) 65 pp.
McIntosh, K. Silver, E., and Shipley, T. “Evidence and mechanisms for forearc extension at theaccretionary Costa Rica convergent margin”. Tectonics, 12 (1993) 1.380-1.392.
McIntosh, K.D., Silver, E.A., Ahmed, I., Berhorst, A., Ranero, C.R., Kelly, R.K. and Flueh, E.R. TheNicaragua Convergent Margin. In: T.Dixon, J.Moore (Editors), The Seismogenic Zone ofSubduction Thrust Faults. Columbia University Press, New York, 2007, 257-287.
Medvedev, S.V. Determinación de la intensidad de los terremotos Voproci Inzhenernoi Seismologii,Vol. 19, 1978. Editorial Nauka [in Russian].
Meschede, M. and Barckhausen, U. Plate tectonic evolution of the Cocos-Nazca spreading center.In: E.A.Silver, G.Kimura, G., P.Blum and T.H.Shipley (Editors): Proceedings of the OceanDrilling Project, Scientific Results: College Station, Texas, Ocean Drilling Program Leg 170(2000) 1-10 pp.
Meyer-Abich, H. “Los volcanes activos de Guatemala y El Salvador”. Anales del Servicio GeológicoNacional de El Salvador, 3 (1956) 1-102 [in Spanish].
Molina, E., Marroquin, G., Escobar, J.J., Talavera, E., Rojas, W., Climent, A., et al. ProyectoRESIS-II. Seismic threat assessment in Central America, 2009, 31 pp.
Molnar, P. and Sykes, L. “Tectonics of the Caribbean and Middle America regions from focalmechanisms and seismicity”. Bulletin of the Seismological Society of America, 80 (1969)1.639-1.684.
Montero, W. and Peraldo, G. “Current knowledge of the Central America historical seismicity: Ananalysis of recent catalogues”. Annali di Geofisica, 47 (2) (2004) 477-485.
Monterroso, D.A. and Kulhánek, O. “Spatial variations of b-values in the subduction zone of CentralAmerica”. Geofísica Internacional, 42 (2003) 575-587.
93
Morales, A., Avilés, R., Sánchez, J. and Tenorio, V. 6: Encuesta macrosísmica del terremotoocurrido el 10 de abril, 2014. Sismos y Volcanes de Nicaragua. Abril 2014, 54-62 pp.https://webserver2.ineter.gob.ni/sis/bolsis/bolsis.html
Morales, A. and Tenorio, V. 5.2: Encuesta macrosísmica del terremoto magnitud 5,7 del 3 deagosto, 6:03 a.m. Sismos y Volcanes de Nicaragua. Agosto 2005. https://webserver2.ineter.gob.ni/sis/bolsis/bolsis.html
Morales, A., Tenorio, V. and Talavera, E. 3.12: Encuesta macrosísmica del terremoto al norteMasaya, del 07 de julio de 2000. Sismos y Volcanes de Nicaragua. Julio, 2000.https://webserver2.ineter.gob.ni/sis/bolsis/bolsis.html
Muehlberg, W.R. and Ritchie, A.W. “Caribbean-American plate boundary in Guatemala andsouthern Mexico as Seen on Skylab IV orbital photography”. Geology, 3 (5) (1975) 232-235.
Nieto-Samaniego, A.F., Barajas-Gea, C.I., Gómez-González, J.M., Rojas, A., Alaniz-Álvarez, S.A.and Xu, S. “Geología, evolución estructural (Eoceno al actual) y eventos sísmicos del Grabende Santiaguillo, Durango, México”. Revista Mexicana de Ciencias Geológicas, 29 (1) (2012)115-130 [in Spanish].
NOAA. Seismicity map of Middle America. 1982, National Geophysical Data Center and NationalEarthquake Information Service.
Novikova, O.V. and Gorshkov, A.I. “High seismicity intersections of morphostructural lineaments:The Black Sea-Caspian Regions”. Journal of Volcanology and Seismology, 12 (6) (2018) 23-31.
Peraldo-Huertas, G., Montero-Phly, W. and Camacho, E. “El terremoto del 29 de Mayo de 1879:Una ruptura de magnitud Ms>7,0 en la zona limítrofe sur de Costa Rica y Panamá”. RevistaGeográfica de América Central, 34-35 (2006) 31-42 [in Spanish].
Pindell, J. and Kennan, L. Kinematic evolution of the Gulf of Mexico and Caribbean. R.H.Fillon, N.CRosen and P.Weimer (Editors), In: Petroleum Systems of Deep-Water Basins: Global andGulf of Mexico Experience, Houston, Texas, U.S.A. (2001). GCSSEPM Foundation, 21st
Annual Research Conference, 193-220 pp.Plafker, G. Field reconnaissance of the effects of the earthquake of April 13, 1973, near Laguna de
Arenal, Costa Rica. U.S. Geological Survey Open file Report, 1973 17 pp. Plafker, G. and Brown Jr., R.D. Surface geologic effects of the Managua earthquake of December
23, 1972. Earthquake Engineering Research Institute. Conference Proceedings. VI, 1975.Plank, T., Balzer, V. and Carr, M. “Nicaraguan volcanoes record paleoceanographic changes
accompanying closure of Panama gateway”. Geology 30 (2002) 1.087-1.090.Probabilistic Risk Assessment Initiative (CAPRA). Análisis probabilista de amenazas y riesgos
naturales. Tomo III, Informe técnico ERN-CAPRA-T2-1. Revisión de eventos históricosimportantes. 2008, 119 pp. [in Spanish].
Protti, M., Gundel, F. and McNally, K. Correlation between the age of the subducting Cocos plateand the geometry of the Wadat-Benioff zone under Nicaragua and Costa Rica. P.Mann(Editor), In: Geological and Tectonics Development of the Caribbean Plate Boundary inSouthern Central America. Boulder, Colorado, Geological Society of America, Special Paper295 (1995) 309-326 pp.
qGIS (2020). QGIS 3.10, A Coruña. QGIS.org, 2020. QGIS Geographic Information System. QGIS Association. https://qgis.org
Radulian, M., Mandrescu, N., Panza, G.F., Popescu, E. and Utale, A. “Characterization ofseismogenic zones of Romania”. Pure Applied Geophysics, 157 (2000) 57-77.

94
Ritchie, A.W. Jocotan fault: Possible western extension. Publication of Geology, ICAITI, 5 (1976)700-701.
Rivera, L. and Cisternas, A. “Stress tensor and fault plane solutions for a population ofearthquakes”. Bullettin of the Seismological Society of America, 80 (3) (1989) 600-644.
Rogers, R. “Slab break-off mechanism for the late Neogene uplift of Honduras, Northern CentralAmerica”. EOS, Transactions, American Geophysical Union, 81 (2000) 1.179 p.
Rojas, W., Bungum, H. and Lindholm, C. “Historical and recent earthquakes in Central America”.Revista Geológica de América Central, 16 (1993) 5-22.
Rubí-Tellez, C.A. Tectónica aciva en la Cuenca de Managua: Paleosismicidad de la falla Cofradía.Tésis doctoral de la Universidad de Barcelona, España, 2006, 342 pp. [in Spanish].
Satake, K., Bourgeois, J., Abe, K., Abe, K., Tsuji, Y., Imamura, F., Iio, Y., Katao, H., Noguera, E.and Estrada, F. “Tsunami field survey of the 1992 Nicaragua earthquake”. EOS,Transactions, American Geophysical Union, 74 (13) (1993) 145-160.
Scholz, Ch.H. The mechanics of earthquakes and faulting. 3 rd edition Cambridge University Press,2019, 491 pp.
Shewchuk, J.R. Triangle: Engineering a 2D quality mesh generator and delaunay triangulator. In:First Workshop on Applied Computational Geometry (Philadelphia, PA), 124-133, ACM, May1996. www.cs.cmu.edu/~quake/triangle.html
Segura, F.F. Reseña de la sismicidad en Nicaragua, con énfasis en la Depresión Nicaragüense.INETER, 2018, 258 pp. [in Spanish].
Sthaler-Vázquez, A. Modelización de las deformaciones corticales de El Salvador (Centroamérica)mediante la integración de datos geodésicos (GPS), geológicos y sismológicos. Phd Thesis,Universidad Politécnica de Madrid, 2014, 256 pp. [in Spanish].
Simkin, T. and Siebert, L. Volcanoes of the World. Geoscience Press, 2nd Edition 1994, 349 pp.ISBN 094500512.1
Stoiber, R.E. and Carr, M.J. “Quaternary volcanic and tectonic segmentation of Central America”.Bulletin of Volcanology, 37 (1973) 304-325.
Strauch, W. Amenazas por maremotos (tsunamis) en Nicaragua y prevención de desastres.INETER, 2005 [in Spanish].
Suárez, G. Seismotectonics of Middle America. In: D.B.Slemmons, E.R.Engdahl, M.D.Zoback andD.D.Blackwell (Editors): Neotectonics of North America, Boulder, Colorado, GeologicalSociety of America, Decade Map Volume I (1991) 309-321 pp.
Sultán, D.I. “The Managua earthquake “. Military Engineer, 23 (1931) 354-361.
Tanner, J.G. and Shepherd, J.B. Seismic hazard in Latin America and the Caribbean. Projectcatalogue and seismic hazard maps. Instituto Panamericano de Geografía e Historia, Volume1 (1997) 143 pp.
Tavera, H. and Buforn, E. “Sismicidad y sismotectónica de Perú”. Revista Física de la Tierra, 10(1998) 187-219 [in Spanish].
Turner, H.L., LaFemina, P., Saballos, A., Mattionli, G.S., Jansma, P.E., and Dixon, T. Kinematics ofthe Nicaraguan forearc from GPS geodesy. Geophysical Research Letters, 34 (2) (2007)L02302.
UNESCO. Tsunami hazard in Central America: Historical events and potential sources. In:Workshop Report No. 278, 2018, 47 pp. Intergovernmental Oceanographic Commission,Costa Rica.
U.S. Geological Survey [USGS]. https://earthquake.usgs.gov/Uyeda S. “Comparative subductology”. Episodes, 5, (1983) 19-24.

95
Uyeda, S. and Kanamori, H. “Back-Arc opening and the mode of subduction”. Journal ofGeophysical Research, 84(B3) (1979), 1.049-1.061.
Vela-Velásquez, Ch. “Subdivisión de la placa de Nazca en tres nuevas placas tectónicas y suincidencia con la sismicidad peruana actual”. Revista del Instituto de InvestigacionesFIGMMG, 12 (23) (2009) 77-87 [in Spanish].
von Huene, R., Ranero, C.R., Weinrebe, W. and Hinz, K. “Quaternary convergent margin tectonicsof Costa Rica, segmentation of the Cocos Plate, and Central American volcanism”.Tectonics, 19 (2) (2000) 314-334 doi: 10.1029/1999TC001143.
Walther, C.H.E., Flueh, E.R., Ranero, C.R., Von-Huene, R. and Strauch, W. “Crustal structureacross the Pacific margin of Nicaragua: Evidence for ophiolitic basement and a shallowmantle sliver”. Geophysics Journal International, 141 (2000) 759-777.
Ward, P.L., Gibbs, J., Harlow, D. and Aburto, A. “Aftershocks of the Managua, Nicaragua,earthquake and the tectonic significance of the Tiscapa fault”. Bulletin of the SeismologicalSociety of America, 64 (1974) 1.017-1.029.
Weinberg, R.F. “Neotectonic development of Western Nicaragua”. Tectonics, 11 (1992) 1.01-1.017. Wesnousky, S.G. and Scholz, C.H. “The craton: Its effect on the distribution of seismicity and stress
in North America”. Earth Planetary Science Letters, 48 (1980) 348-355.Wessel, P. and Smith, W.H.F. “New improved version of generic mapping tools released”. EOS, 79
(47) (1998) doi:10.1029/98EO00426Weyl, R. Geology of Central America. In: Gebrüder, Borntraeger, Berlin and Sturttgar, VIII, (1980)
371 pp. White, R.A. Tectonics implications of upper-crustal seismicity in Central America. In: D.B
Slemmons, E.R.Engdahl, M.D.Zoback and D.D.Blackwell (Editors): Neotectonics of NorthAmerica. Boulder, Colorado, Geological Society of America, Decade Map, Volume I (1991)3.323-3.338.
White, R.A. and Harlow, D.H. “Destructive upper-crustal earthquakes of Central America since1900”. Bulletin of the Seismological Society of America, 83 (1993) 1.115-1.142.
Wiesemann, G. “Remarks on the geologic structure of the Republic of El Salvador, CentralAmerica”. Mitt. Geol. Palaőnt. Inst. Univ. Hamburg, 44 (1975) 557-574.
Williams, H. The great eruption of Consigüina, Nicaragua in 1835. University of CaliforniaGeological Sciences, 38 (1955) 1-86.
Williams, H. and Meyer-Abich, H. Volcanism in the southern part of El Salvador. University ofCalifornia Publ. Geological Sciences, 32, (1955) 1-64.
Wdowinski, S. “A new class of transform plate boundary”. Physics and Chemestry of the Earth, 23(7-8) (1998) 775-783.
World Stress Map Database Release [WSM]. Editors: O.Heidbach, M.Rajabi, K.Reiter andM.Ziegler-WSM Team. The Helmholtz Centre Potsdam, German Research Centre forGeosciences, 2016 doi.org/10.5880/WSM.2016.001
Ye, L., Lay, T. and Kanamori, H. 2013. “Large earthquake rupture process variations on the MiddleAmerica megathrust”. Earth and Planetary Science Letters, 381 (2013) 147-155doi:10.1016/j.epsl.2013.08.042
Zhidkov, M.P., Rotvain, I.M. and Sadowskii, A.M. “Pronóstico del lugar de posible ocurrencia deterremotos fuertes. IV. Intersecciones múltiples de lineamientos de la Meseta Armeniana, losBalcanes y la Cuenca del Mar Egeo”. Vichislitelnaya Seismologiya, 8 (1975) 53-70 [inRussian].

96
Zijlstra, A. World’s 10 most dangerous volcanoes identified (2015). https://www.manchester.ac.uk/discover/news/worlds-10-most-dangerous-volcanoes-identified/
Zoback, M.D. “Managing the seismic risk pored by wastewater disposal”. Earthquake, 57 (4) (2012)38 pp.
Tables Relationship
97
“Comienza haciendo lo necesario; luego haz lo posible y derepente estarás haciendo lo imposible”.
Francisco de Asís (Italia, ¿?-1226)
Tables Relationship
Table 1. Some data on the study region.Table 2. Maximum altitudes.Table 3. Data from the Lakes.Table 3A. Basins in the N and S parts of the two largest Lakes.Table 4. First information about earthquakes in Central America.Table 5. Summary of the approximate numbers of significant earthquakes and deaths.Table 6. Selection of earthquakes in America with more than a thousand deaths.Table 7. Earthquakes of America (M>8,4) recorded by U.S.G.S.Table 8. Selection of strong earthquakes (instrumental stage) in the region of study.Table 9. Recent earthquakes that significantly affected Central America.Table 10. Selection of USGS earthquakes (periods: 1950-1990 and 2000-2019).Table 11. Statistics from the table above.Table 12. Data from Tanner and Shepherd (1977).Table 12A. Macroseismic data of Nicaragua (Chuy, 1984).Table 13. Earthquake selection (ES-Guatemala-H) by USGS (1902-1919).Table 14. Earthquakes recorded by IRIS (1970-2018).Table15. Earthquakes selection from IRIS.Table 16. Strongest seismic activity data from five Pacific American countries.Table 17. Summary of the tsunamis in Central America.Table 18. The used data.Table 18A. Intervals.Table 19. Brief definitions of morphotectonic elements.Table 19A. Main elements of the Central America-I Megablock.Table 20. Alignments and knots of Central America countries.Table 21. Features, structures and unique elements of Central America Provinces.Table 22. Selection of the main rivers of Nicaragua.Table 23A. Main local morphotectonic data (Part 1).Table 23B. Main local morphotectonic data (Part 2).Table 24. Seismic hazard regionalization.Table 25. Structure and hazards.Table 26. Overall ranking.Table 27. Regional seismogenic linear structure.Table 28. Main characteristics to Seismotectonic Province of Central America I.Table 29. Alternative seismogenic references.
98
Figures Relationship

99
“Cada vez que enseñes, enseña a dudar de aquello queenseñas”.
José Ortega y Gasset (España, 1883-1955)
Figures Relationship
Figure 1. Basic scheme of Central America and its surroundings.Figure 2. Simplified tectonic representation.Figure 2A. Structural models to faults interception.Figure 3. Neotectonic scheme of the Pacific and volcanic margins of Nicaragua.Figure 3A1. Directional diagrams (see Figure 3).Figure 3A2. Representation of some neotectonic elements in Nicaragua.Figure 3A3. Structural analysis in the Central Nicaragua Depression.Figure 3A4. Morphotectonic scheme of the linking zone between the lakes.Figure 3A4-1. Detail of morphotectonic at Tisma area.Figure 3B. Geological scheme of Nicaragua.Figure 3C. Simplified neotectonic picture of Managua Lake (Block 2 yellow of Figure 3A3).Figure 3D. Interpretation of the neotectonic activity in Managua Lake.Figure 4. Selection of strongest seismic events in Central America.Figure 5A. Seismicity of Central America-Caribbean (1904-2017) according ISC.Figure 5B. Focal mechanism solutions.Figure 6. Seismicity of Honduras-Nicaragua (1519-1903) according to RESIS-II.Figure 6A-1. Seismicity from Nicaragua network, INETER (January, 1975-May, 2019) [h 0- >100 (km)].Figure 6A-2. Seismicity from Nicaragua network, INETER (January, 1975-May, 2019) [h< 50 (km)].Figure 6A-3. Seismicity from Nicaragua network, INETER (January, 1975-May, 2019) [50< h< 100 (km)].Figure 7A. Stress of earthquake to depths [0, 40) km (CMT).Figure 7B. Stress of earthquake to depths [40, 110) km (CMT). A-B-C-D=as in figure 7A.Figure 7C. Stress of earthquake to depths [110, 250) km (CMT).Figure 8. Legend of World Stress Map, 2016.Figure 8A. Part of World Stress Map, 2016.Figure 9. Isoseismal maps of two Nicaraguan earthquakes. Figure 9A. Modified Managua City scheme from Sultan (1931).Figure 10. Seismicity map 1520-1899 (M>4,75) Figure 11. Seismicity map 1900-1959 (M>4,75) Figure 12. Seismicity map 1950-1972 (M>4,75) Figure 13. Seismicity map 1951-1982 (M>4,25) Figure 15. Seismicity map 1983-1992 (M>4,75) Figure 16. Seismicity map 1993-2005 (M>4,25) Figure 17. Seismicity map 2006-2018 (M>4,25) Figure 18. Seismicity map 2006-2018 (M>3,75) Figure 19. Profiles.Figure 19.1. Profile “noroeste”
100
Figure 19.2. Profile “centro”.Figure 19.3. Profile “sureste”. Figure 20. Sliding stocking.Figure 21. Mmax.Figure 22. Mmax.Figure 23. Mmax.Figure 24. Mmax.Figure 25. Mmax.Figure 26. Mmax.Figure 27. Morphotectonic scheme of El Salvador.Figure 27A. Morphotectonic scheme of Central America.Figure 28. Morphoisohipses scheme of Nicaragua.Figure 29. Preliminary morphotectonic diagram of Nicaragua.Figure 30. Seismotectonic model of Nicaragua.
Acronyms
ALT= Alignment TismaCA= Central AmericaCA-I= Central America-ICA-II= Central America-IICLVD= Compensated Linear Vectorial DipoleCMT= Centroid Moment TensorCR= Costa RicaES= El SalvadorH= HondurasHES= Honduras + El SalvadorIGA= Instituto de Geofísica y AstronomíaINETER= Instituto Nacional de Estudios TerritorialesIRIS= International Research Institute of SeismologyISC= International Seismological CentreMDFO= First Order Main WatershedNI= NicaraguaPTT= Triple Tectonic PointS-A= Seismic activitySEU= Seismotectonic unitSMP= Seismotectonic mapSPR= Seismotectonic provinceTU= Tectonic unitU.S.A.= United States of AmericaU.S.G.S.= U.S. Geological Survey
Note: In the tables and figures there are other abbreviations.
“A different language is a different vision of the life”.Federico Fellini (Italia, 1920-1993)

101
AUTHORS
Dr. Mario Octavio COTILLA-RODRÍGUEZ (Sismotectónica/Seismotectonic)
Dr. José Leonardo ÁLVAREZ-GÓMEZ (Peligrosidad Sísmica/SeismicHazard)
Dr. Diego CÓRDOBA-BARBA (Perfiles Sísmicos/ SeismicProfiles)
102
MSc. Angélica MUÑOZ-GUERRERO (Geología/ Geology)
“Las acciones de los hombres son las mejores intérpretes de suspensamientos”.James Augustine Aloysius Joyce (Irlanda, 1852-Suiza, 1941)
Copyright © 2022 FDOKUMEN