Rose Petal Color Determination - WUR eDepot
63
ROSE PETAL COLOR DETERMINATION - Tools to determine petal color in a segregating population A Thesis by ROBERT STOLKER April 2009 Supervisors Dr. Frans A. Krens* Dr.ir. Chris A. Maliepaard* M.Sc. Virginia W. Gitonga* *Plant Sciences Group - Wageningen University & Research Center Plant Breeding
-
Upload
khangminh22 -
Category
Documents
-
view
2 -
download
0
Transcript of Rose Petal Color Determination - WUR eDepot
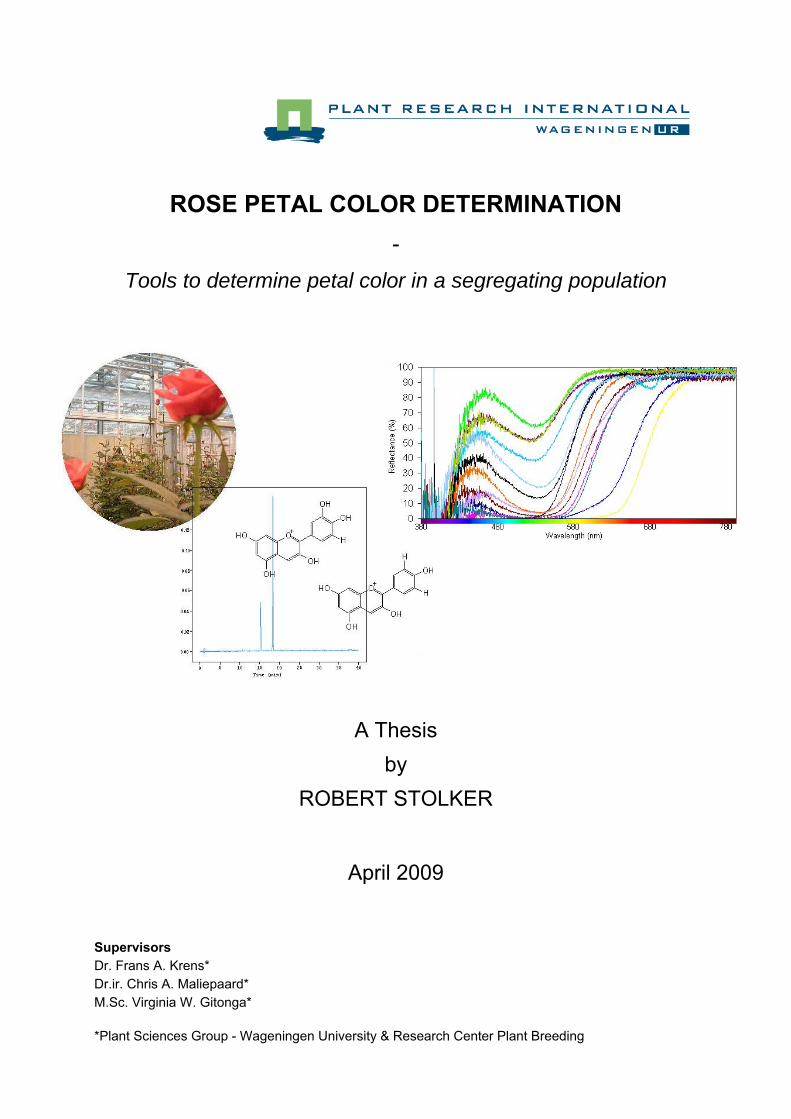
ROSE PETAL COLOR DETERMINATION
-
Tools to determine petal color in a segregating population
A Thesis by
ROBERT STOLKER
April 2009 Supervisors Dr. Frans A. Krens* Dr.ir. Chris A. Maliepaard* M.Sc. Virginia W. Gitonga* *Plant Sciences Group - Wageningen University & Research Center Plant Breeding

R. Stolker, 2009 ROSE PETAL COLOR DETERMINATION Laboratory of Plant Breeding
ABSTRACT
ROSE PETAL COLOR DETERMINATION -
Tools to determine petal color in a segregating population. (April 2009) Robert Stolker, Wageningen University
Little is known about the genetics of Rosa, the major economically important genus
of ornamental horticulture. This project aims at a better understanding of the heritability of color. For that, unbiased screening methods for color are needed. In this project, several methods are checked for suitability and correlations among them are determined. The different methods used to measure rose flower color are visually using the Royal Horticultural Society (RHS) color standards 2001, instrumentally using a reflectance colorimeter and spectrophotometer and chemically using Reverse Phase - High Performance Liquid Chromatography (RP-HPLC). In general, there were good correlations between chemical components and colorimetric indices lightness (L*), chroma (C*) and hue angle (hº) calculated from the reflectance data. The absorbance measurements enable estimation of both the total anthocyanidin concentration and the percentage pelargonidin when not overruled by cyanidin. When studying the inheritance of flower color, one must focus on the inheritance of the individual pigments since flower color is not inherited as such. The reflectance and absorbance method can be used for estimations of the anthocyanidin composition of rose flowers. However, the method most useful when studying the inheritance of individual pigments is the HPLC method because this method provides detailed qualitative and quantitative data on the anthocyanidin content. HPLC alone is not enough for genetics on flower color since color is a joint effect of the anthocyanidin-based pigments and a.o. co-pigmentation, pH and cellular structure. According to the continuous range of anthocyanidin concentrations in the population, the different anthocyanidin pigments seem to inherit quantitatively. In the segregating population, the frequency distribution of the anthocyanidin content is skewed to the right. Overrepresentation of individuals with a low anthocyanidin content is possibly caused by the presence of an inhibitor x+ which is epistatic over the dominant f3’h locus. Further analyses of crosses and QTL mapping are necessary to be able to verify the hypothesized presence of a major gene inhibiting the expression of the f3’h locus in P867.
2
R. Stolker, 2009 ROSE PETAL COLOR DETERMINATION Laboratory of Plant Breeding
ACKNOWLEDGMENTS
I would like to thank drs. Paul (L.C.P.) Keizer for his indispensable help in designing
appropriate statistical software and his help with the statistical analysis. I’d like to say thanks to dr.ir. Gerrit Polder for his help in getting familiar with the reflectance apparatus. I also want to thank dr.ir. Chris A. Maliepaard for his view on the statistical analysis. Also thanks to Simon Ribot for all his guidance and assistance in getting familiar with the HPLC apparatus and the discussions that led to new ideas or insights. I want to thank Virginia Gitonga for all the help in acquiring the data and for her company during the long days of data collection. As last, but certainly not the least, thanks to my family: mom and dad that showed interest in my research and would always listen to me.
3
R. Stolker, 2009 ROSE PETAL COLOR DETERMINATION Laboratory of Plant Breeding
TABLE OF CONTENTS
Page
ABSTRACT …………..…….….….………………………………………………... 2 ACKNOWLEDGMENTS …………...…………………………....………………… 3 TABLE OF CONTENTS ……….……..…………………………...……………….. 4 CHAPTER I INTRODUCTION ………………...………………………………… 5
II LITERATURE REVIEW ………..…………………………………. 8
Flower color: the pigments ……………………….…………. 8 The rose anthocyanin biosynthetic pathway …….………….. 8 Inheritance of anthocyanin pigments ………..…………….… 11
III MATERIALS AND METHODS …………………………………… 12
Plant material …………….………………………………….. 12 Environment …….……....…………………………………… 12 Data Collection ……....….…………………………………… 13
Royal Horticultural Society Color Chart …......................... 13 Reflection measurements ……………………………....... 14 Extractions of anthocyanins ................................................... 16 Acid hydrolysis ………………………………………… 16 Absorbance measurements ……………………………… 16 Chromatographic analyses ……………………………... 17 Chemicals ……………………………………………... 18 IV RESULTS AND DISCUSSION ….….….…………………………... 19
Royal Horticultural Society Color Chart (RHSCC) ……........ 19 Colorimetric method ……………………………...…………. 20 Quantifying reflectance curves …………………………. 20
UV/Vis spectrophotometer ……...………………………….. 22 Maximum wavelength ………………………………… 23
High Performance Liquid Chromatography …….………….. 24 Peak identification ……………………………………. 25 Quantifying anthocyanidins …………………………… 28 Correlations between the different techniques ……………… 31 Inheritance of anthocyanidin pigments ……...…………….... 43
V CONCLUSIONS …….….…………………………………………... 49
LITERATURE CITED ………………..…………………………………………... 52 APPENDIX ……………………………………………….………………………... 56
4
R. Stolker, 2009 ROSE PETAL COLOR DETERMINATION Laboratory of Plant Breeding
CHAPTER I
INTRODUCTION
Roses (Rosa spp.) have been cultivated for over 2000 years. In the early days of rose cultivation, it is assumed that early horticulturists obtained desirable rose species from the wild and grew them in collections. Domestication of the rose species was a slow process. However, the development of domesticated forms was speeded up by discarding the undesirable plants and by improving the propagation methods. Travelers considerably broadened the genetic variation by introducing novel genotypes and cultivars (de Vries & Dubois, 1996). Since the 19th century, rose breeding has expanded tremendously. Rosa has become the major economically important genus of ornamental horticulture because of its popularity as garden-, landscape- and pot plants or cut flowers, and its use in the perfume industry (Gudin, 2000). The turnover on the Dutch flower auctions was 484 x 106 euro in 1996, this has increased to 795 x 106 euro in 2007 (Flower Council of Holland, 2009). The genus Rosa belongs to the family of the Rosacaea. According to Gudin (2000), there are about 200 species and more than 18.000 commercial cultivars in the genus. The modern cultivars are mostly complex tetraploids while the ploidy levels of wild species range from diploid to octoploid. Despite the high number of species, most of the modern commercial cultivars are derived from only 8 to 10 wild diploid and a few tetraploid rose species (Zhang et al., 2006; Crespel & Mouchotte, 2003). The average DNA content in diploid rose is varying from 0.78 to 1.29 pg/ 2C (Yokoya et al., 2000). Although roses have a low basic chromosome number (x=7) and a relatively small genome size, little is known on the genetics of rose (Gudin, 2000). Up to the 1980’s, conventional genetics results have been scarce. Breeders and genetic researchers in rose have to cope with the difficulty of a high level of heterozygosity, difference in ploidy levels and known problems with sexual reproduction from pollination to seed germination (Crespel et al., 2002; Gudin, 2001; Gudin, 2000). Rose breeding is a continuous long-lasting process, and a large number of phenotypic traits are important in full grown plants. Still, breeders have been able to combine many favorable plant characters and were able to produce cultivars with the desired combinations (Rajapakse et al., 2001). The ability of rose breeders to select the best parents for crosses is hampered by a limited knowledge on the inheritance of phenotypic traits (Hibrand-Saint Oyant et al., 2007). This research aims at a better understanding of the inheritance of color. For that, unbiased screening methods are needed. In this project, several methods are checked for suitability and correlations among them are determined using correlation analyses. The different methods are visual evaluation of the flower color using the RHS color chart, reflection analysis of intact rose petals, absorbance measurements on extracted anthocyanins and finally analysis of anthocyanin content using Reverse Phase - High Performance Liquid Chromatography (RP-HPLC).
5
R. Stolker, 2009 ROSE PETAL COLOR DETERMINATION Laboratory of Plant Breeding
The RHSCC (c. 2001) was developed to cover the range of colors found in horticultural taxa. In a survey of color charts to identify the best chart for biological descriptions, the RHS color chart is recommended (Tucker et al., 1991). Reflectance measurements are often used for quantifying colors and color differences between flowers. Le Nard & Biot (1997) measured the color of tulips with a colorimeter, and showed it is possible to quantify color differences in the tulip flowers using reflectance curves. RP-HPLC with photodiode array detection is the most widely used technique for identifying the type and calculating the concentration of the anthocyanins and their aglycones present in the flower (Lee et al., 2008; Hong & Wrolstad, 1990). Using HPLC, the different anthocyanins are separated based on differences in polarity, resulting in varying times needed to travel though the column (retention time). Based on this retention time, and the spectrum of the peak, different anthocyanins can be distinguished from one another. RP-HPLC is fast, sensitive and quantitative. However, one of the problems with HPLC for the analysis of anthocyanins is the varying peak retention times from person to person with similar analytical conditions (Hong & Wrolstad, 1990). This makes it difficult to compare results from one laboratory with the results from another laboratory. Several researches aimed at identifying the correlation between different methods for color measurements. Yokoi & Saitô (1973) determined the relationships between the absorption curves of the intact petal tissues of rose cultivars and the visual evaluations of the color quality with the help of a color chart and colorimetric designation. There was a reasonable correlation. By measuring the anthocyanin content in intact petals, Stewart et al. (1969) showed that there was a good correlation between absorbance and anthocyanin content. Yokoi & Saitô (1973) obtained similar results. Anthocyanins were extracted, concentrated and chromatographed. The relative amounts of anthocyanins were estimated by the visual comparison on chromatograms. They found that the variation in color of the petals from orange to red (code number of RHS Colour Chart 24-56) was dependent on the anthocyanidins present. For example, the code number of the RHS Colour Chart increased with an increasing amount of cyanidin and the code number decreased with an increase in pelargonidin concentration. Biolley et al (1993) analyzed both the chemical and colorimetric features of roses in relation to the color range. To allow quantitative comparisons of colors, the reflectance curves were further translated into indices calculated using the CIELab system. There were good correlations between chemical components and colorimetric indices (lightness (L*), chroma (C*) and hue angle (h)). For example the presence of large pelargonidin amounts would result in orange colours with a particularly pure and bright aspect expressed by high chroma (C*) values. The different research projects described above, aimed on identifying the correlation between different color measurements and stop there. A set of cultivars, different species and/or random flowers are picked and put to the test. This research project aims on finding an unbiased screening method for color and on identifying the correlation between different measurements in a segregating K5 population, to get a better understanding of the
6
R. Stolker, 2009 ROSE PETAL COLOR DETERMINATION Laboratory of Plant Breeding
heritability of flower color. This will improve the ability of rose breeders to select the best parents in their breeding program.
7

R. Stolker, 2009 ROSE PETAL COLOR DETERMINATION Laboratory of Plant Breeding
CHAPTER II
LITERATURE REVIEW Flower color - the pigments
Rose flowers occur in a great range of colors and shades. These different colors are the result of the presence of flavonoids and carotenoids. Carotenoids are hydrophobic pigments that are located in the plastids and give bright yellow, orange and red colors to some flowers (Davies et al., 2003). Rose flavonoids are hydrophilic pigments and consist of the anthocyanins (cyanin, pelargonin and peonin) and the flavonols (quercetin and kaempferol) (Dubois & de Vries, 1980a; de Vries et al., 1974; Harborne, 1961). Flavonols give rise to red and yellow pigments. Anthocyanins, the most common pigments, accumulate in the vacuoles and produce the pink, red, violet and blue colors of flowers (Goto, 1987; Goto and Kondo, 1991). This research focuses on the anthocyanin pigments in relation to the flower color.
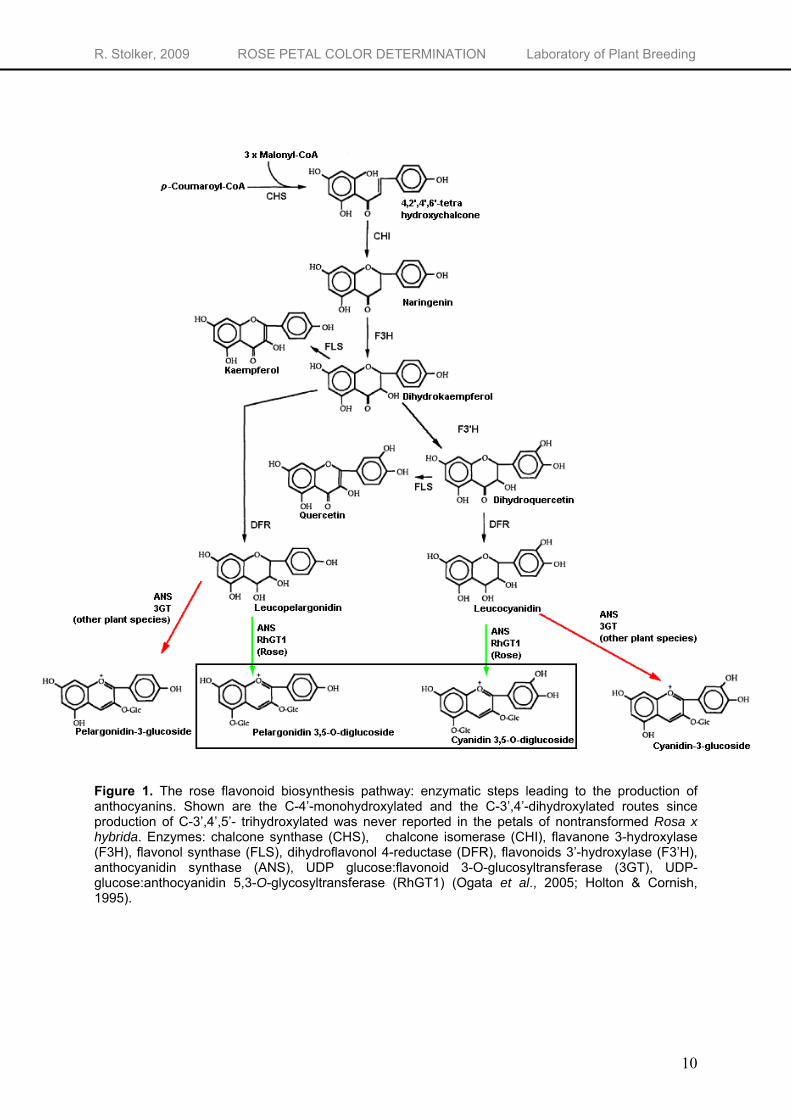
The rose anthocyanin biosynthetic pathway
The flavonoid pathway that results in production of anthocyanins (Figure 1) is generally conserved among plant species (Tanaka et al., 1998; Holton & Cornish, 1995). The first step in the biosynthesis of flavonoids, catalyzed by chalcone synthase (CHS), is the stepwise condensation of three acetate units from malonyl-CoA with p-coumaroyl-CoA resulting in the production of tetrahydroxychalcone. Chalcone isomerase (CHI) subsequently catalyzes the stereospecific isomerization of the yellow-colored tetrahydroxychalcone to the colorless naringenin. Flavanone 3-hydroxylase (F3H) converts naringenin into dihydrokaempferol (DHK). DHK is hydroxylated by flavonoid 3’-hydroxylase (F3’H), this results in the production of dihydroquercetin (DHQ). A minimum of three enzymes is required to convert the colorless dihydroflavonols (DHK and DHQ) to anthocyanins. The first one of the three enzymatic conversions is the reduction of the dihydroflavonols to flavan-3,4-cis-diols (the leucoanthocyanidins leucopelargonidin, and leucocyanidin) by dihydroflavonol 4-reductase (DFR). These leucoanthocyanidins are further oxidated, dehydrated and glycosylated to produce the corresponding brick-red pelargonidin and the red cyanidin (Holton & Cornish, 1995). Pelargonidin has one OH-group and cyanidin two OH-groups on the B-ring. The absorbance maximum shifts by about 10 nm toward longer wavelengths with every hydroxylation of the B-ring (Fujiwara et al., 1997). Anthocyanidin aglycones are unstable (Iacobucci & Sweeny, 1983) and it was assumed they were stabilized by initial glycosylation at the 3-OH group of the anthocyanidin by 3-GT, resulting in anthocyanidin 3-O-glycosides. However, it has been discovered that the
8
R. Stolker, 2009 ROSE PETAL COLOR DETERMINATION Laboratory of Plant Breeding
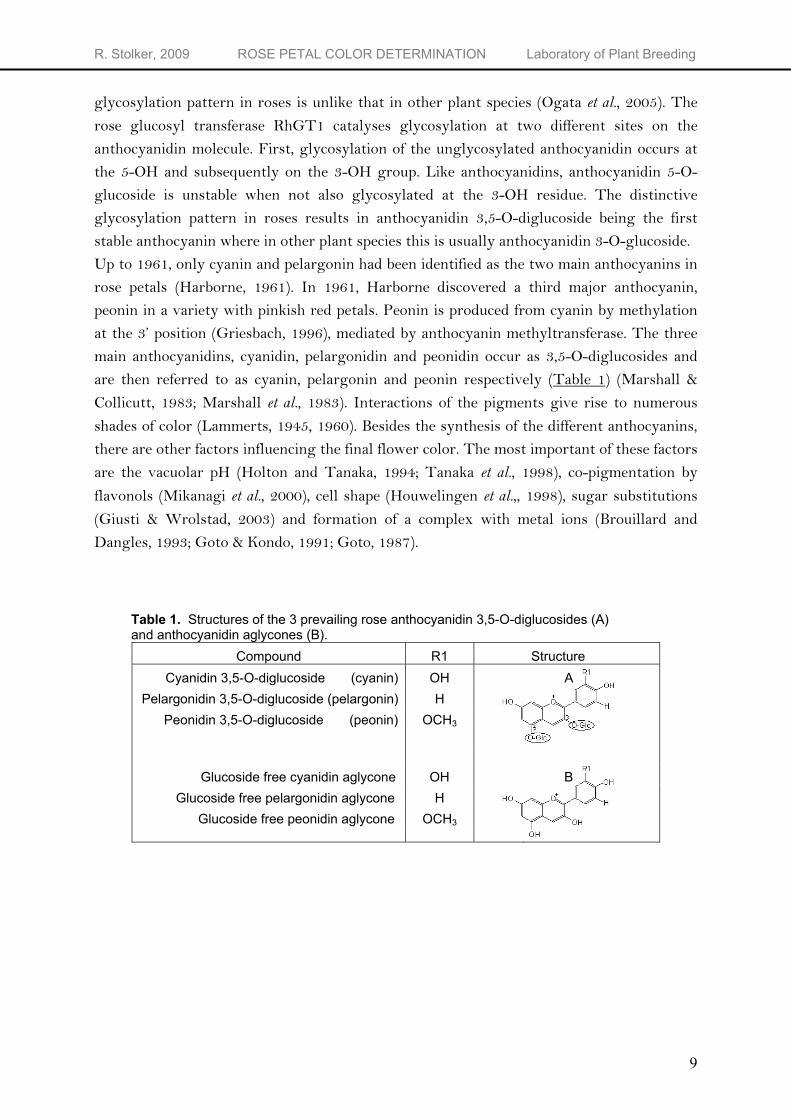
glycosylation pattern in roses is unlike that in other plant species (Ogata et al., 2005). The rose glucosyl transferase RhGT1 catalyses glycosylation at two different sites on the anthocyanidin molecule. First, glycosylation of the unglycosylated anthocyanidin occurs at the 5-OH and subsequently on the 3-OH group. Like anthocyanidins, anthocyanidin 5-O-glucoside is unstable when not also glycosylated at the 3-OH residue. The distinctive glycosylation pattern in roses results in anthocyanidin 3,5-O-diglucoside being the first stable anthocyanin where in other plant species this is usually anthocyanidin 3-O-glucoside. Up to 1961, only cyanin and pelargonin had been identified as the two main anthocyanins in rose petals (Harborne, 1961). In 1961, Harborne discovered a third major anthocyanin, peonin in a variety with pinkish red petals. Peonin is produced from cyanin by methylation at the 3’ position (Griesbach, 1996), mediated by anthocyanin methyltransferase. The three main anthocyanidins, cyanidin, pelargonidin and peonidin occur as 3,5-O-diglucosides and are then referred to as cyanin, pelargonin and peonin respectively (Table 1) (Marshall & Collicutt, 1983; Marshall et al., 1983). Interactions of the pigments give rise to numerous shades of color (Lammerts, 1945, 1960). Besides the synthesis of the different anthocyanins, there are other factors influencing the final flower color. The most important of these factors are the vacuolar pH (Holton and Tanaka, 1994; Tanaka et al., 1998), co-pigmentation by
flavonols (Mikanagi et al., 2000), cell shape (Houwelingen et al.,, 1998), sugar substitutions (Giusti & Wrolstad, 2003) and formation of a complex with metal ions (Brouillard and Dangles, 1993; Goto & Kondo, 1991; Goto, 1987).
Table 1. Structures of the 3 prevailing rose anthocyanidin 3,5-O-diglucosides (A) and anthocyanidin aglycones (B).
Compound R1 Structure Cyanidin 3,5-O-diglucoside (cyanin) OH A
Pelargonidin 3,5-O-diglucoside (pelargonin) H Peonidin 3,5-O-diglucoside (peonin) OCH3
Glucoside free cyanidin aglycone OH B Glucoside free pelargonidin aglycone H Glucoside free peonidin aglycone OCH3
9
R. Stolker, 2009 ROSE PETAL COLOR DETERMINATION Laboratory of Plant Breeding
Figure 1. The rose flavonoid biosynthesis pathway: enzymatic steps leading to the production of anthocyanins. Shown are the C-4’-monohydroxylated and the C-3’,4’-dihydroxylated routes since production of C-3’,4’,5’- trihydroxylated was never reported in the petals of nontransformed Rosa x hybrida. Enzymes: chalcone synthase (CHS), chalcone isomerase (CHI), flavanone 3-hydroxylase (F3H), flavonol synthase (FLS), dihydroflavonol 4-reductase (DFR), flavonoids 3’-hydroxylase (F3’H), anthocyanidin synthase (ANS), UDP glucose:flavonoid 3-O-glucosyltransferase (3GT), UDP-glucose:anthocyanidin 5,3-O-glycosyltransferase (RhGT1) (Ogata et al., 2005; Holton & Cornish, 1995).
10
R. Stolker, 2009 ROSE PETAL COLOR DETERMINATION Laboratory of Plant Breeding
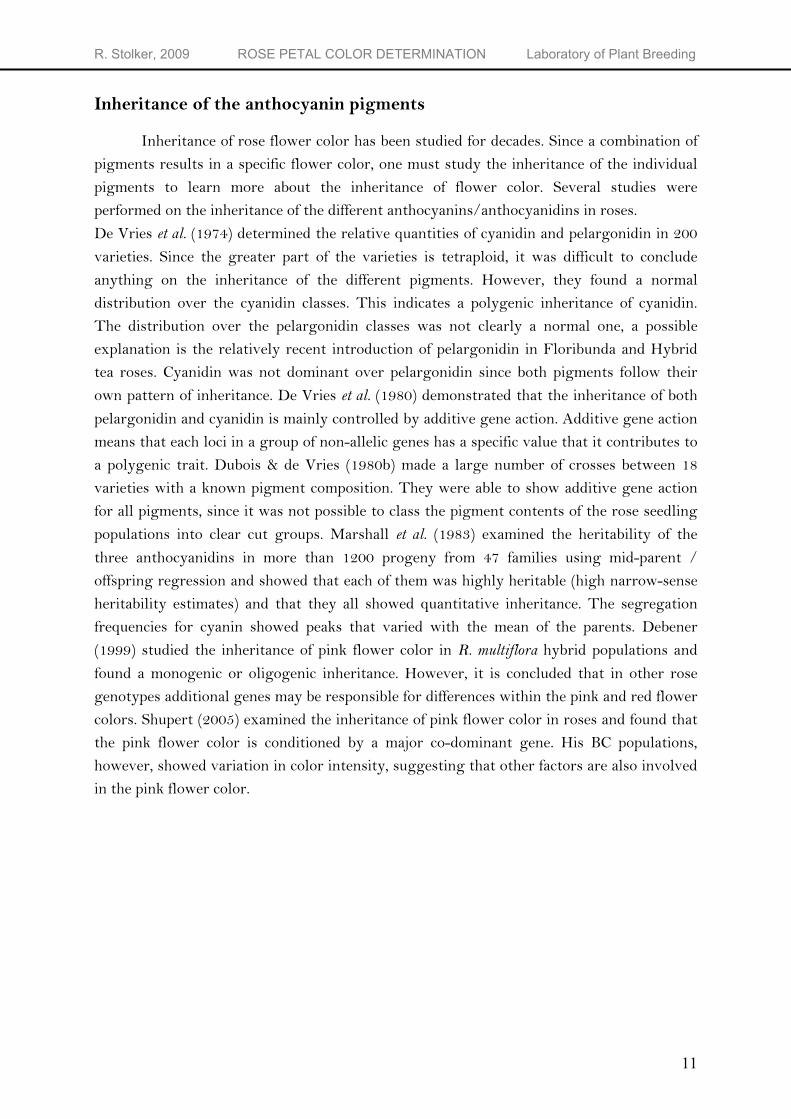
Inheritance of the anthocyanin pigments
Inheritance of rose flower color has been studied for decades. Since a combination of pigments results in a specific flower color, one must study the inheritance of the individual pigments to learn more about the inheritance of flower color. Several studies were performed on the inheritance of the different anthocyanins/anthocyanidins in roses. De Vries et al. (1974) determined the relative quantities of cyanidin and pelargonidin in 200 varieties. Since the greater part of the varieties is tetraploid, it was difficult to conclude anything on the inheritance of the different pigments. However, they found a normal distribution over the cyanidin classes. This indicates a polygenic inheritance of cyanidin. The distribution over the pelargonidin classes was not clearly a normal one, a possible explanation is the relatively recent introduction of pelargonidin in Floribunda and Hybrid tea roses. Cyanidin was not dominant over pelargonidin since both pigments follow their own pattern of inheritance. De Vries et al. (1980) demonstrated that the inheritance of both pelargonidin and cyanidin is mainly controlled by additive gene action. Additive gene action means that each loci in a group of non-allelic genes has a specific value that it contributes to a polygenic trait. Dubois & de Vries (1980b) made a large number of crosses between 18 varieties with a known pigment composition. They were able to show additive gene action for all pigments, since it was not possible to class the pigment contents of the rose seedling populations into clear cut groups. Marshall et al. (1983) examined the heritability of the three anthocyanidins in more than 1200 progeny from 47 families using mid-parent / offspring regression and showed that each of them was highly heritable (high narrow-sense heritability estimates) and that they all showed quantitative inheritance. The segregation frequencies for cyanin showed peaks that varied with the mean of the parents. Debener (1999) studied the inheritance of pink flower color in R. multiflora hybrid populations and found a monogenic or oligogenic inheritance. However, it is concluded that in other rose genotypes additional genes may be responsible for differences within the pink and red flower colors. Shupert (2005) examined the inheritance of pink flower color in roses and found that the pink flower color is conditioned by a major co-dominant gene. His BC populations, however, showed variation in color intensity, suggesting that other factors are also involved in the pink flower color.
11
R. Stolker, 2009 ROSE PETAL COLOR DETERMINATION Laboratory of Plant Breeding
CHAPTER III
MATERIALS AND METHODS
Plant material
A tetraploid (K5) population of 147 individuals was obtained from a cross between P867 (salmon mother) and P540 (dark red father). Cuttings from each of the individuals and the parents were made from production plants of the same age and rooted in plastic trays with commercial potting soil.
Environment
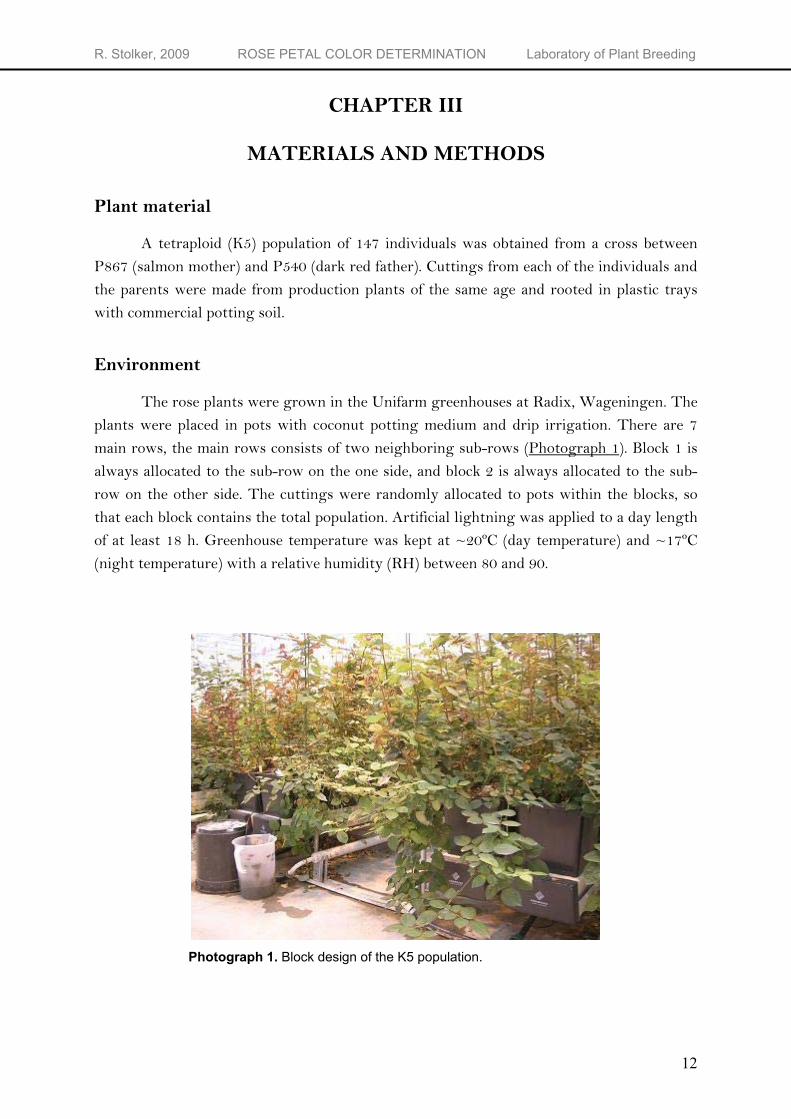
The rose plants were grown in the Unifarm greenhouses at Radix, Wageningen. The plants were placed in pots with coconut potting medium and drip irrigation. There are 7 main rows, the main rows consists of two neighboring sub-rows (Photograph 1). Block 1 is always allocated to the sub-row on the one side, and block 2 is always allocated to the sub-row on the other side. The cuttings were randomly allocated to pots within the blocks, so that each block contains the total population. Artificial lightning was applied to a day length of at least 18 h. Greenhouse temperature was kept at ~20ºC (day temperature) and ~17ºC (night temperature) with a relative humidity (RH) between 80 and 90.
Photograph 1. Block design of the K5 population.
12
R. Stolker, 2009 ROSE PETAL COLOR DETERMINATION Laboratory of Plant Breeding
Data Collection
Flowers, in developmental stage three, were taken from the plants. Ripeness stage of the rose flowers was determined by the criteria set by the Association of Flower Auctions (VBN)1 in The Netherlands. When flowers reach developmental stage three, the outer petals start to loosen and the flowers shows an opened center. Several methods to measure color have been used to evaluate flower color in the K5 population. The first method is visual evaluation of the flower color using the Royal Horticultural Society (RHS) color standards 2001. The chart consists of different leafs on which the colors successively lighten from the A-chip to the B-, C- and D-chips. The code, belonging to the chip showing the highest resemblance to the petal color, is recorded. Tucker et al. (1991) surveyed many color charts used by biologists for biological descriptions and recommended the RHS chart to analyze horticultural taxa. The second method is instrumentally using reflectance colorimeter measurements. These measurements take into account selective absorption wavelengths of vacuolar pigments and surface reflection of the petal. A reflectance measurement results in a spectrum of the flower color that can be used to calculate color values. The third method is instrumentally using a spectrophotometer. After extraction of the anthocyanin pigments from the flowers, the absorbance of the anthocyanin extracts is measured between 350 and 750 nm. The fourth method is chromatographically using Reverse Phase - High Performance Liquid Chromatography (RP-HPLC) to analyze the composition of the anthocyanin extracts. This results in information on the type of anthocyanins and the concentrations of these pigments in the flowers. A more extensive explanation on the different techniques of examining the flower color in the rose population is described below.
Royal Horticultural Society Color Chart
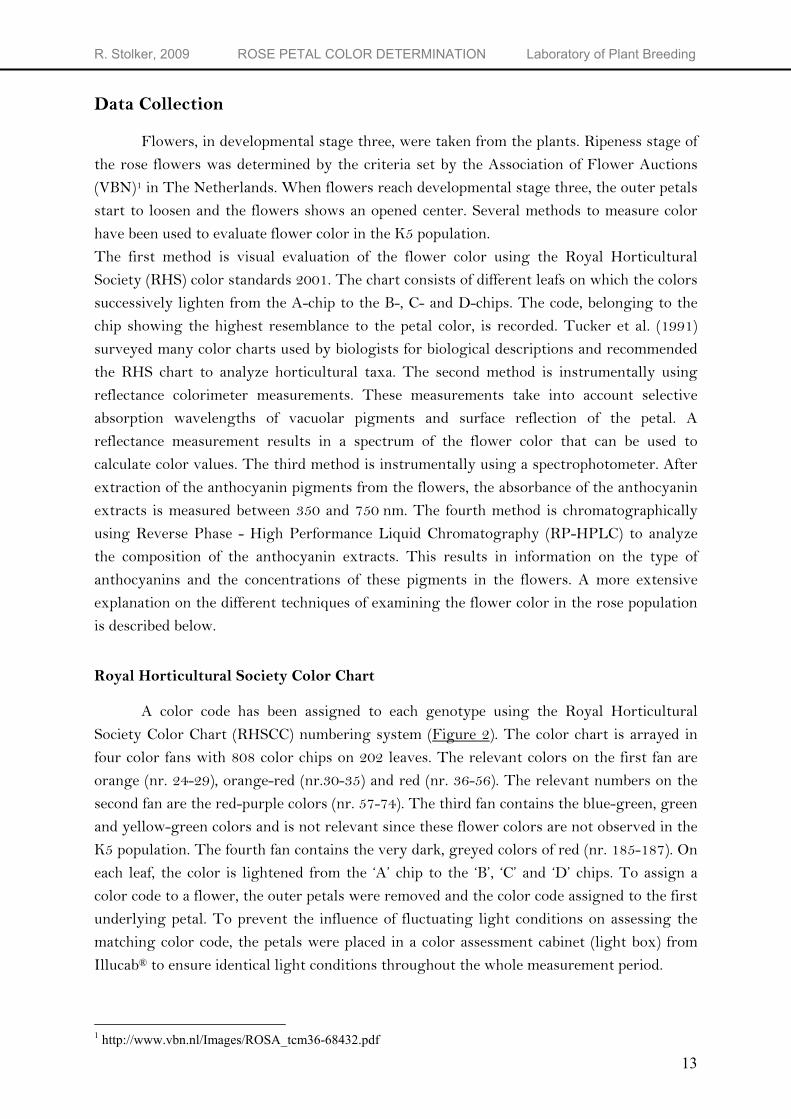
A color code has been assigned to each genotype using the Royal Horticultural Society Color Chart (RHSCC) numbering system (Figure 2). The color chart is arrayed in four color fans with 808 color chips on 202 leaves. The relevant colors on the first fan are orange (nr. 24-29), orange-red (nr.30-35) and red (nr. 36-56). The relevant numbers on the second fan are the red-purple colors (nr. 57-74). The third fan contains the blue-green, green and yellow-green colors and is not relevant since these flower colors are not observed in the K5 population. The fourth fan contains the very dark, greyed colors of red (nr. 185-187). On each leaf, the color is lightened from the ‘A’ chip to the ‘B’, ‘C’ and ‘D’ chips. To assign a color code to a flower, the outer petals were removed and the color code assigned to the first underlying petal. To prevent the influence of fluctuating light conditions on assessing the matching color code, the petals were placed in a color assessment cabinet (light box) from Illucab® to ensure identical light conditions throughout the whole measurement period.
1 http://www.vbn.nl/Images/ROSA_tcm36-68432.pdf
13
R. Stolker, 2009 ROSE PETAL COLOR DETERMINATION Laboratory of Plant Breeding
Figure 2. Example of a color fan from the Royal Horticultural Society color chart (RHSCC). Reflection measurements
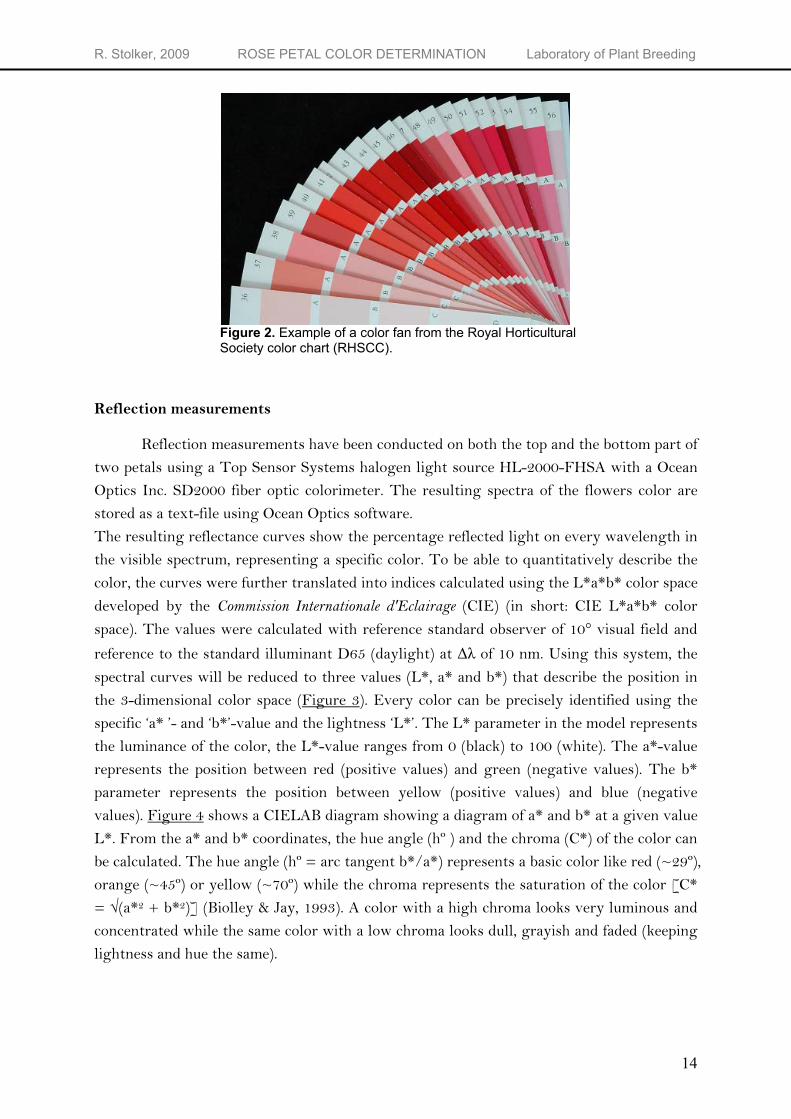
Reflection measurements have been conducted on both the top and the bottom part of two petals using a Top Sensor Systems halogen light source HL-2000-FHSA with a Ocean Optics Inc. SD2000 fiber optic colorimeter. The resulting spectra of the flowers color are stored as a text-file using Ocean Optics software. The resulting reflectance curves show the percentage reflected light on every wavelength in the visible spectrum, representing a specific color. To be able to quantitatively describe the color, the curves were further translated into indices calculated using the L*a*b* color space developed by the Commission Internationale d'Eclairage (CIE) (in short: CIE L*a*b* color space). The values were calculated with reference standard observer of 10° visual field and
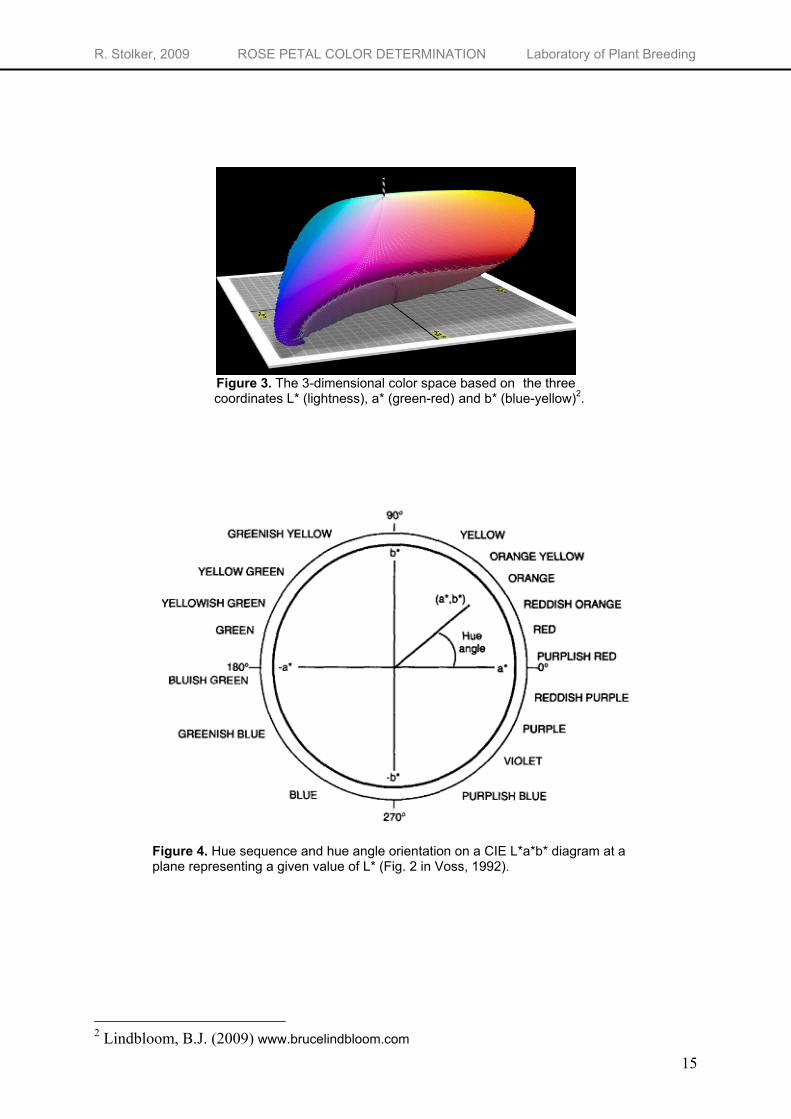
reference to the standard illuminant D65 (daylight) at ∆λ of 10 nm. Using this system, the spectral curves will be reduced to three values (L*, a* and b*) that describe the position in the 3-dimensional color space (Figure 3). Every color can be precisely identified using the specific ‘a* ’- and ‘b*’-value and the lightness ‘L*’. The L* parameter in the model represents the luminance of the color, the L*-value ranges from 0 (black) to 100 (white). The a*-value represents the position between red (positive values) and green (negative values). The b* parameter represents the position between yellow (positive values) and blue (negative values). Figure 4 shows a CIELAB diagram showing a diagram of a* and b* at a given value L*. From the a* and b* coordinates, the hue angle (hº ) and the chroma (C*) of the color can be calculated. The hue angle (hº = arc tangent b*/a*) represents a basic color like red (~29º), orange (~45º) or yellow (~70º) while the chroma represents the saturation of the color [C* = √(a*2 + b*2)] (Biolley & Jay, 1993). A color with a high chroma looks very luminous and concentrated while the same color with a low chroma looks dull, grayish and faded (keeping lightness and hue the same).
14
R. Stolker, 2009 ROSE PETAL COLOR DETERMINATION Laboratory of Plant Breeding
Figure 3. The 3-dimensional color space based on the three coordinates L* (lightness), a* (green-red) and b* (blue-yellow)2.
Figure 4. Hue sequence and hue angle orientation on a CIE L*a*b* diagram at a plane representing a given value of L* (Fig. 2 in Voss, 1992).
2 Lindbloom, B.J. (2009) www.brucelindbloom.com
15
R. Stolker, 2009 ROSE PETAL COLOR DETERMINATION Laboratory of Plant Breeding
Extraction of anthocyanins
From every genotype, depending on the size of the flower, 6 to 9 petals were taken and transferred to liquid nitrogen. From the liquid nitrogen the petals were stored at -80ºC. From the -80ºC, the petals were put into a freeze dryer. The freeze dryer was set at -88ºC, and an air pressure of max 4 mbar. After 48 hours, the dried samples were taken out and subsequently stored at -20ºC upon grinding. Grinding was performed in a bead mill type MM2 from Retsch that was set at two minutes at 50% of max. RPM. After grinding, the ground samples were stored at -20ºC. The frozen pulverized samples were weighed (100 mg for dark flowers and 200 mg for light flowers and the anthocyanins extracted with 5 mL of 1% (v/v) hydrochloric acid (HCl) and 0.1% (v/v) butyl hydroxyl anisol (BHA) in methanol for 30 min at room temperature with shaking on 150 RPM in a shaker type RS500 from LaboTech. Concentrated HCl is 12N, when having a 1% (v/v) solution of HCl, this results in a solution of 0.12N. The tubes were centrifuged for 10 min at 4200 rpm in a Mistral 400 MSE (Fisons, England) centrifuge in order to pour out the supernatant with the extracted anthocyanins. When necessary, this procedure was repeated with either 2.5 or 5 mL of extraction solution to extract the ‘left over’ anthocyanins.
Acid hydrolysis
For preparation of anthocyanidin aglycones, a 2 ml volume of sample solution with 2 ml of 2N HCl was heated for about 120 min in a heating block set at 100ºC. Acid hydrolysis of anthocyanins removes the sugar groups and is useful for identifying the aglycone (anthocyanidin) (Wicker & Lee, 1991).
Absorbance measurements
Spectroscopic analyses of the non-hydrolyzed anthocyanin extracts were carried out on a wavelength-scanning UV/Vis spectrophotometer (Ultrospec 2000, Pharmacia Biotech) controlled by SWIFT WAVESCAN II applications software. Extracts were diluted in order to avoid an absorbance above the maximum possible sensor response. Cuvets with a light path of 1 cm were obtained from Brand (Werteim, Germany). The reference solution is 1% (v/v) hydrochloric acid (HCl) and 0.1% (w/v) butyl hydroxyl anisol (BHA) in methanol. The absorbance was recorded at 1 nm steps over the range 350-750 nm at a scan rate of 2500 nm min-1 and the data were stored as a Microsoft Office Excel file. These data were processed using GenStat v11.
16
R. Stolker, 2009 ROSE PETAL COLOR DETERMINATION Laboratory of Plant Breeding
Chromatographic analyses
The HPLC analyses were performed on a Waters (Milford, MA, USA) high-performance liquid chromatograph equipped with a 2695 Waters separations module and a 2996 Waters photodiode array detector. The HPLC column was a C18 Hypurity (3µm particle size, 150mm×3mm) from Thermo Scientific (Cheshire, UK) and was protected with a C18 HyPurity (5µm particle size, 10mm×3mm) drop-in guard precolumn from Thermo Scientific. The column temperature was set at 40ºC and the sample temperature was set at 5ºC. The HPLC analyses were carried out using the following procedure: approximately 1 mL of non-hydrolyzed or hydrolyzed extracts was injected into HPLC vials through a
0.45µm filter (Millex-HV, Millipore). A volume of 10µL was injected through the C18 column for chromatographic analysis. For the non-hydrolyzed samples, the flow rate was 0.8 mL/min and the mobile phase consisted of eluent A [water-phosphoric acid (98.5:1.5, v/v)] and eluent B [phosphoric acid-formic acid-acetonitril containing 0.1% (v/v) trifluoroacetic acid-water (1.5:20:25:53.5, v/v/v/v). The gradient profile was 95% A at 0 min, 70% A at 35 min, 30% A at 37 min, 30% A at 40 min. The mobile phase was returned to its initial conditions in 5 min followed by running in initial conditions for 5 min. For the hydrolyzed samples, the flow rate was 1.0 mL/min and the mobile phase consisted of eluent A [water-trifluoroacetic acid (99.9:0.1, v/v)] and eluent B [acetonitril-trofluoroacetic acid (99.9:0.1, v/v)]. The gradient profile was 95% A at 0 min, 72% A at 35 min, 25% A at 37 min, 25% A at 40 min. The mobile phase was returned to its initial conditions in 2 min followed by running in initial conditions for 8 min. The HPLC system was equipped with the Empower software from Waters for controlling the analytical system and data processing. Absorbance spectra were recorded every 1 s, between 250 and 550 nm, with a bandwidth of 1.2 nm, and chromatograms were acquired at 512, 365 and 280 nm. Anthocyanins absorb at 512 nm
while 280 nm is also absorbed by other phenolic compounds (Łuczkiewicz & Cisowski, 1995). Since the petal extract is a mixture of different compounds, the chromatogram at 512 nm makes it possible to identify the anthocyanin compounds without removal of non-anthocyanin compounds from the petal extract. The minimum peak area was set at 50,000 µV*sec, below this threshold value the peaks were characterized as not detectable (N.D.). Peaks were identified by comparing them to the retention time (Tr) and spectral characteristics of known samples. Cyanidin -, pelargonidin -, peonidin - and delphinidin chloride were used as the known samples. There are only three common anthocyanidins in roses, so identification is easily achieved. To quantify the peak areas, calibration plots for the different anthocyanidins are needed. To construct calibration plots, four concentration levels (10, 20, 40 and 100 mg L-1) of cyanidin -, pelargonidin -, peonidin - and delphinidin chloride were analyzed. The calibration curves for the anthocyanins were obtained by plotting the anthocyanin peak area against the anthocyanin concentration at four levels. The calibration plots linearity was excellent, with regression coefficients of 0.9998, 0.9995, 0.9999 and 0.9999 respectively. Quantification of anthocyanidins was performed by correlating the
17
R. Stolker, 2009 ROSE PETAL COLOR DETERMINATION Laboratory of Plant Breeding
chromatographic peak area with concentrations in accordance with the calibration plot of the corresponding external standard.
Chemicals
The anthocyanidin standards were obtained from Sigma-Aldrich Chemie B.V. (Zwijndrecht, the Netherlands). Acetonitril and methanol were HPLC supra gradients from Biosolve (Valkenswaard, The Netherlands) and formic acid of p.a. quality was from Fluka. Trifluoroacetic acid and phosphoric acid of p.a. quality were from Merck (Darmstadt, Germany). Butylated hydroxyanisol (BHA) was obtained from Boom (Meppel, The Netherlands). The water used was reagent grade from a Seralpur pro 90 C apparatus (conductivity less than 0.1µS cm-1) with a 0.2 µm membrane filter.
18

R. Stolker, 2009 ROSE PETAL COLOR DETERMINATION Laboratory of Plant Breeding
CHAPTER IV
RESULTS AND DISCUSSION Royal Horticultural Society Color Chart (RHSCC)
The flower color of the K5 individuals was described using the RHS color chart. The variation in flower colors, based on this chart, are presented in Figure 5. There are four subcategories on one sheet number, however, in this figure the individuals are only pooled according to the sheet number. The color codes of the K5 individuals are in the range of 27 to 67 (orange, orange-red, red and red-purple) and 184 to 187 (greyed colors of red, blackish red). Although the RHS color chart contains a lot of different types of red, pink and dark hues, the subdivision in codes is still a rough method. For example, code number 46A is assigned to ~14% of the individuals while these individuals do not have the exact same color. Code number 46A represents a dark red color and is the best fitting code number to the frequently occurring dark red flowering individuals. Color code 187, representing a very blackish dark-red color, is assigned to ~13% of the individuals while in reality these individuals do not have the exact same color. Due to the almost unlimited number of different hues and colors in roses it is impossible to be able to distinguish all the different possible hues in a color chart. Therefore, the subdivision in color codes can only be considered a first indication for the flower color.
Figure 5. Frequency distribution of various color types on the basis of RHS Color Chart.
19
R. Stolker, 2009 ROSE PETAL COLOR DETERMINATION Laboratory of Plant Breeding
Colorimetric method: petal color and reflectance curve
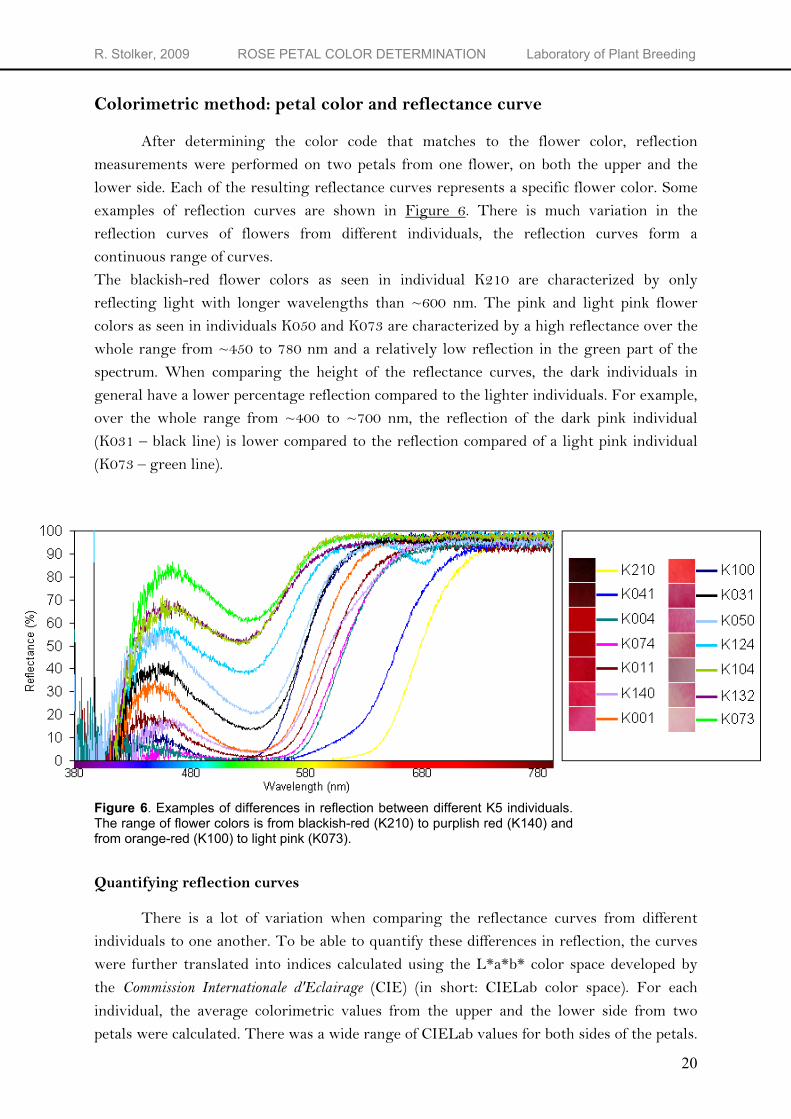
After determining the color code that matches to the flower color, reflection measurements were performed on two petals from one flower, on both the upper and the lower side. Each of the resulting reflectance curves represents a specific flower color. Some examples of reflection curves are shown in Figure 6. There is much variation in the reflection curves of flowers from different individuals, the reflection curves form a continuous range of curves. The blackish-red flower colors as seen in individual K210 are characterized by only reflecting light with longer wavelengths than ~600 nm. The pink and light pink flower colors as seen in individuals K050 and K073 are characterized by a high reflectance over the whole range from ~450 to 780 nm and a relatively low reflection in the green part of the spectrum. When comparing the height of the reflectance curves, the dark individuals in general have a lower percentage reflection compared to the lighter individuals. For example, over the whole range from ~400 to ~700 nm, the reflection of the dark pink individual (K031 – black line) is lower compared to the reflection compared of a light pink individual (K073 – green line).
Figure 6. Examples of differences in reflection between different K5 individuals. The range of flower colors is from blackish-red (K210) to purplish red (K140) and from orange-red (K100) to light pink (K073).
Quantifying reflection curves
There is a lot of variation when comparing the reflectance curves from different individuals to one another. To be able to quantify these differences in reflection, the curves were further translated into indices calculated using the L*a*b* color space developed by the Commission Internationale d'Eclairage (CIE) (in short: CIELab color space). For each individual, the average colorimetric values from the upper and the lower side from two petals were calculated. There was a wide range of CIELab values for both sides of the petals.
20
R. Stolker, 2009 ROSE PETAL COLOR DETERMINATION Laboratory of Plant Breeding
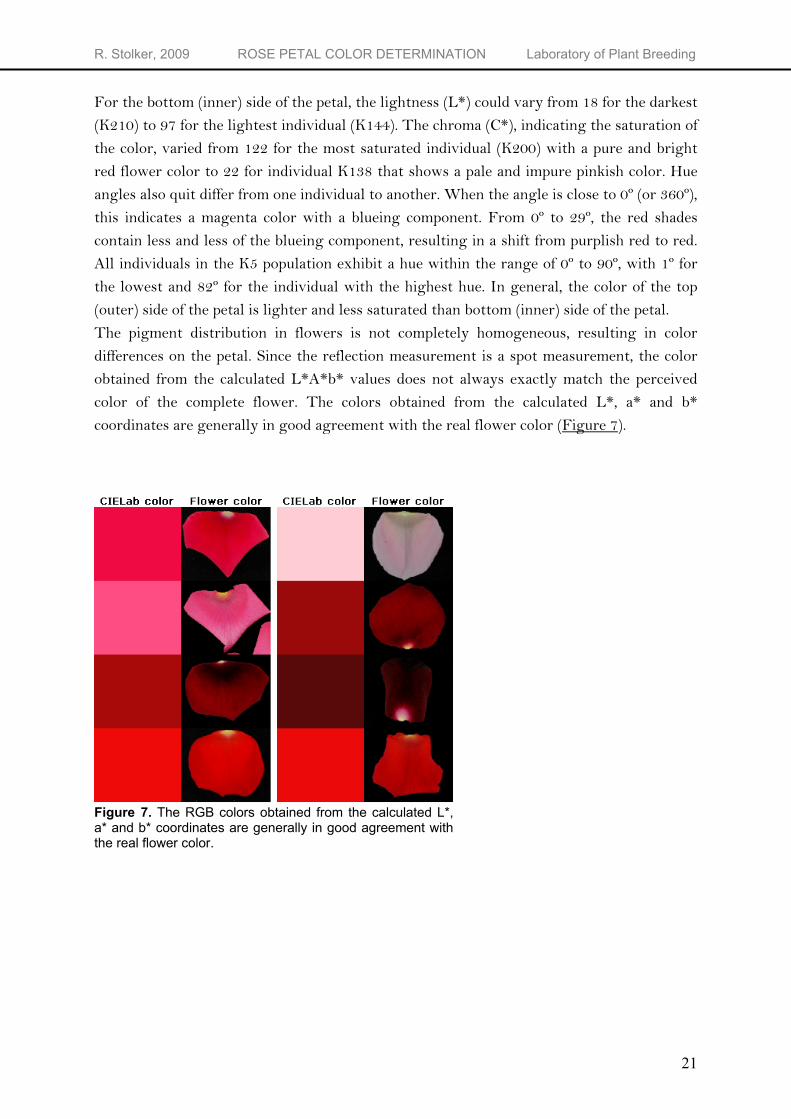
For the bottom (inner) side of the petal, the lightness (L*) could vary from 18 for the darkest (K210) to 97 for the lightest individual (K144). The chroma (C*), indicating the saturation of the color, varied from 122 for the most saturated individual (K200) with a pure and bright red flower color to 22 for individual K138 that shows a pale and impure pinkish color. Hue angles also quit differ from one individual to another. When the angle is close to 0º (or 360º), this indicates a magenta color with a blueing component. From 0º to 29º, the red shades contain less and less of the blueing component, resulting in a shift from purplish red to red. All individuals in the K5 population exhibit a hue within the range of 0º to 90º, with 1º for the lowest and 82º for the individual with the highest hue. In general, the color of the top (outer) side of the petal is lighter and less saturated than bottom (inner) side of the petal. The pigment distribution in flowers is not completely homogeneous, resulting in color differences on the petal. Since the reflection measurement is a spot measurement, the color obtained from the calculated L*A*b* values does not always exactly match the perceived color of the complete flower. The colors obtained from the calculated L*, a* and b* coordinates are generally in good agreement with the real flower color (Figure 7).
Figure 7. The RGB colors obtained from the calculated L*, a* and b* coordinates are generally in good agreement with the real flower color.
21
R. Stolker, 2009 ROSE PETAL COLOR DETERMINATION Laboratory of Plant Breeding
UV/Vis spectrophotometer
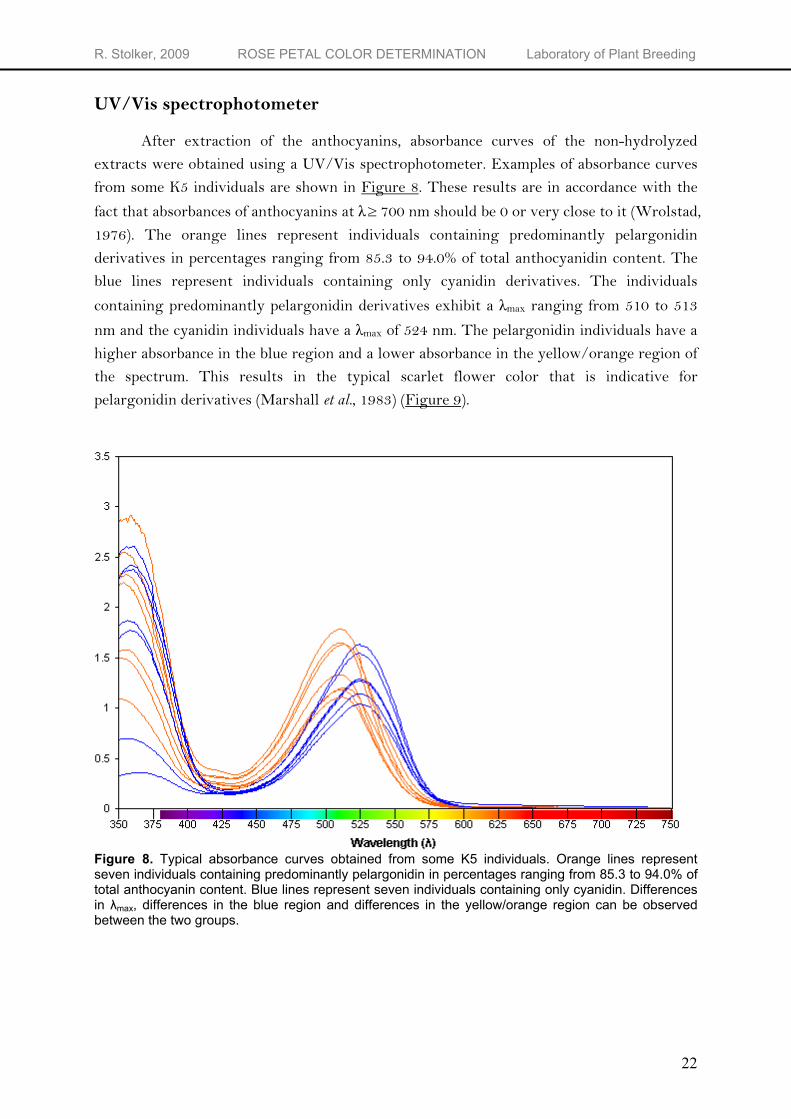
After extraction of the anthocyanins, absorbance curves of the non-hydrolyzed extracts were obtained using a UV/Vis spectrophotometer. Examples of absorbance curves from some K5 individuals are shown in Figure 8. These results are in accordance with the
fact that absorbances of anthocyanins at λ≥ 700 nm should be 0 or very close to it (Wrolstad, 1976). The orange lines represent individuals containing predominantly pelargonidin derivatives in percentages ranging from 85.3 to 94.0% of total anthocyanidin content. The blue lines represent individuals containing only cyanidin derivatives. The individuals
containing predominantly pelargonidin derivatives exhibit a λmax ranging from 510 to 513
nm and the cyanidin individuals have a λmax of 524 nm. The pelargonidin individuals have a higher absorbance in the blue region and a lower absorbance in the yellow/orange region of the spectrum. This results in the typical scarlet flower color that is indicative for pelargonidin derivatives (Marshall et al., 1983) (Figure 9).
Figure 8. Typical absorbance curves obtained from some K5 individuals. Orange lines represent seven individuals containing predominantly pelargonidin in percentages ranging from 85.3 to 94.0% of total anthocyanin content. Blue lines represent seven individuals containing only cyanidin. Differences in λmax, differences in the blue region and differences in the yellow/orange region can be observed between the two groups.
22

R. Stolker, 2009 ROSE PETAL COLOR DETERMINATION Laboratory of Plant Breeding
Maximum wavelength (λmax)
Since pelargonidin - and cyanidin derivatives are the major pigments in the K5 population, together they represent 96.4% of all pigment ratings, the absorbance graphs of the K5 individuals are predominantly build from the combined absorbance graphs of cyanidin-based and pelargonidin-based pigments. According to Hong & Wrolstad (1990)
pelargonidin derivatives exhibit a lower λmax (about 505 nm) compared to cyanidin derivatives (520-526 nm). The absorbance graphs from the K5 population are in agreement
with these observations and show differences in λmax. Individuals containing a relatively high
percentage pelargonin, show a lower λmax than individuals having a lower percentage
pelargonin. However, this λmax is higher than previously reported in literature (Hong & Wrolstad, 1990).
Figure 9. Typical scarlet flower color indicative for individuals containing predominantly pelargonin (A) compared to flower color of individuals containing only cyanidin (B).
23

R. Stolker, 2009 ROSE PETAL COLOR DETERMINATION Laboratory of Plant Breeding
RP-HPLC separation of anthocyanidins
With RP-HPLC, different anthocyanidins have varying retention times based on differences in polarity. The four different anthocyanidin standards used in this study are cyanidin -, pelargonidin -, peonidin - and delphinidin chloride. These compounds elute at 15.3-15.5, 18.3-18.5, 19.7-19.9 and 12.1-12.2 min respectively. Typical HPLC chromatograms of the four anthocyanidin standards are shown in Figure 10. The HPLC chromatogram of the pelargonidin standard shows four different peaks. The retention time of the main peak is taken as the retention time for the pelargonidin standard since pelargonidin in the K5 population elutes at that retention time.
Figure 10. Typical HPLC chromatogram of pure anthocyanidin standards (100 mg L-1) with detection at 512 nm: A) cyanidin chloride (Retention time (Tr) = 15.3 – 15.5 min) B) pelargonidin chloride (Tr = 18.3 – 18.5 min) C) peonidin chloride (Tr = 19.7 – 19.9 min) D) delphinidin chloride (Tr = 12.1 – 12.2 min).
24
R. Stolker, 2009 ROSE PETAL COLOR DETERMINATION Laboratory of Plant Breeding
Peak identification
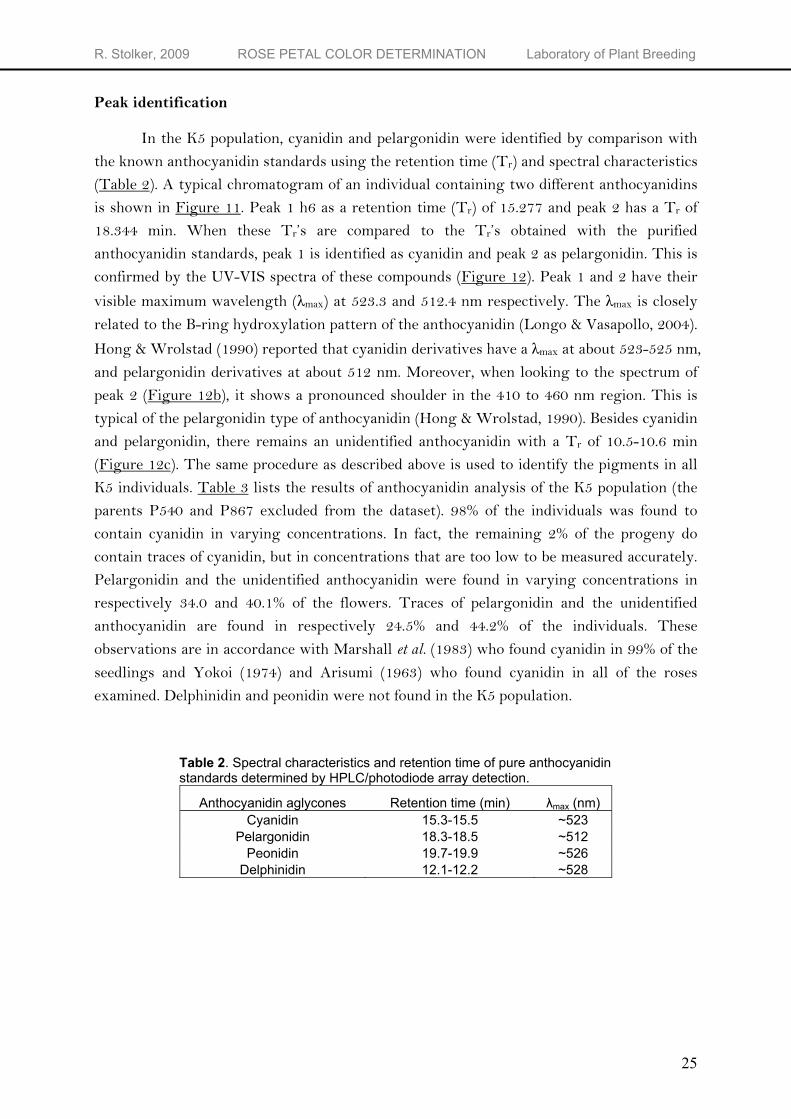
In the K5 population, cyanidin and pelargonidin were identified by comparison with the known anthocyanidin standards using the retention time (Tr) and spectral characteristics (Table 2). A typical chromatogram of an individual containing two different anthocyanidins is shown in Figure 11. Peak 1 h6 as a retention time (Tr) of 15.277 and peak 2 has a Tr of 18.344 min. When these Tr’s are compared to the Tr’s obtained with the purified anthocyanidin standards, peak 1 is identified as cyanidin and peak 2 as pelargonidin. This is confirmed by the UV-VIS spectra of these compounds (Figure 12). Peak 1 and 2 have their
visible maximum wavelength (λmax) at 523.3 and 512.4 nm respectively. The λmax is closely related to the B-ring hydroxylation pattern of the anthocyanidin (Longo & Vasapollo, 2004).
Hong & Wrolstad (1990) reported that cyanidin derivatives have a λmax at about 523-525 nm, and pelargonidin derivatives at about 512 nm. Moreover, when looking to the spectrum of peak 2 (Figure 12b), it shows a pronounced shoulder in the 410 to 460 nm region. This is typical of the pelargonidin type of anthocyanidin (Hong & Wrolstad, 1990). Besides cyanidin and pelargonidin, there remains an unidentified anthocyanidin with a Tr of 10.5-10.6 min (Figure 12c). The same procedure as described above is used to identify the pigments in all K5 individuals. Table 3 lists the results of anthocyanidin analysis of the K5 population (the parents P540 and P867 excluded from the dataset). 98% of the individuals was found to contain cyanidin in varying concentrations. In fact, the remaining 2% of the progeny do contain traces of cyanidin, but in concentrations that are too low to be measured accurately. Pelargonidin and the unidentified anthocyanidin were found in varying concentrations in respectively 34.0 and 40.1% of the flowers. Traces of pelargonidin and the unidentified anthocyanidin are found in respectively 24.5% and 44.2% of the individuals. These observations are in accordance with Marshall et al. (1983) who found cyanidin in 99% of the seedlings and Yokoi (1974) and Arisumi (1963) who found cyanidin in all of the roses examined. Delphinidin and peonidin were not found in the K5 population.
Table 2. Spectral characteristics and retention time of pure anthocyanidin standards determined by HPLC/photodiode array detection.
Anthocyanidin aglycones Retention time (min) λmax (nm) Cyanidin 15.3-15.5 ~523
Pelargonidin 18.3-18.5 ~512 Peonidin 19.7-19.9 ~526
Delphinidin 12.1-12.2 ~528
25
R. Stolker, 2009 ROSE PETAL COLOR DETERMINATION Laboratory of Plant Breeding
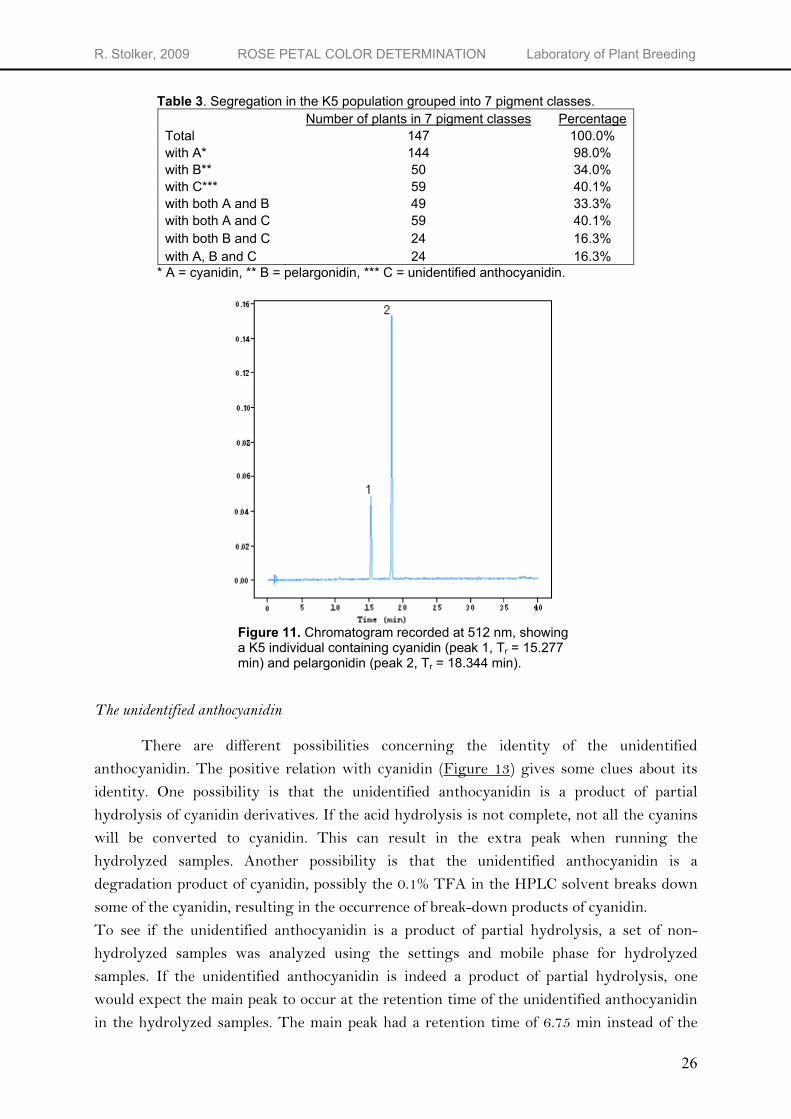
Table 3. Segregation in the K5 population grouped into 7 pigment classes. Number of plants in 7 pigment classes Percentage Total 147 100.0% with A* 144 98.0% with B** 50 34.0% with C*** 59 40.1% with both A and B 49 33.3% with both A and C 59 40.1% with both B and C 24 16.3% with A, B and C 24 16.3%
* A = cyanidin, ** B = pelargonidin, *** C = unidentified anthocyanidin.
Figure 11. Chromatogram recorded at 512 nm, showing a K5 individual containing cyanidin (peak 1, Tr = 15.277 min) and pelargonidin (peak 2, Tr = 18.344 min).
The unidentified anthocyanidin
There are different possibilities concerning the identity of the unidentified anthocyanidin. The positive relation with cyanidin (Figure 13) gives some clues about its identity. One possibility is that the unidentified anthocyanidin is a product of partial hydrolysis of cyanidin derivatives. If the acid hydrolysis is not complete, not all the cyanins will be converted to cyanidin. This can result in the extra peak when running the hydrolyzed samples. Another possibility is that the unidentified anthocyanidin is a degradation product of cyanidin, possibly the 0.1% TFA in the HPLC solvent breaks down some of the cyanidin, resulting in the occurrence of break-down products of cyanidin. To see if the unidentified anthocyanidin is a product of partial hydrolysis, a set of non-hydrolyzed samples was analyzed using the settings and mobile phase for hydrolyzed samples. If the unidentified anthocyanidin is indeed a product of partial hydrolysis, one would expect the main peak to occur at the retention time of the unidentified anthocyanidin in the hydrolyzed samples. The main peak had a retention time of 6.75 min instead of the
26
R. Stolker, 2009 ROSE PETAL COLOR DETERMINATION Laboratory of Plant Breeding
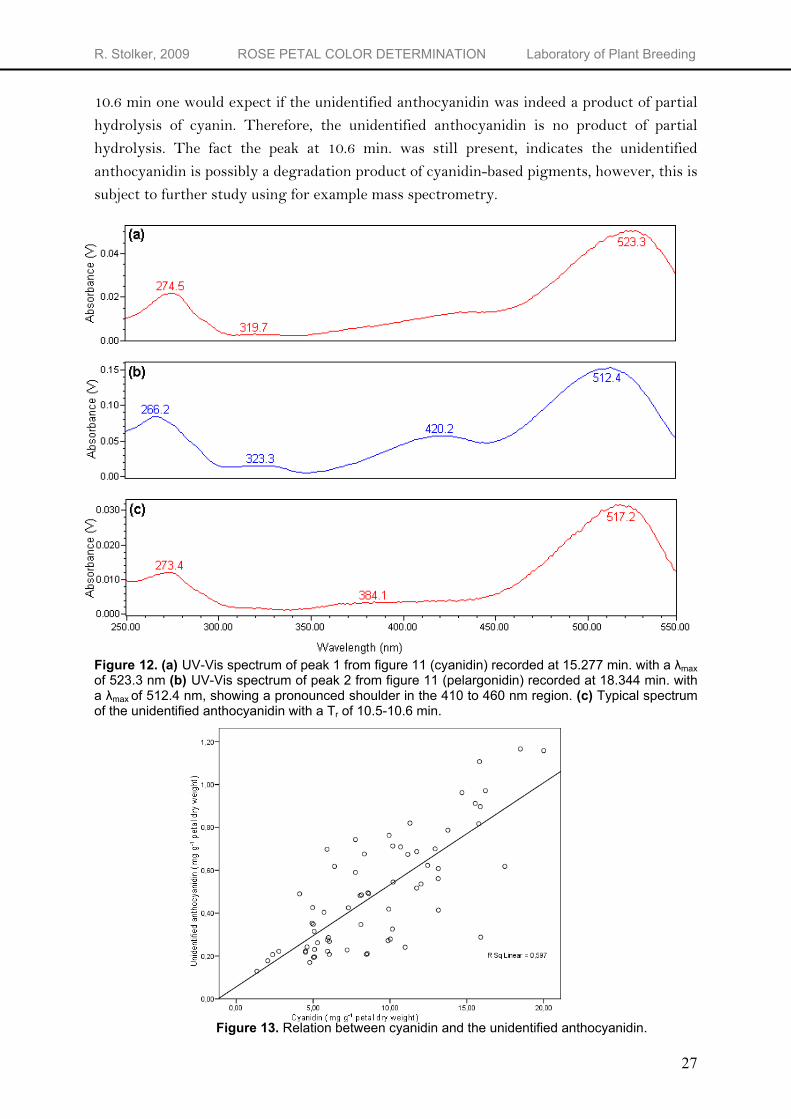
10.6 min one would expect if the unidentified anthocyanidin was indeed a product of partial hydrolysis of cyanin. Therefore, the unidentified anthocyanidin is no product of partial hydrolysis. The fact the peak at 10.6 min. was still present, indicates the unidentified anthocyanidin is possibly a degradation product of cyanidin-based pigments, however, this is subject to further study using for example mass spectrometry. Figure 12. (a) UV-Vis spectrum of peak 1 from figure 11 (cyanidin) recorded at 15.277 min. with a λmax of 523.3 nm (b) UV-Vis spectrum of peak 2 from figure 11 (pelargonidin) recorded at 18.344 min. with a λmax of 512.4 nm, showing a pronounced shoulder in the 410 to 460 nm region. (c) Typical spectrum of the unidentified anthocyanidin with a Tr of 10.5-10.6 min.
Figure 13. Relation between cyanidin and the unidentified anthocyanidin.
27
R. Stolker, 2009 ROSE PETAL COLOR DETERMINATION Laboratory of Plant Breeding
Quantifying anthocyanidins
Choice of anthocyanidin standards
In roses, the anthocyanins only occur as 3,5-O-diglucosides (see Chapter II). Since in this study the sugar groups were removed by acid hydrolysis, the concentration of the different pigments relate to the aglycones. The sugars derived from the acid hydrolysis were not identified. The anthocyanidin aglycones can be quantified using an external standard (cyanidin chloride or any purified anthocyanidin standard). According to Lee et al. (2008), using one standard for quantification can result in underestimating the anthocyanidin concentration in samples that contain different anthocyanidins. The same is observed here. When running the 100 mg L-1 cyanidin standard through HPLC, the resulting peak area is 6,957,406 µV*sec. With pelargonidin, peonidin and delphinidin this is 2,413,555; 2,435,298 and 3,585,776 µV*sec respectively. Quantification of the different anthocyanidins using the cyanidin standard would lead to severe underestimation of the pelargonidin, peonidin and delphinidin concentration. To prevent this, each anthocyanidin was quantified using its own pure standard.
Choice of wavelength
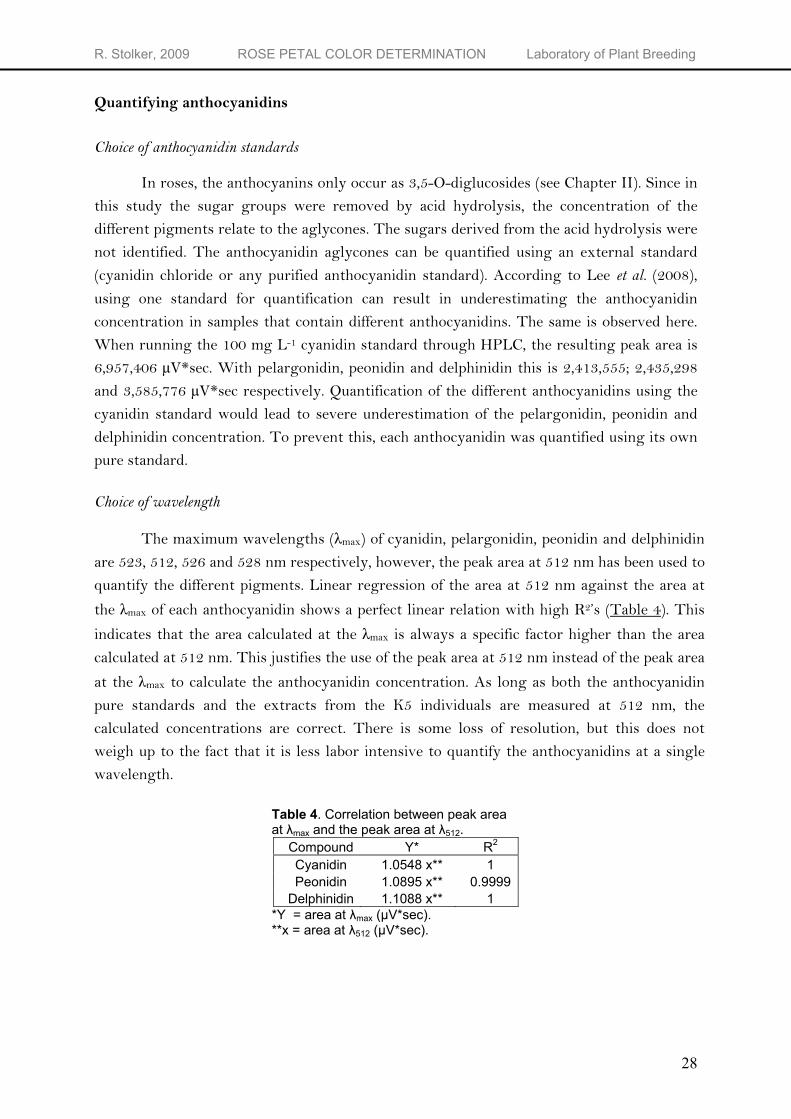
The maximum wavelengths (λmax) of cyanidin, pelargonidin, peonidin and delphinidin are 523, 512, 526 and 528 nm respectively, however, the peak area at 512 nm has been used to quantify the different pigments. Linear regression of the area at 512 nm against the area at
the λmax of each anthocyanidin shows a perfect linear relation with high R2’s (Table 4). This
indicates that the area calculated at the λmax is always a specific factor higher than the area calculated at 512 nm. This justifies the use of the peak area at 512 nm instead of the peak area
at the λmax to calculate the anthocyanidin concentration. As long as both the anthocyanidin pure standards and the extracts from the K5 individuals are measured at 512 nm, the calculated concentrations are correct. There is some loss of resolution, but this does not weigh up to the fact that it is less labor intensive to quantify the anthocyanidins at a single wavelength. Table 4. Correlation between peak area at λmax and the peak area at λ512.
Compound Y* R2
Cyanidin 1.0548 x** 1 Peonidin 1.0895 x** 0.9999
Delphinidin 1.1088 x** 1 *Y = area at λmax (µV*sec). **x = area at λ512 (µV*sec).
28
R. Stolker, 2009 ROSE PETAL COLOR DETERMINATION Laboratory of Plant Breeding
Quantification
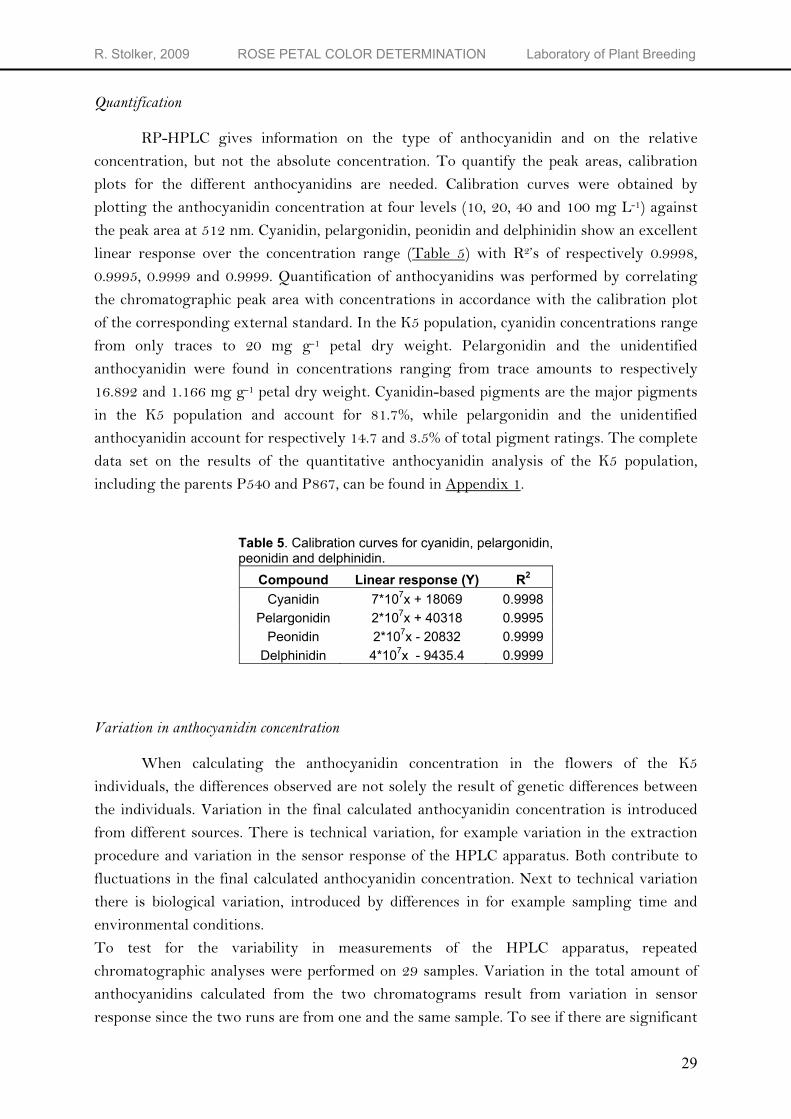
RP-HPLC gives information on the type of anthocyanidin and on the relative concentration, but not the absolute concentration. To quantify the peak areas, calibration plots for the different anthocyanidins are needed. Calibration curves were obtained by plotting the anthocyanidin concentration at four levels (10, 20, 40 and 100 mg L-1) against the peak area at 512 nm. Cyanidin, pelargonidin, peonidin and delphinidin show an excellent linear response over the concentration range (Table 5) with R2’s of respectively 0.9998, 0.9995, 0.9999 and 0.9999. Quantification of anthocyanidins was performed by correlating the chromatographic peak area with concentrations in accordance with the calibration plot of the corresponding external standard. In the K5 population, cyanidin concentrations range from only traces to 20 mg g-1 petal dry weight. Pelargonidin and the unidentified anthocyanidin were found in concentrations ranging from trace amounts to respectively 16.892 and 1.166 mg g-1 petal dry weight. Cyanidin-based pigments are the major pigments in the K5 population and account for 81.7%, while pelargonidin and the unidentified anthocyanidin account for respectively 14.7 and 3.5% of total pigment ratings. The complete data set on the results of the quantitative anthocyanidin analysis of the K5 population, including the parents P540 and P867, can be found in Appendix 1.
Table 5. Calibration curves for cyanidin, pelargonidin, peonidin and delphinidin.
Compound Linear response (Y) R2
Cyanidin 7*107x + 18069 0.9998 Pelargonidin 2*107x + 40318 0.9995
Peonidin 2*107x - 20832 0.9999 Delphinidin 4*107x - 9435.4 0.9999
Variation in anthocyanidin concentration
When calculating the anthocyanidin concentration in the flowers of the K5 individuals, the differences observed are not solely the result of genetic differences between the individuals. Variation in the final calculated anthocyanidin concentration is introduced from different sources. There is technical variation, for example variation in the extraction procedure and variation in the sensor response of the HPLC apparatus. Both contribute to fluctuations in the final calculated anthocyanidin concentration. Next to technical variation there is biological variation, introduced by differences in for example sampling time and environmental conditions. To test for the variability in measurements of the HPLC apparatus, repeated chromatographic analyses were performed on 29 samples. Variation in the total amount of anthocyanidins calculated from the two chromatograms result from variation in sensor response since the two runs are from one and the same sample. To see if there are significant
29

R. Stolker, 2009 ROSE PETAL COLOR DETERMINATION Laboratory of Plant Breeding
differences between the repeated measurements, a two-sample t-test (paired) was performed with the null hypothesis (H0) that the mean of difference is equal to 0. This test resulted in a t-value of t = 0.86 on 28 d.f. with a probability of 0.398. The null hypothesis is not rejected, there is no prove for significant differences between the repeated injections. When extracting anthocyanins from the ground samples, there will be variation in the amount of anthocyanins extracted. To test for the extent of variation in extraction, extractions from the same flower were performed in duplicate. The ground sample is a homogeneous powder, differences between the calculated anthocyanidin concentrations are the result of differences in the extraction procedure. To see if there are significant differences between the double extractions, a paired two-sample t-test was performed with the H0 that the mean of difference is equal to 0. This test resulted in a t-value of t = 0.18 on 12 d.f. with a probability of 0.86. The null hypothesis is not rejected, there is no prove for significant differences between the repeated extractions. When growing plants, there will be differences within the flowers on one plant and between different plants from the same genotype due to environmental variation. To test for the extent of biological variation, the K5 individuals were grown in two blocks. Anthocyanidin measurements were performed on all individuals from block one, but due to time only on a subset of the individuals in block two. As shown above, there are no significant differences between the repeated extractions from the same flower and repeated injections from the same extraction. Variation observed between the blocks results from environmental variation. When running an ANOVA with the blocking factor, the anthocyanidin concentration as the Y-variate and genotype as the treatment (Table 6), only the genotype shows a significant influence on the anthocyanidin content. There is no prove for significant differences between the blocks.
Table 6. ANOVA on total anthocyanidin content Source df MS Block 1 1.1 NS
Genotype 25 896.7*
Residual 25 112.6 NS, *
Nonsignificant or significant at P≤0.001.
30
R. Stolker, 2009 ROSE PETAL COLOR DETERMINATION Laboratory of Plant Breeding
Correlations between the different techniques
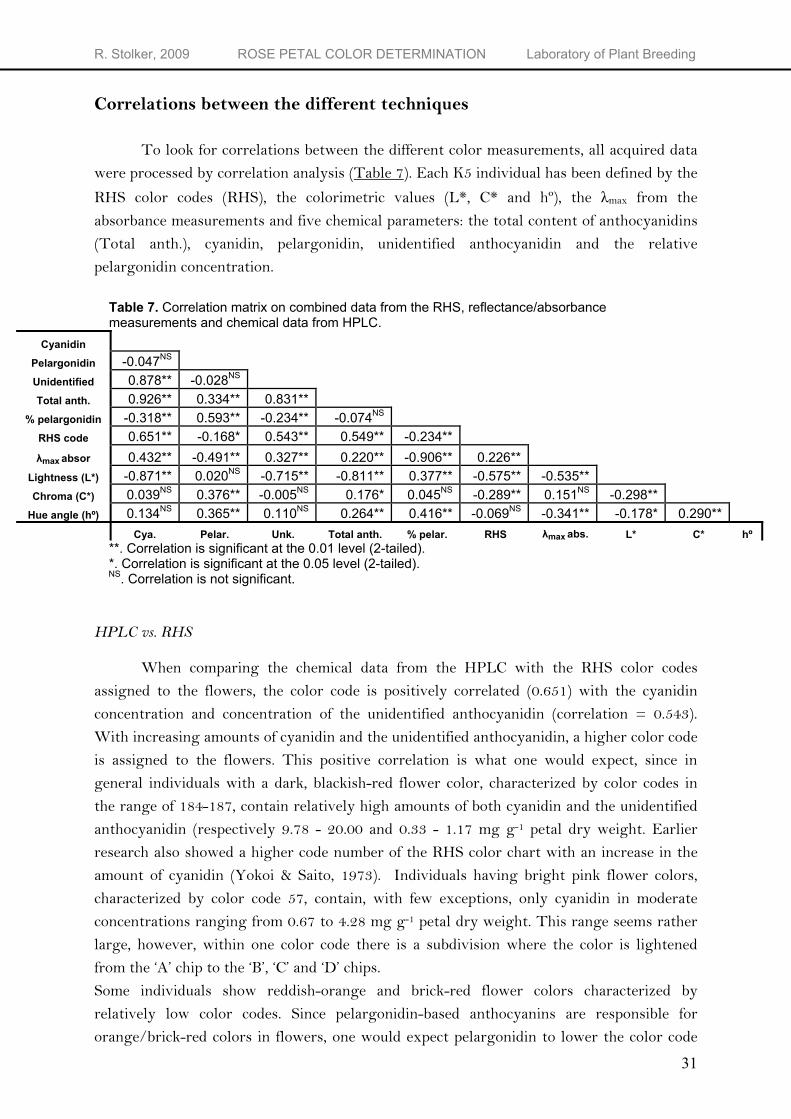
To look for correlations between the different color measurements, all acquired data were processed by correlation analysis (Table 7). Each K5 individual has been defined by the
RHS color codes (RHS), the colorimetric values (L*, C* and hº), the λmax from the absorbance measurements and five chemical parameters: the total content of anthocyanidins (Total anth.), cyanidin, pelargonidin, unidentified anthocyanidin and the relative pelargonidin concentration.
Table 7. Correlation matrix on combined data from the RHS, reflectance/absorbance measurements and chemical data from HPLC.
Cyanidin Pelargonidin -0.047NS Unidentified 0.878** -0.028NS Total anth. 0.926** 0.334** 0.831**
% pelargonidin -0.318** 0.593** -0.234** -0.074NS RHS code 0.651** -0.168* 0.543** 0.549** -0.234** λmax absor 0.432** -0.491** 0.327** 0.220** -0.906** 0.226**
Lightness (L*) -0.871** 0.020NS -0.715** -0.811** 0.377** -0.575** -0.535** Chroma (C*) 0.039NS 0.376** -0.005NS 0.176* 0.045NS -0.289** 0.151NS -0.298**
Hue angle (hº) 0.134NS 0.365** 0.110NS 0.264** 0.416** -0.069NS -0.341** -0.178* 0.290** Cya. Pelar. Unk. Total anth. % pelar. RHS λmax abs. L* C* hº
**. Correlation is significant at the 0.01 level (2-tailed). *. Correlation is significant at the 0.05 level (2-tailed). NS. Correlation is not significant. HPLC vs. RHS
When comparing the chemical data from the HPLC with the RHS color codes assigned to the flowers, the color code is positively correlated (0.651) with the cyanidin concentration and concentration of the unidentified anthocyanidin (correlation = 0.543). With increasing amounts of cyanidin and the unidentified anthocyanidin, a higher color code is assigned to the flowers. This positive correlation is what one would expect, since in general individuals with a dark, blackish-red flower color, characterized by color codes in the range of 184-187, contain relatively high amounts of both cyanidin and the unidentified anthocyanidin (respectively 9.78 - 20.00 and 0.33 - 1.17 mg g-1 petal dry weight. Earlier research also showed a higher code number of the RHS color chart with an increase in the amount of cyanidin (Yokoi & Saito, 1973). Individuals having bright pink flower colors, characterized by color code 57, contain, with few exceptions, only cyanidin in moderate concentrations ranging from 0.67 to 4.28 mg g-1 petal dry weight. This range seems rather large, however, within one color code there is a subdivision where the color is lightened from the ‘A’ chip to the ‘B’, ‘C’ and ‘D’ chips. Some individuals show reddish-orange and brick-red flower colors characterized by relatively low color codes. Since pelargonidin-based anthocyanins are responsible for orange/brick-red colors in flowers, one would expect pelargonidin to lower the color code
31
R. Stolker, 2009 ROSE PETAL COLOR DETERMINATION Laboratory of Plant Breeding
assigned to the flower. There is a negative correlation between the pelargonidin concentration and the color code (correlation = -0.168). With increasing amounts of pelargonidin, a lower color code is assigned to the flowers. Since pelargonidin-based pigments only occur in the presence of (traces of) cyanidin-based pigments, the final flower color of pelargonidin containing individuals is influenced by cyanidin-based pigments. It may be appropriate to calculate the relative concentration of pelargonidin from total anthocyanidin content and compare this ratio to the color code instead of the absolute pelargonidin concentration. The correlation matrix shows a significant negative correlation of -0.234 between the relative pelargonidin concentration and the RHS color code. When the relative amount of pelargonidin increases, the color code assigned to the flowers lowers (more orange). Earlier research also showed a lower code number of the RHS color chart with an increase in the amount of pelargonidin (Yokoi & Saito, 1973). The color code obtained by visual comparison of the color sheets with the flower color gives some idea about the anthocyanin composition of the flower. Dark, blackish-red flowers, characterized by high color codes in the range of 184-187, are likely to contain relatively high amounts of cyanidin and the unidentified anthocyanidin. Reddish-orange and brick-red flowers showing a bright red color are likely to contain a relatively high pelargonidin concentration. However, the variation in pigment concentrations within one RHS color code is to large to conclude anything on the absolute concentrations.
HPLC vs. Colorimetric
There were strong negative correlations between highly positively correlated chemical variables, that are total anthocyanidin amount, cyanidin amount and amount of unidentified anthocyanidin, and lightness (L*) of the petal color. Cyanidin-based pigments can produce the deep or dark blackish-red colors observed in the K5 individuals but also the most blueish shades. With an increase in total anthocyanidin concentration, the color of the flower becomes more dark. A very high concentration of cyanidin as seen in individual K167 results in a weak lightness (L* = 19.4) and a decrease of chroma (C* = 30.6). Thus, individuals K210 and K167, characterized by the darkest (L* = 18.1) and the second darkest color (L* = 19.4) contained a high amount (>18 and >12 mg g-
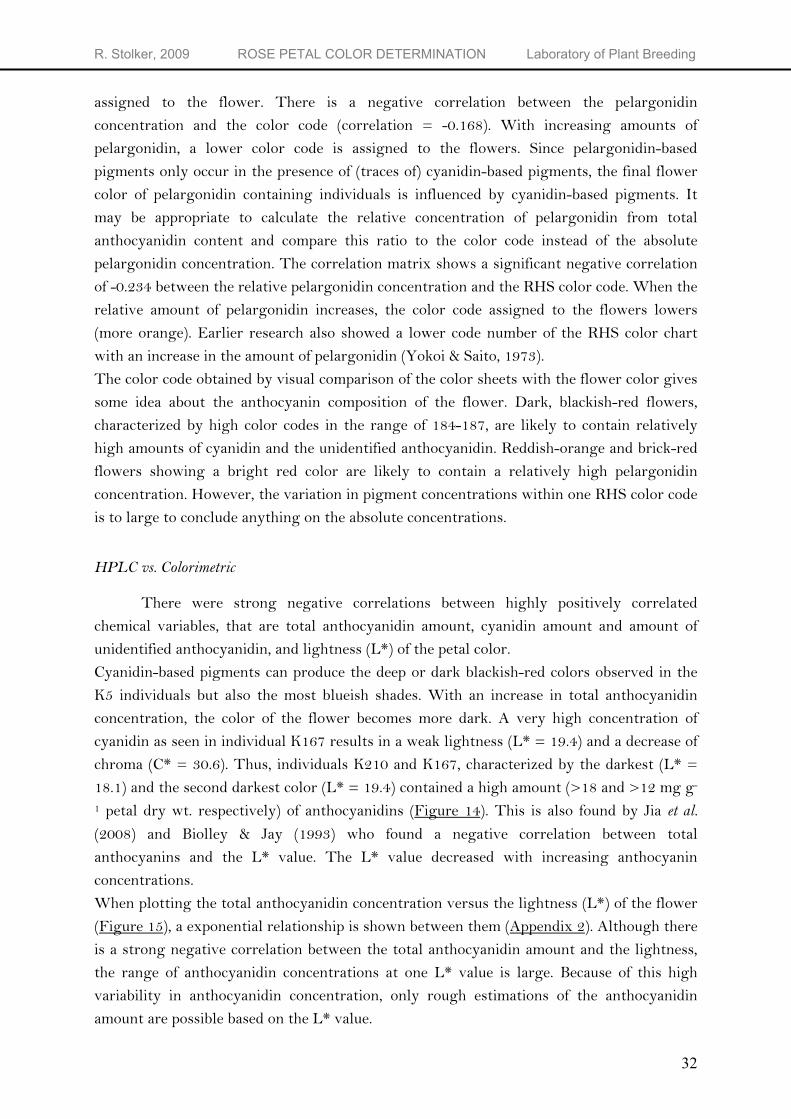
1 petal dry wt. respectively) of anthocyanidins (Figure 14). This is also found by Jia et al. (2008) and Biolley & Jay (1993) who found a negative correlation between total anthocyanins and the L* value. The L* value decreased with increasing anthocyanin concentrations. When plotting the total anthocyanidin concentration versus the lightness (L*) of the flower (Figure 15), a exponential relationship is shown between them (Appendix 2). Although there is a strong negative correlation between the total anthocyanidin amount and the lightness, the range of anthocyanidin concentrations at one L* value is large. Because of this high variability in anthocyanidin concentration, only rough estimations of the anthocyanidin amount are possible based on the L* value.
32
R. Stolker, 2009 ROSE PETAL COLOR DETERMINATION Laboratory of Plant Breeding
Figure 15. Relation between the lightness (L*) of intact tissue and the concentration of anthocyanidins in the rose petals. Observations marked in red indicate individuals containing a pelargonidin concentration higher than 2 mg g-1 petal dry wt.
33
R. Stolker, 2009 ROSE PETAL COLOR DETERMINATION Laboratory of Plant Breeding
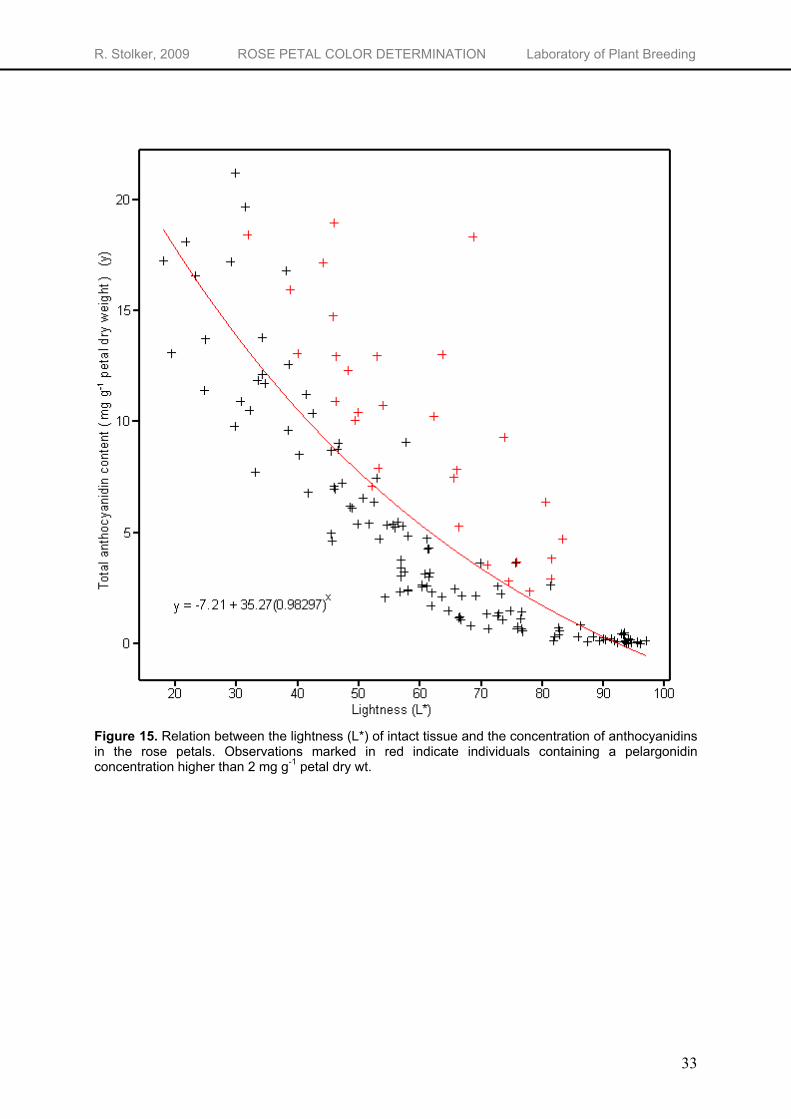
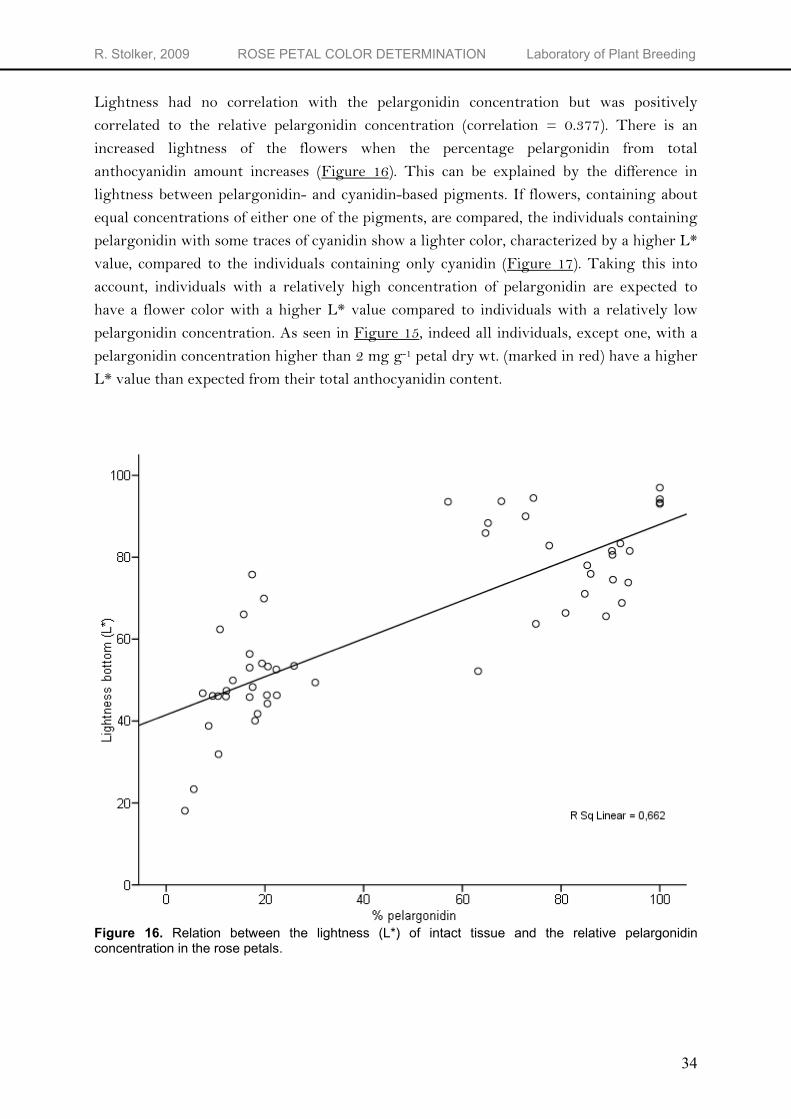
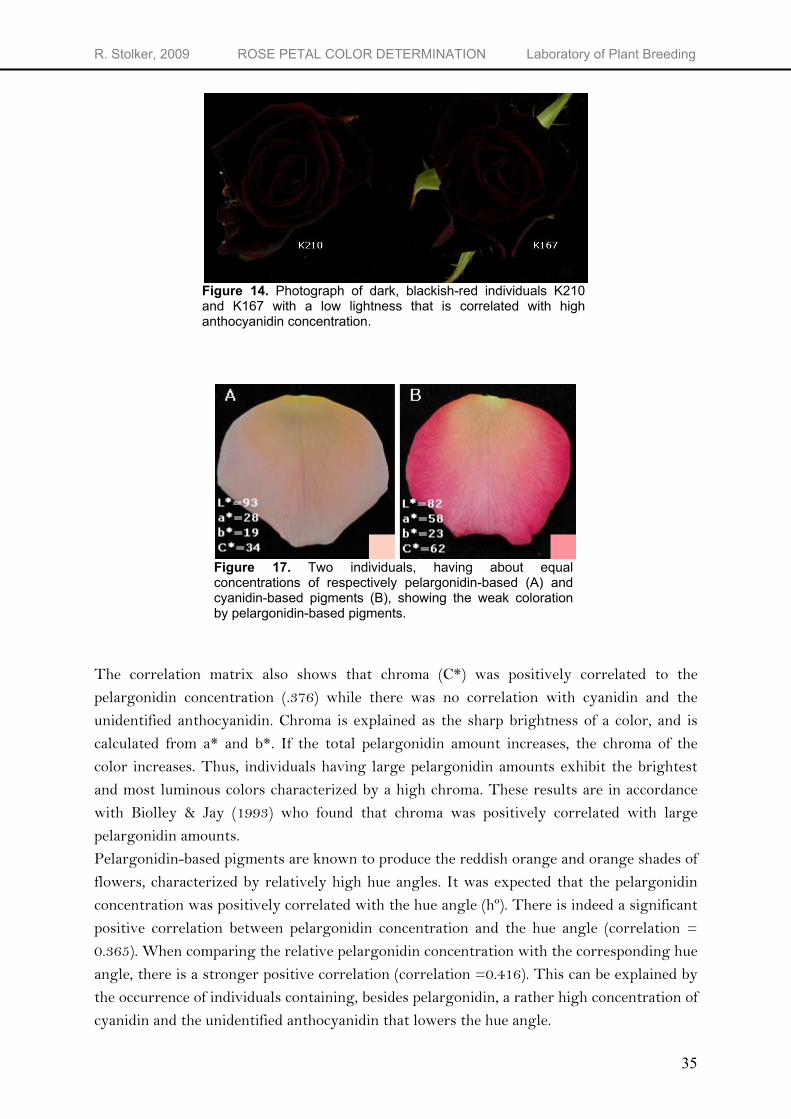
Lightness had no correlation with the pelargonidin concentration but was positively correlated to the relative pelargonidin concentration (correlation = 0.377). There is an increased lightness of the flowers when the percentage pelargonidin from total anthocyanidin amount increases (Figure 16). This can be explained by the difference in lightness between pelargonidin- and cyanidin-based pigments. If flowers, containing about equal concentrations of either one of the pigments, are compared, the individuals containing pelargonidin with some traces of cyanidin show a lighter color, characterized by a higher L* value, compared to the individuals containing only cyanidin (Figure 17). Taking this into account, individuals with a relatively high concentration of pelargonidin are expected to have a flower color with a higher L* value compared to individuals with a relatively low pelargonidin concentration. As seen in Figure 15, indeed all individuals, except one, with a pelargonidin concentration higher than 2 mg g-1 petal dry wt. (marked in red) have a higher L* value than expected from their total anthocyanidin content.
Figure 16. Relation between the lightness (L*) of intact tissue and the relative pelargonidin concentration in the rose petals.
34
R. Stolker, 2009 ROSE PETAL COLOR DETERMINATION Laboratory of Plant Breeding
Figure 14. Photograph of dark, blackish-red individuals K210 and K167 with a low lightness that is correlated with high anthocyanidin concentration.
Figure 17. Two individuals, having about equal concentrations of respectively pelargonidin-based (A) and cyanidin-based pigments (B), showing the weak coloration by pelargonidin-based pigments.
The correlation matrix also shows that chroma (C*) was positively correlated to the pelargonidin concentration (.376) while there was no correlation with cyanidin and the unidentified anthocyanidin. Chroma is explained as the sharp brightness of a color, and is calculated from a* and b*. If the total pelargonidin amount increases, the chroma of the color increases. Thus, individuals having large pelargonidin amounts exhibit the brightest and most luminous colors characterized by a high chroma. These results are in accordance with Biolley & Jay (1993) who found that chroma was positively correlated with large pelargonidin amounts. Pelargonidin-based pigments are known to produce the reddish orange and orange shades of flowers, characterized by relatively high hue angles. It was expected that the pelargonidin concentration was positively correlated with the hue angle (hº). There is indeed a significant positive correlation between pelargonidin concentration and the hue angle (correlation = 0.365). When comparing the relative pelargonidin concentration with the corresponding hue angle, there is a stronger positive correlation (correlation =0.416). This can be explained by the occurrence of individuals containing, besides pelargonidin, a rather high concentration of cyanidin and the unidentified anthocyanidin that lowers the hue angle.
35
R. Stolker, 2009 ROSE PETAL COLOR DETERMINATION Laboratory of Plant Breeding
In general there were good correlations between chemical components and colorimetric indices lightness (L*), chroma (C*) and hº. The fact that the L* and hº show a stronger correlation to the relative pelargonidin amount than to the absolute pelargonidin concentration can be explained by the fact pelargonidin is overruled by cyanidin-based pigments when present in too low relative amounts. Earlier research showed that when the percentage pelargonidin was below 50% of total anthocyanidin amount, it was too weak to modify a color primarily produced by cyanidin-based pigments (Prodanov et al., 2005).
HPLC vs. Absorbance
Since pelargonidin-based pigments exhibit a lower λmax compared to cyanidin-based
pigments, one would expect cyanidin to higher and pelargonidin to lower the λmax of the
peak in the absorbance measurements. The correlation matrix indeed shows a lower λmax when the pelargonidin concentration increases (correlation coefficient = -0.491) and a higher λmax when the cyanidin concentration increases (correlation coefficient = 0.432). Since pelargonidin-based pigments do not occur without the presence of (traces of) cyanidin-based
pigments, the cyanidin concentration influences the λmax in the absorbance measurements. If there is some sort of threshold of relative pelargonidin concentration versus total
anthocyanidin concentration, the comparison of pelargonidin concentration with the λmax may not be appropriate since the cyanidin concentration is not taken into account. To see if there is a correlation between the relative pelargonidin content and the wavelength of maximum absorption, this factor was included in the correlation matrix. There is a highly significant negative correlation of -0.906 between these two factors. An increase in the
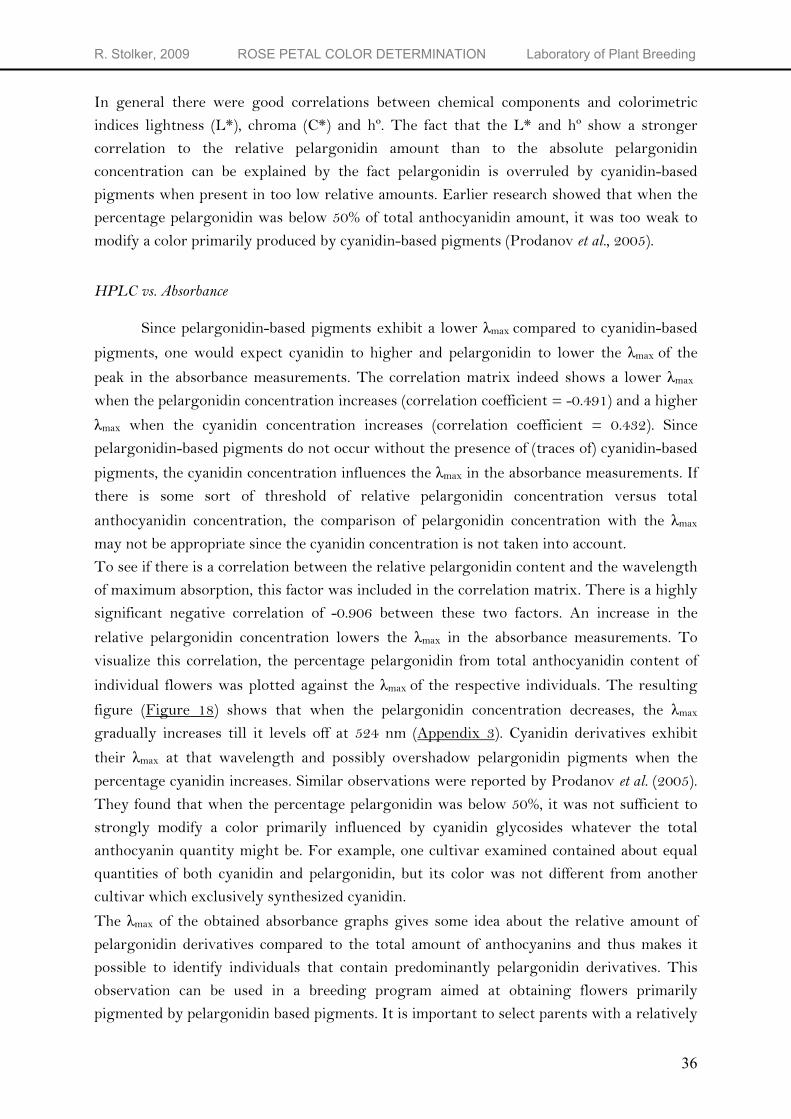
relative pelargonidin concentration lowers the λmax in the absorbance measurements. To visualize this correlation, the percentage pelargonidin from total anthocyanidin content of
individual flowers was plotted against the λmax of the respective individuals. The resulting
figure (Figure 18) shows that when the pelargonidin concentration decreases, the λmax gradually increases till it levels off at 524 nm (Appendix 3). Cyanidin derivatives exhibit
their λmax at that wavelength and possibly overshadow pelargonidin pigments when the percentage cyanidin increases. Similar observations were reported by Prodanov et al. (2005). They found that when the percentage pelargonidin was below 50%, it was not sufficient to strongly modify a color primarily influenced by cyanidin glycosides whatever the total anthocyanin quantity might be. For example, one cultivar examined contained about equal quantities of both cyanidin and pelargonidin, but its color was not different from another cultivar which exclusively synthesized cyanidin.
The λmax of the obtained absorbance graphs gives some idea about the relative amount of pelargonidin derivatives compared to the total amount of anthocyanins and thus makes it possible to identify individuals that contain predominantly pelargonidin derivatives. This observation can be used in a breeding program aimed at obtaining flowers primarily pigmented by pelargonidin based pigments. It is important to select parents with a relatively
36
R. Stolker, 2009 ROSE PETAL COLOR DETERMINATION Laboratory of Plant Breeding
high pelargonidin content, since the cyanidin pigments will overrule the pelargonidin pigments when passing a certain threshold ratio.
Figure 18. Correlation of relative pelargonidin content and λmax
(nm) from the absorbance measurements. The absorbance λmax
of individual flowers is plotted against the relative pelargonidin concentration of the respective individuals. The higher the percentage pelargonidin from total amount of anthocyanidins, the lower the λmax
obtained in the absorbance measurements.
37
R. Stolker, 2009 ROSE PETAL COLOR DETERMINATION Laboratory of Plant Breeding
Determination of total anthocyanidin concentration using absorbance
When running non-hydrolyzed samples through the spectrophotometer, the λmax of the obtained absorbance graphs gives some idea about the amount of pelargonidin relative to the total amount of anthocyanidins. However, nothing can be concluded about the absolute concentration of the pigments. To see if quantification of anthocyanin pigments is possible using UV/Vis spectrophotometry, a concentration series of four concentrations (10, 20, 40 and 100 mg L-1) of the different anthocyanidin standards was analyzed. The resulting absorbance graphs show a perfect linear relationship between the anthocyanidin concentration and the height of the curve. For cyanidin, pelargonidin, peonidin and delphinidin the R2’s are respectively 0.999, 0.997, 1 and 1 (data not shown). Quantification of extracts containing only one anthocyanidin is possible. In contrast to the pure anthocyanidin standards, the non-hydrolyzed flower extracts from the K5 individuals contain a mixture of different anthocyanins. When running these extracts through the UV-Vis spectrophotometer, the absorbance graphs are build up from the combined absorbance’s of the different anthocyanins. Quantification of each individual anthocyanin is hereby made impossible. However, quantification of the total anthocyanin concentration may be possible using the
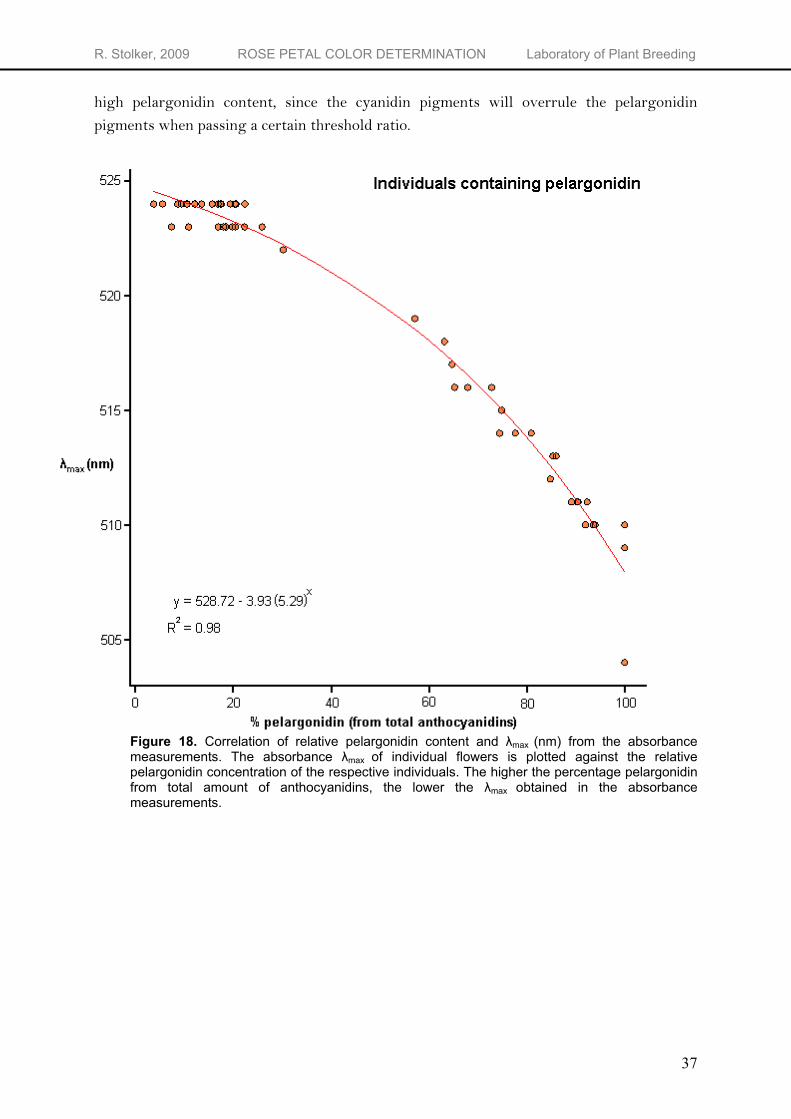
height of the λmax. To be able to compare total anthocyanidin concentration from HPLC with the absorbance
measurement, the height of the curve at the λmax needs to be corrected for the volume extraction fluid used, the dilution factor for the absorbance measurement and the amount of petal material used. The resulting corrected absorbance values (calculation example in Appendix 4) show a good exponential correlation with the anthocyanidin concentration (Figure 19) with a R2 of 0.813. Since the standard error of the observations is rather high (s.e. = 1.89), the absorbance measurements give only a rough estimation of the anthocyanidin concentration in the flowers. When great precision is not necessary, one can use absorbance measurements to have an indication for the anthocyanidin content of the flower. The same relation between absorbance and concentration of anthocyanins is found by Yokoi et al. (1979) who measured the absorbance of intact tissue and the concentration of anthocyanins in the petals of 10 rose cultivars. The exponential relation between the absorbance and the anthocyanidin concentration can be explained by the theory of absorbance. At higher concentrations, linearity breaks down due to saturation of the sample. An increase in concentration will only result in slight changes in absorbance3. This will result in more variability in anthocyanidin concentration at high absorbance values.
3 www.turnerdesigns.com/t2/doc/appnotes/S-0075.pdf 38
R. Stolker, 2009 ROSE PETAL COLOR DETERMINATION Laboratory of Plant Breeding
Figure 19. Relation between the corrected absorbance of petal extracts and concentration of anthocyanidins in the rose petal.
39
R. Stolker, 2009 ROSE PETAL COLOR DETERMINATION Laboratory of Plant Breeding
RHS vs. Colorimetric
There was a negative correlation (R = -.575) between the color code assigned to the flower and the lightness (L*) obtained from the reflectance measurements. This correlation does not indicate any causal relationship between color code and lightness but is merely the effect of a common correlation to the total anthocyanin content. If the total anthocyanidin content is very high, this results in a dark flower color characterized by a high color code in the range of 184-187 and in a low L* value calculated from the reflection curve. A negative correlation (R = -.289) can be observed between chroma (C*) and the color code. This means when an individual has a relatively high C*, it often has a relatively low color code. Again, his correlation does not indicate any causal relationship between the color code and C*, but is merely the effect of a common correlation another variable. Individuals with high pelargonidin concentrations exhibit the brightest and most luminous colors (high chroma) and have relatively low color codes representing reddish-orange and orange colors.
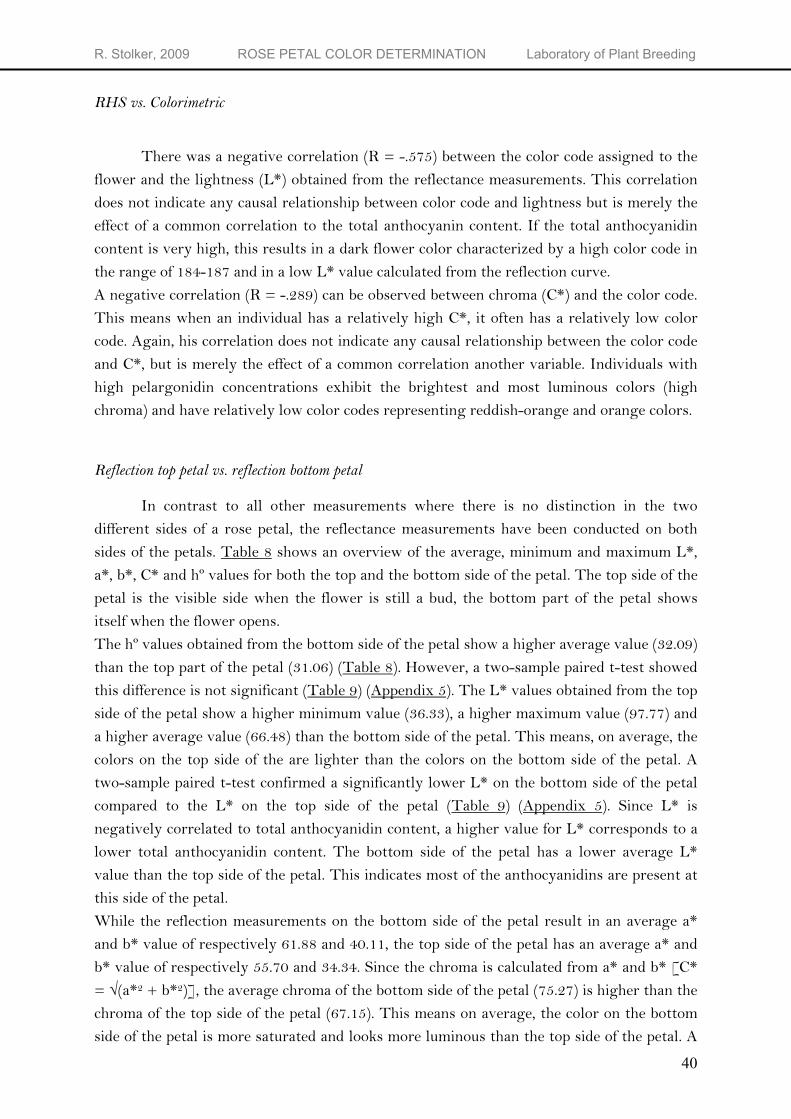
Reflection top petal vs. reflection bottom petal
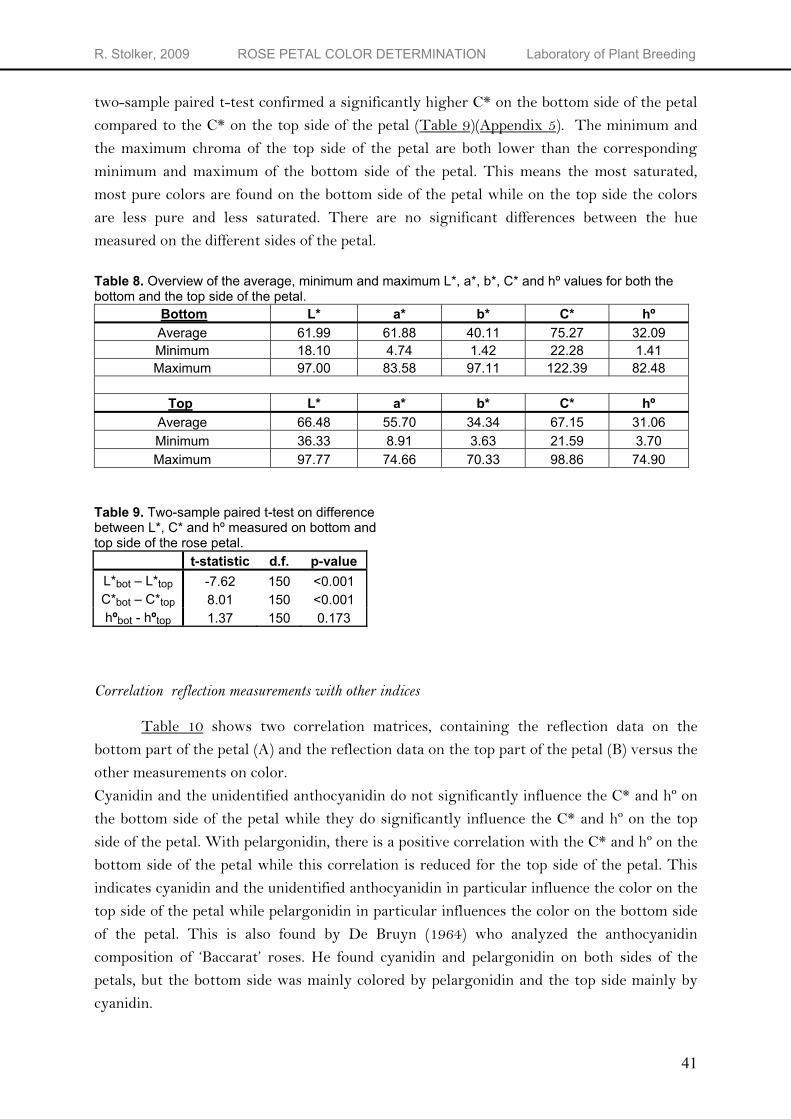
In contrast to all other measurements where there is no distinction in the two different sides of a rose petal, the reflectance measurements have been conducted on both sides of the petals. Table 8 shows an overview of the average, minimum and maximum L*, a*, b*, C* and hº values for both the top and the bottom side of the petal. The top side of the petal is the visible side when the flower is still a bud, the bottom part of the petal shows itself when the flower opens. The hº values obtained from the bottom side of the petal show a higher average value (32.09) than the top part of the petal (31.06) (Table 8). However, a two-sample paired t-test showed this difference is not significant (Table 9) (Appendix 5). The L* values obtained from the top side of the petal show a higher minimum value (36.33), a higher maximum value (97.77) and a higher average value (66.48) than the bottom side of the petal. This means, on average, the colors on the top side of the are lighter than the colors on the bottom side of the petal. A two-sample paired t-test confirmed a significantly lower L* on the bottom side of the petal compared to the L* on the top side of the petal (Table 9) (Appendix 5). Since L* is negatively correlated to total anthocyanidin content, a higher value for L* corresponds to a lower total anthocyanidin content. The bottom side of the petal has a lower average L* value than the top side of the petal. This indicates most of the anthocyanidins are present at this side of the petal. While the reflection measurements on the bottom side of the petal result in an average a* and b* value of respectively 61.88 and 40.11, the top side of the petal has an average a* and b* value of respectively 55.70 and 34.34. Since the chroma is calculated from a* and b* [C* = √(a*2 + b*2)], the average chroma of the bottom side of the petal (75.27) is higher than the chroma of the top side of the petal (67.15). This means on average, the color on the bottom side of the petal is more saturated and looks more luminous than the top side of the petal. A
40
R. Stolker, 2009 ROSE PETAL COLOR DETERMINATION Laboratory of Plant Breeding
two-sample paired t-test confirmed a significantly higher C* on the bottom side of the petal compared to the C* on the top side of the petal (Table 9)(Appendix 5). The minimum and the maximum chroma of the top side of the petal are both lower than the corresponding minimum and maximum of the bottom side of the petal. This means the most saturated, most pure colors are found on the bottom side of the petal while on the top side the colors are less pure and less saturated. There are no significant differences between the hue measured on the different sides of the petal.
Table 8. Overview of the average, minimum and maximum L*, a*, b*, C* and hº values for both the bottom and the top side of the petal.
Bottom L* a* b* C* hº Average 61.99 61.88 40.11 75.27 32.09 Minimum 18.10 4.74 1.42 22.28 1.41 Maximum 97.00 83.58 97.11 122.39 82.48
Top L* a* b* C* hº
Average 66.48 55.70 34.34 67.15 31.06 Minimum 36.33 8.91 3.63 21.59 3.70 Maximum 97.77 74.66 70.33 98.86 74.90
Table 9. Two-sample paired t-test on difference between L*, C* and hº measured on bottom and top side of the rose petal.
t-statistic d.f. p-value L*bot – L*top -7.62 150 <0.001 C*bot – C*top 8.01 150 <0.001 hºbot - hºtop 1.37 150 0.173
Correlation reflection measurements with other indices
Table 10 shows two correlation matrices, containing the reflection data on the bottom part of the petal (A) and the reflection data on the top part of the petal (B) versus the other measurements on color. Cyanidin and the unidentified anthocyanidin do not significantly influence the C* and hº on the bottom side of the petal while they do significantly influence the C* and hº on the top side of the petal. With pelargonidin, there is a positive correlation with the C* and hº on the bottom side of the petal while this correlation is reduced for the top side of the petal. This indicates cyanidin and the unidentified anthocyanidin in particular influence the color on the top side of the petal while pelargonidin in particular influences the color on the bottom side of the petal. This is also found by De Bruyn (1964) who analyzed the anthocyanidin composition of ‘Baccarat’ roses. He found cyanidin and pelargonidin on both sides of the petals, but the bottom side was mainly colored by pelargonidin and the top side mainly by cyanidin.
41
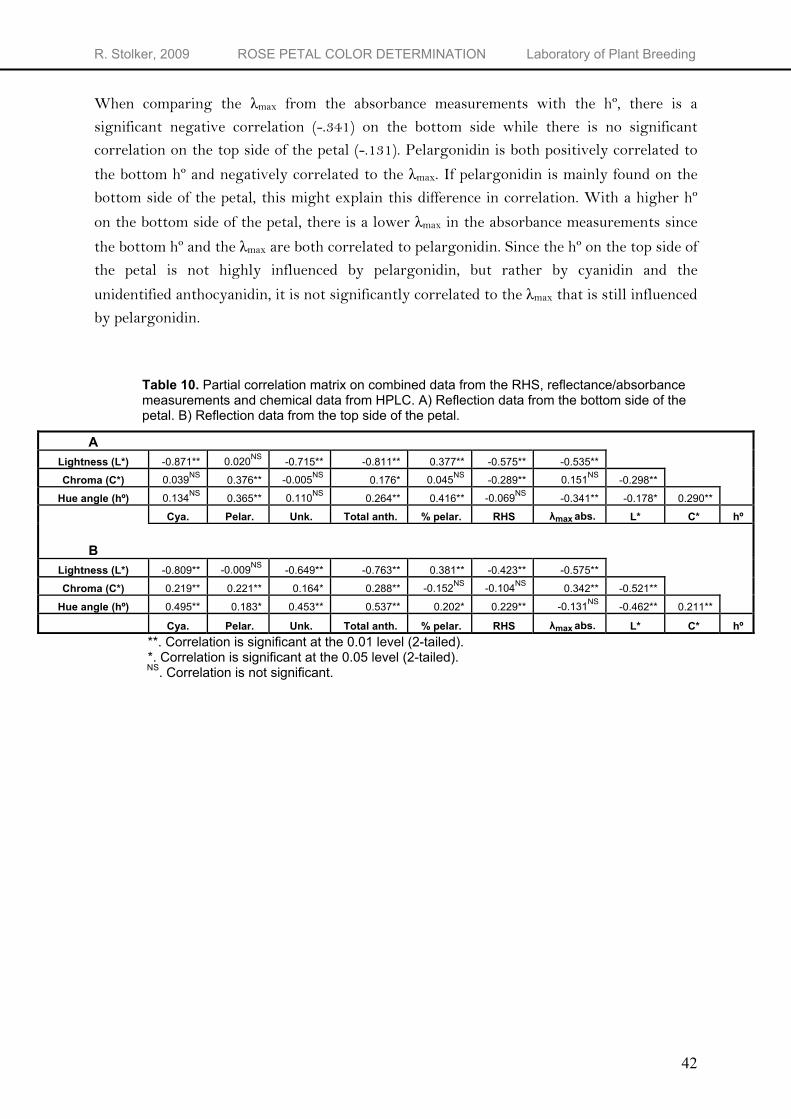
R. Stolker, 2009 ROSE PETAL COLOR DETERMINATION Laboratory of Plant Breeding
When comparing the λmax from the absorbance measurements with the hº, there is a significant negative correlation (-.341) on the bottom side while there is no significant correlation on the top side of the petal (-.131). Pelargonidin is both positively correlated to
the bottom hº and negatively correlated to the λmax. If pelargonidin is mainly found on the bottom side of the petal, this might explain this difference in correlation. With a higher hº
on the bottom side of the petal, there is a lower λmax in the absorbance measurements since
the bottom hº and the λmax are both correlated to pelargonidin. Since the hº on the top side of the petal is not highly influenced by pelargonidin, but rather by cyanidin and the
unidentified anthocyanidin, it is not significantly correlated to the λmax that is still influenced by pelargonidin.
Table 10. Partial correlation matrix on combined data from the RHS, reflectance/absorbance measurements and chemical data from HPLC. A) Reflection data from the bottom side of the petal. B) Reflection data from the top side of the petal.
**. Correlation is significant at the 0.01 level (2-tailed).
A Lightness (L*) -0.871** 0.020NS -0.715** -0.811** 0.377** -0.575** -0.535**
Chroma (C*) 0.039NS 0.376** -0.005NS 0.176* 0.045NS -0.289** 0.151NS -0.298**
Hue angle (hº) 0.134NS 0.365** 0.110NS 0.264** 0.416** -0.069NS -0.341** -0.178* 0.290**
Cya. Pelar. Unk. Total anth. % pelar. RHS λmax abs. L* C* hº B
Lightness (L*) -0.809** -0.009NS -0.649** -0.763** 0.381** -0.423** -0.575**
Chroma (C*) 0.219** 0.221** 0.164* 0.288** -0.152NS -0.104NS 0.342** -0.521**
Hue angle (hº) 0.495** 0.183* 0.453** 0.537** 0.202* 0.229** -0.131NS -0.462** 0.211**
Cya. Pelar. Unk. Total anth. % pelar. RHS λmax abs. L* C* hº
*. Correlation is significant at the 0.05 level (2-tailed). NS. Correlation is not significant.
42
R. Stolker, 2009 ROSE PETAL COLOR DETERMINATION Laboratory of Plant Breeding
Inheritance of anthocyanidin pigments
When studying the inheritance of color, one must focus on the inheritance of the individual pigments since a flower color is not inherited as such but results from a specific combination of pigments. The method most useful when studying the inheritance of individual pigments is the HPLC method. HPLC provides qualitative data on the anthocyanidin composition and quantitative data on the amount of each individual anthocyanidin. In this study, the salmon parent P867 contained low levels of pelargonidin (~0.4 mg g-1 petal dry wt.) and traces of cyanidin. The dark red parent P540 contained high levels of cyanidin (~17.2 mg g-1 petal dry wt.), a relatively high level of the unidentified anthocyanidin (~0.7 mg g-1 petal dry wt.) but no pelargonidin, not even in trace amounts.
Cyanidin
In the total population of 147 individuals, 144 plants contain measurable amounts of cyanidin. The chromatograms of the three remaining plants (K023, K144 and K151) do have a peak at the retention time of cyanidin, but the peak area is below the minimum of 50,000 µv*sec. These plants do contain cyanidin, but only in trace amounts. Cyanidin is regularly found as the only pigment present in a flower. The same observations are made by De Vries et al. (1974) who found cyanidin in 200 varieties tested and by Marshall et al. (1983) who found cyanidin in 99% of the seedlings of 1200 progeny from 47 families. Since it was not possible to class the wide and continuous range of pigment concentrations into clear cut groups (Figure 20), additive gene action was supposed for cyanidin. Additive gene action for cyanidin was also shown by Dubois & de Vries (1980b) who made a large number of crosses between 18 rose varieties with a known pigment composition. This means that each loci in a group of non-allelic genes has a specific value that it contributes to a polygenic trait. The pigment contents in the resulting seedling populations could not be classed into clear cut groups.
Pelargonidin
Segregation of pelargonidin in the K5 population shows 50 individuals containing measurable amounts of pelargonidin and 97 individuals containing not detectable amounts of pelargonidin. The segregation of pelargonidin in the K5 population did not fit any of the expected segregation ratios in a tetraploid cross (Table 11). The presence of many different compounds in the flower extracts results in noise in the sensor response. Therefore, the minimum area to be detected as a peak was set at 50,000 µv*sec. Because of this threshold, some of the 97 individuals do have a sensor response at the retention time of pelargonidin but the peak area of this response is below the threshold. This results in the possibility of classifying some individuals as not containing pelargonidin, while they in fact contain pelargonidin in a concentration that is below the threshold level. The observed segregation ratio for pelargonidin: no pelargonidin (50:97) may be influenced by
43
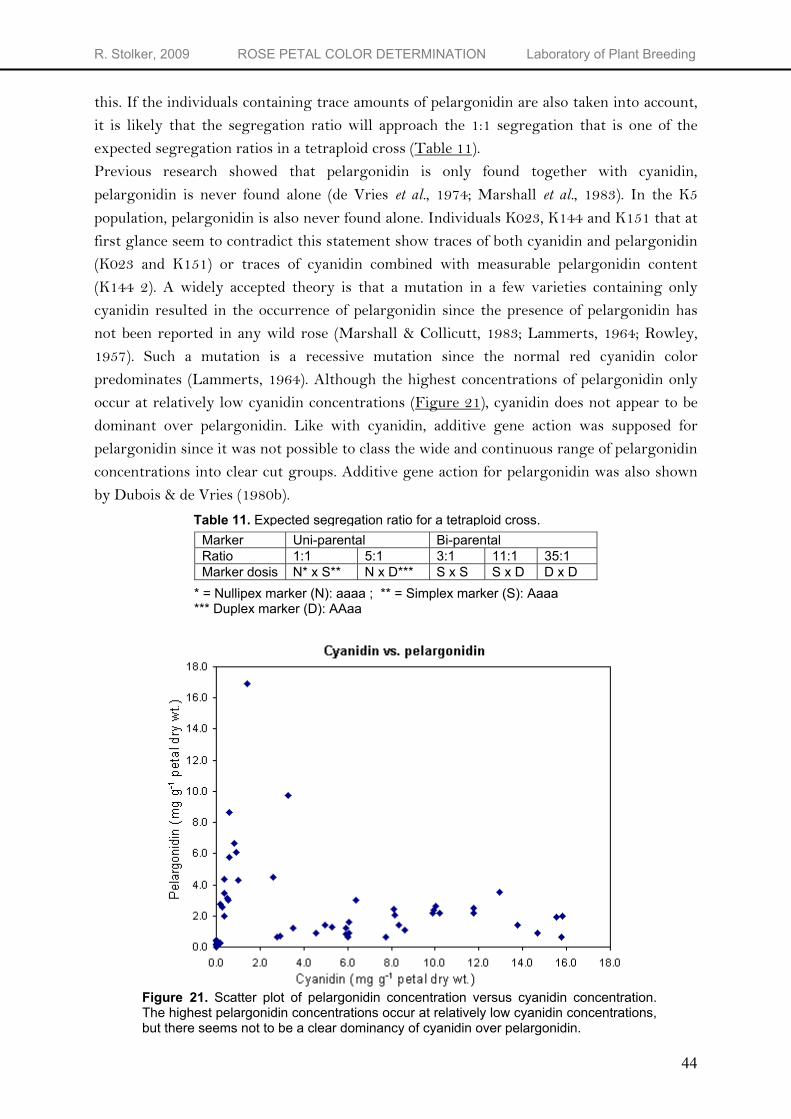
R. Stolker, 20
09 ROSE PETAL COLOR DETERMINATION Laboratory of Plant Breeding
Previous research showed that pelargonidin is only found together with cyanidin, pelargonidin is never found alone (de Vries et al., 1974; Marshall et al., 1983). In the K5 population, pelargonidin is also never found alone. Individuals K023, K144 and K151 that at first glance seem to contradict this statement show traces of both cyanidin and pelargonidin (K023 and K151) or traces of cyanidin combined with measurable pelargonidin content (K144 2). A widely accepted theory is that a mutation in a few varieties containing only cyanidin resulted in the occurrence of pelargonidin since the presence of pelargonidin has not been reported in any wild rose (Marshall & Collicutt, 1983; Lammerts, 1964; Rowley, 1957). Such a mutation is a recessive mutation since the normal red cyanidin color predominates (Lammerts, 1964). Although the highest concentrations of pelargonidin only occur at relatively low cyanidin concentrations (Figure 21), cyanidin does not appear to be dominant over pelargonidin. Like with cyanidin, additive gene action was supposed for pelargonidin since it was not possible to class the wide and continuous range of pelargonidin concentrations into clear cut groups. Additive gene action for pelargonidin was also shown by Dubois & de Vries (1980b).
this. If the individuals containing trace amounts of pelargonidin are also taken into account, it is likely that the segregation ratio will approach the 1:1 segregation that is one of the expected segregation ratios in a tetraploid cross (Table 11).
Figure The higbut ther
Table 11. Expected segregation ratio for a tetraploid cross.
44
* = Nullipex marker (N): aaaa ; ** = Simplex marker (S): Aaaa *** Duplex marker (D): AAaa
21. Scatter plot of pelargonidin concentration versus cyanidin concentration. hest pelargonidin concentrations occur at relatively low cyanidin concentrations, e seems not to be a clear dominancy of cyanidin over pelargonidin.
Marker Uni-parental Bi-parental Ratio 1:1 5:1 3:1 11:1 35:1 Marker dosis N* x S** N x D*** S x S S x D D x D
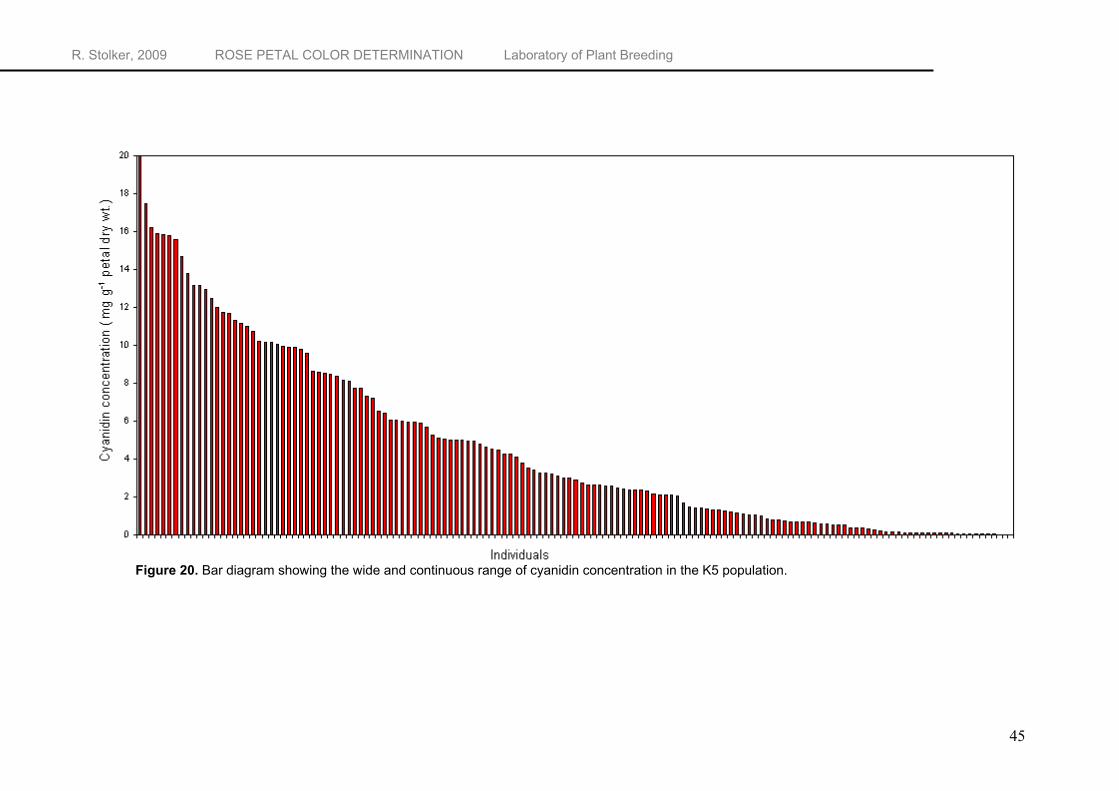
R. Stolker, 20
09 ROSE PETAL COLOR DETERMINATION Laboratory of Plant Breeding
45
Figure 20. Bar diagram showing the wide and continuous range of cyanidin concentration in the K5 population.
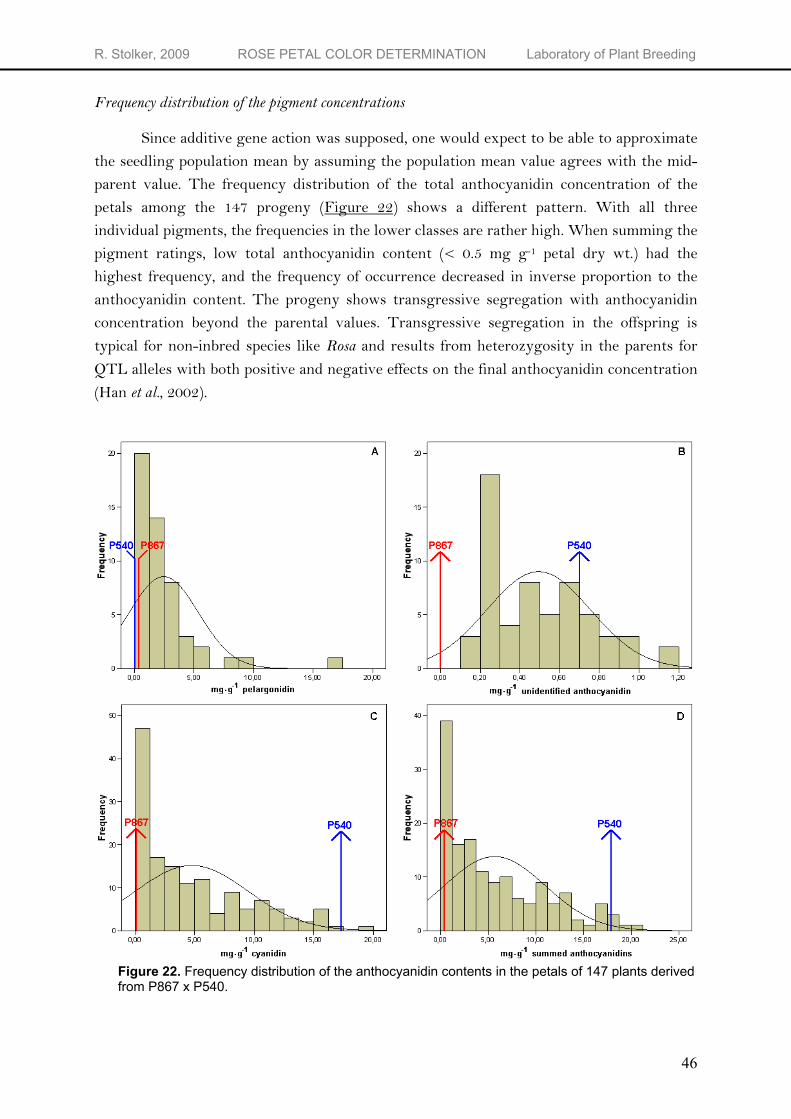
R. Stolker, 2009 ROSE PETAL COLOR DETERMINATION Laboratory of Plant Breeding
Frequency distribution of the pigment concentrations
Since additive gene action was supposed, one would expect to be able to approximate the seedling population mean by assuming the population mean value agrees with the mid-parent value. The frequency distribution of the total anthocyanidin concentration of the petals among the 147 progeny (Figure 22) shows a different pattern. With all three individual pigments, the frequencies in the lower classes are rather high. When summing the pigment ratings, low total anthocyanidin content (< 0.5 mg g-1 petal dry wt.) had the highest frequency, and the frequency of occurrence decreased in inverse proportion to the anthocyanidin content. The progeny shows transgressive segregation with anthocyanidin concentration beyond the parental values. Transgressive segregation in the offspring is typical for non-inbred species like Rosa and results from heterozygosity in the parents for QTL alleles with both positive and negative effects on the final anthocyanidin concentration (Han et al., 2002).
Figure 22. Frequency distribution of the anthocyanidin contents in the petals of 147 plants derived from P867 x P540.
46
R. Stolker, 2009 ROSE PETAL COLOR DETERMINATION Laboratory of Plant Breeding
To be able to explain the observed frequency distributions of the different anthocyanidins, the pathway leading to the production of the different anthocyanidins was investigated. Most DFRs (dihydroflavonol 4-reductases) can utilize all three dihydroflavonols as substrates (Johnson et al., 2001). As a result, the synthesis of the different anthocyanidins are mainly determined by the enzyme activities of F3’H and F3’5’H. Since roses do not contain the F3’5’H (roses do not naturally produce delphinidin-based anthocyanidins), one must focus on the activity of the F3’H gene to explain the observed frequency distributions of the different anthocyanidins. In a great number of plant species, cyanidin synthesis (3’4’-hydroxylation) is dominant over pelargonidin synthesis (4’-hydroxylation) (Tyrach & Horn, 1997). When F3’H is present, the anthocyanin biochemical pathway is directed to the production of cyanidin-based anthocyanins (Tanaka & Ohmiya, 2008; Nakatsuka et al., 2007; Tsuda et al., 2004; Tanaka et al., 1995). Tanaka & Ohmiya (2008) state that the deficiency of the competing F3’H enzyme against DFR is necessary for pelargonidin accumulation in transgenic petunias expressing a gerbera DFR gene. Nakatsuka et al. (2007) produced red-flowering transgenic tobacco plants by down regulation of the NtF3’H gene together with over expressing the gerbera DFR gene. This resulted in additional pelargonidin production in the transgenic lines. Tsuda et al. (2004) worked on modifying the flower color of Petunia hybrida by metabolic engineering. They found that when the rose DFR was expressed in a petunia that was dominant in the F3’H gene, there was no synthesis of pelargonidin. When subsequently the F3’H gene was down regulated in combination with expression of the rose DFR gene, pelargonidin was the most abundant anthocyanidin and the flower color changed from red to orange. Tanaka et al. (1995) transformed a F3’H deficient petunia cultivar with a rose DFR cDNA. The petals and anthers of the transgenic petunia plants were salmon pink and contained pelargonidin. All these results indicate the dominant nature of the F3’H gene over the DFR gene. This dominance of F3’H explains the preference for the production of cyanidin, indicated by the occurrence of cyanidin in all K5 individuals. Tyrach & Horn (1997) found a 3 pelargonidin:1 cyanidin segregation in a cross between two pelargonidin producing genotypes. They explained this segregation by the action of an inhibitor x+ which is epistatic over the dominant f3’h locus which controls the activity of the F3’H enzyme. To be able to explain the overrepresentation of plants with a relatively high pelargonidin concentration and the overrepresentation of plants with a relatively low cyanidin content, a major gene inhibiting the expression of the f3’h locus and the action of multiple genes with both positive and negative effects is hypothesized. The occurrence of high pelargonidin concentration in some K5 individuals can be explained by the proposed presence of an inhibitor of F3’H, resulting in the accumulation of dihydrokaempferol subsequently leading to the production of pelargonidin-based anthocyanins. The presence of such an inhibiting factor would result in relatively many individuals with a low cyanidin content since the pathway leading to the production of dihydroquercetin is blocked in individuals containing this inhibitor. Since the anthocyanidin content is a quantitative trait,
47
R. Stolker, 2009 ROSE PETAL COLOR DETERMINATION Laboratory of Plant Breeding
differences in the genetics between P867 and P540 could account for the observed segregation in anthocyanidin concentrations in the different K5 individuals. The light colored parent P867 contained low levels of pelargonidin (~0.4 mg g-1 petal dry wt.), no unidentified anthocyanidin and only traces of cyanidin. The dark red colored parent P540 contained high levels of cyanidin (~17.2 mg g-1 petal dry wt.), a relatively high level of the unidentified anthocyanidin (~0.7 mg g-1 petal dry wt.) but no pelargonidin, not even in trace amounts. If P867 harbors the inhibitor combined with a high number of minus alleles and P540 contains a high number of plus alleles but does not contain the inhibitor, recombination between these parents could results in individuals having the inhibitor of cyanidin production combined with a relatively high number of plus alleles. These individuals would have a high pelargonidin concentration with a low cyanidin concentrations. The presence of some cyanidin in these individuals can be explained by the fact the F3’H gene could still have a very low expression as previously shown by Tsuda et al. (2004) who down regulated the F3'H gene and showed that the expression was as low as 3-5% compared to the wild type. It must be taken into account that the presence of a major gene with an inhibiting function on the f3’h activity is a hypothesized situation. However, taken the observed frequency distributions into account, it seems to be the most plausible explanation. Although most DFRs (dihydroflavonol 4-reductases) can utilize all three dihydroflavonols as substrates (Johnson et al., 2001), the influence of varying substrate-specificity of different DFRs cannot be ruled out as a possible factor influencing the observed anthocyanidin concentrations in the K5 population. Johnson et al. (2001) analyzed chimeric DFRs of Petunia and Gerbera and identified a region that determines the substrate specificity of DFR. A single mutation in the region already altered the substrate specificity, suggesting that DFRs from different plant species or even in different cultivars of a species can have different substrate specificities. Further analysis of crosses and QTL mapping are necessary to be able to verify the above described hypothesis.
48
R. Stolker, 2009 ROSE PETAL COLOR DETERMINATION Laboratory of Plant Breeding
CHAPTER V
CONCLUSIONS
Reverse Phase Liquid High Performance Chromatography (RP-HPLC) yields precise
information on the exact anthocyanidin composition in rose flowers. Using anthocyanidin standards, the compounds can be identified and quantified resulting in information on the type and concentration of anthocyanidin pigments present in the flower. Assigning a color code to a flower using the Royal Horticultural Society Color Chart (RHSCC) is a rough indication for the flower color. Due to the almost unlimited number of different hues and colors in roses it is impossible to be able to distinguish all the different possible hues of red in a color chart. Therefore, the subdivision in color codes can only be considered a rough first indication for the flower color. The color code obtained by visual comparison of the color sheets with the flower color gives some idea about the anthocyanin composition of the flower. Dark, blackish-red flowers, characterized by high color codes in the range of 184-187, are likely to contain high amounts of cyanidin and the unidentified anthocyanidin. Reddish-orange and brick-red flowers showing a bright red color are likely to contain a relatively high pelargonidin concentration. However, the variation in pigment concentrations within one RHS color code is to large to conclude anything on the absolute concentrations.
Absorbance measurements yields information on the λmax of the anthocyanin extracts. Since the extracts contain a mixture of anthocyanins, the absorbance curve is build up from the combined absorbances of the different pigments. Pelargonidin derivatives exhibit a lower
λmax than cyanidin derivatives. The absorbance graphs from the K5 population are in
agreement with these observations and show differences in λmax. Individuals containing a
relatively high percentage pelargonin, show a lower λmax than individuals having a lower percentage pelargonin making it possible to estimate the relative pelargonin concentration of the extracts.
When comparing the chemical data from HPLC, there is a good relation between the λmax and the percentage pelargonidin from total anthocyanidin content making it possible to give
a rough indication for the ratio of pelargonidin to total anthocyanidin content from the λmax. When comparing the corrected height of the absorbance peak to the total anthocyanidin content from HPLC, there is a reasonable correlation. The anthocyanidin concentration can be estimated from the height of the absorbance peak. If only rough estimations of the anthocyanidin composition are necessary, absorbance measurements are useful. Reflectance measurements result in spectral curves describing the color of each individual. The flower colors can be very precisily quantified using the CIELab color space coordinates lightness (L*) red-green (a*) and yellow-blue (b*). The variation in calculated CIELab values is large. There is evidence that, in general, there are good correlations between chemical components and colorimetric indices so that one method could suggest the
49
R. Stolker, 2009 ROSE PETAL COLOR DETERMINATION Laboratory of Plant Breeding
outcome of the other one. Although there is a strong negative correlation between the total anthocyanidin amount and the lightness, the variability in total anthocyanidin concentrations at one L* value is large. Because of this large variability in anthocyanidin concentration, only rough estimations of the anthocyanidin amount are possible. In general, pelargonidin results in flowers with a higher L* value than flowers with a corresponding cyanidin concentration. The C* value gives some idea about the relative concentration of pelargonidin, but is not as precise as the absorbance measurement in estimating the pelargonidin content. If there is no need to know the precise anthocyanidin composition, one could use the reflectance measurement to estimate the anthocyanidin concentration since the L* value shows a good relation to the total anthocyanidin amount. The lower the lightness of a color, the higher the anthocyanidin amount and vice versa. When studying the inheritance of color, one must focus on the inheritance of the individual pigments since a flower color is not inherited as such but results from a specific combination of pigments. The method most useful when studying the inheritance of individual pigments is the HPLC method since it yields the most accurate information on the concentration of the individual pigments. The continuous range of concentrations of both cyanidin, pelargonidin and the unidentified anthocyanidin show they are all inherited quantitatively. There are no clear distinct groups of specific pigment concentrations. The histograms of the different anthocyanidins and total anthocyanidin concentration show overrepresentation of the lower classes. There are far more individuals with a low anthocyanidin concentrations than expected from the cross between P867 and P540. The most plausible explanation is the presence of a major dominant gene with an inhibiting function on anthocyanidin in P867. Earlier research in Mimulus aurantiacus showed a major locus controlling the expression pattern of both F3H, DFR and ANS in flower tissues, most likely a transcription factor. If P867 was to contain such a transcription factor with a different function or expression than the P540, this could possibly explain the observed overrepresentation of individuals with a low anthocyanin concentration. Further analysis of crosses and QTL mapping are necessary to be able to verify the above described hypothesis. From this study it was concluded that: 1, the RHS color code is a fast method to have a rough indication of the flower color. 2, the absorbance measurements enable estimation of both the total anthocyanidin concentration and the percentage pelargonidin when not overruled by cyanidin. 3, the reflectance measurements enable precise quantification of the flower color using the 3-dimensional CIELab color space. 4, the CIELab values enable estimation of the total anthocyanidin concentration using the L* value while the C* gives a rough indication for individuals containing a relatively high concentration pelargonidin. 5, since the different anthocyanidin pigments are inherited quantitatively, the color of at least one of the parents should be as close as possible to the desired color of the progeny. It is difficult to recover a light pink flower color when the parents have a deep red flower color.
50
R. Stolker, 2009 ROSE PETAL COLOR DETERMINATION Laboratory of Plant Breeding
6, HPLC can be used for genetics on anthocyanins, however, HPLC alone is not enough for genetics on flower color since color is a joint effect of the anthocyanidin-based pigments and a.o. co-pigmentation, pH and cellular structure. 7, the overrepresentation of individuals with a low anthocyanidin content is possibly caused by the presence of a major gene inhibiting the expression of the f3’h locus in P867. Recommendations: 1, to prevent the exclusion of trace amounts of anthocyanidins, due to background interference, it’s recommended to purify the anthocyanidins from the flower extracts 2, to obtain information on the identity of the unidentified anthocyanidin, further analysis using for example mass-spectrometry is necessary. 3, further analysis of crosses and QTL mapping are necessary to be able to verify the hypothesized presence of a major gene inhibiting the expression of the f3’h locus in P867.
51
R. Stolker, 2009 ROSE PETAL COLOR DETERMINATION Laboratory of Plant Breeding
LITERATURE CITED
Arisumi, K. (1963) Studies on the flower colours in Rosa with special references to the biochemical and genetic analyses and to the application of those results to the practical breeding. I. Sci. Bull. Fat. Agric. Kyushu Univ. 20(2): 131-149. Biolley, J. P. & Jay, M. (1993) Anthocyanins in modern roses: Chemical and colorimetric features in relation to the colour range. J. Exp. Bot. 44: 1725-1734. Brouillard R. and Dangles O. (1993) Flavonoids and flower colour. In: Harborne, J.B. (ed.), The Flavonoids: Advances in research since 1986, Chapman & Hall, London, pp. 565-587. Bruyn, J.W. De (1964) Chemisch onderzoek ten behoeve van de veredeling. Meded. IVT 227: 20. Crespel, L., Chirollet, M., Durel, E., Zhang, D., Meynet, J. & Gudin, S. (2002) Mapping of qualitative and quantitative phenotypic traits in Rosa using AFLP markers. Theor Appl Genet 105:1207–1214. Crespel, L. & Mouchotte, J. (2003). Methods of Cross-Breeding. In: Encyclopedia of Rose Science, Elsevier Academic Press, Vol.1, p.30-33. Davies K.M., Marshall G.B., Lewis D.H., Winefield C.S., Deroles S.C., Boase M.R., Zhang H., Nielsen K.M., Schwinn K.E., Bloor S.J., Swinny E. and Martin C.R. (2003) Generation of new ornamental varieties through genetic modification of pigment biosynthesis. ISHS Acta Horticulturae 624: 435-447. Debener, T. (1999) Genetic analysis of horticulturally important morphological and physiological characters in diploid roses. Gartenbauwissenschaft 64(1): 14-20. Debener, T., Bartels, C. & Mattiesch. L. (1996) RAPD analysis of genetic variation between a group of rose cultivars and selected wild rose species. Molecular Breeding 2: 321-327. Dubois, L.A.M. & De Vries, D.P. (1980a) Pigments and petal colors. American Rose Annual 65: 139-144. Dubois, L.A.M. & De Vries, D.P. (1980b) Inheritance of pigments. American Rose Annual 65: 145-148. Fujiwara H., Tanaka Y., Fukui Y., Nakao M., Ashikari T. and Kusumi T. (1997) Anthocyanin 5-aromatic acyltransferase from Gentiana triflora. Purification, characterization and its role in anthocyanin biosynthesis. Eur. J. Biochem. 249: 45-51. Giusti, M.M. & Wrolstad, R.E. (2003) Acylated anthocyanins from edible sources and their applications in food systems. Biochemical Engineering Journal 14: 217–225. Goto T. (1987) Structure, stability and color variation of natural anthocyanins. Prog. Chem. Org. Nat. Products 52: 113–158. Goto T. and Kondo T. (1991) Structure and molecular stacking of anthocyanins-flower color variation. Angrew. Chem. Int. Ed. Engl. 30: 17–33 Griesbach, R.J. (1996) The inheritance of flower color in Petunia hybrida Vilm. The Journal of Heredity 87(3): 241-245. Gudin, S. (2001) Rose breeding technologies. Acta Hort. 547:23-26. Gudin, S. (2000). Rose: Genetics and breeding. Plant breeding reviews. vol. 17:159-189 Wiley, New York. Han, T., Eck van, H.J., De Jeu, M.J., Jacobsen, E. (2002) Mapping of quantitative trait loci involved in ornamental traits in Alstroemeria. HortScience 37(3): 585-592. Harborne, J.B. (1961) The anthocyanins of roses. Occurrence of peonin. Experiential XVII: 72-72.
52
R. Stolker, 2009 ROSE PETAL COLOR DETERMINATION Laboratory of Plant Breeding
Hibrand-Saint Oyant, L., Crespel, L., Rajapakse, S., Zhang, L. & Foucher, F. (2008) Genetic linkage maps of rose constructed with new microsatellite markers and locating QTL controlling flowering traits. Springer-Verlag 2007. Tree Genetics & Genomes 4:11–23. Holton T.A. & Cornish E.C. (1995) Genetics and biochemistry of anthocyanin biosynthesis. Plant Cell 7: 1071–1083. Holton T.A. and Tanaka Y. (1994) Blue roses- a pigment of our imagination? Trends in Biotechnology 12: 40-42. Hong, V. & Wrolstad, R.E. (1990) Use of HPLC Separation/Photodiode Array Detection for Characterization of Anthocyanins. J. Agric. Food Chem. 38(3): 708-715. Hong, V. & Wrolstad, R.E. (1986) Cranberry juice composition. J. Assoc. Off. Anal. Chem. 69(2): 199-207. Houwelingen, van, A., Souer, e., Spelt, K., Kloos, D., Mol, J. & Koes, R. (1998) Analysis of flower pigmentation mutants generated by random transposon mutagenesis in Petunia hybrida. The Plant Journal 13(1): 39–50. Iacobucci, G. A. and Sweeny J. G. (1983). The chemistry of anthocyanins, anthocyanidins and related flavylium salts. Tetrahedron 39(19): 3005-3038. Jia, N., Shu, Q.Y., Wang, L.S., Du, H., Xu, Y.J. & Liu, Z.A. (2008) Analysis of petal anthocyanins to investigate coloration mechanism in herbaceous peony cultivars. Scientia Horticulturae 117(2): 167–173. Johnson, E.T., Ryu, S., Yi, H., Shin, B., Cheong, H. & Choi, G. (2001) Alteration of a single amino acid changes the substrate specificity of dihydroflavonol 4-reductase. The Plant Journal 25(3): 325-333. Koes, R.E., Verweij, W., Quattrocchio, F. (2005) Flavonoids: a colorful model for the regulation and evolution of biochemical pathways. Trends Plant Sci. 10:236–242. Korban, S.S. (2007). Roses. In: Pua E.C. and Davey M.R. (eds) Biotechnology in Agriculture and Forestry. Transgenic Crops VI, vol. 61. Springer, Berlin Heidelberg, pp 227-239. Lammerts, W.E. (1964) Inheritance of The Scarlet-Vermilion Signal Red Colors. American Rose Annual. Lammerts, W.E. (1960) Inheritance of magenta red color in roses. American Rose Annual 119-125. Lammerts, W.E. (1945) The scientific basis of rose breeding. American Rose Annual 71-79. Lee, J., Rennaker, C. & Wrolstad, R.E. (2008) Correlation of two anthocyanin quantification methods: HPLC and spectrophotometric methods. Food Chemistry 110(3): 782-786. Le Nard, M. & Biot, E. (1997) Measurements of colour variation of tulip flowers grown in different conditions. ISHS Acta Horticulturae. 430: 837-842. Longo, L. & Vasapollo, G. (2006) Extraction and identification of anthocyanins from Smilax aspera L. berries. Food Chemistry 94: 226-231. Łuczkiewicz, M. & Cisowski, W. (1995) The RP-HPLC analysis of anthocyanins. Chromatographia 48: 360-364. Marshall, H.H. & Collicutt, L.M. (1983) Breeding for red colors in roses. American Rose Annual 68: 41-44. Marshall, H.H., Campbell, C.G. & Collicutt (1983) Breeding for anthocyanin colors in Rosa. Euphytica 32: 205-216.
53

R. Stolker, 2009 ROSE PETAL COLOR DETERMINATION Laboratory of Plant Breeding
Mikanagi, Y., Saito, N., Yokoi, M. & Tatsuzawa, F. (2000) Anthocyanins in flowers of genus Rosa, sections Cinnamomeae (=Rosa), Chinenses, Gallicanae and some modern garden roses. Biochem. Syst. Ecol. 28: 887–902. Nakatsuka, T., Abe, Y., Kakizaki, Y., Yamamura, S. & Nishihara, M. (2007) Production of red-flowered plants by genetic engineering of multiple flavonoid biosynthetic genes. Plant Cell Rep 26: 1951-1959. Ogata, J., Kanno, Y., Itoh, Y., Tsugawa, H. & Suzuki, M. (2005) Anthocyanin biosynthesis in roses. Nature 435: 757-758. Prodanov, M.P., Domínguez, J.A., Blázquez, I., Salinas, M.R. & Alonso, G.L. (2005) Some aspects of the quantitative/qualitative asessment of commercial anthocyanin-rich extracts. Food Chemistry 90: 585-596. Quattrocchio, F., Baudry, A., Lepiniec, L. & Grotewold, E. (2006) The regulation of flavonoid biosynthesis. In: Grotewold, E., editor. The science of flavonoids. New York: Springer. p. 97–122. Rajapakse, S., Byrne, D.H., Zhang, L., Anderson, N., Arumuganathan, K. & Ballard, R.E. (2001) Two genetic linkage maps of tetraploid roses. Theor Appl Genet 103:575–583. Rowley, G.D. (1957) Changing fashions in roses. J.R. Hort. Soc. 82: 484. Schütz, K., Persike, M., Carle, R. & Schieber, A. (2006) Characterization and quantification of anthocyanins in selected artichoke (Cynara scolymus L.) cultivars by HPLC–DAD–ESI–MSn. Anal Bioanal Chem 384: 1511–1517. Shupert, D.A. (2005) Inheritance of flower, stem, leaf, and disease traits in three diploid interspecific rose populations. M.S. Thesis. Texas A&M university. College Station. Streisfeld, M.A. & Rausher, M.D. (2008) Altered trans-regulatory control of gene expression in multiple anthocyanin genes contributes to adaptive flower color evolution in Mimulus aurantiacus. Molecular Biology and Evolution 26(2): 433-444. Tanaka, Y. & Ohmiya, A. (2008) Seeing is believing: engineering anthocyanin and carotenoid biosynthetic pathways. Current Opinion in Biotechnology 19: 190-197. Tanaka Y., Tsuda S. and Kusumi T. (1998) Metabolic Engineering to Modify Flower Color, Plant Cell Physiol. 39(11): 1119-1126. Tanaka, Y., Fukui, Y., Fukuchi-Mizutani, M., Holton, T.A., Higgins, E., & Kusumi, T. (1995) Molecular Cloning and Characterization of Rosa hybrida Dihydroflavonol 4-reductase Gene. Plant and Cell Physiology 36(6): 1023-1031. Tsuda, S., Fukui, Y., Nakamura, N., Katsumoto, Y., Yonekura-Sakakibara, K., Fukuchi-Mizutani, M., Ohira, K., Ueyama, Y., Ohkawa, H., Holton, T.A., Kusumi, T. & Tanaka, Y.(2004) Flower color modification of Petunia hybrida commercial varieties by metabolic engineering. Plant Biotechnology 21(5): 377-386. Tucker, A.O., Maciarello, M.J. & Tucker, S.S. (1991). A survey of color charts for biological descriptions. Taxon 40(2): 201-214. Tyrach, A. & Horn, W. (1997) Inheritance of flower colour and flavonoid pigments in Gerbera. Plant Breeding 116: 377-381. Voss, D.H. (1992) Relating colorimeter measurement of plant color to the Royal Horticultural Society Colour Chart. Hort. Science 27(12): 1256-1260. de Vries, D.P. & Dubois, L.A.M. (1996) Rose breeding: past, present, prospects. Acta. Hort. 424:241-248.
54
R. Stolker, 2009 ROSE PETAL COLOR DETERMINATION Laboratory of Plant Breeding
de Vries, D.P., Garretsen, F., Dubois, L.A.M. & Keulen, van, H.A. (1980) Breeding research on rose pigments. II. Combining ability analyses of variance of four flavonoids in F1 populations. Euphytica 29: 115-120. de Vries, D.P., Keulen, van, H.A. & Bruyn, de, J.W. (1974) Breeding research on rose pigments. I. The occurrence of flavonoids and carotenoids in rose petals. Euphytica 23: 447-457. Wicker, L. & Lee, H.S. (1991) Anthocyanin Pigments in the Skin of Lychee Fruit. Journal of food science 56(2): 466-468. Wrolstad, R.E. (1976). Color and pigment analysis in fruit products. Agricultural Experimental Station Bulletin 624, Oregon State University, Corvalis, OR, USA. Yokoi, M. (1974) Colour and pigment distribution in ornamental plants. V. Anthocyanin distribution in rose cultivars. Tech. Bull. Fac. Hort. Chiba Univ. 22: 13-24. Yokoi, M. & Saito, N. (1973) Light absorption pattern of intact Rosa flowers in relation to the flower colour. Phytochemistry 12: 1783-1786. Yokoi, M., Saito, N., Kawabata, Y. & Suzuki, S. (1979) Relation of quantitative flower colour measurement to the flower colour in rose cultivars. Tech. Bull. Fac. Hort. Chiba Univ. 26: 1–8. Yokoya, K., Roberts, A.V., Mottley, J., Lewis, R. & Brandham, P.E. (2000) Nuclear DNA Amounts in Roses. Ann Bot 85: 557-561. Zhang, L.H., Byrne, D.H., Ballard, R.E. and Rajapakse, S. (2006) Microsatellite marker development in rose and its application in tetraploid mapping. J. Amer. Soc. Hort. Sci. 131(3): 380-387.
55
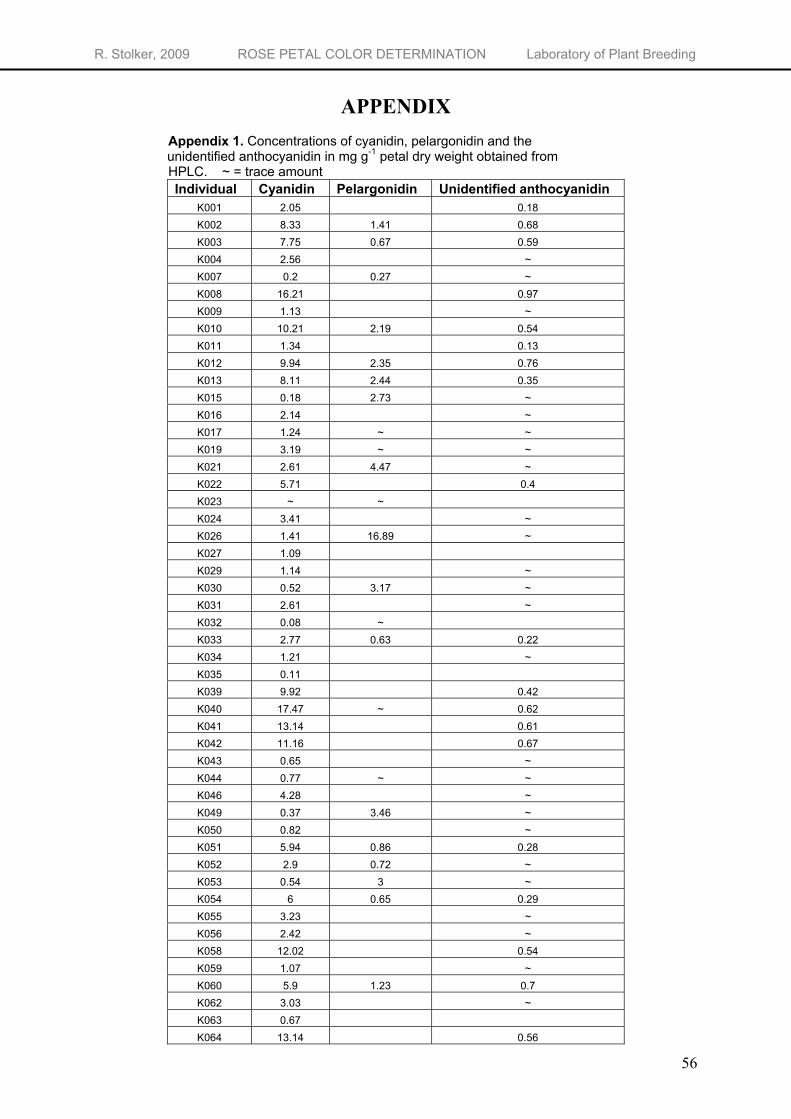
R. Stolker, 2009 ROSE PETAL COLOR DETERMINATION Laboratory of Plant Breeding
APPENDIX Appendix 1. Concentrations of cyanidin, pelargonidin and the unidentified anthocyanidin in mg g-1 petal dry weight obtained from HPLC. ~ = trace amount
Individual Cyanidin Pelargonidin Unidentified anthocyanidin K001 2.05 0.18 K002 8.33 1.41 0.68 K003 7.75 0.67 0.59 K004 2.56 ~ K007 0.2 0.27 ~ K008 16.21 0.97 K009 1.13 ~ K010 10.21 2.19 0.54 K011 1.34 0.13 K012 9.94 2.35 0.76 K013 8.11 2.44 0.35 K015 0.18 2.73 ~ K016 2.14 ~ K017 1.24 ~ ~ K019 3.19 ~ ~ K021 2.61 4.47 ~ K022 5.71 0.4 K023 ~ ~ K024 3.41 ~ K026 1.41 16.89 ~ K027 1.09 K029 1.14 ~ K030 0.52 3.17 ~ K031 2.61 ~ K032 0.08 ~ K033 2.77 0.63 0.22 K034 1.21 ~ K035 0.11 K039 9.92 0.42 K040 17.47 ~ 0.62 K041 13.14 0.61 K042 11.16 0.67 K043 0.65 ~ K044 0.77 ~ ~ K046 4.28 ~ K049 0.37 3.46 ~ K050 0.82 ~ K051 5.94 0.86 0.28 K052 2.9 0.72 ~ K053 0.54 3 ~ K054 6 0.65 0.29 K055 3.23 ~ K056 2.42 ~ K058 12.02 0.54 K059 1.07 ~ K060 5.9 1.23 0.7 K062 3.03 ~ K063 0.67 K064 13.14 0.56
56
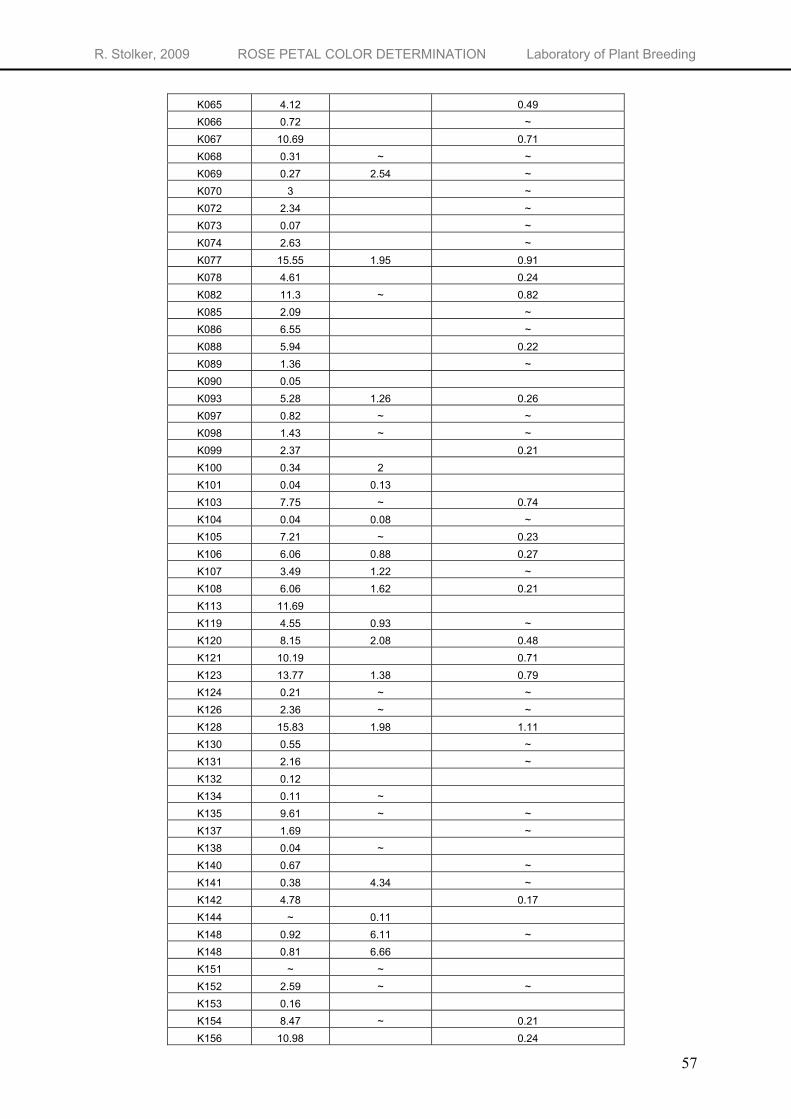
R. Stolker, 2009 ROSE PETAL COLOR DETERMINATION Laboratory of Plant Breeding
K065 4.12 0.49 K066 0.72 ~ K067 10.69 0.71 K068 0.31 ~ ~ K069 0.27 2.54 ~ K070 3 ~ K072 2.34 ~ K073 0.07 ~ K074 2.63 ~ K077 15.55 1.95 0.91 K078 4.61 0.24 K082 11.3 ~ 0.82 K085 2.09 ~ K086 6.55 ~ K088 5.94 0.22 K089 1.36 ~ K090 0.05 K093 5.28 1.26 0.26 K097 0.82 ~ ~ K098 1.43 ~ ~ K099 2.37 0.21 K100 0.34 2 K101 0.04 0.13 K103 7.75 ~ 0.74 K104 0.04 0.08 ~ K105 7.21 ~ 0.23 K106 6.06 0.88 0.27 K107 3.49 1.22 ~ K108 6.06 1.62 0.21 K113 11.69 K119 4.55 0.93 ~ K120 8.15 2.08 0.48 K121 10.19 0.71 K123 13.77 1.38 0.79 K124 0.21 ~ ~ K126 2.36 ~ ~ K128 15.83 1.98 1.11 K130 0.55 ~ K131 2.16 ~ K132 0.12 K134 0.11 ~ K135 9.61 ~ ~ K137 1.69 ~ K138 0.04 ~ K140 0.67 ~ K141 0.38 4.34 ~ K142 4.78 0.17 K144 ~ 0.11 K148 0.92 6.11 ~ K148 0.81 6.66 K151 ~ ~ K152 2.59 ~ ~ K153 0.16 K154 8.47 ~ 0.21 K156 10.98 0.24
57

R. Stolker, 2009 ROSE PETAL COLOR DETERMINATION Laboratory of Plant Breeding
K157 0.07 ~ ~ K159 8.57 ~ 0.5 K160 0.09 0.31 K161 12.93 3.51 0.7 K162 2.08 ~ ~ K163 10.03 2.64 0.28 K165 20 1.16 K166 4.97 ~ 0.43 K167 12.45 0.62 K169 2.31 ~ ~ K171 1.33 ~ K172 0.61 5.76 K174 6.39 3.04 0.62 K175 0.1 0.19 K177 14.68 0.92 0.96 K182 2.47 ~ K184 3.12 ~ K185 5.09 ~ 0.23 K187 4.25 ~ ~ K189 3.77 ~ K190 5.09 ~ 0.2 K192 1.01 4.27 ~ K193 10.16 ~ 0.33 K194 4.96 1.42 ~ K195 4.93 0.35 K198 5.03 0.19 K199 15.87 ~ 0.9 K200 0.59 8.67 K204 5.07 0.32 K206 8.53 ~ 0.21 K207 0.07 ~ K208 0.07 0.17 K210 15.78 0.65 0.82 K211 0.11 0.2 ~ K212 8.62 1.11 0.49 K216 7.29 0.43 K219 1.46 ~ ~ K221 3.26 9.74 ~ K222 11.74 2.49 0.52 K223 9.88 2.16 0.27 K225 0.57 K228 0.05 ~ ~ K229 9.78 ~ ~ K231 4.51 0.22
P540 1 15.91 0.29 P540 2 18.48 1.17 P867 1 ~ 0.4 P867 2 ~ 0.44
58

R. Stolker, 2009 ROSE PETAL COLOR DETERMINATION Laboratory of Plant Breeding
Appendix 2. Nonlinear (exponential) regression of total anthocyanidin concentration versus L* measured on the bottom side of the petal using GenStat 11.0.
Nonlinear regression analysis Response variate: Total anthocyanidin concentration Explanatory: L* measured on the bottom side of the petal Fitted Curve: A + B*(R**X) = -7.21 + 35.27(0.98297x) Constraints: R < 1 Summary of analysis Source d.f. s.s. m.s. v.r. F pr. Regression 2 3023 1511.521 162.78 <.001 Residual 148 1374 9.286 Total 150 4397 29.315
Percentage variance accounted for 68.3 Standard error of observations is estimated to be 3.05. Estimates of parameters Parameter estimate s.e. R 0.98297 0.00494 B 35.27 2.07 A -7.21 3.91
59

R. Stolker, 2009 ROSE PETAL COLOR DETERMINATION Laboratory of Plant Breeding
Appendix 3. Nonlinear (exponential) regression of the λmax absorbance versus %pelargonidin from total anthocyanidin content using GenStat 11.0.
Nonlinear regression analysis Response variate: λmax absorbance Explanatory: % pelargonidin from total anthocyanidin content Fitted Curve: A + B*(R**X) = 528.72 – 3.93(5.29x) Constraints: R < 1 Summary of analysis Source d.f. s.s. m.s. v.r. F pr. Regression 2 1860.87 930.4371 1299.31 <.001 Residual 50 35.81 0.7161 Total 52 1896.68 36.4746
Percentage variance accounted for 98.0 Standard error of observations is estimated to be 0.846. Estimates of parameters Parameter estimate s.e. R 5.29 1.13 B -3.93 1.03 A 528.72 1.22
60
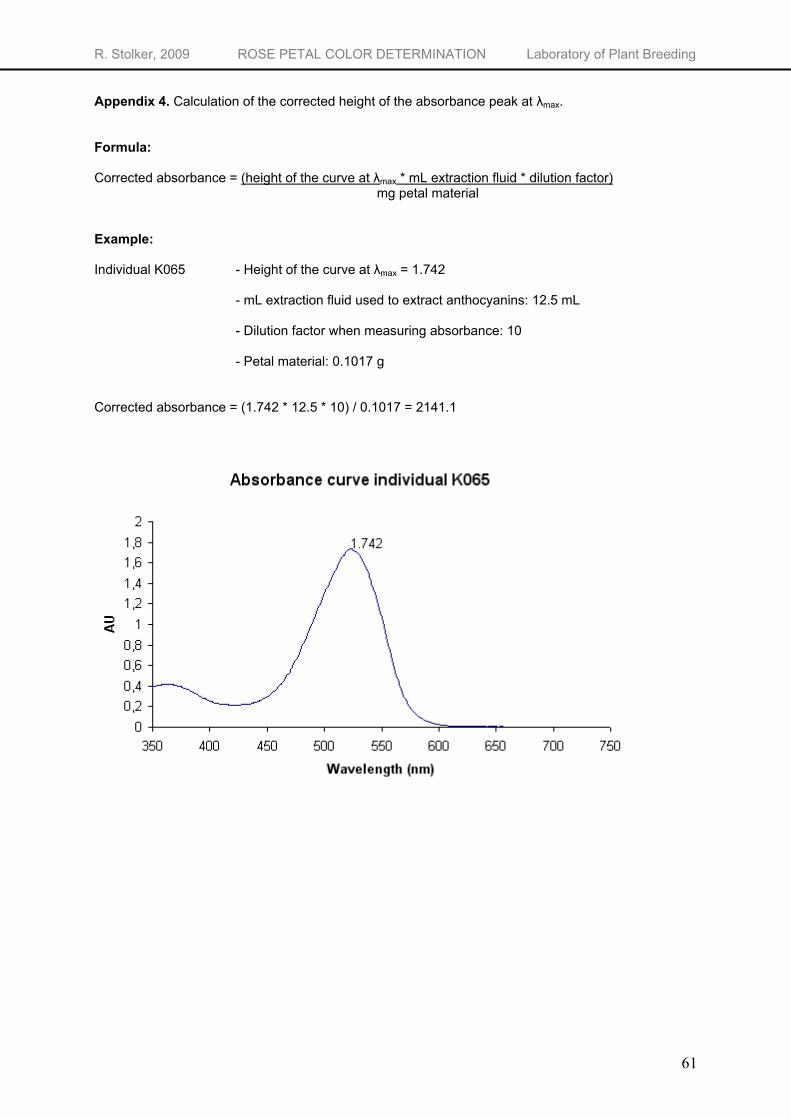
R. Stolker, 2009 ROSE PETAL COLOR DETERMINATION Laboratory of Plant Breeding
Appendix 4. Calculation of the corrected height of the absorbance peak at λmax. Formula: Corrected absorbance = (height of the curve at λmax * mL extraction fluid * dilution factor)
mg petal material Example: Individual K065 - Height of the curve at λmax = 1.742
- mL extraction fluid used to extract anthocyanins: 12.5 mL
- Dilution factor when measuring absorbance: 10
- Petal material: 0.1017 g Corrected absorbance = (1.742 * 12.5 * 10) / 0.1017 = 2141.1
61
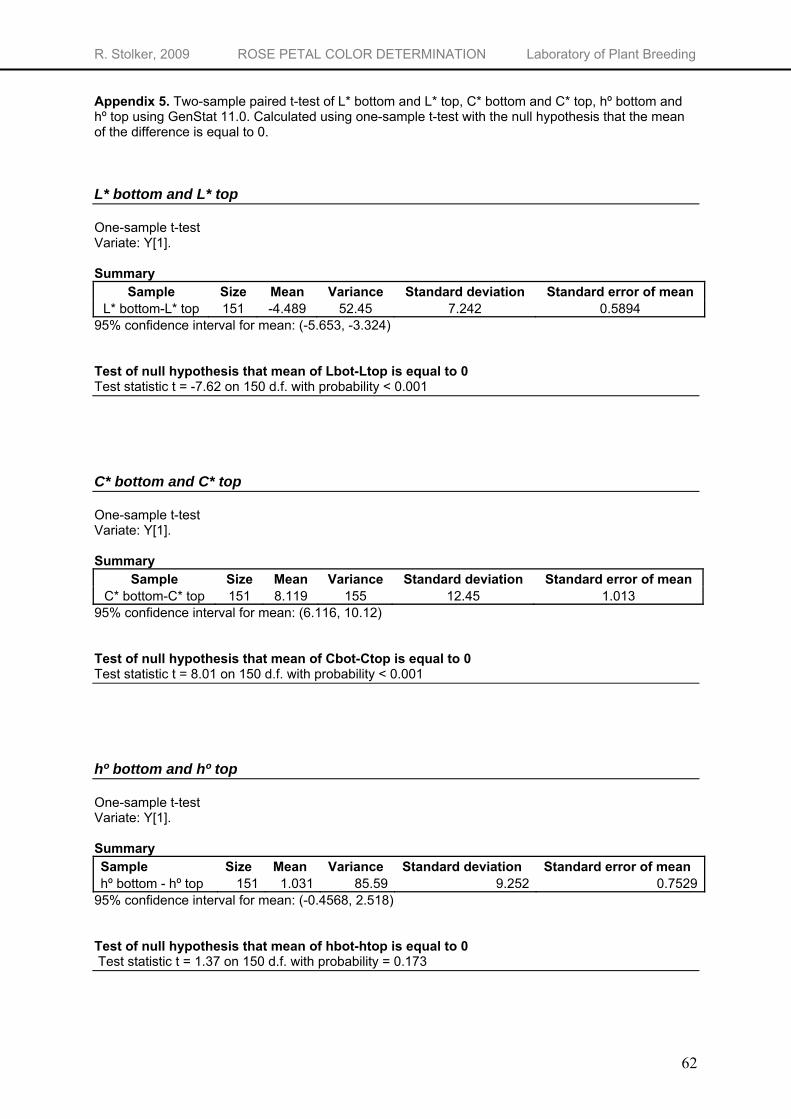
R. Stolker, 2009 ROSE PETAL COLOR DETERMINATION Laboratory of Plant Breeding
Appendix 5. Two-sample paired t-test of L* bottom and L* top, C* bottom and C* top, hº bottom and hº top using GenStat 11.0. Calculated using one-sample t-test with the null hypothesis that the mean of the difference is equal to 0. L* bottom and L* top One-sample t-test Variate: Y[1]. Summary
Sample Size Mean Variance Standard deviation Standard error of mean L* bottom-L* top 151 -4.489 52.45 7.242 0.5894
95% confidence interval for mean: (-5.653, -3.324) Test of null hypothesis that mean of Lbot-Ltop is equal to 0 Test statistic t = -7.62 on 150 d.f. with probability < 0.001 C* bottom and C* top One-sample t-test Variate: Y[1]. Summary
Sample Size Mean Variance Standard deviation Standard error of mean C* bottom-C* top 151 8.119 155 12.45 1.013
95% confidence interval for mean: (6.116, 10.12) Test of null hypothesis that mean of Cbot-Ctop is equal to 0 Test statistic t = 8.01 on 150 d.f. with probability < 0.001 hº bottom and hº top One-sample t-test Variate: Y[1]. Summary Sample Size Mean Variance Standard deviation Standard error of mean hº bottom - hº top 151 1.031 85.59 9.252 0.7529
95% confidence interval for mean: (-0.4568, 2.518) Test of null hypothesis that mean of hbot-htop is equal to 0 Test statistic t = 1.37 on 150 d.f. with probability = 0.173
62
R. Stolker, 2009 ROSE PETAL COLOR DETERMINATION Laboratory of Plant Breeding
63