Role of BK channels in macrophage activation - UCL Discovery
215
1 Role of BK channels in macrophage activation A thesis submitted by Minae Yoshida to University College London for the Degree of Doctor of Philosophy March 2017 Department of Neuroscience, Physiology and Pharmacology University College London, Gower Street, London WC1E 6BT
-
Upload
khangminh22 -
Category
Documents
-
view
0 -
download
0
Transcript of Role of BK channels in macrophage activation - UCL Discovery

1
Role of BK channels in macrophage activation
A thesis submitted by Minae Yoshida to University College London for
the Degree of Doctor of Philosophy
March 2017
Department of Neuroscience, Physiology and Pharmacology
University College London, Gower Street, London WC1E 6BT

2
Declaration
I, Minae Yoshida, confirm that the work presented in this thesis is my own. Where
information has been derived from other sources, I confirm that this has been
indicated in the thesis.

3
Abstract
The cells of the immune system expresses an array of different ion channels, yet
their roles in these cells are not fully understood. The large-conductance voltage
and calcium-activated potassium channel (BK channel) is a potassium ion channel,
which is found in a wide variety of cells and tissues. Their biophysical properties and
expression in excitable cells are extensively studied. However, their role in immune
cells is unclear. In this thesis I have investigated the role of BK channels in
macrophages.
The expression of BK channels in the RAW264.7 mouse macrophages cell line was
characterised by Western blot, immunofluorescence imaging and
electrophysiological recordings. BK channels were predominantly associated with
intracellular compartments in resting macrophages. Activation of RAW264.7 with
ultrapure lipopolysaccharide (LPS) resulted in the upregulation of BK channel
protein on the plasma membrane and the channel activity.
To investigate the function of BK channels in these cells, both genetic and
pharmacological approaches were used. These studies suggested that the role of
the BK channel in macrophages is dependent on the sub-cellular location of the
channel. Importantly this thesis suggests that plasma membrane located BK
channels regulate the release of tumour necrosis factor- (TNF- and interleukin-6
receptor (IL-6R from activated macrophages. IL-6 release was not affected.
These results together suggested that a disintegrin and metalloprotease domain 17
(ADAM17) enzyme is negatively regulated by the plasma membrane BK channel.
This thesis proposes a novel interaction between ion channels and the activity of a
membrane metalloprotease. This project also identified the dynamic movement of
BK channels during activation of macrophages.
ADAM17 regulates the release of a diverse range of proteins including cytokines,
growth factors, receptors and adhesion molecules, which are implicated in many
fields including immunology, tissue regeneration, neurology and tumour growth. It is
anticipated that this finding could stimulate further research.

4
Acknowledgement
Firstly I owe my gratitude to my supervisor, Dr Dean Willis, for his support and
guidance during my PhD study. I am grateful for Professor Alasdair Gibb for his
advice. I would like to thank Dr Steve Marsh for his guidance. I am also indebted to
my colleagues and friends at UCL and in Japan, especially Dr Kheng Peh, Mr Stuart
Martin, Miss Emily Langron, Mrs Setsuko Ichikawa and Mr Jack Barton, whose
friendship and help have been a great encouragement and made my time here most
enjoyable. It is my honour to thank those who have financially supported my study,
Miss Miyuki Miyazaki, my grandmother and parents.
Finally I would like to express my heartfelt thanks to my family, my grandmother,
mother, sister, dog, Luna, and cats, Moo and Lu, for their support and care.
5
Contents
Title 1
Declaration 2
Abstract 3
Acknowledgements 4
Contents 5
List of figures 10
List of tables 13
List of equation 13
List of abbreviations 14
Chapter 1 Introduction ........................................................................................18
1.1 Inflammation .............................................................................................18
1.1.1 General concepts of inflammation .....................................................18
1.1.2 Pattern recognition receptors .............................................................20
1.2 Toll-like receptor pathways .......................................................................21
1.2.1 TLR structure .....................................................................................21
1.2.2 TLR4 .................................................................................................24
1.2.3 NF-B ................................................................................................28
1.3 Cells in innate immune system .................................................................29
1.4 Macrophages ............................................................................................30
1.4.1 Macrophages production of cytokines ................................................32
1.4.2 Control of TNF- mRNA ....................................................................34
1.4.3 Translational control of TNF- ...........................................................36
1.4.4 Regulation of TNF- release and actions ..........................................37
1.5 Ion channels in immune systems ..............................................................39

6
1.5.1 Evolution of ion channels and function in immune cells .....................39
1.5.2 Macrophages and ion channels .........................................................40
1.6 BK channels .............................................................................................42
1.6.1 Physiological roles for BK channels ...................................................42
1.6.2 Channel structure and gating mechanisms of BK channels ...............43
1.6.2.1 Crystal structure and function .....................................................43
1.6.2.2 The gating mechanism of BK channels .......................................44
1.6.3 BK channel auxiliary subunits ............................................................46
1.6.4 BK channel pharmacology .................................................................48
1.6.4.1 BK channel blockers ...................................................................48
1.6.4.2 BK channel openers ...................................................................49
1.6.4.3 BK channel modulation by endogenous signalling molecule .......50
1.6.5 BK channel expression in different cellular locations .........................51
1.7 Aims .........................................................................................................52
Chapter 2 Material and method ..........................................................................55
2.1 Materials ...................................................................................................55
2.1.1 Drugs .................................................................................................55
2.1.2 Chemicals and reagents ....................................................................57
2.1.3 Bioassay kits .....................................................................................57
2.1.4 Buffers and solutions .........................................................................57
2.1.5 Antibodies ..........................................................................................61
2.2 Methods....................................................................................................62
2.2.1 Cell culture ........................................................................................62
2.2.2 Mycoplasma detection .......................................................................62
2.2.3 Nitrite assay .......................................................................................63
2.2.4 MTT assay .........................................................................................66
2.2.5 Bradford assay ..................................................................................66
2.2.6 Whole cell protein preparation for Western blot analysis ....................66
2.2.7 Plasma membrane protein isolation. ..................................................68
2.2.8 Nuclei isolation ..................................................................................68

7
2.2.9 Rat brain homogenise preparation .....................................................69
2.2.10 Western blot analysis.........................................................................70
2.2.10.1 Calibration of the molecular weight .............................................72
2.2.10.2 Densitometry analysis ................................................................74
2.2.11 Electrophysiology ..............................................................................76
2.2.12 Cytokine and cytokine receptor assays ..............................................78
2.2.13 RNA extraction and cDNA synthesis ..................................................80
2.2.14 Real time-quantitative PCR................................................................80
2.2.15 Gene silencing ...................................................................................81
2.2.16 ADAM17 activity assay ......................................................................82
2.2.17 Immune fluorescence imaging ...........................................................84
2.2.18 Statistical analysis .............................................................................85
Chapter 3 How macrophages change TNF-, IL-6 and IL-6R release during
TLR4 activation? .....................................................................................................86
3.1 Introduction ...............................................................................................86
3.2 Results .....................................................................................................86
3.3 Discussion ................................................................................................95
Chapter 4 Do macrophages express BK channels and does TLR4 activation
affect the channel expression? ...............................................................................98
4.1 Introduction ...............................................................................................98
4.2 Results .....................................................................................................98
4.2.1 BK channel expression in resting macrophages ................................98
4.2.2 BK channels in TLR4 activated macrophages ................................. 103
4.2.3 Electrophysiological recording of resting and LPS treated
macrophages ................................................................................................. 106
4.3 Discussion .............................................................................................. 111
Chapter 5 Does the plasma membrane BK channel have a role in TNF-, IL-6 or
IL-6Rrelease from macrophages? ...................................................................... 116
5.1 Introduction ............................................................................................. 116
5.2 Results ................................................................................................... 117

8
5.2.1 Effect of IbTX on TNF-, IL-6 and IL-6R ........................................ 117
5.2.2 Effect of paxilline on TNF- release from early time point of TLR4
activation of macrophages. ............................................................................ 127
5.2.3 LPS conditioning protocol and its effect on TNF-, IL-6 and IL6R
release from macrophages ............................................................................ 130
5.2.4 Effect of IbTX on TNF-, IL-6 and IL-6R release from LPS
conditioned macrophages .............................................................................. 136
5.2.5 Regulation of TNF- by IbTX ........................................................... 139
5.3 Discussion .............................................................................................. 142
Chapter 6 Does ADAM17 have a role in TNF- and/or IL-6R release in
macrophages and does the plasma membrane BK channel regulate ADAM17
activity? 146
6.1 Introduction ............................................................................................. 146
6.2 Results ................................................................................................... 146
6.2.1 ADAM17 expression in TLR4 activated macrophages ..................... 146
6.2.2 ADAM17 activity in TLR4 activated macrophages ........................... 149
6.2.3 Effect of a general inhibitor for membrane metalloproteases, GM6001
and ADAM17 specific inhibitor, TAPI-0, on TNF-and/or IL-6R release from
TLR4 activated macrophages ........................................................................ 152
6.2.4 Effect of GM6001 and TAPI-0 on IL-6 release from TLR4 activated
macrophages ................................................................................................. 157
6.2.5 Effect of IbTX on ADAM17 activity in macrophages ......................... 161
6.2.6 Effect of IbTX on ADAM17 expression ............................................ 164
6.3 Discussion .............................................................................................. 165
Chapter 7 Does BK channel silencing upregulate ADAM17 activity in
macrophages? ...................................................................................................... 170
7.1 Introduction ............................................................................................. 170
7.2 Results ................................................................................................... 170
7.2.1 Optimization of siRNA protocol in macrophages .............................. 170
7.2.1.1 Transfection reagents for the inhibition of BK protein expression
170
9
7.2.2 Effect of BK silencing siRNA on BKexpression on the plasma
membrane isolate .......................................................................................... 173
7.2.3 Effect of BK silencing siRNA on TNF- release and mTNF-
expression during TLR4 activation. ................................................................ 174
7.2.4 Effect of BK silencing siRNA on and ADAM17 activity ................... 178
7.3 Discussion .............................................................................................. 180
Chapter 8 General discussion .......................................................................... 183
Chapter 9 Reference ........................................................................................ 199
Appendix 215

10
List of figures
Figure 1-1 TLR4 signalling pathways ......................................................................27
Figure 1-2 Classical and Trans-signalling of IL-6 ....................................................34
Figure 1-3 TNF- signalling via TNFR1 or TNFR2 ..................................................38
Figure 1-4 BK channel structure and binding sites for endogenous signalling
molecules. .......................................................................................................46
Figure 2-1 Nitrite production from LPS and/or IFNactivated macrophages ...........65
Figure 2-2 Validation of the plasma membrane isolation .........................................68
Figure 2-3 BK expression in rat brain lysate .........................................................70
Figure 2-4 Calibration method for molecular weight in Western blot analysis ..........73
Figure 2-5 Blots stained with secondary antibodies without primary antibodies ......76
Figure 2-6 Voltage ramp protocol for whole cell recordings .....................................77
Figure 2-7 ELISA standard plots for TNF-, IL-6 and IL-6R ..................................79
Figure 2-8 ADAM17 activity in macrophages and the effect of GM6001 and TAPI-0
........................................................................................................................83
Figure 2-9 Immunofluorescence imaging of macrophages ......................................85
Figure 3-1 TNF- release from LPS activated macrophages ..................................88
Figure 3-2 IL-6 release from LPS activated macrophages ......................................90
Figure 3-3 IL-6R release from LPS activated macrophages ..................................92
Figure 3-4 Effect of LPS treatment on macrophage cell viability ............................94
Figure 4-1 BK expression in resting macrophages using a rabbit polyclonal anti-
mouse BK antibody, APC-107 .......................................................................99
Figure 4-2 BK expression in resting macrophages using a mouse monoclonal anti-
mouse BKantibody, L6/60 ........................................................................... 100
Figure 4-3 Localisation of BK in resting macrophages ........................................ 101
Figure 4-4 BK expression in nuclei isolate of resting macrophages .................... 102
Figure 4-5 Localisation of BK in LPS activated macrophages ............................. 104
Figure 4-6 Localisation of BK in LPS activated macrophages at population level105
Figure 4-7 BK expression in the plasma membrane isolate and whole cell lysate
from RAW264.7 macrophages during LPS treatment .................................... 106
Figure 4-8 I-V plot of whole cell TEA-sensitive current in macrophages ................ 108
Figure 4-9 I-V plot for whole cell IbTX sensitive current in macrophages. ............. 109

11
Figure 5-1 Effect of IbTX on TNF-IL-6 and IL-6R release from resting
macrophages ................................................................................................. 120
Figure 5-2 Effect of IbTX on TNF-IL-6 and IL-6R release from macrophages
activated with a submaximal dose of LPS ...................................................... 122
Figure 5-3 Effect of IbTX on TNF-IL-6 and IL-6R release from macrophages
activated with a maximal dose of LPS............................................................ 124
Figure 5-4 Cell viability of macrophages treated with IbTX and LPS ..................... 126
Figure 5-5 Preliminary data. Effect of paxilline on TNF- release and cell viability in
resting macrophages ..................................................................................... 128
Figure 5-6 Preliminary data. Effect of paxilline on TNF-release from LPS activated
macrophages ................................................................................................. 129
Figure 5-7 Protocol for investigating the effect of plasma membrane BK channel
block by macrophages ................................................................................... 130
Figure 5-8 TNF- expression in resting and LPS activated macrophages using a
rabbit monoclonal anti-mouse TNF- antibody, D2D4 ................................... 131
Figure 5-9 Effect of LPS conditioning on TNF- release and mTNF- expression in
macrophages ................................................................................................. 134
Figure 5-10 Effect of LPS conditioning on IL-6 and IL-6R release from
macrophages ................................................................................................. 135
Figure 5-11 Effect of IbTX on the plasma membrane BK channels in TNF-and IL-
6R from LPS activated macrophages. ......................................................... 138
Figure 5-12 Effect of IbTX on TNF- mRNA and mTNF- expression .................. 140
Figure 5-13 Preliminary data. Effect of NS11021 on TNF- release from LPS
conditioned macrophages. ............................................................................. 141
Figure 6-1 ADAM17 expression in whole cell lysate from LPS activated
macrophages ................................................................................................. 147
Figure 6-2 ADAM17 expression in plasma membrane isolate from LPS activated
macrophages ................................................................................................. 148
Figure 6-3 ADAM17 activity in LPS activated macrophages and the effect of LPS
conditioning, GM6001 and TAPI-0 ................................................................. 151
Figure 6-4 Effect of GM6001 on TNF-and IL-6R release from LPS activated
macrophages ................................................................................................. 154
Figure 6-5 Effect of an ADAM17 inhibitor, TAPI-0, on TNF-and IL-6R release
from LPS activated macrophages .................................................................. 156

12
Figure 6-6 Effect of GM6001 and TAPI-0 on IL-6 release from LPS activated
macrophages ................................................................................................. 158
Figure 6-7 Effect of LPS, GM6001 or TAPI-0 treatments on cell viability .............. 160
Figure 6-8 Effect of IbTX on ADAM17 activity of LPS activated of macrophages .. 162
Figure 6-9 Effect of IbTX on ADAM17 activity in LPS conditioned macrophages .. 163
Figure 6-10 Preliminary data. Effect of IbTX on ADAM17 expression ................... 164
Figure 7-1 Effect of BK silencing siRNA treatment on BK expression using
GeneMute™, Viromer ® Blue or lipofectamine® RNAiMAX reagents ............ 171
Figure 7-2 Effect of silencing siRNA on BKexpression at the whole cell in
macrophages ................................................................................................. 172
Figure 7-3 Effect of BK silencing siRNA on BK expression at the plasma
membrane in macrophages ........................................................................... 173
Figure 7-4 TNF- release and cell viability in macrophages after treatment with BK
silencing siRNA ............................................................................................. 175
Figure 7-5 Effect of BK silencing siRNA on mTNF- expression in macrophages
...................................................................................................................... 176
Figure 7-6 Effect of BK silencing siRNA on IL-6Rrelease from macrophages 177
Figure 7-7 Effect of BK silencing siRNA on ADAM17 activity in macrophages .... 178
Figure 7-8 Preliminary data. Effect of BK silencing on ADAM17 expression ....... 179
Figure 8-1 BK channels opening down regulate ADAM17 activity ......................... 198
13
List of tables
Table 1-1 TLR superfamily ......................................................................................23
Table 1-2 Ion channel expression in monocytes and macrophages ........................41
Table 2-1 Drugs ......................................................................................................56
Table 2-2 Buffers ....................................................................................................60
Table 2-3 Typical results from mycoplasma test on RAW264.7 cells. .....................63
Table 2-4 Formulations for SDS-PAGE gel. ............................................................72
Table 2-5 Sources and experimental conditions for antibodies in Western blot .......75
Table 4-1 Summery of whole cell recordings in resting and LPS treated RAW264.7
macrophages ................................................................................................. 110
Table 8-1 ADAM17 substrates .............................................................................. 190
List of equation
Equation 2-1 Calculation of Western blot sample volume .......................................67
14
List of abbreviations
A disintegrin and metalloprotease (ADAM)
A disintegrin and metalloprotease domain 17 (ADAM17)
Activated protein-1 (AP-1)
Ammonium persulfate (APS)
AU rich element (ARE)
AU-rich element RNA-binding protein (AUF1)
Bovine serum albumin (BSA)
Calcium release activated calcium (CRAC)
Calcium release activated channel (CRAC)
Carbon monoxide (CO)
Colony stimulated factor-1 receptor (CSF-1R)
Colony stimulating factor (CSF)
Cyclooxygenase-2 (COX-2)
Damage associated molecular patterns (DAMPs)
Death domain (DD)
Dimethyl sulfoxide (DMSO)
Distilled water (diH2O)
Dithiothreitol (DTT)
Dulbecco's modified eagle medium (DMEM)
ELAV-like protein 4 (HUD)
Enzyme-linked immunosorbent assay (ELISA)
Epidermal growth factor receptor (EGFR)
Eukaryotic translation initiation factor 2 (eIF2)
Eukaryotic translation initiation factor 2B (elF2B)
Fetal bovine serum (FBS)
15
Final protein concentration (FPC)
Granulocyte-macrophage colony stimulating factor (GM-CSF)
Heparin-binding epidermal growth factor -like growth factor (HB-EGF)
Horse radish peroxidase (HRP)
Hosphate buffered saline with tween-20 (PBS-T)
Hu-antigen receptor (HUR)
Ibriotoxin (IbTX)
Interleukin (IL)
Interleukin-1 receptor associated kinase-1 (IRAK-1)
Interleukin-1 receptor associated kinase-4 (IRAK-4)
Interleukin-6 receptor (IL-6R)
I kappa B kinase (IKK)
Interferon (IFN)
Interleukin regulatory factor (IRF)
Intracellular adhesion molecule-1 (ICAM-1)
Large conductance voltage- and calcium-activated potassium channel (BK channel)
Leucine-rich repeat (LRR)
Lipopolysaccharide (LPS)
LPS binding protein (LBP)
Methyl-thiazolyl-tetrazolium (MTT)
MicroRNA (miRNA)
Mitogen-activated protein kinase (MAPK)
Mononuclear cells (MNs)
MyD88 adaptor like protein (Mal)
Myloid differentiation factor 2 (MD2)
Myloid differentiation factor 88 (MyD88)
16
Nitric oxide (NO)
Nonsense mediated decay (NMD)
Nuclear factor-kappa B (NF-B)
Nuclear factor-kappa B essential modifier (NEMO)
Nuclear localisation signals (NLS)
Open probability (Po)
Pathogen associated molecular patterns (PAMPs)
Pattern recognition receptors (PRRs)
Phorbol 12-myristate 13-acetate (PMA)
Phosphate buffered saline (PBS)
Phosphatidyllinositol-4,5-biphosphate (PtdLns(4,5)P2 )
Polymorphonuclear cells (PMNs)
Polyunsaturated fatty acid (PUFA)
Reactive oxygen species (ROS)
Receptor interacting protein (RIP)
Receptor interacting protein homotypic interaction motif (RHIM)
Regulator of nonsense transcripts (UPF)
Regulator of potassium conductance (RCK)
Rel homology domain (RHD)
Ribosomal RNA (rRNA)
RNA induced silencing complex (RISC)
Sodium dodecyl sulfate (SDS)
Sodium dodecyl sulfate polyacrylamide gel electrophoresis (SDS-PAGE)
Sterile alpha and armadillo-motif containing protein (SRAM)
Synaptotagmin XI (SytXI)
Tetraethylammonium chloride (TEA)

17
Tetramethylethylenediamine (TEMED)
Tissue inhibitor of metalloproteinases-3 (TIMP-3)
Toll-interleukin-1 receptor (TIR)
Toll-interleukin-1 receptor related adaptor molecule (TRAM)
Toll-interleukin-1 receptor-domain containing adaptor inducing interferon- (TRIF)
Toll-interleukin-1 receptor-domain containing adaptor inducing interferon- elated
adaptor molecule (TRAM)
Toll-like receptor (TLR)
Transcription activation domain (TAD)
Transforming growth factor (TGF)
Transforming growth factor- activated kinase 1 binding protein 2 (TAB2)
Transforming growth factor- activated kinase 1 (TAK1)
Transforming growth factor- activated kinase 1 binding kinase 1 (TBK-1)
Transient receptor potential cation (TRPC)
Transient receptor potential melastatin 2 (TRPM2)
Transient receptor potential vaniloid 2 (TRPV2)
Transmembrane form TNF- (mTNF-)
Tris-buffered saline with tween-20 (TBS-T)
Tristetraprolin (TTP)
Tumour necrosis factor receptor (TNFR)
Tumour necrosis factor receptor associated factor (TRAF)
Tumour necrosis factor receptor associated factor 6 regulated I B activator (TRIKA)
Tumour necrosis factor- converting enzyme (TACE)
Tumour necrosis factor- (TNF)
Untranslated terminal region (UTR)
Vascular cell adhesion molecule-1 (VCAM-1)

Chapter 1 Introduction
18
Chapter 1 Introduction
1.1 Inflammation
1.1.1 General concepts of inflammation
Inflammation is a protective process, which is initiated by a disturbance to cellular or
tissue homeostasis. Ultimately the aim of this process is to eliminate the initial or
continuing insult, initiate healing and eventually restore normal tissue homeostasis.
Although inflammation was first recognised by the Egyptians, circa 300 B.C., the
visible changes associated with inflammation were first defined by Celsus
(approximately 30 B.C.- 38 A.D.) and described as cardinal signs of inflammation.
These signs were termed ‘redness’, ‘heat’ and ‘swelling’. To these was added ‘pain’
by Virchow and ‘loss of function’ later by John Hunter (1728-1793 A.D.). Although
exact people responsible for the last two signs is still debated. These ‘cardinal signs’
are caused by the physiological changes in surrounding tissue and the
microcirculation, which result in the exudation of plasma and emigration of
leukocytes from blood vessels to the area of injury.
The beneficial nature of inflammation was first recognised by Galen (approximately
129-216 A.D.) in the 3rd century A.D. Galen interpreted the inflammation associated
with infection has to be beneficial for host wound repair. However the concept that
the inflammation was a cause of the disease dominated over ensuing centuries. It
was John Hunter in 18th century in his thesis on ‘Gun Shot Wounds’ who explicitly
referred to Inflammation as a physiological or ‘salutary’, process. He described
inflammation response as a salutary process to remove insults and to restore the
normal state of the tissue. He expressed his views in following words;
“But if inflammation develops, regardless of the cause, still it is an effort whose
purpose is to restore the parts to their natural functions.”
In the late 19th to early 20th century, the cellular aspects of inflammatory responses
began to be elucidated. Rudolf Virchow (1821-1902 A.D.) began to investigate the
cellular components of inflammation, which was followed by the discovery of
phagocyte by Eile Metchnikoff (1845-1916 A.D.). This described an important role of
phagocytosis in protection against pathogen invasion (Lord Florey, 1970).

Chapter 1 Introduction
19
It is now established that the inflammatory response is essential in host defence,
and an inability to produce a sufficient inflammatory response results in immune
deficiency diseases causing life threating infections. Immunodeficiency can occur in
both the innate and adaptive immune response. Innate immune deficiencies include
chronic granulomatosis diseases, which is caused by genetic defect in the reactive
oxygen species producing enzyme, NADPH oxidase (Roos et al., 1996). In severe
combined immune deficiency, a deficiency of the adaptive immune system, patients
have impairment of T-cell development causes. In both cases patients suffer from
opportunistic, severe infections by bacterial, viral and fungal infections (Aloj et al.,
2012).
However, beside this ‘physiological inflammation’, which is essential for continued
wellbeing, it is also recognised that the inflammation can cause tissue damage and
pathology. Classically, ‘pathological inflammation’ is associated with excessive
and/or an inappropriate inflammatory responses. For example, septic shock and
anaphylaxis are associated with excessive inflammatory reactions, which, in severe
cases, could lead to the multiple organ failure and death (Boghner and Lichtenstein,
1991; Angus and van der Poll, 2013). Moreover, the general concept of what
inflammation is in differing situations is still developing. In past the 15 years, an
intermediate tissue condition between normal and inflamed tissue conditions have
been introduced and termed ‘para-inflammation’. While the exact definition of para-
inflammation is still to be determined, this condition refers to prolonged and low
grade inflammatory reactions which causes gradual tissue damage and alter
responsiveness to endogenous signalling molecules including hormones and
neurotransmitters (Medzhitov, 2008). This may contribute to the development of
many chronic diseases such as diabetes, arthrosclerosis and neurodegenerative
diseases (Nathan, 2002). Inflammation plays an important role in tissue protection
and in homeostasis but alternatively, contributes to disease, it is important to
investigate the mechanisms and mediators which are responsible for controlling and
eliciting this fundamental process.
Central to inflammatory response is the immune system, which has evolved a
diverse range of immune cell populations with specialised functions, molecular

Chapter 1 Introduction
20
signalling pathways and various chemical mediators to bring about the protective
effects of inflammation (Medzhitov, 2008). The immune system can be divided into
two parts, the innate and adaptive systems. The innate responses provide the first
line of defence against many common pathogens. The adaptive immune system
evolved later than innate system and importantly, provides the immune systems with
a memory and greater response against previously encountered pathogens. The
components of innate immune system are important in the initiation of the
inflammatory response and provide a bridge to the adaptive system, for example,
antigen is presented by macrophages to T cells. (Janeway et al., 2001). The central
questions in inflammation research are how do these cells recognise the presence
of noxious inflammatory stimuli? And how do they regulate the appropriate
responses to these stimuli?
1.1.2 Pattern recognition receptors
Inflammation can be induced by a variety of stimuli including, microbial infections,
molecules associated with tissue injury and cell death, tissue neoplasm, and the
conditions associated with abnormal tissue conditions/environment, such as obesity,
hypoxia and neoplasms (Hotamisligil et al., 1993; Jiang et al., 2005; Akira et al.,
2006). The nature of the initial inflammatory insult is important in determining the
property and magnitude of subsequent inflammatory response. An efficient
inflammatory response results in the most appropriate responses to the stimuli.
However, this needs the ability of the immune cells to recognise a broad range of
noxious stimuli quickly and to respond rapidly toward the insult. Therefore the
principles of “broad”, “quick” and “appropriate” are central to inflammation. To
accommodate the first two principles, the innate immune system has evolved a
series of receptors which recognise differing chemical entities, which are not usually
found under normal tissue conditions. These are termed pattern recognition
receptors (PRRs). PRRs express the conserved recognition sites, which bind to
variable chemical epitopes on invading microorganisms termed pathogen
associated molecular patterns (PAMPs), or endogenous chemical moieties
associated with cellular stress, damage associated molecular patterns (DAMPs).
Some members of PPRs are endocytic, soluble proteins- they sense, are activated
and elicit their repose in the extracellular fluid. These endocytic PRRs include
Pentaxin, C-type leucine like receptors and the plasma components of complement
cascade. Alternatively cell associated PRRs are found on/in host cells and activate
the cells inflammatory response. Examples of cell-associated PRRs are toll-like

Chapter 1 Introduction
21
receptors (TLRs), nucleotide-binding oligomerization domain (NOD)-like receptors,
DNA sensors, such as absent in melanoma 2, RNA sensors such as retinoic acid
inducible gene-1 and melanoma differentiation-associated protein-5. These cell-
associated PRRs are expressed at various cellular locations which include
cell/plasma membrane, the cytoplasm and various intracellular compartments.
Recently it has been demonstrated that some cell associated PRRs can be found in
multiple cellular compartments (Akira et al., 2006). This variation in locations
enables the host to respond to different levels of microbial invasions (Takeuchi and
Akira, 2010). For example, lipopolysaccharide (LPS), a component of gram-negative
bacterial cell wall, is detected by TLR2 heterodimers and/or TLR4 homodimers on
the plasma membrane and causes the release of inflammatory cytokines and
phagocytosis. Whereas LPS in the cytosol is associated with higher bacterial load
and causes the activation of caspase-11 and subsequent cell death (Hagar et al.,
2013).
1.2 Toll-like receptor pathways
1.2.1 TLR structure
One of the best characterised families of PRRs is the TLR superfamily. Initially toll
receptors, the homology of the TLRs, were discovered in Drosophila. At present, 10
types of TLRs have been identified in human and 13 in mice, Table 1-1. These
receptors can be expressed on the plasma or intracellular membranes. The differing
subcellular localisation of the receptor is thought to enable effective detection of
extracellular or intracellular pathogen as well as allowing the selective recruitment of
signalling proteins.
All TLRs contain a ligand binding domain and a toll/interleukin-1 receptor (TIR)
homology domain, which are separated by a transmembrane region. The ligand
binding site of TLRs consists of a leucine-rich repeat (LRR) of 20-30 amino acids,
forming a conserved horseshoe-like tertiary protein structure. The LRRs have a
signature consensus sequence motif, L(XX) LXL (XX) NXL (XX) L (XXXXXXX) L
(XXX) with N=asparagine, L=leucine and X=any amino acid (Kang and Lee, 2011).
These LRR conserved sequences compose the hydrophobic core of the receptor,
with variations the X amino acids, influencing its selectivity to particular ligands.
LRRs are generally considered as protein binding domains which facilitate protein-
protein interactions (Kobe and Deisenhofer, 1995). However due to the slight
Chapter 1 Introduction
22
variations in its amino acid sequence in TLRs, LRRs in TLRs bind to a chemically
more diverse set of ligands (Song and Lee, 2012). These ligands include peptides,
lipids and nucleic acids, and possibly oxidised forms of lipoproteins. For example,
the absence of asparagine in TLR1, 2, 4 and 6 leads to the formation of a
hydrophobic pocket in its LRR region allowing the receptors to bind lipid based
ligands. It is therefore not surprising that certain lipids found in bacterial, fungal and
viral pathogens or released during tissue stress can act as ligands for TLRs (Song &
Lee, 2012). Table 1-1 lists TLRs, their ligands and cellular locations. The molecular
mechanisms of ligand binding differ between TLRs, however, they all form dimers
when binding to their ligands. These dimers can be homo- or hetero-dimer in nature
and once formed, the dimers fold their ligand in the regions between the two LRRs.
The dimerization of the receptors is facilitated by the TIR-domains. The TIR-domain
is important in the formation of the dimers and the recruitment of the adaptor
molecules which also contain TIR-domains.
Five TIR-domain containing adaptor proteins have identified in human. These are
myeloid differentiation factor 88 (MyD88), TIR-domain containing adaptor protein
inducing IFN- (TRIF), MyD88 adaptor like protein (Mal), TRIF related adaptor
molecule (TRAM) and sterile alpha and armadillo-motif containing proteins (SRAM).
Each member of TLR dimers recruits a specific combination of these five adaptor
proteins that initiates different but overlapping inflammatory signalling cascades. It
was suggested that this specificity, together with the TLRs ligand selectivity, enables
the activation of most appropriate immune response directed towards the initiation
stimuli (O’Neill and Bowie, 2007). Therefore the combination of receptor locations,
ligand binding specificity and selective adaptor protein recruitment allows a quick
and appropriate response to a broad class of exogenous and endogenous
molecules. It also can be suggested that these combinatory interactions allow a
diverse range of signalling cascades to be established. To date TLR4 mediated
pathway represents the most well characterised signalling pathway among the TLRs
family.

Chapter 1 Introduction
23
Table 1-1 TLR superfamily
Table shows the identified members of TLR superfamily in mouse and human. Each member of receptors is activated by specific set of ligand, which can be
classified as microbial, endogenous or synthetic in nature.

Chapter 1 Introduction
24
1.2.2 TLR4
TLR4 has a hydrophobic ligand binding region and as a result as high affinity for
lipid based ligands. For example, lipid A epitopes found in LPS is considered to be a
most potent activator of this receptor (Raetz and Whitfield, 2002; Kang and Lee,
2011; Song and Lee, 2012). As such LPS are a strong activators of the TLR4 and is
strongly implicated in septic shock (Poltorak et al., 1998). Binding of LPS to TLR4 is
facilitated by extracellular adaptor proteins, LPS binding protein (LBP) and myeloid
differentiation factor 2 (MD2) (Miyake, 2006).LPS binding leads to the formation of
TLR4 homodimers and the recruitment of either activated MyD88 and/or TRIF
adaptor proteins. Depending on the adaptor protein recruited, MyD88 or TRIF,
distinct pathways are activated (Kawai and Akira, 2006).
MyD88 dependent pathway
MyD88 is composed of 296 amino acids with a C-terminus TIR domain and N-
terminus death domain. In addition to TLR4 pathway, the protein is recruited by
TLR2, TLR5, TLR7 and TLR9. The activation of MyD88 dependent pathway is
thought to contribute to strong and rapid inflammatory responses. MyD88 knockout
mice have been shown to be highly susceptible to S. aureus infections indicating the
importance of this pathway in the host’s defence against bacterial infections
(Takeuchi et al., 2000). In comparison, the activation of MyD88 dependent pathway
by LPS injection causes an excessive and destructive inflammation. MyD88
deficiency protects animals from lethal endotoxin shock by decreasing pro-
inflammatory cytokine production, including, TNF- and IL-6 (Kawai et al., 1999).
These studies have demonstrate the importance of MyD88 dependent pathway
mediated inflammation and a role of this pathway in protection against bacterial
infections.
The binding of MyD88 to the activated TLR4 homo-dimer requires another TIR-
containing adaptor Mal. Mal functions as a bridge between the TLR4 dimers and
MyD88 (Fitzgerald et al., 2001; Horng et al., 2002; Yamamoto et al., 2002). Mal is
composed of 235 amino acids with phosphatidyllinositol-4,5-biphosphate
(PtdLns(4,5)P2) binding domains near the N-terminus and a TIR-domain proximal to
the C-terminus. The PtdLns(4,5)P2 binding domain of Mal has been shown to define
Chapter 1 Introduction
25
its expression on the plasma membrane (Jenkins and Mansell, 2010). The plasma
membrane localisation of this adaptor protein serves to set the starting point of
MyD88 dependent signalling to the cell surface and enables the death domain (DD)
of MyD88 to interact with IL-1R associated kinase-4 (IRAK-4). The IRAK-4
subsequently recruits IL-1R associated kinase-1 (IRAK-1), forming the IRAK-1-
IRAK-4 complex. The IRAK-1-IRAK4 complex dissociates from the receptors and
interacts with TNF-receptor associated factor 6 (TRAF6), which exists in cytoplasm
(Kawai and Akira, 2006). TRAF6 is a RING-finger domain containing protein and
functions as an ubiquitin ligase. Together with ubiquitin-conjugating enzyme E2 and
ubiquitin-conjugating enzyme 13, TRAF6 mediates the polyubiquitination of
substrate proteins at Lys-63. The substrates for this Lys-63 polyubiqutination include
the NF-kB essential modifier (NEMO, also IKK, and TRAF6 itself (Walsh et al.,
2015). Polyubiquitination enables NEMO and TRAF6 to associate with
transforming-growth–factor--activated kinase 1 (TAK1) and TAK1-binding protein 2
(TAB2). TAK1 is subsequently polyubiquitinated at Lys-63 and this activates the
kinase function of the TAK1, initiating two distinct signalling pathways (Wang et al.,
2001). In the first pathway, TAK1 phosphorylates IB kinase (IKK) of IKK
complex and increases its enzymatic activity. The IKK then phosphorylates a
natural inhibitor for NF-B, IB. The phosphorylation of IB acts as a signal for its
polyubiqutination and subsequent degradation by the proteasome (Deng et al.,
2000; Chen, 2005). The dissociation of IB from NF-B leads to NF-B’s
translocation to the nucleus and binding to DNA binding sites for NF-B. NF-B
activation results in the increased expression of pro-inflammatory molecules,
including tumour necrosis factor- (TNF- interleukin-6 (IL-6), tumour necrosis
factor receptor 1 (TNFR1) and TNFR 2, and adhesion molecules.
The second pathway is mediated by TAK1. TAK1 phosphorylates mitogen-activated
protein kinases (MAPKs), including JNK and p38. This phosphorylation ultimately
leads to the activation of transcription factor, activated protein-1 (AP-1). This
pathway can contributes to both pre- and post-transcriptional regulation of pro-
inflammatory mediator release (Kawai and Akira, 2006).

Chapter 1 Introduction
26
Finally TRAF6 has also been shown to directly activate interleukin regulatory factor
5 (IRF5) and IRF7 by polyuibiutination. This results in the late phase production of
TNF- and production of interferon- (IFN-respectively (Walsh et al., 2015).
TRIF dependent pathway
The second branch of the TLR4 inflammatory signalling occurs via TRIF. This
pathway is known to facilitate the later phase activation of NF-B and has been
recognised to contribute to the production of type 1 IFNs. Mice deficient in TRIF
have been shown to have a normal early phase activation of NF-B via the MyD88
dependent pathway, whereas they have an impaired activation of IRF3 and IFN
production (Yamamoto et al., 2003a). TRIF is a 712 amino acid protein containing a
TIR domain in the central region and recruits receptor interacting protein (RIP)
homotypic interaction motif (RHIM) in the C-terminus (Jenkins and Mansell, 2010).
TRIF dependent pathways can be initiated from the endosomal membrane and/or
the plasma membrane. The TIR-containing adaptor protein, TIR related adaptor
molecule (TRAM), has an analogous role to Mal in the TRIF dependent pathway
acting as a bridge between TLR4 and TRIF (Yamamoto et al., 2003b). The
chemical modification of TRAM is speculated to be crucial in regulating TRIF
pathway from differing cellular localisations. In contrast to Mal, TRAM does not
contain a PtdLns(4,5)P2 binding domain and therefore does not contribute to its
association with the plasma membrane. Mytristoylation of TRAM does enable the
TRAM to localise to the plasma membrane and interact with the TLR4 homodimer
(Rowe et al., 2006). The second study has also demonstrated that the
phosphorylation of TRAM is required for its adaptor function (McGettrick et al., 2006).
Once recruited, TRAM mediates trafficking of TLR4 into endosome. Once at the
endosomal membrane, TLR4 recruits TRIF (Kagan et al., 2008). Activated TRIF
then interacts with TRAF3 and other adaptor molecules. This molecular association
leads to auto-ubiquitination of TRAF3 and activation of TANK-1 binding kinase 1
(TBK-1). Finally TBK-1, in conjunction with IKK leads to the phosphorylation of
IRF3 to induce the type 1 IFNs (Häcker et al., 2011). However TRIF may also
contributed to the NF-B activation and has also been suggested to directly activate
TRAF6, leading to the ubiquitination of NF-B, IRF5 and IRF7 (Sato et al., 2003).
Furthermore TRIF is also been shown to activate RIP1 via its C-terminus RHIM
domain with the subsequent recruitment of NEMO, resulting in the activation NF-B
(Jenkins and Mansell, 2010).

Chapter 1 Introduction
27
The TLR4 signalling culminates in the activation of at least 5 transcription factors.
These factors upregulate the transcription of genes encoding inflammatory
mediators, receptors and cell adhesion molecules. Among these factors, NF-B is
considered to be the most important in inflammation.
Figure 1-1 TLR4 signalling pathways
LPS binds to TLR4 in conjunction with LPS binding protein (LBP) and myeloid differentiation
factor (MD2) and results in the homodimer formation. Activated TLR4 homodimers recruit
toll/interleuckin-1 receptor homology domain (TIR) containing adaptor proteins resulting in
MyD88 or TRIF dependent signalling pathways. In MyD88 dependent pathway, MyD88 binds
to TLR4 homodimers via Mal. Subsequently MyD88 interacts with IL-R associated kinase-4
(IRAK-4) and IRAK-1 via death domain (DD). IRAK-1 and IRAK-4 complex activates TNF-
receptor associated factor 6 (TRAF6) and TRAF activates transforming growth factor
activated kinase 1 (TAK1) and TAB2 resulting in activation of NF-B dimers, p50 and p60
and/or activation of AP-1 via JNK1/2 and p38 MAP kinases. TRIF dependent pathway: LPS
bound TLR4 homodimers binds to TIR related adaptor molecule (TRAM) and TRAM facilitate
endocytosis of TLR4 complex where the receptor complex activate TRIF. TRIF causes to the
activation of TRAF3 and TRAF6 and subsequently TAK-1 binding kinase 1 (TBK-1), which
activates IKK leading to activation of IRF3. TRIF also activate AP-1 and NF-B via RIP1,
which activates TRAK-TAK1 complex. Adapted from O’Neil, L. and Browie, A. (2007) Nature
Reviews Immunology, 7 (5) 353-364.

Chapter 1 Introduction
28
1.2.3 NF-B
The NF-B family of transcription factors consist of five members, p65 also called
RelA, c-Rel, RelB, p50 (p100 full length precursor) and p52 (p105 full length
precursor). These members can form hetero- and homo-dimers resulting in at least
12 different combinations of transcription factors. All five members of NF-B
possess a rel homology domain (RHD) at their N-terminus which facilitates protein
dimerization and sequence specific DNA binding (Vallabhapurapu and Karin, 2009).
The structure of the RHD has been revealed by X-ray crystallization studies and is
composed of two immunoglobulin-like folds, one which facilitates dimerization and
the other which mediates DNA recognition. p65, c-Rel and RelB have a transcription
activation domain (TAD), which is essential in initiating NF-B target gene
expression, while p50 and p52 lack the TAD domain and require dimerization with
other members of the family to initiate protein transcriptions. Alternatively the
dimerization of these members can results in blocking of NF-B transcription sites
(Napetschnig and Wu, 2013). The combinations of transcriptionally active NF-B
dimers are suggested to be specific to tissue types and lead to differing upstream
signalling pathway and cellular responses. In general, the NF-B heterodimer
composed of p65/p50 is most frequently activated via TLR4 signalling. This p65/p50
dimer is often referred as ‘classical NF-B’ and results in the production of pro-
inflammatory cytokines.
Under normal conditions, NF-B dimers are sequestered in the cytoplasm by a
family of IB proteins containing multiple ankyrin repeats which bind to partially
mask the nuclear localisation signals (NLS) present in NF-B dimers. The classical
examples are IB, IB, and IB. Recently it has been shown that some NF-B
proteins, p100 and p105 have ankyrin repeats in C-terminal, which also have IB
like activity. Each IB member selectively binds to particular sets of NF-B dimers
which have different kinetics for the activation of NF-B. As described in 1.2.2, TLR4
signalling causes phosphorylation and ubiquitination on IB resulting in its
proteasomal degradation. IB dissociation from the dimer unmasks the NLS of p65
and causes the nuclear translocation of the NF-B dimer.
Both MyD88 and TRIF dependent pathway activates NF-B, however, it was
suggested that these pathways regulates different temporal phases of NF-B

Chapter 1 Introduction
29
activation (Kawai and Akira, 2006). MyD88 deficient cells have been reported to
have impaired NF-B activation at early time points (2-3 hours) but show a normal
peak of the NF-B transcriptional activation at later time point. However the deletion
of MyD88 and TRIF resulted in the essential loss of NF-B activity. Together these
results suggest that while MyD88 pathway is required for an efficient NF-B
activation, TRIF dependent pathway can contribute to the NF-B when MyD88 is not
activated (Yamamoto et al., 2003a). Finally NF-B leads to the expression of IB
subunit, thus the activation negative regulatory thus establishing a negative
feedback loop.
At the cellular level, the activation of the classical NF-B dimer increases the
transcription of genes encoding numerous pro-inflammatory molecules and results
in strong inflammatory responses. The expression of proteins induced by NF-B
include cytokines TNF-, IL-6, IL-1; growth factors, granulocyte-macrophage
colony stimulating factor (GM-CSF); chemokines, IL-8, RANTES, macrophage
inflammatory protein-1; monocyte chemotactic protein-1; and enzymes inducible
nitric oxide synthase, phospholipase 2 and cyclooxygenase-2 (COX-2) and
adhesion molecules, vascular cell adhesion molecule-1 (VCAM-1), intracellular
adhesion molecule-1 (ICAM-1) and E-selectin (Bonizzi and Karin, 2004).
Taken together, we can see the activation of PPRs leads to robust proinflammatory
responses via NF-B activation. While this response has now been characterised in
many different cell types, the leukocytes represent the cells most identified with
these receptors and pathways in acute inflammation.
1.3 Cells in innate immune system
Leukocytes represent the most important cells in the innate immune system. These
cells can be divided into two types, polymorphonuclear cells (PMNs) or mononuclear
cells (MNs). These cells can be further subdivided and have clear roles in the
development, maintenance and resolution of inflammation. In general, inflammatory
response is initiated by tissue resident macrophages or mast cells. This activation
results in the migration of PMNs into the site of inflammation, usually neutrophils,
followed by the migration of the monocytes/macrophages to the site of inflammation.
Chapter 1 Introduction
30
It is the macrophage (along the dendritic cells) which represents the conduit
between the innate and adaptive immunity, and/or the inflammatory lesion resolution
or progression. Due to this, the macrophage has both a large array of PPRs and the
ability to produce a diverse range of biological mediators, the production of which is
dependent on the extracellular environment the macrophage encounters.
1.4 Macrophages
A wide range of PRRs, including TLR4, and their associated signalling components
are found in macrophages (Mukhopadhyay et al., 2009). They are involved in almost
all steps of acute inflammatory responses and considered as a major component of
innate immune system. In general, macrophages are divided into tissue resident
macrophages and inflammatory/migratory macrophages (although in inflammation,
the majority of macrophages at sites of inflammation are derive from migratory
monocytes). However, macrophages are highly heterogenetic in nature and shows
distinct anatomical and biological features depending on the tissue they are located
in. For instance, alveolar macrophages (lung), Kupffer cells (liver), Langham cells
(skin), peritoneal macrophages (gut) and osteoclast (bones), all have distinct biology
and functions. As well as functional and morphological heterogeneity at the tissue
level, macrophages from the same tissue also show heterogeneity. For instance,
microglia shows diverse morphology depending on the location in the brain and
distinct macrophages populations are found within the spleen (Perdiguero and
Geissmann, 2016).
Attempts have been made to discover the origin of macrophage, and to classify its
diverse populations. The precursor of tissue macrophage populations originates
from bone marrow, postnatal spleen, embryonic yok sac (initial source of microglia
in mice during development) or foetal liver in the embryo (Davies et al., 2013).
During the inflammatory response, bone-marrow derived monocytes in the
circulation migrate into the site of inflammation and differentiate into the
macrophages. Differentiation of monocytes into macrophages provides important
control points of macrophage physiology and differing colony stimulating factors
(CSFs) regulate this process depending on the macrophage population. For
example, the presence of colony stimulated factor-1 (CSF-1), a ligand for colony
stimulated factor-1 receptor (CSF-1R), IL-34, GM-CSF and the expression of CSF-
1R are required for the maintenance of tissue resident macrophage populations

Chapter 1 Introduction
31
(Gordon et al., 2014). CSF-1 is considered to regulate peritoneal macrophages and
Kupffer cells differentiation, IL-34 is thought to be required for microglia and
Langerhans cells differentiation and GM-CSF for alveolar macrophages
differentiation. The differentiation of circulating blood monocytes to macrophages
involves the GM-CSF and CSF-1 (Mosser and Edwards, 2008). The identification of
the origin of macrophages may provide a clue to inhibit the pathogenic functions of
macrophages and CSFs currently represent important targets for controlling
macrophage actions in diseases (Lenzo et al., 2012).
During acute inflammatory responses tissue resident macrophages along with mast
cells are thought to be the first cells to recognise the inflammatory stimuli via PRRs
and as a result the activated macrophages secret a wide range of inflammatory
mediators, such as cytokines, chemokines, amines, fatty acid metabolites and
complement components. These molecules act on the vascular endothelial cells and
increasing its permeability and thus leading to formation of inflammatory oedema.
Neutrophils are usually the first cell to migrate to the site of inflammation and there
they secret toxic granules containing proteases and release reactive oxygen species
(ROS), which attempt to destroy the invading pathogens. Subsequently
macrophages are recruited which can phagocytose pathogens, dead cells and/or
tissue debris. Due to the different mechanisms of macrophage activation,
researchers have attempted to classify macrophages by their activation states. For
example a early simple form of classification considered macrophages to be either
classically activated (M1) and considered to be proinflammatory macrophages, while
alternatively activate macrophages (M2) are associated with the hormonal immunity
and wound healing(Mills et al., 2000; Tzachanis et al., 2002; Gordon and Martinez,
2010). These early classification criteria have been developed over past 15 years.
While this classification may be useful to obtain detailed information on their
response and cell surface molecule expression patterns under extreme conditions in
vitro and in vivo, any group classification criteria may lead to simplistic explanations
for macrophages function in the complex tissue environments encountered in
pathology (Gordon et al., 2014). Indeed, even within macrophage cell lines, a
significant degree of heterogeneity is observed, which is not due to the genetic
instability found in some cell lines (Ravasi et al., 2002). Indeed the contribution of
macrophage heterogeneity to normal physiological and pathological responses is
relatively under-researched area.

Chapter 1 Introduction
32
In addition to macrophage heterogeneity, another hallmark of macrophage biology is
cell plasticity. This is the ability of macrophages to change their array of mediators
released in response to extracellular ques. An example of this is the effect of
phagocytosis on macrophage function. Originally macrophages were distinguished
for their remarkable ability to phagocytose material (Metschnikoff, 1884; Flannagan
et al., 2012). Phagocytosis is important during the pro-inflammatory phase of the
inflammation, as well as during inflammation resolution, however the molecules
release in each of these cases is reported to be pro- or anti-inflammatory in nature
respectively. Phagocytosis of invading pathogen or necrotic materials could lead to
the release of proinflammatory mediators. In contrast, phagocytosis of apoptotic
materials could cause the release of anti-inflammatory materials (Flannagan et al.,
2012). However it is important to note that most of these studies are conducted with
the purified stimuli, and may not represent the complex tissue environment found in
inflammatory lesions. An important question to address is how do macrophages
continually regulate the release inflammatory mediators to finesse the body’s
response to particular noxious stimuli? In macrophages, this exquisite control of
mediator release is mediated by the diversity of the PRR expression and
intracellular mechanism to finely regulate cytokine release from activated
macrophages.
Besides the macrophages role in inflammation the macrophage also play a part in
numerous physiological processes. Research has demonstrated their involvement in
the development, maintenance of tissue homeostasis, tissue repair and metabolism
of nutrients. The role of the macrophage development is seen by the lethal
phenotype observed when macrophages population is inhibited in mice (Wynn et al.,
2013).
1.4.1 Macrophages production of cytokines
Of central importance to the role of macrophages in inflammation is the production
of cytokines. Depending on the definition, to date approximately 130 cytokines have
been descried. These cytokines include ILs, CSFs, IFNs, TNF superfamily,
chemokines, CCL1-28, CXCL1-17 and CX3CL-1 and growth factors. These proteins
are released from macrophages in response to a diverse range of inflammatory
stimuli, which are recognised by various receptors on macrophages, such as PRRs.
Along with IL-1 the most important cytokines described are TNF- and IL-6. These

Chapter 1 Introduction
33
inflammatory mediators play vital roles in control of innate immune responses and
inhibition of these mediators leads to the increased susceptibility to tuberculosis and
opportunistic infections. At the same time, these mediators are found upregulated in
many inflammatory pathologies including arthritis, atherosclerosis, asthma,
neurodegenerative diseases, diabetes, fibrosis and cancer. These mediators
represent important therapeutic targets and the understanding of mechanisms by
which these mediators are released from macrophages is important (Murray and
Wynn, 2011; Arango Duque and Descoteaux, 2014). The classical stimulator for
TNF- and IL-6 production is LPS stimulation via TLR4. As discussed, LPS
signalling result in the activation of NF-B.
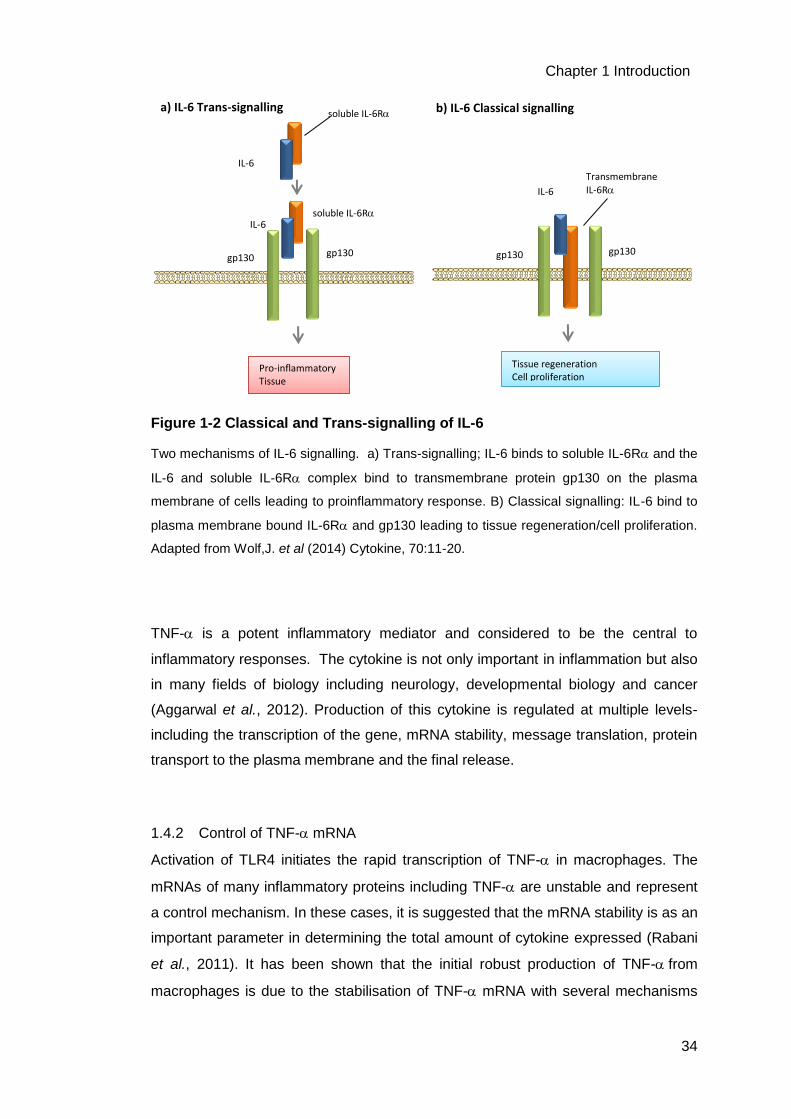
IL-6 is known as a pleiotropic cytokine with proinflammatory, anti-inflammatory and
regenerative actions (Hunter and Jones, 2015). The cytokine induces the acute-
phase inflammatory responses as well as the promotion of T cells subtypes and
differentiation of B-cells (Klimpel, 1980; Yoshizaki et al., 1984; Woloski and Fuller,
1985; Yasukawa et al., 1987; Kopf et al., 1994). IL-6 elicits its biological responses
from the cell mainly via two different signalling pathways. Firstly, signalling through
membrane bound IL-6 receptor (IL-6R) and gp130 which is termed classical
signalling, and signalling through the soluble form of receptor, IL-6R in
combination with membrane bound gp130 is termed trans-signalling, Figure 1-2. IL-
6Ris secreted from leukocytes and the elevated level of IL-6R is associated with
chronic inflammatory conditions (Jones et al., 2001). Secondly, signalling via IL-6R
trans-signalling is known to exert proinflammatory action of IL-6 and associated with
the pathologies of chronic inflammations including colitis, tissue fibrosis,
inflammatory arthritis, allergy, neuroinflammation, cardiovascular diseases and
cancers (Campbell et al., 2014; Tanaka et al., 2014). Trans-signalling has also been
shown to be important in the recruitment and activation of leukocytes, the
development and maintenance of T cell populations and their effector functions
(Rose-John and Heinrich, 1994; Jones et al., 2001). IL-6 signalling via membrane
bound IL-6R is termed classical signalling, which controls an acute inflammatory
reaction, apoptosis of immune cells and haematopoiesis (Kopf et al., 1994; Hunter
and Jones, 2015). Particularly in brain, the classical signalling is thought to mediate
homeostatic processes including energy metabolisms, control of fever, fatigue and
loss of appetite (Schöbitz et al., 1995).
Chapter 1 Introduction
34
Figure 1-2 Classical and Trans-signalling of IL-6
Two mechanisms of IL-6 signalling. a) Trans-signalling; IL-6 binds to soluble IL-6R and the
IL-6 and soluble IL-6R complex bind to transmembrane protein gp130 on the plasma
membrane of cells leading to proinflammatory response. B) Classical signalling: IL-6 bind to
plasma membrane bound IL-6R and gp130 leading to tissue regeneration/cell proliferation.
Adapted from Wolf,J. et al (2014) Cytokine, 70:11-20.
TNF- is a potent inflammatory mediator and considered to be the central to
inflammatory responses. The cytokine is not only important in inflammation but also
in many fields of biology including neurology, developmental biology and cancer
(Aggarwal et al., 2012). Production of this cytokine is regulated at multiple levels-
including the transcription of the gene, mRNA stability, message translation, protein
transport to the plasma membrane and the final release.
1.4.2 Control of TNF- mRNA
Activation of TLR4 initiates the rapid transcription of TNF- in macrophages. The
mRNAs of many inflammatory proteins including TNF- are unstable and represent
a control mechanism. In these cases, it is suggested that the mRNA stability is as an
important parameter in determining the total amount of cytokine expressed (Rabani
et al., 2011). It has been shown that the initial robust production of TNF-from
macrophages is due to the stabilisation of TNF- mRNA with several mechanisms
IL-6
gp130 gp130
a) IL-6 Trans-signalling
IL-6
soluble IL-6R
soluble IL-6R
Pro-inflammatory
Tissue degeneration
IL-6
Transmembrane
IL-6R
gp130 gp130
b) IL-6 Classical signalling
Tissue regeneration
Cell proliferation
Anti-inflammatory response

Chapter 1 Introduction
35
being suggested to stabilize the TNF- mRNA. TNF- mRNA is also the subject of
various post-transcriptional modifications, which include alternative splicing of
mRNA, mRNA polyadenylation, and the regulation of initiation and termination of
protein translation (Carpenter et al., 2014).
The transcription of TNF- mRNA during LPS stimulation is rapid and transient, with
the transcript also being subject of degradation (Clark et al., 2003). The rate of
mRNA decay is very important in determining the extent of translation of TNF-. The
mRNA for TNF-, is known to express conserved AU rich sequences in the 3’
untranslated terminal region (UTR) of the gene and this region is termed AU rich
element (ARE). ARE is found in mRNAs of many inflammatory proteins and has
been demonstrate to have a key role in destabilizing mRNAs (Shaw and Kamen,
1986; Xu et al., 1997). TNF- is known to be highly sensitive to degradation and
contains the shortest version of ARE, with a 34 nucleotide 6 times AUUUA motifs in
the 3’UTRs. However the relation between the length of ARE regions and the
cytokine’s mRNA stability has yet to be fully characterised. Currently there are 20
ARE-binding proteins described and once bound to the AREs, these proteins
stimulate the decay of mRNAs. Among these ARE-binding proteins, tristetraprolin
(TTP) and AU-rich element RNA-binding protein (AUF1) have key roles in facilitating
the degradation of TNF- mRNA. Mice lacking TTP or AUF1 have been shown to
have excessive inflammatory responses. In comparison, other ARE binding proteins
act to stabilise mRNA by competing for binding regions with the “destablizing” ARE
binding proteins without destabilizing effect. This in turn limits the effect of these
destabilizing ARE-binding proteins. Examples of these “inhibitory” ARE binding
proteins include, Y-box binding protein 1, embryonic lethal, abnormal vision (ELAV),
Hu-antigen R (HUR) and ELAV-like protein 4 (HUD). The overall relationship
between different ARE binding proteins regulates TNF- mRNA stability. The
activation of p38 MAPK downstream of TLR4 activation has been shown to stabilise
the ARE containing mRNAs by altering the affinity of ARE binding proteins for the
mRNA. For example the phosphorylation of TTP by p38 decreases its affinity to
ARE and sequesters the TTP for the degradation (Stoecklin et al., 2004). This
favours the binding of HUR to ARE thus stabilising TNF- mRNA and in turn
upregulate its translation (Tiedje et al., 2012). Proteins whose mRNAs are stabilised
by p38 include TNF-, IL-8, IL-1, COX-2 and GM-CSF (Clark et al., 2003).
However it must be noted that HURs are also involved in stabilization of mRNAs of
Chapter 1 Introduction
36
anti-inflammatory proteins. Therefore the role for HUR in inflammatory conditions is
yet to be fully elucidated.
Another element, constitutive decay element, expressed in TNF- 3’UTR causes the
decay of TNF- mRNA independently of AREs (Stoecklin et al., 2003). Additionally it
has emerged that microRNAs (miRNAs) modulate mRNA decay in macrophages.
miRNAs are non-coding RNAs which pair to complementary 3’UTR sequences of
target mRNAs. This essentially forms a miRNA and mRNA complex causing the
inhibition of the target mRNA via RNA induced silencing complex (RISC). The RISC
inhibits mRNA translation and/or initiates the decay of target transcript. It has
become evident that the miRNAs are important in the control of inflammatory
responses in macrophages.
mRNAs which have an extended 3’UTR downstream of a stop codon are down-
regulated by the regulator of nonsense transcripts (UPF) proteins, UPF1-3, in the
process called nonsense mediated decay (NMD). In this process, phosphorylation of
the UPF1 causes the endonucleotic cleavage of the transcript. In macrophages,
inhibition of NMD by the deletion of UPF2 upregulates 186 different gene transcripts,
suggesting a significant contribution of NMD in the control of mRNA stability
(Weischenfeldt et al., 2008).
1.4.3 Translational control of TNF-
The translation initiation of existing mRNAs allows the rapid production of
inflammatory mediators. This is particularly relevant to innate immune responses
which involve fast onset responses. Eukaryotic translation initiation factor 2 (eIF2) is
considered to be an important regulator in innate immunity. Eukaryotic translation
initiation factor 2B (elF2B) works via recycling between a GTP active complex and
GDP in inactive complex of translation complex. Phosphorylation of elF2 is known to
inhibit its recycling and supresses the translation initiation of cellular mRNAs
(Donnelly et al., 2013). In addition, TLR4 or TLR3 activation causes the
dephosphorylation of eIF2B via TRIF activation, resulting in frequent activation and
translation of protein in comparison cell stressors such as ER stress which inhibits
protein translation.

Chapter 1 Introduction
37
Another structural element which regulates translation is poly (A) tail in 3’ end of
mRNA. This provides a binding site for a poly (A) binding protein which interacts
with various translation initiation factors and is required in translation. TNF- mRNA
is constitutively expressed in resting macrophages. However this constitutively
expressed TNF- mRNA lacks poly (A) tail and therefore cannot produce TNF-.
LPS activation causes the appearance of mRNA TNF- with poly (A) tail which
could enhance the production of TNF- (Crawford et al., 1997).
1.4.4 Regulation of TNF- release and actions
Once translated, TNF- protein starts to accumulate in Golgi complex as early as 20
minutes after cell activation (Shurety et al., 2000) and is directed to the plasma
membrane via trans-Golgi network (TGN)-derived vesicle. Once the vesicle is fused
with the plasma membrane, TNF- is expressed as a transmembrane protein trimer
consisting of three 26 kDa (mTNF-) monomers. The final control mechanism for
the cytokine is the release from the plasma membrane via ecoto-domain shedding
by metalloproteinases (Stow et al., 2009). A disintegrin and metalloproteases protein
17 (ADAM17) or Tumour necrosis factor- converting enzyme (TACE) is considered
to be the main sheddase for TNF-(Black et al., 1997; Moss et al., 1997). The
actions of TNF- a due to its binding to its receptors, TNFR1, (CD120a, p55) and
TNFR2 (CD120b, p75), where it initiates a variety of intracellular cell signalling
pathways and leads to the cellular responses (Sedger and McDermott, 2014).
Figure 1-3 summarises these TNF- signalling pathways.
Macrophages are a major source of TNF- along with other cytokines and control
mechanisms for the production and release of these cytokines release are
significant in regulating inflammation. It is therefore not surprising that cell signalling
mechanisms, which lead to this cytokine release, including TLR4 signalling and
secretory pathways are extensively studied in macrophages (Stow et al., 2009;
Rutledge et al., 2012). As discussed above, macrophages have a great capacity to
sense their surrounding environment via PPRs, initiate cell signalling mechanisms
and produce the relevant inflammatory mediators via precise regulation of
transcription and post-transcriptional mechanisms. As both sensing its environment
and regulation of protein release are regulated at the plasma membrane, it is

Chapter 1 Introduction
38
surprising that the class of protein intimately involved in membrane biology, namely
ion channels, has only received limited attention in the study of macrophage biology.
The aim of this thesis is to investigate ion channels in macrophages.
Figure 1-3 TNF- signalling via TNFR1 or TNFR2
a) Soluble TNF- (sTNF) and membrane bound TNF- (mTNF) signal via TNF- receptor 1
(TNFR1), which contains tumour necrosis factor receptor 1 associated death domain
(TRADD) in cytoplasmic region. The ligation of sTNF/mTNF and initiates the activation of
transcription of NF-B, mitogen activated protein kinases (MAPKs), caspase-8 or mixed
lineage kinase like protein (MLKL) leading to inflammation, tissue degeneration, apoptosis
and/or necrosis. b) mTNF binds to TNFR2 with a higher affinity and via TNF-receptor
associated factor 2 (TRAF2), this initiates the activation of MAPKs, NF-B and protein kinase
B (AkT) leading to tissue regeneration, cell survival/proliferation and/or inflammation.
Adapted from Kalliolias,G. and Iashkiv, L., (2016) Nature Reviews Rheumatology, 12:4-62.

Chapter 1 Introduction
39
1.5 Ion channels in immune systems
1.5.1 Evolution of ion channels and function in immune cells
From evolutionary point of view, once the building blocks of life had occurred DNA,
RNA and simple proteins, the next important step for life to occur was to bring these
molecules close and keep them together, i.e. the packaging of the life chemicals.
The answer to this was the evolution of lipid membranes. However the use of
membranes to package the chemicals brought a new problem. This was essentially
osmotic problems. Again the evolutionary answer to this osmotic problem was the
arrival of the channels, which conduct ion species across the membranes. The use
of “ion channels” by ancient cells together with protein pumps also allowed the
generation of ion gradient, which contributed to the evolution of energy producing
pathways such as proton gradient pathways. It is from these beginnings, the ion
channel evolved and now play fundamental role in every cell of the body and
virtually all physiological responses. Indeed, ion channels are still important in
osmotic regulation, for example, the regulation of cell volume as well as in
multicellular processes, such as cell signalling and nerve transmission. The
activation of these ion channels allows passive movement of sets of ion species
across the membranes and this selective movement of ions is essential in regulating
cell volume, setting membrane potentials and facilitating cellular signalling
processes.
In the cells of immune system, ion channels have also been shown to have
important functions. These are not only on general cellular processes, e.g.
regulation of cellular volume, but also on specific immune responses. For instance
transient receptor potential melastin 2 (TRPM2) or transient receptor potential
vaniloid 2 (TRPV2) knock-out mice showed susceptibility to infection with
L.mocytogenes indicating the importance of these channels in anti-microbial
responses. It has also been suggested that there is a link between a mutation in a
gene encoding ORAI1, part of the calcium release activated channel (CRAC) and
immunodeficiency and autoimmunity, therefore indicating the essential role for these
channels in defence mechanisms (Feske, 2009). The role of these ion channels are
also studied at the individual cell population level and with T-lymphocyte populations
probably the most well studied example. A variety of ion channels are found in T-
lymphocytes; CRACs; members of transient receptor potential cation channel
subfamily, TRPM2, TRPM4 and TRPM7; voltage gated calcium channels; non-
selective cation channel; P2PX7; Zinc channels, ZIP3, ZIP6 and ZIP8; potassium

Chapter 1 Introduction
40
channels, KV1.3, KCa3.1, K2P3.1; sodium channels; Chloride channels; GABAA and
cystric fibrosis transmembrane conductance regulator. These channels have been
reported to be involved in cell proliferation, cell survival and chemotaxis (Launay et
al., 2004; Srivastava et al., 2008; Cahalan and Chandy, 2009).
1.5.2 Macrophages and ion channels
Macrophages have been found to express a wide array of ion channels. These
include KV1.3, KV1.5, BK; inward rectifier potassium channels (Kir2.1); CRAC channels;
voltage-gated proton (HV) channels; P2X7; and TRP channels, TRPC1, TRPC3,
TRPC6, TPRM2 and TRPV2 (Gallin, 1984, 1991; Gallin and Sheehy, 1985;
DeCoursey and Cherny, 1996; DeCoursey et al., 1996; Berthier et al., 2004; Liu et
al., 2007; Nagasawa et al., 2007; Yamamoto et al., 2008; Schilling and Eder, 2009;
Finney-Hayward et al., 2010; Gao et al., 2010; Di et al., 2011; Santoni et al., 2013;
Stebbing et al., 2015). The role of these ion channels in macrophages is not
completely understood and in many instances only investigated in resting
macrophages. Several studies have indicated the involvement of proton channels in
the NADPH oxidase activity and TRPV2 channels in the macrophage migration.
However in comparison to that of the T-lymphocytes or to excitable cells, relatively
little research has focused on the role of these ion channels in activated
macrophages, Table 1-2.
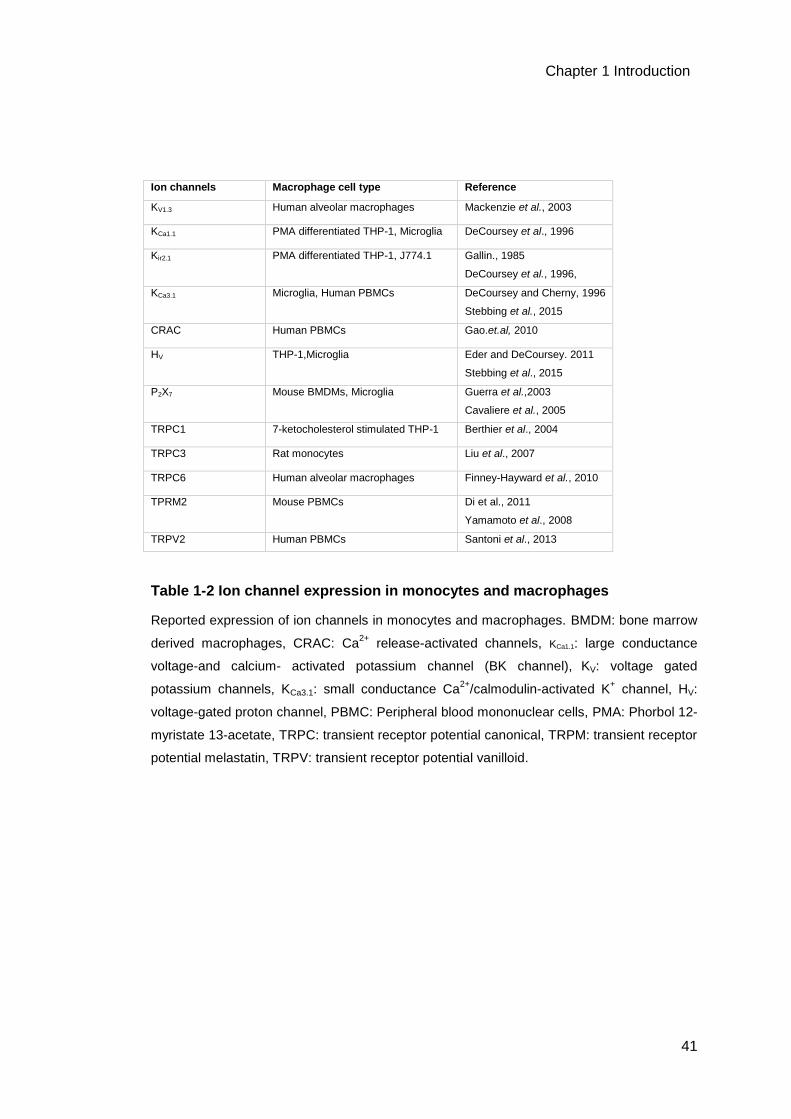
Chapter 1 Introduction
41
Ion channels Macrophage cell type Reference
KV1.3 Human alveolar macrophages Mackenzie et al., 2003
KCa1.1 PMA differentiated THP-1, Microglia DeCoursey et al., 1996
Kir2.1 PMA differentiated THP-1, J774.1 Gallin., 1985
DeCoursey et al., 1996,
KCa3.1 Microglia, Human PBMCs DeCoursey and Cherny, 1996
Stebbing et al., 2015
CRAC Human PBMCs Gao.et.al, 2010
HV THP-1,Microglia Eder and DeCoursey. 2011
Stebbing et al., 2015
P2X7 Mouse BMDMs, Microglia Guerra et al.,2003
Cavaliere et al., 2005
TRPC1 7-ketocholesterol stimulated THP-1 Berthier et al., 2004
TRPC3 Rat monocytes Liu et al., 2007
TRPC6 Human alveolar macrophages Finney-Hayward et al., 2010
TPRM2 Mouse PBMCs Di et al., 2011
Yamamoto et al., 2008
TRPV2 Human PBMCs Santoni et al., 2013
Table 1-2 Ion channel expression in monocytes and macrophages
Reported expression of ion channels in monocytes and macrophages. BMDM: bone marrow
derived macrophages, CRAC: Ca2+
release-activated channels, KCa1.1: large conductance
voltage-and calcium- activated potassium channel (BK channel), KV: voltage gated
potassium channels, KCa3.1: small conductance Ca2+
/calmodulin-activated K+ channel, HV:
voltage-gated proton channel, PBMC: Peripheral blood mononuclear cells, PMA: Phorbol 12-
myristate 13-acetate, TRPC: transient receptor potential canonical, TRPM: transient receptor
potential melastatin, TRPV: transient receptor potential vanilloid.

Chapter 1 Introduction
42
1.6 BK channels
As stated above, macrophages express a diverse array of ion channels. One of
these channels is the BK channel. The BK channel are characterised by its large
conductance and also noted for the diverse range of endogenous modulators which
can regulate its opening. These two characteristics suggest that the channel may be
involved in multiple cellular functions which allow the integration of extracellular
signals into intracellular cell signalling pathways. As macrophages are known to
respond to numerous extracellular stimuli, it was speculated that the BK channel
could be involved in regulating macrophage functions.
1.6.1 Physiological roles for BK channels
The BK channel, also known as large conductance calcium- and voltage-potassium
channel, Maxi-K, Slo-1 or KCa1.1, is highly selective to K+ ions. The channel is
characterised by high K+ selectivity, large conductance (250 pS in symmetrical K+
concentrations) and its allosteric opening mechanisms by a rise in intercellular Ca2+
concentration and membrane depolarization (Cui et al., 2009). The large
conductance for K+ and the unique allosteric opening mechanisms enable BK
channel to integrate changes in Ca2+ with differing membrane potentials (Hoshi et al.,
2013). The opening and closing of the BK channels contribute to fast after-
hyperpolarization, regulation of action potential frequency, neurotransmitter release
in some neurons (Contreras et al., 2013).
BK channels are ubiquitously expressed. In particular, the function of BK channels in
excitable tissues, such as in neurons and smooth muscle cells have been well
characterised. For example, BK channels in smooth muscle cells contribute to
muscle relaxation and are thought to provide protection from vascular hypertension.
It has also been proposed that BK channels have roles in the regulation of circadian
rhythm, inducing ethanol tolerance and the generations of nociception, although
these channel functions may be location dependant (Contreras et al., 2013; Whitt et
al., 2016). In humans, the dysfunction of BK channels is linked to a number of
pathologies including epilepsy, dyskinesia, seizure, incontinence, asthma,
hypertension, alcoholism and cancer. Therefore pharmacological modulation of this
channel is of clinical interest (Ghatta et al., 2006; Bentzen et al., 2014)

Chapter 1 Introduction
43
1.6.2 Channel structure and gating mechanisms of BK channels
1.6.2.1 Crystal structure and function
The structure of BK channels has been determined by studies using x-ray
crystallography (Wu et al., 2010; Yuan et al., 2010). These studies have revealed
the 3D structure of the core part of the human BK channel at a resolution below 10
Å. This core part of the protein contains the gating ring and cytoplasmic Ca2+ binding
sites. The crystallography was made in absence of Ca2+ binding to the channel
protein. Thus it is assumed that the described structure represents the closed
channel (Yuan et al., 2010).
The core forming part of the channel is composed of four identical subunits (BK
Slo-1). The BK subunit contains approximately 1100 amino acids and is encoded
by one gene, KCNMA1 or alternatively named SLO-1. The BK tetramer can form
the functional part of a BK channel but native channels are likely to be associated
with auxiliary and/or subunits. The crystal structure defined on the plasma
membrane each BK is formed by seven, S0-S6, transmembrane helices with the
extracellular N-terminus, intercellular C-terminus domain with the S5-S6 region
forming the selectivity filter of the pore (Wu et al., 2010). Positively charged S2, S3
and S4 together with S1 and S0 serving as the voltage sensor domain. S0 segment
has also been shown to contribute to the stabilization of auxiliary subunits
expressions, 1-4- and 1-4-subunits with the BK protein. The transmembrane
region and N-terminus accounts for one third of the amino acid residues of the BK
protein with the remaining part consisting of the cytoplasmic domains. This relatively
large cytoplasmic domain contains binding regions for Ca2+, Mg2+ and various
endogenous signalling molecules (Cui et al., 2009; Contreras et al., 2013; Hoshi et
al., 2013).
The crystallography studies showed that four BK subunits assemble as a gating
ring of total eight regulator of conductance of potassium 1 (RCK1) and RCK2
domains (Yuan et al., 2010a). The gating ring of the BK channel has been shown to
have a relatively large central hole around 20 Å, which permit ions to move between
pore regions into intracellular parts. These RCK1 and 2 have hydrophobic
interactions involving residues on-helices and this hydrophobic interactions
Chapter 1 Introduction
44
appeared to be conserved among RCK domains. Near to the end of RCK2 domain,
there is a high affinity Ca2+ binding site. This structure is known as Ca2+ bowl,
connected by short helix. The study also showed that the gating ring of the
channel is linked to the S5-S6 linker pore-forming region by a strand-like structure
which appeared to be free from any non-covalent interaction from other protein
residues. This may allow the effective coupling of pore region to gating ring (Yuan et
al., 2010).
1.6.2.2 The gating mechanism of BK channels
The precise mechanism by which the voltage sensor and the Ca2+ region integrate
to cause the opening of the BK channel is still to be elucidated. However, studies
suggest that membrane depolarization pushes the positively charged S4 segment
toward the extracellular side and this movement rearranges other segments in the
voltage sensor region of BK (S0-S3), which leading to opening of the pore via S6-
regulator of potassium conductance (RCK) linker region. For the Ca2+ mediated
opening, Ca2+ binding to the channel causes the release of free energy. It is
proposed that this energy is transduced into mechanical force and opens the
channel pore. Both the binding of Ca2+ and voltage sensor activation increase the
probability of the channel opening and these two factors can have synergistic
influences on each other’s activity. At molecular level, the activation of the voltage
sensor domain has been shown to increase the affinity of the channel to Ca2+.and
the binding of Ca2+ enhances the voltage sensor activation. Therefore the activation
of both factors is normally required to achieve the maximum probability that the ion
conduction gate is open (Open probability: Po) (Cui et al., 2009). This mechanism is
in contrast to other K+ channels including voltage gated K+ channels and other
calcium-activated K+ channels. In Kv, the activation always causes the opening of
the channel due to 4-8 times bigger electric charge on the voltage sensor region
than that of BK channels which couples the voltage sensing and pore region tightly.
In small and/or intermediate conductance calcium activated K+ channels, the binding
of Ca2+ activates the channels. However under certain conditions, the requirement
for BK channels to open in the presence of high Ca2+ and increased voltage may
become redundant. It has been reported that BK channels can open at high
membrane voltage without a rise in Ca2+. In addition high intracellular Ca2+ has been
shown to open the channels at negative voltage (Hoshi et al., 2013). The BK
tetramer can be co-assembled with various combinations of auxiliary subunits, 1-4

Chapter 1 Introduction
45
and/or 1-4 in a tissue specific manner, and the assembly with these subunits has
an impact on the gating properties of the channel (Kyle and Braun, 2014). The
sensitivity of BK channels to the membrane voltage and Ca2+ is subject to the
expression of these auxiliary subunits. While another divalent ion, Mg2+, is not an
activator of the BK channel but has also been reported to enhance the coupling
strength between the ion conduction gate and voltage sensor domain at mM
concentrations (Cui et al., 2009).
Another mechanism by which BK channel open probability can be changed is via
alternative splicing of the BK gene. As previously stated BK is encoded by one
gene, KCNMA1. In the case of BK it is theoretically possible that the alternative
splicing can give rise to variety of polypeptides and some of these variants have
been reported to show altered Ca2+ sensitivity, channel kinetics, localization and
sensitivity to endogenous molecules. However, only several variants are fully
characterised to date. Finally post-translational modifications, such as
phosphorylation and palmitoylation of BK proteins can also lead to alterations in
BK channel activity and localizations depending on which amino acid residue is
modified (Srivastava et al., 2008, Jeffries et al., 2010).
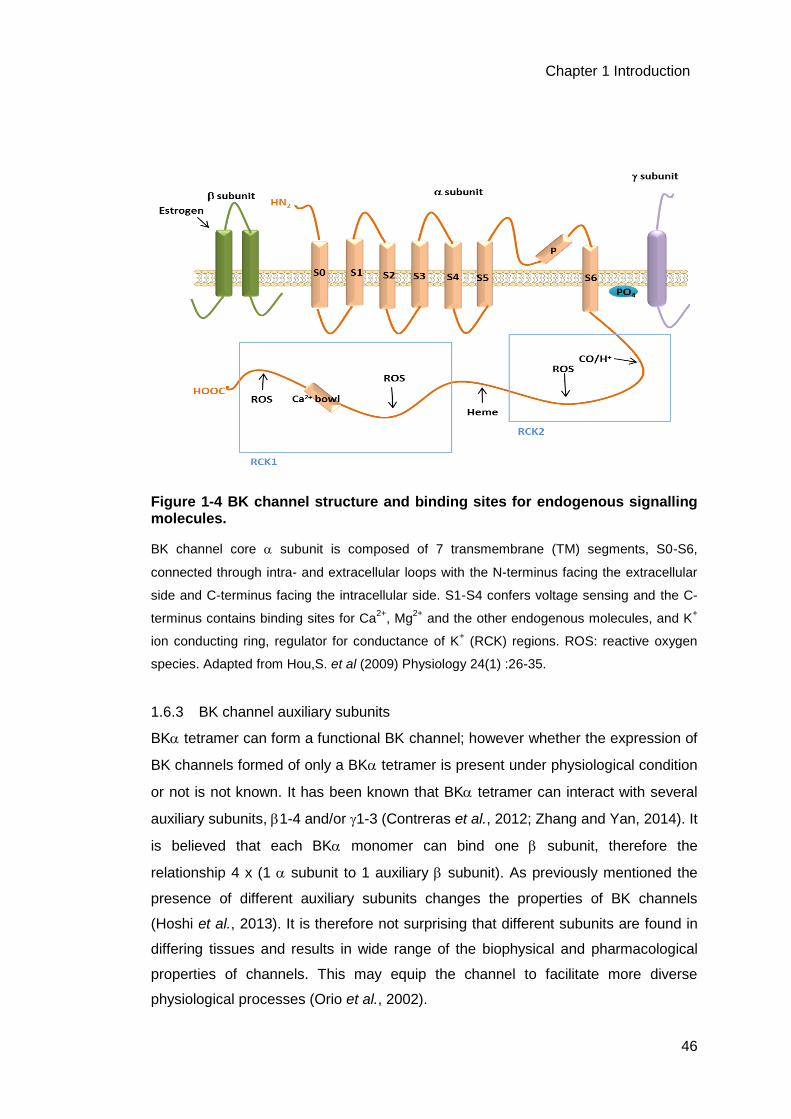
Chapter 1 Introduction
46
Figure 1-4 BK channel structure and binding sites for endogenous signalling molecules.
BK channel core subunit is composed of 7 transmembrane (TM) segments, S0-S6,
connected through intra- and extracellular loops with the N-terminus facing the extracellular
side and C-terminus facing the intracellular side. S1-S4 confers voltage sensing and the C-
terminus contains binding sites for Ca2+
, Mg2+
and the other endogenous molecules, and K+
ion conducting ring, regulator for conductance of K+ (RCK) regions. ROS: reactive oxygen
species. Adapted from Hou,S. et al (2009) Physiology 24(1) :26-35.
1.6.3 BK channel auxiliary subunits
BK tetramer can form a functional BK channel; however whether the expression of
BK channels formed of only a BK tetramer is present under physiological condition
or not is not known. It has been known that BK tetramer can interact with several
auxiliary subunits, 1-4 and/or 1-3 (Contreras et al., 2012; Zhang and Yan, 2014). It
is believed that each BK monomer can bind one subunit, therefore the
relationship 4 x (1 subunit to 1 auxiliary subunit). As previously mentioned the
presence of different auxiliary subunits changes the properties of BK channels
(Hoshi et al., 2013). It is therefore not surprising that different subunits are found in
differing tissues and results in wide range of the biophysical and pharmacological
properties of channels. This may equip the channel to facilitate more diverse
physiological processes (Orio et al., 2002).
Chapter 1 Introduction
47
To date the majority of research has focused on the expression and function of the
subunits. The expression of subunit is known to be tissue specific and was first
observed in bovine tracheal smooth muscles. This was later categorized as the 1
subunit (Knaus et al., 1994a; Orio et al., 2002). To date, four variations of
subunits,1, 2,3 and 4, have been cloned from mammalian tissues (Wallner et
al., 1999; Behrens et al., 2000; Brenner et al., 2000). Each subunit is composed of
2 transmembrane domains, connected by a loop on the extracellular side of the
membrane. The expression of these subunit changes the gating properties of the
channel. 1 and 2 have been shown to increase the sensitivity of the BK channel to
Ca2+ and voltage, and slows the opening and closing kinetics of the channel. 3
subunit is known to speed up the deactivation of the channel. The 4 expression
has only been found in the brain tissue (Orio et al., 2002; Contreras et al., 2012,
2013). The BK channels with 4 subunits has been reported to shows the slower
opening and closing kinetics to a greater degree than 1 and 2 subunits. In
addition the presence of 4 confers the resistance to the channel blocking peptides,
charybdotoxin and iberiotoxin (IbTX) (Meera et al., 2000).
Recently, a second class of BK channels auxiliary subunits have been discovered,
which are designated as subunits. Four subunits have been identified and each
subunit has approximate molecular weight of 35 kDa and are single transmembrane
proteins. Intriguingly the subunits also contain LRRs, which has previously
described as the hallmark of PRRs, at their N-terminus (Yan and Aldrich, 2012). The
first characterised subunit was 1, LRRC26. This subunit was discovered in a
prostate cancer cell line, LNCaP to shift the half maximal activation voltage of BK
channel by approximately -140 mV, allowing channel in absence of intracellular Ca2+
(Yan and Aldrich, 2010). It has been suggested that this change in gating properties
could allow channels to operate in non-excitable tissues. The other three subunits,
2 (LRRC52), 3 (LRRC55) and 4 (LRRC38) respectively, are also known to shift
the channel activation voltage toward negative, although to less extent than the 1
subunit.

Chapter 1 Introduction
48
1.6.4 BK channel pharmacology
A wide range of endogenous, natural or synthetic compounds have been identified
and/or developed to modulate the activity of BK channels. These compounds
interact with BK channels and alter the activation state of the channel in various
ways. The inhibitors for the channel have provided useful tools to investigate the
functional roles, structure and electrophysiological properties of the channel (Yu et
al., 2016). Also much attention has been focused to study the therapeutic potential
of the BK modulators (Bentzen et al., 2014). Importantly the BK channel can be
regulated by a number of endogenous signalling molecules (Hou et al., 2009).
These molecules can be produced by immune cell, which may suggest a link
between the inflammatory response and the BK channels.
1.6.4.1 BK channel blockers
BK channels are highly selective for K+ ions and the application of several cations
have been shown to block K+ conductance by interacting with the conduction gate of
BK channels (Carvacho et al., 2008). These cations are H+, Na+, Cs+ and Ba2+, and
bind to the gates internally or externally with distinct affinity for each site. The
blockade by these cations tends to be affected by membrane voltage, which affects
the movement of K+ ions via the channel. These studies have been used to
investigate the nature of pore region and selectivity filter of the channel. For instance,
Cs+ entres the conduction gate regions to cause blockade of BK channels. This
blockade has been suggested to be relieved by the large influx of K+ ions probably
due to the higher affinity of the K+ ion for Cs+ to the conduction gate (Cecchi et al.,
1987). Ba2+ blocks BK channels from both external and internal sides but exhibits
1000 fold difference in affinity between the two sides (Vergara et al., 1999).
Tetraethylammonium chloride (TEA) is a non-selective potassium channel blockers
but also known to effectively block the BK channel. TEA inhibits BK channels from
both side but shows distant affinity with the dissociation constant 0.2 mM when
applied internally and 30 mM for the external application (Kaczorowski and Garcia,
1999). Including TEA, quaternary ammonium ions have been characterised to block
Kv channels and also shown to block the BK channel with different kinetics. It was
suggested that the results possibly reflected the structural similarlities as well as
differences between these channels (Villarroel et al., 1988). BK channels are also
blocked by Shaker ball peptide, which has been known for its blockade of Shaker K+
channels.

Chapter 1 Introduction
49
In addition to these non-selective BK channel blocking compounds, several scorpion
toxins have been identified to block BK channels and a few of these toxins are
highly selective to BK channels among other ion channels. These peptide toxins
include charibdotoxin, slototoxin, martentoxin and iberiotoxin (IbTX). These
polypeptide toxins inhibit BK channels by covering the pore region composed by the
subunit tetramer. These peptides are identified to have interaction sites with the
subunits and the affinity and effectiveness are shown to be sensitive to the
expression pattern of subunits (Kaczorowski and Garcia, 1999). Most importantly,
IbTX is highly selective to BK channel with the dissociation constant of 1.2 nM and
used as the gold standard to inhibit the BK channel (Candia et al., 1992).
A fungal indole alkaloid, paxilline is another selective BK channel inhibitor and
alongside IbTX, it is widely used to study the property of the channel. The reagent is
a small lipophilic molecule and considered to inhibit the channel at more than one
site with distinct affinities (Knaus et al., 1994b; Li and Cheung, 1999; Zhou and
Lingle, 2014).
1.6.4.2 BK channel openers
BK channels have been reported to open by several unsaturated cis fatty acid
produced in cells. These fatty acids are arachidonic, palmitoleic, eicosapenanoic
and eicosatetraynoic acids (Hercule et al., 2007). Also BK channels have been
reported to increase opening in response to 17-estradiol depending on its
coexpression with 1 subunit (Valverde et al., 1999). An anti-microbial peptide, -
defensin 2, produced by innate immune cells has also been reported to open the BK
channel when the channel is coexpressed with the 1 subunit (Liu et al., 2013). A
protecting effect of vasculature has been reported on the application of these BK
channel activating molecules (Bentzen et al., 2014).
There found several synthetic compounds to open the BK channel. An anti-estrogen
agent, Tamoxifen has been reported to open BK channels which are coexpressed
with the 1 subunit (Coiret et al., 2007). Various BK channel activators have been
developed by drug companies. Benzimidaolone derivatives NS004 and NS1619
have been used to study the physiological functions of BK channels and therapeutic
effect (Olesen et al., 1994). Cym04 is another reported activator of the channel (G et
al., 2012). However it also has been noticed that these drugs exhibit mitochondrial
Chapter 1 Introduction
50
toxicity and low specificity (Bentzen et al., 2014). A newer benximidaxolone
derivative, NS11021, is considered to have improved selectivity and effect on BK
channel opening (Bentzen et al., 2007). Another activator, the GoSlo-SR family of
activators are found to shift the voltage dependence of the BK channels (Roy et al.,
2012).It has been reported that compounds naturally found in plants and fungi
activate BK channels. Examples of these are dihdrosoyasaponin and DHS-I. These
materials have been used in medicines to treat asthma and smooth muscle
disorders (Nardi et al., 2003).
These openers for BK channels have been great interest of drug discovery to treat
hypotension, vascular hyperactivity, erectile dysfunction, bladder instability, and
inflammatory pain, and have studied in clinical trials (Bentzen et al., 2014).
1.6.4.3 BK channel modulation by endogenous signalling molecule
It has become apparent that various endogenous signalling molecules also regulate
the opening of BK channels. Importantly in the context of this research, some of
these molecules are produced by macrophages during the innate immune
responses (Hou et al., 2009). The endogenous molecules which have been
speculated to increase the opening of BK channels include protons, carbon
monoxide (CO), arachidonic acid metabolites, such as hydroxyeicosatetranoic acids,
epoxyeicosatrienoic acids and dihydroxyeicosatrienoic acids; the metabolites of
cytochrome P540, epoxygenases, lipoxygenases; the human--defensin 2; 17--
estradiol and unsaturated free fatty acids such as omega-3 docosahexaenoic acids
(Baron et al., 1997; Bringmann et al., 1998; Hou et al., 2009; Bentzen et al., 2014).
Indeed it has been suggested that the ability of these molecules to modulate BK
channels may underlie their physiological and pathophysiological effects (Hercule et
al., 2007). For instance, omega-3 docosahexaenoic acid has been demonstrated to
lower the blood pressure in wild-type mice, while this was ineffective in BK knock
out mice. 17, 18-epoxyeicosatetraenoic acid has been shown to achieve its
vasodilator effect by acting on BK channels (Hercule et al., 2007). Heme has been
reported to modulate the activity of the channels, however its effect is more complex.
Heme binds to the cytoplasmic region of BK and increases the Po at negative
voltage, however at positive voltages heme decreases Po (Horrigan et al., 2005).
Finally ROS, such as hydrogen peroxide (H2O2), nitric oxide (NO), peroxynitrite
(ONOO-) and super oxide (O2-) have been suggested to inhibit the channel activity
via oxidation of Cys911 in the cytoplasmic region (Tang et al., 2004).

Chapter 1 Introduction
51
Interestingly many of these endogenous BK channel modulators have a role in
inflammatory responses. For instance ROS, BK channel inhibitors, are released
from macrophages during the early phase of inflammation and may contribute to
pro-inflammatory signalling cascades (Tang et al., 2004). In contrast, CO, BK
channel opener, has been shown to have anti-inflammatory effects in inflammation.
In terms of cell signalling, CO is probably a more likely candidate as a modulator of
the channel activity, as CO release is regulated by the enzyme heme oxygenase
and the heme oxygenase 1 and 2 are involved in inflammation (Wallace et al., 2015).
A second class of molecules, which have anti-inflammatory effects and also BK
channel modulatory effects include arachidonic acid metabolites, including
hydroxyeicosatetranoic acids, epoxyeicosatrienoic acid and dihydroxyeicosatrienoic
acids. These molecules are associated with the later phase of inflammatory
response and the resolution of inflammation (Perretti et al., 2015).
1.6.5 BK channel expression in different cellular locations
As stated above the BK channel can be found in many tissues and exist in many
forms. Furthermore the BK channels are expressed in multiple subcellular locations
and appear to have tissue and location specific properties/functions. The cellular
location in which the BK are found include the plasma membrane, mitochondrial
membrane and nuclear envelops (Xu et al., 2002; Douglas et al., 2006; Cui et al.,
2009; Li et al., 2014). However the roles for these intracellular BK channels are not
completely understood. This may be related to the lack of specific reagents which
are required to investigate their activity.
BK channels have many important roles in cell biology, however its function in
inflammation is not fully characterised. Interestingly several mediators of
inflammation modulate the activity of the channels. The aim of this PhD is to
investigate the role of the BK channels in cytokine production during the classical
activation of macrophages via TLR4.

Chapter 1 Introduction
52
1.7 Aims
The overall aim of this thesis is to investigate a role for BK channels in macrophage
activation via TLR4. To date, relatively few studies have been carried out on ion
channels in macrophages. References to suggest properties related to ion
channel ,especially electrophysiology of these cells, are relatively sparse. Therefore
this project was also aimed to structure the framework of ion channel research in
macrophages. This included the development of methods to research ion channels
such as patch clamp technique on macrophages.
A mouse macrophage cell line, RAW264.7, was used throughout the thesis. This is
because the cell line is often used in the studies of TLR4 signalling and cytokine
production (Rutledge et al., 2012). Macrophages are known to be heterogenetic and
plastic in nature. The cell line generally has more stable phenotype and is thought to
be suitable for the method development, which aimed on this thesis.
Previous research in the lab had established a role for heme oxygenases and CO in
the regulator of inflammatory responses. One of proteins, which has been shown to
be regulated by CO are BK channels. In addition, the activation of BK channels is
the subject of many factors and importantly this include endogenous molecules
which are produced during inflammatory responses. Especially the channels are
regulated by CO, whose anti-inflammatory actions have been interest of the
laboratory. It is hypothesised the channel may have involvement in inflammatory
response.
However the role of BK channel in macrophages had been under-researched. This
thesis attempted to establish protocols by which the BK channel expression and
activity could be measured in macrophages and carry out initial investigations into
the role of the BK channel in macrophages. It was hoped that this research would
elucidate the role of BK channel in macrophage activation and possibly indicate a
mechanism by which CO regulates macrophage activation.

Chapter 1 Introduction
53
The release of inflammatory mediators is an important aspect of macrophage
activation and has an impact on forming overall inflammatory responses (Medzhitov,
2008; Stow et al., 2009; Arango Duque and Descoteaux, 2014). Therefore this
project used the release of cytokines and a cytokine receptor as a measure of
macrophage activation.
The research questions to be addressed are following.
1 Establish a model of macrophage activation by TLR4 activation in vitro
To use cytokine release as a measure of inflammatory response, it was necessary
to characterise the pattern of protein release during TLR4 activation in RAW264.7
macrophages. These macrophages were stimulated with TLR4 ligand, LPS, and the
released levels of cytokines were measured using enzyme-linked immunosorbent
assay (ELISA). TNF-, IL-6 and IL-6R are considered to be important in
inflammatory pathology and were analysed in this thesis.
2 Do macrophages express BK channels?
Little data is available on the ion channel expression in RAW264.7 macrophages.
Especially the expression of BK channels in these cells had not been known.
Therefore it was necessary to characterise their expression in RAW264.7
macrophages. The channel expression was studied using 3 different method
analysis, Western blot was carried out to assess the expression of the channel,
immunofluorescence to visualise the channel location and electrophysiological
recordings to determine the activity of the channel. Western blot analysis were
carried out at whole cell level and other cellular fractions. As it has been reported
that the activation of immune cells alter the expression of K+ channels (Feske et al.,
2015), this study was carried out in both resting LPS stimulated macrophages.
3 Are BK channels expressed in macrophages involved in inflammatory response
during TLR4 activation?
To study the involvement of BK channels in macrophage activation, the effect of BK
channel block by IbTX on cytokine and cytokine receptor release was studied. First
whether IbTX has direct effect on cytokine and cytokine receptor release by

Chapter 1 Introduction
54
macrophages was tested to assess the suitability of this drug to use on
macrophages. Once the effect was found, it was aimed to address the mechanism
by which the channel inhibition altered the release of TNF-. This was investigated
by different techniques; TNF- mRNA levels by real time quantitative PCR (RT-
qPCR), cellular retention of TNF- by Western blot.
4 How ADAM17 important in release of cytokine and is BK channel involved in
regulating it activity?
The results led the hypothesis that BK channels regulated the main membrane
sheddase for TNF-, ADAM17 (Rose-John, 2013). To assess the effect of IbTX on
ADAM17 activity, enzyme activity assay was carried out.
5 Does the genetic inhibition of BK channel have the same effect as
pharmacological inhibition?
The results from this pharmacological modulation of channel were further elucidated
by genetic inhibition of BK channels by BK silencing siRNA.It has been reported
that macrophages are difficult to transfect siRNA (Forsbach et al., 2012). Therefore,
the first experiment aimed to establish a protocol for effective BK silencing in
RAW264.7 macrophages using several transfection reagents and siRNA sequences.
The effect was assessed by measuring protein level by Western blot. The effect on
the release of cytokines and a cytokine receptor by genetic inhibition of BK were
analysed by ELISA, Western blot and ADAM17 enzyme activity assay.

Chapter 2 Material and method
55
Chapter 2 Material and method
2.1 Materials
2.1.1 Drugs
Sterile cell culture grade distilled water (diH2O: Thermo Fisher Scientific, U.S.) was
used to reconstitute drugs. Sterile filtered cell culture grade dimethyl sulfoxide
(DMSO: Sigma Aldrich, UK) was used to reconstitute drugs. Ultrapure LPS from
E.coli 0111:B4 strain (Invivogen, U.S.) was reconstituted in diH2O and the stocks
were made at the concentration of 5 mg/ml and aliquots were kept in -70oC freezer
until required. A BK channel inhibitor, IbTX (Alomone Labs, Israel), was
reconstituted in diH2O to the concentration of 10 M and aliquots were stored in -
20oC freezer. Another BK channel inhibitor, Paxilline (R & D Systems, U.S.), was
prepared in DMSO at the concentrations of 100 mM and aliquots were stored in -
20oC freezer. A general inhibitor for membrane metalloproteases, GM6001 (Enzo
Life Sciences, UK) was reconstituted in DMSO at the concentration of 6.75 mM,
immediately diluted to 1 in 10 in diH2O to minimize DMSO concentrations and
aliquots were stored in -20oC freezer. A selective inhibitor for ADAM17, TAPI-0
(Enzo Life Sciences, UK), was prepared in DMSO at the concentration of 6.75 mM
and aliquots were stored in -20oC freezer. NS11021 (Sigma Aldrich, UK) was
dissolved in DMSO at the concentration of 100 mM and aliquots were stored in -
20oC freezer. Protease inhibitor cocktail (Sigma Aldrich, UK) was prepared in diH2O
to 20 times concentrated than working concentrations and aliquots were stored in -
20oC freezer. The components of protease inhibitor cocktail and working
concentrations are as following; 1 mM AEBSF, 0.8 M Aprotinin, 50 M Bestatin, 15
M E-64, 5 mM EDTA, 20 M Leupeptin and 10 M Pepstatin A. TACE substrate II
(fluorogenic) (BML-228; Enzo Life Science, UK) were reconstituted in DMSO at the
concentration of 6.7 mM and was used in ADAM17 activity assay immediately after
reconstitution. When DMSO was used for the reconstitution, the concentration of
DMSO in the culture well never exceeded 0.015% in cytokine assays and 0.1% in
the ADAM17 activity assays. Table 2-1 shows the summery of drug preparation
used in the methods used in the thesis.
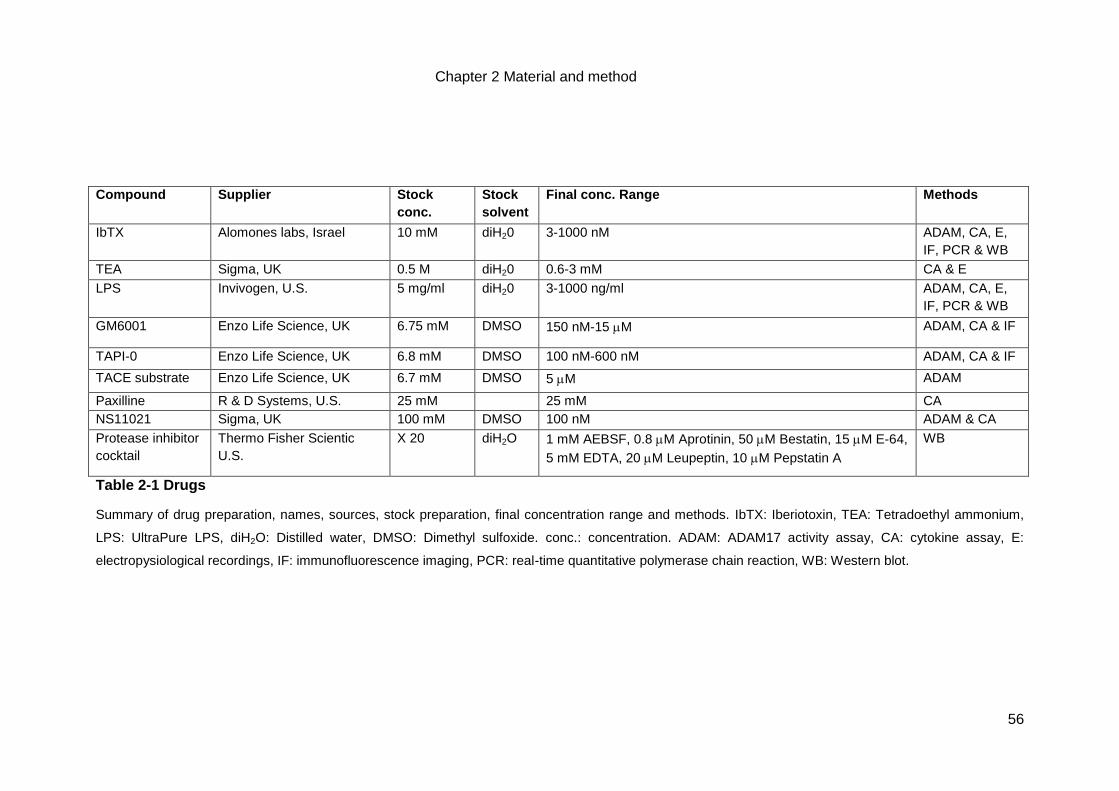
Chapter 2 Material and method
56
Compound Supplier Stock
conc.
Stock
solvent
Final conc. Range Methods
IbTX Alomones labs, Israel 10 mM diH20 3-1000 nM ADAM, CA, E,
IF, PCR & WB
TEA Sigma, UK 0.5 M diH20 0.6-3 mM CA & E
LPS Invivogen, U.S. 5 mg/ml diH20 3-1000 ng/ml ADAM, CA, E,
IF, PCR & WB
GM6001 Enzo Life Science, UK 6.75 mM DMSO 150 nM-15 M ADAM, CA & IF
TAPI-0 Enzo Life Science, UK 6.8 mM DMSO 100 nM-600 nM ADAM, CA & IF
TACE substrate Enzo Life Science, UK 6.7 mM DMSO 5 M ADAM
Paxilline R & D Systems, U.S. 25 mM 25 mM CA
NS11021 Sigma, UK 100 mM DMSO 100 nM ADAM & CA
Protease inhibitor
cocktail
Thermo Fisher Scientic
U.S.
X 20 diH2O 1 mM AEBSF, 0.8 M Aprotinin, 50 M Bestatin, 15 M E-64,
5 mM EDTA, 20 M Leupeptin, 10 M Pepstatin A
WB
Table 2-1 Drugs
Summary of drug preparation, names, sources, stock preparation, final concentration range and methods. IbTX: Iberiotoxin, TEA: Tetradoethyl ammonium,
LPS: UltraPure LPS, diH2O: Distilled water, DMSO: Dimethyl sulfoxide. conc.: concentration. ADAM: ADAM17 activity assay, CA: cytokine assay, E:
electropysiological recordings, IF: immunofluorescence imaging, PCR: real-time quantitative polymerase chain reaction, WB: Western blot.
Chapter 2 Material and method
57
2.1.2 Chemicals and reagents
Dulbecco’s Modified Eagle Medium (DMEM) (Thermo Fisher Scientific, U.S.) and
penicillin/streptomycin concentrate consisted of penicillin 10000 unit/ml and 10
mg/ml streptomycin (Thermo Fisher Scientific, U.S.) were used for cell culture and
DMEM was stored at 4oC and penicillin/streptomycin was at -20oC respectively.
Molecular biology grade, bovine serum albumin (BSA; Sigma UK) was stored at 4oC.
Sterile, cell cluture grade fetal bovine serum (FBS; Thermo Fisher Scientific, U.S.)
and goat serum (Thermo Fisher Scientific, U.S.) was stored in -20oC. 30%
acrylamide/Bis-acrylamide (Sigma, UK), sodium dodecyl sulfate (SDS; Pomega, UK),
tetramethylethylenediamine (TEMED; Thermo Fisher Scientific, U.S.), and
ammonium persulfate (APS; Sigma, UK) were used to make sodium dodecyl sulfate
polyacrylamide gel electrophoresis (SDS-PAGE) gels. Pre-stained protein standards
(New England Biolabs, UK) were used as a protein size indicator in Western blot.
Other chemicals were purchased from Sigma, UK unless otherwise stated.
2.1.3 Bioassay kits
Mycoprobe (R&D Systems, U.S.) was used to monitor mycoplasma contaminations.
Pierce Cell Surface Protein Isolation Kit (Thermo Fisher Scientific, U.S.) was used to
isolate the plasma membrane from cells. Enzyme-linked immunosorbent assay
(ELISA) kits for mouse TNF-, IL-6R and IL-6 (R & D Systems, U.S.) were used to
quantify released cytokines from the cells. RNAsay mini-kit (Qiagen, UK) was used
to isolate mRNA from cells. Superscript III Reverse transcriptase kit (Thermo Fisher
Scientific, U.S.) was used to construct cDNA from mRNA. Taqman custom gene
expression assay kit (Thermo Fisher Scientific, U.S.) for mouse TNF- and -actin
were used for RT-QPCR.
2.1.4 Buffers and solutions
The formulations for the buffers and solutions used in experiments are summarized
in Table 2-2. Chemicals were dissolved in diH2O unless specified. pH of the solution
was normally adjusted with 12 N HCl solution and/or 1-3 N NaOH solution. For
phosphate buffer used in Rat brain preparation, 1N H2PO4 was used to adjust pH in
place of HCl. For electrophysiology solutions free Ca2+ concentration in the pipette

Chapter 2 Material and method
58
solution was estimated from a software, MAXCHELATOR (Stanford University, U.S.)
and the osmolality of buffers was measured using an Osmometer (Loser
Messetechnik, Germany) where required.

Chapter 2 Material and method
59
Name Composition pH application
Electrode buffer 192 mM Glycine, 25 mM Tris-Base, 0.1% (v/v) SDS WB
Phosphate buffered saline
(PBS)
137 mM NaCl, 2.7mM KCl, 10 mM Na2HPO4, 1.8 mM KH2PO4 7.2 ADAM, CA,CI, E,
IF, PCR & WB
Phosphate buffered saline
with Tween (PBS-T)
137 mM NaCl, 2.7 mM KCl, 10 mM Na2HPO4, 1.8 mM KH2PO4,
0.1% (v/v) Tween-20
7.2 CA
SDS-PAGE sample buffer
4 times concentrate
62.5 mM Tris-HCl, 20% (v/v) Glycerol, 2% (w/v) SDS,
5% (v/v) -mercaptoethanol
WB
Tris-buffered saline (TBS) 10 mM Tris (8.4 mM Tris-HCl, 1.6 mM Tris-Base), 100 mM NaCl 7.4 CI &WB
Tris-buffered saline with
Tween (TBS-T)
10 mM Tris, 100 mM NaCl, 0.1% (v/v) Tween-20 7.4 CI &WB
Transfer buffer 190 mM Glycine, 25 mM Tris-Base, 20% (v/v) Methanol WB
Citrate buffer (pH=5.0) 5 mM Citric Acid, 5 mM Tri-sodium citrate 5.0 CA
Mild stripping buffer (pH=2.2) 200 mM Glycine, 1% (w/v) SDS, 1% (v/v) Tween-20, pH set to 2.2 with HCl 2.2 WB
Lysis buffer for nuclei isolation 8 mM Tris-HCl, 2 mM Tris-Base, 10 mM NaCl, 3 mM MgCl2, 0.8% NP-40,
Protease inhibitor cocktail
7.5 CI
Quenching solution for cell
surface protein isolation
PBS with 100 mM Glycine CI
Lysis buffer for cell surface
protein isolation
PBS with 1% IGEPAL-CA63, Protease inhibitor cocktail CI
Cell culture freezing solution 10% (v/v) Glycerol, 90% FBS CC

Chapter 2 Material and method
60
Wash buffer for cell surface
isolation
PBS with 0.1% IGEPAL-CA630, Protease inhibitor cocktail CI
Kreb’s 125 mM NaCl, 26 mM NaHCO3, 2.5 mM KCl, NaH2PO4, 2 5mM D-glucose, 1
mM CaCl2
7.4 E
Phosphate buffer for rat brain
preparation
153 M NaH2PO4,1.46 mM Na2HPO4, 320 mM Sucrose, Adjust pH with H2PO4 7.4 WB
Pipette solution free Ca2+
high(1.6 M)
5 mM EGTA, 20 mM HEPES, 10 mM KCl, 100 mM K-acetate, 1 mM MgCl2, 4
mM CaCl2
7.4 E
Pipette solution free Ca2+
low
(10 nM)
5 mM EGTA, 20 mM HEPES, 10 mM KCl, 100 mM K-acetate, 1 mM MgCl2, 50
nM CaCl2
7.4 E
Table 2-2 Buffers
Formulations, names, abbreviation, pH of the buffers and solutions and applied techniques. ADAM: ADAM17 activity assay, CA: cytokine assay, E:
electrophysiological recordings, IF: immunofluorescence imaging, PCR: real-time quantitative polymerase chain reaction, SDS-PAGE: sodium dodecyl
sulphate polyacrylamide gels, WB: Western blot, CI: isolation of cellular fractions. CC: cell culture.

Chapter 2 Material and method
61
2.1.5 Antibodies
A mouse monoclonal anti-mouse BK mouse antibody (L6/60; Millipore, UK) and a
rabbit polyclonal anti-mouse BK (APC-107; Almone labs, Israel) were used for
BK identification in Western blot analysis. Both antibodies are designed to bind the
intracellular, C-terminal, region of the BKprotein. Antibodies which are directed to
the extracellular region of the subunit were avoided due to possible interference with
the biotinylation procedure, 2.2.7. This is because the method for the plasma
membrane isolation involves covalent modification of the cell surface protein, which
could limit the binding of antibody to the extracellular region. L6/60 was used to
visualise BK in immunofluorescence imaging. A rabbit polyclonal anti-ADAM17
antibody (ab2051; abcam, U.S.) was used to assess ADAM17 expression in
Western blot. This antibody is designed to bind to the intracellular, C-terminal,
region of ADAM17. For the validation of plasma membrane isolation technique, anti-
Akt rabbit polyclonal antibody was used. A rabbit monoclonal anti-mouse TNF-
antibody (D2D4; Cell Signaling Technology, U.S.) was used to detect cellular TNF-
in Western blot. A rabbit polyclonal anti--actin antibody (D6A8; Cell Signaling
Technology, U.S.) was used as a loading control in Western blot. Goat anti-rabbit
IgG horse radish peroxidase (HRP)-linked secondary antibody and horse anti-
mouse IgG HRP-linked secondary (Cell Signaling Technology, U.S.) were used to
conjugate HRP to primary antibodies in Western blot. Non-specific binding of the
secondary antibodies was tested by incubating the samples with the secondary
antibodies alone, see 2.2.10.
A mouse monoclonal anti-mouse BK antibody (L6/60; Millipore, UK) was used to
visualize BK protein in immunofluorescence imaging. Before incubating with L6/60,
F(ab)’ fragment-affinity purified unconjugated goat anti-mouse IgG (Thermo Fisher
Scientific, U.S.) was applied at 1.25 g/ml to block the binding of the anti-mouse IgG
secondary antibody to endogenous mouse Ig. Goat anti-mouse IgG (H&L)
secondary antibody Alex Fluor® 488 conjugate (Thermo Fisher Scientific, U.S.) was
used to conjugate fluorescence to primary antibody for immunofluorescence imaging.
In order to achieve good signals, experimental conditions, such as antibody
concentrations and incubation times were optimised. The optimised experimental
conditions are summarised in Table 2-5.

Chapter 2 Material and method
62
2.2 Methods
2.2.1 Cell culture
RAW264.7 murine macrophage cell line and J774.1 murine macrophage cell line
were obtained from the European Collection of Cell Culture. RAW264.7 and J774.1
macrophages were cultured in DMEM containing 10% FBS, 100 unit/ml penicillin
and 100 g/ml streptomycin, referred as culture media in text, in a humidified
incubator at 37oC, 5% CO2. Cells were kept frozen in freezing media consisting of
90% FBS (v/v) and 10% (v/v) glycerol, sterile filtered. The stocks of cells were kept
in cryotubes. Each tube contained approximately 5x10⁶ cells in liquid nitrogen. The
cells were thawed in water bath at 37oC and immediately transferred to conical
bottom tubes supplied with flesh media. To remove any freezing media, tubes were
centrifuged at 210 x g, re-suspended in fresh culture media, transferred to the cell
culture flasks and cultured in a incubator. The culture media was replaced at 4 hours
and 24 hours after thawing to remove dead cells, released molecules and debris.
When flasks reached approximately 80% confluency, the cells were passaged using
a rubber scraper and a portion of cells were continuously cultured. The passage
number did not exceed 16 times. Mycoplasma contamination was routinely tested as
described in 2.2.2. Upon thawing and periodically, Nitrite assay, see 2.2.3, was
carried out to assess the responsiveness to LPS.
2.2.2 Mycoplasma detection
The presence of mycoplasma contamination was tested using a mycoplasma
detection kit, Mycoprobe (R&D Systems, U.S.) following the manufacturer’s
instruction. To allow the detection of low level of contamination, cell culture media
was sampled on day 1 and 3 to determine any increases in signal. The samples
were mixed with supplied lysis buffer and hybridized to probes (biotin-labelled
capture oligonucleotide probes and digoxigenin-labelled detection probes). Those
probes are targeted to the 16S ribosomal RNA (rRNA) of common mycoplasmas.
The hybridization solution is transferred to a streptavidin-coated microplate to
capture the rRNA/probe hybrid. Following removal of unbound material by wash, an
anti-digoxigenin alkaline phosphatase was added. An amplified solution was added
and colour develops in proportion to the amount of mycoplasma rRNA. Colour
development is stopped and the intensity of the colour is measured using a plate

Chapter 2 Material and method
63
reader at wavelength 490 nm with correction at 650 nm. An optical density greater
than 0.1 indicated the presence of mycoplasma infection and density less than 0.05
indicated the absence of mycoplasma contamination. Signals from day 0 sample
and day 3 samples were compared to check change in mycoplasma level.
Mean O.D.
positive ctrl 1.8163
negative ctrl 0
Day 1 0.0063
Day 3 0.0038
Table 2-3 Mycoplasma test on RAW264.7 cells.
A typical result from mycoplasma test using culture media from RAW264.7 macrophages.
Ctrl: control supplied with the kit. O.D.: Optical density. O.D.>0.1: presence mycoplasma
infection, O.D. <0.05: absence of mycoplasma infection. Ctrl: control.
2.2.3 Nitrite assay
Macrophages are known to exhibit heterogeneity depending on the environmental
cues and origin (Mosser and Edwards, 2008). Pervious work in the lab had found
that sub-clones of macrophage cell lines can occur if high passage numbers, 25
times or more, are used, or cells are not continually cultured under optimal
conditions. These cells were usually associated with a decrease in their ability to be
activated (lack of macrophage response to LPS can also be due to contamination).
To use relatively consistent macrophage populations throughout the thesis, the
nitrite assay was routinely carried out when each vial was thawed and to monitor the
LPS responsiveness of the cells. Macrophages which showed a significant
difference to a standard response was discarded and new culture was started.
Activation of macrophages with LPS and IFN leads to the generation of nitric oxide
(NO) from L-arginine. Nitric oxide synthase 2 inducible derived NO is known to have
an antimicrobial activity and possible participates in signal transduction pathways
during the inflammatory response. Nitrite assay measures the amount of nitrite in
cell culture media and is used to estimate the nitric oxide production. Typical data
from experiments were displayed in Figure 2-1. The amount of nitrite in media were
measured based on Greiss reaction. The Greiss reaction is a colorimetric assay,

Chapter 2 Material and method
64
resulting from the formation of pink coloured diazonium salt by addition of sulphate
acid on the nitrite. The cells were plated at 1x10⁵ per well on 96 well tissue culture
plate and incubated overnight. Macrophages were stimulated with 10 or 1000 ng/ml
LPS in presence or absence of 100 unit/ml IFN. After 24 hours, the media was
collected. 50l of sample was transferred into 96 well plates in duplicate and 100l
of Greiss solution, consisting of equal parts of 0.2% naphthylethylenediamine
dihydrochloride, and 2% sulphanilamide in 5% phosphoric acid, added. The optical
density was measured in microcell plate with a single wave length at 540 nm.
Duplicates were averaged and the nitrite concentration in the samples was
calculated against standard (0-100 M) composed of NaNO3 in diH2O.

Chapter 2 Material and method
65
Figure 2-1 Nitrite production from LPS and/or IFNactivated macrophages
a) A typical nitrate standard plot and b) nitrate production from activated RAW264.7 cells
using the Greiss assay. The cells were activated with various combinations of LPS and
IFNfor 24 hours. At 24 hours the conditioned culture media was collected and the nitrite
contents were analysed by Greiss reaction. Experiments were routinely carried out and data
shown is one example.
y = 0.0017x + 0.0012
0
0.05
0.1
0.15
0.2
0 20 40 60 80 100
O.D
.
Nitrite (M)
0
10
20
30
40
50
Nitrite
(M
)
ctrl LPS (100ng/ml)
LPS
(1g/ml)
LPS (100ng/ml)
IFN
(100unit/ml)
LPS
(1g/ml)
IFN
(100unit/ml)
a
b
Chapter 2 Material and method
66
2.2.4 MTT assay
Methyl-thiazolyl-tetrazolium (MTT) assay was performed to estimate the effect of
drug treatments on the cell viability. NAD(P)H-dependent cellular oxidoreductase
enzymes present in mitochondria are capable of reducing yellow coloured
tetrazolium salt and this results in the formation of purple coloured precipitated
product, formazan. The change in colour is measured by optical density and used to
estimate the activity of these enzymes. At the end of experiments, supernatant was
removed and thiazolyl salt solution, 0.33 mg/ml Thiazolyl Blue Terazolium Bromide
(Alfa Asar, U.S.) in PBS at 37oC was added to each wells. Plates were incubated on
a shaker at room temperature until a purple precipitate was visible, typically for 10
minutes. Once the purple precipitate formed the MTT solution was removed, plates
dried and the product dissolved in DMSO (Sigma, UK). The sample was pipetted
into 96 well-plate wells in duplicate. Optical density of the samples was measured in
a microplate reader, Spectra MAXPlus (Molecular Devices, U.S.) at single wave
length 545 nm. The values averaged and were compared to non-treated controls.
.
2.2.5 Bradford assay
Protein concentrations in samples were measured by Bradford assay. Bradford
assay is a colormetric assay using the dye Comassie Brilliant Blue G-250. When
binding to protein, the product was read at 595 nm. The change in optical density
was used to calculate the protein contents in the samples. Samples were diluted in
PBS so as to fit the range of standard. Protein standard (0-2 mg/ml) was made with
BSA in phosphate buffered saline (PBS). 2-5 l diluted sample and standard was
pipetted in duplicates into a 96 well plate. Bradford reagent (Sigma, UK) was diluted
1 in 2 in PBS and added to each well to give sample to reagent ratio of 1 to 50.
Optical density was measured in a microplate reader, Spectra MAXPlus (Molecular
Devices, U.S.) at single wave length 595 nm. The duplicates were averaged and
background signal subtracted. Protein contents in the samples were calculated from
the standard.
2.2.6 Whole cell protein preparation for Western blot analysis
After treatment procedures cell were prepared for Western blot analysis as follows.
Cells were collected in conical bottom cryotubes with PBS supplied with protease

Chapter 2 Material and method
67
inhibitor cocktail at 4oC. The tubes were centrifuged at 10000 x g for 7 minutes and
supernatant was discarded. Cell pellets were snap frozen in liquid nitrogen and
stored in -70 oC freezer until use. The cell pellet was lysed by sonication at 4oC in
PBS containing protease inhibitor cocktail. The protein concentration in each sample
was measured by Bradford assay, see 2.2.5. Four times concentrate SDS-PAGE
sample buffer, 62.5 mM Tris-HCL, 20% (v/v) Glycerol, 2% (w/v) SDS, 5% (v/v) -
mercaptoethanol with trace amount of bromophenol blue was added 3 parts cell
sample in PBS. The final protein concentration of the loading sample was 1 mg/ml
protein. The following equation 2-1 was used to calculate the proportion of loading
buffer, sample and PBS used, with FV being the final volume of sample prepared
and FPC being the final protein concentration. The loading sample mixture was
boiled in hot water bath for 2-3 minutes. Samples were used immediately or were
stored at -20oC until loading.
𝐹𝑉 = 𝐹𝑖𝑛𝑎𝑙 𝑣𝑜𝑙𝑢𝑚𝑒 (𝑚𝑙)
𝑆𝑃𝐶 = 𝑆𝑎𝑚𝑝𝑙𝑒 𝑝𝑟𝑜𝑡𝑒𝑖𝑛 𝑐𝑜𝑛𝑐𝑒𝑛𝑡𝑟𝑎𝑡𝑖𝑜𝑛 (𝑚𝑔
𝑚𝑙) ; 𝑤ℎ𝑒𝑟𝑒 𝑆𝑃𝐶 ≥
1.333𝑚𝑔
𝑚𝑙
𝐹𝑃𝐶 = 𝐹𝑖𝑛𝑎𝑙 𝑝𝑟𝑜𝑡𝑒𝑖𝑛 𝑐𝑜𝑛𝑐𝑒𝑛𝑡𝑟𝑎𝑡𝑖𝑜𝑛 =1𝑚𝑔
𝑚𝑙
𝐹𝑉
4= 𝑺𝑫𝑺𝑷𝑨𝑮𝑬 𝒔𝒂𝒎𝒑𝒍𝒆 𝑳𝒐𝒂𝒅𝒊𝒏𝒈 𝒃𝒖𝒇𝒇𝒆𝒓 (𝒎𝒍)
𝐹𝑉 ∗𝐹𝑃𝐶
𝑆𝑃𝐶= 𝒔𝒂𝒎𝒑𝒍𝒆 (𝒎𝒍)
𝐹𝑉 − 𝑙𝑜𝑎𝑑𝑖𝑛𝑔 𝑏𝑢𝑓𝑓𝑒𝑟 𝑣𝑜𝑙𝑢𝑚𝑒 − 𝑠𝑎𝑚𝑝𝑙𝑒 𝑣𝑜𝑙𝑢𝑚𝑒 = 𝑷𝑩𝑺 (𝒎𝒍)
Equation 2-1 Calculation of Western blot sample volume
This formulation is used to calculate the volume of SDS-PAGE (sodium dodecyl sulfate
polyacrylamide gel electrophoresis) sample loading buffer, sample and PBS to prepare
samples for Western blot.
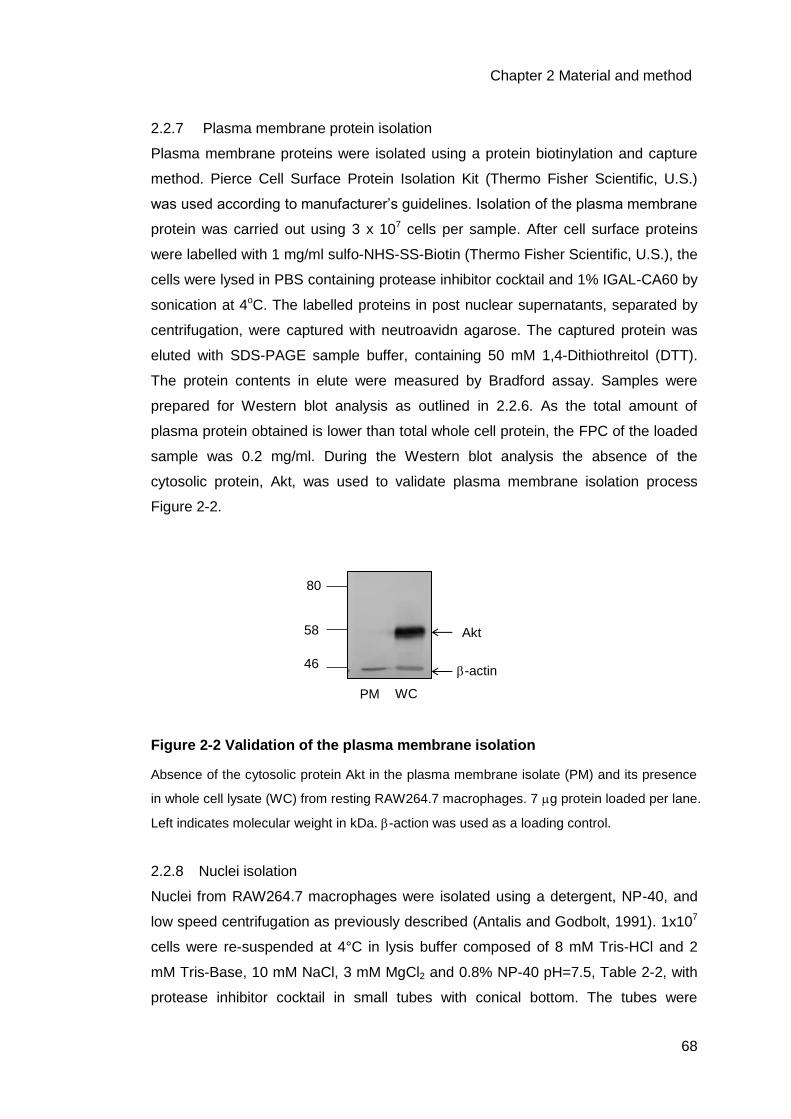
Chapter 2 Material and method
68
2.2.7 Plasma membrane protein isolation
Plasma membrane proteins were isolated using a protein biotinylation and capture
method. Pierce Cell Surface Protein Isolation Kit (Thermo Fisher Scientific, U.S.)
was used according to manufacturer’s guidelines. Isolation of the plasma membrane
protein was carried out using 3 x 10⁷ cells per sample. After cell surface proteins
were labelled with 1 mg/ml sulfo-NHS-SS-Biotin (Thermo Fisher Scientific, U.S.), the
cells were lysed in PBS containing protease inhibitor cocktail and 1% IGAL-CA60 by
sonication at 4oC. The labelled proteins in post nuclear supernatants, separated by
centrifugation, were captured with neutroavidn agarose. The captured protein was
eluted with SDS-PAGE sample buffer, containing 50 mM 1,4-Dithiothreitol (DTT).
The protein contents in elute were measured by Bradford assay. Samples were
prepared for Western blot analysis as outlined in 2.2.6. As the total amount of
plasma protein obtained is lower than total whole cell protein, the FPC of the loaded
sample was 0.2 mg/ml. During the Western blot analysis the absence of the
cytosolic protein, Akt, was used to validate plasma membrane isolation process
Figure 2-2.
Figure 2-2 Validation of the plasma membrane isolation
Absence of the cytosolic protein Akt in the plasma membrane isolate (PM) and its presence
in whole cell lysate (WC) from resting RAW264.7 macrophages. 7 g protein loaded per lane.
Left indicates molecular weight in kDa. -action was used as a loading control.
2.2.8 Nuclei isolation
Nuclei from RAW264.7 macrophages were isolated using a detergent, NP-40, and
low speed centrifugation as previously described (Antalis and Godbolt, 1991). 1x10⁷
cells were re-suspended at 4°C in lysis buffer composed of 8 mM Tris-HCl and 2
mM Tris-Base, 10 mM NaCl, 3 mM MgCl2 and 0.8% NP-40 pH=7.5, Table 2-2, with
protease inhibitor cocktail in small tubes with conical bottom. The tubes were
-actin
Akt
80
58
46
WC PM

Chapter 2 Material and method
69
centrifuged twice at 180 x g for 15 minutes. To prevent further lysis of nuclear
membranes, NP-40 was washed from the cells by re-suspension with buffer 8 mM
Tris-HCl and 2 mM Tris-Base, 10 mM NaCl, 3 mM MgCl2 pH=7.5, Table 2-2, and
centrifugation at 180 x g for 10 minutes at 4°C. The obtained nuclei pellets were
resuspended in buffer without NP-40. The nuclei integrity was checked using a
confocal microscopy by visualizing DNA with DAPI staining. The isolated nuclei was
lysed in PBS containing protease inhibitor cocktail by sonication at 4 oC and protein
concentrations in the lysate was measured by Bradford assay. Samples were
prepared for Western blot analysis as outlined in 2.2.6.
2.2.9 Rat brain homogenise preparation
Rat brain was used as a positive control for BK detection in Western blot. Rat brain
tissue was kindly given by Professor Dickenson’s group at the department of
Neuroscience, Physiology and Pharmacology in UCL. In his laboratory, all
procedures associated with animals were approved by the UK Home Office. The rat
brain was homogenised in 5 mM phosphate buffer supplemented with 320 mM
sucrose and protease inhibitor cocktail using a glass squeezer. The homogenate
was transferred to 1.5 ml conical bottom tubes and span at 800 x g for 5 minutes.
The obtained pellet was suspended in the phosphate buffer and lysed in PBS
containing protease inhibitor cocktail by sonication at 4oC and protein concentrations
in the lysate were measured by Bradford assay. Samples were prepared for
Western blot analysis as outlined in 2.2.6.

Chapter 2 Material and method
70
Figure 2-3 BK expression in rat brain lysate
BKexpression in rat brain lysates was analysed by Western blot using anti-mouse BK
antibodies, L6/60 and APC-107. 10 g protein was loaded each lane. Left indicates the
molecular weight marker in kDa. Experiment was repeated for 5 times with L6/60 and twice
with APC-107.
2.2.10 Western blot analysis
Gel casting, sample loading and transfer were performed using Mini-PROTEAN®
Tetra Handcast Systems (Bio-rad, UK). SDS-PAGE gels were constructed by free
radical polymerization of acrylamide and a monomer cross-linker bis-acrylamide.
Pores between the polymers permit the movement of denatured protein in samples.
SDS-PAGE gels were hand casted using the casting set in the Mini-PROTEAN®
system. First Tris-HCl buffers, diH2O, acrylamide and bis-acrylamide solution were
mixed and solution was degassed. Polymerization is initiated by adding APS with
TEMED acting as a catalyst. Once the first layer of running gel has set, the second
layer was poured. Pore sizes in polyacrylamide gels were determined by the
percentage of acrylamide, APS and TEMED. To yield the best separation of the
protein samples for the analysis, the composition of the running gel was changed
depending on the molecular size of the target protein. For proteins, between 15 kDa
and 60 kDa, 12.5% gels were used and for proteins larger than 60 kDa 7.5% gels
were used. Stacking gel was made at 4.5%. Table 2-4 summarizes the formulation
of the gels, which are total of 50 ml running gel solutions and 20 ml stacking gel
L6/60 APC-107
80
130
58
46
100
32
25

Chapter 2 Material and method
71
solution, typically used to make 4 gels. Gels were used immediately after pouring or
stored in a fridge with hydration for up to one week before use.
Gels are assembled in an electrophoresis chamber. 7 l pre-stained protein
standard was load first lane of gel. Equal amount of sample protein, as prepared in
2.2.6, was loaded on to gels. The amount of protein loaded per lane was typically
between 1 to 10 g. Proteins were separated in the chamber filled with electrode
buffer, Table 2-2. A constant voltage of 180 V applied until the protein sample
reached the bottom of the gel and this was typically for 1 hour. The gel was
assembled in transfer cassette and protein in the gels were transferred to
nitrocellulose membranes (Thermo Fisher Scientific, U.S.) in transfer buffer by
application of a constant voltage at 100 V for 1 hour.
The membranes were blocked with 5% non-fat milk, 0.01% BSA and 0.1% Tween-
20 in tris-buffered saline (TBS) for 2 hours at room temperature with gentle shaking.
Subsequently membranes were stained with primary antibodies overnight at 4oC
with gentle shaking. The dilution factors and conditions for each primary antibody
are summarized in Table 2-5. The membranes were washed with tris-buffered saline
with tween-20 (TBS-T) for 10 minutes for 3 times on a shaker. The relevant
secondary HRP-linked anti-mouse IgG or anti-rabbit IgG antibodies were applied to
the nitrocellulose membranes. Non-specific binding of the secondary antibodies was
tested by incubating the samples without primary antibody. Protein bands were
visualized by chemiluminescence using Pierce ECL2 Western Blot Substrate
(Thermo Fisher Scientific, U.S.) and scanned by a phosphor imager (Typhoon 9410
variable made imager, GE Healthcare UK).

Chapter 2 Material and method
72
Reagent Stacking gel (20 ml total)
7.5% running gel (50 ml total)
12% running gel (50 ml total)
30% Acrylamide/bis-acrylamide
2.6 ml 12.5 ml 20 ml
0.5 M Tris-HCl pH 6.8
5 ml - -
1.5 M Tris-HCl pH 8.6
- 12.5 ml 12.5 ml
10% SDS 0.2 ml 0.5 ml 0.5 ml
diH2O 12 ml 24.3 ml 16.8 ml
TEMED 20 l 25 l 25 l
10% (w/v) APS 0.1 ml 0.25 ml 0.25 ml
Total volume 20 ml 50 ml 50 ml
Table 2-4 Formulations for SDS-PAGE gel
Formulation of sodium dodecyl sulfate polyacrylamide gel electrophoresis (SDS-PAGE) gels
20 ml of stacking gel solution and 50 ml of running gels. This volume can make up 4 mini-
gels (8.6 cm x 6.7 cm). Ammonium persulfate (APS), prepared as 10% (W/W) solution in
distilled water (diH2O). TEMED: tetramethylethylenediamin.
2.2.10.1 Calibration of the molecular weight
The molecular weight of protein bands was estimated using a pre-stained colour
protein standard. This also confirms the samples on the gels were separated and
transferred correctly. The marker is a visible colour (wavelength: 390 -700 nm) when
transferred to the nitrocellulose but the colour does not appear when imaged with
blue lazer (wavelength : 450 nm).
To calibrate molecular weight, initially the left side of the membrane was cut at each
colour indicator so that the marker is visible even under the phosphor-imager.
However this process caused damage on the membrane and affected the quality of
the image. Thus this calibration was done by matching the final image taken in the
phosphor-imager and the photo taken in the same size prior to the application of
chemiluminescence reagents as the colour marker fades immediately after the
phosphoimage, Figure 2-4a. This analysis was followed in the Western blot and the
calibrated molecular weight was indicated as bars, Figure 2-4a and b. These results
were recorded in the form presented in Figure 2-4b not in the colour photo shown in
Figure 2-4a. Molecular weights are marked as bars shown in Figure 2-4b when the
antibody was first used and following blot, the bands at corresponding molecular
weights were presented as in Figure 2-4c.

Chapter 2 Material and method
73
Figure 2-4 Calibration method for molecular weight in Western Blot analysis
a) After sample transfer to nitrocellulose membrane a photograph was taken. After protein
bands were developed in a phosphor imager, a) the two images were compared and the
molecular weight were annotated on the image as bars. b) Western blot results were
recorded with the annotations determined by process. These annotated images b) were
used when an antibody was first applied. Subsequent experiments presented c) the bands at
relevant molecular weight.
a
b
90 130
58
46
35
25
17
175
The end of membrane
65
The top of membrane
120 kDa
90 130
58
46
35
25
17
175
65
120 kDa
120 kDa
c
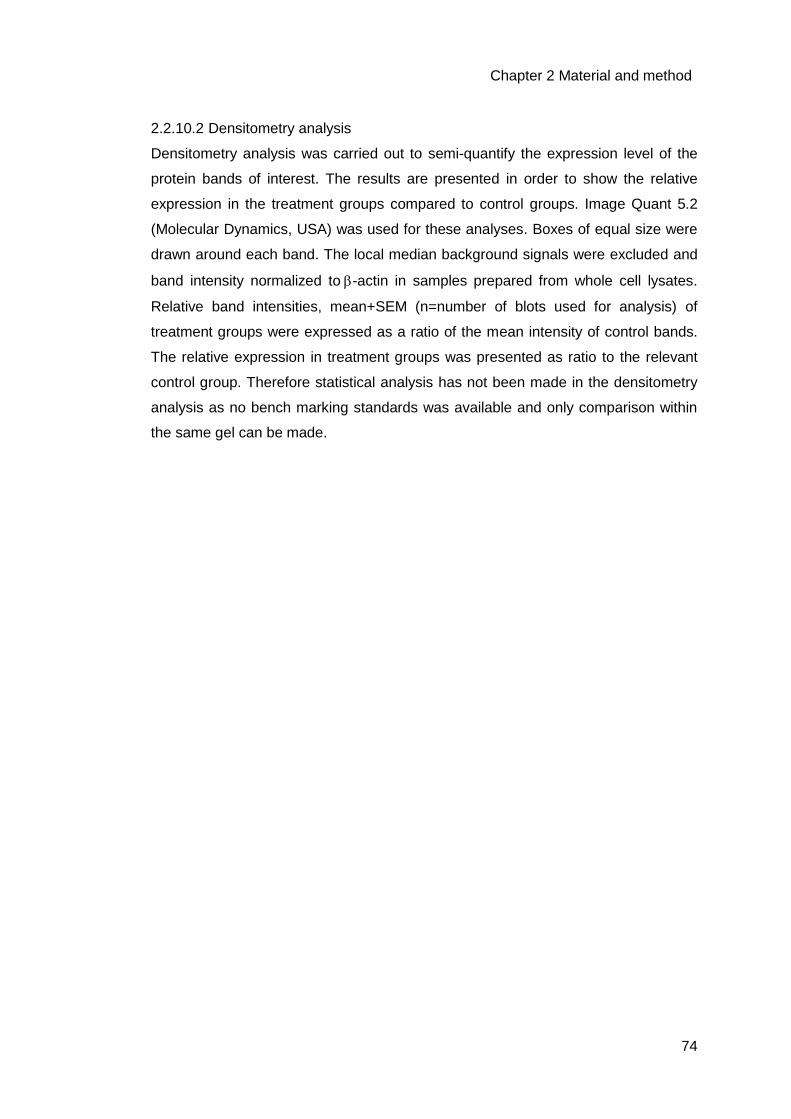
Chapter 2 Material and method
74
2.2.10.2 Densitometry analysis
Densitometry analysis was carried out to semi-quantify the expression level of the
protein bands of interest. The results are presented in order to show the relative
expression in the treatment groups compared to control groups. Image Quant 5.2
(Molecular Dynamics, USA) was used for these analyses. Boxes of equal size were
drawn around each band. The local median background signals were excluded and
band intensity normalized to-actin in samples prepared from whole cell lysates.
Relative band intensities, mean+SEM (n=number of blots used for analysis) of
treatment groups were expressed as a ratio of the mean intensity of control bands.
The relative expression in treatment groups was presented as ratio to the relevant
control group. Therefore statistical analysis has not been made in the densitometry
analysis as no bench marking standards was available and only comparison within
the same gel can be made.

Chapter 2 Material and method
75
Primary antibody Secondary antibody
Antibody name ( Target
protein)
Manufacturer Host species Dilution Diluent Incubation Antibody name Manufacturer Host
species
Dilution Diluent Incubation
L6/60
(Mouse BK
Milipore, UK Mouse
monoclonal
1 in 1000 TBS Overnight 4 oC Anti-mouse IgG HRP-linked
Antibody
Abcam, U.S. Horse 1 in 4000 TBS 50 min
RT
ab2051(Mouse
ADAM17)
Abcam, U.S. Rabbit
polyclonal
1 in 750 TBS Overnight 4 oC Anti-rabbit IgG HRP-linked
Antibody
Cell Signaling
Technology, U.S.
Goat 1 in 4000 TBS 50 min RT
anti-Akt rabbit
polyclonal antibody
(Mouse Akt)
Cell Sigaling
Technology, U.S.
Rabbit
polyclonal
1 in 1500 TBS Overnight 4 oC Anti-rabbit IgG HRP-linked
Antibody
Cell Signaling
Technology, U.S.
Goat 1 in 4000 TBS 50 min RT
APC-107
(Mouse/Human BK
Cell Sigaling
Technology, U.S.
Rabbit
polyclonal
1 in 1500 TBS
0.1%BSA
Overnight 4 oC Anti-rabbit IgG HRP-linked
Antibody
Cell Signaling
Technology, U.S.
Goat 1 in 4000 TBS 50 min RT
D2D4 (Mouse TNF- Cell Sigaling
Technology, U.S.
Rabbit
monoclonal
1 in 1500 TBS Overnight 4 oC Anti-rabbit IgG HRP-linked
Antibody
Cell Signaling
Technology, U.S.
Goat 1 in 4000 TBS 50 min RT
D6A8(Mouse/Human -
actin)
Cell Sigaling
Technology, U.S.
Rabbit
monoclonal
1 in 2000 TBS Overnight 4 oC Anti-rabbit IgG HRP-linked
Antibody
Cell Signaling
Technology, U.S.
Goat 1 in 4000 TBS 50 min RT
DM3568 (Mouse IL-
6R)
2B Scientific, UK Rat
monoclonal
1 in 500 TBS Overnight 4 oC Anti-rat IgG HRP-linked
Antibody
Cell Signaling
Technology, U.S.
Goat 1 in 4000 TBS 50 min RT
Table 2-5 Sources and experimental conditions for antibodies in Western blot
Description of antibodies (antibody name, source and experimental conditions) used in Western blot analysis. BSA: bovine serum albumin,
TBS: tris-buffered saline, RT: room temperature, HRP: horse radish peroxidase.

Chapter 2 Material and method
76
Figure 2-5 Blots stained with secondary antibodies without primary antibodies
Protein samples from whole cell lysate of RAW264.7 macrophages and rat brain lysates.
Proteins were loaded 10 g per each lane. Secondary antibodies, goat anti-rabbit IgG HRP-
linked secondary antibody and goat anti-mouse IgG HRP-linked antibody were used at 1 in
4000 dilution. The experiments were repeated twice and blots show representative.
2.2.11 Electrophysiology
Whole cell voltage clamp recordings were performed at room temperature.
Macrophages were plated on 13 mm glass coverslips chosen to fit the
electrophysiology recording chamber. Pipettes were made using thin walled
borosilicate glass (Harvard, Germany), heat-pulled and polished. When filled with
pipette solution, the pipette had a resistance between 3.5 - 4 MΩ. Pipette solution
was based on 120 mM K-acetate, 20 mM HEPES, 10 mM KCl, 5 mM EGTA, 1 mM
MgCl2 and 4 mM CaCl2 with pH=7.2. Free Ca2+ in the solution was estimated as 1.6
M using a software, MAXCHELATOR (Stanford University, U.S.). For initial
recordings, pipette solution with free Ca2+ at 10 nM was also used, Table 2-2. The
extracellular solution was a modified Kreb’s; 125 mM NaCl, 26 mM NaHCO3, 2.5
mM KCl, 1.26 mM NaH2PO4 H2O, 25 mM D-glucose and 1 mM CaCl2 with pH=7.4.
The osmolality of the pipette solutions and extracellular solutions were maintained
between 250-300 mOsmol. Currents were recorded using an Axopatch 200B
amplifier (Axon Instruments, U.S.) at the sample rate of 5 kHz and filtered at 1kHz
80
130
58
46
100
32
25
Rat brain RAW264.7 Rat brain RAW264.7
Anti-rabbit IgG Anti-mouse IgG

Chapter 2 Material and method
77
with Digitata 1332A (Molecular Devices, U.S.). Once a high resistance seal (>2 GΩ)
was formed, a ramp protocol (25 second with 10 second sweep ranging from -40 to
100 mV) was applied, Figure 2-6. 3 mM TEA and 30 nM IbTX were applied in
extracellular solutions. pH of the extracellular solution was adjusted when TEA was
used. For each treatment and control, ramp was repeated at least 5 times and the
traces were averaged. There was 5-7 minutes interval between different drug
applications. Both IbTX and TEA are reversible channel blockers and whole cell
current are to recover during re-application of ramps in Kreb’s. Macrophage
possesses pseudopodia on their cell surfaces, and the blockade of glass pipette
electrode could easily occur. To test whether reduction in current was due to the
channel blocking, control ramps were repeated several times to observe recovery
and after the blocker application. TEA- and IbTX-sensitive currents were obtained by
subtracting average traces in presence of TEA or IbTX from control traces. Net
membrane currents were plotted against membrane voltage. Recordings were
carried out at room temperature. pCLAMP software (Molecular Devices, U.S.) was
used to monitor current magnitude and duration, establish voltage ramp protocols
and analyze the data.
Figure 2-6 Voltage ramp protocol for whole cell recordings
A ramp protocol was established using pCLAMP software and applied in 35 second interval.
Between 0 to 10 second voltage remained -60 mV. At 10 second, the membrane voltage
was dropped to -100 mV and raised to 40 mV during 10 to 20 seconds. Between 20-35
second voltage was kept -60 mV and the protocol was repeated. The ramp protocol was
applied at least 5 times per treatment and the obtained traces were averaged.
-120
-60
0
60
0 5 10 15 20 25 30 35
Mem
bra
ne v
oltage (
mV
)
Time (S)

Chapter 2 Material and method
78
2.2.12 Cytokine and cytokine receptor assays
Macrophages were plated at 2.5x10⁵ cells per well on 24 well plates and incubated
overnight. The following day, the media was replaced and the cells received various
drug treatments. After treatments, media was collected and kept in a -20°C freezer
until analysis. Released cytokines and cytokine receptors, TNF-, IL-6R and IL-6,
from macrophages were assessed using ELISA kits (R & D Systems, U.S.),
according to the manufacturer’s protocol. All procedures were performed at room
temperature. First the plate was coated with a relevant capture antibody in PBS
overnight. Following day, the plates were washed with phosphate buffered saline
with tween-20 (PBS-T) and blocked with 1% BSA in PBS for 1 hour. Cytokine/
cytokine receptor standards were prepared in a range between 0-1000 ng/ml in PBS
containing 0.5% BSA. Samples were diluted in PBS containing 0.5% BSA, so as to
achieve cytokine concentrations which fit with the standard curve of the kit. The
standard and diluted samples were pipetted in duplicate. After 2 hours incubation,
plates were washed with PBS-T and incubated with a secondary antibody, followed
by wash and incubation with HRP. The color was developed using TMB substrate
diluted in citrate buffer and optical density were measured in a microwell plate
reader, Spectra MAXPlus (Molecular Devices, U.S.) at a wavelength 405 nm with
650 nm corrections. The results were averaged and a cytokine concentration in the
samples was calculated using the standard curve. The detection limits of kits are
31.6 pg/ml for TNF- and IL-6, or 15.6 pg/ml for IL-6R. Figure 2-7 shows typical
standard curves for TNF-, IL-6 and IL-6R.

Chapter 2 Material and method
79
Figure 2-7 ELISA standard plots for TNF-, IL-6 and IL-6R
TNF-, IL-6 an IL-6R were prepared at the concentrations from 0-1000 pg/ml for TNF-
and IL-6 or 0-500 pg/m for IL-6R in PBS containing 0.5% BSA and used as a standard for
each plate in ELISA. Standard plots were fitted to curves using non-liner regression analysis
using Graph pad prism software (Graphpad, U.S.). O.D.: Optical density.
0
0.1
0.2
0.3
0.4
0.5
0 250 500 750 1000
O.D
.
TNF- (pg/ml)
0
0.07
0.14
0.21
0.28
0.35
0 250 500 750 1000
O.D
.
IL-6 (pg/ml)
0
0.2
0.4
0.6
0.8
1
0 100 200 300 400 500
O.D
.
IL-6R(pg/ml)

Chapter 2 Material and method
80
2.2.13 RNA extraction and cDNA synthesis
Total RNA was extracted from RAW264.7 macrophages using RNAsay mini-kit
(Qiagen, UK) according to manufacturer’s instruction. The procedure extracts RNA
molecules longer than 200 nucleotides. This feature provides relatively selective
isolation of mRNA and exclusion of shorter RNAs, rRNA and tRNAs (<200
nucleotides). Frozen cell pellets, containing 1x10⁶ cells per group, were lysed and
homogenized in a supplied lysis buffer supplied with 0.1% -metacaptoethanol
(Sigma, UK) by votexing until participate clears. The lysates were centrifuged for 30
seconds at 13000 x g in RNase free collection tubes with gDNA eliminator column.
Total RNA in flow through was combined with 70% ethanol and salt and captured in
the RNA binding column. RNA binding column washed twice with supplied washing
buffers and centrifugations at 13000 x g for 15 seconds twice. RNA was eluted in
water and stored in a -20 oC freezer. The quality and purity of RNA were assessed
by OD260/280 ratio, which is measured using a spectrophotometer (DU800;
Beckman Coulter, U.S.). Complementary DNA (cDNA) was synthesized using the
Superscript III Reverse transcriptase kit (Thermo Fisher Scientific, U.S.) with
random primers (Thermo Fisher Scientific, U.S.) according to the manufacturer’s
instructions. 2 g total RNA was mixed with 125 ng random primers, 10 ng dNTP
Mix and RNase free DEPC treated water. The mixture was heated at 65°C for 5
minutes to denature RNA. The mixture containing single stranded RNA was mixed
with 4 l 5 x first stranded buffer, 200 units SuperScript™III RT, 1 nmol DTT and 1
l RNaseOUT. After mixing, tubes were incubated at 25°C for 5 minutes for
annealing. The mixture was heated at 50°C for 45 minutes to extend the strand. The
reaction was inactivated by heating at 70°C for 15 minutes and cDNA for PCR
template was obtained.
2.2.14 Real time-quantitative PCR
RT-QPCR was performed to assess mRNA level of TNF- from cDNA. Taqman
custom gene expression assay (Thermo Fisher Scientific, U.S.) and the ABI Prism
7900HT sequence detection system (Thermo Fisher Scientific, U.S.) were used. The
probes for mouse TNF-(Mm00443260_g1, Thermo Fisher Scientific, U.S.) and
mouse -actin (Mm00607939_s1, Thermo Fisher Scientific, U.S. ) were used. The

Chapter 2 Material and method
81
assay was set up in accordance with Taqman protocols. cDNA samples were diluted
in DEPC treated RNase DNase free water. Master mixes for TNF- and -actin
were made and sample dilution was added to each mix. The sample was loaded on
the plates in triplicate and blank control was DEPC RNase and DNase free water.
The PCR was performed. The background signal was subtracted and values were
averaged. TNF- expression level was normalized to -actin. Experiments were
repeated with n=3 per treatment group and shows representative data and is
expressed as mean+SEM.
2.2.15 Gene silencing
Most effective BKsilencing in RAW264.7 macrophages in this thesis was observed
when Lipofectamine® RNAiMAX reagent was used (Thermo Fisher Scientific, U.S.).
Two silencing siRNAs for mouse BK Mm_Kcnma1_1 FlexiTube siRNA, termed
sequence 1 (Catalogue number: SI00194369, Qiagen UK) and Mm_Kcnma1_5
FlexiTube siRNA, termed sequence 5(Catalogue number: SI02670486 , Qiagen,
UK) were used. Sequence 1 targets the sequence, CAC AAT GTC TAC AGT GGG
TTA, and sequence 5 targets the sequence, CAG TTT CTG AAT ATC CTT AAA.
These siRNAs were reconstituted in RNase free water to 10 M and stored at -20 oC.
A non-silencing siRNA, Negative Control siRNA (Catalogue number: 1022076,
Qiagen, UK) targeting sequence AAT TCT CCG AAC GTG TCA CGT was used.
Stocks for non-silencing siRNA was made in RNase free water at the concentration
of 20 M and stored at -20oC. RAW264.7 macrophages was plated in T25 cm2 cell
culture flasks at 1.25 x 10⁶ cells per flasks and each flask had and 6 ml of complete
culture media supplied with 10% FBS, 100 unit/ml penicillin and 100 g/ml
streptomycin. After overnight incubation, siRNAs and transfection reagents were
diluted (siRNA 0.2 M, Lipofectamine® RNAiMAX 1 in 25) in OptiMEM (Thermo
Fisher Scientific, U.S.). After 5 minutes, siRNA and transfection reagents were
mixed and the mixture was incubated for further 20 minutes for the transfection
complex to form. 90 pmol of total siRNA and 27 l of Lipofectamine® RNAiMAX
were used per 25 cm2 flasks which were used for each transfection the final siRNA
concentration was 15 nM during the transfection. Macrophages were incubated with
the transfection complex for 72 hours. The effect of silencing was determined by
Western blot analysis of BK.

Chapter 2 Material and method
82
In initial experiments, first GeneMute™ (SignaGen® Laboratories, U.S.) reagent
was used in attempt to inhibit the expression of BK in RAW264.7 macrophages.
GeneMute™ regent was used following the manufacturer’s instructions. Briefly,
RAW264.7 macrophages were plated at 5 x 10⁵ cells per well in 6 well plate and
each well contained 1.5 ml complete media. siRNAs were diluted into 10 M in 150
l GeneMute™ reagent. The siRNA-transfection mixture was incubated for 15
minutes to form transfection complex. The complex was added to each well and the
cells were incubated for 48 hours.
Second, Viromer® Blue (Lipocalyx, Germany) reagent was used in attempt to inhibit
BK expression in RAW264.7 macrophages. The reagent was used following the
manufacture’s instruction. Briefly RAW264.7 macrophages were plated at 5 X 10⁵
cells per well in 6 well plate and each well contained 1.5 ml culture media. 15 pmol
siRNA was diluted in Blue Buffer, supplied, and Viromer® transfection reagent was
mixed. The mixture was incubated for 15 minutes at room temperature to allow
transfection complex to form. 150 l transfection complex was added to each well
and after 48 hours of incubation. The cells were analyzed for the expression of BK.
See chapter 7 for the validation of silencing protocols.
2.2.16 ADAM17 activity assay
Proteolytic activity of ADAM17 was assessed by monitoring cleavage of TACE
substrate II (fluorogenic) in living macrophages. The method was adapted from a
paper by Alvarez-Iglesias et al (Alvarez-Iglesias et al., 2005). The enzyme substrate
was added directly on to cells in culture and this configuration enabled the
assessment of the plasma membrane expressed ADAM17 activity in living cells.
RAW264.7 macrophages were plated at 4.8 x 10⁴ cells per well on a 96 well
fluorescence plate with complete DMEM and received relevant treatment. As the
phenol red contained in normal DMEM interfered with fluorescence signal, the
media was replaced with phenol red free DMEM supplemented with 4 mM L-
glutamine (Thermo Fisher Scientific, U.S.) on the day of the activity assay. Three
hours before the assay, the macrophages were activated with 150 ng/ml LPS. TACE
substrate II fluorogenic (BML-P228, Enzo Life Sciences, UK) reconstituted in DMSO,
directly dissolved in the assay media and applied to the cells at the final

Chapter 2 Material and method
83
concentration of 5 M. Immediately, fluorescence signals were measured for 60
minutes using a fluorescence plate reader (Mithras LB 940, Thermo Fisher Scientific,
U.S.) in 15 minutes interval. Samples containing no TACE substrate acted as
negative control. A general inhibitor for membrane metalloproteases, 4.5 M
GM6001, and a selective inhibitor for ADAM17, 0.6 M TAPI-0, were used to
confirm that the fluorescence signal was due to the ADAM17 activity. Activity was
calculated as change in fluorescence per minute in each well, this is expressed as
fluorescence/minute for clarity. Results state per minute increase of fluorescence
signal as mean+/-SEM and stated in text. Each experiment was repeated with n=3
or 4 per treatment group. Figure 2-8 shows the data from 150 ng/ml LPS stimulated
RAW264.7 macrophages with or without 4.5 M GM6001 or 0.3 M TAPI-0.
Figure 2-8 ADAM17 activity in macrophages and the effect of GM6001 and TAPI-0
RAW264.7 macrophages were stimulated with 150 ng/ml LPS for 3 hours and TACE II
substrate was applied at 5 M with/without inhibitors for ADAM17, 4.5 M GM6001 or 0.3 M
TAPI-0. Control wells received DMSO and all wells had 0.15 % DMSO during assay.
Fluorescence signals were monitored in 10 minutes interval for 60 minutes and the rate of
change in fluorescence between 10 to 50 minutes was expressed as ADAM activity
(fluorescence/minute). The graph shows results from n=3 repeated experiments.
0
10000
20000
30000
40000
50000
Flu
ore
ce
nce
.min
-1
DMSO Veh.
GM6001 TAPI-0

Chapter 2 Material and method
84
2.2.17 Immune fluorescence imaging
RAW264.7 macrophages were plated at 1.3 x 10⁴ cells per 13 mm circular glass
coverslips. Macrophages were treated with 10 ng/ml LPS for up to 24 hours and
fixed by incubation with 4% paraformaldehyde in PBS for 5 minutes and washed
with PBS twice. The coverslips were blocked for one hour at room temperature on a
shaker with 10% goat serum and 4% BSA in PBS. For staining of BK, mouse
monoclonal anti-moue BK antibody, L6/60 (Millipore, UK), was used. RAW264.7
macrophage is a mouse cell line, and it was predicted that specific binding of Alex
Fluor® 488 anti-mouse IgG secondary antibody (Thermo Fisher Scientific, U.S.) to
the endogenous cellular like Ig molecules could result in high background. To avoid
this problem, 1.25 g/ml anti-mouse IgG was added to the block solution and
incubated for 2 hours prior to the primary antibodies to mask endogenous Ig. The
coverslip was washed twice with PBS. The coverslips were then incubated with
L6/60 diluted to 1 in 750 in 5% goat serum and 2% BSA in PBS at 4oC overnight.
The coverslips were washed twice for 5 minutes with PBS. Alex Fluor® 488 anti-
mouse IgG secondary antibody was used to conjugate fluorescence dye to the
primary antibody bind the cells. The secondary antibodies were diluted to 1 in 4000
in 5% goat serum and 2% BSA in PBS for 2 hours at room temperature. The
coverslips were washed for 5 minutes twice. To visualize nuclei of macrophages,
DAPI diluted 1 in 10000 in PBS, was applied for 5 minutes. The coverslips were
washed for 5 minutes twice. The coverslips were mounted on glass slides with
Vectashield (Vector Laboratories, U.S.). Fluorescence was visualized using a
confocal microscopy (Zeiss LSM510 Meta, Carl Zeiss, Germany). Coverslips without
primary antibody incubation were also prepared and the gain of microscope was
adjusted so that no fluorescence signal was seen in these secondary antibody only
control samples. This allowed to record the fluorescence signal due to the primary
antibody binding and not resulting from non-specific binding of the secondary
antibody to the cell to be recorded, 8. Images were taken from an area with 15-20
cells with the size indicated in the image. Experiments were repeated at least 3
times and resentative images are shown in figures.

Chapter 2 Material and method
85
Figure 2-9 Immunofluorescence imaging of macrophages
RAW264.7 macrophages were paraformaldehyde fixed and stained with antibodies (Ab) and
DAPI. Left panel shows a cell stained with anti-BK (L6/60) following incubation with a
secondary antibody and DAPI. The right panel shows a cell incubated with a secondary
antibody and DAPI without primary antibody staining. Scale bar: 5 m.
2.2.18 Statistical analysis
Statistical significance among treatment groups were tested using one-way ANOVA
and the significance between control group and treatment group was tested by
Dunnet’s test following one-way ANOVA. Alternatively paired t-test was performed
where there were only two groups. The name of test performed was indicated in
each figure legend. Graphpad Prism (Graphpad Software, U.S.) was used to
perform these tests. A p-value less than 0.05 was considered to be significant and
expressed as *p<0.05, **p<0.01 and ***p<0.001 in figures.
Value stated in the text is from one example from repeated experiments. Figures in
this thesis present both data from one experiment, which are quoted in text as well
as combined data from all repeated experiments. Comments were made in the end
of each result section to discuss these data from single experiment and aggregate
data. The number of biological replicates, blots or cells for each experiment (n) is
indicated in the figure legend.
Secondary Ab +DAPI
Primary Ab + Secondary Ab +DAPI

Chapter 3 TLR4 activation of macrophages
86
Chapter 3 How macrophages change TNF-, IL-6 and IL-6R
release during TLR4 activation?
3.1 Introduction
Inflammatory stimuli are recognised by receptors expressed on immune cells and
this recognition leads to the activation of inflammatory responses from the cell.
Activated immune cells release a variety of inflammatory mediators which have
important roles in controlling immune responses. Monocytes and macrophages are
known to be the major source of these mediators during inflammation.
The aim of this short chapter is to characterise cytokine release from macrophages
in response to TLR4 activation. Three proteins released from macrophages, TNF-,
IL-6 and IL-6Rwere studied. LPS, a classical TLR4 activator, was used to activate
macrophages at doses ranging from 3 to 1000 ng/ml. After 4 or 24 hours of LPS
treatment, the concentration of these proteins in culture media was analysed.
3.2 Results
Stimulation of macrophages with LPS, 1 to 100 ng/ml, increased the release of TNF-
in dose-dependent manner. The maximum TNF- release occurred with 100
ng/ml LPS and was 32.6+/-1.0 ng/ml at 4 hours and 41.7+/-3.0 ng/ml at 24 hours,
Figure 3-1 a and b. LPS stimulation also induced the release of IL-6 in dose
dependant manner at doses from 10 to 1000 ng/ml. The maximum IL-6 release
occurred at LPS dose of 1000 ng/ml with 0.63+/-0.02 ng/ml at 4 hours and 2.3+/-
0.08 ng/ml at 24 hours, Figure 3-2 a and b. IL-6Rwas constitutively released from
macrophages and was 66.4+/-3.9 pg/ml at 4 hours and 328+/-14.8 pg/ml at 24 hours,
Figure 3-3 a and b. LPS did not alter IL-6Rrelease from macrophages during the
first 4 hours of incubation and was 65.8+/-4.1 pg/ml with 100 ng/ml LPS, however
after 24 hours, LPS dose-dependently inhibited IL-6R release with the minimum IL-
6R release at 24 hours was occurring at 100 ng/ml LPS and was 104+/-10.3 pg/ml,
Figure 3-3 a and b. Additional increases in the dose of LPS had no further effect,
Figure 3-3 a and b. MTT assays indicated that LPS doses had no significant effect
on cell viability at either 4 hours or 24 hours, Figure 3-4 a and b. The combined
data, from repeated (≥ 3 times) experiments, for protein release and MTT was in line
with the described results from individual experiments. These combined data were
presented in Figure 3-1, 3-2, 3-3 and 3-4.

Chapter 3 TLR4 activation of macrophages
87
0
10
20
30
40
TN
F-
(ng/m
l)
30 100 3 10 300 1000 0
0
10
20
30
40
50
TN
F-
(ng/m
l)
100 1 10 1000 0
LPS (ng/ml)
LPS (ng/ml)
b
a

Chapter 3 TLR4 activation of macrophages
88
Figure 3-1 TNF- release from LPS activated macrophages
RAW264.7 macrophages were treated with 0-1000 ng/ml LPS for a) & c) 4 hours or b) & d)
24 hours. TNF- in conditioned was media measured by ELISA. Bars show mean+SEM
(n≥3). a) & b) shows result from one experiment with n=4. c) & d) show combined data from
3 experiments.
30 100 3 10 300 1000 0
100 1 10 1000 0
LPS (ng/ml)
LPS (ng/ml)
0
5
10
15
20
25
30
TN
F-
(ng/m
l)
1
0
10
20
30
40
50
TN
F-
(ng/m
l)
c
d
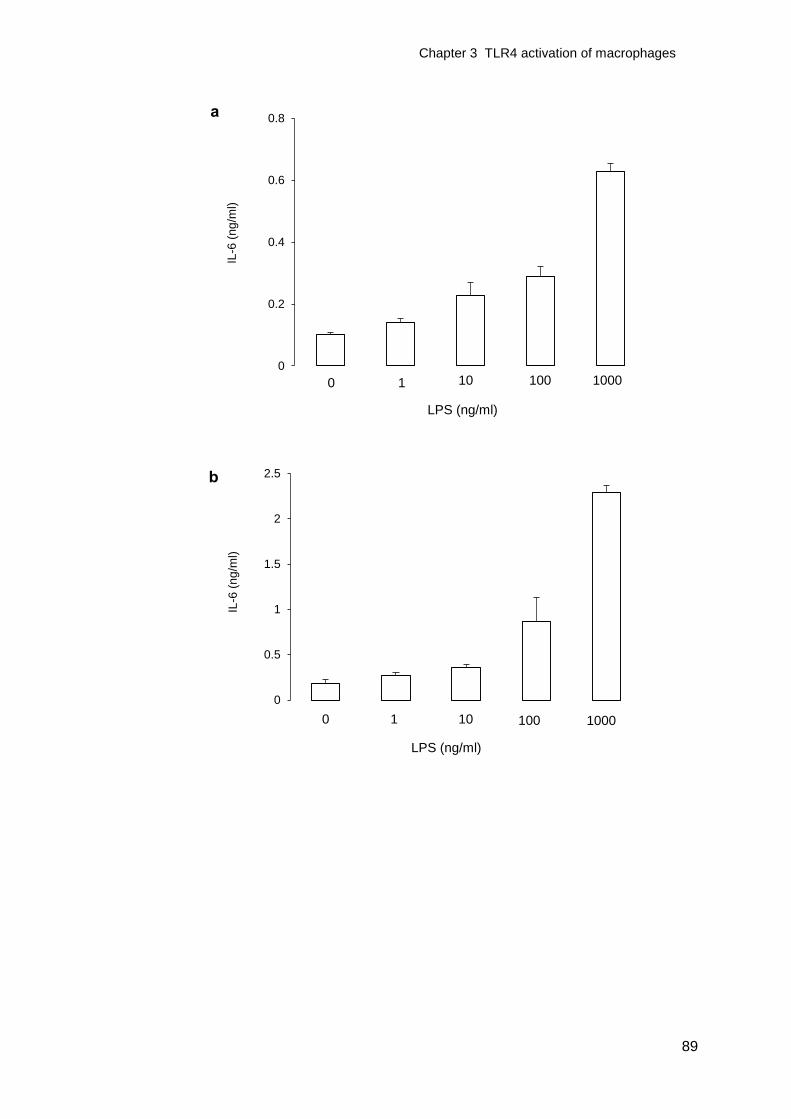
Chapter 3 TLR4 activation of macrophages
89
0
0.5
1
1.5
2
2.5
IL-6
(n
g/m
l)
100 1 10 1000 0
0
0.2
0.4
0.6
0.8
IL-6
(n
g/m
l)
100 1 10 1000 0
LPS (ng/ml)
LPS (ng/ml)
a
b

Chapter 3 TLR4 activation of macrophages
90
Figure 3-2 IL-6 release from LPS activated macrophages
RAW264.7 macrophages were treated with 0-1000 ng/ml LPS for a) & c) 4 hours or b) & d)
24 hours. IL-6 in conditioned was media measured by ELISA. Bars show mean+SEM (n≥3).
a) & b) shows result from one experiment with n=3. c) & d) show combined data from 3
experiments.
100 10 1000 0
100 1 10 1000
LPS (ng/ml)
LPS (ng/ml)
c
d
1
0
0
0.5
1
1.5
2
IL-6
(n
g/m
l)
0
0.2
0.4
0.6
0.8
1
IL-6
(ng
/ml)
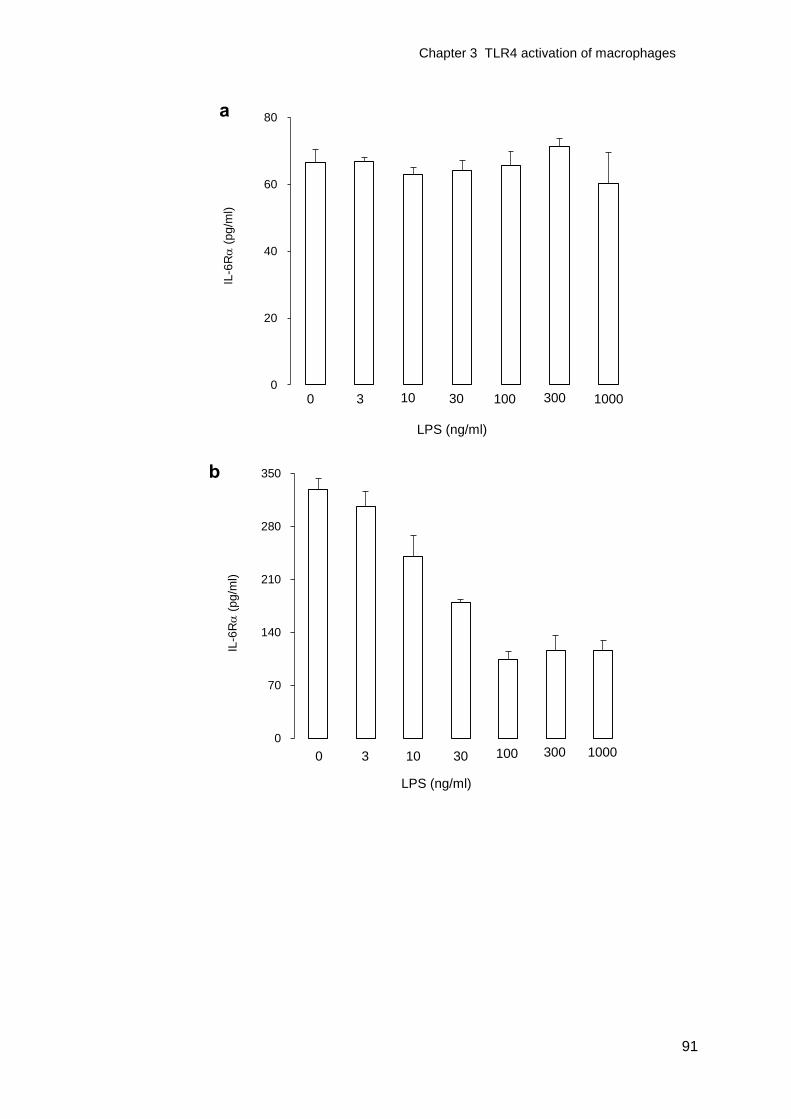
Chapter 3 TLR4 activation of macrophages
91
0
20
40
60
80
IL-6
R
(p
g/m
l)
30 100 3 10 300 1000 0
LPS (ng/ml)
0
70
140
210
280
350
IL-6
R
(p
g/m
l)
30 100 3 10 300 1000 0
LPS (ng/ml)
a
b

Chapter 3 TLR4 activation of macrophages
92
Figure 3-3 IL-6R release from LPS activated macrophages
RAW264.7 macrophages were treated with 0-1000 ng/ml LPS for a) & c) 4 hours or b) & d)
24 hours. IL-6R in conditioned was media measured by ELISA. Bars show mean+SEM
(n≥3). a) & b) shows result from one experiment with n=3. c) & d) show combined data from
3 experiments.
30 100 3 10 300 1000 0
LPS (ng/ml)
30 100 3 10 300 1000 0
LPS (ng/ml)
c
d
0
20
40
60
80
IL-6
R
(p
g/m
l)
0
100
200
300
400
IL-6
R
(p
g/m
l)
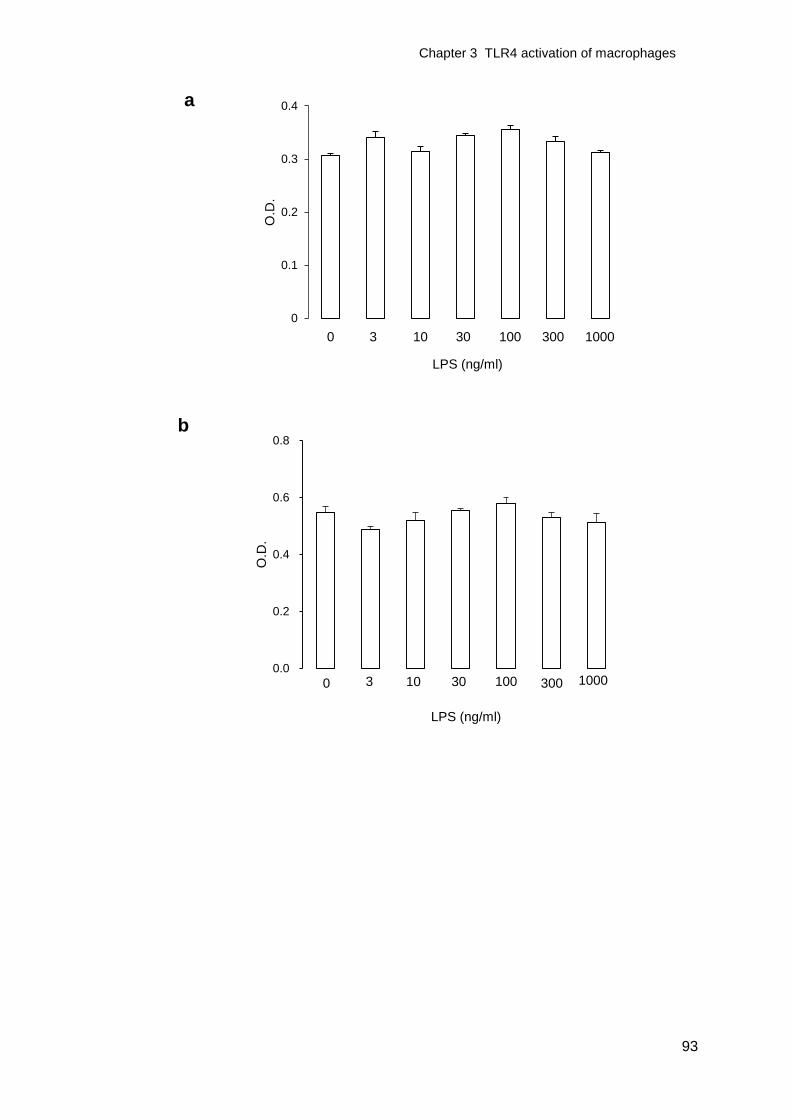
Chapter 3 TLR4 activation of macrophages
93
0
0.1
0.2
0.3
0.4
O.D
.
0.0
0.2
0.4
0.6
0.8
O.D
.
30 100 3 10 300 1000 0
30 100 3 10 300 1000 0
LPS (ng/ml)
LPS (ng/ml)
a
b

Chapter 3 TLR4 activation of macrophages
94
Figure 3-4 Effect of LPS treatment on macrophage cell viability
RAW264.7 macrophages were treated with 0-1000 ng/ml LPS for a) & c) 4 hours or b) & d)
24 hours. Cell viability was assessed by MTT. Bars show mean+SEM (n≥3). a) & b) show
the result from one experiment with n=4 and c) & d) show combined data from 3 experiments.
30 100 3 10 300 1000 0
LPS (ng/ml)
30 100 3 10 300 1000 0
LPS (ng/ml)
c
d
0
0.1
0.2
0.3
0.4
0.5
0.6
0.7
O.D
.
1
0
0.1
0.2
0.3
0.4
0.5
O.D
.
1

Chapter 3 TLR4 activation of macrophages
95
3.3 Discussion
Ligation of LPS to TLR4 initiates inflammatory signalling cascades via intercellular
adaptor proteins, MyD88 and/or TRIF, leading to the activation of transcription
factors and the initiation of gene transcription. The transcription factors activated
after LPS treatment include NF-B, AP-1 and IRFs (Kawai and Akira, 2006; Watters
et al., 2007). The activation of these transcription factors leads to the induction of
inflammatory molecules including TNF- and IL-6. RAW264.7 macrophages are
known to express TLR4 (He et al., 2016). In agreement with previous observations,
the results demonstrated that macrophages released increasing amounts of TNF-
and IL-6, upon the activation of TLR4.
TNF-is a potent pro-inflammatory cytokine and the elevated levels of this cytokine
are associated with much inflammatory pathology. TNF- binds to TNFR1 and
TNFR2 expressed on the plasma membrane of cells. Ligation of these TNF-
receptors ultimately causes the activation of NF-B which results in the activation of
further inflammation i.e. a positive feedback loop is established. TNF- also acts
directly on the hypothalamus, stimulates the release of corticotrophic releasing
hormone and induces fever (Aggarwal et al., 2012; Croft et al., 2013).
TNF- release was increased in a dose dependant manner up to 100 ng/ml LPS
and began to decrease above 100 ng/ml LPS in RAW264.7 macrophages. However
LPS did not affect the viability within the dose range, 1-1000 ng/ml, over 24 hours.
Therefore the reduction in TNF- release was unlikely to be due to the toxicity of
LPS but possibly by other mechanisms. It is known that there are negative
regulators of TNF- production. For example, IL-10 released from macrophages is
known to down-regulate the release of proinflammatory cytokines including TNF-.
Synaptotagmin XI (SytXI) is a specific inhibitor of TNF-. SytXI has been shown to
inhibit the fusion of TNF- with the plasma membrane therefore decreasing the
expression of the cytokine on the membrane. This, in turn, results in the decreased
release of TNF- from the cell (Duque et al., 2013). It is possible that the decrease
in TNF- release at high concentration of LPS which has been observed in this
section could be due to the activation of negative regulators rather than cell death.

Chapter 3 TLR4 activation of macrophages
96
IL-6 is known to exhibit both pro-inflammatory and anti-inflammatory effects. IL-6
signals through a receptor consisting of IL-6R in combination with gp130. IL-6R
can be found as both soluble and membrane bound form with IL-6 being able to bind
to either forms. The binding of IL-6 to either the soluble or membrane bound form of
the receptor can leads to the activation of distinct signalling pathways which exert
different biological responses. Signalling via soluble IL-6R, termed trans-signalling,
elicits pro-inflammatory effects such as the increase in fever and induction of acute
phase proteins. The trans-signalling is known to be important in the maintenance of
T cells by inhibiting apoptosis of T helper 17 cells and promoting the development of
regulatory T cells. Signalling via membrane bound IL-6R, is termed classical
signalling, and known to be regenerative, mediating tissue remodelling (Hunter and
Jones, 2015). IL-6 release from RAW264.7 macrophages continued to increase at
the highest dose of LPS, which differed from TNF- release. This phenomenon
suggested that TNF- and IL-6 have distinct mechanisms for controlling their
release the downstream of TLR4 activation.
A previous report using RAW264.7 macrophages showed that IL-6 and TNF- have
differing production kinetics on their release, due to the segregation of TNF- and
IL-6 into different vesicles (Manderson et al., 2007). The results in this chapter
supported this idea of different kinetic in the release of TNF- and IL-6. With 100
ng/ml LPS stimulation, the concentration of released TNF- in media at 4 hours was
32.6 ng/ml, and 41.7 ng/ml at 24 hours. This result showed that the first 4 hours of
activation accounts for 75% of total TNF- release over 24 hours. IL-6 level was
0.63 ng/ml at 4 hours and 2.3 ng/ml at 24 hours suggesting that 27% of total IL-6
release in 24 hours was occurred during the first 4 hours i.e. suggesting a linear
production of the cytokine over 24 hours. However, this analysis does not take into
account the possible breakdown of these cytokines in the culture. Although the
breakdown of cytokines has been poorly investigated, it is possible that TNF- may
have a faster decay rate than IL-6 in the system, although in this instance the decay
of TNF- would not be the same rate throughout the 24 hours.
It is known that IL-6R, a receptor for IL-6, is constantly released from macrophages
and found at nM level in normal human serum (Jones et al., 2001). In line with this,
culture media from resting RAW264.7 macrophages contained IL-6R. However,
Chapter 3 TLR4 activation of macrophages
97
LPS treatment appeared to inhibit the release of IL-6R at 24 hours in dose
dependant manner and this inhibition in IL-6R release by LPS appeared at only
later time point at 24 hours. It must be noted that there are few studies which
characterized the release of IL-6R in macrophages. One possible explanation for
the observed reduction in IL-6Rrelease at later time point could be due to the
binding of IL-6 to the IL-6R, which sharply increased after 24 hours of LPS
stimulation. In this scenario the IL-6/IL-6R complex could not recognised by ELISA.
This was tested in the laboratory and found that the addition of 3 ng/ml IL-6 only
reduces the measurement in pg/ml range for IL-6R by 5%. Therefore the
interference with IL-6 was not likely to be the cause of the reduction in IL-
6Rmeasurement, but suggests this reduction may be due to another biological
effect. The control of IL-6 trans-signalling is of great interest in the treatment of
autoimmune diseases and it is important to investigate further.
This chapter characterised the release of TNF-, IL-6 and IL-6R from RAW264.7
macrophages during TLR4 activation. Next chapter investigated the BK channel
expression in RAW264.7 macrophages.
Chapter 4 BK channels in macrophages
98
Chapter 4 Do macrophages express BK channels and does
TLR4 activation affect the channel expression?
4.1 Introduction
The aim of this chapter is to characterise the expression of BK channels in
RAW264.7 macrophages. The expression, sub-cellular location of BK channels, the
expression level and functionality were studied using immunofluorescence imaging,
Western blot analysis and electrophysiological recordings. Macrophages are known
to be plastic in nature with immune stimuli dramatically alter their phenotypes
(Mosser and Edwards, 2008). It was hypothesised that immune activation may alter
the expression of ion channels in macrophages. The BK channel expression was
therefore characterised in LPS activated macrophages as well as in resting
macrophages.
4.2 Results
4.2.1 BK channel expression in resting macrophages
Western blot analysis
Two antibodies against mouse BK subunit, a rabbit polyclonal antibody, APC-107,
and mouse monoclonal antibody, L6/60, were used in Western blot analysis of BK
in RAW264.7 macrophages. Both antibodies are designed to bind to the C-terminal
region of BK. Both primary antibodies detected the presence of protein bands at
approximately 120 kDa in whole cell lysate from resting RAW264.7 macrophages,
Figure 4-1 and Figure 4-2. Using the L6/60 antibody resulted in the appearance of
doublet bands at 110 to 120 kDa, Figure 4-2. Protein bands at approximately
120kDa also appeared in rat brain lysates, Figure 4-2. For both APC-107 and L6/60
protein bands appeared at 100, 80, 60, 46, 32, and 25 kDa in whole cell lysates of
RAW264.7 macrophages. However the lower band intensity appeared less than the
band at 120 kDa when L6/60 was used. APC-107 gave less clear cut discrimination
in signal intensities between the higher and lower molecular weight band, Figure 4-1
and Figure 4-2. In rat brain lysate, major bands appeared between 120-140 kDa.
Lower protein bands at 110, 80, 45, 32 and 25 kDa were also appeared against both
APC-107 and L6/60, Figure 4-1 and Figure 4-2.

Chapter 4 BK channels in macrophages
99
When APC-107 was removed and the anti-rabbit IgG HRP-linked secondary
antibody was applied on the membrane alone, most of the protein bands
disappeared, although some faint bands could still be seen, Figure 4-1. When L6/60
was removed and anti-mouse IgG HRP-linked secondary antibody was applied
alone, doublet bands between 110 to 120 kDa disappeared, Figure 4-2. Due to the
specificity of L6/60 antibody for the 120 kDa band, which is predicted to be the
complete BK subunit, it was decided to use L6/60 to characterise BK expression
in following experiments.
Figure 4-1 BK expression in resting macrophages using a rabbit polyclonal
anti-mouse BK antibody, APC-107
BKexpression in the whole cell lysate of resting RAW264.7 macrophages (left) and rat
brain (right) was analysed by Western blot using APC-107. No primary blot was made by
omitting the primary antibody. Molecular marker in kDa is indicated in far left. 10 g protein
was loaded each lane. The experiment was repeated twice.
80
130
58
46
100
32
25
Rat brain RAW264.7
APC-107 No primary APC-107 No primary

Chapter 4 BK channels in macrophages
100
Figure 4-2 BK expression in resting macrophages using a mouse
monoclonal anti-mouse BKantibody, L6/60
BKexpression in whole cell lysate of resting RAW264.7 macrophages (left) and rat brain
(right) was analysed by Western blot using L6/60. No primary blot was made by omitting the
primary antibody. Molecular marker in kDa is indicated in far left. 10 g protein was loaded
each lane. The experiment was repeated 5 times.
Immunolocalisation
The subcellular location of BK channels in resting RAW264.7 macrophages was
analysed by immunofluorescence imaging techniques. BK in the cells was
analysed using L6/60. DAPI staining displayed nuclei in resting RAW264.7 cells,
and positive staining for BK were found in the nucleus, nuclear membrane and
cytoplasm in resting macrophages, Figure 4-3. The plasma membrane appeared to
be relatively free of BK protein with only faint diffuse staining was seen, Figure 4-3.
BK was found to be associated with the nuclei BK in approximately 90% of resting
macrophages, Figure 4-3.
80
130
58
46
100
32
25
L6/60 L6/60
Rat brain RAW264.7
No primary No primary

Chapter 4 BK channels in macrophages
101
Figure 4-3 Localisation of BK in resting macrophages
Resting RAW264.7 macrophages were paraformaldehyde fixed and stained for with DAPI
(blue) and anti-BKwith L6/60 (green); merged DAPI+L6/60 and control in which there was
no primary antibody but DAPI was present. a) single cell images (n=4, n: the number of
cells) or b) area (n=11). Scale bar, 5m. The experiment was repeated 4 times and images
shown are representative. Pictures are taken from area containing approximately 15 cells.
No primary Merged DAPI Anti-BK a
b

Chapter 4 BK channels in macrophages
102
Nuclei isolation
Nuclei from resting macrophages were isolated and analysed for BK expression by
Western blot. The blot indicated bands at 120 kDa and 80 kDa using L6/60 in
samples of whole cell lysate and nuclei isolate. The protein band at 80 kDa in nuclei
isolate appeared stronger than whole cell lysate, Figure 4-4.
Figure 4-4 BK expression in nuclei isolate of resting macrophages
BK expression in nuclei (N) and whole cell (WC) lysates from resting RAW264.7
macrophages. 10 g protein was loaded each lane. Left shows molecular weight marker in
kDa. The experiment was repeated 3 times.
80
175
56
46
N WC
L6/60
100
130

Chapter 4 BK channels in macrophages
103
4.2.2 BK channels in TLR4 activated macrophages
In order to investigate if TLR4 activation changes the BK channel expression,
macrophages were stimulated with LPS for up to 24 hours and the expression of
BK was analysed. In preliminary experiments, LPS was applied at the maximal
dose, 150 ng/ml, however this resulted in a significant increase in membrane
dynamics, see 4.2.3. Therefore 10 ng/ml LPS was selected to use to investigate the
effect of TLR4 activation on the channel expression. This does of LPS, 10 ng/ml,
had been shown to increase TNF- and IL-6 release and decrease the release of IL-
6R from RAW264.7 macrophages at 24 hours in chapter 3.
Immunolocalisation
In immunolocalisation studies, the major effect of stimulating RAW264.7
macrophage with LPS was the appearance of clusters of positive staining on some
parts of the cell plasma membrane at 18 hours and 24 hours, the lack of DAPI
staining at these clusters suggest it was not nuclei material. However the intensity of
nuclei staining appeared to decrease after 24 hours of LPS treatment, while the
proportion of cells showing nuclei staining remained approximately the same (83%;
10/12), Figure 4-5 and Figure 4-6.

Chapter 4 BK channels in macrophages
104
Figure 4-5 Localisation of BK in LPS activated macrophages
RAW264.7 macrophages were activated with 10 ng/ml LPS and at indicated times cells were
paraformaldehyde fixed and stained for nuclei with DAPI (blue) and anti-BKwith L6/60
(green); merged DAPI+L6/60 and control in which there was no primary antibody but DAPI
was present. Scale bar, 5m. Arrows indicate BK staining on the plasma membrane. The
experiment was repeated 3 times.
No primary
0 hrs
DAPI
6 hrs
Merged Anti-BK
12 hrs
18 hrs
24 hrs
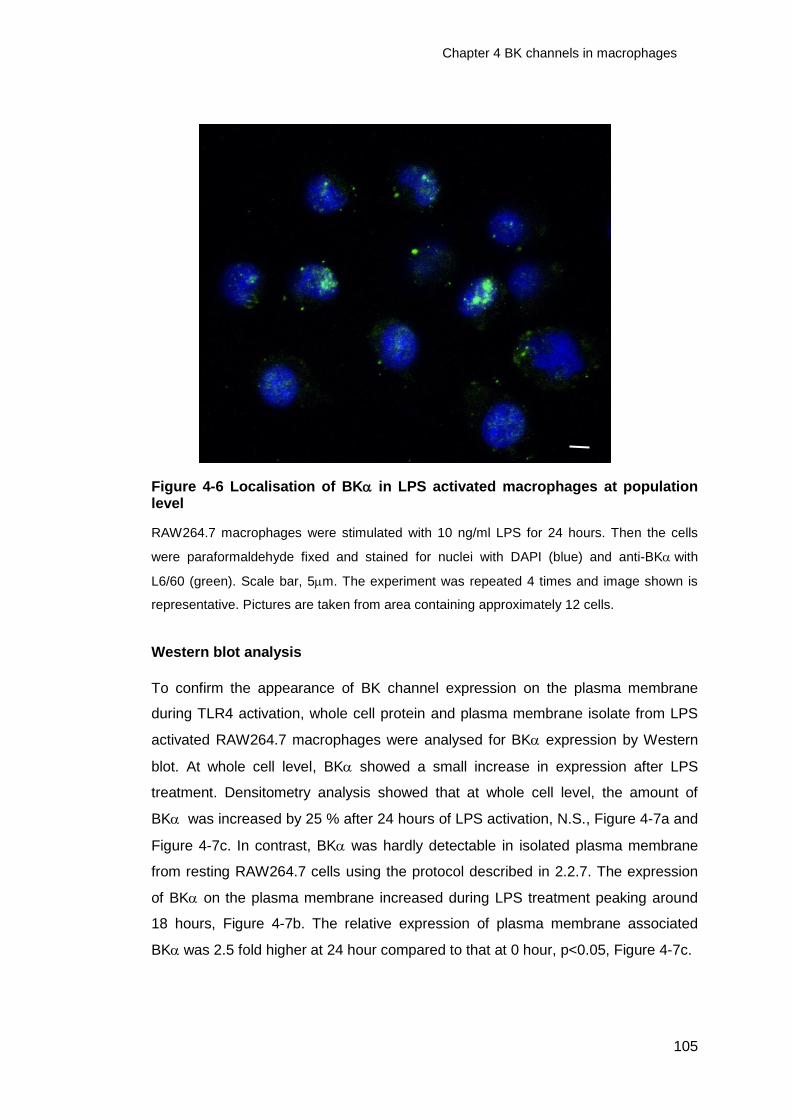
Chapter 4 BK channels in macrophages
105
Figure 4-6 Localisation of BK in LPS activated macrophages at population level
RAW264.7 macrophages were stimulated with 10 ng/ml LPS for 24 hours. Then the cells
were paraformaldehyde fixed and stained for nuclei with DAPI (blue) and anti-BKwith
L6/60 (green). Scale bar, 5m. The experiment was repeated 4 times and image shown is
representative. Pictures are taken from area containing approximately 12 cells.
Western blot analysis
To confirm the appearance of BK channel expression on the plasma membrane
during TLR4 activation, whole cell protein and plasma membrane isolate from LPS
activated RAW264.7 macrophages were analysed for BK expression by Western
blot. At whole cell level, BK showed a small increase in expression after LPS
treatment. Densitometry analysis showed that at whole cell level, the amount of
BK was increased by 25 % after 24 hours of LPS activation, N.S., Figure 4-7a and
Figure 4-7c. In contrast, BK was hardly detectable in isolated plasma membrane
from resting RAW264.7 cells using the protocol described in 2.2.7. The expression
of BK on the plasma membrane increased during LPS treatment peaking around
18 hours, Figure 4-7b. The relative expression of plasma membrane associated
BKwas 2.5 fold higher at 24 hour compared to that at 0 hour, p<0.05, Figure 4-7c.
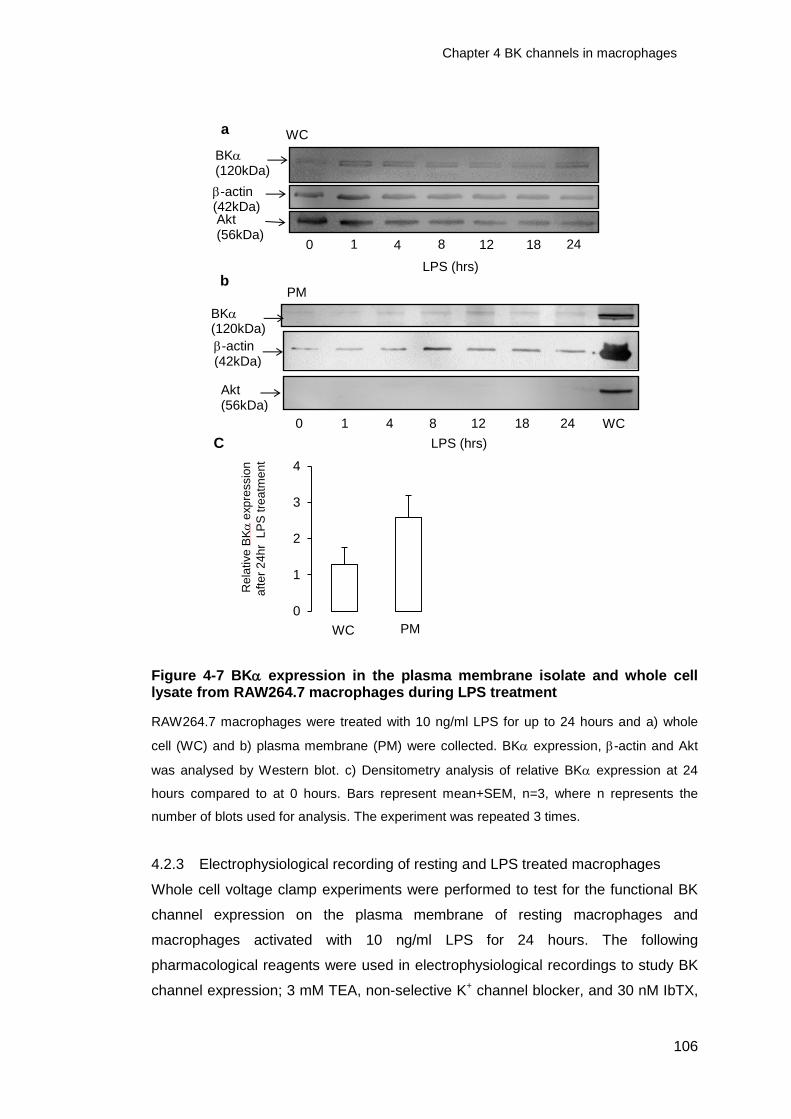
Chapter 4 BK channels in macrophages
106
Figure 4-7 BK expression in the plasma membrane isolate and whole cell lysate from RAW264.7 macrophages during LPS treatment
RAW264.7 macrophages were treated with 10 ng/ml LPS for up to 24 hours and a) whole
cell (WC) and b) plasma membrane (PM) were collected. BK expression, -actin and Akt
was analysed by Western blot. c) Densitometry analysis of relative BK expression at 24
hours compared to at 0 hours. Bars represent mean+SEM, n=3, where n represents the
number of blots used for analysis. The experiment was repeated 3 times.
4.2.3 Electrophysiological recording of resting and LPS treated macrophages
Whole cell voltage clamp experiments were performed to test for the functional BK
channel expression on the plasma membrane of resting macrophages and
macrophages activated with 10 ng/ml LPS for 24 hours. The following
pharmacological reagents were used in electrophysiological recordings to study BK
channel expression; 3 mM TEA, non-selective K+ channel blocker, and 30 nM IbTX,
WC
0 1 4 8 12 18 24
BK (120kDa)
-actin (42kDa) Akt (56kDa)
-actin (42kDa)
0 1 4 8 12 18 24 WC
Akt (56kDa)
PM
0
1
2
3
4
Rela
tive
BK
exp
ressio
n
aft
er
24
hr
LP
S tre
atm
en
t
WC PM
LPS (hrs)
LPS (hrs)
BK (120kDa)
a
b
C

Chapter 4 BK channels in macrophages
107
a BK channel selective inhibitor. Both reagents were applied in extracellular
solutions for the justification of doses, see 4.3.
As mentioned in section 4.2.2, LPS was initially applied at the maximal dose at 150
ng/ml, however, at this maximal dose of LPS, macrophages were highly activated
and became very difficult to make recordings from. This was due to an inability to
make a stable seal with the electrode possibly because of the change in the
membrane property. Therefore the submaximal dose of LPS was selected. Even
after lowering LPS doses, it was to complete the cycle of drug treatments in
macrophages and this limited the number of cells recorded in this thesis.
During the first series of experiments, the membrane properties of macrophages,
probably the presence of pseudopodia prevented the formation of seal. To
overcome this problem, a gentle air pressure applied into pipette using 1ml syringe
when approaching cells. This is to repeal these pseudopodia and make relatively
clean surface. This improved the formation of seal in the subsequent experiments.
Initially pipette solutions were prepared with 640 nM free Ca2+ in K+-gluconate based
solution, however, it was found that it was found difficult to determine free K+ ions in
the solution and this interfered with the data analysis. It was also suggested to
increase the concentration of free Ca2+ for the activation of the channel. Therefore
the pipette solution was changed to K+-acetate based pipette solution, see Table 2-2,
with 1.6 M. free Ca2+. Pipettes with various resistances from 2 to 4.5 MΩ were
tested in RAW264.7 macrophages and it was decided to use pipette with the
resistance between 3.5 and 4 MΩ.
3 mM TEA did not affect the whole cell current during voltage clamp (-100 mV to 40
mV, duration 10 s, Figure 2-5) in the majority of resting macrophages. In separate
experiments, only 8.7% of resting macrophages had a K+ current which was
sensitive to 30 nM IbTX. After 24 hours of LPS treatment, the proportion of cells
expressing TEA sensitive current increased. Importantly 30 nM IbTX blocked K+
current in 41.5% macrophages. The 0 current potential of the I-V plot indicated both
TEA and IbTX sensitive currents were carried via K+ ions, Figure 4-8 and Figure 4-9.

Chapter 4 BK channels in macrophages
108
Figure 4-8 I-V plot of whole cell TEA-sensitive current in macrophages
Representative traces of TEA-sensitive current obtained by whole cell recordings from
resting RAW264.7 macrophage or RAW264.7 macrophage stimulated for 24 hours with 10
ng/ml LPS. Voltage ramp (-100 mV to +40 mV, duration 10 s) was applied in presence or
absence of 3 mM TEA in the extracellular solution. Representative graphs of TEA-sensitive
current. The ramp protocol was run in individual cells at least 6 times per drug treatment and
these traces were averaged. Sensitive currents were obtained by subtraction of traces with
drug treatment from control traces and plotted against membrane voltage.
-50
0
50
100
-100 -50 0
mV
TEA-sensitive current
pA
-50
0
50
100
-100 -50 0
TEA-sensitive current mV
pA

Chapter 4 BK channels in macrophages
109
Figure 4-9 I-V plot for whole cell IbTX sensitive current in macrophages
Representative traces of IbTX-sensitive current obtained by whole cell recordings from
resting RAW264.7 macrophages or RAW264.7 macrophages treated for 24 hours with 10
ng/ml LPS. Voltage ramp (-100 mV to +40 mV, duration 10 s) was applied in presence or
absence of 30 nM IbTX in the extracellular solution. Representative graphs of IbTX-sensitive
current. The ramp protocol was run in individual cells at least 6 times per drug treatment and
these traces were averaged. Sensitive currents were obtained by subtraction of traces with
drug treatment from control traces and plotted against membrane voltage.
-100
0
100
200
-100 -50
-100
0
100
200
-100 -50 0
mV
mV
pA
pA
IbTX-sensitive current
IbTX-sensitive current

Chapter 4 BK channels in macrophages
110
LPS treatment BK current present Resting potential
Current amplitude of
BK current at
0 mV
none 8.7%(2/23) -60 to -50 mV (11 cells)
-30 to -40 mV ( 7 cells)
0 to +10 mV ( 4 cells)
50 to 100 pA ( 1 cell)
150 to 200 pA (1 cell)
24 hrs 41.2% (7/17) -60 to -50 mV ( 9 cells)
-30 to -40 mV (4 cells)
0 to +10 mV ( 4 cells)
50 to 100 pA (2 cells)
100 to 150 pA (2 cells)
150 to 200 pA (3 cells)
Table 4-1 Summery of whole cell recordings in resting and LPS treated RAW264.7 macrophages
RAW264.7 macrophages received no treatment or received 10 ng/ml LPS for 24 hours prior
to patch-clamp experiments. The percentage and the number of cells which expressed 30
nM IbTX-sensitive whole cell K+ current /the total numbers of cells recorded are described.

Chapter 4 BK channels in macrophages
111
4.3 Discussion
BK channels are expressed in various cellular locations including the plasma
membrane, mitochondrial membrane and nuclear membrane. These channels are
known to have location specific roles in cell biology (Xu et al., 2002; Hoshi et al.,
2013; Li et al., 2014; Balderas et al., 2015). In addition, the gating properties of the
BK channel are altered by tissue specific expression of accessory - and/or -
subunits or BK gene splicing (Yan & Aldrich, 2010; Orio, et al., 2002).
Endogenous molecules, such as proton, Heme, carbon monoxide and arachidonic
acid also affect activation states of the channels (Hou, et al., 2009). Due to the
variations in the localisation and differing opening properties of the BK channel, their
expression pattern must be carefully examined before studying their biological roles.
The aim of this chapter was to characterise the expression of BK channel in resting
and TLR4 activated RAW264.7 macrophages. This was investigated using three
different techniques. Immunofluorescence imaging was used to visualise the
subcellular location of BK protein. Western blot analysis of the cellular fractions
semi-quantified the BK expression levels, indicated any possible splice variants
and also confirmed the pattern of the cellular localisation observed in the
immunofluorescence staining. Because of the various forms of post-translational
regulation of the ion channels (Kyle and Braun, 2014), the mere existence of
channel protein does not confirm that the channel is functional as an ion channel.
Therefore, the whole cell voltage clamp experiment was performed to test the
expression of the plasma membrane located channels.
In electrophysiological recordings, the assessment of the channel expression was
mainly determined by its pharmacological properties. Two types of K+ channel
blockers were used, TEA and IbTX. TEA blocks most types of K+ channels from
both sides of lipid bilayer membranes in a voltage dependent manner and is known
to exhibit higher affinity for BK channels compared to other types of K+ channels (Yu
et al., 2016). IbTX is a peptide toxin of 37 amino acid in length and is highly
selective for BK channel. This toxin is membrane impermeable and blocks the
channel pore from the outside. This drug is selective for BK channels located on the
plasma membrane at concentrations at 100 nM and below (Galvez, et al., 1990).

Chapter 4 BK channels in macrophages
112
The results from immunofluorescence imaging and Western blot analysis of cellular
fractions consistently indicated the presence of BK protein in resting RAW264.7
macrophages. Immunofluorescence images showed that BK was predominantly
associated with the nucleus and its surrounding region of cytoplasm. The BK
positive staining was hardly detectable on the plasma membrane in resting
macrophages. This expression pattern was confirmed by Western blot analysis of
the cellular fraction of the plasma membrane and nuclei. The expression of BK
channels on nuclear membrane has been reported in neurons (Li et al., 2014),
however, this is the first time the expression of nuclear BK channels in macrophages
has been reported to my knowledge. Consistent with the biochemical analysis, the
electrophysiological recordings with TEA and IbTX also showed that few resting
macrophages express functional BK channels on the plasma membrane.
However, there was a noticeable change in the expression of plasma membrane BK
channel during LPS activation. BK positive staining of distinct areas of the plasma
membrane was observed in the immunofluorescence image between 18-24 hours of
LPS stimulation. BK staining pattern on the plasma membrane of macrophages
resembled the channel clustering, which has been reported in central principal
neurons of rats and mice (Kaufmann et al., 2010). Western blot analysis also
showed an increased expression of BK protein in the plasma membrane isolate
after LPS activation, with the relative expression at 24 hours was 2.5 fold higher
than that of resting macrophages. An increase BK expression was also observed
at whole cell level; however, the magnitude of increase was 25%, which was 10
times smaller than that seen for the plasma membrane.
It was noted by a number of experienced electrophysiologists in the department that
RAW264.7 macrophages were a particularly difficult cell to path-clamp. First, it was
difficult to form GΩ seals. This may be due to the fact that the plasma membrane of
macrophages is comparatively dynamic in nature. This property is important in the
process of phagocytosis, however may have resulted in the difficulty in forming
stable seal between the electrode and the membrane. Secondly the tip of electrode
was often blocked by fine pseudopodia on macrophages. On the other hand, it was
required to use a thin walled grass electrode in order to achieve effective dilation of
cytoplasm, however this may have increased a chance of pseudopodia to slip into
Chapter 4 BK channels in macrophages
113
the electrode. This condition was slightly improved by applying gentle air pressure to
the pipette electrode when approaching a cell, to repeal the uneven structure of
macrophage membrane such as pseudopodia. Even though, the percentage of cells,
which completed the recording cycle, composed of approximately 20 ramps, was
estimated to be approximately 3% of the total cells attempted. This highlights
possible sampling problems when conducting electrophysiological studies of
macrophages and their phenotypes. This problem became even more evident in
LPS stimulated cells. The activation of cells is known to alter the cell surface
molecule expression and membrane properties. It is possible that the plasma
membrane of macrophages became more fluid and dynamic after TLR4 activation. It
would be important to develop technique to achieve stable recordings in these cells.
Possible experiments would be resting the cells in normal culture media for 1 hour
after LPS activation to make them less active before carrying out recordings. It was
also noticed that the cells which succeeded to record tended to share morphological
characteristics. The macrophages existed in many shapes including spindly shape
or round shape with various sizes. In this thesis, it was noticed that the recordings of
macrophages with round shape were relatively successful compared to the cells
with spindly shape. However as macrophages are heterogenic, the interpretation
could be limited to these particular population. Again it would be important to
develop techniques to consistently record these cells.
While technically challenging electrophysiological recordings did provide some
evidence that the BK channel was upregulated on the plasma membrane in
activated macrophages. The population of cells with TEA sensitive K+ channel
increased among macrophages treated with LPS for 24 hours. In line with this, the
number of macrophages, which expressed IbTX sensitive K+ current, increased 5
fold in LPS treated macrophages. Taken together, these results indicated that LPS
activation led to an increase in the expression of functional BK channels on the cell
surface in RAW264.7 macrophages. However it is important to note that not all
macrophages upregulated BK channels on the plasma membrane during LPS
activation. The upregulation of K+ channels during immune cell activation has been
observed in previous studies, suggesting a positive correlation between the immune
cell activation and K+ channel expression. The expression of Kir currents was
reported to increase after Phorbol 12-myristate 13-acetate (PMA) treatment in a
mouse macrophage cell line J774.1 (Gallin and Sheehy, 1985) and mouse bone
Chapter 4 BK channels in macrophages
114
marrow derived macrophages have been shown to induce the expression of Kv1 type
channel subunits after treatment with TNF-(Vicente et al., 2005).
Using two different BK antibodies a protein band was detected in RAW264.7
macrophages at 120 kDa. This is close to the predicted molecule weight for mouse
BK protein of 130 kDa. However, it is important to note that studies often report the
BK being detected as a 120 kDa by Western blot analysis. When whole cell lysate
is analysed, 120 kDa protein bands were observed as doublets in RAW264.7
macrophages. This doublet has been reported when using anti-BK antibodies with
rat brain tissue (Misonou et al., 2006). However when plasma membrane isolates
are analysed, the 120 kDa band is appeared in single band. It is possible that the
doublet may result from various modifications of the channel, including mRNA
splicing and glycosylation (Kyle and Braun, 2014). The absence of double band but
repeated appearance of signal band in plasma membrane isolate could lead to
assume that such modification occurs at different rate depending on channel cellular
location. Further analysis with different cellular fractions may help to investigate the
reason for doublet in whole cells and absence in plasma membrane isolate.
Additional protein bands also appeared at smaller sizes, 110, 80, 60, 46, 32 and 25
kDa when using L6/60. Blots were the primary antibody was omitted indicated that
these bands were likely due to non-specific binding of the secondary antibody.
However, it cannot be totally exclude that a smaller sized BK protein, possibly
spliced variant, exists in the cell. To test this BK mRNA expression could be
analysed. When APC-107 was used bands at smaller sizes 60, 46, 32 and 25 kDa
were also detected. Again removal of the primary antibody could not totally exclude
the possibility that these where specific lower molecular weight BK protein. Lower
weights of BK proteins have been reported in previous research. It is proposed that
proteolysis of the C-terminal region of BKoccurs during the process of sample
preparations and resulted in smaller fragments of 55 kDa and 25 kDa BK (Knaus,
et al., 1995) by a methodological effect. It is possible that this phenomenon occurred
during the process of sample preparation in this thesis. However it is possible to say
that both antibodies recognised a protein band at 120 kDa which appeared to be the
regular form of the BK protein.

Chapter 4 BK channels in macrophages
115
It has been well appreciated that the co-expression of accessory subunits can alter
the voltage dependence and Ca2+ sensitivity of BK channels (Hoshi, et al., 2013). In
this study, the electrophysiological studies were limited to their pharmacological
properties in RAW264.7 macrophages at whole cell level. I-V relation of the IbTX
sensitive currents from macrophages described shallower I-V relationship, indicating
the possibility that the BK channels on macrophages may have less voltage
dependency compared to other cells. However this needs further investigation. It
will be interesting to address the subunit expression in these cells by molecular and
biochemical analysis and to characterise the electrophysiological properties of the
channels in macrophages at the single channel level in the future.
In conclusion, BK channels are present in RAW264.7 macrophages. In the resting
macrophages the channel are predominantly intracellular but sparse on the cell
surface. TLR4 activation by LPS led to the upregulation of functional BK channels
on the plasma membrane of these cells. In next chapter, the involvement of these
plasma membrane located BK channels in the release of cytokine and cytokine
receptors from TLR4 activated macrophages were studied.
Chapter 5 Effect of BK channel blockers
116
Chapter 5 Does the plasma membrane BK channel have a
role in TNF-, IL-6 or IL-6Rrelease from
macrophages?
5.1 Introduction
Chapter 4 demonstrated that RAW264.7 macrophages express BK channels. In the
resting condition or early time point of LPS activation, these channels are
predominantly associated with intracellular sites with functional BK channels
appearing sparse on the plasma membrane. However LPS treatment over 24 hours
led to the appearance of the channels on the plasma membrane.
Functional BK channels have been described in different subcellular locations,
including the mitochondrial membrane, nuclear membrane and plasma membrane
and these studies have suggested the location specific roles for the channel (Xu et
al., 2002; Singh et al., 2012; Hoshi et al., 2013; Li et al., 2014). The aim of this
chapter was to investigate whether the plasma membrane expressed BK channels
are involved in the release of TNF-, IL-6 and IL-6R. These molecules were
selected as they have been shown to be involved in the pathogenesis of a number
of diseases, see chapter 1 and are current therapeutic targets for chronic
inflammatory diseases.
First, the effect of BK channel blocking drugs, IbTX and paxilline on the release of
these proteins from macrophages was investigated at a time when the expression of
plasma membrane BK channels appeared low. This was done by applying these
drugs on resting macrophages or during at the early time points, 0 to 4 hours of LPS
stimulation. Second, the involvement of the plasma membrane BK channels in the
release of these proteins was studied. This was done by treating macrophages with
a low level of LPS for 24 hours prior to simulating with a higher dose of LPS. This
protocol allows the investigation of the effect of BK channel blocking drugs on
macrophage activation when the plasma membrane form of the BK channel is
present.
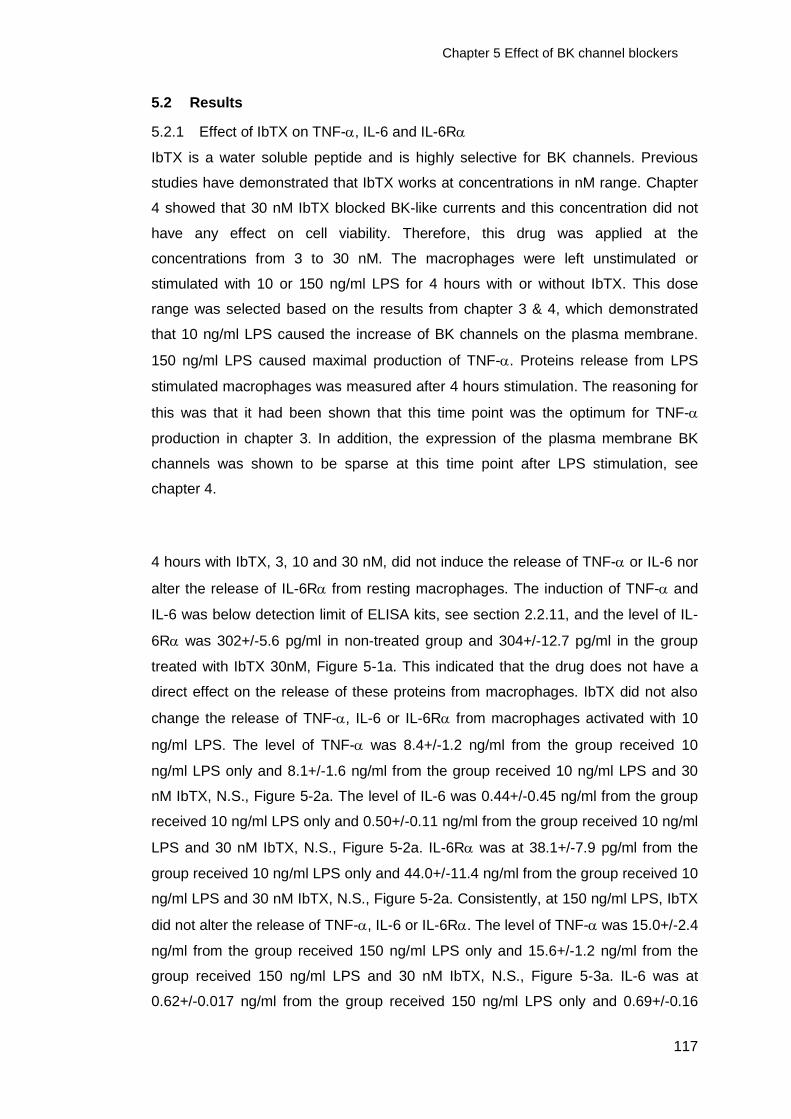
Chapter 5 Effect of BK channel blockers
117
5.2 Results
5.2.1 Effect of IbTX on TNF-, IL-6 and IL-6R
IbTX is a water soluble peptide and is highly selective for BK channels. Previous
studies have demonstrated that IbTX works at concentrations in nM range. Chapter
4 showed that 30 nM IbTX blocked BK-like currents and this concentration did not
have any effect on cell viability. Therefore, this drug was applied at the
concentrations from 3 to 30 nM. The macrophages were left unstimulated or
stimulated with 10 or 150 ng/ml LPS for 4 hours with or without IbTX. This dose
range was selected based on the results from chapter 3 & 4, which demonstrated
that 10 ng/ml LPS caused the increase of BK channels on the plasma membrane.
150 ng/ml LPS caused maximal production of TNF-. Proteins release from LPS
stimulated macrophages was measured after 4 hours stimulation. The reasoning for
this was that it had been shown that this time point was the optimum for TNF-
production in chapter 3. In addition, the expression of the plasma membrane BK
channels was shown to be sparse at this time point after LPS stimulation, see
chapter 4.
4 hours with IbTX, 3, 10 and 30 nM, did not induce the release of TNF- or IL-6 nor
alter the release of IL-6R from resting macrophages. The induction of TNF- and
IL-6 was below detection limit of ELISA kits, see section 2.2.11, and the level of IL-
6R was 302+/-5.6 pg/ml in non-treated group and 304+/-12.7 pg/ml in the group
treated with IbTX 30nM, Figure 5-1a. This indicated that the drug does not have a
direct effect on the release of these proteins from macrophages. IbTX did not also
change the release of TNF-, IL-6 or IL-6R from macrophages activated with 10
ng/ml LPS. The level of TNF- was 8.4+/-1.2 ng/ml from the group received 10
ng/ml LPS only and 8.1+/-1.6 ng/ml from the group received 10 ng/ml LPS and 30
nM IbTX, N.S., Figure 5-2a. The level of IL-6 was 0.44+/-0.45 ng/ml from the group
received 10 ng/ml LPS only and 0.50+/-0.11 ng/ml from the group received 10 ng/ml
LPS and 30 nM IbTX, N.S., Figure 5-2a. IL-6R was at 38.1+/-7.9 pg/ml from the
group received 10 ng/ml LPS only and 44.0+/-11.4 ng/ml from the group received 10
ng/ml LPS and 30 nM IbTX, N.S., Figure 5-2a. Consistently, at 150 ng/ml LPS, IbTX
did not alter the release of TNF-, IL-6 or IL-6R. The level of TNF- was 15.0+/-2.4
ng/ml from the group received 150 ng/ml LPS only and 15.6+/-1.2 ng/ml from the
group received 150 ng/ml LPS and 30 nM IbTX, N.S., Figure 5-3a. IL-6 was at
0.62+/-0.017 ng/ml from the group received 150 ng/ml LPS only and 0.69+/-0.16

Chapter 5 Effect of BK channel blockers
118
ng/ml from the group received 150 ng/ml LPS and 30 nM IbTX, N.S., Figure 5-3a.
IL-6R was 32.9+/-5.7 pg/ml from the group received 150 ng/ml LPS only and
33.6+/-5.1 pg/ml from the group received 150 ng/ml LPS and 30 nM IbTX, N.S.,
Figure 5-3a. MTT assay indicated no effect on cell viability when it was applied
alone or with either dose LPS, Figure 5-4a.
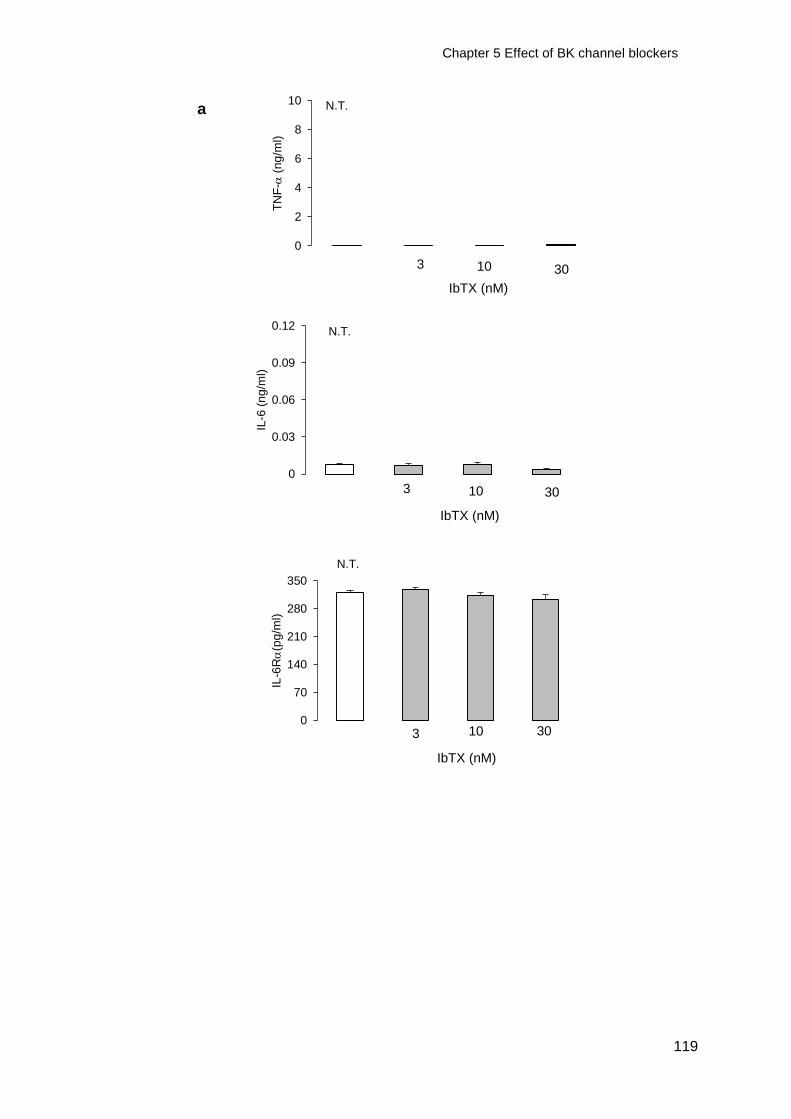
Chapter 5 Effect of BK channel blockers
119
0
2
4
6
8
10
TN
F-
(n
g/m
l)
IbTX (nM)
0
70
140
210
280
350
IL-6
R
(pg
/ml)
IbTX (nM)
N.T.
3 10 30
N.T.
3 10 30
0
0.03
0.06
0.09
0.12
IL-6
(n
g/m
l)
N.T.
3 10 30
IbTX (nM)
a

Chapter 5 Effect of BK channel blockers
120
Figure 5-1 Effect of IbTX on TNF-IL-6 and IL-6R release from resting macrophages
RAW264.7 macrophages received 3-30 nM IbTX, shaded bars, or medium control, clear bar.
After 4 hours culture media was collected. TNF-IL-6 and IL-6R in media was measured
by ELISA. Bars represent mean+SEM (n≥3). a) shows results from one experiment with n=3.
b) shows combined data from 3 experiments. N.T.: no treatment controls. Statistical
significance of drug treatments against control (ctrl) was tested by one-way ANOVA followed
by Dunnett’s test.
IbTX (nM)
IbTX (nM)
ctrl 3 10 30
ctrl 3 10 30
ctrl 3 10 30 IbTX (nM)
0
0.005
0.01
0.015
0.02
TN
F-
(ng/m
l)
0
0.03
0.06
0.09
0.12
IL-6
(n
g/m
l)
0
30
60
90
120
150
IL-6
R
(pg/m
l)
b N.T.
N.T.
N.T.
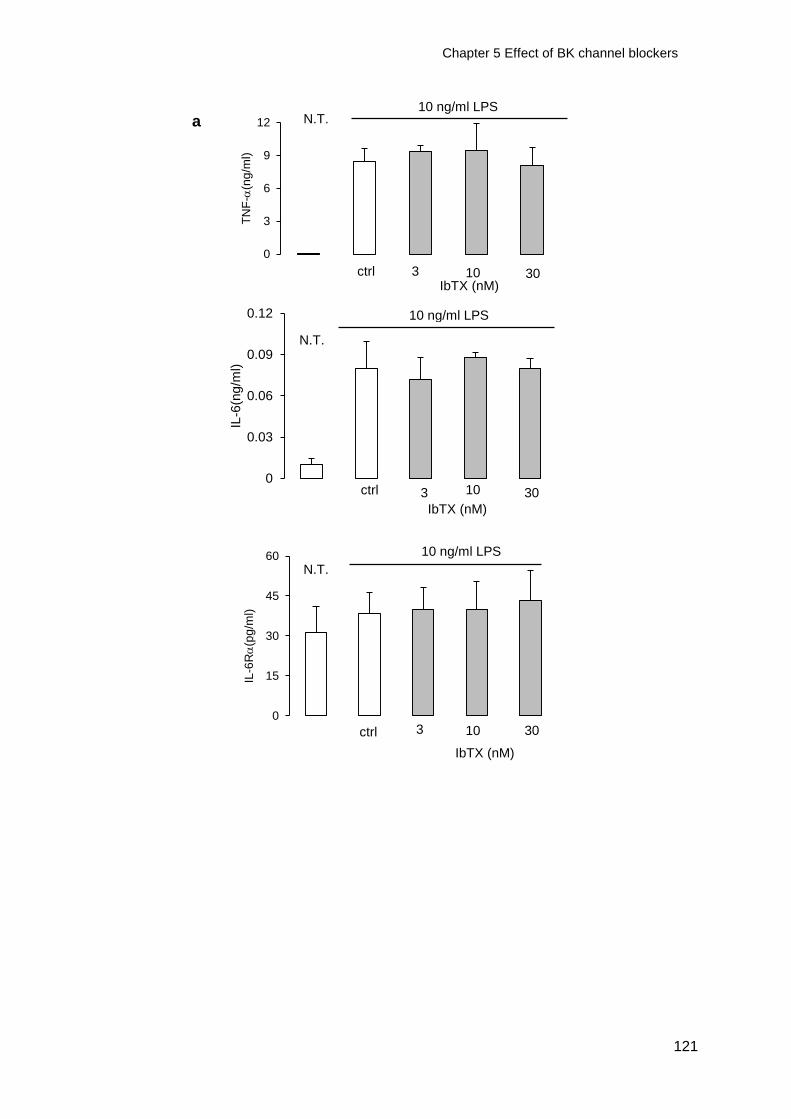
Chapter 5 Effect of BK channel blockers
121
0
3
6
9
12
TN
F-
(ng
/ml)
0
15
30
45
60
IL-6
R
(pg
/ml)
IbTX (nM)
N.T.
3 10 30
10 ng/ml LPS
10 ng/ml LPS
IbTX (nM)
3 10 30
0
0.03
0.06
0.09
0.12
IL-6
(ng/m
l)
3 10 30 IbTX (nM)
10 ng/ml LPS
N.T.
N.T.
a
ctrl
ctrl
ctrl

Chapter 5 Effect of BK channel blockers
122
Figure 5-2 Effect of IbTX on TNF-IL-6 and IL-6R release from macrophages activated with a submaximal dose of LPS
RAW264.7 macrophages received 3-30 nM IbTX, shaded bars, or medium control, clear
bars, during stimulation with 10 ng/ml LPS. After 4 hours, culture media was collected. TNF-
IL-6 and IL-6R in media were measured by ELISA. Bars represent mean+SEM, (n≥3).
N.T.: no treatment controls. a) shows results from one experiment with n=4. b) shows
combined data from 3 experiments. Statistical significance of drug treatments against control
(ctrl) was tested by one-way ANOVA followed by Dunnett’s test.
IbTX (nM)
N.T.
3 10 30
10 ng/ml LPS
ctrl
10 ng/ml LPS
IbTX (nM) 3 10 30
3 10 30
ctrl
IbTX (nM)
10 ng/ml LPS
ctrl
0
3
6
9
12
TN
F-
(ng
/ml)
0
50
100
150
200
IL-6
R
(pg
/ml)
0
0.1
0.2
0.3
0.4
IL-6
(ng/m
l)
N.T.
N.T.
b

Chapter 5 Effect of BK channel blockers
123
0
5
10
15
20
TN
F-
(n
g/m
l)
0
10
20
30
40
50
IL-6
R
(pg
/ml)
N.T.
150 ng/ml LPS
N.T. 150 ng/ml LPS
IbTX (nM) 3 10 30
IbTX (nM) 3 10 30
0
0.2
0.4
0.6
0.8
1
IL-6
(n
g/m
l)
150 ng/ml LPS
3 10 30
N.T.
IbTX (nM)
a
ctrl
ctrl
ctrl

Chapter 5 Effect of BK channel blockers
124
Figure 5-3 Effect of IbTX on TNF-IL-6 and IL-6R release from macrophages activated with a maximal dose of LPS
RAW264.7 macrophages received 3-30 nM IbTX, shaded bars, or medium control, clear
bars, during stimulation with 150 ng/ml LPS. After 4 hours, culture media was collected.
TNF-IL-6 and IL-6R in media were measured by ELISA. Bars represent mean+SEM,
(n≥3). N.T.: no treatment controls. a) shows results from one experiment with n=4. b) shows
combined data from 3 experiments. Statistical significance of drug treatments against control
(ctrl) was tested by one-way ANOVA followed by Dunnett’s test.
N.T.
150 ng/ml LPS
150 ng/ml LPS
IbTX (nM) 3 10 30
IbTX (nM) 3 10 30
150 ng/ml LPS
3 10 30
N.T.
IbTX (nM)
0
5
10
15
20
TN
F-
(n
g/m
l)
0
30
60
90
120
150
IL-6
R
(pg
/ml)
0
0.05
0.1
0.15
0.2
0.25
IL-6
(n
g/m
l)
b
N.T.
ctrl
ctrl
ctrl
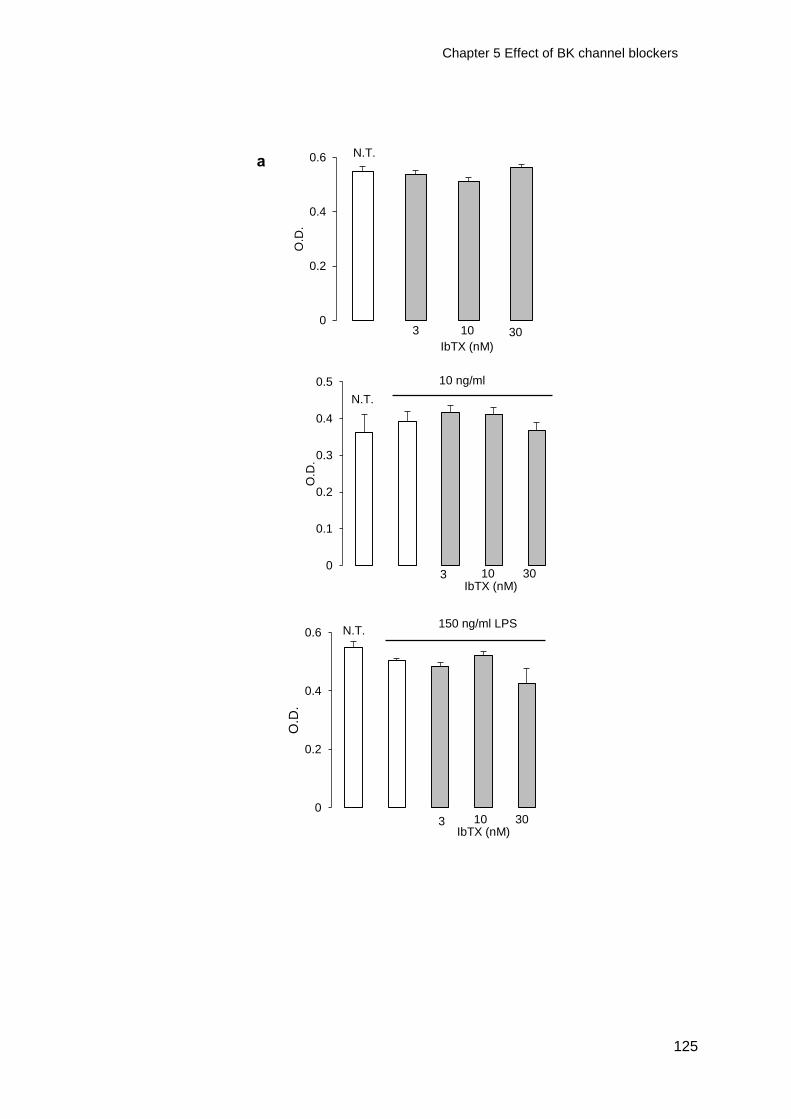
Chapter 5 Effect of BK channel blockers
125
0
0.2
0.4
0.6
O.D
.
0
0.2
0.4
0.6
O.D
.
0
0.1
0.2
0.3
0.4
0.5
O.D
.
N.T.
10 ng/ml
LPS
IbTX (nM) 3 10 30
IbTX (nM) 3 10 30
IbTX (nM) 3 10 30
150 ng/ml LPS
a
N.T.
N.T.

Chapter 5 Effect of BK channel blockers
126
Figure 5-4 Cell viability of macrophages treated with IbTX and LPS
RAW264.7 macrophages received no treatment, 10 or 150 ng/ml LPS for 4 hours with,
shaded bars or without, clear bars, 3-30 nM IbTX and cell vitality was assessed by MTT. Cell
viability was measured by MTT. Bars represent mean+SEM, n≥3. N.T.: no treatment controls.
a) shows data from one experiment with n=3 and b) shows combined data from 3 repeated
experiments. Statistical significance of drug treatments against no treatment control was
tested by one-way ANOVA followed by Dunnett’s test.
N.T.
10 ng/ml LPS
IbTX (nM) 3 10 30
IbTX (nM) 3 10 30
IbTX (nM) 3 10 30
150 ng/ml LPS
0
0.2
0.4
0.6
O.D
.
0
0.2
0.4
0.6
0.8
O.D
.
0
0.2
0.4
0.6
O.D
.
b
N.T.
N.T.

Chapter 5 Effect of BK channel blockers
127
5.2.2 Effect of paxilline on TNF- release from early time point of TLR4 activation
of macrophages
A second reported BK channel selective blocker, paxilline, was investigated. Due to
the complexity of how paxilline blocks the channel, it was difficult to estimate the
IC50 for this drug in this experiment. Therefore an initial cell culture experiment with
paxilline was carried out to find the maximal tolerable dose of the drug in RAW264.7
macrophages. Paxilline, at 3 M, significantly increased the release of TNF-from
resting macrophages, 601+/-225 pg/ml compared to vehicle control, which had no
detectable production of TNF-, p<0.05, Figure 5-5a. However, above 1 M
paxilline decreased MTT result, with measurements of 0.17+/-0.008 O.D. in vehicle
control and 0.13+/-0.05 O.D. in 3 M paxilline treatment group, p<0.05, Figure 5-5b.
Therefore the maximum dose of paxilline used was set as 1 M. The lower does
was selected by estimating from the literature, which has been reported to
selectively block closed BK channels and this is at 20 nM. Due to its poor solubility
in aqueous solutions, paxilline was first dissolved in DMSO. The final concentration
of DMSO used in culture wells was 0.015%. Initial experiments showed that this
concentration of DMSO did not have an effect on TNF- release.
Paxilline treatment for up to 24 hours at 0 to 1 M did not induce TNF- from resting
macrophages, Figure 5-5a. In comparison, 20 nM paxilline enhanced TNF- release
from macrophages stimulated for 4 hours with 10 ng/ml LPS by 54% compared to
vehicle control group, 4.8+/-0.34 ng/ml with 20 nM paxilline compared to 3.1+/-0.99
ng/ml DMSO vehicle control, p<0.05, Figure 5-6. 1 M paxilline also significantly
increased, p<0.05, TNF- release by 61%, 5.0+/-1.2 ng/ml compared to the DMSO
vehicle control, Figure 5-6a. Paxilline did not affect TNF- release when 150 ng/ml
LPS was used on the macrophages. MTT assay showed that 4 hours of incubation
with paxilline did not affect the viability of the cells, Figure 5-6.

Chapter 5 Effect of BK channel blockers
128
Figure 5-5 Preliminary data. Effect of paxilline on TNF- release and cell viability in resting macrophages
RAW264.7 macrophages received no treatment (N.T.) or 3-3000 nM paxilline (Pax.), shaded
bars, for 4 hours. Vehicle control (DMSO Veh.), clear bars, was made with DMSO. The final
concentration of DMSO was 0.015% in controls, clear bars, and drug treatments, shaded
bars. a) Concentration of TNF- in conditioned media was measured by ELISA. b) Cell
viability was assessed by MTT assay. Bars represent mean+SEM and shows result from
one preliminary experiment with n=5. O.D.: optical density. Statistical significance of vehicle
control (DMSO Veh) against drug treatments was tested by one–way ANOVA followed by
Dunnett’s t-test.* p<0.05.
0
200
400
600
800
1000
TN
F-
(pg
/ml)
N.T. 30 300 DMSO Veh.
100. 1000 3000
Pax. (nM).
0
0.05
0.1
0.15
0.2
0.25
O.D
.
N.T. 30 300 DMSO Veh.
100 1000 3000
Pax. (nM).
*
*
a
b

Chapter 5 Effect of BK channel blockers
129
Figure 5-6 Preliminary data. Effect of paxilline on TNF-release from LPS activated macrophages
RAW264.7 macrophages received no treatment (N.T.), 10 or 150 ng/ml LPS with/without 20
or 1000 nM paxilline (Pax.) for 4 hours. Vehicle control (DMSO Veh.), clear bars, was DMSO.
The final concentration of DMSO 0.015% in controls, clear bars, and drugs treatments,
shaded bars. TNF- in conditioned media was measured by ELISA. Bars represent
mean+SEM with n=4. The experiment was repeated twice and graph shows result from one
experiment with n=4. Statistical significance of vehicle control (DMSO Veh) against drug
treatments was tested by one–way ANOVA followed by Dunnett’s test.* p<0.05.
0
2
4
6
8
TN
F-
(n
g/m
l)
Pax.(nM) 20 1000 DMSO Veh.
Pax.(nM) 20 1000 DMSO Veh.
0
7
14
21
28
35
TN
F-
(n
g/m
l)
150 ng/ml LPS N.T.
10 ng/ml LPS N.T.
* *

Chapter 5 Effect of BK channel blockers
130
5.2.3 LPS conditioning protocol and its effect on TNF-, IL-6 and IL6R release
from macrophages
The results from the previous section demonstrated that IbTX did not have any
effect on the release of TNF-, IL-6 and IL-6R during first 4 hours of LPS
stimulation. However the results from chapter 4 demonstrated that this was not the
optimum time for the expression of BK channels on the plasma membrane, but
would suggest that the active BK channels only occurred on the plasma membrane
of the RAW264.7 cells after 18-24 hours of stimulation with 10 ng/ml LPS. Therefore,
to investigate the effect of IbTX on the release of these proteins at a time when BK
channels were expressed on the plasma membrane, the following protocol was
developed, Figure 5-7. First RAW264.7 macrophages were stimulated with 10 ng/ml
LPS for 24 hours. After 24 hours, the culture media was changed and these
‘conditioned macrophages’ were treated with 150 ng/ml LPS for 4 hours in the
presence or absence of 30 nM IbTX, Figure 5-7. The protocol is called ‘LPS
conditioning’ protocol.
Figure 5-7 Protocol for investigating the effect of plasma membrane BK channel block by macrophages
RAW264.7 macrophages were treated with 10 ng/ml LPS for 24 hours. The media was
replaced at 24 hours and subsequently, macrophages were activated with 150 ng/ml LPS
with/without 30 nM IbTX. At 4 hours, cells and media were collected for analysis.
+10 ng/ml LPS
With or without 150 ng/ml LPS
With or without agonist or antagonist
0 24 28
Medium replacement
Time (hrs)

Chapter 5 Effect of BK channel blockers
131
As described in chapter 1, TNF- release can be regulated at the plasma
membrane and it was decided to investigate the amount of cellular mTNF- in the
following experiments. mTNF- was detected using a rabbit monoclonal anti-mouse
TNF-antibody, D2D4. D2D4 detected a protein band at 26 kDa in LPS stimulated
cells and this protein band was absent in whole cell lysate from resting
macrophages. Weaker bands also appeared between 30-40 kDa. The 26kDa band
corresponded to the molecular weight of mTNF-.
Figure 5-8 TNF- expression in resting and LPS activated macrophages using
a rabbit monoclonal anti-mouse TNF- antibody, D2D4
RAW264.7 macrophages received no treatment or 150 ng/ml LPS for 4 hours. mTNF-
expression was assessed by Western blot. 10 g protein was loaded per lane. Left indicates
molecular weight marker in kDa. The experiment was repeated 5 times.
Before investigating the effect of the IbTX in this model, the effect of preconditioning
the RAW264.7 macrophages with low dose LPS on the subsequent activation of the
macrophages with 150ng/ml LPS was evaluated. LPS conditioning of macrophages
resulted in approximately 38% reduction in TNF- secretion in response to 150
ng/ml LPS for 4 hours compared to non-conditioned macrophages, 2.4+/-0.32 ng/ml
and 3.9+/-0.64 ng/ml respectively, p<0.05, Figure 5-9a.
LPS conditioning also reduced the expression of the 26 kDa cellular mTNF- LPS
stimulation with 150 ng/ml LPS by 70%, Figure 5-9b. In contrast, release of IL-6
25
32
58
80
N.T.
LPS
D2D4

Chapter 5 Effect of BK channel blockers
132
was potentiated in LPS conditioned group by 280%, non-conditioned group 0.34+/-
0.08 ng/ml compared to condition group 1.3 +/-0.11 ng/ml, p<0.05, Figure 5-10a. IL-
6R release was also increased by 25%, 14.0+/-0.54 pg/ml to 19.1 +/- 2.1 pg/ml,
p<0.05, Figure 5-10a.

Chapter 5 Effect of BK channel blockers
133
0
1
2
3
4
5
TN
F-
(n
g/m
l)
ctrl a
LPS conditioned
0
0.3
0.6
0.9
1.2
Rela
tive
m
TN
F-
exp
ressio
n
mTNF-(26kDa)
-actin (42kDa)
LPS conditioned b
150 ng/ml LPS
150 ng/ml LPS 150 ng/ml LPS
ctrl ctrl
*
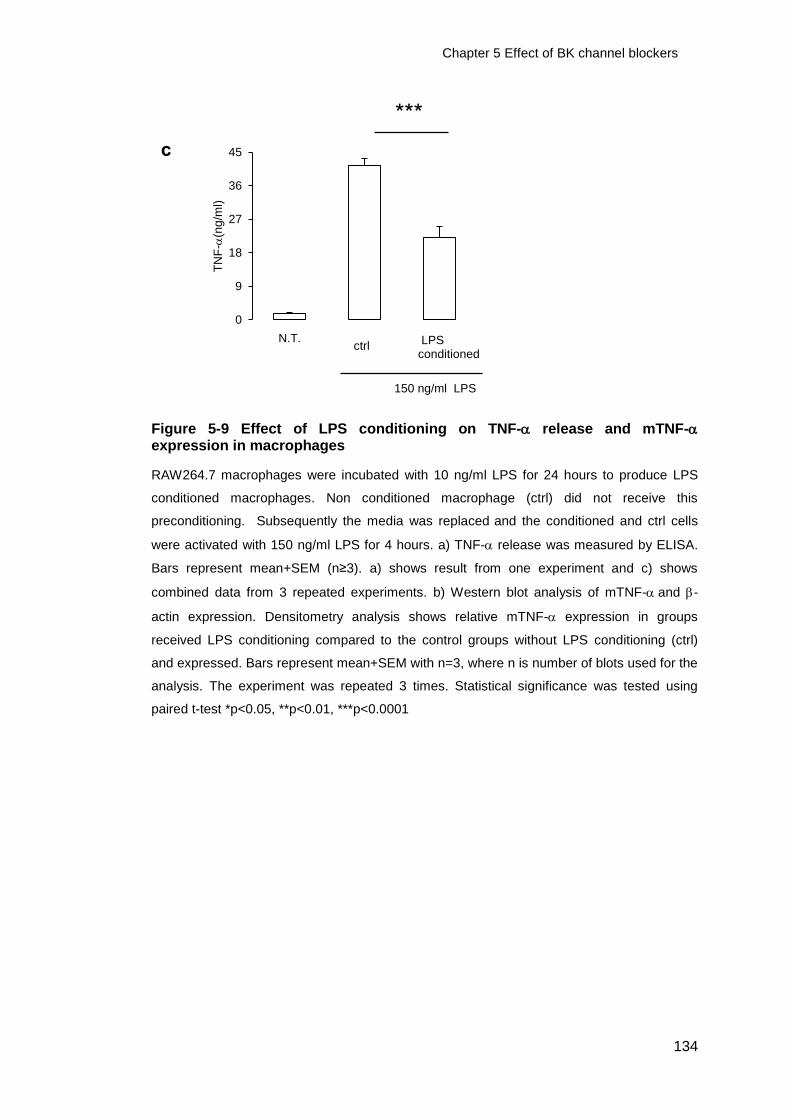
Chapter 5 Effect of BK channel blockers
134
Figure 5-9 Effect of LPS conditioning on TNF- release and mTNF- expression in macrophages
RAW264.7 macrophages were incubated with 10 ng/ml LPS for 24 hours to produce LPS
conditioned macrophages. Non conditioned macrophage (ctrl) did not receive this
preconditioning. Subsequently the media was replaced and the conditioned and ctrl cells
were activated with 150 ng/ml LPS for 4 hours. a) TNF- release was measured by ELISA.
Bars represent mean+SEM (n≥3). a) shows result from one experiment and c) shows
combined data from 3 repeated experiments. b) Western blot analysis of mTNF-and -
actin expression. Densitometry analysis shows relative mTNF- expression in groups
received LPS conditioning compared to the control groups without LPS conditioning (ctrl)
and expressed. Bars represent mean+SEM with n=3, where n is number of blots used for the
analysis. The experiment was repeated 3 times. Statistical significance was tested using
paired t-test *p<0.05, **p<0.01, ***p<0.0001
c
0
9
18
27
36
45
TN
F-
(ng
/ml)
LPS conditioned
ctrl N.T.
150 ng/ml LPS
***

Chapter 5 Effect of BK channel blockers
135
Figure 5-10 Effect of LPS conditioning on IL-6 and IL-6R release from macrophages
RAW264.7 macrophages were incubated with 10 ng/ml LPS for 24 hours to produce LPS
conditioned macrophages. Non conditioned macrophage (ctrl) did not receive this
preconditioning. Subsequently the media was replaced and the conditioned and ctrl cells
were activated with 150 ng/ml LPS for 4 hours. IL-6 and IL-6R release was measured by
ELISA. Bars represent mean+SEM (n≥3). a) shows results from one experiment with n=4. b)
shows combined data from 3 repeated experiments. Statistical significance was tested using
paired t-test *p<0.05. **p<0.01, ***p<0.0001.
150 ng/ml LPS
0
5
10
15
20
25
IL-6
R(
ng
/ml)
0
0.4
0.8
1.2
1.6
IL-6
(n
g/m
l)
150 ng/ml LPS
LPS conditioned
ctrl LPS conditioned
ctrl
150ng/ml LPS
LPS conditioned ctrl
0
2
4
6
8
10
IL-6
(ng
/ml)
***
b
* *
a

Chapter 5 Effect of BK channel blockers
136
5.2.4 Effect of IbTX on TNF-, IL-6 and IL-6R release from LPS conditioned
macrophages
In conditioned macrophages, the application of 30 nM IbTX significantly enhanced
TNF- release during 150 ng/ml LPS treatment compared to macrophages which
did not receive the drug. Release was increased by approximately 65%, 2.4+/-0.32
ng/ml in LPS only group compared to 3.8+/-0.12 ng/ml in LPS with IbTX group,
p<0.05, Figure 5-11a. IL-6R release from LPS stimulated conditioned
macrophages was also shown to increase with IbTX treatment by approximately
80%, 30.1+/-3.1 pg/ml from the group received LPS only and 54.5+/-7.5 pg/ml from
the group received LPS with IbTX, p<0.05, Figure 5-11a. In comparison, IL-6
release was not altered by IbTX treatment, showing 1.2+/-0.11 ng/ml in the group
received LPS only and 1.3+/-0.24 ng/ml in the group received LPS with IbTX, Figure
5-11a. IbTX treatment did not affect the viability of the cells, Figure 5-11a.
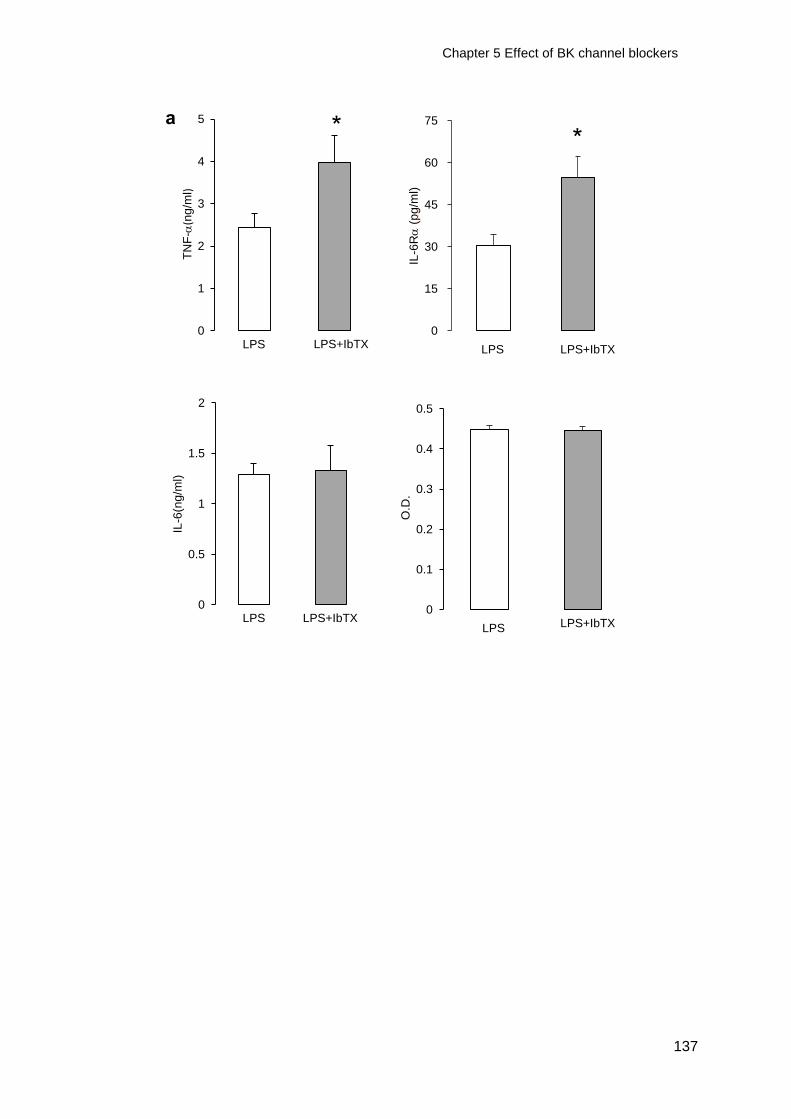
Chapter 5 Effect of BK channel blockers
137
0
0.1
0.2
0.3
0.4
0.5 O
.D.
0
1
2
3
4
5
TN
F-
(ng
/ml)
*
LPS LPS+IbTX LPS LPS+IbTX
0
15
30
45
60
75
IL-6
R
(p
g/m
l)
*
0
0.5
1
1.5
2
IL-6
(ng
/ml)
LPS LPS+IbTX LPS LPS+IbTX
a

Chapter 5 Effect of BK channel blockers
138
Figure 5-11 Effect of IbTX on the plasma membrane BK channels in TNF-and
IL-6R from LPS activated macrophages.
RAW264.7 macrophages were incubated with 10 ng/ml LPS for 24 hours to produce LPS
conditioned macrophages. Subsequently the media was replaced and conditioned cells were
activated with 150 ng/ml LPS with/without 30 nM IbTX. After 4 hours, culture media was
collected and analysed by ELISA for TNF-IL-6R and IL-6. Cell viability was assessed by
MTT. Bars show mean+SEM (n≥3). a) shows results from one experiment with n=3 and b)
shows combined data from 3 repeated experiments. Statistical significance was tested by
paired t-test. O.D.: optical density.*p<0.05, **p<0.01.
**
LPS LPS+IbTX LPS LPS+IbTX
LPS LPS+IbTX LPS LPS+IbTX
0
1
2
3
4
5
6T
NF
-(n
g/m
l)
0
25
50
75
100
125
IL-6
R
(pg/m
l)
0
2
4
6
8
10
IL-6
(ng/m
l)
0
0.1
0.2
0.3
0.4
0.5
0.6
MT
T (
O.D
.)
b
**
N.T.

Chapter 5 Effect of BK channel blockers
139
5.2.5 Regulation of TNF- by IbTX
Previous section, 5.2.4, demonstrated that IbTX increases the release of TNF- and
IL-6Rfrom the conditioned macrophages during LPS activation. TNF-production
is regulated at multiple levels including gene transcription, protein translation and
membrane release. The increase in the release of TNF- by IbTX could involve any
or all these mechanisms. To identify at which step of TNF- production IbTX
modulated, TNF- mRNA was analysed by RT-qPCR and the cellular contents of
the cytokine protein was analysed by Western blot.
mRNA samples were collected from conditioned RAW264.7 macrophages after 4
hours LPS treatment with or without 30 nM IbTX and cDNA synthesised. The levels
of TNF- mRNA were subsequently analysed by RT-qPCR with levels normalised to
-actin, an internal control, Figure 5-12a. GAPDH had previously been shown not be
a reliable internal control in this experiment. In spite of a significant increase in the
levels of released TNF- by IbTX, no significant difference in TNF- mRNA
expression was observed with IbTX, Figure 5-12a. In comparison, cellular levels of
mTNF- decreased with IbTX, Figure 5-12b and 5-12c. Taken together these results
suggested that IbTX modulated the release of the cytokine and not gene
transcription or translation.
To further investigate the role of BK channels in the system, a BK channel opener,
100 nM NS11021 was applied to LPS stimulated conditioned macrophages as a
preliminary experiment. 100 nM NS11021 caused a significant decrease in TNF-
release, 9.8+/-0.22 ng/ml from LPS only group and 6.2+/-0.98 ng/ml from LPS with
NS11021 group, p<0.05, Figure 5-13. This result supports the role of BK channels in
negatively regulating the release of the cytokine. However, it has to be noted that
similar to paxilline, NS11021 is a small lipophilic molecule. Therefore the possibility
that this drug caused the activation of other cytoplasmic BK channels as well as the
activation of the plasma membrane BK channels cannot be excluded.
Initially it was attempted to study the expression of IL-6R in RAW264.7
macrophages and the effect of IbTX on the cellular expression of IL-6R. However
only one available antibody, a rat monoclonal anti-mouse IL-6R antibody, DM3568,

Chapter 5 Effect of BK channel blockers
140
was not able to detect any protein bands even after a series of optimization.
Therefore, this study focused on the regulation of TNF-
The combined data, from repeated (≥ 3 times) experiments, for protein release and
MTT was in line with the described results from individual experiments. These
combined data were presented in Figure 5-1, 5-2, 5-3, 5-4, 5-9 and 5-10. Statistical
analysis of combined data and individual experimental data demonstrated a similar
pattern of significance between treatment groups. It was noted combined data
reached higher degree of significance.
Figure 5-12 Effect of IbTX on TNF- mRNA and mTNF- expression
RAW264.7 macrophages were incubated with 10 ng/ml LPS for 24 hours to produce LPS
conditioned macrophages. Subsequently the media was replaced and conditioned cells were
activated with 150 ng/ml LPS with/without 30 nM IbTX. After 4 hours, cells were collected
and analysed for a) TNF- mRNA expression normalised to an internal control, -actin. Bars
represent mRNA signal ratio as mean+SEM, n=3 independent experiments. b) mTNF
expression was analysed by Western blot. c) Densitometry analysis of TNF- expression.
Bars represent protein expression mean+SEM, n=3.
0
0.4
0.8
1.2
TN
F-
mR
NA
(S
ign
al ra
tio
)
LPS LPS+IbTX
b
a
LPS LPS+IbTX
mTNF- (26kDa)
-actin (42kDa)
0
0.3
0.6
0.9
1.2
Rela
tive
mT
NF
-
exp
ressio
n
LPS LPS+IbTX
c
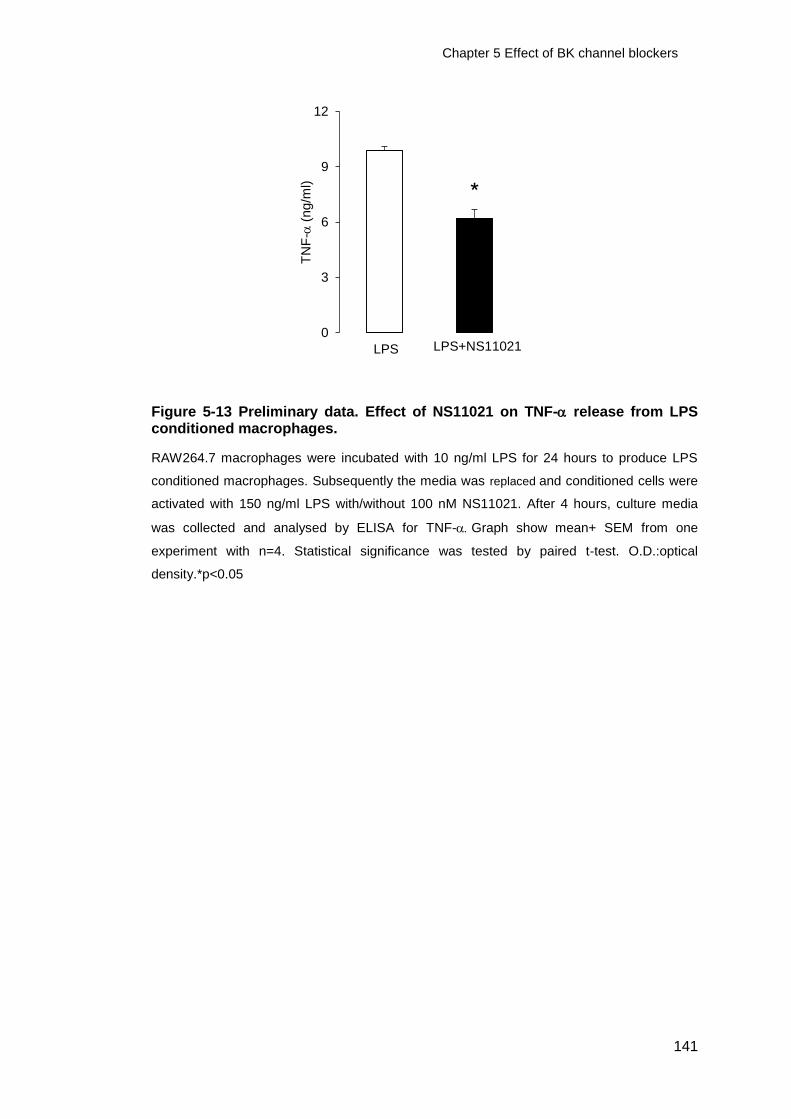
Chapter 5 Effect of BK channel blockers
141
Figure 5-13 Preliminary data. Effect of NS11021 on TNF- release from LPS conditioned macrophages.
RAW264.7 macrophages were incubated with 10 ng/ml LPS for 24 hours to produce LPS
conditioned macrophages. Subsequently the media was replaced and conditioned cells were
activated with 150 ng/ml LPS with/without 100 nM NS11021. After 4 hours, culture media
was collected and analysed by ELISA for TNF-Graph show mean+ SEM from one
experiment with n=4. Statistical significance was tested by paired t-test. O.D.:optical
density.*p<0.05
*
LPS LPS+NS11021 0
3
6
9
12
TN
F-
(ng/m
l)

Chapter 5 Effect of BK channel blockers
142
5.3 Discussion
The first aim of this chapter was to investigate the effect of BK channel blockers,
IbTX and paxilline, on the release of TNF-, IL-6 and IL-6R. IbTX is a 37 amino
acids peptide toxin isolated from scorpion venom. IbTX achieves a half maximum
block of BK channels within the nM range and is highly selective for BK channels at
30 nM. This drug is impermeable to the lipid bilayer membranes and blocks the pore
region of the channels from the outside (Galvez et al., 1990; Yu et al., 2016).
Through PRRs, macrophages are known to respond to various microbial toxins.
Therefore it was important to establish if IbTX lead to the direct activation of
macrophages at the concentrations which the drug blocks BK channels. It was found
that IbTX did not stimulate TNF-, IL-6 release or alter IL-6R release from resting
macrophages. The IbTX was not toxic to the cells over 4 hours. Taken together
these results suggested that IbTX itself does not stimulate inflammatory cascades in
macrophages.
The tremorgenic mycotoxin, paxilline is another selective blocker for BK channels.
The size of paxilline is 435 Da and is highly lipophilic in nature (Knaus et al., 1994b).
Previous research has demonstrated that the paxilline blocks BK channels
differently depending on the channels activation state. The affinity of this blocker to
the channels has been reported to be inversely proportional to the open probability
(Po) of the channel. The IC50 of this drug ranges from 10 nM, when the channels are
closed, to 10 M ,when the channels are opening at maximum rate (Zhou and Lingle,
2014). In this thesis, the paxilline doses above 1 M appeared to affect the viability
of the cells. Paxilline also significantly enhanced TNF- secretion from
macrophages, activated with submaximal dose of LPS. However this effect was lost
when macrophages were stimulated with the optimal dose for TNF-release. The
result showed that paxilline modulated cytokine secretion from macrophages. If IbTX
and paxilline are selective to BK channels how could they elicit differing effects?
From chapter 4, it was demonstrated that RAW264.7 macrophages had low
expression of BK channels on the plasma membrane in resting conditions and 4
hours after LPS activation. BK channels were abundant at intracellularly sites in
resting RAW264.7 macrophages and at early time points of LPS activation. Owing to
its lipophilic nature, it is possible that the paxilline entered cells and blocked
intercellular BK channels whereas IbTX does not. Alternatively paxilline may

Chapter 5 Effect of BK channel blockers
143
enhance TNF- release by the off-target effect which is in addition to BK channel
block. Additional targets for paxilline have been reported. At M levels, paxilline
inhibits Ca2+ ATPase and IP3 receptors (Longland et al., 2000; Bilmen et al., 2002).
As this drug is widely used to study the BK channel, it would be worth investigating
the mechanisms of how paxilline causes the activation of macrophages.
IbTX is considered to be a gold standard for the BK channel inhibition. Importantly, it
only blocks BK channels located on the plasma membrane, thus provides a unique
tool to selectively investigate plasma membrane located BK channels without
affecting the intercellular pool of BK channels. For this reason, IbTX was used to
block the plasma membrane located BK channel.
To investigate the effect of the plasma membrane BK channel block it was
necessary for the cells to express functional BK channels on their plasma
membrane. Results from chapter 4 have demonstrated that BK channels are
upregulated on the plasma membrane 24 hours after stimulation with 10 ng/ml LPS,
using this observation, a protocol was developed to investigate the role of the BK
channel in activated macrophages. In this protocol, macrophages were stimulated
for 24 hours with a sub-optimal dose of LPS to induce BK expression on the plasma
membrane. These macrophages were termed ‘LPS conditioned’ macrophages.
These cells were then activated with 150 ng/ml LPS for 4 hours and the drug could
be applied during the activation to investigate BK channels role.
This protocol of low dose followed by high dose treatment with LPS is reminiscent of
LPS/endotoxin tolerance, which is a well-appreciated immunological phenomenon
(Morris et al., 2015). In this response, a first challenge of cells, usually macrophages,
with a low dose of LPS causes macrophages to become less responsive to
subsequent challenge with a higher dose of LPS. In the tolerant state, immune cells
have been reported to down-regulate the release of pro-inflammatory cytokines in
response to the second challenge (Biswas and Lopez-Collazo, 2009). LPS tolerance
is not only seen at cellular level, but also may be important in clinical settings where
the immune system becomes unresponsive to a subsequent bacterial infections. To
date multiple mechanisms have been implicated in the establishment/maintenance
of endotoxin tolerance. Among these mechanisms, the downregulation of

Chapter 5 Effect of BK channel blockers
144
proinflammatory cytokine transcription is considered to be most prominent. However,
it is likely the multiple mechanisms are involved in tolerance. As expected,
stimulation of macrophages with 10 ng/ml LPS generated the tolerance state and
reduced the release of TNF- form macrophages in response to secondary
stimulation with 150 ng/ml. mTNF- expression was also decreased in LPS
conditioned RAW264.7 macrophages. However, in comparison to TNF-, it was
noted that IL-6 was significantly increased in LPS conditioned macrophages by 3
fold. There was also a significant increase in IL-6R release. This opposing effect
on IL-6 release may rather represent the priming effect of immune cells. It has been
known that low dose of LPS application could dramatically enhance the
inflammatory response to subsequent LPS application (Morris et al., 2015).
30 nM IbTX significantly increased TNF- release by 55%. Indeed it appeared to
reverse the effect of endotoxin tolerance in TNF- release. However this was not
associated with an increase in TNF-mRNA, but at the post transcriptional site. To
investigate the cellular contents of mTNF- expression in these cells, Western blot
was performed using a rabbit monoclonal anti-mouse TNF- antibody D2D4. Firstly,
in non-treated resting cells no protein band appeared, in LPS activated
macrophages, the major band at 26 kDa and minor bands approximately at 30 kDa
appeared indicating the production of TNF- in response to TLR4 activation. The
major band possibly corresponds to 26 kDa membrane anchored form TNF- and
minor bands to glycosylated form. In the LPS conditioned macrophages IbTX
decreased the expression of mTNF- by 44% which negatively correlated with the
increase in the secretion of TNF- from IbTX treated LPS conditioned cells. These
results suggest that BK channels regulate TNF- at the secretion from the cells and
not earlier protein synthesis. In support of this, IbTX treatment did not affect the
mRNA for TNF-In deed the most likely explanation is that the BK channel
negatively regulates the release of TNF- from the plasma membrane. In support of
the negative effect of BK channel in the release of TNF-, an application of 100 nM
BK opener, NS11021, at the dose selective for BK channels resulted in a significant
decrease in TNF- release. However it is noted that NS11021 is lipophilic in nature
and the interpretation of the results from this activator may not be limited in the
activation of the plasma membrane BK channel.

Chapter 5 Effect of BK channel blockers
145
TNF- is initially expressed as its transmembrane form of 26 kDa mTNF-.
Membrane metalloproteases cleave mTNF- to release the soluble 17 kDa TNF-.
ADAM17 is the primary enzyme to facilitate TNF- ecotodomain shedding. This
enzyme also cleaves IL-6R and is known to increase IL-6R in the circulation
(Khokha et al., 2013). It is noted that IL-6R is also reported as a substrate for a
membrane metalloprotease, ADAM10 (Giebeler and Zigrino, 2016). IbTX further
increased IL-6R release observed in LPS treated conditioned macrophages.
Collectively, the data indicated possible interaction between the plasma membrane
BK channel and the ADAMs.
IL-6, by contrast, is not expressed in a transmembrane form and is not subjected to
cleavage by ADAM17 or other members of membrane metalloproteases family
(Arango Duque and Descoteaux, 2014). IL-6 is produced in the endoplasmic
reticulum and directed to Golgi. Accumulation has been reported to occur after 4
hours of LPS stimulation in RAW264.7 macrophages (Manderson et al., 2007). IL-6
then exits from the Golgi, in vesicles and is secreted from the membrane via
SNARE-mediated fusion with plasma membrane without processing as a
transmembrane form. The block of the plasma membrane BK channels had no
effect on IL-6 release during LPS stimulation of conditioned macrophages. Again
this observation also supports the plasma membrane BK channels are working on
the substrates of ADAM17. Therefore it was important to establish the role of
ADAM17 in our system and interaction between its proteolytic activity and BK
channels.
This chapter demonstrated that IbTX increased the release of TNF-at the
secretion in LPS conditioned macrophages. The release of IL-6R is also enhanced
by IbTX however IL-6 was not affected. This opened up the hypothesis that BK
channels located on the plasma membrane may be involved in the regulation of
ADAM17 activity.
Chapter 6 ADAM17 in macrophages
146
Chapter 6 Does ADAM17 have a role in TNF- and/or IL-6R
release in macrophages and does the plasma membrane
BK channel regulate ADAM17 activity?
6.1 Introduction
Chapter 5 indicated a possible interaction between the plasma membrane BK
channel and the release TNF- and IL-6R. The release of TNF- and IL-6R is
mediated by ADAM17. It was hypothesised that the plasma membrane located BK
channel may regulate ADAM17 activity. The aim of this chapter was to first
investigate the expression and function of ADAM17 protein in RAW264.7
macrophages and secondly to study the effect of IbTX on the activity of ADAM17.
6.2 Results
6.2.1 ADAM17 expression in TLR4 activated macrophages
A rabbit polyclonal antibody for ADAM17, ab2051, which designed to bind the C-
terminal region of the enzyme protein, was used to characterise the expression of
ADAM17 in RAW264.7 macrophages. Figure 6-1 and Figure 6-2 show blots of
ADAM17 in whole cell and plasma membrane isolate from RAW264.7 macrophages
during treatment with 10 ng/ml LPS for up to 24 hours. ADAM17 has been reported
to exist in a full length precursor 130 kDa and active 85 kDa forms. Ab2051 detected
the presence of 85 and 130 kDa protein bands from whole cell lysates of RAW264.7
macrophages, Figure 6-1. In whole cell lysate, 10 ng/ml LPS treatment caused an
increase in the expression level of 85 kDa protein bands, peaking around 24 hours
of LPS stimulation, Figure 6-1. By contrast, protein bands at 130 kDa in whole cell
lysate stayed relatively constant during the time course of LPS treatment except at
24 hours where the protein band appeared weaker, Figure 6-1. A cytosolic protein,
Akt, which was used to validate isolation process, was present in whole cell lysate
and absent in plasma membrane isolate indicating that the cell surface isolation
appeared not to have the contamination of cytosolic contents, Figure 6-1 and Figure
6-2.

Chapter 6 ADAM17 in macrophages
147
Figure 6-1 ADAM17 expression in whole cell lysate from LPS activated macrophages
RAW264.7 macrophages were treated with 10 ng/ml LPS for 0-24 hours. ADAM17, Akt and
-actin expression in whole cell lysate (WC) were analysed by Western blot. -actin acted as
a loading control. The experiment was repeated 3 times.
0 1 4 8 12 18 24
-actin (42 kDa)
LPS (hrs)
ADAM17 (85 kDa)
ADAM17 (130 kDa)
AkT (56 kDa)

Chapter 6 ADAM17 in macrophages
148
Western blot analysis of the plasma membrane isolates using an anti-ADAM17
antibody demonstrated the presence of protein bands at 85 and 130 kDa in plasma
membrane isolate, Figure 6-2. It appeared that the level of 85 kDa form and the
level of 130 kDa from ADAM17 stayed relatively constant during LPS treatment
except that the expression level of 85 kDa form appeared highest at 12 hours of
LPS treatment, Figure 6-2.
Figure 6-2 ADAM17 expression in plasma membrane isolate from LPS activated macrophages
RAW264.7 macrophages were treated with 10 ng/ml LPS for 0-24 hours. ADAM17, AkT and
-actin expression in plasma membrane isolate (PM) were analysed by Western blot. -actin
acted as a loading control. Absence of cytosolic protein AkT was used to check the
contamination of cytosolic contents in isolation process. The experiment was repeated 4
times.
ADAM17 (85 kDa)
-actin (42 kDa)
ADAM17 (130 kDa)
0 1 4 8 12 18 24
LPS (hrs)
AkT (56 kDa)

Chapter 6 ADAM17 in macrophages
149
6.2.2 ADAM17 activity in TLR4 activated macrophages
The ultimate aim of this chapter was to investigate if the plasma membrane BK
channel regulates the activity of ADAM17. To test this, it was required that ADAM17
activity was measured in the system which allowed the physical interaction between
plasma membrane BK channel and ADAM17 to be maintained. Therefore, although
the majority of ADAM17 assays have been done in cell-free systems, it was
important that this assay was performed in live cells. Reported protocols were used
and adapted to meet the requirement of the experiment (Alvarez-Iglesias et al.,
2005). After initial experiments, using fluorogenic TACE substrate II, a substrate for
ADAM17 in this assay, it was found that the phenol red formulated in the media
used and FBS lead to a high background by interfering with the fluorescence signal
resulting from TACE substrate cleavage. Therefore enzyme activity assays were
carried out with phenol red-free DMEM and FBS free DMEM.
The cells received LPS conditioning for 24 hours, as described in chapter 5, Figure
5-7. This protocol was demonstrated to upregulate the plasma membrane BK
channels in macrophages in chapter 4. At 24 hours, the media was replaced with
FBS and phenol red free DMEM during the macrophages activation with 150 ng/ml
LPS for 3 hours, the substrate was added for the final hour. To preserve the spatial
configuration of cellular components in the macrophages, the enzyme assay was
carried out on plated live cells. As described in 2.15, the wells without TACE II
substrate were prepared in order to eliminate the interference with the data from
endogenous fluorescence of the cells. Per minute change in fluoresce signal in wells
with TACE II substrate after the subtraction of the control measurement was
estimated as ADAM17 membrane sheddase activity. ADAM17 activity data was
reported as the rate of fluorescence signal increase per minute. In all experiments,
ADAM17 inhibitors were used to confirm that increase in fluorescence was due to
the enzyme activity of ADAM17.
The ADAM17 activity in the group which received LPS conditioning showed
significantly higher activity compared to the group which did not receive LPS
conditioning, 1718+/-261fluorescence/minute without LPS conditioning and 2459+/-
119 fluorescence/minute in LPS conditioned cells, p<0.05, Figure 6-3.

Chapter 6 ADAM17 in macrophages
150
Application of 4.5 M GM6001, a general inhibitor for membrane metalloproteases,
diminished fluorescence signal by 86% in groups without LPS conditioning. The
activity in DMSO control was 1718+/-261 fluorescence/minute and 235+/-344
fluorescence/minute in GM6001 treatment group, p<0.05, Figure 6-3. A reduction of
93% was also observed with GM6001 treatment in LPS conditioned macrophages,
where DMSO control groups showed 2459+/-119 fluorescence/minute and GM6001
treatment group showed 183+/-96.4 fluorescence/minute, p<0.001, Figure 6-3.
Treatment with 0.6 M TAPI-0, a specific inhibitor for ADAM17, also significantly
reduced the signal but at lesser degree compared to GM6001. The reduction in
fluorescence signal was 70% in groups without conditioning, where DMSO control
groups had 1718+/-26 fluorescence/minute and TAPI-0 treatment group had 528+/-
13 fluorescence/minute, p<0.05, Figure 6-3. TAPI-0 also reduced ADAM17 activity
by 59% in LPS conditioned groups, where DMSO control group had 2459+/-119
fluorescence/minute and TAPI-0 treatment group had 1019+/-232
fluorescence/minute, p<0.05, Figure 6-3.
The results demonstrated the presence of enzymatically active ADAM17 in TLR4
activated RAW264.7 macrophages. This section also showed that inhibitors for
ADAM17, significantly down-regulated the substrate cleavage. Utilizing these
inhibitors the next section was aimed to investigate its effect of ADAM17 inhibitors
on the release of TNF-, IL-6 and IL-6R.

Chapter 6 ADAM17 in macrophages
151
Figure 6-3 ADAM17 activity in LPS activated macrophages and the effect of LPS conditioning, GM6001 and TAPI-0
RAW264.7 macrophages were incubated with 10 ng/ml LPS for 24 hours to produce LPS
conditioned macrophages. Non conditioned macrophages (ctrl) did not receive this
preconditioning. Subsequently the media was replaced and the cells were stimulated with
150 ng/ml LPS for 3 hours and TACE II substrate was applied at 5 M with/without inhibitors
for ADAM17, 4.5 M GM6001, light grey bars, or 0.3 M TAPI-0, dark grey bars, for the final
hour. Control wells received DMSO, clear bars, and the final concentration of DMSO in all
wells was 0.15%. Fluorescence signals were monitored every 10 minutes for 60 minutes
after the addition of the enzyme substrate and the rate of change in fluorescence between
10 to 50 minutes was expressed as ADAM activity (fluorescence/minute). Bars represent
mean+SEM, n=4, repeated experiments. Statistical significance within groups received no
LPS conditioning or within the groups received LPS conditioning was tested using one-way
ANOVA followed by Dunnett’s test. Statistical significance between non conditioned and LPS
conditioned groups were tested using paired t-test. *p<0.05, ***p<0.001.
LPS conditioned ctrl
GM6001 GM6001 0
500
1000
1500
2000
2500
3000
3500
Flu
ore
ce
nce
.min
-1
TAPI-0 TAPI-0
***
* *
*
*
DMSO Veh.
DMSO Veh.

Chapter 6 ADAM17 in macrophages
152
6.2.3 Effect of a general inhibitor for membrane metalloproteases, GM6001 and
ADAM17 specific inhibitor, TAPI-0, on TNF-and/or IL-6R release from
TLR4 activated macrophages
GM6001 doses at 0.45-4.5 M was applied during 150 ng/ml LPS activation of
macrophages for 4 hours and its effect on TNF- and IL-6R release was assessed.
GM6001 dose dependently inhibited TNF-release with the maximum decrease in
TNF- secretion by 86% at 4.5 M GM6001. The level of TNF- was 12.9+/-4.2
ng/ml in DMSO control and 1.8+/-0.48 ng/ml in the 4.5 M GM6001 treatment group,
p<0.001 Figure 6-4a. IL-6Rrelease was also inhibited by GM6001 with the
maximum reduction of 49% occurring at 1.5 M GM6001. The level of IL-6R was
81.6+/-6.2 pg/ml in DMSO control group and 32.6+/-0.5 pg/ml in the group with 1.5
M GM6001 treatment, p<0.05, Figure 6-4a.
TAPI-0 0.1- 0.6 M was applied to RAW264.7 macrophages during 150 ng/ml LPS
activation for 4 hours. TAPI-0 inhibited the release of TNF- with the maximum
reduction by 70% at 0.3 M TAPI-0. The level of TNF- was 13.0+/-2.2 ng/ml in
DMSO control group and 3.9+/-0.24 ng/ml in the 0.3 M TAPI-0 p<0.05, Figure 6-5a.
TAPI-0 inhibited IL-6R release and with a maximum inhibition of 49% in the groups
treated with 0.3 M TAPI-0. The level of IL-6R was 79.2+/-8.7 pg/ml in DMSO
control group and 41.3+/-12.8 pg/ml in 0.3 M TAPI-0 group, Figure 6-5a.

Chapter 6 ADAM17 in macrophages
153
0
6
12
18
TN
F-
(ng
/ml)
LPS DMSO Veh.
LPS GM6001 (4.5M)
LPS GM6001 (1.5M)
LPS GM6001 (0.45 M)
***
LPS DMSO Veh.
LPS GM6001 (1.5M)
LPS GM6001 (0.45M)
LPS GM6001 (4.5M)
0
30
60
90
120
IL-6
R
(pg
/ml)
*
*
a

Chapter 6 ADAM17 in macrophages
154
Figure 6-4 Effect of GM6001 on TNF-and IL-6R release from LPS activated macrophages
RAW264.7 macrophages were treated with 150 ng/ml LPS with/without 0.45, 1.5 or 4.5 M
GM6001, grey bars, or vehicle control, clear bars. At 4 hours culture media was collected.
The amount of TNF-and IL-6R in conditioned media was measured by ELISA. Bars show
mean+SEM (n≥3). a) shows results from one experiment with n=3 and b) shows combined
data from 3 repeated experiments. Controls received DMSO vehicle (DMSO Veh.) and all
wells had 0.015 % DMSO. Statistical significance of treatment groups compared to DMSO
control group was tested using one-way ANOVA followed by Dunnett’s test.*p<0.05,
**p<0.001.
0
2
4
6
8
10
TN
F-
(ng
/ml)
LPS DMSO
(0.015%)
LPS GM6001 (4.5M)
LPS GM6001 (1.5M)
LPS GM6001 (450nM)
0
25
50
75
100
IL-6
R
(pg
/ml)
LPS DMSO
(0.015%)
LPS GM6001 (4.5M)
LPS GM6001 (1.5M)
LPS GM6001 (450nM)
N.T.
N.T.
b
**
**
**
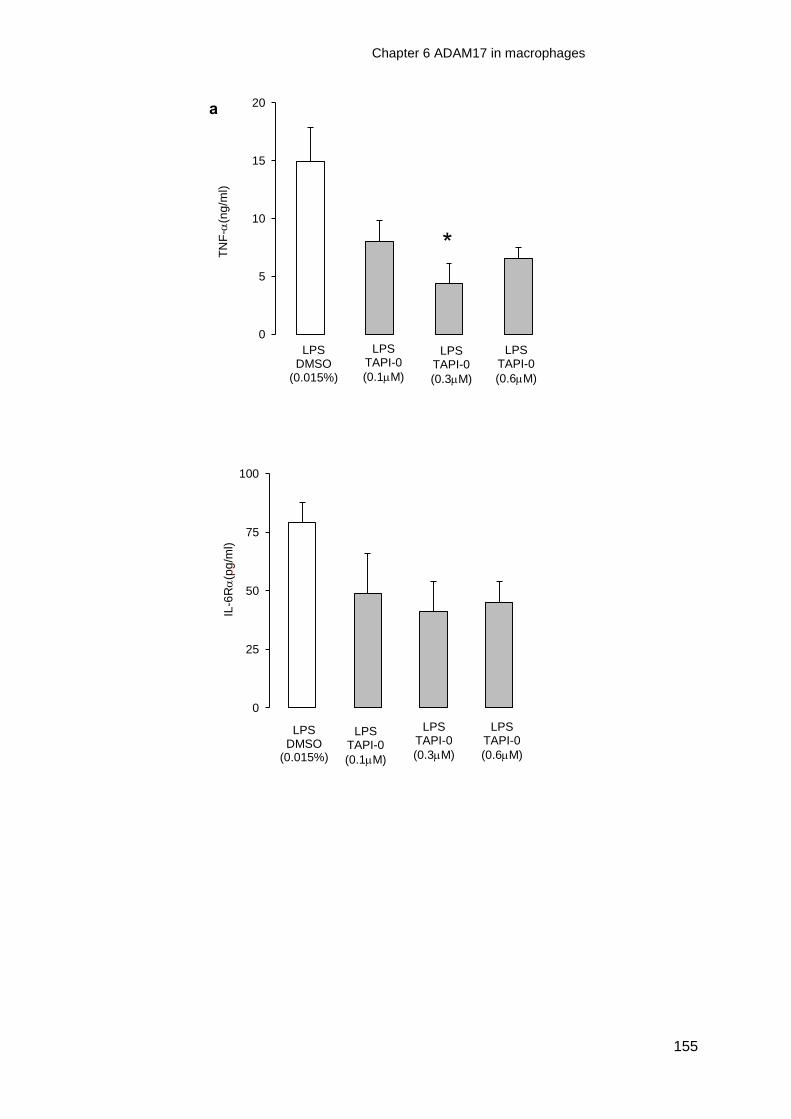
Chapter 6 ADAM17 in macrophages
155
0
5
10
15
20
TN
F-
(ng
/ml)
LPS DMSO
(0.015%)
LPS TAPI-0 (0.1M)
LPS TAPI-0 (0.3M)
LPS TAPI-0 (0.6M)
LPS DMSO
(0.015%)
LPS TAPI-0 (0.1M)
LPS TAPI-0 (0.3M)
LPS TAPI-0 (0.6M)
0
25
50
75
100
IL-6
R
(pg
/ml)
a
*

Chapter 6 ADAM17 in macrophages
156
Figure 6-5 Effect of an ADAM17 inhibitor, TAPI-0, on TNF-and IL-6R release from LPS activated macrophages
RAW264.7 macrophages were treated with 150 ng/ml LPS with/without 0.1, 0.3 or 0.6 M
TAPI-0, grey bars, or vehicle control, clear bars. At 4 hours culture media was collected. The
amount of TNF-and IL-6R in conditioned media was measured by ELISA. Bars represent
mean+SEM (n≥3).a) shows result from one experiment with n=3 and b) shows combined
data from 3 repeated experiments. Controls contained 0.015 % DMSO. Statistical
significance of treatment groups compared to DMSO control group was tested using one-
way ANOVA followed by Dunnett’s test.*p<0.05, **p<0.01, ***p<0.0001.
LPS DMSO
(0.015%)
LPS TAPI-0 (0.1M)
LPS TAPI-0 (0.3M)
LPS TAPI-0 (0.6M)
LPS DMSO
(0.015%)
LPS TAPI-0 (0.1M)
LPS TAPI-0 (0.3M)
LPS TAPI-0 (0.6M)
0
1
2
3
4
TN
F-
(n
g/m
l)
0
25
50
75
100
125
IL-6
R
(pg
/ml)
N.T.
N.T.
b
**
**
** **

Chapter 6 ADAM17 in macrophages
157
6.2.4 Effect of GM6001 and TAPI-0 on IL-6 release from TLR4 activated
macrophages
Application of GM6001 did not affect the release of IL-6. The level of IL-6 was
recorded as 0.65+/-0.059 ng/ml from DMSO control group and 0.62+/-0.045 from
4.5 M GM6001 treatment group, Figure 6-6a. TAPI-0 treatment did not affect the
release of IL-6 and was 0.35+/-0.017 ng/ml in the DMSO control group and 0.32+/-
0.0072 ng/ml in the group received 0.6 M TAPI-0, Figure 6-6a. MTT assay showed
that GM6001 and TAPI-0 treatments had no effect on the viability of cells, Figure 6-
7a.
0
0.03
0.06
0.09
0.12
IL-6
(ng/m
l)
0
0.2
0.4
0.6
0.8
IL-6
(ng/m
l)
LPS DMSO Veh.
LPS TAPI-0
(0.1 M)
LPS TAPI-0
(0.3 M)
LPS TAPI-0
(0.6 M)
LPS DMSO Veh.
LPS GM6001 (4.5 M)
LPS GM6001 (1.5 M)
LPS GM6001 (0.45 M)
a

Chapter 6 ADAM17 in macrophages
158
Figure 6-6 Effect of GM6001 and TAPI-0 on IL-6 release from LPS activated macrophages
RAW264.7 macrophages were treated with 150 ng/ml LPS with 0.45, 1.5 or 4.5 M GM6001
or 0.1, 0.3 or 0.6 M TAPI-0 grey bars, or vehicle control, clear bars. At 4 hours culture
media was collected. The amount of IL-6 in conditioned media was measured by ELISA.
Bars represent mean+SEM (n≥3). a) shows result from one experiment and b) shows
combined data from 3 repeated experiments. Controls groups received DMSO vehicle
(DMSO Veh.) and all wells contained 0.015 % DMSO. Statistical significance of treatment
groups compared to DMSO control group was tested using one-way ANOVA followed by
Dunnett’s test.
0
50
100
150
200
250
IL-6
(p
g/m
l)
0
50
100
150
200
IL-6
(p
g/m
l)
LPS DMSO
(0.015%)
LPS TAPI-0 (0.1M)
LPS TAPI-0 (0.3M)
LPS TAPI-0 (0.6M)
N.T.
LPS DMSO
(0.015%)
LPS GM6001 (4.5M)
LPS GM6001 (1.5M)
LPS GM6001 (450nM)
N.T.
b

Chapter 6 ADAM17 in macrophages
159
0
0.2
0.4
0.6
O.D
. 0
0.2
0.4
0.6
O.D
.
LPS DMSO veh.
LPS GM6001 (4.5M)
LPS GM6001 (1.5M)
LPS GM6001 (4.5M)
LPS DMSO veh.
LPS TAPI-0 (0.1M)
LPS TAPI-0 (0.3M)
LPS TAPI-0 (0.6M)
a
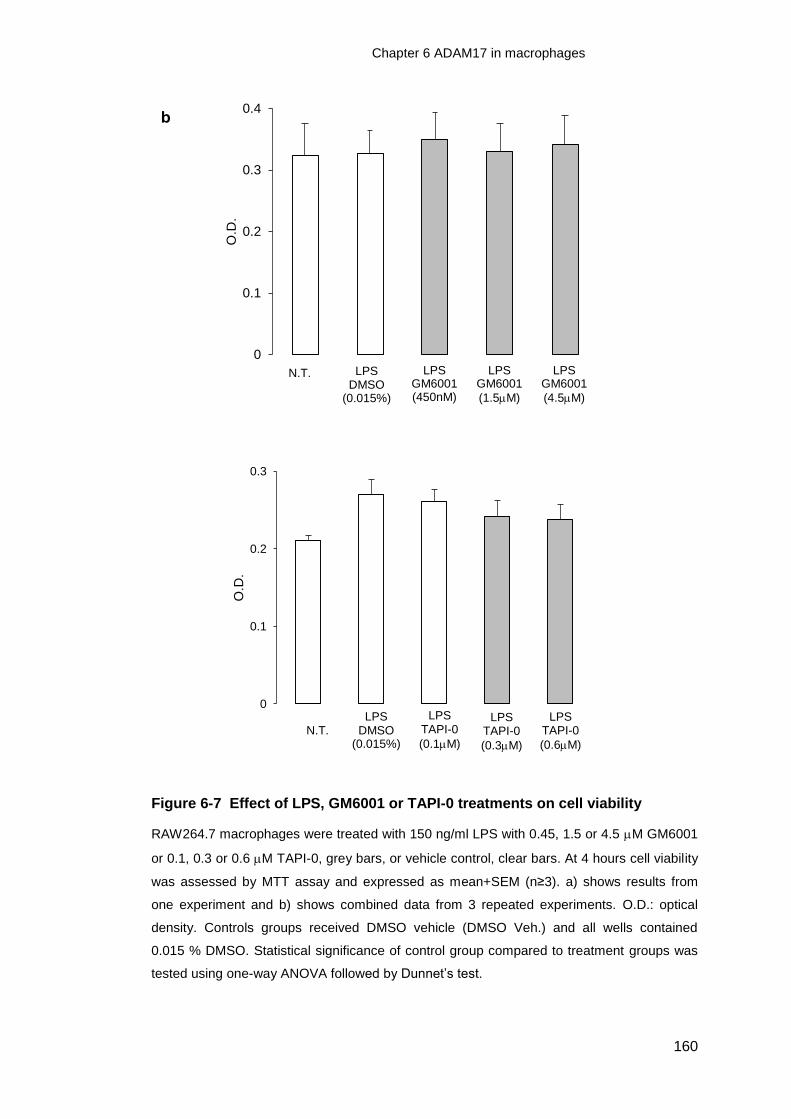
Chapter 6 ADAM17 in macrophages
160
Figure 6-7 Effect of LPS, GM6001 or TAPI-0 treatments on cell viability
RAW264.7 macrophages were treated with 150 ng/ml LPS with 0.45, 1.5 or 4.5 M GM6001
or 0.1, 0.3 or 0.6 M TAPI-0, grey bars, or vehicle control, clear bars. At 4 hours cell viability
was assessed by MTT assay and expressed as mean+SEM (n≥3). a) shows results from
one experiment and b) shows combined data from 3 repeated experiments. O.D.: optical
density. Controls groups received DMSO vehicle (DMSO Veh.) and all wells contained
0.015 % DMSO. Statistical significance of control group compared to treatment groups was
tested using one-way ANOVA followed by Dunnet’s test.
LPS DMSO
(0.015%)
LPS TAPI-0 (0.1M)
LPS TAPI-0 (0.3M)
LPS TAPI-0 (0.6M)
N.T.
LPS DMSO
(0.015%)
LPS GM6001 (4.5M)
LPS GM6001 (1.5M)
LPS GM6001 (450nM)
N.T.
b
0
0.1
0.2
0.3
0.4
O.D
.
0
0.1
0.2
0.3
O.D
.

Chapter 6 ADAM17 in macrophages
161
6.2.5 Effect of IbTX on ADAM17 activity in macrophages
IbTX had no effect on the activity of ADAM17 during 4 hours of LPS activation with
activity being 1545+/-42 fluorescence/minute in LPS only group and 1457+/-108
fluorescence/minute in LPS with IbTX group, N.S., Figure 6-8. Next RAW264.7
macrophages received LPS conditioning to upregulate the plasma membrane BK
channel. 30 nM IbTX was applied to these macrophages and its effect on ADAM17
activity was compared to conditioned macrophages which did not receive IbTX. In
LPS conditioned cells, IbTX treatment dramatically increased ADAM17 activity by
150%. The activity was at 2560+/-228 fluorescence/minute in control LPS group and
at 7095+/-1485 fluorescence/minute in IbTX treatment group, p<0.05, Figure 6-9 . In
all treatment groups, the increase in fluorescence was inhibited by 4.5 M GM6001.
The activity was 166+/-111 fluorescence/minute in the group received LPS and
GM6001, p<0.01 compared to LPS with DMSO control group, and at 394+/-99
fluorescence/minute in the group received LPS, IbTX and GM6001, p<0.001
compared to control. This indicated that fluorescence signals were due to the activity
of membrane bound metalloproteases. In LPS conditioned groups, application of 0.3
M TAPI-0 also inhibited activity of ADAM17 but to a lesser degree than GM6001.
The activity was 1515+/-216 fluorescence/minute in the group received LPS with
TAPI-0, p<0.05 compared to LPS with DMSO control group and was at 1008+/-453
fluorescence/minutes in the group received LPS, IbTX and TAPI-0, p<0.05
compared to the group with LPS, IbTX and DMSO control, Figure 6-9.
The combined data, from repeated (≥ 3 times) experiments, for protein release and
MTT was in line with the described results from individual experiments. These
combined data were presented in Figure 6-3, 6-4, 6-5, 6-6 and 6-7. Statistical
analysis of combined data and individual experimental data demonstrated a similar
pattern of significance between treatment groups. It was higher degree of
significance was seen in combined data compared to individual experimental data.

Chapter 6 ADAM17 in macrophages
162
Figure 6-8 Effect of IbTX on ADAM17 activity of LPS activated of macrophages
RAW264.7 macrophages were stimulated with 150 ng/ml LPS with/without 30 nM IbTX for 3
hours and TACE II substrate was applied at 5 M during the first 1 hour. Fluorescence
signals were monitored in 10 minutes interval for 60 minutes and signals between 10 to 50
minutes used for analysis. The concentration of DMSO in all wells was at 0.15%. ADAM17
activity was measured as per minutes increase in fluorescence signal. Bars show
mean+SEM with n=3 repeated experiments. Statistical significance was tested by paired t-
test.
0
600
1200
1800
Flu
ore
sce
nce
.min
-1
LPS+ IbTX
LPS

Chapter 6 ADAM17 in macrophages
163
Figure 6-9 Effect of IbTX on ADAM17 activity in LPS conditioned macrophages
RAW264.7 macrophages were incubated with 10 ng/ml LPS for 24 hours to produce LPS
conditioned macrophages. Subsequently these macrophages were stimulated with 150
ng/ml LPS for 3 hours and TACE II substrate was applied at 5 M for the final hour. Cells
recived IbTX, grey bars, or media alone, clear bars, with/without inhibitors for ADAM17, 4.5
M GM6001 or 0.6 M TAPI-0. The final DMSO concentration was 0.15 % and DMSO acted
as the vehicle control (DMSO Veh.) Fluorescence signals were monitored in 10 minutes
interval for 60 minutes and the rate of change in fluorescence between 10 to 50 minutes was
used to assess ADAM activity (fluorescence/minute). Bars show mean+SEM with n=3
repeated experiments. Statistical significance between the treatment groups of interest
versus the relevant control group is indicated by horizontal lines and tested using paired t-
test. *p<0.05,**p<0.01,***p<0.0001.
0
2500
5000
7500
10000F
luo
rece
nce
.min
-1
*
IbTX
GM6001 GM6001 TAPI-0 TAPI-0 DMSO Veh.
DMSO Veh.
**
*
***
*

Chapter 6 ADAM17 in macrophages
164
6.2.6 Effect of IbTX on ADAM17 expression
The effect of IbTX on the expression of ADAM17 during LPS activation of
conditioned macrophages was analysed by Western blot in a single preliminary
study. It was difficult to obtain clean blot from this experiment. However at whole cell
level there was 51% increase in the expression of 85 kDa protein band with IbTX
treatment, while the level of 130 kDa protein was not affected, Figure 6-10.
Figure 6-10 Preliminary data. Effect of IbTX on ADAM17 expression
RAW264.7 macrophages were incubated with 10 ng/ml LPS for 24 hours to produce LPS
conditioned macrophages. Subsequently the media was replaced and the conditioned cells
were activated with 150 ng/ml LPS for 4 hours with, grey bars, or without, clear bars, 30nM
IbTX. a) ADAM17 expression was analysed by Western blot and -actin acted as a loading
control. Densitometry analysis shows relative expression of b) 85 kDa band or c) 130 kDa in
IbTX treatment group compared to activated macrophage containing no IbTX only group.
Blots were obtained from a single preliminary experiment.
ADAM17 (85kDa)
LPS LPS+IbTX
-actin (42kDa)
ADAM17 (130kDa)
80 kDa
130 kDa
60 kDa
42 kDa
0
0.5
1
1.5
2
Rela
tive
85
kD
a A
DA
M1
7
exp
ressio
n
0
0.5
1
1.5
Rela
tive
13
0 k
Da A
DA
M1
7
exp
ressio
n
LPS LPS+IbTX LPS LPS+IbTX
a
b c

Chapter 6 ADAM17 in macrophages
165
6.3 Discussion
ADAM17 was first identified in 1997 as a membrane bound enzyme which release
mTNF- from the cell surface (Black et al., 1997; Moss et al., 1997). Since its
discovery, a diverse range of molecules, including cytokines, growth factors,
receptors and adhesion molecules have been found to be the targets for ADAM17.
76 proteins have been identified as substrates for the enzyme (Scheller et al., 2011;
Giebeler and Zigrino, 2016). Many of the substrates for ADAM17 are involved in the
inflammatory responses as well as in other intercellular signalling mechanisms.
Examples include the regulation of TNF- signalling by the cleavage of TNF- and
its receptors, the initiation of epidermal growth factor receptor (EGFR)-mediated
proliferation by ecotodomain shedding of heparin-binding EGF-like growth factor
(HB-EGF) and the modulation of regulated intramembrane proteolysis by cleavage
of Notch receptor. Taken together ADAM17 regulates a wide range of biological
responses, including the immune response, cell survival and growth (Scheller et al.,
2011). However an essential question is how ADAM17 selectively regulates the
release of these substrate molecules in a special manner to initiate specific cellular
signalling pathways?
Due to its important role in biology, ADAM17 is one of the best characterised
members of membrane metalloproteases family. While global ADAM17 knock-out
animals are not viable, the significance of this enzyme is seen in the studies using a
cell specific gene deletion, for example, mice deficient in myeloid ADAM17 are
resistant to septic shock (Horiuchi et al., 2007). The enzyme has been also shown to
mediate key roles in the regeneration and resolution of inflammation. Using a novel
transgenic technique termed exon-induced translational stop, it was demonstrated
that epithelial cells with an approximately 95% reduction in ADAM17 expression had
deficiencies in intestinal barrier function and poor recovery after intestine
inflammation. This was due to insufficient TGFand EGFR signalling (Chalaris et al.,
2010).
Perhaps reflecting its important role, the expression and activity of the protease is
highly regulated, with the protein undergoing a series of maturation processes to
become an active enzyme on the plasma membrane. It has been reported that
ADAM17 is initially translated as a catalytically inactive form with pro-domain
masking the catalytic site of this enzyme. At late Golgi compartment, the pro-domain
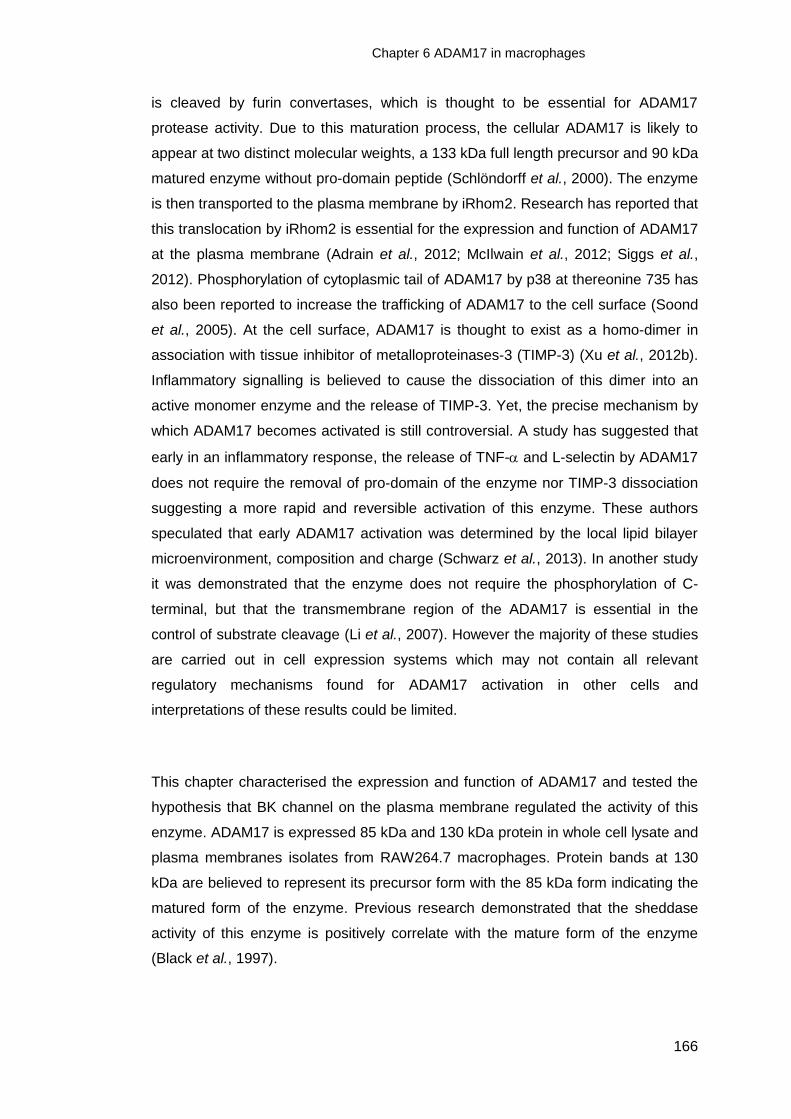
Chapter 6 ADAM17 in macrophages
166
is cleaved by furin convertases, which is thought to be essential for ADAM17
protease activity. Due to this maturation process, the cellular ADAM17 is likely to
appear at two distinct molecular weights, a 133 kDa full length precursor and 90 kDa
matured enzyme without pro-domain peptide (Schlöndorff et al., 2000). The enzyme
is then transported to the plasma membrane by iRhom2. Research has reported that
this translocation by iRhom2 is essential for the expression and function of ADAM17
at the plasma membrane (Adrain et al., 2012; McIlwain et al., 2012; Siggs et al.,
2012). Phosphorylation of cytoplasmic tail of ADAM17 by p38 at thereonine 735 has
also been reported to increase the trafficking of ADAM17 to the cell surface (Soond
et al., 2005). At the cell surface, ADAM17 is thought to exist as a homo-dimer in
association with tissue inhibitor of metalloproteinases-3 (TIMP-3) (Xu et al., 2012b).
Inflammatory signalling is believed to cause the dissociation of this dimer into an
active monomer enzyme and the release of TIMP-3. Yet, the precise mechanism by
which ADAM17 becomes activated is still controversial. A study has suggested that
early in an inflammatory response, the release of TNF- and L-selectin by ADAM17
does not require the removal of pro-domain of the enzyme nor TIMP-3 dissociation
suggesting a more rapid and reversible activation of this enzyme. These authors
speculated that early ADAM17 activation was determined by the local lipid bilayer
microenvironment, composition and charge (Schwarz et al., 2013). In another study
it was demonstrated that the enzyme does not require the phosphorylation of C-
terminal, but that the transmembrane region of the ADAM17 is essential in the
control of substrate cleavage (Li et al., 2007). However the majority of these studies
are carried out in cell expression systems which may not contain all relevant
regulatory mechanisms found for ADAM17 activation in other cells and
interpretations of these results could be limited.
This chapter characterised the expression and function of ADAM17 and tested the
hypothesis that BK channel on the plasma membrane regulated the activity of this
enzyme. ADAM17 is expressed 85 kDa and 130 kDa protein in whole cell lysate and
plasma membranes isolates from RAW264.7 macrophages. Protein bands at 130
kDa are believed to represent its precursor form with the 85 kDa form indicating the
matured form of the enzyme. Previous research demonstrated that the sheddase
activity of this enzyme is positively correlate with the mature form of the enzyme
(Black et al., 1997).

Chapter 6 ADAM17 in macrophages
167
Interestingly, the expressions of ADAM17 followed a distinct pattern between whole
cell and plasma membrane during LPS activation of RAW264.7 macrophages. At
whole cell level, 130 kDa ADAM17 appeared to be present under resting condition
and remained at similar level thought the time course of LPS activation. Taking this
into account, it appeared that there was an increase in the mature form of ADAM17
at 85 kDa, 12 to 18 hours after LPS treatment. In this thesis the ADAM17 at 85 kDa
did not appear as a distinct band, but appeared as smear. The existence of full-
length ADAM17 on the plasma membrane of RAW264.7 macrophages contrasted
with the conclusion from a study using human COS-7 cells, where full length form
ADAM17 was hardly detected in the cell surface protein (Schlöndorff et al., 2000).
Possible explanations for this phenomenon may include differences in the cell
surface protein isolation process, different mode of cell activation and/or species
specific regulation of ADAM17 localisation. While the above measurement of
ADAM17 protein in cell preparation is important, ADAM17 activity in living cells
general gives a better insight into control mechanism for an enzyme.
The use of a fluorogenic substrate for ADAM17 indicated the presence of membrane
sheddase activity of ADAM17 in RAW264.7 macrophages. The use of the general
metalloproteases inhibitor, GM6001, also confirmed that the activity assay was
measuring the membrane metalloproteases activity in RAW264.7 macrophages.
The enzyme activity in these macrophages seemed to increase after LPS treatment.
The data could indicate that LPS may have caused the upregulation of this enzymes
activity in these cells. Importantly a selective inhibitor for ADAM17, TAPI-0 also
inhibited the increased activity. This data support a role for ADAM17 in this assay
and demonstrate the presence of ADAM17 on the plasma membrane on RAW264.7
macrophages. Comparing the degree of inhibition between GM6001 and TAPI-0, it
appeared that the ADAM17 was the dominant metalloprotease responsible for the
breakdown of TACE II substrate.
Cells release cytokines by a variety of mechanisms, such as membrane fusion of
secretary granules and ecoto-domain shedding of transmembrane anchored
cytokines by membrane bound proteases (Stow et al., 2009). Macrophages release
TNF- via the latter mechanisms (Arango Duque and Descoteaux, 2014). In line
with this, the inhibition of membrane metalloproteases by GM6001 significantly
reduced the amount of TNF-release from LPS activated RAW264.7 macrophages.

Chapter 6 ADAM17 in macrophages
168
The release of TNF- was also significantly reduced by the application of TAPI-0, a
selective inhibitor of ADAM17. The maximum inhibition of TNF- release achieved
with this drug was approximately 70%, as compared with 90% with GM6001. The
discrepancy in the inhibitory effects between GM6001 and TAPI-0 could suggest the
involvement of other membrane metalloproteases such as ADAM10 in TNF-
release, with the greater effect of GM6001 being due to the inhibition of both
ADAM10 and ADAM17. However the difference also may due to the potency and/or
half-lives of the two drugs. In this thesis, TAPI-0 was found to have a maximal effect
on TNF- inhibition at 0.3 M. It must be noted that at concentrations above 2 M,
TAPI-0 has been shown to inhibit other metalloproteinases. To further investigate
the release of TNF- in the system, it would be necessary to silence ADAM17 by
gene silencing. However, it is difficult to achieve an effective silencing of protein
expression in RAW264.7 cells as it will be discussed in chapter 7.
The inhibition of membrane metalloproteases by GM6001 and the inhibition of
ADAM17 by TAPI-0 also effectively inhibited the release of IL-6R. It has been
known that ADAM10 and ADAM17 are involved in the release of IL-6RAnother
study has suggested that ADAM10 and ADAM17 may work on different regions for
cleavage. ADAM17 requires its stalk region, a triple serine (3S) motif (Ser-359 to
Ser-361) adjacent to the cleavage site for IL-6R in human, while ADAM10 does not
(Riethmueller et al., 2016). The result with TAPI-0 suggested the involvement of
ADAM17 in releasing IL-6R. To clarify involvement and relative contribution of
ADAM10 and ADAM17 in RAW264.7 macrophages, the application of selective
inhibitors for ADAM10 and gene silencing of individual enzyme, especially ADAM17,
would be suggested.
While GM6001 and TAPI-0 inhibited the release of IL-6R release, the inhibition of
this receptor was to lesser degree compared to the inhibition observed in TNF-
release. In addition to membrane shedding by membrane metalloproteases,
alternative splicing of IL-6R mRNA also leads to the soluble/circulating form of IL-
6R, which is independent of membrane metalloproteases (Rose-John and Heinrich,
1994). It is believed that the contribution of mRNA splicing pathway to IL-6R
production is relatively minor compared to the membrane metalloprotease mediated
shedding. Collectively the results demonstrated that ADAM17 protein is expressed

Chapter 6 ADAM17 in macrophages
169
in RAW264.7 macrophages and functions as a membrane sheddase for mTNF-
and IL-6R. Therefore although other metalloproteases than ADAM17 also cause
the release of TNF- and IL-6R, the data from this chapter would suggest that
ADAM17 mediated sheddase activity is the major mechanism by which TNF- is
released from RAW264.7 macrophages.
Pharmacological inhibition of plasma membrane located BK channels in RAW264.7
macrophages by IbTX dramatically enhanced the activity of ADAM17. This result
was in line with the observation from chapter 5, where IbTX significantly enhanced
TNF- and IL-6R release and reduced cellular mTNF-. Importantly IbTX only
increased ADAM17 in conditioned macrophages. The LPS pre-conditioning is
required to increase the expression of the BK channel on the plasma membrane,
and therefore the data is in line with a role for the channel in regulating ADAM17
activity. The results suggest that BK channels on the plasmas membrane of
macrophages negatively regulate the activity of ADAM17. As a preliminary study, it
was tested if IbTX changed in ADAM17 expression. IbTX appeared to increase the
expression of 85 kDa ADAM17 in LPS stimulated RAW264.7 macrophages.
However it should be noted that this data is from a single preliminary experiment
and this interpretation is limited in the case that the level of 85 kDa ADAM17
expressions and its activity is directly proportional to each other. To confirm this
phenomenon, further experiments is required. The experiments could be suggested
would be first to investigate the correlation between 85 kDa form enzyme and the
activity of ADAM17 in RAW264.7 cells and this experiment also need to be further
repeat with plasma membrane isolate.
The data suggested a role for BK channels in regulating TNF- and IL-6R from
macrophages via activity of ADAM17. This links an ion channel activity to protein
secretory mechanisms and suggests a novel regulatory process for ADAM17.
However this analysis relays on the selectivity of IbTX for BK channels. Therefore in
next chapter an alternative method to inhibit BK channels, gene silencing, was used.

Chapter 7 BK channel silencing
170
Chapter 7 Does BK channel silencing upregulate ADAM17
activity in macrophages?
7.1 Introduction
Chapter 6 showed that a pharmacological inhibition of the plasma membrane BK
channel increased the activity of ADAM17, suggesting a role for BK channels in
regulating the activity of ADAM17. The aim of this chapter is to study the effect of
genetic inhibition of BK channels on ADAM17 to validate the results using IbTX.
The introduction of genetic materials into macrophages is known to be problematic
as transfection reagents/vectors themselves can lead to the activation of
macrophages. In addition stably transfected macrophages can lead to the
generation of sub-clones from a heterogenic macrophage population which may
show different activities compared to the original population. Therefore it was
decided to use transient transfection with siRNA to knock-down BKin RAW264.7
macrophages. The first part of this chapter attempted to optimize the transfection
protocol to inhibit BK expression in RAW264.7 macrophages. Secondly, the effect
of BK silencing on the release of TNF- and IL-6R and the activity of ADAM17
was investigated.
7.2 Results
7.2.1 Optimization of siRNA protocol in macrophages
7.2.1.1 Transfection reagents for the inhibition of BK protein expression
First objective of this chapter was to develop a protocol which silenced BK channels
in RAW264.7 macrophages; two sequences for BK silencing siRNA were acquired
from Qiagen. These sequences were predesigned to be selective against
BKThese two sequences were named sequence 1 and sequence 5. siRNAs were
used at the recommended concentration of 10 nM in the first set of experiments,
which investigated different transfection reagents, namely GeneMute™, Viromer®
and lipofectamine® RNAiMAX with transfection protocols followed as described in
2.2.15. Cells received either no treatment, transfection reagent alone, transfection
reagent containing non-silencing siRNA and BK silencing siRNAs, sequence 1 and
5. BK expression was analysed by Western blot analysis using a mouse
monoclonal anti-mouse BK, L6/60.
GeneMute™ transfection reagent was applied to RAW264.7 macrophages at the
concentration of 10 nM. This reagent utilises a liposome mediated delivery of siRNA.

Chapter 7 BK channel silencing
171
In line with results from chapter 4, Western blot displayed the presence of protein
bands at 120 kDa as a doublet. The application of GeneMute™ reagent by itself
down regulated the expression of BK and there was no apparent difference in the
expression of BKbetween the non-silencing siRNA and BK silencing siRNA
treatment groups. This suggested that GeneMute™ reagent had a non-specific
inhibitory effect on the expression of the protein RAW264.7 cells, Figure 7-1a. The
application of higher concentrations of siRNA with GeneMute™ caused the
significant proportion of cell death. Secondly BK silencing sequence was applied to
macrophages using Viromer® Blue reagent at the concentration of 10 nM. This
transfection reagent uses viral vector mediated delivery of siRNA. With Viromer®
Blue, the addition of non-silencing or silencing siRNA did not alter the expression of
BK in RAW264.7 macrophages, Figure 7-1b. Similar results were obtained
Lipofectamine® RNAiMAX, where BK silencing siRNA had only a minor effect in
the group treated with siRNA sequence 5, Figure 7-1c. Higher concentration of
siRNA with Veromer® Blue resulted in a significant proportion of cell death during
the incubation with siRNA. As a minor silencing effect was seen with
Lipofectamine® RNAiMAX, further optimization was carried out with Lipofectamine®
RNAiMAX.
Figure 7-1 Effect of BK silencing siRNA treatment on BK expression using GeneMute™, Viromer ® Blue or lipofectamine® RNAiMAX reagents
RAW264.7 macrophages were not treated (N.T.) or treated with transection reagent only
(Reagent), non-silencing siRNA (Ns), BK silencing siRNA sequence 1 (sBK1), sequence 5
(sBK5). The transfection reagents used was a) GeneMute™, b) Viromer® Blue or c)
lipofectamine® RNAiMAX. siRNA concentration was 10 nM. The expression of BK was
analysed by Western blot. The experiment was performed 1-2 times. Blots shown are
representative of all experiments.
BK (120 kDa)
N.T. Reagent Ns sBK1 sBK5
a
b
c
BK (120 kDa)
BK (120 kDa)

Chapter 7 BK channel silencing
172
Due to the lack of the effect on BK silencing by the siRNA at 10 nM, a second
series of experiments were carried out using 15 nM siRNA. An additional group
which contained both sequence 1 and sequence 5 (7.5 nM each) was included.
Using Genemute® and Viromer® Blue as transfection reagents in this experiment
resulted in cell death after 48 hours. In comparison, Lipofectamine® RNAiMAX in
combination with non-silencing or silencing siRNA did not cause a noticeable
change in cell morphology or adherence to the culture flasks for at least 72 hours.
Using these conditions, a combination of silencing siRNA sequences 1 and 5
achieved the most effective silencing. However, the overall decrease in BK
expression was still limited to approximately 25% at whole cell lysates compared to
the control which is non-silencing siRNA group, Figure 7-2. The concentration of
siRNA used in subsequent experiments was 15 nM and incubation time was 72
hours.
Figure 7-2 Effect of silencing siRNA on BKexpression at the whole cell in macrophages
RAW264.7 macrophages were not treated (N.T.) or treated with non-silencing siRNA (Ns) or
BK silencing siRNA (sBK), RNAiMAX was used as the transfection reagent. BK, -actin
and Akt expression in whole cell lysate (WC) was assessed by Western blot. Densitometry
analysis of relative BK was normalised to -actin. The amount of BK expression in the no
treatment group and BK silencing siRNA treated group was compared to non-silencing
siRNA control group. Bars represent mean+SEM with n=3 where n is number of blots used
for analysis. The experiment was repeated 4 times.
.
BK (120kDa)
-actin (42kDa)
Akt (56kDa)
WC
0
0.5
1
1.5
2
Rela
tive
B
K
exp
ressio
n
sBK Ns N.T sBK Ns N.T.
b a

Chapter 7 BK channel silencing
173
7.2.2 Effect of BK silencing siRNA on BKexpression on the plasma membrane
isolate
As discussed in chapter 4, BK channels were found on the plasma membrane of
RAW264.7 macrophages and at intracellular sites. As chapter 4, 5 and 6 suggested
that it was the plasma membrane BK channel which was important in the regulation
of ADAM17, the effect of siRNA treatment on the plasma membrane BK channel
was assessed. BK was almost undetected in plasma membrane lysate from non-
treated cells, Figure 7-3a. These results were consistent with the observations made
in chapter 4. Notably, BK was detected at 120 kDa in the plasma membrane
isolate of the groups which received non-silencing siRNA, Figure 7-3a. Densitometry
analysis indicated that there was approximately 5 fold increase in BK expression
on the plasma membrane in the non-silencing siRNA groups compared to the non-
treated control groups, Figure 7-3b. BK silencing siRNA reduced this expression
on the plasma membrane with a 65% reduction when compared to non-silencing
siRNA groups, Figure 7-3b. MTT assay was carried out to assess if the siRNA
treatment affected the viability of the cells.
Figure 7-3 Effect of BK silencing siRNA on BK expression at the plasma membrane in macrophages
RAW264.7 macrophages were not treated (N.T.) or treated with non-silencing siRNA (Ns) or
BK silencing siRNA (sBK) using lipofectamine® RNAiMAX. BK, -actin and Akt
expression in plasma membrane isolates (PM) was assessed by Western blot. Densitometry
analysis of relative BK was normalised to -actin. The amount of BK expression in the no
treatment group and BK silencing siRNA treated group was compared to non-silencing
siRNA control group. Bars represent mean+SEM with n=3 where n is number of blots used
for analysis. The experiment was repeated 3 times.
sBK sBK
BK (120kDa)
Ns ctrl
PM
0
0.3
0.6
0.9
1.2
Rel
ativ
e B
K
exp
ress
ion
Ns ctrl
-actin (42kDa)
Akt (56kDa)
a b

Chapter 7 BK channel silencing
174
7.2.3 Effect of BK silencing siRNA on TNF- release and mTNF- expression
during TLR4 activation
The application of non-silencing siRNA caused the upregulation of BK channel on
the plasma membranes, Figure 7-3. As this was the reason for using the
conditioning protocol in chapter 5, which was applied to the cells in order to
upregulate the BK channel on the plasma membrane, was no longer required in this
chapter. siRNA treated cells were stimulated with 150 ng/ml LPS. BK silencing
significantly increased the release of TNF- by 107%. The level of TNF- was 8.1+/-
0.15 ng/ml in non-silencing siRNA treatment group and 16.9+/-1.9 ng/ml in BK
silencing siRNA treatment group, p<0.05, Figure 7-4a. BK silencing siRNA also
resulted in the reduction in mTNF-expression and densitometry analysis indicated
that BK silencing caused a 66% reduction in mTNF- relative to the expression
seen in the non-silencing siRNA treated group, Figure 7-5. BK silencing siRNA
also significantly increased IL-6R release from RAW264.7 macrophages by 50%
with 103+/-30 pg/ml and 159+/-7.3 pg/ml measured in the no-silencing and BK
silencing siRNA treatment group respectively, p<0.05, Figure 7-6a.
The combined data, from repeated experiments over 3 times, for protein release and
MTT was in line with the described results from individual experiments. These
combined data were presented in Figure 7-4 c and d, and 7-6b. Statistical analysis
of combined data and individual experimental data demonstrated a similar pattern of
significance between treatment groups in TNF- and IL-6R release. It was noted
combined data from repeated experiments reached higher degree of significance in
these molecules release. However the cell viability was shown to be affected by the
siRNA application in combined data with approximately 40% degrease, Figure 7-4d.
This may be due to reported off target effect of siRNA transfection to immune cells
(De Arras et al., 2014), which will be discussed in 7.3 discussion. However the
decrease was equivalent in non-silencing siRNA, which is the control group and
BK silencing siRNA groups, which is the treatment group in the experiment.
Therefore this did not affect the analysis nor interpretation of the effect of BK
channel inhibition.

Chapter 7 BK channel silencing
175
Figure 7-4 TNF- release and cell viability in macrophages after treatment with
BK silencing siRNA
RAW264.7 macrophages were not treated (N.T), clear bar, or treated with non-silencing
siRNA (Ns), black bars, or BK silencing siRNA (sBK), grey bar followed by stimulation with
150 ng/ml LPS. After 4 hours cell culture media were collected. The level of TNF- in
conditioned media was measured by ELISA. Cell viability was assessed by MTT assay. Bars
represent mean+SEM (n≥4). a) & b) shows result from one experiment with n=4 and c) & d)
shows combined data from 3 repeated experiments.
sBK Ns 0
7
14
21
28
35
TN
F-
(ng/m
l)
N.T.
*
0
0.1
0.2
0.3
0.4
0.5
O.D
Ns N.T. sBK
b a
sBK Ns N.T.
**
Ns N.T. sBK
d c
0
4
8
12
16
TN
F-
(ng/m
l)
0
0.1
0.2
0.3
0.4
0.5
0.6
O.D
**
**

Chapter 7 BK channel silencing
176
Figure 7-5 Effect of BK silencing siRNA on mTNF- expression in macrophages
RAW264.7 macrophages were treated with non-silencing siRNA (Ns), black bar, or BK
silencing siRNA (sBK), grey bar followed by stimulation with 150 ng/ml LPS. After 4 hours
cell were collected for Western blot analysis a) mTNF- and -actin. b) Densitometry
analysis shows relative mTNF- expression in the BK silencing siRNA treated group
compared to non-silencing siRNA treated group. Bars represent mean+SEM (n=3), where n
is the number of blots used for analysis. The experiment was repeated 4 times.
Ns
mTNF- (26kDa)
-actin (42kDa)
Ss sBK
0
0.3
0.6
0.9
1.2
Re
lative
mT
NF
-e
xp
ressio
n
Ns sBK
b a

Chapter 7 BK channel silencing
177
Figure 7-6 Effect of BK silencing siRNA on IL-6Rrelease from macrophages
RAW264.7 macrophages were treated with non-silencing siRNA (Ns), black bar, or BK
silencing siRNA (sBK), grey bars, followed by stimulation with 150 ng/ml LPS. After 4 hours
medium was collected for IL-6R measurement by ELISA. Bars represent mean+SEM (n≥4).
a) shows result from one experiment with n=4 and b) shows combined data from 3 repeated
experiments. Statistical significance between the two treatment groups was tested using
paired t-test. *p<0.05, **p<0.01.
0
70
140
210
IL-6
R(
pg
/ml)
**
sBK+LPS Ns+LPS
b a
0
50
100
150
200
IL-6
R(
pg
/ml)
*
sBK+LPS Ns+LPS
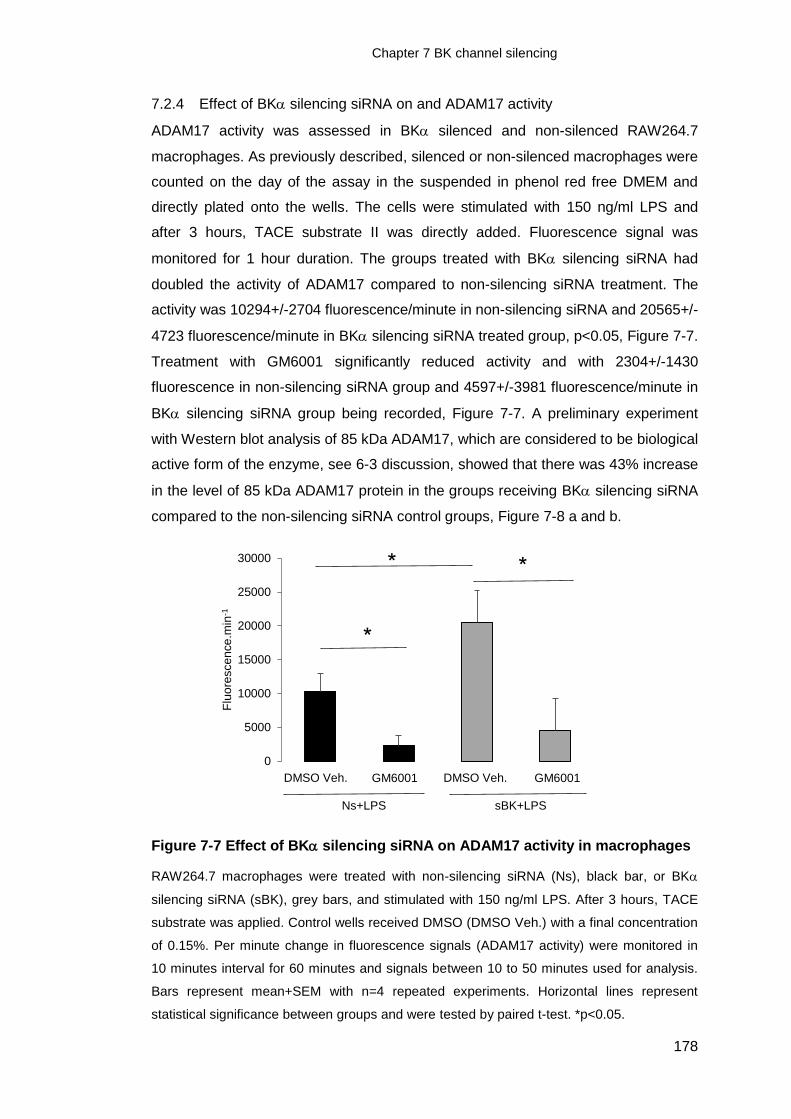
Chapter 7 BK channel silencing
178
7.2.4 Effect of BK silencing siRNA on and ADAM17 activity
ADAM17 activity was assessed in BK silenced and non-silenced RAW264.7
macrophages. As previously described, silenced or non-silenced macrophages were
counted on the day of the assay in the suspended in phenol red free DMEM and
directly plated onto the wells. The cells were stimulated with 150 ng/ml LPS and
after 3 hours, TACE substrate II was directly added. Fluorescence signal was
monitored for 1 hour duration. The groups treated with BK silencing siRNA had
doubled the activity of ADAM17 compared to non-silencing siRNA treatment. The
activity was 10294+/-2704 fluorescence/minute in non-silencing siRNA and 20565+/-
4723 fluorescence/minute in BK silencing siRNA treated group, p<0.05, Figure 7-7.
Treatment with GM6001 significantly reduced activity and with 2304+/-1430
fluorescence in non-silencing siRNA group and 4597+/-3981 fluorescence/minute in
BK silencing siRNA group being recorded, Figure 7-7. A preliminary experiment
with Western blot analysis of 85 kDa ADAM17, which are considered to be biological
active form of the enzyme, see 6-3 discussion, showed that there was 43% increase
in the level of 85 kDa ADAM17 protein in the groups receiving BK silencing siRNA
compared to the non-silencing siRNA control groups, Figure 7-8 a and b.
Figure 7-7 Effect of BK silencing siRNA on ADAM17 activity in macrophages
RAW264.7 macrophages were treated with non-silencing siRNA (Ns), black bar, or BK
silencing siRNA (sBK), grey bars, and stimulated with 150 ng/ml LPS. After 3 hours, TACE
substrate was applied. Control wells received DMSO (DMSO Veh.) with a final concentration
of 0.15%. Per minute change in fluorescence signals (ADAM17 activity) were monitored in
10 minutes interval for 60 minutes and signals between 10 to 50 minutes used for analysis.
Bars represent mean+SEM with n=4 repeated experiments. Horizontal lines represent
statistical significance between groups and were tested by paired t-test. *p<0.05.
0
5000
10000
15000
20000
25000
30000
Flu
ore
sce
nce
.min
-1
GM6001
Ns+LPS sBK+LPS
GM6001
*
*
*
DMSO Veh. DMSO Veh.

Chapter 7 BK channel silencing
179
Figure 7-8 Preliminary data. Effect of BK silencing on ADAM17 expression
RAW264.7 macrophages were treated with non-silencing siRNA (Ns), black bar, or BK
silencing siRNA (sBK), grey bars, followed by the stimulation with 150 ng/ml LPS. After 4
hours the cells were collected for Western blot analysis for a) ADAM17 and -actin. b)
Densitometry analysis shows relative mTNF- expression in BK silencing siRNA treated
group compared to non-silencing siRNA treated group. Blots shown are from a single
preliminary experiment.
ADAM17 (85kDa)
Ns sBK
-actin (42kDa)
0
0.4
0.8
1.2
1.6
Re
lative
85
kD
a A
DA
M1
7
exp
ressio
n
Ns sBK
b a
Chapter 7 BK channel silencing
180
7.3 Discussion
Gene silencing is mediated by the sequence specific degradation of RNA resulting
from the insertion of a short double stranded RNA (small interference RNA: siRNA)
(Hohjoh, 2004). While this technique provides a powerful tool to investigate the roles
of the protein of interest, the effectiveness of silencing is known to vary significantly
between the cell types. In addition, the application of siRNA may cause toxicity or
cellular activation depending on the cellular system investigated. RAW264.7
macrophages and macrophages in general, are regarded as difficult cells to carry
out genetic manipulation of protein expression in vitro (De Arras et al., 2014). In this
chapter, it was found the most efficient transfection protocol developed only resulted
in 25% reduction in whole cell BK expression in these macrophages. This is in line
with a previous observation of RAW264.7 macrophages in which proteins have been
attempted to be silenced (Thompson et al., 1999).
Previous research has showed that siRNA can activate immune responses by TLR3,
TLR7 and/or TLR8. These TLRs recognises double stranded RNA including siRNA
and/or delivery vehicles used for siRNA transfection (Sioud, 2005). TLR3 is
activated in a sequence independent manner and has been suggested to take a
comparatively minor role in siRNA induced inflammation compared to that of TLR7
and TLR8. It has been suggested that the TLR7 and TLR8 preferentially recognise
certain sequences of siRNA, which results in the release of TNF-IL-6 and or
IFN(Karikó et al., 2004; Sioud, 2005; Forsbach et al., 2012). Unlike these
observations, in the protocol used in the transfection did not stimulate TNF-
release from resting RAW264.7 macrophages. Although combined data showed a
decrease in cell viability after non-silencing or silencing siRNA, the decrease in cell
viability between non-silencing control group and silencing siRNA group were
equivalent. Therefore this protocol was used to analyse the role of BK channels in
these cells. Importantly it was noted that a purpose of this protocol was the
upregulation of the plasma membrane BK channels in non-silencing siRNA controls.
The silencing of BK resulted in much lower level of expression of the plasma
membrane BK channels, while not completely inhibiting it. It therefore appears that
the reagent used in protocol, most likely upregulated the expression of BK channels
on the plasma membrane. Fortuitously, this mimicked the effect of LPS conditioning
which was used to upregulate the BK channel on the plasma membrane in chapter 4
and 5. Therefore the direct effect of BK silencing on TLR4 activation of
macrophages was possible without conditioning the macrophages.

Chapter 7 BK channel silencing
181
The reason why BK silencing was 3 times more effective on the plasma membrane
than at whole cells is not known. No literature could be found which investigated the
difference in the effectiveness of siRNA silencing siRNA among cellular locations.
However BK channels appeared on the plasma membranes of the macrophages
after the transfection. It is possible to speculate that the BK silencing siRNA
preferentially inhibited the translation of the newly synthesised BK which were
directed to the cell surface. It would be important to test if the plasma membrane BK
channel came from the pre-existing pool of BK channel protein, i.e. the intracellular
pool, or was newly synthesized. To test this, it would be suggested to activate
macrophages with 10 ng/ml LPS for 4 hours or the non-silencing siRNA to induce
BK the appearance of the channel on the membrane in the presence or absence of
transcription inhibitors and analyse the effect on the channel expression pattern.
However, it must be noted that these experiments may be difficult to interpret. In
addition, the silencing appeared to have less effect on intracellular sources of the
BK channel. This result suggests that the effect which is seen in this chapter with BK
channel silencing is likely to be due to the inhibition of the plasma membrane
located BK channel and rather than the intracellular BK channel. The result also
highlights a problem encountered when using other knockout technologies which
prevent the expression of the channel globally i.e. all cellular location. This makes it
important not only in the relation of a cellular function to the presence of protein, but
also to its cellular location.
BK channel protein knock down increased the activity of the ADAM17 showing a 2.5
fold higher compared to non-silencing siRNA controls. These changes in TNF-and
IL-6R release profiles, mTNF-expression and ADAM17 activity shown in BK
silenced cells were comparable to the effects seen with IbTX, a pharmacological
inhibition of the plasma membrane BK channel, shown in chapter 5 and 6. Although
the data was from a single preliminary experiment, the matured form ADAM17 at 85
kDa appeared upregulated by BK silencing. It would be important to elucidate the
connection between BK channel and ADAM17 activation processes.
In conclusion, non-silencing siRNA treatment led to the upregulation of BK channels
on the plasma membrane in macrophages and BK silencing siRNA significantly

Chapter 7 BK channel silencing
182
down regulated this. Data from this chapter, using gene silencing, support the
hypothesis that the plasma membrane located BK channel negatively regulates
ADAM17 activity and enhances the release of TNF- and IL-6R.

Chapter 8 General discussion
183
Chapter 8 General discussion
Inflammatory cytokines are important in facilitating acute inflammatory responses
and essential in host defence. At the same time, prolonged and/or deregulated
production of cytokines is associated with major diseases. Drugs which target
cytokines and their receptors are used to treat many inflammatory diseases e.g.
Remicade©, an anti-TNF- drug, and Actemra©, an anti-IL-6R drug in rheumatoid
arthritis. While many cytokines have been implicated in the inflammatory response
TNF- is considered the archetype pro-inflammatory cytokine. Macrophages are
known to be the major source of TNF- along with a diverse array of other
inflammatory mediators (Arango Duque and Descoteaux, 2014). It is therefore not
surprising that a significant amount of research has investigated the cellular
mechanisms which regulate the production of this cytokine from macrophages.
However, the involvement of one class of plasma membrane protein, namely ion
channels, in macrophage activation has received relatively little attention.
The general aim of this thesis was to use a variety of techniques to investigate the
role of ion channels in the activation of macrophages in vitro. Specifically, the
expression and role of BK channels in TNF- production from macrophages during
TLR4 activation was investigated.
BK channels are highly selective for K+ ions and characterised by a large voltage
conductance. The channel has important roles in regulating the membrane voltage
and Ca2+ signalling. Their functions and biophysical properties have been
extensively studied in excitable tissues such as in neurons and smooth muscle cells.
Research has also revealed that BK channels are widely expressed in the body, in
many different cell types and at different cellular locations. The BK channel is
regulated by a diverse range of endogenous ligands. Importantly, many of the
regulator ligands for BK channels opening have been hypothesised to have roles in
inflammation e.g. CO. Previous work in the lab had suggested a role for CO
producing enzyme, heme oxygenase, in regulating macrophage functions; however
the precise mechanism by which this enzyme elicits its anti-inflammatory effect is
yet to be elucidated. Finally, while not directly related to this thesis but of importance

Chapter 8 General discussion
184
in any possible follow-up research in vivo, BK channels had been conclusively
shown to have no role in neutrophils in the innate immune response (Essin et al.,
2007).
It was therefore hypothesised that the BK channel may be involved in macrophage
inflammatory responses. However not many studies had been carried out to
characterise the expression of BK channels in these cells and the presence or
absence of the channel in macrophages had not been determined and the technical
approach to study ion channels in these cells had not been established. The
challenge of this thesis was to first optimise the experiment to study ion channel in
macrophages. Therefore a macrophage cell line, which tends to give more
reproducibility to the experiments, was considered to be better for this study than
primary cells. Furthermore literatures suggested that cultures of macrophages while
expressing BK like channels did not show a homogenous expression across the
populations (Gallin, 1991). This was probably because macrophages are highly
heterogenic in nature (Gordon and Taylor, 2005). Human cell lines are not used
predominately monocytic in nature and require to be differentiated before they
become macrophages. The differentiation step adds another level of variability into a
cellular system and produces macrophages which unlikely to be conducive for
electrophysiological techniques. For these reasons, it was decided that a mouse
macrophage cell line, RAW264.7 macrophage is suitable for this study. In addition,
these cells are readily activated by the TLR4 ligand, LPS and TLR4 signalling has
been well characterised in these cells. Therefore it was expected that these cells are
clearer to investigate the effect of BK channel modulation on the TLR4.
The research progressed as follows;
1 The release of TNF-, IL-6 and IL-6R, important proteins in inflammatory
response, from RAW264.7 macrophages during activation of TLR4 was
characterised. The effect of BK channel modulation drugs on the cytokine
release was tested.
2 The expression of BK protein in resting macrophages was investigated by
biochemical analysis, and the channel functionality on the plasma membrane
was tested by electrophysiological recordings.

Chapter 8 General discussion
185
3 BK proteins were found in resting macrophages, therefore the effect of
TLR4 activation on the BK channel expression pattern was investigated.
4 TLR4 activation led to upregulation of BK channels on the plasma membrane
at later time point. The involvement of the plasma membrane expressed BK
channels on the secretion of TNF-, IL-6 and IL-6R was studied using a
selective pharmacological inhibitor for BK channels, IbTX.
5 TNF- release was found to be elevated by IbTX. Next the research proceed
to identify at which steps of TNF- production was affected by the channel
inhibition; mRNA transcription, cellular protein synthesis or release was
investigated.
6 BK channel inhibitor was found to alter the release and retention of mTNF-.
It was hypothesised that BK channels may interact with a TNF- releasing
enzyme, ADAM17. The functions of ADAM17, in macrophages were
characterised. Subsequently the effect of IbTX on the activity of ADAM17
was studied.
7 As IbTX treatment enhanced ADAM17 activity, next BK channel was
inhibited by gene silencing siRNA to verify the results from the
pharmacological inhibition of BK channels.
These research objectives were investigated and the results were presented and
analysed in chapter 3-7. In terms of the general aim of the thesis, if positive data on
BK channel involvement in these cells had not be collected by objective 2, the role
of other ions channels in these cells would have been investigated. This discussion
chapter is aimed to integrate the results chapters, interpret the data in the light of the
current literature and suggest further work arising from this thesis. This chapter also
discusses the importance of this finding in inflammation and other physiological
and/or pathological processes.
The main finding of this thesis is that the plasma membrane expressed BK channel
regulates the activity of ADAM17 in TLR4 activated RAW264.7 macrophages,
chapter 6 and 7. This was demonstrated using both a pharmacological approach
and gene silencing approach. ADAM17 is a membrane sheddase which causes the
release of TNF- from the plasma membrane along with a number of other proteins,
Table 8-1. Data in chapter 6 confirmed the role of this enzyme in the release TNF-
from RAW264.7 macrophages. ADAM17 also appeared to regulate the release of

Chapter 8 General discussion
186
IL-6Rfrom macrophages. However the results indicated that the contribution of
ADAM17 in overall IL-6R release is slightly less than that for TNF-. An alternative
mechanism by which IL-6R is released could include ADAM10, however the data
with the pan metalloproteinase inhibiter, GM6001, would suggest this is not the case
here. Instead, the result suggested the contribution of other mechanisms which are
independent of membrane metalloproteinases. IL-6R is also released by the
alternative splicing of the IL-6R gene (Horiuchi et al., 1994) and this mechanism
may account for the release of IL-6R from RAW264.7 macrophages. Nevertheless,
the BK channel inhibition caused a significant enhancement in IL-6R release.
The analysis of the enzyme protein expression and the effect of membrane
metalloprotease inhibitors supported the hypothesis that it was ADAM17, which is
most likely to be regulated by BK channels, chapter 6 and 7. However the limitation
of this analysis is that the specificity of the membrane metalloprotease inhibitors is
not absolute due to the similarity of the cleavage sites recognised by these enzymes.
Therefore there have been difficulties in synthesising selective inhibitors for each
enzyme. In addition, the members of membrane metalloproteases family can have
overlapping substrate specificities and different members can act on the same
substrate (Khokha et al., 2013). This means that the absence of one
metalloproteinase can be compensates by the other members. A possibility that the
BK channel regulated the activity of other member of ADAMs cannot be excluded. In
particular ADAM10 can act as a sheddase for TNF- and IL-6R Additional
experiments with inhibitors of other metalloproteases and gene silencing may help
to determine the relative contribution of various metalloproteinase to these proteins
release.
Two previous papers (Papavlassopoulos et al., 2006; Essin et al., 2009) have
investigated the role of BK channels in the production of TNF- from macrophages.
Essentially these papers reported that BK channels facilitated TNF- production
(Papavlassopoulos et al., 2006) or had no role (Essin et al., 2009). These results
appear to oppose the finding from this thesis. This difference may due to various
factors. This may include the use of different drugs in the paper, paxilline, instead of
IbTX used in this thesis and the general knock-down of BK channels in these papers,
while in this thesis, the experiments were designed to selectively inhibit plasma

Chapter 8 General discussion
187
membrane expressed BK channels without affecting intracellular BK channels. In
the paper by Papavlassopoulos et al, paxilline, a different reagent from IbTX used in
this thesis, was used as a BK channel blocker at 20 M to confirm the involvement
of the channel. However, in this thesis, paxilline at the concentrations of 3 M and
higher concentrations resulted in a toxic effect of paxilline. It is also noted that the
IC50 for BK channel block with paxilline can be relatively high. Paxilline was not
extensively studied in these thesis because i) the above noted toxicity, ii) the
possible effect on intracellular BK channels due to the lipid nature of the drug, iii)
reported off-target effects of paxilline (Longland et al., 2000; Bilmen et al., 2002). In
the second paper (Essin et al., 2009), TNF- function was investigated from
macrophages isolated from BK knockout mice. Interestingly these researchers
found no effect of knocking out BK channel on TNF- release from macrophages
stimulated for 24 hours with LPS. This thesis showed that only when BK channel
appeared on the plasma membrane did IbTX have an effect and BK channel like
current was sparse in resting macrophages. These authors also found a sparsity of
IbTX sensitive currents in electrophysiological recordings from macrophages
isolated from wildtype animals, which may have had similar phenotype to resting
macrophages. Therefore this data on the BK channel expression in resting
macrophages is also in line with this thesis.
An ELISA assay was used to measure release of TNF-, IL-6 and IL-6R in the
samples which were taken from repeated separate experiments. Although drug
treatment caused relatively consistent effects in terms of ratio to the control groups,
the level of protein release showed variations in some experiments. Similarly, after
the activation with LPS, not all macrophages upregulated the plasma membrane BK
channels and the membrane IbTX sensitive BK current was observed in only around
40% of the total cells recorded. The variability in response to LPS could be due to
the phenotypic heterogeneity in macrophages. Macrophages are known to be highly
plastic and heterogenetic in nature (Ravasi et al., 2002; Gordon et al., 2014). Their
responses to immune stimuli could vary among some cell lines. Although the
variability in basal levels, the results showed consistency in the effect of IbTX on
cytokine release in terms of ratio to control groups, which would suggest that the
interaction between BK channels and ADAM17 may occur consistently among
macrophage populations.

Chapter 8 General discussion
188
Are there any in vivo studies which show a link between the BK channel and
cytokine regulation? Three studies have investigated the involvement of BK
channels in the models of sepsis (Cauwels and Brouckaert, 2008; O’Brien et al.,
2011; Xu et al., 2012a). In the most recent study an exaggerated mortality was seen
in mice by selective knock-out of 1 subunit, targeting vascular smooth muscle BK
channels after the induction of sepsis (Xu et al., 2012a). The study also showed that
this was associated by an increased release of TNF- and IL-6 in these knock-out
animals, suggesting an inhibitory role for BK channel in TNF- release. Although the
data from this thesis does not agree completely, i.e. IL-6 release, this data on
negative effect of BK channels in TNF- release would be in line with the results
within this thesis. Secondary another study suggested that the inhibition of BK
channel and small conductance calcium dependent potassium channels have a
protective effect in endotoxin shock (Cauwels and Brouckaert, 2008). In this study,
animals treated with BK channel inhibitors showed a decreased survival to LPS but
not TNF- induced death. Again this could suggest that BK channels can regulate
LPS activation mechanism. Finally, BK deficient mice have been shown to have
reduced survival in a model of polymicrobial sepsis via mechanisms independent of
hypotension (O’Brien et al., 2011). Again, it would be possible that this may related
to the protective role of BK channels by reducing the release of TNF- shown in this
thesis.
How does the BK channel regulate ADAM17?
It is known that ADAM17 undergoes a series of maturation steps before being
expressed as an active enzyme on the plasma membrane. Reported mechanisms
which are believed to contribute to the control of ADAM17 activity include; cleavage
of the enzyme pro-domain by furin proteases, translocation of ADAM17 to plasma
membrane by iRhom2 and the conversion of ADAM17 dimers to active monomers
by dissociation of the endogenous inhibitor TIMP-3 (Schlöndorff et al., 2000; Adrain
et al., 2012; McIlwain et al., 2012; Siggs et al., 2012; Xu et al., 2012b). The inhibition
of BK channels appeared to show a mild effect on the protein expression of mature
ADAM17, chapter 6 and Chapter 7 chapter 7. Therefore it appears that BK channels
could regulate the enzyme activity at the level of expression or protein stability;
however these results need further elucidation such as the expression at the plasma
membrane level and the relationship between the molecular weight and the activity
of ADAM17. In addition, alternative mechanisms for BK channel regulation of
Chapter 8 General discussion
189
ADAM17 cannot be discounted; for example, the opening of BK channel alters the
membrane potential and ion compositions of the cells. These changes may directly
or indirectly influence the activity of ADAM17. A recent paper suggested that the
externalization of phosphatidylserine facilitates the interaction between the active
site of the ADAM17 and cleavage site of its substrates via negatively charged
residues on the phospholipid (Sommer et al., 2016). In this light, it is possible to
suggest that the membrane depolarization associated with BK channels could
modulate the ADAM17 confirmation to inhibit its activity on the plasma membrane.
However to confirm this, further experiments are needed. Firstly it would be
suggested to investigate the effect on the membrane potential by the BK channel
opening, and the link between membrane potentials and the activity of ADAM17 and
its substrate release.

Chapter 8 General discussion
190
Cytokines, growth factors Receptors Adhesion molecules
Other molecules
TNF- SEMA4D TNFR1 SORT1 GPIba ICAM-1 APP
TGF LAG-3 TNFR2 CD91/APIER GPV VCAM-1 GP
AREG DLL1 P75NTR PTPRF,PTP-LAR
GPVI NCAM CA9
EREG KL-1 IL-6R EPCR SDC1 ALCAM PRNP, PrPc
EPGN, Epigen KL-2 IL-1R2 ACE2 SDC4 L1-CAM KL
NRG1, Heregulin MICA NTR1, TrkA
LOX-1 KDR,VEGR2 EpCAM MUC-1
HB-EGF MICB GHR NPR CD89 DSG2 LYPD3, C4.4A
Pref1 Jagged CSF1R, M-CSFR
HER4/ErbB4 Ptprz CD62L VASN
Fractalkine/ CX3CL1
LTA SORL1 Notch 1 IGF2-R CollagenXVII CD163
TRANCE/RANKL TMEFF2 SORCS1 TNFRSF8, CD30
M6P/IGF2R PVRL4 Nectin-4
PMEL17
CSF-1 FLT-3L SORCS3 TNFRSF5, CD40
CD44
Table 8-1 ADAM17 substrates
Reported substrate molecules for ADAM17. Adapted from Scheller et al., 2011 Trends Immunol. 32, 380–387.
What regulates the expression and activity of BK channels in macrophages?
Chapter 4 demonstrated that the activation of macrophages led to the upregulation
BK channels on the plasma membrane. It is known that not only adaptive immune
cells, but innate immune cells adjust their response to a subsequent stimuli (Netea
et al., 2016). Well-known examples include endotoxin tolerance and priming.
Endotoxin tolerance is a phenomenon whereby the immune cells become
unresponsive to the subsequent immune activation. This phenomenon is widely
observed in vitro, in vivo and in clinical settings (Biswas and Lopez-Collazo, 2009).
Priming is a elevating of inflammatory responses in a subsequent response after the
first immune activation with a low dose of LPS. Chapter 5 showed the down
regulation of released and cellular TNF- protein, and an increase in IL-6 release in
the groups received conditioning dose of LPS for 24 hours in prior to experiments.
This result does not simply mimic the phenomenon of endotoxin tolerance or
priming; however, it would be sufficient to say that the activation of these
macrophages altered their phenotypes. Thus it can be suggested that the

Chapter 8 General discussion
191
upregulation of BK channels may be one of the adaptation mechanisms for
macrophages to subsequent stimuli.
Mechanisms by how macrophages upregulate the BK channels are not clear. This
could be the translocation of the channel protein from the cytosol, or newly
synthesized. It has been reported that chemical modifications of the channel protein
can upregulate the cell surface expression of BK channels (Jeffries et al., 2010; Kyle
and Braun, 2014). In the view of potential drug discovery, it would be useful to
identify the mechanisms of BK channel expression change in macrophages.
Classically the opening of BK channels requires a rise in intracellular Ca2+ and
hyperpolarization, which are often observed in the neurons and smooth muscle cells
(Hoshi et al., 2013). An important question is what increases the opening probability
of BK channels in macrophages. In past decades, research has brought light into
the new factors which markedly alter the activation states of the BK channel. Two
possible factors must be considered when investigating the opening of BK channels,
firstly the involvement/presence of endogenous signalling molecules and secondly
the expression of unique BK subtype or co-assembly with accessory subunits.
Firstly, several endogenous signalling molecules have been reported to activate BK
channels (Hou et al., 2009). Importantly many of these endogenous openers are
known to be produced in macrophages during inflammatory responses. These
molecules include CO, prostaglandin E2 (PGE2) and poly-unsaturated fatty acid
(PUFA). It should be noted that these molecules are associated with down-
regulation of inflammation in leukocytes. CO has been long recognised for its anti-
inflammatory effect and the PUFA is known to promote the resolution of
inflammation (Perretti et al., 2015; Wallace et al., 2015). Many of these openers are
produced in macrophages and act intracellularly on the C-terminus (Hou et al.,
2009). In future work, it would be useful to analyse the production of these
endogenous openers in TLR4 activated macrophages. In addition, recent paper has
reported that the extracellular application of -2-macroglobulin (2M) can activate
BK channels. 2M can be produced by the activated immune cells and therefore
indicates possible connection between the BK channel activation and inflammatory
response (Wakle-Prabagaran et al., 2016).

Chapter 8 General discussion
192
However, the endogenous signalling molecules may not be the only factor when
considering the opening of the channels. During the experiments, a few distinct
resting membrane potential were observed in RAW264.7 cells, which were 60 mV, -
35 mV and/or to -10 mV. This pattern did not change after 10 ng/ml LPS treatment
for 24 hours. With the relatively low membrane potential ranges, it would be
reasonable to assume that there would be other mechanisms which support these
channels to open. The subtype of the BK of macrophage BK channels and
auxiliary subunit composition could alter the gating properties of this channel.
The subtype of BK composition of the channel has not been determined in
macrophages. A wide range of post transcriptional and/or post-translational
modifications of the core channel protein modifies the gating properties of the
channel (Kyle and Braun, 2014). These include alternative splicing of mRNA,
chemical modifications such as phosphorylation and lipid insertion of the channel
protein. Especially the alternative splicing of the channel mRNA results in a unique
type of channel. For instance, BK channels found in glioma cells are known to have
a distinct splice insert in BK at C-terminus. This results in faster activation and
higher Ca2+ sensitivity than those BK channels found in neurons and/or smooth
muscle cells (Liu et al., 2002). BK channels found in mitochondria are known to
have a splice insert in C-terminus, which direct the channel to cardiac mitochondria.
This mitochondrial BK channels are also known to exhibit a high conductance,
voltage dependency and Ca2+ sensitivity (Balderas et al., 2015). In RAW264.7
macrophages, BK are found at a standard molecular weight of 120 kDa. In addition
the auxiliary subunit composition can alter BK channel properties. 1subunit found
in prostate cancer cells has been demonstrated to alter the gating of BK channels
dramatically, enabling the channel to open at negative voltage with physiological
Ca2+ concentrations (Yan and Aldrich, 2010). The co-expression of this subunit is
suggested to enable the opening of this channel in non-excitable tissues. The other
members of subunits: 2-4 also alter the gating properties of the channel shifting
the activation to a more negative voltage, but to a lesser degree than the subunit
(Zhang and Yan, 2014). From the whole cell recordings, the steepness of I-V plot of
the IbTX sensitive current from RAW264.7 cells indicated that the channels would
be less dependent on membrane voltages to open. Therefore it would be useful to
test the expression of any member of subunits in the RAW264.7 macrophages.

Chapter 8 General discussion
193
Furthermore the subunits of BK channels contain LRRs, which are an important
motif for the pathogen recognition by TLRs (Yan and Aldrich, 2012). It would be
suggested to study the sequence similarity of LRRs between BK channel subunits
and TLRs, and intriguing could the BK channel be directly regulated by PAMPs or
DAMPs.
What could be the consequence of BK channel regulation of ADAM17 for TNF-
and IL-6R function?
ADAM17 is one of the best characterised members of membrane
metalloproteinases and known to facilitate the release of at least 76 transmembrane
proteins from cell surface (Gooz, 2010; Scheller et al., 2011; Giebeler and Zigrino,
2016). These substrates include inflammatory cytokines, growth factors, cell
adhesion molecules and receptors, which are particularly important in the regulation
of immune responses. Therefore the proposed interaction between BK channels and
ADAM17 may assign the channel an important role in inflammatory response from
macrophages.
It is known that not only circulating cytokines but membrane bound cytokines
activate signalling cascades, leading to distinct physiological effects. Circulating
TNF- has been reported to preferentially act on the TNFR1, while mTNF-binds to
TNFR2 (Aggarwal et al., 2012). These two signalling cascades have been reported
to induce different cellular responses. The activation of TNFR1 by circulating TNF-
elicits a strong pro-inflammatory effect and the mTNF- signalling through TNFR2
have been known to generate anti-inflammatory/regenerative responses, while still
maintain an anti-microbial effect (McCoy and Tansey, 2008; Sedger and McDermott,
2014). In addition, it has been shown that mTNF- also acts as receptor on the cell
surface and the ligation of TNFRs on neighbouring cells can activate signalling in
the cells. This form is termed reverse signalling and has been suggested to activate
apoptosis in monocytes and macrophages (Juhász et al., 2013). As a main
membrane sheddase for TNF-, ADAM17 regulates the ratio between circulating
and membrane bound form of TNF-and maintains the balance between the
proinflammatory and tissue protective aspects of this cytokine. The inhibition of BK
channels resulted in the enhanced activity of ADAM17. The increased activity of
ADAM17 resulted in a decrease in mTNF- expression and the increased release of

Chapter 8 General discussion
194
TNF- in LPS activated RAW264.7 macrophages, chapter 6 and chapter 7. It is
possible that active plasma membrane BK channel could shift TNF-away from a
predominant pro-inflammatory effect towards a tissue protective by increasing
proportion of mTNF- compared to its circulating form. The brain may represent a
particular interesting area in which to look at this relationship (Probert, 2015).
IL-6R is expressed as both transmembrane form and circulating form. ADAM17
together with ADAM10 are known to facilitate the ecotodomain shedding of IL-6R.
Both membrane bound IL-6R and circulating form IL-6R are able to initiate IL-6
signalling in combination with gp130. However, the signalling via membrane-bound
IL-6R and signalling via circulating IL-6R have different cellular responses
(Schöbitz et al., 1995). IL-6 signalling via transmembrane IL-6R, termed classical
signalling, leads to anti-inflammatory and regenerative process but signalling via
circulating IL-6R is termed trans-signalling and known to promote inflammation.
Especially, the circulating level of IL-6R has the impact on IL-6 trans-signalling
process, which has been shown to have proinflammatory effect. Over activation of
this IL-6 trans-signalling is associated with many inflammatory diseases, including
rheumatoid arthritis and the control of circulating level of IL-6R is important in the
treatment of these diseases (Hunter and Jones, 2015). Cleavage of ecotodomain of
IL-6R by ADAM17 together with ADAM10, could modulate the balance between
the two different signalling pathways, which may represent a new therapeutic target
(Hunter and Jones, 2015).
The ADAM17 is widely expressed and the substrates for ADAM17 are implicated in
numerous fields of biology. Investigation of the proposed BK-ADAM17 interaction in
other tissues which express ADAM17 and BK channels would be useful. In
particular, endothelial cells are abundant in BK and ADAM17. ADAM17 mediated
shedding of growth factors, cytokines and cell adhesion molecules are known to be
important in controlling vascular biology (Dreymueller et al., 2012). In particular,
ADAM17 mediated EGF-like growth factors are involved in endothelial migration
(Maretzky et al., 2011) and have implications in vascular tissue maintenance.
Moreover ADAM17 facilitates the shedding of VCAM-1 and regulates the leukocytes
migration into the tissues, which are essential during acute inflammatory responses
(Garton et al., 2006). It would be useful to study if the modulation of endothelial BK

Chapter 8 General discussion
195
channels have an impact on the phenomenon. Another cells would be important is
glioma cells. These cells express unique variant BK channels as well as ADAM17.
In U87 glioma cells, the enzyme has been suggested to promote migration, self-
renewal and development of malignant phenotype (Zheng et al., 2012; Chen et al.,
2013a, 2013b). It would be important to study the effect of BK channel modulation in
on glioma cell phenotypes.
The BK channel-ADAM17 axis in biology?
This study was carried out in RAW264.7 macrophages. It would be important to
evaluate the plasma membrane BK channel regulation of ADAM17 in animal models.
However upon application to any other models, cautions have to be made to
selectively modulate BK channels which are expressed on the plasma membrane.
The channel has been reported at variable cellular localisation and location specific
functions. In this thesis, nuclear BK channels are found in RAW264.7 macrophages
and further variations in the channel location can be assumed in any types of
macrophages. The conclusion from this thesis does not agree with the data from a
paper using BK knock out mice which showed the down regulation of TNF- in BK
channel deficient animals (Essin et al., 2009). In this thesis, the plasma membrane
BK channels are selectively inhibited by IbTX and siRNA treatment. The difference
in the results in Essin et al‘s paper and this thesis may be due to the difference
between pan BK channel inhibition by knock down and the selective inhibition of the
plasma membrane BK channels. When investigating this phenomenon in BK
transgenic models, first it would be important to generate a model, which selectively
silences the plasma membrane BK channel to achieve the selective inhibition.
The thesis confirmed the expression of BK channels in nucleus of macrophages.
The role for the nuclear BK channels in macrophage inflammatory response would
be investigated in future. A report has shown that BK channel exit in nuclear
membrane of rodent neurons and regulates CREB mediated transcription (Li et al.,
2014). CREB is known to regulate innate inflammatory responses (Wen et al., 2010).
It would be interesting to address whether the nuclear BK channels in macrophages
may interact with the CREB mediated transcription.

Chapter 8 General discussion
196
Future works arising from this thesis
As discussed above, this thesis opened up many possible directions of future
research.
Does this finding have physiological relevance? The application of this study into
animal models would give insight into the significance of the phenomenon of plasma
membrane BK channel regulation of ADAM17 observed in RAW264.7 macrophages.
It is important that the plasma membrane BK channel is selectively inhibited upon
application on animal models.
How BK channels regulate ADAM17? In this thesis, the mechanisms of how plasma
membrane BK channels regulate ADAM17 activity was not addressed. It is
important to investigate this question in the future. Preliminary data suggested that
the BK channel inhibition appeared to affect the expression level of 85 kDa ADAM17
protein, which is considered to be biological active form. The relationship between
the expression level of biological active ADAM17 on plasma membrane and BK
channels could be elucidate further.
Do immune stimuli regulate BK channel expression in macrophages? This thesis
has shown that LPS caused upregulation of BK channels on the plasma membrane
of the macrophages. Also previous research suggested the general trend of
upregulation of K+ channels upon the activation or differentiation of immune cells
(Feske et al., 2015). It would be interesting to investigate if LPS or other immune
stimuli such as IFN or TNF- have this effect on human macrophages.
What is the subtype and subunit compositions of BK channels in macrophages? The
subtype of BK or subunit expression was not determined from this thesis. It is
important to study the expression of subunits and BK subtype to elucidate how
these channel could function in inflammatory responses. Also this characterization
of macrophage BK channels may suggest the possible way of selectively inhibiting
the channels in macrophages.

Chapter 8 General discussion
197
Would ADAM17 and BK channels interact in other types of cells? ADAM17 and BK
channels are widely expressed in the body. These two molecules are observed in
other types of cells including endothelial cells and glioma cells, which express tissue
specific type of BK channels (Baron et al., 1997; Liu et al., 2002). It is useful to
repeat this study of the BK channel regulation of ADAM17 activity to further
elucidate this phenomenon.
Conclusion
In conclusion, inflammatory response is a protective process, which facilitates the
host defence and the maintenance of homeostasis; however, at the same time
deregulated inflammation could lead to many diseases. Signalling cascades
mediated by inflammatory cytokines are essential in the regulation of inflammatory
responses. This thesis investigated the role of BK channels in TNF- production
from macrophages. The BK channels are upregulated on the plasma membrane of
macrophages during the TLR4 activation or siRNA transfection, suggesting the
possible involvement of these channels in adaptation of innate inflammatory
responses. Using the pharmacological modulators and gene silencing, this thesis
demonstrated that the plasma membrane BK channel regulates the activity of
ADAM17 and the release of ADAM17 substrates from RAW264.7 macrophages
during TLR4 activation. ADAM17 is an important regulator of numerous cell
signalling during inflammatory responses, tissue regeneration, growth, respiratory
and cardiovascular systems, and tumour growth. This mechanism of ADAM17
regulation by BK channels would possibly suggest a novel signalling axis, which
directly link an ion channel and the activity of membrane metalloproteinase and
would stimulate future research in these fields. Indeed further work is required,
especially in vivo model, it is hoped that this finding may open up new therapeutic
interventions.
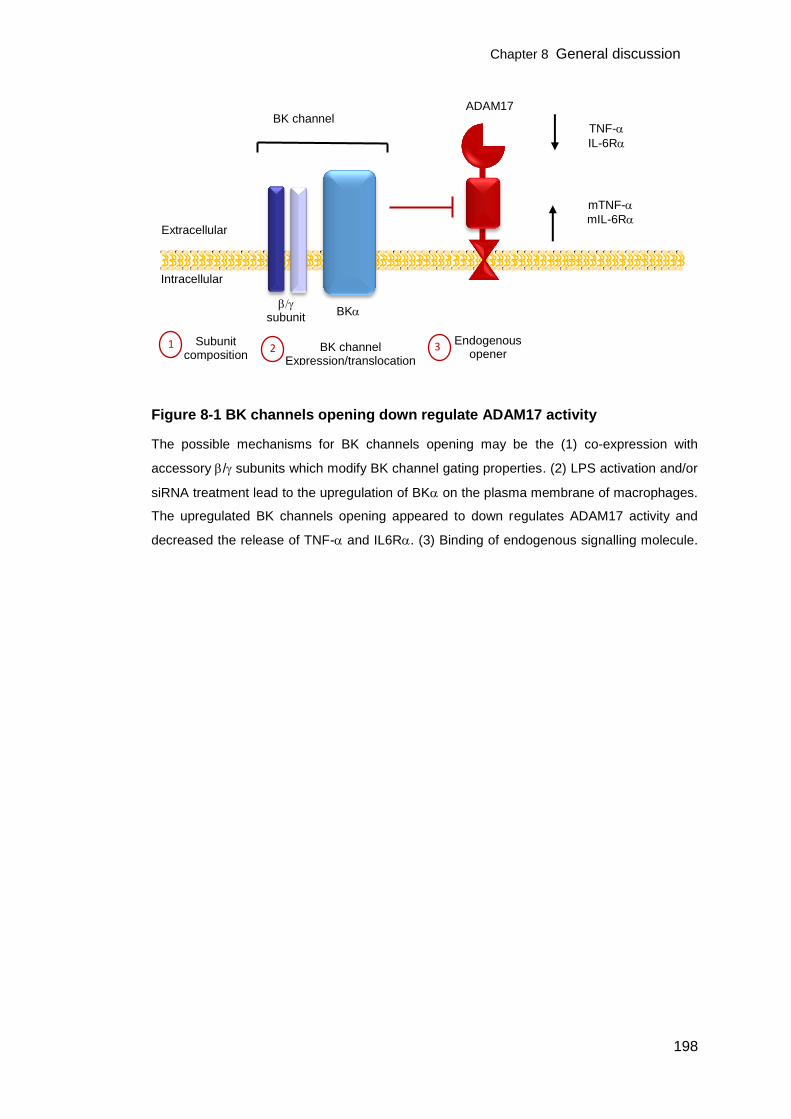
Chapter 8 General discussion
198
Figure 8-1 BK channels opening down regulate ADAM17 activity
The possible mechanisms for BK channels opening may be the (1) co-expression with
accessory / subunits which modify BK channel gating properties. (2) LPS activation and/or
siRNA treatment lead to the upregulation of BK on the plasma membrane of macrophages.
The upregulated BK channels opening appeared to down regulates ADAM17 activity and
decreased the release of TNF- and IL6R. (3) Binding of endogenous signalling molecule.
BK
subunit
BK channel ADAM17
TNF-
IL-6R
mTNF-
mIL-6R
1 Subunit composition
2 BK channel Expression/translocation
3 Endogenous
opener
Extracellular
Intracellular

Chapter 9 Reference
199
Chapter 9 Reference
Adrain, C., Zettl, M., Christova, Y., Taylor, N., and Freeman, M. (2012). Tumor necrosis factor signaling requires iRhom2 to promote trafficking and activation of TACE. Science 335, 225–228.
Aggarwal, B. B., Gupta, S. C., and Kim, J. H. (2012). Historical perspectives on tumor necrosis factor and its superfamily: 25 years later, a golden journey. Blood 119, 651–665.
Akira, S., Uematsu, S., and Takeuchi, O. (2006). Pathogen recognition and innate immunity. Cell 124, 783–801.
Aloj, G., Giardino, G., Valentino, L., Maio, F., Gallo, V., Esposito, T., Naddei, R., Cirillo, E., and Pignata, C. (2012). Severe combined immunodeficiences: new and old scenarios. Int. Rev. Immunol. 31, 43–65.
Alvarez-Iglesias, M., Wayne, G., O’Dea, K. P., Amour, A., and Takata, M. (2005). Continuous real-time measurement of tumor necrosis factor-α converting enzyme activity on live cells. Lab. Invest. 85, 1440–1448.
Angus, D. C., and van der Poll, T. (2013). Severe sepsis and septic shock. N. Engl. J. Med. 369, 840–851.
Antalis, T. M., and Godbolt, D. (1991). Isolation of intact nuclei from hematopoietic cell types. Nucleic Acids Res. 19, 4301.
Arango Duque, G., and Descoteaux, A. (2014). Macrophage cytokines: involvement in immunity and infectious diseases. Front. Immunol. 5, 491.
Balderas, E., Zhang, J., Stefani, E., and Toro, L. (2015). Mitochondrial BKCa channel. Front. Physiol. 6. 104
Baron, A., Frieden, M., and Bény, J.-L. (1997). Epoxyeicosatrienoic acids activate a high-conductance, Ca2+-dependent K+ channel on pig coronary artery endothelial cells. J. Physiol. 504, 537–543.
Behrens, R., Nolting, A., Reimann, F., Schwarz, M., Waldschütz, R., and Pongs, O. (2000). hKCNMB3 and hKCNMB4, cloning and characterization of two members of the large-conductance calcium-activated potassium channel β subunit family. FEBS Lett. 474, 99–106.
Bentzen, B. H., Nardi, A., Calloe, K., Madsen, L. S., Olesen, S.-P., and Grunnet, M. (2007). The small molecule NS11021 is a potent and specific activator of Ca2+-activated big-conductance K+ channels. Mol. Pharmacol. 72, 1033–1044.
Bentzen, B. H., Olesen, S.-P., Rønn, L. C. B., and Grunnet, M. (2014). BK channel activators and their therapeutic perspectives. Front. Physiol. 5. 389.
Berthier, A. et al. (2004). Involvement of a calcium-dependent dephosphorylation of BAD associated with the localization of TRPC-1 within lipid rafts in 7-ketocholesterol-induced THP-1 cell apoptosis. Cell Death Differ. 11, 897–905.
Chapter 9 Reference
200
Bilmen, J. G., Wootton, L. L., and Michelangeli, F. (2002). The mechanism of inhibition of the sarco/endoplasmic reticulum Ca2+ ATPase by paxilline. Arch. Biochem. Biophys. 406, 55–64.
Biswas, S. K., and Lopez-Collazo, E. (2009). Endotoxin tolerance: new mechanisms, molecules and clinical significance. Trends Immunol. 30, 475–487.
Black, R. A. et al. (1997). A metalloproteinase disintegrin that releases tumour-necrosis factor-α from cells. Nature 385, 729–733.
Boghner, B. S., and Lichtenstein, L. M. (1991). Anaphylaxis. N. Engl. J. Med. 324, 1785–1790.
Bonizzi, G., and Karin, M. (2004). The two NF-B activation pathways and their role in innate and adaptive immunity. Trends Immunol. 25, 280–288.
Brenner, R., Jegla, T. J., Wickenden, A., Liu, Y., and Aldrich, R. W. (2000). Cloning and functional characterization of novel large conductance calcium-activated potassium channel β subunits, hKCNMB3 and hKCNMB4. J. Biol. Chem. 275, 6453–6461.
Bringmann, A., Skatchkov, S. N., Biedermann, B., Faude, F., and Reichenbach, A. (1998). Alterations of potassium channel activity in retinal Müller glial cells induced by arachidonic acid. Neuroscience 86, 1291–1306.
Cahalan, M. D., and Chandy, K. G. (2009). The functional network of ion channels in T lymphocytes. Immunol. Rev. 231, 59–87.
Campbell, I. L., Erta, M., Lim, S. L., Frausto, R., May, U., Rose-John, S., Scheller, J., and Hidalgo, J. (2014). Trans-signaling is a dominant mechanism for the pathogenic actions of interleukin-6 in the brain. J. Neurosci. 34, 2503–2513.
Candia, S., Garcia, M. L., and Latorre, R. (1992). Mode of action of iberiotoxin, a potent blocker of the large conductance Ca2+-activated K+ channel. Biophys. J. 63, 583–590.
Carpenter, S., Ricci, E. P., Mercier, B. C., Moore, M. J., and Fitzgerald, K. A. (2014). Post-transcriptional regulation of gene expression in innate immunity. Nat. Rev. Immunol. 14, 361–376.
Carvacho, I., Gonzalez, W., Torres, Y. P., Brauchi, S., Alvarez, O., Gonzalez-Nilo, F. D., and Latorre, R. (2008). Intrinsic electrostatic potential in the BK channel pore: role in determining single channel conductance and block. J. Gen. Physiol. 131, 147–161.
Cauwels, A., and Brouckaert, P. (2008). Critical role for small and large conductance calcium-dependent potassium channels in endotoxemia and TNF toxicity. Shock Augusta Ga 29, 577–582.
Cavaliere, F., Dinkel, K., and Reymann, K. (2005). Microglia response and P2 receptor participation in oxygen/glucose deprivation-induced cortical damage. Neuroscience 136, 615–623.

Chapter 9 Reference
201
Cecchi, X., Wolff, D., Alvarez, O., and Latorre, R. (1987). Mechanisms of Cs+ blockade in a Ca2+-activated K+ channel from smooth muscle. Biophys. J. 52, 707–716.
Chalaris, A. et al. (2010). Critical role of the disintegrin metalloprotease ADAM17 for intestinal inflammation and regeneration in mice. J. Exp. Med. 207, 1617–1624.
Charles A Janeway, J., Travers, P., Walport, M., and Shlomchik, M. J. (2001). Principles of innate and adaptive immunity. Immunobiology: the immune system in health and disease. 5th edition. 711 Third Avenue, 8th Floor New York, NY 10017. Garland Science Ltd. 1-35.
Chen, X., Chen, L., Chen, J., Hu, W., Gao, H., Xie, B., Wang, X., Yin, Z., Li, S., and Wang, X. (2013a). ADAM17 promotes U87 glioblastoma stem cell migration and invasion. Brain Res. 1538, 151–158.
Chen, X., Chen, L., Zhang, R., Yi, Y., Ma, Y., Yan, K., Jiang, X., and Wang, X. (2013b). ADAM17 regulates self-renewal and differentiation of U87 glioblastoma stem cells. Neurosci. Lett. 537, 44–49.
Chen, Z. J. (2005). Ubiquitin signalling in the NF-B pathway. Nat. Cell Biol. 7, 758–765.
Clark, A. R., Dean, J. L. E., and Saklatvala, J. (2003). Post-transcriptional regulation of gene expression by mitogen-activated protein kinase p38. FEBS Lett. 546, 37–44.
Coiret, G., Borowiec, A.-S., Mariot, P., Ouadid-Ahidouch, H., and Matifat, F. (2007). The antiestrogen tamoxifen activates BK channels and stimulates proliferation of MCF-7 breast cancer cells. Mol. Pharmacol. 71, 843–851.
Contreras, G. F. et al. (2013). A BK (Slo1) channel journey from molecule to physiology. Channels 7, 442–458.
Contreras, G. F., Neely, A., Alvarez, O., Gonzalez, C., and Latorre, R. (2012). Modulation of BK channel voltage gating by different auxiliary β subunits. Proc. Natl. Acad. Sci. U. S. A. 109, 18991–18996.
Crawford, E. K., Ensor, J. E., Kalvakolanu, I., and Hasday, J. D. (1997). The role of 3’ poly(A) tail metabolism in tumor necrosis factor-alpha regulation. J. Biol. Chem. 272, 21120–21127.
Croft, M., Benedict, C. A., and Ware, C. F. (2013). Clinical targeting of the TNF and TNFR superfamilies. Nat. Rev. Drug Discov. 12, 147–168.
Cui, J., Yang, H., and Lee, U. S. (2009). Molecular mechanisms of BK channel activation. Cell. Mol. Life Sci. CMLS 66, 852–875.
Davies, L. C., Jenkins, S. J., Allen, J. E., and Taylor, P. R. (2013). Tissue-resident macrophages. Nat. Immunol. 14, 986–995.
De Arras, L., Guthrie, B. S., and Alper, S. (2014). Using RNA-interference to investigate the innate immune response in mouse macrophages. J. Vis. Exp. 93, 51306.

Chapter 9 Reference
202
DeCoursey, T. E., and Cherny, V. V. (1996). Voltage-activated proton currents in human THP-1 monocytes. J. Membr. Biol. 152, 131–140.
DeCoursey, T. E., Kim, S. Y., Silver, M. R., and Quandt, F. N. (1996). Ion channel expression in PMA-differentiated human THP-1 macrophages. J. Membr. Biol. 152, 141–157.
Deng, L., Wang, C., Spencer, E., Yang, L., Braun, A., You, J., Slaughter, C., Pickart,
C., and Chen, Z. J. (2000). Activation of the IB kinase complex by TRAF6 requires a dimeric ubiquitin-conjugating enzyme complex and a unique polyubiquitin chain. Cell 103, 351–361.
Di, A., Gao, X.-P., Qian, F., Kawamura, T., Han, J., Hecquet, C., Ye, R. D., Vogel, S. M., and Malik, A. B. (2011). The redox-sensitive cation channel TRPM2 modulates phagocyte ROS production and inflammation. Nat. Immunol. 13, 29–34.
Donnelly, N., Gorman, A. M., Gupta, S., and Samali, A. (2013). The eIF2α kinases: their structures and functions. Cell. Mol. Life Sci. CMLS 70, 3493–3511.
Douglas, R. M., Lai, J. C. K., Bian, S., Cummins, L., Moczydlowski, E., and Haddad, G. G. (2006). The calcium-sensitive large-conductance potassium channel (BK/MAXI K) is present in the inner mitochondrial membrane of rat brain. Neuroscience 139, 1249–1261.
Dreymueller, D., Pruessmeyer, J., Groth, E., and Ludwig, A. (2012). The role of ADAM-mediated shedding in vascular biology. Eur. J. Cell Biol. 91, 472–485.
Duque, G. A., Fukuda, M., and Descoteaux, A. (2013). Synaptotagmin XI regulates phagocytosis and cytokine secretion in macrophages. J. Immunol. 190, 1737–1745.
Essin, K. et al. (2007). Large-conductance calcium-activated potassium channel activity is absent in human and mouse neutrophils and is not required for innate immunity. Am. J. Physiol. - Cell Physiol. 293, C45–C54.
Essin, K. et al. (2009). BK channels in innate immune functions of neutrophils and macrophages. Blood 113, 1326–1331.
Feske, S. (2009). ORAI1 and STIM1 deficiency in human and mice: roles of store-operated Ca2+ entry in the immune system and beyond. Immunol. Rev. 231, 189–209.
Feske, S., Wulff, H., and Skolnik, E. Y. (2015). Ion channels in innate and adaptive immunity. Annu. Rev. Immunol. 33, 291–353.
Finney-Hayward, T. K. et al. (2010). Expression of transient receptor potential c6 channels in human lung macrophages. Am. J. Respir. Cell Mol. Biol. 43, 296–304.
Fitzgerald, K. A. et al. (2001). Mal (MyD88-adapter-like) is required for toll-like receptor-4 signal transduction. Nature 413, 78–83.
Flannagan, R. S., Jaumouillé, V., and Grinstein, S. (2012). The cell biology of phagocytosis. Annu. Rev. Pathol. Mech. Dis. 7, 61–98.
Chapter 9 Reference
203
Forsbach, A., Müller, C., Montino, C., Kritzler, A., Curdt, R., Benahmed, A., Jurk, M., and Vollmer, J. (2012). Impact of delivery systems on siRNA immune activation and RNA interference. Immunol. Lett. 141, 169–180.
Gessmer, G., Cui, Y-M., Otani, Y., Soom, M., Hoshi, T., and Heinemann, H. S. (2012). Molecular mechanism of pharmacological activation of BK channels, molecular mechanism of pharmacological activation of BK channels. Proc. Natl. Acad. Sci. U. S. 109, 3552–3557.
Gallin, E. K. (1984). Calcium- and voltage-activated potassium channels in human macrophages. Biophys. J. 46, 821–825.
Gallin, E. K. (1991). Ion channels in leukocytes. Physiol. Rev. 71, 775–811.
Gallin, E. K., and Sheehy, P. A. (1985). Differential expression of inward and outward potassium currents in the macrophage-like cell line J774.1. J. Physiol. 369, 475–499.
Galvez, A., Gimenez-Gallego, G., Reuben, J. P., Roy-Contancin, L., Feigenbaum, P., Kaczorowski, G. J., and Garcia, M. L. (1990). Purification and characterization of a unique, potent, peptidyl probe for the high conductance calcium-activated potassium channel from venom of the scorpion Buthus tamulus. J. Biol. Chem. 265, 11083–11090.
Gao, Y., Hanley, P. J., Rinné, S., Zuzarte, M., and Daut, J. (2010). Calcium-activated K+ channel (KCa3.1) activity during Ca2+ store depletion and store-operated Ca2+ entry in human macrophages. Cell Calcium 48, 19–27.
Garton, K. J., Gough, P. J., and Raines, E. W. (2006). Emerging roles for ectodomain shedding in the regulation of inflammatory responses. J. Leukoc. Biol. 79, 1105–1116.
Ghatta, S., Nimmagadda, D., Xu, X., and O’Rourke, S. T. (2006). Large-conductance, calcium-activated potassium channels: structural and functional implications. Pharmacol. Ther. 110, 103–116.
Giebeler, N., and Zigrino, P. (2016). A disintegrin and metalloprotease (ADAM): historical overview of their functions. Toxins 8, 122.
Gooz, M. (2010). ADAM-17: the enzyme that does it all. Crit. Rev. Biochem. Mol. Biol. 45, 146–169.
Gordon, S., and Martinez, F. O. (2010). Alternative activation of macrophages: mechanism and functions. Immunity 32, 593–604.
Gordon, S., Plüddemann, A., and Martinez Estrada, F. (2014). Macrophage heterogeneity in tissues: phenotypic diversity and functions. Immunol. Rev. 262, 36–55.
Gordon, S., and Taylor, P. R. (2005). Monocyte and macrophage heterogeneity. Nat. Rev. Immunol. 5, 953–964.
Guerra, A. N. et al. (2003). Purinergic receptor regulation of LPS-induced signaling and pathophysiology. J. Endotoxin Res. 9, 256–263.

Chapter 9 Reference
204
Häcker, H., Tseng, P.-H., and Karin, M. (2011). Expanding TRAF function: TRAF3 as a tri-faced immune regulator. Nat. Rev. Immunol. 11, 457–468.
Hagar, J. A., Powell, D. A., Aachoui, Y., Ernst, R. K., and Miao, E. A. (2013). Cytoplasmic LPS activates caspase-11: implications in TLR4-independent endotoxic shock. Science 341, 1250–1253.
He, L., Duan, H., Li, X., Wang, S., Zhang, Y., Lei, L., Xu, J., Liu, S., and Li, X. (2016). Sinomenine down-regulates TLR4/TRAF6 expression and attenuates lipopolysaccharide-induced osteoclastogenesis and osteolysis. Eur. J. Pharmacol. 779, 66–79.
Hercule, H. C., Salanova, B., Essin, K., Honeck, H., Falck, J. R., Sausbier, M., Ruth, P., Schunck, W.-H., Luft, F. C., and Gollasch, M. (2007). The vasodilator 17,18-epoxyeicosatetraenoic acid targets the pore-forming BK α channel subunit in rodents. Exp. Physiol. 92, 1067–1076.
Hohjoh, H. (2004). Enhancement of RNAi activity by improved siRNA duplexes. FEBS Lett. 557, 193–198.
Horiuchi, K., Kimura, T., Miyamoto, T., Takaishi, H., Okada, Y., Toyama, Y., and Blobel, C. P. (2007). Cutting edge: TNF-α-converting enzyme (TACE/ADAM17) inactivation in mouse myeloid cells prevents lethality from endotoxin shock. J. Immunol. 179, 2686–2689.
Horiuchi, S., Koyanagiu, Y., Zhouu, Y., Miyamotou, H., Tanakau, Y., Waki, M., Matsumoto, A., Yamamotou, M., and Yamamotof, N. (1994). Soluble interleukin-6 receptors released from T cell or granulocyte/macrophage cell lines and human peripheral blood mononuclear cells are generated through an alternative splicing mechanism. Eur. J. Immunol. 24, 1945–1948.
Horng, T., Barton, G. M., Flavell, R. A., and Medzhitov, R. (2002). The adaptor molecule TIRAP provides signalling specificity for toll-like receptors. Nature 420, 329–333.
Horrigan, F. T., Heinemann, S. H., and Hoshi, T. (2005). Heme regulates allosteric activation of the Slo1 BK channel. J. Gen. Physiol. 126, 7–21.
Hoshi, T., Pantazis, A., and Olcese, R. (2013). Transduction of voltage and Ca2+ signals by Slo1 BK channels. Physiology 28, 172–189.
Hotamisligil, G. S., Shargill, N. S., and Spiegelman, B. M. (1993). Adipose expression of tumor necrosis factor-alpha: direct role in obesity-linked insulin resistance. Science 259, 87–91.
Hou, S., Heinemann, S. H., and Hoshi, T. (2009). Modulation of BKCa channel gating by endogenous signaling molecules. Physiology 24, 26–35.
Hunter, C. A., and Jones, S. A. (2015). IL-6 as a keystone cytokine in health and disease. Nat. Immunol. 16, 448–457.
Jeffries, O., Geiger, N., Rowe, I. C. M., Tian, L., McClafferty, H., Chen, L., Bi, D., Knaus, H. G., Ruth, P., and Shipston, M. J. (2010). Palmitoylation of the S0-S1 linker regulates cell surface expression of voltage- and calcium-activated potassium (BK) channels. J. Biol. Chem. 285, 33307–33314.

Chapter 9 Reference
205
Jenkins, K. A., and Mansell, A. (2010). TIR-containing adaptors in toll-like receptor signalling. Cytokine 49, 237–244.
Jiang, D. et al. (2005). Regulation of lung injury and repair by toll-like receptors and hyaluronan. Nat. Med. 11, 1173–1179.
Jones, S. A., Horiuchi, S., Topley, N., Yamamoto, N., and Fuller, G. M. (2001). The soluble interleukin 6 receptor: mechanisms of production and implications in disease. FASEB J. 15, 43–58.
Juhász, K., Buzás, K., and Duda, E. (2013). Importance of reverse signaling of the TNF superfamily in immune regulation. Expert Rev. Clin. Immunol. 9, 335–348.
Kaczorowski, G. J., and Garcia, M. L. (1999). Pharmacology of voltage-gated and calcium-activated potassium channels. Curr. Opin. Chem. Biol. 3, 448–458.
Kagan, J. C., Su, T., Horng, T., Chow, A., Akira, S., and Medzhitov, R. (2008). TRAM couples endocytosis of toll-like receptor 4 to the induction of interferon-β. Nat. Immunol. 9, 361–368.
Kang, J. Y., and Lee, J.-O. (2011). Structural biology of the toll-like receptor family. Annu. Rev. Biochem. 80, 917–941.
Karikó, K., Bhuyan, P., Capodici, J., and Weissman, D. (2004). Small interfering RNAs mediate sequence-independent gene suppression and induce immune activation by signaling through toll-like receptor 3. J. Immunol. 172, 6545–6549.
Kaufmann, W. A., Kasugai, Y., Ferraguti, F., and Storm, J. F. (2010). Two distinct pools of large-conductance calcium-activated potassium channels in the somatic plasma membrane of central principal neurons. Neuroscience 169, 974–986.
Kawai, T., Adachi, O., Ogawa, T., Takeda, K., and Akira, S. (1999). Unresponsiveness of MyD88-deficient mice to endotoxin. Immunity 11, 115–122.
Kawai, T., and Akira, S. (2006). TLR signaling. Cell death differ. 13, 816–825.
Khokha, R., Murthy, A., and Weiss, A. (2013). Metalloproteinases and their natural inhibitors in inflammation and immunity. Nat. Rev. Immunol. 13, 649–665.
Klimpel, G. R. (1980). Soluble factor(s) from LPS-activated macrophages induce cytotoxic T cell differentiation from alloantigen-primed spleen cells. J. Immunol. 125, 1243–1249.
Knaus, H. G., Folander, K., Garcia-Calvo, M., Garcia, M. L., Kaczorowski, G. J., Smith, M., and Swanson, R. (1994a). Primary sequence and immunological characterization of beta-subunit of high conductance Ca2+-activated K+ channel from smooth muscle. J. Biol. Chem. 269, 17274–17278.
Knaus, H.-G., McManus, O. B., Lee, S. H., Schmalhofer, W. A., Garcia-Calvo, M., Helms, L. M. H., Sanchez, M., Giangiacomo, K., and Reuben, J. P. (1994b). Tremorgenic indole alkaloids potently inhibit smooth muscle high-conductance calcium-activated potassium channels. Biochemistry 33, 5819–5828.
Kobe, B., and Deisenhofer, J. (1995). Proteins with leucine-rich repeats. Curr. Opin. Struct. Biol. 5, 409–416.
Chapter 9 Reference
206
Kopf, M., Baumann, H., Freer, G., Freudenberg, M., Lamers, M., Kishimoto, T., Zinkernagel, R., Bluethmann, H., and Köhler, G. (1994). Impaired immune and acute-phase responses in interleukin-6-deficient mice. Nature 368, 339–342.
Kyle, B. D., and Braun, A. P. (2014). The regulation of BK channel activity by pre- and post-translational modifications. Membr. Physiol. Membr. Biophys. 5, 316.
Launay, P., Cheng, H., Srivatsan, S., Penner, R., Fleig, A., and Kinet, J.-P. (2004). TRPM4 regulates calcium oscillations after T cell activation. Science 306, 1374–1377.
Lenzo, J. C., Turner, A. L., Cook, A. D., Vlahos, R., Anderson, G. P., Reynolds, E. C., and Hamilton, J. A. (2012). Control of macrophage lineage populations by CSF-1 receptor and GM-CSF in homeostasis and inflammation. Immunol. Cell Biol. 90, 429–440.
Li, B. et al. (2014). Nuclear BK channels regulate gene expression via the control of nuclear calcium signaling. Nat. Neurosci. 17, 1055–1063.
Li, G., and Cheung, D. W. (1999). Effects of paxilline on K+ channels in rat mesenteric arterial cells. Eur. J. Pharmacol. 372, 103–107.
Li, X., Pérez, L., Pan, Z., and Fan, H. (2007). The transmembrane domain of TACE regulates protein ectodomain shedding. Cell Res. 17, 985–998.
Liu, D. Y., Scholze, A., Kreutz, R., Wehland-von-Trebra, M., Zidek, W., Zhu, Z. M., and Tepel, M. (2007). Monocytes from spontaneously hypertensive rats show increased store-operated and second messenger-operated calcium influx mediated by transient receptor potential canonical type 3 channels. Am. J. Hypertens. 20, 1111–1118.
Liu, R. et al. (2013). Human β-defensin 2 is a novel opener of Ca2+-activated potassium channels and induces vasodilation and hypotension in monkeys novelty and significance. Hypertension 62, 415–425.
Liu, X., Chang, Y., Reinhart, P. H., and Sontheimer, H. (2002). Cloning and characterization of glioma BK, a novel BK channel isoform highly expressed in human glioma cells. J. Neurosci. 22, 1840–1849.
Longland, C. L., Dyer, J. L., and Michelangeli, F. (2000). The mycotoxin paxilline inhibits the cerebellar inositol 1,4,5-trisphosphate receptor. Eur. J. Pharmacol. 408, 219–225.
Lord Florey (1970). Inflammation in general pathology, 49 Newman Street London: Lloyd-Luke (Medical Books) Ltd, 22–123.
Mackenzie, A. B., Chirakkal, H., and North, R. A. (2003). Kv1.3 potassium channels in human alveolar macrophages. Am. J. Physiol. - Lung Cell. Mol. Physiol. 285, L862–L868.
Manderson, A. P., Kay, J. G., Hammond, L. A., Brown, D. L., and Stow, J. L. (2007). Subcompartments of the macrophage recycling endosome direct the differential secretion of IL-6 and TNFα. J. Cell Biol. 178, 57–69.

Chapter 9 Reference
207
Maretzky, T., Evers, A., Zhou, W., Swendeman, S. L., Wong, P.-M., Rafii, S., Reiss, K., and Blobel, C. P. (2011). Migration of growth factor-stimulated epithelial and endothelial cells depends on EGFR transactivation by ADAM17. Nat. Commun. 2, 229.
McCoy, M. K., and Tansey, M. G. (2008). TNF signaling inhibition in the CNS: implications for normal brain function and neurodegenerative disease. J. Neuroinflammation 5, 45.
McGettrick, A. F., Brint, E. K., Palsson-McDermott, E. M., Rowe, D. C., Golenbock, D. T., Gay, N. J., Fitzgerald, K. A., and O’Neill, L. A. J. (2006). TRIF-related adapter molecule is phosphorylated by PKCε during toll-like receptor 4 signaling. Proc. Natl. Acad. Sci. U. S. A. 103, 9196–9201.
McIlwain, D. R. et al. (2012). iRhom2 regulation of TACE controls TNF-mediated protection against listeria and responses to LPS. Science 335, 229–232.
Medzhitov, R. (2008). Origin and physiological roles of inflammation. Nature 454, 428–435.
Meera, P., Wallner, M., and Toro, L. (2000). A neuronal β subunit (KCNMB4) makes the large conductance, voltage- and Ca2+-activated K+ channel resistant to charybdotoxin and iberiotoxin. Proc. Natl. Acad. Sci. 97, 5562–5567.
Metschnikoff, P. E. (1884). Ueber die beziehung der phagocyten zu milzbrandbacillen. Arch. Für Pathol. Anat. Physiol. Für Klin. Med. 97, 502–526.
Mills, C. D., Kincaid, K., Alt, J. M., Heilman, M. J., and Hill, A. M. (2000). M-1/M-2 macrophages and the Th1/Th2 paradigm. J. Immunol. 164, 6166–6173.
Misonou, H., Menegola, M., Buchwalder, L., Park, E. W., Meredith, A., Rhodes, K. J., Aldrich, R. W., and Trimmer, J. S. (2006). Immunolocalization of the Ca2+-activated K+ channel Slo1 in axons and nerve terminals of mammalian brain and cultured neurons. J. Comp. Neurol. 496, 289–302.
Miyake, K. (2006). Invited review: Roles for accessory molecules in microbial recognition by toll-like receptors. J. Endotoxin Res. 12, 195–204.
Morris, M. C., Gilliam, E. A., and Li, L. (2015). Innate immune programing by endotoxin and its pathological consequences. Mol. Innate Immun. 5, 680.
Moss, M. L. et al. (1997). Cloning of a disintegrin metalloproteinase that processes precursor tumour-necrosis factor-α. Nature 385, 733–736.
Mosser, D. M., and Edwards, J. P. (2008). Exploring the full spectrum of macrophage activation. Nat. Rev. Immunol. 8, 958–969.
Mukhopadhyay, S., Plüddemann, A., and Gordon, S. (2009). Macrophage pattern recognition receptors in immunity, homeostasis and self tolerance. Adv. Exp. Med. Biol. 653, 1–14.
Murray, P. J., and Wynn, T. A. (2011). Protective and pathogenic functions of macrophage subsets. Nat. Rev. Immunol. 11, 723–737.

Chapter 9 Reference
208
Nagasawa, M., Nakagawa, Y., Tanaka, S., and Kojima, I. (2007). Chemotactic peptide fMetLeuPhe induces translocation of the TRPV2 channel in macrophages. J. Cell. Physiol. 210, 692–702.
Napetschnig, J., and Wu, H. (2013). Molecular basis of NF-B signaling. Annu. Rev. Biophys. 42, 443–468.
Nardi, A., Calderone, V., Chericoni, S., and Morelli, I. (2003). Natural modulators of large-conductance calcium-activated potassium channels. Planta Med. 69, 885–892.
Nathan, C. (2002). Points of control in inflammation. Nature 420, 846–852.
Netea, M. G., Joosten, L. A. B., Latz, E., Mills, K. H. G., Natoli, G., Stunnenberg, H. G., O’Neill, L. A. J., and Xavier, R. J. (2016). Trained immunity: a program of innate immune memory in health and disease. Science 352, aaf1098.
O’Brien, A. J., Terala, D., Orie, N. N., Davies, N. A., Zolfaghari, P., Singer, M., and Clapp, L. H. (2011). BK large conductance Ca2+-activated K+ channel deficient mice are not resistant to hypotension and display reduced survival benefit following polymicrobial sepsis. Shock 35, 485–491.
Olesen, S. P., Munch, E., Moldt, P., and Drejer, J. (1994). Selective activation of Ca2+-dependent K+ channels by novel benzimidazolone. Eur. J. Pharmacol. 251, 53–59.
O’Neill, L. A. J., and Bowie, A. G. (2007). The family of five: TIR-domain-containing adaptors in toll-like receptor signalling. Nat. Rev. Immunol. 7, 353–364.
Orio, P., Rojas, P., Ferreira, G., and Latorre, R. (2002). New disguises for an old channel: maxiK channel β-subunits. Physiology 17, 156–161.
Papavlassopoulos, M., Stamme, C., Thon, L., Adam, D., Hillemann, D., Seydel, U., and Schromm, A. B. (2006). MaxiK blockade selectively inhibits the
lipopolysaccharide-induced IB-α/NF-B signaling pathway in macrophages. J. Immunol. 177, 4086–4093.
Perdiguero, E. G., and Geissmann, F. (2016). The development and maintenance of resident macrophages. Nat. Immunol. 17, 2–8.
Perretti, M., Leroy, X., Bland, E. J., and Montero-Melendez, T. (2015). Resolution pharmacology: opportunities for therapeutic innovation in inflammation. Trends Pharmacol. Sci. 36, 737–755.
Poltorak, A. et al. (1998). Defective LPS signaling In C3H/Hej and C57BL/10SCCR mice: mutations In TLR4 gene. Science 282, 2085–2088.
Probert, L. (2015). TNF and its receptors in the CNS: The essential, the desirable and the deleterious effects. Neuroscience 302, 2–22.
Rabani, M. et al. (2011). Metabolic labeling of RNA uncovers principles of RNA production and degradation dynamics in mammalian cells. Nat. Biotechnol. 29, 436–442.
Raetz, C. R. H., and Whitfield, C. (2002). Lipopolysaccharide endotoxins. Annu. Rev. Biochem. 71, 635–700.

Chapter 9 Reference
209
Ravasi, T., Wells, C., Forest, A., Underhill, D. M., Wainwright, B. J., Aderem, A., Grimmond, S., and Hume, D. A. (2002). Generation of diversity in the innate immune system: macrophage heterogeneity arises from gene-autonomous transcriptional probability of individual inducible genes. J. Immunol. Baltim. Md 1950 168, 44–50.
Riethmueller, S., Ehlers, J. C., Lokau, J., Düsterhöft, S., Knittler, K., Dombrowsky, G., Grötzinger, J., Rabe, B., Rose-John, S., and Garbers, C. (2016). Cleavage site localization differentially controls interleukin-6 receptor proteolysis by ADAM10 and ADAM17. Sci. Rep. 6, 25550.
Roos, D. et al. (1996). Mutations in the X-linked and autosomal recessive forms of chronic granulomatous disease. Blood 87, 1663–1681.
Rose-John, S. (2013). ADAM17, shedding, TACE as therapeutic targets. Pharmacol. Res. 71, 19–22.
Rose-John, S., and Heinrich, P. C. (1994). Soluble receptors for cytokines and growth factors: generation and biological function. Biochem. J. 300, 281–290.
Rowe, D. C., McGettrick, A. F., Latz, E., Monks, B. G., Gay, N. J., Yamamoto, M., Akira, S., O’Neill, L. A., Fitzgerald, K. A., and Golenbock, D. T. (2006). The myristoylation of TRIF-related adaptor molecule is essential for toll-like receptor 4 signal transduction. Proc. Natl. Acad. Sci. 103, 6299–6304.
Roy, S., Morayo Akande, A., Large, R. J., Webb, T. I., Camarasu, C., Sergeant, G. P., McHale, N. G., Thornbury, K. D., and Hollywood, M. A. (2012). Structure-activity relationships of a novel group of large-conductance Ca2+-activated K+ (BK) channel modulators: the GoSlo-SR family. ChemMedChem 7, 1763–1769.
Rutledge, H. R., Jiang, W., Yang, J., Warg, L. A., Schwartz, D. A., Pisetsky, D. S., and Yang, I. V. (2012). Gene expression profiles of RAW264.7 macrophages stimulated with preparations of LPS differing in isolation and purity. Innate Immun. 18, 80–88.
Santoni, G., Farfariello, V., Liberati, S., Morelli, M. B., Nabissi, M., Santoni, M., and Amantini, C. (2013). The role of transient receptor potential vanilloid type-2 ion channels in innate and adaptive immune responses. Front. Immunol. 4.34
Sato, S., Sugiyama, M., Yamamoto, M., Watanabe, Y., Kawai, T., Takeda, K., and Akira, S. (2003). Toll/IL-1 receptor domain-containing adaptor inducing IFN-beta (TRIF) associates with TNF receptor-associated factor 6 and TANK-binding kinase 1, and activates two distinct transcription factors, NF-kappa B and IFN-regulatory factor-3, in the toll-like receptor signaling. J. Immunol. Baltim. Md 1950 171, 4304–4310.
Scheller, J., Chalaris, A., Garbers, C., and Rose-John, S. (2011). ADAM17: a molecular switch to control inflammation and tissue regeneration. Trends Immunol. 32, 380–387.
Schilling, T., and Eder, C. (2009). Non-selective cation channel activity is required for lysophosphatidylcholine-induced monocyte migration. J. Cell. Physiol. 221, 325–334.

Chapter 9 Reference
210
Schlöndorff, J., Becherer, J. D., and Blobel, C. P. (2000). Intracellular maturation and localization of the tumour necrosis factor alpha convertase (TACE). Biochem. J. 347, 131–138.
Schöbitz, B., Pezeshki, G., Pohl, T., Hemmann, U., Heinrich, P. C., Holsboer, F., and Reul, J. M. (1995). Soluble interleukin-6 (IL-6) receptor augments central effects of IL-6 in vivo. FASEB J. 9, 659–664.
Schwarz, J. et al. (2013). Short-term TNFα shedding is independent of cytoplasmic phosphorylation or furin cleavage of ADAM17. Biochim. Biophys. Acta BBA - Mol. Cell Res. 1833, 3355–3367.
Sedger, L. M., and McDermott, M. F. (2014). TNF and TNF-receptors: From mediators of cell death and inflammation to therapeutic giants – past, present and future. Cytokine Growth Factor Rev. 25, 453–472.
Shaw, G., and Kamen, R. (1986). A conserved AU sequence from the 3′ untranslated region of GM-CSF mRNA mediates selective mRNA degradation. Cell 46, 659–667.
Shurety, W., Merino-Trigo, A., Brown, D., Hume, D. A., and Stow, J. L. (2000). Localization and post-golgi trafficking of tumor necrosis factor-alpha in macrophages. J. Interferon Cytokine Res. 20, 427–438.
Siggs, O. M., Xiao, N., Wang, Y., Shi, H., Tomisato, W., Li, X., Xia, Y., and Beutler, B. (2012). iRhom2 is required for the secretion of mouse TNFα. Blood 119, 5769–5771.
Singh, H., Stefani, E., and Toro, L. (2012). Intracellular BKCa (iBKCa) channels. J. Physiol. 590, 5937–5947.
Sioud, M. (2005). Induction of inflammatory cytokines and interferon responses by double-stranded and single-stranded siRNAs is sequence-dependent and requires endosomal localization. J. Mol. Biol. 348, 1079–1090.
Sommer, A. et al. (2016). Phosphatidylserine exposure is required for ADAM17 sheddase function. Nat. Commun. 7, 11523.
Song, D. H., and Lee, J.-O. (2012). Sensing of microbial molecular patterns by toll-like receptors. Immunol. Rev. 250, 216–229.
Soond, S. M., Everson, B., Riches, D. W. H., and Murphy, G. (2005). ERK-mediated phosphorylation of Thr735 in TNFα-converting enzyme and its potential role in TACE protein trafficking. J. Cell Sci. 118, 2371–2380.
Srivastava, S., Zhdanova, O., Di, L., Li, Z., Albaqumi, M., Wulff, H., and Skolnik, E. Y. (2008). Protein histidine phosphatase 1 negatively regulates CD4 T cells by inhibiting the K+ channel KCa3.1. Proc. Natl. Acad. Sci. 105, 14442–14446.
Stebbing, M. J., Cottee, J. M., and Rana, I. (2015). The role of ion channels in microglial activation and proliferation – a complex interplay between ligand-gated ion channels, K+ channels, and intracellular Ca2+ in innate and adaptive responses, Front. Immuno.4, 34

Chapter 9 Reference
211
Stoecklin, G., Lu, M., Rattenbacher, B., and Moroni, C. (2003). A constitutive decay element promotes tumor necrosis factor alpha mRNA degradation via an AU-rich element-independent pathway. Mol. Cell. Biol. 23, 3506–3515.
Stoecklin, G., Stubbs, T., Kedersha, N., Wax, S., Rigby, W. F. C., Blackwell, T. K., and Anderson, P. (2004). MK2-induced tristetraprolin:14-3-3 complexes prevent stress granule association and ARE-mRNA decay. EMBO J. 23, 1313–1324.
Stow, J. L., Ching Low, P., Offenhäuser, C., and Sangermani, D. (2009). Cytokine secretion in macrophages and other cells: pathways and mediators. Immunobiology 214, 601–612.
Takeuchi, O., and Akira, S. (2010). Pattern recognition receptors and inflammation. Cell 140, 805–820.
Takeuchi, O., Hoshino, K., and Akira, S. (2000). Cutting edge: TLR2-deficient and MyD88-deficient mice are highly susceptible to staphylococcus aureus infection. J. Immunol. 165, 5392–5396.
Tanaka, T., Narazaki, M., Ogata, A., and Kishimoto, T. (2014). A new era for the treatment of inflammatory autoimmune diseases by interleukin-6 blockade strategy. Semin. Immunol. 26, 88–96.
Tang, X. D., Garcia, M. L., Heinemann, S. H., and Hoshi, T. (2004). Reactive oxygen species impair Slo1 BK channel function by altering cysteine-mediated calcium sensing. Nat. Struct. Mol. Biol. 11, 171–178.
Thompson, C. D., Frazier-Jessen, M. R., Rawat, R., Nordan, R. P., and Brown, R. T. (1999). Evaluation of methods for transient transfection of a murine macrophage cell line, RAW 264.7. BioTechniques 27, 824–826.
Tiedje, C., Ronkina, N., Tehrani, M., Dhamija, S., Laass, K., Holtmann, H., Kotlyarov, A., and Gaestel, M. (2012). The p38/MK2-driven exchange between tristetraprolin and HuR regulates AU-rich element-dependent translation. PLoS Genet. 8, e1002977.
Tzachanis, D., Berezovskaya, A., Nadler, L. M., and Boussiotis, V. A. (2002). Blockade of B7/CD28 in mixed lymphocyte reaction cultures results in the generation of alternatively activated macrophages, which suppress T-cell responses. Blood 99, 1465–1473.
Vallabhapurapu, S., and Karin, M. (2009). Regulation and function of NF-B transcription factors in the immune system. Annu. Rev. Immunol. 27, 693–733.
Valverde, M. A., Rojas, P., Amigo, J., Cosmelli, D., Orio, P., Bahamonde, M. I., Mann, G. E., Vergara, C., and Latorre, R. (1999). Acute activation of maxi-K channels (hslo) by estradiol binding to the β subunit. Science 285, 1929–1931.
Vergara, C., Alvarez, O., and Latorre, R. (1999). Localization of the K+ lock-in and the Ba2+ binding sites in a voltage-gated calcium-modulated channel. J. Gen. Physiol. 114, 365–376.
Vicente, R., Escalada, A., Soler, C., Grande, M., Celada, A., Tamkun, M. M., Solsona, C., and Felipe, A. (2005). Pattern of Kv beta subunit expression in

Chapter 9 Reference
212
macrophages depends upon proliferation and the mode of activation. J. Immunol. Baltim. Md 1950 174, 4736–4744.
Villarroel, A., Alvarez, O., Oberhauser, A., and Latorre, R. (1988). Probing a Ca2+-activated K+ channel with quaternary ammonium ions. Pflüg. Arch. 413, 118–126.
Wakle-Prabagaran, M., Lorca, R. A., Ma, X., Stamnes, S. J., Amazu, C., Hsiao, J. J., Karch, C. M., Hyrc, K. L., Wright, M. E., and England, S. K. (2016). BKCa channel regulates calcium oscillations induced by alpha-2-macroglobulin in human myometrial smooth muscle cells. Proc. Natl. Acad. Sci. 113, E2335–E2344.
Wallace, J. L., Ianaro, A., Flannigan, K. L., and Cirino, G. (2015). Gaseous mediators in resolution of inflammation. Semin. Immunol. 27, 227–233.
Wallner, M., Meera, P., and Toro, L. (1999). Molecular basis of fast inactivation in voltage and Ca2+-activated K+ channels: A transmembrane β-subunit homolog. Proc. Natl. Acad. Sci. 96, 4137–4142.
Walsh, M. C., Lee, J., and Choi, Y. (2015). Tumor necrosis factor receptor- associated factor 6 (TRAF6) regulation of development, function, and homeostasis of the immune system. Immunol. Rev. 266, 72–92.
Wang, C., Deng, L., Hong, M., Akkaraju, G. R., Inoue, J., and Chen, Z. J. (2001). TAK1 is a ubiquitin-dependent kinase of MKK and IKK. Nature 412, 346–351.
Watters, T. M., Kenny, E. F., and O’Neill, L. A. J. (2007). Structure, function and regulation of the toll/IL-1 receptor adaptor proteins. Immunol. Cell Biol. 85, 411–419.
Weischenfeldt, J., Damgaard, I., Bryder, D., Theilgaard-Mönch, K., Thoren, L. A., Nielsen, F. C., Jacobsen, S. E. W., Nerlov, C., and Porse, B. T. (2008). NMD is essential for hematopoietic stem and progenitor cells and for eliminating by-products of programmed DNA rearrangements. Genes Dev. 22, 1381–1396.
Wen, A. Y., Sakamoto, K. M., and Miller, L. S. (2010). The role of the transcription factor CREB in immune function. J. Immunol. 185, 6413–6419.
Whitt, J. P., Montgomery, J. R., and Meredith, A. L. (2016). BK channel inactivation gates daytime excitability in the circadian clock. Nat. Commun. 7, 10837.
Woloski, B. M., and Fuller, G. M. (1985). Identification and partial characterization of hepatocyte-stimulating factor from leukemia cell lines: comparison with interleukin 1. Proc. Natl. Acad. Sci. 82, 1443–1447.
Wu, Y., Yang, Y., Ye, S., and Jiang, Y. (2010). Structure of the gating ring from the human large-conductance Ca2+-gated K+ channel. Nature 466, 393–397.
Wynn, T. A., Chawla, A., and Pollard, J. W. (2013). Macrophage biology in development, homeostasis and disease. Nature 496, 445–455.
Xu, H., Wang, Y., Garver, H., Galligan, J. J., and Fink, G. D. (2012a). Vascular BK channel deficiency exacerbates organ damage and mortality in endotoxemic mice. J. Cardiovasc. Pharmacol. 59, 207–214.

Chapter 9 Reference
213
Xu, N., Chen, C. Y., and Shyu, A. B. (1997). Modulation of the fate of cytoplasmic mRNA by AU-rich elements: key sequence features controlling mRNA deadenylation and decay. Mol. Cell. Biol. 17, 4611–4621.
Xu, P., Liu, J., Sakaki-Yumoto, M., and Derynck, R. (2012b). TACE activation by MAPK-mediated regulation of cell surface dimerization and TIMP3 association. Sci. Signal. 5, ra34-ra34.
Xu, W., Liu, Y., Wang, S., McDonald, T., Eyk, J. E. V., Sidor, A., and O’Rourke, B. (2002). Cytoprotective role of Ca2+- activated K+ channels in the cardiac inner mitochondrial membrane. Science 298, 1029–1033.
Yamamoto, M. et al. (2002). Essential role for TIRAP in activation of the signalling cascade shared by TLR2 and TLR4. Nature 420, 324–329.
Yamamoto, M. et al. (2003a). Role of adaptor TRIF in the MyD88-independent toll-like receptor signaling pathway. Science 301, 640–643.
Yamamoto, M., Sato, S., Hemmi, H., Uematsu, S., Hoshino, K., Kaisho, T., Takeuchi, O., Takeda, K., and Akira, S. (2003b). TRAM is specifically involved in the toll-like receptor 4-mediated MyD88-independent signaling pathway. Nat. Immunol. 4, 1144–1150.
Yamamoto, S. et al. (2008). TRPM2-mediated Ca2+ influx induces chemokine production in monocytes that aggravates inflammatory neutrophil infiltration. Nat. Med. 14, 738–747.
Yan, J., and Aldrich, R. W. (2010). LRRC26 auxiliary protein allows BK channel activation at resting voltage without calcium. Nature 466, 513–516.
Yan, J., and Aldrich, R. W. (2012). BK potassium channel modulation by leucine-rich repeat-containing proteins. Proc. Natl. Acad. Sci. U. S. A. 109, 7917–7922.
Yasukawa, K., Hirano, T., Watanabe, Y., Muratani, K., Matsuda, T., Nakai, S., and Kishimoto, T. (1987). Structure and expression of human B cell stimulatory factor-2 (BSF-2/IL-6) gene. EMBO J. 6, 2939–2945.
Yoshizaki, K., Nakagawa, T., Fukunaga, K., Tseng, L. T., Yamamura, Y., and Kishimoto, T. (1984). Isolation and characterization of B cell differentiation factor (BCDF) secreted from a human B lymphoblastoid cell line. J. Immunol. 132, 2948–2954.
Yu, M., Liu, S., Sun, P., Pan, H., Tian, C., and Zhang, L. (2016). Peptide toxins and small-molecule blockers of BK channels. Acta Pharmacol. Sin. 37, 56–66.
Yuan, P., Leonetti, M. D., Pico, A. R., Hsiung, Y., and MacKinnon, R. (2010). Structure of the human BK channel Ca2+-activation apparatus at 3.0 å resolution. Science 329, 182–186.
Zhang, J., and Yan, J. (2014). Regulation of BK channels by auxiliary γ subunits. Membr. Physiol. Membr. Biophys. 5, 401.
Zheng, X., Jiang, F., Katakowski, M., Lu, Y., and Chopp, M. (2012). ADAM17 promotes glioma cell malignant phenotype. Mol. Carcinog. 51, 150–164.

Chapter 9 Reference
214
Zhou, Y., and Lingle, C. J. (2014). Paxilline inhibits BK channels by an almost exclusively closed-channel block mechanism. J. Gen. Physiol. 144, 415–440.

Appendix
215
Appendix
Prizes
Finalist, The New Investigator Award, A novel role for BK channel in regulating
metalloprotease activity, 12th World Congress on Inflammation, August 2015 Boston.
Published abstracts
Yoshida, M., Gibb. A. J., Willis. D. (2012) Iberiotoxin block of endotoxin tolerance in
a mouse macrophage cell line. P008. British Pharmacological Society Winter
Meeting, December 2012 London.
Yoshida, M., Willis, D. (2015) A novel role for BK channel in regulating
metalloprotease activity. B266. 12th World Congress on Inflammation, August 2015
Boston.
Scholarship
University College London Old Students’ Association Trust Scholarships, 2014