Retrieving near-surface soil moisture from Radarsat SAR data
11
WATER RESOURCES RESEARCH, VOL. 35, NO. 5, PAGES 1569-1579, MAY 1999 Retrieving near-surface soil moisture from Radarsat SAR data Getu Fana Biftu and Thian Yew Gan Department of Civil and Environmental Engineering, Universityof Alberta, Edmonton,Alberta, Canada Abstract. On the basis of sixRadarsat synthetic aperature radar (SAR) images acquired over the Paddle River Basin, Alberta, and 1350 field soil moisture data collected from nine selected sites of the basinin the samedays, this study demonstrated the feasibility of retrieving near-surface soil moisture (5-10 cmdepth) fromRadarsat SAR data. Between two retrieval algorithms, a linear regression and the theoretical integral equationmodel (IEM) of Funget al. [1992], the results indicate that IEM performed consistently better than the regression model. However,the performance of both models generally deteriorates when the basinis nearly saturated, which is the case for September 10 and 27, 1996,with a basinsaturation level of 82 and 75%, respectively. With respect to Radarsat's configuration and IEM'ssurface parameters, it isfound that radar backscattering o 'ø is highlysensitive to the surface rms height,especially for a relatively smooth surface and a Gaussian correlation function. From thesemivariogram of measured soil moisture and o 'ø it is found that the homogeneity assumption of spatialinterpolation as a functionof distance lag breaksdown only at a distance lag of about 200-275 m. Apparently,spatial interpolation methods based on this assumption can only interpolatesoil moisture meaningfully for single land useplots of several hundredmetersin size. 1. Introduction Albeit on a global basis, the surface soilmoisture represents only0.05% of the world's total fresh water [Chow et al., 1988]; the amount of soil moisture is important for cropdevelopment, plant stress, andyields [e.g., Dobson and Ulaby, 1986; Brown et al., 1993].It is a major component of the hydrologic cycle, and its regional status is an important criterionfor irrigationman- agement and for the selection of crop types [O'Brien, 1992]. However, the statusof soil moisture is difficult to assess on a regional scale accurately because it is highlyvariablespatially and temporally, and ground measurements that are time con- suming and expansive to collectare always limited. For overtwo decades, research on the useof remote-sensing techniques to retrieve soil moisturefrom microwave sensors over large areasshows that this is possible with airborneand satellite active microwave, for example, ERS-1 (C band) and JERS (L band),undera variety of topographic and land cover conditions [e.g.,Ulaby et al., 1979; Mohan et al., 1990; Rotunno Filho et al., 1996; Altese et al., 1996;Crevier et al., 1996].Rela- tionships between radarbackscattering echoes andsurface soil moisture for bare ground or agricultural land havelong been established [e.g., Ulaby et al., 1982, 1986; Schmugge, 1985]. Studies show that for single-frequency and single-polarization systems, the optimum radar configuration for retrieving soil moisture wouldbe a C bandradar (5.3 Ghz) operating in VV and/or HH polarizations and at 10ø-20 øincidence angle, where the effects of surface roughness and vegetation cover on the radar echoesare minimal [Ulaby et al., 1979; Dobsonand Ulaby,1981; Bernard et al., 1982; Mohan et al., 1990]. Lately, the CanadianRadarsatsatellitecarrying a C band, synthetic apertureradar (SAR) hasbeen designed with opti- mum radar parameters for monitoring near-surface soilmois- ture at HH polarization andbeammodes operating at 10ø-60 ø Copyright1999 by the American Geophysical Union. Paper number 1998WR900120. 0043-1397/99/1998WR900120509.00 incidence angle,10-100 m resolution, and 50-500 km ground swaths [Brown et al., 1993; Parashar et al., 1993].Also, Radar- sat's frequent coverage provides an opportunity to monitorthe dynamics of soilmoisture change in Canada andotherpartsof the world. 2. Research Objectives The primaryobjective of this study is to assess the feasibility of retrievingnear-surface (5-10 cm deep) soil moisture of agricultural/ranch lands in the Canadian Prairies using an em- pirical and a theoretical model from Radarsat SAR data. The second objective is to examine the spatial variabilityof near- surface soil moisture usinga semivariogram and the homoge- neity assumption (spatial correlation asa function of distance- lag only) often usedfor spatially interpolating soil moisture. The site chosenfor this study is the Paddle River Basin of central Alberta in the Canadian Prairies. 3. Study Site Description The PaddleRiver Basin(53ø52'N latitude, 115ø32'W longi- tude) of central Alberta, witha basin area of 265 km 2 (Figure 1), lies within the western edge of the Alberta Plains,in the koeppen climatic zone (shortand cool summer), where mean temperatureranges from -15.5øC in Januaryto + 15.6øC in July and annualmean precipitation is about 508 mm [Pretula and Ko, 1982]. Its land cover consists of about 50% mixed forest, 21% coniferous forest,15% agricultural land, 11% pas- ture land with shortgrass, 2% water body, and 1% relatively impervious lands. Forest,brushlands, and tree muskegs cover •80% of the headwater region of the basin.The deciduous, Aspen forest is the predominant vegetation type [Alberta En- ergyand Natural Resources, 1977]. The basin has moderate hydrological response (an annualstreamflow/rainfall ratio of about0.28) with an average land slope of 3-5%. The major soil groupof the study area is the Hubalta series 1569
-
Upload
independent -
Category
Documents
-
view
1 -
download
0
Transcript of Retrieving near-surface soil moisture from Radarsat SAR data

WATER RESOURCES RESEARCH, VOL. 35, NO. 5, PAGES 1569-1579, MAY 1999
Retrieving near-surface soil moisture from Radarsat SAR data
Getu Fana Biftu and Thian Yew Gan
Department of Civil and Environmental Engineering, University of Alberta, Edmonton, Alberta, Canada
Abstract. On the basis of six Radarsat synthetic aperature radar (SAR) images acquired over the Paddle River Basin, Alberta, and 1350 field soil moisture data collected from nine selected sites of the basin in the same days, this study demonstrated the feasibility of retrieving near-surface soil moisture (5-10 cm depth) from Radarsat SAR data. Between two retrieval algorithms, a linear regression and the theoretical integral equation model (IEM) of Fung et al. [1992], the results indicate that IEM performed consistently better than the regression model. However, the performance of both models generally deteriorates when the basin is nearly saturated, which is the case for September 10 and 27, 1996, with a basin saturation level of 82 and 75%, respectively. With respect to Radarsat's configuration and IEM's surface parameters, it is found that radar backscattering o 'ø is highly sensitive to the surface rms height, especially for a relatively smooth surface and a Gaussian correlation function. From the semivariogram of measured soil moisture and o 'ø it is found that the homogeneity assumption of spatial interpolation as a function of distance lag breaks down only at a distance lag of about 200-275 m. Apparently, spatial interpolation methods based on this assumption can only interpolate soil moisture meaningfully for single land use plots of several hundred meters in size.
1. Introduction
Albeit on a global basis, the surface soil moisture represents only 0.05% of the world's total fresh water [Chow et al., 1988]; the amount of soil moisture is important for crop development, plant stress, and yields [e.g., Dobson and Ulaby, 1986; Brown et al., 1993]. It is a major component of the hydrologic cycle, and its regional status is an important criterion for irrigation man- agement and for the selection of crop types [O'Brien, 1992]. However, the status of soil moisture is difficult to assess on a regional scale accurately because it is highly variable spatially and temporally, and ground measurements that are time con- suming and expansive to collect are always limited.
For over two decades, research on the use of remote-sensing techniques to retrieve soil moisture from microwave sensors over large areas shows that this is possible with airborne and satellite active microwave, for example, ERS-1 (C band) and JERS (L band), under a variety of topographic and land cover conditions [e.g., Ulaby et al., 1979; Mohan et al., 1990; Rotunno Filho et al., 1996; Altese et al., 1996; Crevier et al., 1996]. Rela- tionships between radar backscattering echoes and surface soil moisture for bare ground or agricultural land have long been established [e.g., Ulaby et al., 1982, 1986; Schmugge, 1985]. Studies show that for single-frequency and single-polarization systems, the optimum radar configuration for retrieving soil moisture would be a C band radar (5.3 Ghz) operating in VV and/or HH polarizations and at 10ø-20 ø incidence angle, where the effects of surface roughness and vegetation cover on the radar echoes are minimal [Ulaby et al., 1979; Dobson and Ulaby, 1981; Bernard et al., 1982; Mohan et al., 1990].
Lately, the Canadian Radarsat satellite carrying a C band, synthetic aperture radar (SAR) has been designed with opti- mum radar parameters for monitoring near-surface soil mois- ture at HH polarization and beam modes operating at 10ø-60 ø
Copyright 1999 by the American Geophysical Union.
Paper number 1998WR900120. 0043-1397/99/1998WR900120509.00
incidence angle, 10-100 m resolution, and 50-500 km ground swaths [Brown et al., 1993; Parashar et al., 1993]. Also, Radar- sat's frequent coverage provides an opportunity to monitor the dynamics of soil moisture change in Canada and other parts of the world.
2. Research Objectives The primary objective of this study is to assess the feasibility
of retrieving near-surface (5-10 cm deep) soil moisture of agricultural/ranch lands in the Canadian Prairies using an em- pirical and a theoretical model from Radarsat SAR data. The second objective is to examine the spatial variability of near- surface soil moisture using a semivariogram and the homoge- neity assumption (spatial correlation as a function of distance- lag only) often used for spatially interpolating soil moisture. The site chosen for this study is the Paddle River Basin of central Alberta in the Canadian Prairies.
3. Study Site Description The Paddle River Basin (53ø52'N latitude, 115ø32'W longi-
tude) of central Alberta, with a basin area of 265 km 2 (Figure 1), lies within the western edge of the Alberta Plains, in the koeppen climatic zone (short and cool summer), where mean temperature ranges from -15.5øC in January to + 15.6øC in July and annual mean precipitation is about 508 mm [Pretula and Ko, 1982]. Its land cover consists of about 50% mixed forest, 21% coniferous forest, 15% agricultural land, 11% pas- ture land with short grass, 2% water body, and 1% relatively impervious lands. Forest, brushlands, and tree muskegs cover •80% of the headwater region of the basin. The deciduous, Aspen forest is the predominant vegetation type [Alberta En- ergy and Natural Resources, 1977]. The basin has moderate hydrological response (an annual streamflow/rainfall ratio of about 0.28) with an average land slope of 3-5%.
The major soil group of the study area is the Hubalta series
1569

1570 BIFTU AND GAN: RETRIEVING NEAR-SURFACE SOIL MOISTURE
49 '5;•11vis;on • ..... •
ß Pasture Land
0 Herbaceous Vegetation [] Agricultural Land
Figure 1. Location map and field soil sampling sites of Paddle River Basin, Alberta.
associated with Onoway and Modeste [Twardy and Lindsay, 1971] and characterized by strongly developed Orthic Gray Wooded features. Its dominant soil texture is clay loam under moderately good drainage conditions. Typical particle distri- butions of the Hubalta series at a depth of 0-10 cm consist of 25% sand, 64% silt, and 11% clay. The field sites chosen within the basin for soil sampling include pasture lands (with short grasses of height generally <5 cm), agricultural lands under postharvest condition only (covered with short weeds), and herbaceous lands which had a mixture of grass, weeds, and some low-growing brush (Figure 2). The objective of measur- ing soil moisture under postharvest conditions is to minimize the effect of volumetric scattering of crops on the radar echoes.
4. Research Methodology The research methodology involved collecting soil moisture
data, processing and analyzing satellite images, establishing two functional relationships between SAR backscatter and soil moisture values, and examining the homogeneity assumption used in most spatial interpolation algorithms of soil moisture, such as the universal kriging. Near-surface soil moisture sam- ples were collected on six selected days when the Radarsat satellite passed over the Paddle River Basin: September 3, 10, and 27 of 1996 and August 5, 12, and 29 of 1997. These six days were chosen because the satellite path was such that it was possible to acquire SAR images at standard beam modes S1 or S2 that were of relatively low incident angles, which is desirable for retrieving soil moisture (see Table 1). Figure 3 shows two of the six raw SAR images. The satellite passed by the study site at •1411 local time and at descending orbit.
4.1. Soil Moisture Data Collection
On these six selected days, between 10:00 A.M. and 5:00 P.M., intensive soil moisture samples were collected at nine carefully selected field sites (Figure 1). The nine field sites represent agricultural lands (sites 5 and 7), pasture lands (sites 1, 8, and 9), and herbaceous lands (sites 2, 3, 4, and 6) with distance lag ranging from 1 to 13 km. In each site, 25 soil samples, each taken at a depth of 5-10 cm, were collected per day at sampling points located ---50 m from each other within
a 200 x 200 m window. These soil samples were analyzed for gravimetric and volumetric soil moisture in the laboratory. On the basis of field measurements, the average saturation level (volumetric moisture content/soil porosity) for the Paddle River Basin for the 3 days of 1996 were 68, 82, and 75% and for the three days of 1997 were 72, 68, and 58%, respectively.
4.2. Satellite Data Processing and Analysis The calibration of the Radarsat SAR data involves two com-
ponents. The internal component, known as radiometric cali- bration, requires knowledge of the transmitted power, the re- ceived power and processing gains, range, and antenna gain, which depend on the angular quantity. The data obtained for our study site were calibrated radiometrically by the Canadian Center for Remote Sensing (CCRS) into a 16-bit product, SAR path image plus (SGX). The external calibration included geometric correction, change of the digital number to image intensity (brightness), and backscattering value. To derive the backscattering values from the image digital number (DN), parameters estimated (see Shepherm et al. [1996] for details) include incidence I i angles for column j of the image pixel, radar brightness/3•:i, and radar backscatter rr•/for scanline k, column j, such that
(r•:j =/3kj + 10 x log•0 [sin (I)] (1)
The six Radarsat SAR images were first subjected to speckle suppression filters using a 5 x 5 median filtering technique. Then the images were coregistered to a Landsat-TM image acquired on August 7, 1996. By applying many ground control points uniformly distributed across the Whole image, an accu- rate registration has been achieved with an average calibration error that is mostly <10-12 m, as opposed to the 25 m reso- lution of Landsat. The original images at a resolution of 8 x 8 m were then resampled to pixels of 25 x 25 m resolution using the nearest neighbor method. From the Landsat TM image classified into six land cover classes (water bodies, co- niferous and mixed forest, pasture and agricultural land, and roads or less permeable lands), locations of the soil-sampling sites were identified.
Then a regressional and a theoretical functional relationship

BIFTU AND GAN: RETRIEVING NEAR-SURFACE SOIL MOISTURE 1571
Pasture Land ? ........................ "
i ':-- ß •:• ....... 'a ....... • ......... **-"*' '"-':--"--'-:'*•':'•;•; ..... •, ---::sx..•c•--•,•
...
...... . ....... : ............. .•v...., .. ...... t;x,...:......•-,;...v:;:•:,:.?.:.. •:..•; : ....... ......... .:...: ..
Agricultural Land ;•.:;• • .... *•,::":*:'•*':'"' ": ...... '" ":" ...... :•,:;.,:•,...• • ....; ..,k..::.:.... ß ... :7. ............... ;..:;':.::::"::':":':,:';.":' ' ..:.*';:' ..
Herbaceous Vegetation.--,
Figure 2. Photographs of three landcover types of Paddle River Basin from which soil moisture data were collected.

1572 BIFTU AND GAN: RETRIEVING NEAR-SURFACE SOIL MOISTURE
Table 1. Description of the Six Radarsat SAR Images Acquired at ---1411 Local Time and at Descending Orbit Over the Paddle River Basin
Date
Scene Center
Angle of Beam Type Incidence, deg Latitude Longitude
Sept. 3, 1996 Sept. 10, 1996 Sept. 27, 1996 Aug. 5, 1997 Aug. 12, 1997 Aug. 29, 1997
S1 23.296 53056 ' 115031 ' S2 27.685 53055 ' 115030 ' S1 23.268 53o55 ' 115o34 ' S1 23.303 53o36 ' 115o39 ' S2 27.663 53o40 ' 115o34 ' S1 23.311 53o35 ' 115o39 '
SAR, synthetic aperature radar.
were established between Radarsat SAR backscatters and field
soil moisture data for the Paddle River Basin. In the former, a basin-dependent (e.g., Paddle River Basin) approach, the mean soil moisture values (averaged from 25 samples per site collected on a given day) for the nine field sites were regressed against their corresponding mean Radarsat SAR backscatter values (averaged from 64 pixels of 25 m resolution each). The strategy of matching the average of sets of 25 soil samples with the average of sets of 64 pixels of Radarsat backscatter is to filter out the data noise as much as possible. The mean back- scattering value was obtained with minimum noise by averag- ing them along the row direction and then applying a moving
average of 4 pixels along the azimuthal direction to eliminate pixels radically different from the mean.
Unlike the regression model, the theoretical, integral equa- tion model (IEM) of Fung et al. [1992] provides a site- independent relationship applicable to different radar config- urations (frequency, polarization, and incidence angle) and surface parameters. The general theoretical model, IEM, cov- ers a wide range of models, including the small perturbation model (applicable for slightly rough surface), the standard Kirchhoff model (applicable for large surface height and small surface slope), the geometric optic solution (applicable for large surface slope with multiple scattering terms), and others. This model has been applied over a wide range of roughness condition and radar configuration to retrieve soil moisture from radar backscattering values [e.g., Le Toan et al., 1993; Altese et al., 1996]. However, the inversion of such a model to retrieve soil moisture requires information about the surface roughness and correlation length. In this study, on the basis of the Gaussian and exponential correlation functions, IEM was first used to study the sensitivity of surface parameters with respect to Radarsat's configuration. Second, on the basis of measured field soil moisture and radar backscatter values ob-
tained from Radarsat SAR data, the surface parameters (sur- face rms height o- and correlation length L) of IEM were automatically calibrated using the Simplex algorithm of Nelder and Mead [1965]. Lastly, using these optimized surface param- eters, IEM was inverted to obtain volumetric soil moisture for
(a) September 10, 1996 .. ..... ......
(b) August 29, 1997
................. ß : ::' ... :....::,:. :'-•. • ................ :.. ..... :..'..• ..... ,...i"' ":Z':•-:i" *": """"' ' '• ';..:.- ß .,• .:....½
:•..-'.::Z :4.:.. ..
ß
ß •. . ..,•,;. .:.-.• '• ß i•:• • I:: ......... .. ,::.,, -
7. •;"::'. ,. 4 •:::'½: ':': i;.i'i,i :'•' . ß .;•
.:.
ß •..::. j• ..;...•.,; :.- '. •t....:., •....
t2::.;:
::.: •:;•: ;..•-• •-..• •;..%•. :::..( :.,.
':•* ':'...;i:..•,,•;•;. "•?' •"•':: '• "::: .... '" :7". ............. •:., • '*"½• ........ . .......... . ........................................ ,., ................... . ........... . .............. .•. ........................ ..,: ...... :•<•.
Figure 3. Two of the six raw Radarsat SAR images acquired for Paddle River Basin, Alberta The Septem- ber 10, 1996, scene, which represents an average saturation level of 82%, has an overall texture that is darker than that of the August 29, 1997, scene, whose average saturation level was only 58%.

BIFTU AND GAN: RETRIEVING NEAR-SURFACE SOIL MOISTURE 1573
the study site from Radarsat SAR backscattering values (see section 5.2). rr ø= 0.5k 2 exp (-2k•2o -2) • rr2nlln12 W•(-2kx' O) n! (3)
n=l
5. Discussion of Results
The relationship between radar backscattering echoes and soil moisture content is affected by variables such as the rms surface height, surface correlation length, and land cover type. To bypass the effects of these surface parameters, one practical approach is to relate radar backscatters (dB) with soil moisture data via a linear regression model as discussed below.
5.1. Regression Analysis
The simple linear regression (equation (2)) established be- tween Radarsat SAR backscatter cr ø and volumetric soil mois- ture 0 data collected from nine selected sites of the Paddle
River Basin is
rrø= a +/30 (2)
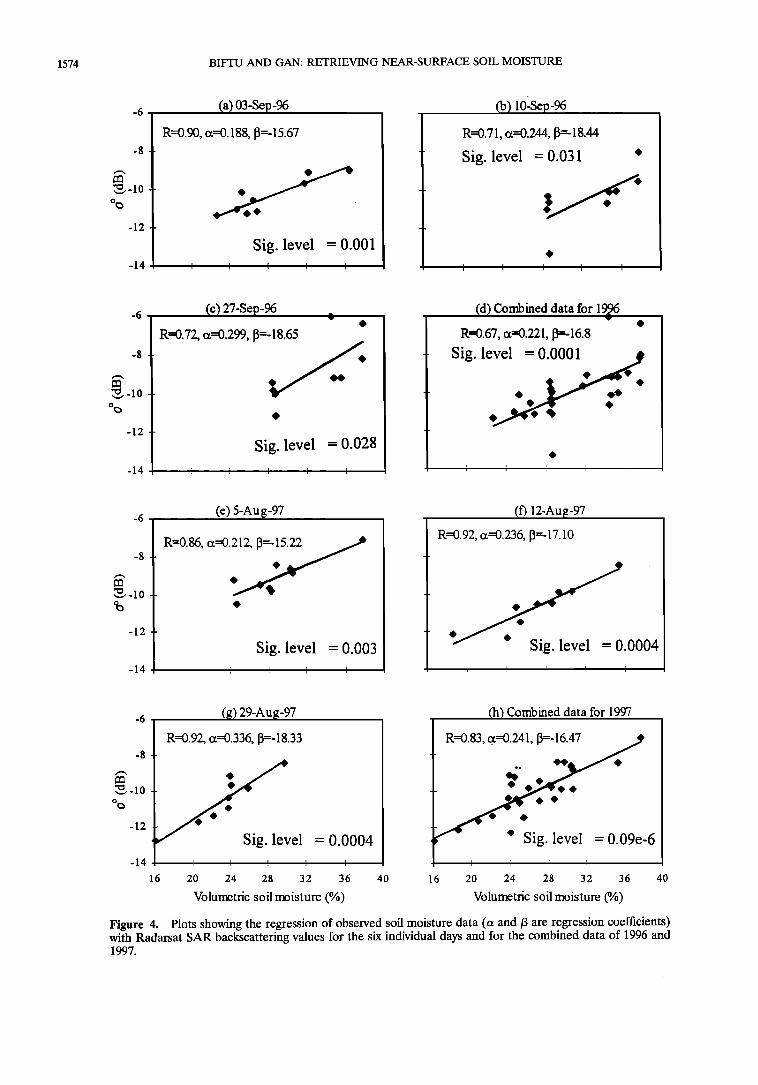
Regression parameters a and/3 were obtained through cali- bration. The regressional results for each of the 6 days and for the three combined days in 1996 and 1997 are given in Figures 4a-h. The regression plots of Figure 4 show a fairly strong dependence of radar backscatters to volumetric soil moisture. The best result obtained was for August 12 and 29 of 1997 (R = 0.92), which were also the driest (with an overall basin saturation of 68 and 58%, respectively) among the 6 days. Apparently, the assumption of a linear relationship between Radarsat SAR and field soil moisture works best when the soil
is relatively dry. Near saturation, radar backscatters level off and become less sensitive to an increase in the soil water
content [Dobson and Ulaby, 1986]. Radar backscatters would fall quickly when the soil saturation is exceeded and surface ponding appears [Brunet al., 1990]. Therefore the deteriora- tion of R with an increase in soil water does not come as a
surprise; for example, R = 0.71 for September 10, 1996, when the average basin saturation levels were 82%. Brunet al. [1990] and Altese et al. [1996] obtained similar results.
The statistical model (equation (2)) developed was cross- validated using soil moisture and Radarsat SAR data that were not used to calibrate a and/3. Figure 5a shows that the regres- sion model calibrated from the 1996 data oversimulated soil
moisture during the validation period of 1997. It seems that this is partly caused by the calibration data being "wetter" than the validation data because the reverse result is obtained when
calibrating the model with 1997 data and validating it with 1996 data; for example, the model undersimulated the validation data in 1996 (Figure 5b). This implies that regression model parameters would be better established with calibration data that represent a wide range of soil moisture conditions, and poorer results would be expected when retrieving soil moisture from radar backscatters under relatively wet, rather than dry, conditions. In other words, if the basin is nearly saturated, the degree of radar backscattering becomes less sensitive to in- creased water content, as evident in the generally poorer agreements between the fitted regression model and observed data when the calibration period was extended to both 1996 and 1997 (Figure 5c).
5.2. Integral Equation Model
The following integral equation model for radar backscatters is expressed in terms of the Radarsat satellite configuration.
I n = (2kz)nf exp (-o'2k• 2) + 0.5•[F(-kx, O) + F(kx, 0)] (4)
F(-kx, O) + F(kx, O) = 2 sin24•(1 + Rñ)2
cos 4>
/•e - sin2 4> - /-• cos24>.] cos
(5)
Where f = (-2Rñ)/(cos 40, Rñ = (1 - X/-•)/(1 + X/-•) (Frensel reflection coefficient), o -ø is the radar backscattering, o-is the surface rms height, • is the dielectric constant, • is the magnetic permeability, 4> is the incidence angle, k is the wave number, k z = k cos 4•, and kx = k sin 4>.
The roughness spectrum W"(u, 0) of the surface based on the n th power of the surface correlation function p(•) and the Fourier transform is given by
Wn(u, 0) = • (•) exp (-ju•) d• (6)
In the evaluation of the roughness spectrum it is assumed that the surface correlation function is isotropic and can be repre- sented either by a Gaussian, p(•) = exp [•2/L2], or an expo- nential, p(•) = exp model, where L is the corre- lation length.
For Radarsat, by assuming that the increase of the real part of the dielectric constant • at 5.3 Ghz is much higher than the increase of its imaginary part, it is required to consider only the real part of • [see Ulaby et al., 1986; Schmugge, 1985; Halli- kainen et al., 1985]. The relationship between • and the volu- metric soil moisture 0 is based on an equation derived by Topp et al. [1980] that has been validated for a wide range of mineral soils under different conditions [Topp and Davis, 1985; Ansoult et al., 1985; Altese et al., 1996].
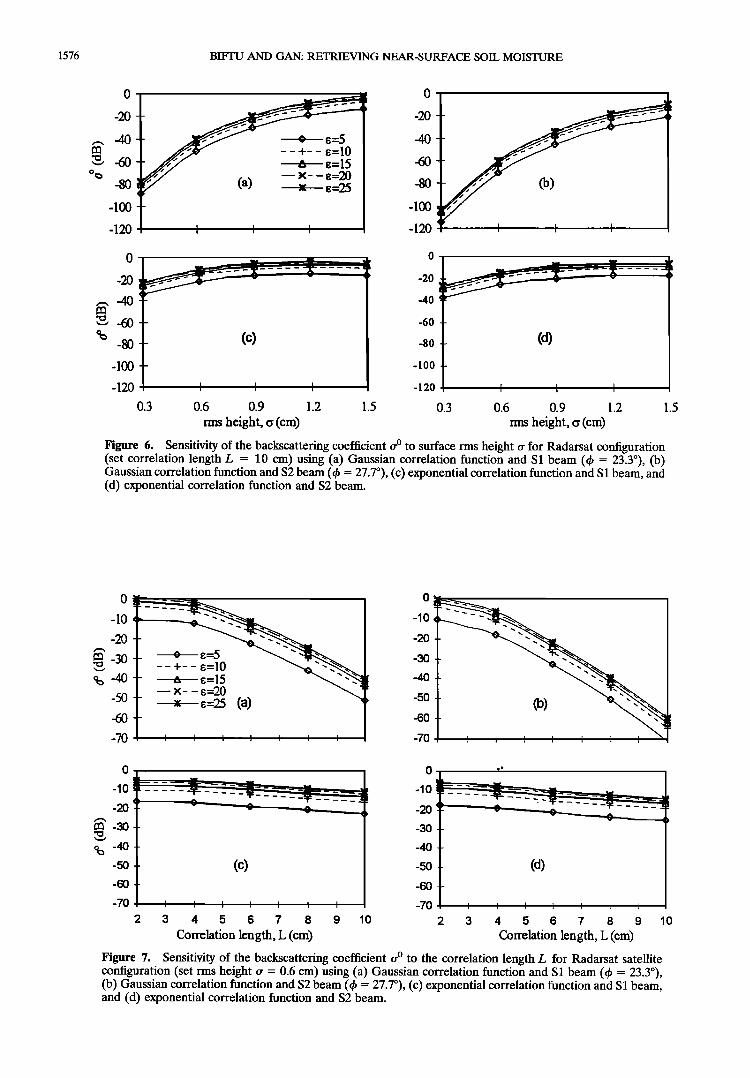
Equations (3)-(5) were used to study the sensitivity of radar backscattering rr ø to surface parameters (rr and L) under Ra- darsat's configurations (C band, HH polarization) operating at the standard beam mode (S1 and S2). The roughness param- eters used in the sensitivity analysis are the most commonly encountered in agricultural land, pasture lands, and range lands. Figures 6a-6d show that o -ø is not too sensitive to • but is more sensitive to surface rms height rr, especially under the Gaussian, than the exponential correlation functions, and when o- is low. Figure 6b shows that using the Gaussian cor- relation function at the S2 beam mode of Radarsat, o -ø changes by as much as 44 (dB) for an increase of only 0.3 cm in o-. Similarly, o -ø is more sensitive to the correlation length L for the Gaussian than the exponential correlation functions (Fig- ures 7a-7d) for large correlation length (e.g., L > 4 cm). Altese et al. [1996] obtained similar results for ERS-1 radar configuration (VV polarization, C band, and 4> of 23 ø) and concluded that the behavior of the model is highly dependent on the choice of the correlation function. So, using an expo- nential correlation function, the sensitivity of cr ø to changes in surface parameters can be reduced and their effect on the volumetric soil moisture derived from backscatter values can
be minimized. Besides, for three relatively smooth surfaces (or = 0.32, 0.4, and 1.12), Oh et al. [1992] found that the
1574 BIFTU AND GAN: RETRIEVING NEAR-SURFACE SOIL MOISTURE
-6
-8
-12
-14
(a) 03-Sep-96 • R=0.90, ct=0.188, [3=-15.67 I R=0'71' ct=0'244'_[3718'44
I Sig. level = 0.031
Sig. level = 0.001
-6
-8
-12
-14
(c) 27-Sep-96 (d) Combined data for 1996
R=0.72, ct=0.299, [3 =- 18.65
Sig. level = 0.028
R=0.67, ct=0.221, 13 =- 16.8
Sig. level = 0.0001
-6
-8
-12
-14 •
(e) 5-Au g-97
ct=0 R=0.86, . , =- .
Sig. level = 0.003 , , I
(f) 12-Aug-97
R=0.92, ct=0.236, •--17.10
Sig. level = 0.0004
-6 (g) 29-Aug-97 R=0.92, cz=0.336, [3=-18.33
-8
•-•o
-12
• Sig. level -14• : • I t
= 0.0004
I
(h) Combined data for 1997
R=0.83, .ct=0.241, [3=-16.47
ß Sig. level = 0.09e-6
16 20 24 28 32 36 40 16 20 24 28 32 36 40
Volumetric soil moisture (%) Volumetric soil moisture (%)
Figure 4. Plots showing the regression of observed soil moisture data (a and/3 are regression coefficients) with Radarsat SAR backscattering values for the six individual days and for the combined data of 1996 and 1997.

BIFTU AND GAN: RETRIEVING NEAR-SURFACE SOIL MOISTURE 1575
45
• 35
15
i996 data 1997 data
45
• 35
15
45
• 35
25
15
45
• 35
15
;" I II II I I I i i I
•a * _ * • • I/% * '•' • '•'
,.,, ,,
1 4 7 I 4 7 I 4 7
IIEM model I regression model
ß I * Observed I
' 'Y,' '• ' •'••t ** I
,, ..... ',,," ..... 1 4 7 1 4 7 1 4 7
Site number
Figure 5. Four sets of calibiation and validation results for the regression model and integral equation model (IEM) comparing the retrieved (based on Radarsat SAR data) versus observed soil moisture: (a) 1996 data used for calibration and 1997 data for validation; (b) 1997 data used for calibration and 1996 data for validation; (c) both 1996 and 1997 data used for calibration, no validation; and (d) average values of model parameters obtained in Figure 5a and 5b used for retrieving soil moisture from backscatter values for 1996 and 1997. The parameter s is overall basin saturation level.
measured autocorrelation function is closer in shape to an exponential thari the Gaussian functions. Similarly, Wegmuller et al. [1994] found that the exponential correlation function provides a better fit to the observed correlation than Gaussian models for agricultural land uses. Since our study site repre- sents relatively smooth surfaces, such as agricultural, pasture and herbaceous lands, an exponential correlation function is used for further analysis with IEM.
Under natural conditions, surface parameters measured in the field are highly variable spatially and thus are not isotropic as assumed in man), correlation functions. There has been extensive research on either isolating or quantifying the effects of surface parameters on rr ø [e.g., Fung, 1994; Engman and Wang, 1987; Autret et al., 1989; Altese et al., 1996]. However, none of these efforts lead to a method that can retrieve soil
moisture from backscattering data without the surface rough- ness parameter. For truck-mounted or airborne radar experi- ments it is possible• to collect multipolarized data, which allows us to solve for soil moisture and surface parameters simulta- neously. However, this multipolarization technique is not pos- sible with our current space platforms that have single fre- quency and poiarization sensors, and other means are required to estimate the surface parameters. Recently, Jackson et al. [1997] suggested a first-order, rainfall-dependent correction for the surface roughness from the land cover database estab- lished through numerous soil erosion studies. Nonetheless, because of the high sensitivity of soil moisture models to sur- face roughness, they suggested field measurements to increase the precision of the roughness estimate.
Initially, a range of surface roughness parameter values was
1576 BIFTU AND GAN: RETRIEVING NEAR-SURFACE SOIL MOISTURE
-2O
(a)
o •=5 -- +-- •=10
a •=15 • •:- - •=20
X •=2.•
I I
0
-20
40
-60
-80
-100
-120 I I I
-120
(c)
-20
-40
-60
-80
-100
-120
0.3 0.6 0.9 1.2 1.5 0.3 0.6 0.9 1.2
rms height, c• (cm) rms height, c• (cm) 1.5
Figure 6. Sensitivity of the backscattering coefficient o 'ø to surface rms height o' for Radarsat configuration (set correlation length L = 10 cm) using (a) Gaussian correlation function and S1 beam (qb = 23.3ø), (b) Gaussian correlation function and S2 beam (qb = 27.7ø), (c) exponential correlation function and S1 beam, and (d) exponential correlation function and S2 beam.
0
-10
-20
ca -30
-50
-70
L
- - - +- - s=10 •' -."•.'"'•_
x s=25 (a)
o i <
-20
-30
-40
-50
-60
-70
0
-10
-20
-50
-60
-70
(c)
-lO
-2o
-3o
-4o
-5o
-6o
-7o
(d)
2 3 4 5 6 7 8 9 10 2 3 4 5 6 7 8 9
Correlation length, L (cm) Correlation length, L (cm) 10
Figure 7. Sensitivity of the backscattering coefficient o 'ø to the correlation length L for Radarsat satellite configuration (set rms height o' = 0.6 cm) using (a) Gaussian correlation function and S1 beam (qb = 23.3ø), (b) Gaussian correlation function and S2 beam (qb - 27.7ø), (c) exponential correlation function and S1 beam, and (d) exponential correlation function and S2 beam.

BIFTU AND GAN: RETRIEVING NEAR-SURFACE SOIL MOISTURE 1577
Table 2. Summary of Calibration and Validation Results of the Regression Model and Integral Equation Model Given in Figure 5
Regression Model Integral Equation Model
Calibration Validation Calibration Validation
Cases R SE R SE R SE R SE
Figure 7a 0.67 0.0517 0.83 0.0348 0.85 0.0295 0.90 0.0237 Figure 7b 0.83 0.0320 0.67 0.0474 0.92 0.0200 0.80 0.0360 Figure 7c 0.69 0.0450 ...... 0.79 0.0338 ......
obtained for agricultural and range land covers from the liter- ature [e.g., Jackson et al., 1997] and then optimized with re- spect to the Radarsat backscattering values and soil moisture using the Simplex algorithm [Nelder and Mead, 1965]. Then, using the 1997 Radarsat rr ø (August 5, 12, and 29) and surface roughness parameters calibrated from the 1996 data (Septem- ber 3, 10, and 27), the corresponding soil moisture 0 for 1997 is simulated by IEM and validated against field measurements (Figure 5a). The same procedure is repeated using 1997 as the calibration data and 1996 as the validation data (Figure 5b). The results indicated that IEM performed consistently better than the statistical model (see Figures 5a and 5b and Table 2). However, similar to the statistical model, IEM generally over- estimated the soil moisture when calibrated with the 1996 data
that was "wetter" than the validation data of 1997. For the
same reason, when 1997 was the calibration period, the reverse situation of the statistical model was also found, in that IEM underestimated the 1996 validation data.
Just like the statistical model, IEM is also calibrated using the whole data set of 1996 and 1997 that covers a wider range of soil moisture conditions than data of individual years. How- ever, there is no data left to validate the third case. Instead, on the basis of the averaged parameters obtained from the first two cases, the statistical model and IEM were rerun using both years of Radarsat data (Figure 5d). Differences between the simulated and observed volumetric soil moisture are similar to
those of the third case. In all four cases, both the statistical model's and IEM's performances were poorer for relatively wet conditions (75 and 82% saturation), with an average sim- ulation error of _+ 10% in soil moisture.
5.3. Spatial Variability of Soil Moisture
Using the semivariogram function defined by Journel and Huijbregts [1978], the homogeneity assumption (spatial corre- lation as a function of distance lag or intersite distance only) often used in spatial interpolation techniques of soil moisture, such as the universal kriging, was also investigated. The semi- variograms of all the measured soil moisture data collected from the nine sites in September 3, 10, and 27 of 1996 show virtually no correlation with intersite distances (Figure 8a) that vary from 1 to 13 km. A similar result has been obtained for backscattering values derived from Radarsat SAR data. How- ever, for a particular land cover type such as agricultural land, field-measured soil moisture and Radarsat backscatter values
have a definite spatial correlation with intersite distance up to about 200-275 m (Figure 8b). Beyond this distance the spread of data points grows so much that no more meaningful corre- lation can be identified from the semivariogram, which sug- gests that regionalization of soil moisture is difficult, though it is an issue that is beyond the scope of this paper.
In conclusion, at field scales larger than plot sizes, besides the intersite distance, the combined influence of local topog- raphy, vegetation covers, and other factors play a significant part in determining the spatial correlation of soil moisture or radar backscatter values. Our result agrees with that of Rotunno Filho [1996], using bare field and ERS-1 data, and Rotunno Filho et al. [1996], who found that the cross correla- tion of soil moisture in pasture lands breaks down at an inter- site distance of 150-450 m. It seems that regardless of the land cover type, for deriving soil moisture maps from satellite or field soil moisture data, the homogeneity assumption of spatial interpolation (correlation, as a function of distance lag only) is only applicable for intersite distances of the order of 150-400 m.
6. Summary and Conclusions In six selected days of September 1996 and August 1997,
about 1350 soil samples were collected from nine sites of the Paddle River Basin (265 km 2) of central Alberta. Twenty-five soil samples (each analyzed for volumetric soil moisture) were collected at each site (agricultural or ranch land) to character- ize the average soil moisture of the site for each day. On these 6 days we also acquired Radarsat SAR images of standard beam modes S1 or S2.
A simple regression model was developed from the average of 25 observed soil moisture values per site of the nine sites against the corresponding average backscatter values of 64 pixels per site from Radarsat SAR images. The strategy of matching sets of 25 soil samples with about 64 pixels of Ra- darsat backscatter is to filter out the data noise as much as
possible. The best calibration result obtained for the regression model has a R = 0.92 for August 12 and 29 of 1997, when the basin was relatively dry, with an overall saturation level of 68 and 58%, respectively.
Using the IEM of Fung et al. [1992] and Radarsat's config- urations, it was found that radar backscattering rr ø was highly sensitive to surface rms height, especially for a relatively smooth surface and a Gaussian correlation function. Then, using the same sets of Radarsat and soil moisture data, the surface parameters of IEM were calibrated with the Simplex algorithm, and the calibrated IEM was used to retrieve soil moisture from Radarsat rr ø. IEM consistently performed better than the regression model, but the performance of both mod- els generally deteriorates as the basin's soil moisture ap- proaches saturation. Apparently, when near saturation, radar backscatters level off and become less sensitive to an increase in the soil water content.
Lastly, from the semivariogram of measured soil moisture and radar backscatters with intersite distances, it is found that

1578 BIFTU AND GAN: RETRIEVING NEAR-SURFACE SOIL MOISTURE
160
140
120
100
80
60
40
2O
(a) Measured soil moisture for different land covers.
ß X X
ß x x
0 Sept 3 [ ß Sept 10[ X Sept 27
o 2000 14000
x x • o
ß •'X• •: • X $ •m ß )4mg• W ß o •X
, , , .
.
4000 6000 BOO0 10000 12000
Distance Lag (m)
(b) Radarsat SAR image- September 3, 1996 (Agricultural field).
2.5
m 1.5 .œ
• I
0.5
% ++++ %
50 100 150 2()() 250 3()()
Distance Lag (m)
Figure 8.' Spatial semivariogram of (a) 1996 measured soil moisture of all 9 sites and (b) Radarsat back- scatters o -ø for one agricultural site of Paddle River Basin.
the homogeneity assumption of spatial interpolation (correla- tion as a function of distance lag only) breaks down at intersite distances of about 200-275 m. Apparently, spatial interpola- tion methods such as universal kriging are applicable only to interpolate soil moisture from plots several hundred meters in size and of a particular land cover type.
Acknowledgments. This project is funded by an NSERC operating grant and a CRF-NSERC grant of University of Alberta. The first author was also supported by a University of Alberta Ph.D. scholarship and a dissertation scholarship. The authors are grateful to Bruce Mackenzie, Tony Balce, and Robert Sleep of Alberta Environment and Protection for funding the purchase of Radarsat SAR data, and Robert Gautheir of the Canadiah Center for Remote Sensing (CCRS) for prov!ding the Landsat-TM data through the EODS program. Cui Wei, Qiang Wang, Purushottam R. Singh, and Mike Senika partici- pated in the collection of field soil moisture data. We also thank Terry Pultz of CCRS for reprocessing the iadiometric correction of several Radarsat SAR images.
References
Alberta Energy and Natural Resources, A study of watershed man- agement options for controlling flood runoff in the headwaters of the Paddle River Basin, Rep. 44, pp. 1-39, Edmonton, Alberta, Canada, 1977.
Altese, E., O. Bolognani, M. Mancini, and P. T. Troch, Retrieving soil moisture over bare soil from ERS-1 Synthetic Aperture Radar data: Sensitivity analysis based on a theoretical surface scattering model and field data, Water Resour. Res., 32(3), 653-661, 1996.
Ansoult, M., L. W. De Backer, and M. Declercq, Statistical relation- ship between apparent dielectric constant and water content in po- rous media, Soil Sci. Am. J., 49, 47-50, 1985.
Autret, M., R. Bernard, and D. Vidal-Madjar, Theoretical study of the sensitivity of the microwave backscattering coefficient to the soil surface parameters. Int. J. Remote Sens., 10,171-10,179, 1989.
Bernard, R., D. Vidal-Madjar, F. Baudin, and G. Laurent, C-band radar for determining surface soil moisture, Remote Sens. Environ., 12, 189-200, 1982.
Brown, R. J., B. Brisco, R. Leconte, D. J. Major, J. A. Fischer, G. Reichert, K. D. Korporal, P. R, Bullock, H. Pokrant, and J. Culley, Potential applications of RADARSAT data to agriculture and hy- drology, Canadian J. Remote Sens., 19, 317-329, 1993.
Brun, C., R. Bernard, D. Vital-Majar, C. Gascule-Odoux, P. Merot, J. Duchesne, and H. Nicolas, Mapping saturated areas with helicopter- borne C-band scatterometer, Water Resour. Res., (26)5, 945-955, 1990.
Chow, V. T., D. R. Maidment, and L. W. Mays, Applied Hydrology, McGraw-Hill, New York, 1988.
Crevier, Y., T. J. Pultz, T. I. Lukowski, and T. Toutin, Temporal analysis of ERS-1 SAR backscatter for hydrology applications, Can. J. Remote Sens., 22(1), 65-76, 1996.
Dobson, M. C., and F. T. Ulaby, Microwave backscatter dependence on surface roughness, soil moisture, and soil texture, III, Soil ten- sion, IEEE Trans. Geosc. Remote Sens., GE-19, pp. 51-61, 1981.
Dobson, M. C., and F. T. Ulaby, Active microwave soil moisture research, IEEE Trans. Geosci. Remote Sens., GE-24, 23-36, 1986.
Engman, E. T., and J. R. Wang, Evaluating roughnes.s models of radar backscatter, IEEE Trans. Geosci. Remote Sens., GRS-25, 709-713, 19•7.
Fung, A. K., Microwave Scattering and Emission Models and Their Applications, Artech House, Norwood, Mass., 1994.

BIFTU AND GAN: RETRIEVING NEAR-SURFACE SOIL MOISTURE 1579
Fung, A. K., Z. Lee, and K. S. Chen, Backscattering from a randomly rough dielectric surface, IEEE Trans. Geosci. Remote $ens., 30(2), 356-369, 1992.
Hallikainen, M. T., F. T. Ulaby, M. C. Dobson, M. A. E1-Rayes, and L. K. Wu, Microwave dielectric behavior of wet soil, I, Empirical models and experimental observations, IEEE Trans. Geosci. Remote $ens., 23, 25-34, 1985.
Jackson, T. J., H. McNairn, M. A. Weltz, B. Brisco, and R. Brown, First order surface roughness correction of active microwave obser- vations for estimating soil moisture, IEEE Trans. Geosci. Remote Sens., 35, 1065-1069, 1997.
Journel, A. G., and C. J. Huijbregts, Mining Geostatistics, Academic, San Diego, Calif., 1978.
Le Toan, T., P. Smachia, J. Souyris, A. Beaudoin, M. Merdas, M. Wooding, and J. Lichteneger, On the retrieval of soil moisture from ERS-1 SAR data, paper presented at Second ERS-1 Symposium, Eur. Space Agency, Hamburg, Germany, Oct. 11-14, 1993.
Mohan, S., N. S. Mehta, R. L. Mehta, P. Patel, V. H. Bora, K. K. Sule, S. P. Purohit, S. Rai, H. P. Singh, and Y. Ramakrishnay, Radar response to soil moisture of sandy soil, $ci. Note SAC/RAC/RSAG/ ERS-1/SN/01/90, 1990.
Nelder, J. A., and R. Mead, A simplex method for functional minimi- zation, Comput. J., 9, 308-313, 1965.
O'Brien, E.G., An agricultural application of regional scale soil mois- ture modelling and monitoring, paper presented at the Ninth NHRC Symposium, Saskatoon, Sask., Canada, March 9-10, 1992.
Oh, Y., K. Sarabandi, and F. T. Ulaby, An emprical model and an inversion technique for radar scattering from bare soil surfaces, IEEE Trans. Geosci. Remote $ens., 30(2), 370-381, 1992.
Parashar, S., E. Langham, J. McNally, and S. Ahmed, RADARSAT mission requirements and concepts, Can. J. Remote Sens., 19, 280- 288, 1993.
Pretula, B. R., and C. A. Ko, Hydrogeology Paddle River Reservoir area near Mayerthorpe, Alberta, report, pp. 1-107, Alberta Envi- ronment Protection, Edmonton, Alberta, Canada, 1982.
Rotunno Filho, O. C., Soil moisture mapping using remote sensing and
geostatistics applied to rainfall-runoff models, Ph.D. thesis, 396 pp., Dep. of Civ. Eng., Univ. of Waterloo, Waterloo, Ont., 1996.
Rotunno Filho, O. C., E. D. Soulis, N. Kouwen, A. Abdeh-Kolahchi, T. J. Pultz, and Y. Crevier, Soil moisture in pasture fields using ERS-1 SAR data: Preliminary results, Can. J. Remote Sens., (22)1, 95-107, 1996.
Schmugge, T., Remote sensing of soil moisture, in Hydrological Fore- casting, chap. 5, pp. 101-124, John Wiley, New York, 1985.
Shepherd, N. W., et al., CDPF output data calibration, Tech. Note 4.2, N. W. Shepherd and Assoc., 1996.
Topp, G. C., and J. L. Davis, Measurements of soil water content using time domain reflectometry: A field evaluation, Soil Sci. Soc. Am. J., 49, 19-24, 1985.
Topp, G. C., J. L. Davis, and A. P. Annan, Electromagnetic determi- nation of soil water content: Measurement in coaxial transmission
lines, Water Resour. Res., 16, 574-582, 1980. Twardy, A. G., and J. D. Lindsay, Soil survey of the Chip Lake area,
Alberta Soil Surv. 28, pp. 1-71, Edmonton, Alberta, Canada, 1971. Ulaby, F. T., G. A. Bradley, and M. C. Dobson, Microwave backscatter
dependence on surface roughness, soil moisture, and soil texture, II, Vegetation covered soil, IEEE Trans. Geosci. Electron., GE-17, 33- 40, 1979.
Ulaby, F. T., R. K. Moore, and A. K. Fung, Microwave Remote Sensing: Active and Passive, vol. 2, Artech House, Norwood, Mass., 1982.
Ulaby, F. T., R. K. Moore, and A. K. Fung, Microwave Remote Sensing: Active and Passive, vol. 3, Artech House, Norwood, Mass., 1986.
Wegmuller, U., C. Matzler, R. Huppi, and E. Schanda, Active and passive microwave signature catalogue on bare soil (2-12 Ghz), IEEE Trans. Geosci. Electron., 32(3), 698-702, 1994.
G. F. Biftu and T. Y. Gan, Department of Civil and Environmental Engineering, University of Alberta, Edmonton, Alberta, Canada T6G 2G7. ([email protected])
(Received May 6, 1998; revised November 19, 1998; accepted December 14, 1998.)