Fractal Dimension Algorithm for Detecting Oil Spills Using RADARSAT-1 SAR
9
O. Gervasi and M. Gavrilova (Eds.): ICCSA 2007, LNCS 4705, Part I, pp. 1054–1062, 2007. © Springer-Verlag Berlin Heidelberg 2007 Fractal Dimension Algorithm for Detecting Oil Spills Using RADARSAT-1 SAR Maged Marghany, Mazlan Hashim, and Arthur P. Cracknell Department of Remote Sensing Faculty of Geoinformation Science and Engineering Universiti Teknologi Malaysia 81310 UTM, Skudai, Johore Bahru, Malaysia [email protected], [email protected], [email protected], [email protected] Abstract. This paper introduces a method for modification of the formula of the fractal box counting dimension. The method is based on the utilization of the probability distribution formula in the fractal box count. The purpose of this method is to use it for the discrimination of oil spill areas from the surrounding features e.g., sea surface and look-alikes in RADARSAT-1 SAR data. The result shows that the new formula of the fractal box counting dimension is able to discriminate between oil spills and look-alike areas. The low wind area has the highest fractal dimension peak of 2.9, as compared to the oil slick and the surrounding rough sea. The maximum error standard deviation of low wind area is 0.68 which performs with fractal dimension value of 2.9. Keywords: Fractal algorithm, Probability Density Function (PDF), RADARSAT-1 SAR image, oil spill, look-alikes. 1 Introduction Fractal geometry can be used on occasion to discriminate between different textures. A fractal refers to entities, especially sets of pixels, which display a degree of self- similarity at different scales. Self-similarity is the foundation for fractal analysis and is defined as a property of a curve or surface where each part is indistinguishable from the whole, or where the form of the curve or surface is invariant with respect to scales, meaning that the curve or surface is made of copies of itself at reduced scale and enlarged scales [9]. The most well known procedures that have been proposed for estimating the fractal dimension of SAR images are box counting, fractal Brownian motion [1],[14] and fractal interpolation function system dimension of images [4]. Initially, Falconer [8] introduced the fractional Brownian motion model with SAR image intensity variation, which has shown promise in the SAR data textures. In fact, both the sea surface and its backscattered signal in the SAR data can be modeled as fractals [8],[19]. By contrast, Gado and Redondo [10] found that a box counting fractal dimension model provided excellent discrimination between oil spills and look-alikes, although
-
Upload
teknologimalaysia -
Category
Documents
-
view
6 -
download
0
Transcript of Fractal Dimension Algorithm for Detecting Oil Spills Using RADARSAT-1 SAR
O. Gervasi and M. Gavrilova (Eds.): ICCSA 2007, LNCS 4705, Part I, pp. 1054–1062, 2007. © Springer-Verlag Berlin Heidelberg 2007
Fractal Dimension Algorithm for Detecting Oil Spills Using RADARSAT-1 SAR
Maged Marghany, Mazlan Hashim, and Arthur P. Cracknell
Department of Remote Sensing Faculty of Geoinformation Science and Engineering
Universiti Teknologi Malaysia 81310 UTM, Skudai, Johore Bahru, Malaysia
[email protected], [email protected], [email protected], [email protected]
Abstract. This paper introduces a method for modification of the formula of the fractal box counting dimension. The method is based on the utilization of the probability distribution formula in the fractal box count. The purpose of this method is to use it for the discrimination of oil spill areas from the surrounding features e.g., sea surface and look-alikes in RADARSAT-1 SAR data. The result shows that the new formula of the fractal box counting dimension is able to discriminate between oil spills and look-alike areas. The low wind area has the highest fractal dimension peak of 2.9, as compared to the oil slick and the surrounding rough sea. The maximum error standard deviation of low wind area is 0.68 which performs with fractal dimension value of 2.9.
Keywords: Fractal algorithm, Probability Density Function (PDF), RADARSAT-1 SAR image, oil spill, look-alikes.
1 Introduction
Fractal geometry can be used on occasion to discriminate between different textures. A fractal refers to entities, especially sets of pixels, which display a degree of self-similarity at different scales. Self-similarity is the foundation for fractal analysis and is defined as a property of a curve or surface where each part is indistinguishable from the whole, or where the form of the curve or surface is invariant with respect to scales, meaning that the curve or surface is made of copies of itself at reduced scale and enlarged scales [9].
The most well known procedures that have been proposed for estimating the fractal dimension of SAR images are box counting, fractal Brownian motion [1],[14] and fractal interpolation function system dimension of images [4]. Initially, Falconer [8] introduced the fractional Brownian motion model with SAR image intensity variation, which has shown promise in the SAR data textures. In fact, both the sea surface and its backscattered signal in the SAR data can be modeled as fractals [8],[19].
By contrast, Gado and Redondo [10] found that a box counting fractal dimension model provided excellent discrimination between oil spills and look-alikes, although

Fractal Dimension Algorithm for Detecting Oil Spills Using RADARSAT-1 SAR 1055
the backscatter information, which could allow a first robust localization of the oil spills, had not been considered. Furthermore, Benelli and Garzelli [3] used a multi-resolution algorithm which was based on fractal geometry for texture analysis. They found that the sea surface is characterized by an approximately steady value of fractal dimension, while the oil spills have a different average fractal dimension compared to look-alikes.
This work has hypothesized that the dark spot areas (oil slick or look-alike pixels) and its surrounding backscattered environmental signals in the SAR data can be modeled as fractals. In this context, a box-counting fractal estimator can be used as a semiautomatic tool to discriminate between oil spills, look-alikes and surrounding sea surface waters. In addition, utilization of a probability density formula in the box-counting equation can improve the accuracy of discrimination between oil slick pixels and surrounding feature pixels such as ocean surface and look-alikes.
2 Fractal Algorithm for the Oil Spill Identification
The oil slick detection tool uses fractal algorithms to detect the self-similar characteristics of RADARSAT-1 SAR image intensity variations. A box-counting algorithm introduced by Benelli and Garzelli [2] was used in this study. The box counting estimator of fractal dimension divided a convoluted line of slick, which was embedded in the image plane, into smaller and smaller boxes by dividing the initial
length of the convoluted line at backscatter level sβ by the recurrence level of the
iteration [18]. We define a decreasing sequence of backscattering sβ tending
from 0β , the largest value, to less than or equal to zero. The fractal dimension D
( sβ ) as a function of the RADARSAT-1 SAR image intensity sβ is given by:
)log(
)(log)( lim
s
s
sBs
MDD
βββ
−==
∞→ (1)
where, )( sM β denotes the number of boxes which are needed to cover the various
slick areas with different backscatter intensity sβ in the RADARSAT-1 SAR image.
The number of boxes was calculated from the fractal dimension algorithm having side
length sl , and needed to cover a fractal profile, varies as Ds−β , where D is the fractal
dimension that is to be estimated. If the profile being sampled is a fractal object, then
)( sM β should be proportional to Ds−β , i.e., the following relation, which was
adopted from Milan et al. [16], should be satisfied:
Dss CM −= ββ )( (2)
where C is a positive constant derived from a linear regression analysis between log
M ( sβ ) and log ( sβ ). For different box sizes )( sβ , a number of points were
1056 M. Marghany, M. Hashim, and A.P. Cracknell
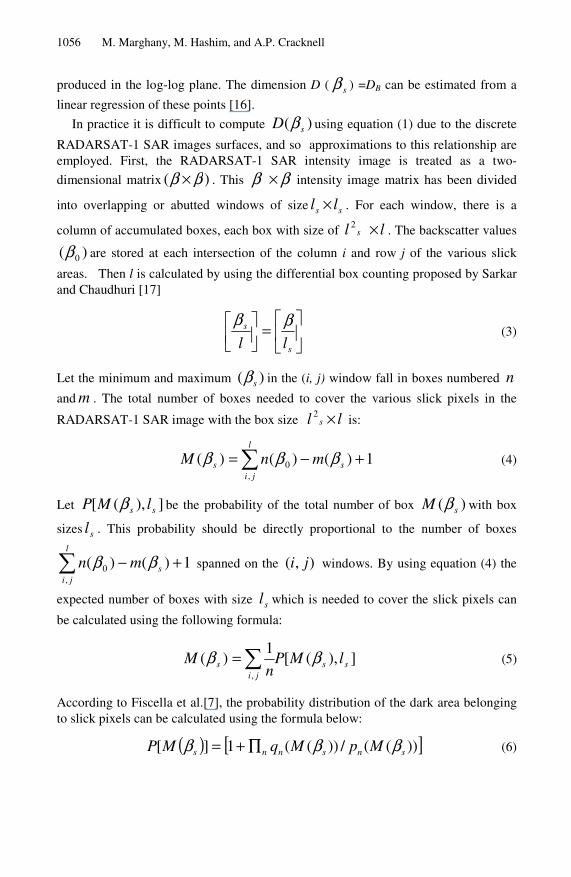
produced in the log-log plane. The dimension D ( sβ ) =DB can be estimated from a
linear regression of these points [16].
In practice it is difficult to compute )( sD β using equation (1) due to the discrete
RADARSAT-1 SAR images surfaces, and so approximations to this relationship are employed. First, the RADARSAT-1 SAR intensity image is treated as a two-
dimensional matrix )( ββ × . This ββ × intensity image matrix has been divided
into overlapping or abutted windows of size ss ll × . For each window, there is a
column of accumulated boxes, each box with size of ll s ×2 . The backscatter values
)( 0β are stored at each intersection of the column i and row j of the various slick
areas. Then l is calculated by using the differential box counting proposed by Sarkar and Chaudhuri [17]
⎥⎦
⎤⎢⎣
⎡=⎥⎦
⎤⎢⎣⎡
s
s
ll
ββ (3)
Let the minimum and maximum )( sβ in the (i, j) window fall in boxes numbered n
and m . The total number of boxes needed to cover the various slick pixels in the
RADARSAT-1 SAR image with the box size ll s ×2 is:
1)()()(,
0 +−=∑ s
l
jis mnM βββ (4)
Let ]),([ ss lMP β be the probability of the total number of box )( sM β with box
sizes sl . This probability should be directly proportional to the number of boxes
1)()(,
0 +−∑ s
l
ji
mn ββ spanned on the ),( ji windows. By using equation (4) the
expected number of boxes with size sl which is needed to cover the slick pixels can
be calculated using the following formula:
]),([1
)(,
ssji
s lMPn
M ββ ∑= (5)
According to Fiscella et al.[7], the probability distribution of the dark area belonging to slick pixels can be calculated using the formula below:
( ) [ ]))((/))((1][ snsnns MpMqMP βββ ∏+= (6)

Fractal Dimension Algorithm for Detecting Oil Spills Using RADARSAT-1 SAR 1057
Let 1)()(,
0 +−=∑ s
l
ji
mnn ββ , q and p are the probability distribution functions
for look-alike and oil spill pixel areas, respectively. From equations (5), (6) and (1) one can get a new formula for estimating the fractal dimension DB
)log(
))]((/))((1[log
lim)( ,
1
s
snsnnji
sBs
MpMqn
DDβ
βββ
−
∏+==
∑ −
∞→ (7)
In practice, the limit of M going to zero cannot be taken as it does not produce a texture image for oil spills or look-alikes in SAR data. Using fractal dimensions to quantize texture for segmentation, we may divide the slick’s pixel areas into overlapping sub-images. Each sub-image is centred on the pixel of interest. We then
estimate the fractal dimension )( sD β within each sub-image, and assign the fractal
dimension value to the central pixel of each sub-image. This will produce a texture image that may be used as an additional feature in slick pixel classification.
3 Results and Discussion
The RADARSAT-1 SAR Standard 2 beam mode (S2) image has been selected for testing the proposed fractal algorithm. The RADARSAT-1 SAR image detail of Fig. 1 contains a confirmed oil-slick which occurred near the west coast of Peninsular Malaysia on 20 December 1999[11]. Fig. 2 shows the variation of the average backscatter intensity along the azimuth direction in the oil-covered area as function of incidence angle for RADARSAT-1 SAR. The backscattered intensity is damped by –10 dB to -18 dB, which is above the RADARSAT-1 noise floor value of nominally –20 dB. The RADARSAT-1 image covered an area located in between 101° 01’ 01.01’’ E to 101° 17’ 11.5’’ E and 2° 25’ 38.6’’ N to 2° 34‘ 23.5’’ N. This result of backscatter variation across oil spill locations agrees with the study of Maged and Mazlan [15].
The proposed method for estimation of the fractal dimension has been applied to the raw RADARSAT-1 SAR data by using a 10 x 10 block at full resolution (Figure 4). Figure 4b shows the resulting fractal map. The fractal dimension map shows good discrimination between different textures on the RADARSAT-1 SAR image. The resulting fractal dimension map appears to correlate well with image texture regions (Figs. 3a and 3b). The oil slick pixels are dominated by lower fractal values than look-alikes and surrounding environment (Fig. 3b).
It is interesting to find that the region of oil slick has fractal values are between 1.5 and 2.3 which might be suggested the spreading of oil spill. As well as the fractal dimension value increases, the oil spill becomes more thin which can be noticed in areas of (A to C ). In fact, a thick oil spill dampens small scale waves and so there is no Bragg resonance, which reduced the roughness of sea surface compared to thin oil spill [4]. In this context, the fractal dimension is a function of sea surface level

1058 M. Marghany, M. Hashim, and A.P. Cracknell
Fig. 1. Locations of oil spill are indicated by small circles
Fig. 2. Radar cross section intensity along oil slick locations

Fractal Dimension Algorithm for Detecting Oil Spills Using RADARSAT-1 SAR 1059
Fig. 3. (a) RADARSAT-1 SAR texture feature of oil spill and (b) fractal map
intensities over the RADARSAT-1 SAR image which expresses the self similarity [12],[17]. The fractal dimension values of look-alikes are between 2.5 and 2.8 which can be seen in the areas F and E. The highest fractal dimension values of 3.4 and 4.0 in the areas D and G are represented the occurrence of shear current flow and existence of ship, respectively. It is interesting to discover that the fractal dimension algorithm based probability is able to extract ship wake information in area H with a value of 3.6. This suggests that the corresponding value of fractal dimension for different categories allows a multi-fractal characterization of the different features in a RADARSAT-1 SAR image. These results confirm the study of Maged and Mazlan[15].

1060 M. Marghany, M. Hashim, and A.P. Cracknell
Fig. 4 shows the comparison between oil slick fractal dimension curve and surrounding environment condition curves. The maximum fractal value of 4.0 is observed for a group of ships with normalized backscatter value of 0.9. This suggests that the strong amplitude of variation in RADARSAT-1 SAR image can be mapped as fractal discontinuities and small details are easily detected, e.g. ships. This result confirms the study of Maged and Mazlan [15]. Furthermore, it is apparent that the oil spill areas have a parabolic curve with maximum fractal dimension peak value of 2.6 and normalized RADARSAT-1 SAR backscatter value of 0.03 (Fig. 4). It is also found that the sea surface is dominated by a wide steady peak of fractal dimension (Fig. 4), which is 2.7, while the oil spill has substantially different values of fractal dimension, which range between 1.9 and 2.6 (Fig. 4). In fact, the sea surface is considered as a non-fractal object. According to Falconer [9], the slope measure of non-fractal objects corresponds to the complexity of the objects, with the natural implication that the sea surface would have steady value (Fig. 4). By contrast, the look-alike tends to have normal distribution curve with fractal dimension peak of 2.8 and the normalized backscatter is between 0.15 and 0.55; this is distinguishable from the oil slick and the surrounding rough sea (Fig. 4). It can also be seen that there are small differences of 0.2 and 0.3 between the fractal values of the maximum peaks of look-alike, sea surface and oil spill, respectively (Fig.4). This could be attributed to high surface wind speed which was induced sea surface roughness in the RADARSAT-1 SAR image along the surrounding area of the oil slicks and look-alike areas. This was made small differences between the fractal results between oil spills and surrounding sea surface [5],[8],[13].
Fig. 4. Fractal dimension curve for different features

Fractal Dimension Algorithm for Detecting Oil Spills Using RADARSAT-1 SAR 1061
4 Conclusions
This study was demonstrated the modification of the fractal box counting formula by involving the parameter of probability density function (PDF). The use of fractal dimension based on the probability distribution function (PDF) improve the discrimination between oil spill, look-alikes, sea roughness and low wind zones. In fact, involving the PDF formula in the fractal dimension map is directly related the textures at different scale to fractal dimension. In addition, this modification of the fractal equation reduces the problems of speckle and sea clutter and assists in the accurate classification of different textures over SAR images.
References
1. Aiazzi, B., Alparone, L., Baronti, S., Garzelli, A.: Multiresolution Estimation of Fractal Dimension from Noisy Images. SPIE-IS&T Journal of Electronic Imaging 10, 339–348 (2001)
2. Benelli, G., Garzelli, A.: A multi-resolution Approach to Oil-spills Detection in ERS-1 SAR Images. Image and Signal Processing for Remote Sensing 4, 145–156 (1998)
3. Benelli, G., Garzelli, A.: Oil-spill Detection in SAR Images by Fractal Dimension Estimation. In: Proceedings of Geoscience and Remote Sensing Symposium, 1999, IGARSS’99, Hamburg, Germany, 28 June-2 July 1999, vol. 2, pp. 1123–1126. IEEE Geoscience and Remote Sensing Society, USA (1999)
4. Bern, T.I., Wahl, T., Anderssen, T., Olsen, R.: Oil Spill Detection Using Satellite Based SAR; Experience from a Field Experiment. Photogrammetric Engineering and Remote Sensing 59, 423–428 (1993)
5. Bertacca, M., Berizzi, F., Mese, E.D.: A FARIMA-based Technique for Oil Slick and Low-wind Areas Discrimination in Sea SAR Imagery. IEEE Transactions on Geosciences and Remote Sensing 43, 2439–2484 (2005)
6. Calaberesi, G., Del Frate, F., Lightenegger, J., Petrocchi, A., Trivero, P.: Neural Networks for the Oil Spill Detection Using ERS-SAR Data. In: Proceedings of Geoscience and Remote Sensing Symposium, 1999, IGARSS’99, Hamburg, Germany, 28 June-2 July 1999, vol. 1, pp. 215–217. IEEE Geoscience and Remote Sensing Society, USA (1999)
7. Fiscella, B., Giancaspro, A., Nirchio, F., Pavese, P., Trivero, P.: Oil Spill Detecting Using Marine SAR Images. International Journal of Remote Sensing 12, 3561–3566 (2000)
8. Falconer, K.: Fractal geometry. John Wiley & Sons, New York (1990) 9. Fukunaga, K.: Introduction to Statistical Pattern Recognition, 2nd edn. Academic Press,
London (1990) 10. Gade, M., Redondo, J.M.: Marine Pollution in European Coastal Waters Monitored by the
ERS-2 SAR: A comprehensive Statistical Analysis. In: Proceedings of Geoscience and Remote Sensing Symposium, 1999, IGARSS’99, Hamburg, Germany, 28 June-2 July 1999, vol. 2, pp. 1375–1377. IEEE Geoscience and Remote Sensing Society, USA (1999)
11. Hashim, M., Ibrahim, A.L., Ahmad, S.: Mapping and Identifying Oil Spill Occurrences in Malaysian Water (Straits of Malacca and South China Sea) Using 2000-2005 Archived Radarsat-1 SAR. Evaluation Report, Department of Remote Sensing, Universiti Teknologi Malaysia, Skudai, Malaysia, 20pp, Unpublished (2006)

1062 M. Marghany, M. Hashim, and A.P. Cracknell
12. Henschel, M.H., Olsen, R.B., Hoyt, P., Vachon, P.W.: The Ocean Monitoring Workstation: Experience Gained with RADARSAT. In: Proceedings of Geomatics in the Era of RADARSAT, Canadian Center of Remote Sensing, Canada, Ottawa, Canada, May 25-30, 1997, Canadian Center of Remote Sensing, Ottawa (1997)
13. Lu, J., Kwoh, L.K., Lim, H.: Mapping Oil Pollution from Space. Backscatter, 23–26 (2000)
14. Maragos, P., Sun, F.K.: Measuring the Fractal Dimension of Signals: Morphological Covers and Iterative Optimization. IEEE Transactions Signal Processing 41(1993), 108–121 (1993)
15. Maged, M., Mazlan, H.: Simulation of Oil Slick Trajectory Movements from the RADARSAT-1 SAR. Asian Journal of Geoinformatics 5, 17–27 (2005)
16. Milan, S., Vachav, H., Roger, B.: Image Processing Analysis and Machine Vision. Chapman and Hall Computing, New York (1993)
17. Sarkar, N., Chaudhuri, B.B.: An Efficient Differential Box-counting Approach to Compute Fractal Dimension of Image. Man. Cyber-net. 24, 115–120 (1994)
18. Redondo, J.M.: Fractal Description of Density Interfaces. Journal of Mathematics and its applications. 5, 210–218 (1996)
19. Wornell, G.W., Oppenheim, A.: Estimation of fractal signals from noisy measurements using wavelets. IEEE Transactions Signal Processing 40, 611–623 (1992)