Understanding Fractal Analysis? The Case of Fractal Linguistics
18
UNDERSTANDING FRACTAL ANALYSIS? THE CASE OF FRACTAL LINGUISTICS HERBERT F. JELINEK School of Community Health, Charles Sturt University, Australia CAMERON L. JONES Centre for Mathematical Modeling, School of Mathematical Sciences Swinburne University of Technology, Australia MATTHEW D. WARFEL Mennonite Central Committee – Bolivia Casilla 59 Camiri, Bolivia CECILE LUCAS; CECILE DEPARDIEU; GAELLE AUREL I.U.P. Genie Physiologique – Informatique et D.E.S.S. DESSTAUP. University Poitiers, France Field: CS questions Key words: Fractal analysis, nonlinear science, communication, linguistics Communicating Author: Herbert F. Jelinek School of Community Health Charles Sturt University Albury, 2640 Australia PH: +61 2 60516946 FAX: +61 2 60516772 EMAIL: [email protected] European Conference on Complex Systems Paris, 14-18 November 2005
Transcript of Understanding Fractal Analysis? The Case of Fractal Linguistics

UNDERSTANDING FRACTAL ANALYSIS? THE CASE OF FRACTAL LINGUISTICS
HERBERT F. JELINEK
School of Community Health,
Charles Sturt University, Australia
CAMERON L. JONES
Centre for Mathematical Modeling, School of Mathematical Sciences
Swinburne University of Technology, Australia
MATTHEW D. WARFEL
Mennonite Central Committee – Bolivia
Casilla 59 Camiri, Bolivia
CECILE LUCAS; CECILE DEPARDIEU; GAELLE AUREL
I.U.P. Genie Physiologique – Informatique et D.E.S.S. DESSTAUP.
University Poitiers, France
Field: CS questions
Key words: Fractal analysis, nonlinear science, communication, linguistics
Communicating Author:
Herbert F. Jelinek
School of Community Health
Charles Sturt University
Albury, 2640
Australia
PH: +61 2 60516946
FAX: +61 2 60516772
EMAIL: [email protected]
European Conference on Complex SystemsParis, 14-18 November 2005
ABSTRACT
Terms such as ‘self-similarity’, ‘space filling’ ‘fractal dimension’, and associated concepts have different
meanings to different people depending on their background. We examine how methodology in fractal
analysis is influenced by diverse definitions of fundamental concepts that lead to difficulties in
understanding fundamental issues. The meaning of terms associated with fractal analysis need to be
clarified if this method is to be useful in diverse disciplines. It is our premise that communications that are
result focused constitute a danger in perpetuating misconceptions of terms due to the concise nature of the
writing and the reliance on references to fill in the procedural and conceptual gaps. Communicating
effectively requires a sound understanding of the terminology and a clear and meaningful presentation. We
address here communication and the nature of scientific discourse, ‘fractal linguistics’
INTRODUCTION
The literature shows that the fractal dimension (D) of an object reveals something about the natural world
not otherwise apparent. This, combined with the seemingly simple procedures involved in fractal analysis,
has led to the popularity of this procedure for pattern analysis. The interpretation of such analysis, however,
is not always straightforward and confounding this are a number of misconceptions associated with
terminology and meaning. This is particularly true for people interested in applications of fractal analysis
but lacking a deep understanding of the underlying mathematical theory. In this paper we attempt to
correct some of these misconceptions and suggest ways which will avoid their repetition. For language to
have meaning in a community requires the specialists to take responsibility for the dissemination of
knowledge that enables others to gain control of the discourse (subject matter) and contribute in a
meaningful way. The lack of clarity can be attributed to people in specialised fields forming a specific
linguistic boundary, fractal literacy, and expecting researchers in a different research field with different
subject literacy to follow the discourse. The ideas underlying fractal analysis are inherently alien if
compared, say, to the mathematics underlying simple principles in physics. The transfer of ideas from the
theoretical domain of science to the applied is never easy but in the case of fractal analysis it appears to
have been particularly difficult. The problem has been confounded in the case of fractals by the increasing
specialization of science.
At the bases of this discussion is that there appears to be little agreement on the meaning of the terms used
in fractal analyses and, more importantly, how these terms are used in context of describing the results of
fractal analyses. As an example consider the question whether biological forms are fractal.[1,2] Strictly
speaking, a fractal only describes forms that are strictly self-similar and infinite. Natural objects and, their
representations on computers are not fractals, yet are often so described. Are natural objects space-filling?
Like the term ‘fractal’, ‘space-filling’ can have various meanings. With regards to fractal theory, space-

filling is an attribute of fractals and reflects that the recursive nature of the fractal tends to a space-filling
limit. An example is the Peano curve that if drawn to the limit of infinity has infinite length and reaches
every point of the delimited plane it is drawn on.[3] Biological forms do not have this property as they do
not possess infinite length. Thus biological forms are not strictly space-filling. However space-filling can
be used in a difference sense as discussed by Murray.[1] Here space-filling is viewed as a process, a
structure such as a plant is involved in, to optimise coverage.
Can we then use fractal analysis to discuss forms in nature? As the magnitude of published literature
indicates, many seem to think this is possible. What is often not clearly stated is that ‘fractals’ can only be
used as ‘models’ for biological shapes because natural objects lack several characteristics that define
fractals.3 The most common characteristic cited for fractals is the exact repetition of detail at every
observation scale, its strict self-similarity.[4] However the construction of true fractal objects can be
randomized. These objects possess statistical self-similarity and resemble more closely objects in nature.
In the literature though, there has been a tendency to equate statistical self-similarity (which natural objects
do possess to differing degree) with strict self-similarity and to assume that estimates of statistical self-
similarity are a test of fractality.
D is a parameter that describes the relationship between measured size and the measuring scale. Common
examples from the literature that use D to describe relationships in space and time, include heart rate
irregularities, grazing effects on pastoral lands or structural attributes of blood vessel systems and
neurons.[5-10] It is our observation however, that conclusions drawn from fractal research remain at best
tentative due to a lack of a generally comprehensible description of fractal theory and its relationship to the
associated analysis procedures.
Concepts in fractal research such as the fractal dimension are not strictly defined and much of the
terminology is used loosely. Fractal research and discussion is characterised by the repetition of definitions
and procedures that were initially ill defined and intended by the authors to be vague.[7] Thus,
communicating effectively requires a sound understanding of the terminology and a clear and meaningful
presentation. We address here communication and the nature of scientific discourse, ‘fractal linguistics’.
Communication
"A fractal set is a set in metric space for which the Hausdorff-Besicovitch dimension D is greater than the
topological dimension DT".[7, p361]
The sentence above is the most often quoted citation found in journal articles to describe fractals, even
though Mandelbrot stated, on the next page of his book, that this definition is rigorous, but also tentative.[5]

The definition is an example of communication that may be mathematically rigorous, but uses language
that is not accessible to non-specialists. Terms such as ‘set’, ‘metric space’, ‘Hausdorff-Besicovitch
dimension’ and are not very informative and meaningful to novices to fractal analysis and possibly to non-
mathematicians, bearing in mind that defining what a dimension is, has involved the most brilliant
mathematicians since the ancient Greeks.[3]
How can fractal analysis be better understood?
Once a group of the scientific/professional community is established it becomes obvious that a type of
professional socialisation takes place. This socialisation leads to communication barriers in terms of the
discourse adopted by a specific group. Thus scientific community in terms of research area and proficiency
in fractal analysis can be divided into three main categories: 1. those in the know who already posses a
solid knowledge base in fractal and scaling theory.[7,14,15] Thus the use of specific language by a group
establishes an identity for this group with a specialist domain of knowledge and expertise. 2. those with a
solid knowledge base in other disciplines and an understanding of mathematics or physics, [16-18 3] those
that bridge the gap between 1. and 2. that is, those that develop tools for fractal analyses and aim at
describing these clearly).[19] Category 3 should primarily consist of category 1 researchers that aim to
make the theoretical basis more accessible to applied research. Despite the efforts of the third group the gap
between groups 1 and 2 is still considerable. In order to have control of the ways language is used to create
meaning in fractal analysis throughout the community requires the specialists to take responsibility for the
dissemination of knowledge that enables others to gain control of the discourse (subject matter) and
contribute in a meaningful way. The lack of clarity lies in the fact that many in the first category, being
entrenched within a specific linguistic boundary, fractal literacy, find it hard to communicate the necessary
information to researchers in a different research field with different subject literacy. Papers in the second
category reflect that the authors can acquire the necessary literacy and know how fractal analysis is applied
but perpetuate that same inaccuracy in terminology. Thus, it is this section where inherent uncertainties in
definitions are most easily propagated. One likely reason for this is that the communicator adopts the new
language base but may not have a correct understanding of the terms. Should a correct understanding exist
then it is important to communicate this explicitly This latter requirement is important as many researchers
in specialised fields do not have familiarity with expertise outside their special interests yet are, in many
instances, referred to publications from the first category above. The third category is meant to provide the
tools and structure necessary to bridge the gap between the first and the second category. This third
category is not well presented.[3,20-22] It is our assertion therefore that category 1 and 2 researchers have
an obligation to disseminate their work in a manner understandable to all in addition to their publications in
specialist journals. These communications certainly exist. Indeed Mandelbrot, who is known as the father
of fractal geometry and a mathematician, published a paper that is aimed for the uninitiated, as did Jürgens
and co-workers, albeit this latter paper is more complicated.[23,24] Yet, why are the most active uses of
fractal analysis in physics?[25]
The problems which surround fractal research can be illustrated by the case of diffusion limited aggregates
(DLAs). These are the result of a random growth process and could serve as a model for many such
processes, for example, in biology. Most of the analysis of DLAs has been undertaken by physicists who
have a good grasp of the theory. The inherent complexities of DLAs, however, have meant that there is
considerable disagreement about the interpretation of these objects. Is a DLA self-similar?[25,27] Is a DLA
a multifractal?[26,28-30] These publications and their authors are well known in the field of physics and
thus their results are widely cited. All papers cited here involved physicists and apart from one paper, were
published in physics journals and written for physicists. This may explain why fractal analysis has not been
as successful in the biological sciences as it has in engineering and physics. What is lacking in the field of
fractal analyses, is for researchers in the field of fractal theory to articulate clearly how they themselves
learned both theory and application, the fractal discourse. It is important to disseminate to the rest of the
community how meaning is constructed and communicated in their field.
Fractal linguistics
The popularization of fractals and chaos has led to widespread interest in applying these ideas in a range of
scientific disciplines. What is not immediately apparent to scientists entering this field is that there is no
consensus on a number of the most basic issues, even amongst experts. Terms, such as those mentioned at
the beginning of this paper, and procedures used in fractal analysis need to be understood before fractal
analysis becomes an effective tool. It is the World Wide Web that can be of use here as many sites exist
that address ‘basic’ issues. We exemplify our stance in the next section. Teaching the skills of fractal
literacy: a language base for novices.
A Language Base for Novices
This section cannot cover all the terms that are required for a good language base. It rather aims at
correcting some common misconceptions. What then is a fractal and how is fractal analysis performed? We
start by describing some of the properties displayed by fractals. Fractals do not have inherently smooth
surfaces no matter what magnification is used to examine the object.
How can a fractal be described?
A common, yet ‘mathematically’ inappropriate term used to describe the surface of objects, is their
‘roughness’. The term roughness is used in common language to describe what is, in fractal linguistics, an
object’s space filling capacity or surface irregularity. Yet, roughness and fractal dimension do not describe
the same feature. Roughness, is a measure of the average variation about a mean and is not related to scale
or changes in scale of measurement. D quantifies the variation in length, area or volume with changes in the
size of the measuring scale.[16]
How can the attributes of fractals and natural objects be described more appropriately? Three of these are
characteristic length, self-similarity and complexity. Any non-fractal form can be approximated by a simple
shape with the same characteristic length. Thus, a sphere can approximate the Earth. The existence of a
characteristic implies a smooth surface In case of the Earth, the highest mountain is much smaller than the
diameter. Another way of looking at this is to say that the surface of the Earth becomes smoother as the
magnification is decreased. Fractal objects cannot be represented by any combination of shapes with
characteristic lengths. A cloud is such an object. Thus for many forms, Euclidean geometry and its
associated Euclidean dimension suffice to characterise these. Ideal fractal objects have no characteristic
length. Consider the representation of several steps in the construction of a Koch curve (Fig.1). Even at the
fourth step of construction, it becomes apparent, that no characteristic scale exists for the Koch curve and
that it can only be approximated by the use of a number of spheres with different sizes and not by one
simple shape.
PUT FIG 1 HERE
Fig.1 also demonstrates the self-similarity of fractal images as any change in scale will show more detail as
magnification is increased but will not lose detail if the magnification is decreased. Fractal analysis is then
the procedure that compares the size of the outline or mass of the object for each scale of the measurement.
This can be done using disks, or squares. If this change of size is constant with change of scale on a double
logarithmic plot, the form approximates a fractal and the gradient of the line through these points is
proportional to the fractal (self-similarity) dimension (Fig. 2).
PUT FIG 2 HERE
The gradient is mathematically defined by D = )/1log()(log
eeN
, which transforms into N(e)D = 1, a power law
relationship, where the exponent ‘D’ is the fractal dimension (for the Koch curve in Fig. 2, D = 1.246). The
mathematical definition of the fractal states that the size of the image scales indefinitely by a constant
proportion. The fractional part of the exponent indicates the complexity of the object. If the fractional part
of the exponent is 0, D would be equal to 1 and equal to the Euclidean dimension for a line. If the line
becomes more space filling the fractional part of the exponent increases towards 2.
Complexity is another common term used to describe the surface irregularities or the intricacy of a
branching structure. D indicates whether the structure contains a degree of self-similarity, which in turn can
be an indication of the underlying biological process that leads to the observed pattern. Self-similarity as
Mandelbrot points out, is a simple design principle that can be independent of genetic determination and
only dependent on a consecutive scaling with changes of magnitude. The dimension exponent can indicate
how a structures’ branches scale from the parent to the daughter branches as can be observed in the lung
bronchi for instance.[8] D can also be an indicator of how space-filling a structure is. If D has a value of 1.2
than the structure is not as space filling as if D was 1.4. Thus the feature that makes fractal analysis
interesting is measuring the range of the statistical self-similarity across scaling levels and the associated
estimate of D. Statistical self-similarity can be an indicator of a growth process in tubular structures such
as blood vessels, lung bronchi or neurons. The fractal dimension, provided the structure displays ‘statistical
self-similarity’ can be used to infer physiological function such as flow of air in lungs or electrotonic
properties in neurons as the diameter exponent in this special case equals the fractal dimension in some
cases.[7]
Accuracy or precision is important in fractal analysis as with any other measurement. Using Euclidean
objects is the easiest way forward as the dimension of these is known. However because we want to
ascertain the fractal dimension of fractal-like structures it is important to use test images that are similar to
the structures to be investigated. In general fractal objects such a as the Koch snow flake or a DLA
(diffusion limited aggregate) is used for such calibration[25] However a fractal object is the result of
repeated transformations of a geometrical figure that leads to strictly self-similar pattern with no scaling
limit. In practice only prefractals can be used to calibrate the measurement system. These are
approximations to true fractals – examples of true fractals shown at a finite number of iterations – since
truly infinite cases are not possible in the real world. The ‘Koch curve’ shown in Fig. 1 is not a true
fractal, as none of the iteration levels depict the case of infinity. Any incomplete representation of an ideal
fractal, as is the case with computer representations, is referred to as prefractal.[31] In practice when
prefractals are used as test images, accuracy in the strict sense cannot be ascertained as the image is not
completely represented on the screen. However analytical estimates using many fractal analysis algorithms
agree with the theoretical dimension value.
Once a biological object is analysed and a constant slope is obtained for the log-log representation of scale
versus size as a function of scale, the object is said to be self-similar with a certain fractal dimension. This
broad use of the term self-similar has led to biological forms being often identified as fractal. Biological
forms are not fractals, as they are not characterised by identical patterns at different scales (strict or linear
self-similarity).[7,33] Biological forms are at best statistically self-similar over a limited range.[32]
This misconception may have arisen from the use of the term self-similarity and scale-invariance to
indicate both strict self-similarity for ideal fractals and statistical self-similarity if biological forms are
described.[3,34-36] Similarly, obtaining D for an object does not indicate that this object is fractal.
Fractality is determined by the relationship between the observation scale and the measured size of the

object, which has to be constant without a limit. Once some of the terminology becomes clear, the
application of the algorithms still remains a mystery.
The Black Box
Prior to the advent of fractal analysis, the relationship between scale and length of coastlines was discussed
by Richardson.[37] He used callipers of different size (scale) to determine the length of the coast of Britain.
What he found was that the coast line length increased as the scale was decreased according to a power law
relationship. The exponent, is then the parameter that quantifies this relationship. Thus, whether the object
is fractal or not did not have any bearing on the aim of the analysis. [37-40] Currently many different
methods such as box-counting, dilation, mass-radius as well as the calliper method used by Richardson are
used to determine similar relationships. These methods are all analytical tools that estimate the relationship
between a scale of measurement and the size/mass of the object being measured. This is now referred to as
fractal analysis and the exponent is the fractal dimension. What is a dimension? There exists disagreement
among physicists and mathematicians, what constitutes a dimension and what measures can be included in
this term. Apart from the Hausdorff dimension other so called fractal dimensions such as the Minkowski
and the Kolmogorov dimension are not really dimensions in a mathematical sense.[3,7,16,41] However, in
the literature authors often refer to these two measures as dimensions possibly because of trying to simplify
what is really quite a complex area in mathematics. Analytical tools, such as the dilation method, and box-
counting method, are based on the Minkowski measure and Kolmogorov measure respectively. These two
measures are in themselves approximations of the mathematically rigorously defined fractal dimension
(Haudorff dimension) and are only equal for strictly self-similar objects.[21,35] Indeed books and articles
containing the terms ‘fractal analysis’ in their titles often do not point out that a strict application of the
rules of mathematics to the procedures of fractal analysis is not possible. One only needs to observe the
intricate definition of the Hausdorff dimension, which is not usable in practice and the shortcomings of the
analysis procedures in estimating the Hausdorff dimension using for instance the box-counting method.[32,
41,42]
Having decided to undertake fractal analysis, we need to consider several procedural steps. The first
question to ask is whether or not it is important that the image is fractal. No! Fractal analysis procedures are
applicable to non-fractal objects (which all biological objects are). Next is the question of what aspect of
the structure is to be analysed, especially with respect to the necessity of representing the structure as a 2D
object on the computer screen. Is a surface the same as a boundary or border? For instance, when
considering a structure such as a particle aggregate, many authors have a different idea of what a 2D image
versus 3D object is or what a surface, a boundary or border is. What is mass in 2D?[41,43] What does it
mean to analyse a surface when some people see a surface like a relief map, while others view it as the
boundary or perimeter of a 3D object? Understanding these terms is critical as techniques for analysing the
scaling characteristics are very different.[44-48] Image silhouettes, for example, have been used in the
analyses of fractal-like characteristics in sludge aggregates by several investigators.[47-49] These
silhouettes can be presented as sectioned boundaries or as the boundary of the silhouette. Estimates of the
dimension of silhouette boundaries are consistently smaller than those of sectioned boundaries.[48]
Associated with this is the significant problem of determining the ‘appropriate’ fractal dimension. What
type of fractal does the image represent? Pfeifer suggests several ‘prototypes’ of fractals including mass
and porous fractals.[44] This is important as different fractal analysis procedures have been suggested,
depending on the prototype the object is akin to. Note, though that there is no agreement with this step and
some authors use the boundary of an object regardless if its length or mass with respect to scale is
investigated.[50-52]
Having decided that the image to be analysed does not have to be fractal but that some type of scaling rule
may be implicit in the morphology of the structure, the next step is to decide on the type of algorithm to be
used.[44,53] Now it becomes important to extend or working definition of self-similarity to include the
broader concept of self-affinity.3 Self-affine images scale differently in the x and y directions. When the
object scales equally in the x and y direction, self-affinity is the same as self-similarity.[3,54]
Before starting the analysis, some image manipulation or preparation of the sample, such as sectioning a 3D
object versus representing it as a silhouette, may be required and may have an effect on the estimate of
D.[5,43] The image needs to be available for the specific fractal analysis software for analysis. Here the
placement of the image and the size of the image within the acquisition screen may also influence the
estimated D. Many of the fractal analysis applications then include a choice of the number of starting points
for the box placement and selection of the range of box sizes and whether the image is to be rotated.[4,5,55-
57] These options need to be investigated with all software as both the extent of statistical self-similarity
and the magnitude of D are influenced by these procedures. Further, application of conventional fractal
techniques such as box-counting are inappropriate for analysing self-affine fractals.[58] However, using a
section parallel to the nominal surface orientation, the resulting boundary lines may be statistically self-
similar or scale-invariant. These boundary lines can then be analysed to characterise the surface. The
boundary of the silhouette is an approximation of this sectional boundary as discussed previously.
Using ‘fractal’ test images to ascertain the efficacy of the procedure may also be misleading because of
how this aspect of fractal analysis is often described. The accuracy of fractal analysis methods is by its very
nature difficult to determine. Consider the determination of D for a branching fungus. The control image
needs to be of similar shape to the image tested.[59] DLAs (diffusion limited aggregates) are chosen often
for this task.[25,52] Yet physicists are not in agreement that a DLA is a fractal or what it's exact dimension
is.[23,33,43] If the dimension of a boundary has to be determined, such as for a particle aggregate, the
Koch curve can be used as a control image. The precise D for this curve is 1.264 but as the curve cannot be
represented accurately, that is, with an infinite amount of detail, the estimate of D will in many cases
deviate from the theoretical. This can be avoided if a level 4 or 5 representation of the curve is used (see
Fig. 1). In addition there is a pixelation/staircase effect that is dependent on the size of the pixels (resolution
of the screen) that influences the complexity of the border. In classification tasks for instance, the
robustness of the procedure is important and this can even be tested by using Euclidean images such as a
square or circle. The question is not whether the images are fractal but if a there is difference between
images in their scaling behaviour.[60,61]
What fractal analysis procedure is appropriate has been briefly mentioned above. Despite arguments in the
literature that both mass and boundary fractal dimensions should be measured using image boundaries,
investigators have often used these fractal analysis techniques to measure different types of images.[5,18]
Others used the box-counting technique on silhouette areas to characterise the mass of flocs and
granules.[48] The resulting dimension, though perhaps not a theoretical mass fractal dimension, was found
to be effective in differentiation tasks.[43] Fractal analyses methods such as the dilation technique may also
be applied to image boundaries (including both perimeters and pore space boundaries) of a 2D
image.[37,49] However, the resulting fractal dimension is greater than the fractal dimension of the
perimeter as the pore boundaries provide an increase in the space-filling ability of the surface.
Once the data has been obtained as a scaling relationship between the logarithm of the scale of observation
and the logarithm of the size of the image, the extent of statistical self-similarity and the fractal dimension
can be determined. A decision that needs to be made here is whether to include all data points or whether
there is one, two or more clearly defined linear segments apparent in the plot.[3,6,20,51] Inherent in the
linearity of the plot is the selection of the different scales of the measuring device such as a box or circle. If
the measuring scale is very much larger than the size of the object, the box always covers the object and the
number of boxes required to cover the object, regardless of the size, will always be 1 and the slope or D
will be 1. Alternatively, if the size of the box is smaller than the "line width" of the object, then one is
measuring the area of a solid object and the slope or D is 2.[62] Having chosen the appropriate size for the
boxes, the log-log plots that represent the scaling characteristics of biological forms still do not show a
constant relationship between the scale of measurement and the size/mass of the object. The points where
this occurs are the upper and lower cut-off points between which statistical self-similarity occurs. One can
remove data points one at a time until the squared correlation coefficient approaches some previously
defined number (eg 0.995), or utilise a combination of curve-fitting tests and curvilinearity of residuals to
identify the largest range over which the image displays statistical self-similarity.[22,63,64] Curvilinearity
can be tested by fitting the data to first and second order polynomials and comparing using a chi square test
the better fit or use the error in Y.[22,63] If regression analysis is used, one needs to consider that
converting linear data to log-log data changes the profile of the distribution of the data points. This can be
corrected for by weighting the log-log data points.[65] However, any method involving linear regression

may not be suited to measure complexity and an alternative may be more appropriate.[41] The final
outcome is an estimate of the fractal dimension for a biological object and an indication of the range of
statistical self-similarity.
The above considerations have attempted to provide a start to sound understanding of fractal analysis in
that they clarify the meaning behind terms commonly used in this field and aspects of the procedure.
CONCLUSION
Being familiar and understanding the basic terms used in any analysis procedure sets up a linguistic domain
that is imperative to ensure that the results are meaningful. This paper concentrated on several that are
relevant to fractal analysis. The process of selecting an appropriate fractal analysis technique with reference
to image characteristics was also outlined. This then represents together with the section on ’language base
for the novice’ and ‘the black box’ an attempt to make this methodology available and understandable to
scientists within the field of fractal analysis and in other field of research.
Acknowledgments
MDW would like to acknowledge the support of the National Science Foundation, Environmental and
Ocean Systems Program (Grant No. BES-9312825). HJ was in receipt of a Faculty Seed Grant.
REFERENCES
1. Murray, JD: Use and abuse of fractal theory in neuroscience. J Comp Neurol 1995; 361:369-371.
2. Panico, J, Sterling, P: Retinal neurons and vessels are not fractal but space filling. J Comp Neurol
1995; 361:479-490.
3. Peitgen, H-O, Jürgens, H, Saupe, D: Fractals for the Classroom. Part One, Springer-Verlag, New
York, 1991
4. Montague, PR, Friedlander, MJ: Morphogenesis and territorial coverage by isolated mammalian
retinal ganglion cells, J Neurosci. 1991; 11(5):1440-1457.
5. Jelinek, HF, Fernandez, E: (1998) Neurons and fractals: how reliable and useful are calculations of
fractal dimensions? J Neurosci Meth 1998; 81:9-18.
6. Vicsek, T: Fractal Growth Phenomena, 2 ed. Singapore, World Scientific, 1992.
7. Mandelbrot, BB: The Fractal Geometry of Nature, W.H. Freeman and Co., N.Y., 1987.
8. Bassingthwaighte, JB, Liebovitch, LS, West, BJ: Fractal Physiology, Oxford University Press,
Oxford, 1994.
9. Loehle, C, Li, B: Statistical properties of ecological and geological fractals. Eco. Mod. 1996; 85:271-
284.
10. Stanley, HE, Ostrovsky, N: On Growth and Form: Fractal and Non-Fractal Patterns in Physics.
Nijhoff, Dordrecht, 1986.
11. Sernetz, M, Wübbeke, J, Wlczek, P: Three-dimensional image analysis and fractal characterization
of kidney arterial vessels. Physica A, 1992. 19:13-16.
12. Jelinek, HF, Spence, I: Categorization of cat retinal ganglion cells using fractal dimension: the case
of the gamma, epsilon and delta cells, in Australian Neuroscience Soc. 1995; 134.
13. Avnir, D, Biham, O, Lidar D, Malcai, O: Is the Geometry of Nature Fractal. Science, 279, 39
14. Hausdorff, F. (1919) Dimension und äußeres Maß, Math Ann 1998; 79:157-179.
15. Taylor, J: The measure theory of random fractals. Math Proc Camb Phil Soc 1986; 100:383-407.
16. Cox, BL, Wang, JSY: Fractal surfaces: measurement and applications in the earth science. Fractals
1993; 1(1): p. 87-115.
17. Smith, Jr., TG., Behar, TN, Lange, GD, Sheriff, Jr., WH, Neale, EA: (1989) A fractal analysis of cell
images. J Neurosci Meth 1989; 27:173-180.
18. Roach, DE, Fowler, AD: Dimensionality analysis of patterns: fractal measurements. Computers
Geosciences, 1993; 19(6):849-869.
19. Bernston, GM, Stoll, P: Correcting for finite spatial scales of self-similarity when calculating the
fractal dimension of real-world structures. Proc. R. Soc. Lond. B. 1997; 264:1531-1537.
20. Hastings, HM, Sugihara, G: Fractals: a user's guide for the natural sciences. Oxford University Press,
Oxford, 1993.
21. Lauwerier, H: Fractals: Images of Chaos. Penguin Books. Princeton University Press, New Jersey,
1991.
22. Russ, J : Fractal Surfaces, Plenum Press, New York, NY., 1994.
23. Mandelbrot, BB: Fractals – geometry of nature. Science 1990; 22-27.
24. Jürgens, H, Peitgen, H-O, Saupe, D: The language of fractals Sci Am 1990; 40-47.
25. Witten, A, Sander, LM: Diffusion Limited Aggregation. Physical Rev. B, 1981; 27(9):5686-5697.
26. Nittman, J, Stanley, HE, Touboul, E, Daccord, G: Experimental evidence for multifractality. Phys
Rev Lett 1987; 58:612-622.
27. Mandelbrot, BB: Plane DLA is not self-similar; it is a fractal that becomes increasingly compact as it
grows? Physica A.1992; 191:95-107.
28. Viscek, F, Family, F, Meakin, P: (1990) Multifractal geometry of diffusion-limited aggregates.
Europhys Lett 1990; 12:217-222.
29. Lam, CH:Finite size effects in diffusion-limited aggregation. Phys Rev B 1995; 52:2841-2847
30. Fernandez, E, Bolea, JA, Ortega, G, Louis, E: Are neurons multifractals? J Neurosci Meth 1999; 89:
151-157.
31. Feder, J: Fractals, Plenum Press, New York, 1988.
32. Schroeder, M: Fractals, Chaos and Power Laws, W.H. Freeman and Co. U.S.A., 1991.
33. Shenker, OR: Fractal geometry is not the geometry of nature. Stud Hist Phil Sci 1994; 25(6):967-
981.
34. Takayasu, H: Fractals in the Physical Science,. Manchester University Press, Manchester and New
York, 1990.
35. Peitgen, H-O, Saupe, D: The Science of Fractal Image, Springer-Verlag, Berlin, 1988.
36. Pfeifer, P: Is nature fractal? Letter to Science. 1998; 279:784.
37. Richardson, LF: The problem of contiguity: an appendix to statistics of deadly quarrels. General
Systems Yearbook. 1961; 6:139-187.
38. Bellouti, MM., Alves, M, Novais, JM, Mota, M: Flocs vs. granules: differentiation by fractal
dimension Water Res 1997; 31 (5): 1227-1231.
39. Pfeifer, P, Welz, U, Wipperman, H: Fractal surface dimension of proteins: lysozyme. Chemical
Physics Letters, 11985; 13 (6): 535-540.
40. Reilly, S, Clark, NN: Computer based general shape description with harmonics and a roughness
index. Proceedings of the Institution of Mechanical Engineers. Part E, J of Proc Mech Eng 1991; 205
(E2): 103-111.
41. Sandau, K, Kurz, H: Measuring fractal dimension and complexity - an alternative approach with an
application J Microscopy 1997; 186(2):164-176.
42. Falconer, K: Fractal geometry, mathematical foundations and applications. Wiley, New York, 1990.
43. Warfel, MD. Characterization of particles from wastewater and sludge treatment facilities by size
and morphology M.Sc. Thesis, Cornell University. 1998.
44. Pfeifer, P: (1987) Characterization of surface irregularity. In: Preparative Chemistry Using

Supported Reagants. P. Laszlo (ed.). Academic Press, San Diego, CA. 1987.
45. Akashi, T, Kojima, E, Ichikawa, E: Applied fractal method to measurement of flocculation in
wastewater treatment processes. In: Control and Instrumentation. Proceedings of the 20th
International Conference on Industrial Electronics, 1994; 2:1259-64.
46. Namer, J, Ganczarczyk, JJ: (1994) Fractal dimensions and shape factors of digested sludge particle
aggregates Water Pollution Res J 1994; 29 (4):441-455.
47. Jiang, Q, Logan, E: Fractal dimensions of aggregates from shear devices. Journal of the American
Water Works Association, 1996; 88:100-113.
48. Ganczarczyk. JJ: A correlation between external surface characteristics and settling velocity of
activated sludge flocs. Proceedings of the International Association of Water Quality, 1995; 8 (1), 4-
7.
49. Jiang, Q, Logan, B: Fractal dimensions of aggregates determined from steady-state size distributions.
Environmental Science and Technology, 1991; 25 (12):2031-2038.
50. Smith, TG, Lange, GD, Marks, WB: Fractal methods and results in cellular morphology –
dimensions, lacunarity and multifractals. J Neurosci Meth 1996; 69(2):126-136.
51. Fernandez, E, Jelinek, HF: Use of fractal theory in neuroscience: methods, advantages and potential
problems. Meth 2001; 24:309-321
52. Caserta, F, Eldred, WD., Fernandez, E, Hausman, RE., Stanford, LR., Bulderev, SV., Schwarzer, S,
Stanley, HE: Determination of physiologically characterized neurons in two and three dimensions. J.
Neurosci. Meth. 1995; 56:133-144.
53. Warfel, MD: http://www.cee.cornell.edu/~mdw/index.html 1997.
54. Li, DH, Ganczarczyk, JJ: Fractal geometry of particle aggregates generated in water and wastewater
treatment processes. Environmental Science and Technology, 1989; 23 (11):1385-1389.
55. Jones, C, Jelinek, HF: Wavelet Packet Fractal Analysis of Neuronal Morphology Meth 2001;
24(4):347-358.
56. Forest, SR, Witten, TA: Long-range correlations in smoke particle aggregates. J Physics A Math and
Gen 1979; 12:L109-L117.
57. Droppo, IG, Flannigan, DT, Leppard, GG, Liss, SN: Microbial floc stabilization and preparation for
structural analyses by correlative microscopy. Water Science and Technology, 1996; 34 (5-6), 155-
162.
58. Soddell, JA, Seviour, RJ: A comparison of methods for determining the fractal dimensions of
colonies of filamentous bacteria Binary 1994; 6, 21-31.
59. Jelinek, HF, Elston, GN: Dendritic branching of pyramidal cells in the visual cortex of the nocturnal
owl monkey: a fractal analysis Fractals 2003; 11(4):1-5.
60. Mandelbrot, BB, Pfeifer, P, Biham, O, Lidar, DA, Avnir, D: (1998) Editorial and Letters: Science,
1998; 279: 783.
61. Tsonis, AA, Eisner, JB, Avnir. D: Editorial and Letters: Fractality in Nature. Science, 1988;
279:784.
62. Bourke, P: Fractal dimension calculator user manual.
http://www.mhri.edu.au/~pdp/frctals/fractdim.html 1993.
63. Nonnenmacher, TF: Digital image analysis of self-similar cell profiles Biomedical computing, 1994;
37:131-138.
64. Soille, P, Rivest, J-F: On the validity of fractal dimension measurements in image analysis. J. Vis.
Com Image Repr. 1996; 7(3):217-229.
65. Struzik, ZR: From coastline length to inverse fractal problem: the concept of fractal metrology. PhD
Thesis. University of Amsterdam. 1996.

Figure 1
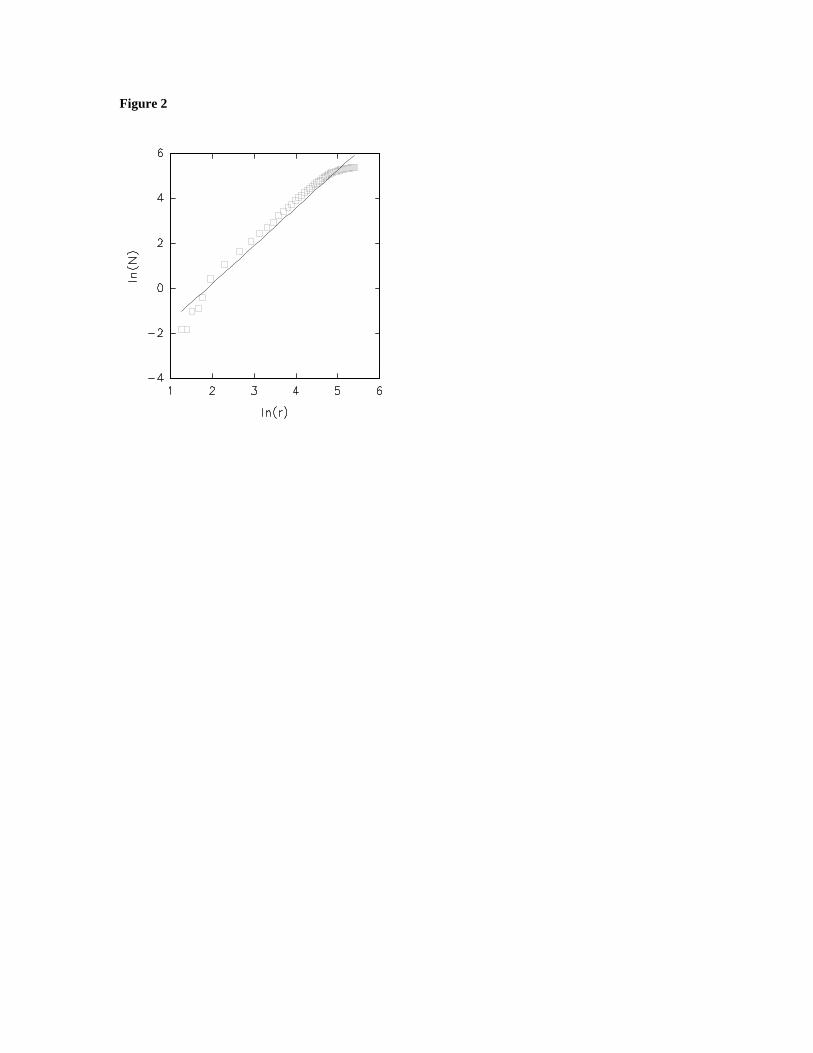
Figure 2
Legends
Figure 1
The Koch curve displaying the iteration process over several generations.
Figure 2
Double logarithmic relationship between the measuring scale (1/e) and the size of the image N(e). The
regression line through the data points indicates the range of statistical self-similarity and its gradient is
proportional to the scaling exponent.
Figure 2
Method of applying mass-radius analyses to quantify the branching complexity of a fungal colony. The
mean of 5 separate analyses of this image, using different centres of origin returned a mean Df=1.691 ±
0.017 r2=0.967.