The fractal structure of polycation–DNA complexes
35
1 THE FRACTAL STRUCTURE OF POLYCATION-DNA COMPLEXES SUPTI SARKAR , LI KIM LEE, STEPHEN L. HART 1 , HELEN C. HAILES 2 , SUSANA M. LEVY, ALETHEA TABOR 2 , PARVIZ AYAZI SHAMLOU 3 Department of Biochemical Engineering University College London, Torrington Place, London WC1E 7JE 1 Institute of Child Health, UCL Molecular Immunology Unit, Institute of Child Health, University College London Medical School, London WC1N 1EH 2 Department of Chemistry, UCL University College London, Christopher Ingold Laboratories, 20 Gordon Street, London WC1H OAJ 3 Corresponding Author: [email protected] Keywords: Aggregate, diffusion-limited colloidal aggregation and regime limited colloidal aggregation, DVLO theory, fractal dimensions, gene therapy. Abstract We use static light scattering to obtain new measurements on the internal structure of aggregated non-viral delivery vector particles in colloidal suspension. The vector particles are prepared by charge neutralisation of plasmid DNA by Poly-L-Lysine (PLL- DNA) and a Lipofectin/integrin-targeting Peptide (LPD). We use established theories of stability of colloidal particles and fractal concepts to explain the aggregation processes and demonstrate the existence of a new property (fractal dimension) of the aggregated vector particles. Aggregation is shown to produce particles with fractal dimensions in the range between 1.8 and 2.4; the former suggests a loose 3-dimensional structure and the latter characterises an aggregation process that leads to the formation of particles with tightly packed structures. We show that the fractal dimension of the vector particles is sensitive to changes in physico-chemical conditions (ionic strength) of the buffer solution and propose that fractal dimension may provide a useful means of monitoring the physical state of non-viral delivery vector particles during preparation and storage. Biotechnol. & Appl. Biochem. Immediate Publication. Published on 8 Jul 2004 as manuscript BA20040017 Copyright 2004 Portland Press Ltd.
Transcript of The fractal structure of polycation–DNA complexes
1
THE FRACTAL STRUCTURE OF POLYCATION-DNA COMPLEXES
SUPTI SARKAR , LI KIM LEE, STEPHEN L. HART1, HELEN C. HAILES2, SUSANA M. LEVY, ALETHEA TABOR2, PARVIZ AYAZI SHAMLOU3
Department of Biochemical Engineering University College London, Torrington Place, London WC1E 7JE
1 Institute of Child Health, UCL Molecular Immunology Unit, Institute of Child Health, University College London
Medical School, London WC1N 1EH 2 Department of Chemistry, UCL
University College London, Christopher Ingold Laboratories, 20 Gordon Street, London WC1H OAJ
3 Corresponding Author: [email protected]
Keywords: Aggregate, diffusion-limited colloidal aggregation and regime limited colloidal aggregation, DVLO theory, fractal dimensions, gene therapy.
Abstract We use static light scattering to obtain new measurements on the internal structure of
aggregated non-viral delivery vector particles in colloidal suspension. The vector
particles are prepared by charge neutralisation of plasmid DNA by Poly-L-Lysine (PLL-
DNA) and a Lipofectin/integrin-targeting Peptide (LPD). We use established theories of
stability of colloidal particles and fractal concepts to explain the aggregation processes
and demonstrate the existence of a new property (fractal dimension) of the aggregated
vector particles. Aggregation is shown to produce particles with fractal dimensions in
the range between 1.8 and 2.4; the former suggests a loose 3-dimensional structure and
the latter characterises an aggregation process that leads to the formation of particles
with tightly packed structures. We show that the fractal dimension of the vector
particles is sensitive to changes in physico-chemical conditions (ionic strength) of the
buffer solution and propose that fractal dimension may provide a useful means of
monitoring the physical state of non-viral delivery vector particles during preparation
and storage.
Biotechnol. & Appl. Biochem. Immediate Publication. Published on 8 Jul 2004 as manuscript BA20040017
Copyright 2004 Portland Press Ltd.
2
Introduction
DNA vaccination and gene therapy offer significant advantages in the treatment of
many intractable diseases such as different cancers, AIDS and autoimmune diseases
[1,2] but many technical challenges must be overcome before the potential of these
techniques are realised. A major challenge is the need for better delivery systems. Viral
vectors are popular, but there are safety concerns regarding their use [3] and it is
proving difficult to make them in large quantities and sufficient purity [4,5]. DNA
complexes pose fewer problems than viral vectors, but suffer from unacceptably low
transfection efficiencies. Considerable research has been devoted to establishing the
causes of poor transfection and the size of plasmid DNA complexes has been identified
as an important factor. When polycations are mixed with nucleic acids, the ensuing
electrostatic interactions result in the collapse of DNA into a compact structure. Work in
our laboratories [6-8] and elsewhere [9,10] has shown that aggregation of these
compacted DNA-polycation complexes occurs under most physico-chemical conditions,
including physiological conditions. This form of aggregation may play an important
role in cell transfection. We recently reported that the tendency for aggregation of these
systems is governed by their physio-chemical properties and is described by the DLVO
theory [6]. We also described the kinetics of aggregation of these complexes using
Monte Carlo simulations [8]. The properties of aggregates of DNA complex have also
been investigated in numerous studies using a variety of techniques including light
scattering, centrifugation, gel electrophoresis, electron microscopy, X-ray diffraction
and atomic force microscopy [10-14]. However, these techniques provide no
information on the mechanisms of aggregation and give no indication of the
morphology of the resulting aggregates. The spatial distribution of DNA complexes
within the aggregates may vary considerably with time and/or as a result of changes in
Biotechnol. & Appl. Biochem. Immediate Publication. Published on 8 Jul 2004 as manuscript BA20040017
Copyright 2004 Portland Press Ltd.
3
the physio-chemical and preparation conditions. The three-dimensional structure of the
aggregates may vary from a loosely bound, open structure to a tightly packed, dense
structure. The impact of these structures on transfection efficiency may be significant
but has not been investigated because it has proven difficult to quantify these structures.
The concept of fractals has been used previously to describe the morphology of many
structures resulting from naturally occurring growth processes. The formation of a
fractal structure starts when primary nano-particles or clusters of such particles in a
liquid medium collide continuously to form larger self-similar structures; depending on
the detailed kinetics of the collisions between the particles the final structure may vary
from a 1-dimensional linear structure to a 2- or 3-dimensional branched, porous or solid
structure. Mass fractals are formed in this way and may be characterised by their fractal
dimension, Df, which relates the size (R) to the mass (M) of the structure. Thus:
( ) fD1NR α= (1)
where α is a constant and N is the number of the primary particles in the structure. Df is
typically in the range 1 ≤ Df ≤ 3. Experimental studies combined with theoretical
analysis have identified two physical processes by which mass fractal structures form.
Briefly, reaction-limited colloidal aggregation (RLCA) has been reported to occur at
low particle concentrations and/or low sticking probability where only a small fraction
of encounters between particles leads to aggregation. These conditions lead to the
formation of compact fractal structures with a high value of fractal dimension (Df ≥
2.1). In contrast, diffusion-limited colloidal aggregation (DLCA) occurs at high particle
concentrations. In this case it is hypothesised that all particle-particle collisions cause
Biotechnol. & Appl. Biochem. Immediate Publication. Published on 8 Jul 2004 as manuscript BA20040017
Copyright 2004 Portland Press Ltd.
4
aggregation, corresponding to a sticking probability of unity. The result is the formation
of loose structures with fractal dimensions close to 1.8 [28].
In biotechnology, many growth processes including growth of filamentous micro-
organisms and microbial colonies have been shown to have fractal properties [34]. For
example, it has been demonstrated that the fractal dimensions of bacterial colonies and
the branching ability of filamentous micro-organisms are sensitive to changes in
nutrient concentration. Other examples of fractal aggregation include aggregation of
particles with adsorbed antibody fragments, coagulation of waste water sludge and
many non-biological systems [15-19].
To our knowledge, however, no study has been reported in the literature on the fractal
properties of non-viral vector delivery systems. In the present investigation we
hypothesis that the aggregation of DNA complexes leads to the formation of fractal
structures and provide new experimental data to test the hypothesis. We measure the
fractal dimension of aggregates of DNA complexes using static light scattering (SLS)
and demonstrate that the fractal dimension provides insight into the spatial distribution
of DNA complexes within the aggregate. We show that the fractal dimension of these
aggregates are sensitive to changes in physico-chemical properties of the system and
recommend that fractal methods may be used as a new tool for monitoring the quality of
gene delivery vectors during preparation and storage.
Biotechnol. & Appl. Biochem. Immediate Publication. Published on 8 Jul 2004 as manuscript BA20040017
Copyright 2004 Portland Press Ltd.

5
Materials and methods
Reagents and plasmid DNA
All solutions were prepared from deionised Milli-Q water (resistivity ≈18.2 MΩ.cm)
(Millipore Ltd, Bedford, MA, USA) and filtered with 0.22 µm pore size Millipore
syringe filters to remove particulates. HEPES (N-[2-hydroxyethyl]piperazine-N’-[2-
ethanesulfonic acid]) (Sigma-Aldrich, Poole, Dorset, UK) was dissolved in deionised
water and the pH was adjusted as required, by adding NaOH.
Experiments were performed with a 6.9 kb plasmid, pSVβ (Promega Corp., Madison,
WI, USA). The plasmid was transformed and propagated in Escherichia coli DH5α
(Gibco Life Technologies, Gaithersburg, MD, USA) and purified using a Qiagen Kit
(West Sussex, UK). Plasmid purity was analysed by spectrophotometry and gave an
absorbance ratio ( )280260 A/A of 1.8 [20]. Further details are given elsewhere [21].
Experiments were carried out with two different condensing agents. Most experiments
were performed using the Lipofectin-integrin-targetting Peptide-DNA (LPD) vector
particles described fully elsewhere [22-25]. The LPD particles were prepared at a
0.75:4:1 (L:P:D) weight ratio, corresponding to a charge ratio of +7 (ratio of positive
equivalents of the cationic groups to negative charge equivalents of the nucleic acid).
Experiments were performed at different electrolyte concentrations ranging from 20
mM to 1 M NaCl.
Limited tests were also performed with the condensing agent, poly-L-lysine, PLL,
(MW≈25,250, Sigma, Poole, Doorset, UK) and used without further purification or
Biotechnol. & Appl. Biochem. Immediate Publication. Published on 8 Jul 2004 as manuscript BA20040017
Copyright 2004 Portland Press Ltd.
6
modification. Purified plasmid was resuspended at a concentration of 25 µg/ml in 20
mM HEPES pH 7.2 and mixed with an equal volume of PLL (31.67 µg/ml in 20 mM
HEPES pH 7.2) to form PLL/DNA complexes at a molar charge ratio of 2.0. NaCl was
added to the buffer solution to give ionic strengths of 20, 40, 80 100, 150, 250, 750 or
1000 mM.
There is no reported measurement of fractal dimensions for gene delivery particles
described in the present study. Therefore, to provide comparative data we also
performed a series of initial tests with latex particles (Duke Scientific, CA, USA). The
latex particles were purchased originally in a surfactant-stabilised state as standard
calibration particles (220 nm ± 5 nm) for the particle-sizing instrument. The particles
were suspended in either 250 mM or 1 M NaCl pH 3.0 solutions for static light
scattering studies.
Dynamic light scattering measurements
The stability of the vector particles in solution was evaluated by measuring the particle
size as a function of time. Size measurements were carried out by dynamic light
scattering (DLS), using a Malvern Zetasizer 3000 (Malvern Instruments Ltd, Malvern,
Worcester, UK) equipped with a 10 mW, HeNe laser operating at 633 nm wavelength
and 90° scattering angle. The method of measurement and analysis of data have been
previously described [6-8].
Static light scattering measurements
Fractal properties of the vector particles were obtained from static light scattering
measurements using a Malvern 4800 computer controlled spectrophotometer (Autosizer
Biotechnol. & Appl. Biochem. Immediate Publication. Published on 8 Jul 2004 as manuscript BA20040017
Copyright 2004 Portland Press Ltd.

7
4800, Malvern Instruments Ltd, Worcestershire, UK. The light source used was a 50
mW 532 nm Uniphase Micro Green laser. The scattered light was collected by an
avalanche photodiode detector positioned at angle θ relative to the forward direction of
the incident beam. All experiments were performed at the constant temperature of 25°C.
The spectrometer was calibrated by performing angular measurements of intensity on
toluene. The toluene count rate was taken at 30°, 90° and 150°, to ensure that the count
rate at 90° was half that at 30° and 150°. In our experiments, angular scans were
performed from θ = 12° to 100°, with a measurement made every 4° (23 steps) for an
acquisition time of 10 seconds (sample acquisition time ≥ 230 seconds) for PLL-DNA
and 10°- 30° for LPD and latex particles (31 steps) The intensity measurements were
repeated at different times following sample preparation. The ability to measure the
intensity of scattered light at angles less than 20o on a goniometer system will depend
on the degree of flare that the laser produces as it enters the cuvette. The refractive
index difference between the glass of the vat and the liquid contained in the vat will
exasperate this situation. To reduce this flare, toluene can be used in the vat. However,
if the system is very well aligned and the vat and fluid used in the vat is exceptionally
clean, there is no reason why measurements made at angles lower than 20o cannot be
performed (Malvern Instruments – private communication). The way to validate the
suitability of the system for measurements at such forward angles is to perform angle
scans with a suitable solvent such as toluene. If the system is well aligned and clean, the
standard angle scan will produce a flat response. This measurement was always
performed in our experiments prior to measurements of the samples to ensure that the
system was suitable for data collection .
Biotechnol. & Appl. Biochem. Immediate Publication. Published on 8 Jul 2004 as manuscript BA20040017
Copyright 2004 Portland Press Ltd.

8
The theory of light scattering to determine the fractal dimension has been reviewed in
several publications [26,27] and therefore only a brief description is given here. In the
experiments, the scattered intensity I(q) from the randomly oriented particles in
suspension is measured as a function of the scattering angle, θ. The magnitude of the
scattered vector, q, measured in reciprocal length, is given by:
λθπ /2)sin(4 nq = (2)
where n is the refractive index of the solution (1.33) and λ the incident wavelength of
the light in a vacuum (532 nm). The scattered intensity I(q) may be described as the
product of the form factor, P(q) which is the scattered intensity function of the
elementary (scatterer) particles of radius a and the structure function, S(q), which
accounts for the scattered intensity arising from the spatial distribution of the scatterer
particles within the aggregate, having a characteristics maximum length l. Thus:
)()()( qPqSqI ∝ (3)
In the intermediate regime of the wave number, which is of interest to this study, i.e. in
the range l-1 < q < a-1, the form factor P(q) is assumed to be constant and independent of
fractal dimension [35] Importantly, in this regime, theoretical consideration leads to the
following mathematical statement between the structure function S(q) and the wave
number (q) [36][37]Thus:
fDqqS −∝)( (4)
Biotechnol. & Appl. Biochem. Immediate Publication. Published on 8 Jul 2004 as manuscript BA20040017
Copyright 2004 Portland Press Ltd.
9
Therefore, in the intermediate regime, letting P(q)=1.0 and using equations 3 and 4,
leads to the following relationship [15, 26]:
fDqqSI(q) −∝∝ )( (5)
According to Equation 5, a plot of the scattered intensity (photoncounts), I(q), or the
form factor, S(q), vs. the wave number, q on log-log coordinates would be expected to
yield a straight line with a negative slope equal to the fractal dimension. In the
discussion that follows we have used the I(q) vs q plots to present our results [36][37].
To ensure accuracy of results, the angular range 12° ≤ θ ≤ 68° was chosen for
determination of the fractal dimenison in the experiments with PLL-DNA (0.2 < qa <
1) and 10o ≤ θ ≤ 30o (0.1 < qa < 1) in experiments involving the latex particles and LPD.
Measurements of fractal dimension were initiated when the average aggregate size
exceeded ten times the size of the initial particle size in order to ensure accuracy of data.
Zeta potential measurements
Zeta potentials were measured using laser Doppler velocimetry in a Malvern Zetasizer
3000 (Malvern Instruments Ltd). After the initial particle sizing period, typically
between two and three hours, the sample was diluted further with the relevant buffer to
maintain an acceptable photomultiplier signal. In these measurements the lipopolyplex
(LPD) DNA concentration was approximately 20 µg/ml. The zeta potential was
averaged from 10 measurements.
Biotechnol. & Appl. Biochem. Immediate Publication. Published on 8 Jul 2004 as manuscript BA20040017
Copyright 2004 Portland Press Ltd.

10
Results and Discussion
Measurements of DNA of various sizes have been reported previously,in our
laboratories, we have studied the factors that influence the size and size distribution of
DNA complexes under different physico-chemical conditions for nearly a decade using
static and dynamic light scattering as well as atomic force microscopy [6][8][38]. These
studies demonstrate that the presence of a negatively charged condensing agent, such as
the poly-L-lysine or the Lipofectin, cause the DNA molecule to collapse on itself
forming a condensed structure in association with the components in the condensing
reagent, it has been suggested that the reduction in the size of the DNA molecule
facilitates its transport across cell-wall membrane, and the complex structure, formed
through binding of the DNA and the components in the condensing agent, has been
implicated in the cellular trafficking processes that lead to transfection. However,
charge neutralization renders the condensed DNA molecules susceptible to aggregation,
the rate and extent of aggregation are critically controlled by the buffer conditions (ionic
strength and pH). There is as yet no consensus of opinion on the precise molecular
mechanisms by which the components in the condensing agent interact (associate) with
the DNA molecules, although a number of hypothesis has been suggested [39]. The
elucidation of the molecular association mechanisms is beyond the scope of our paper,
which is intended to be a contribution on the fractal properties of the aggregates, which
are formed as a result of collision between the elementary units (scatterer particles) of
condensed DNA. In this respect, an important parameter is the size of the elementary
(scatterer) particles, but in our experiments with PLL-DNA and LPD systems, the
definition of a scatterer particle size presented two practical difficulties. The first
difficulty stemmed from the rapidly aggregating nature of the condensed DNA particles
Biotechnol. & Appl. Biochem. Immediate Publication. Published on 8 Jul 2004 as manuscript BA20040017
Copyright 2004 Portland Press Ltd.

11
in most buffers, which made it difficult to establish the precise size of the scatterer
particles at t=0, which is taken to represent the time at the end of DNA condensation
process and prior to the start of aggregation. The second difficulty was related to the
inability of the static light scattering technique to detect the size of the uncondensed
DNA molecules prior to condensation. These challenges and our approaches to
resolving them are considered first before discussing the results of the fractal
experiments
The static light scattering technique employed in the present study, was not able to
detect the (uncondensed) DNA molecules in solution. It has been reported previously
that the loose structure of the (uncondensed) DNA molecule does not allow sufficient
light scattering to facilitate such measurements [40-43]. Also, the peptide (Poly-L-
Lysine) solution on its own did not produce any detectable measurements [39]. Size and
scattering intensity I(q) became detectable only upon condensation of the DNA.
Considering the rapidly aggregating nature of the condensed DNA particles we devised
controlled experiments to establish the size of the scatterer particles. In the case of
DNA-PLL system, we previously showed [6][7]that mixing of the DNA and PLL in
distilled water induced DNA condensation, but did not cause aggregation. In all other
buffers, condensation was followed by rapid aggregation. We therefore used
measurements in water to define a nominal (notional) “scatterer” size of 50 nm (data
not shown) for the DNA-PLL particles. In the case of the Lipofectin-(integrin-
targeting) Peptide-DNA (LPD) system, Figure 1a indicates a mean scatterer size of
150nm, the size distributions, which are shown as function of time, confirm that in
distilled water DNA condensation occurs without aggregation. Interestingly, as shown
in this figure 1b, prior to mixing with the DNA solution, the Lipofectin particles had a
Biotechnol. & Appl. Biochem. Immediate Publication. Published on 8 Jul 2004 as manuscript BA20040017
Copyright 2004 Portland Press Ltd.

12
bimodal size distribution with two peak sizes at 400 nm and 1300nm. However,
immediately after mixing with a solution containing the DNA-Peptide, the large particle
size fractions of Lipofectin disappeared as the Lipofectin (DOPE and DOTMA)
components associated/interacted with the DNA-Peptide molecules to form the
condensed particles (Figure 1a). Taken together, the controlled experiments involving
the condensation (but not aggregation) of DNA-PLL and Lipofectin-Peptide-DNA in
distilled water suggest that the scatterer size is system specific, and, additionally, these
observations indicate that unlike fractal experiments involving mono-size model (latex)
particles, condensed DNA scatterer particles exhibit a size distribution, which is
expected to impact the aggregation process, although it is not at yet possible to quantify
the effect.
The rapid aggregation of condensed DNA (scatterer) particles in most buffers
necessitated the use of a special experimental procedure in order to capture the dynamic
size distribution of the particles during aggregation. To achieve this, measurements
were carried out in-situ, by filling the sample cell of the instrument with the DNA
solution first, followed by adding a predetermined amount of the condensing agent
(poly-L-lysine or Lipofectin) while collecting data throughout the procedure. As
explained previously, our control experiments consisted of carrying out the same
experiments in distilled water (where condensation occurred in the absence of
aggregation) to obtain the scatterer size.
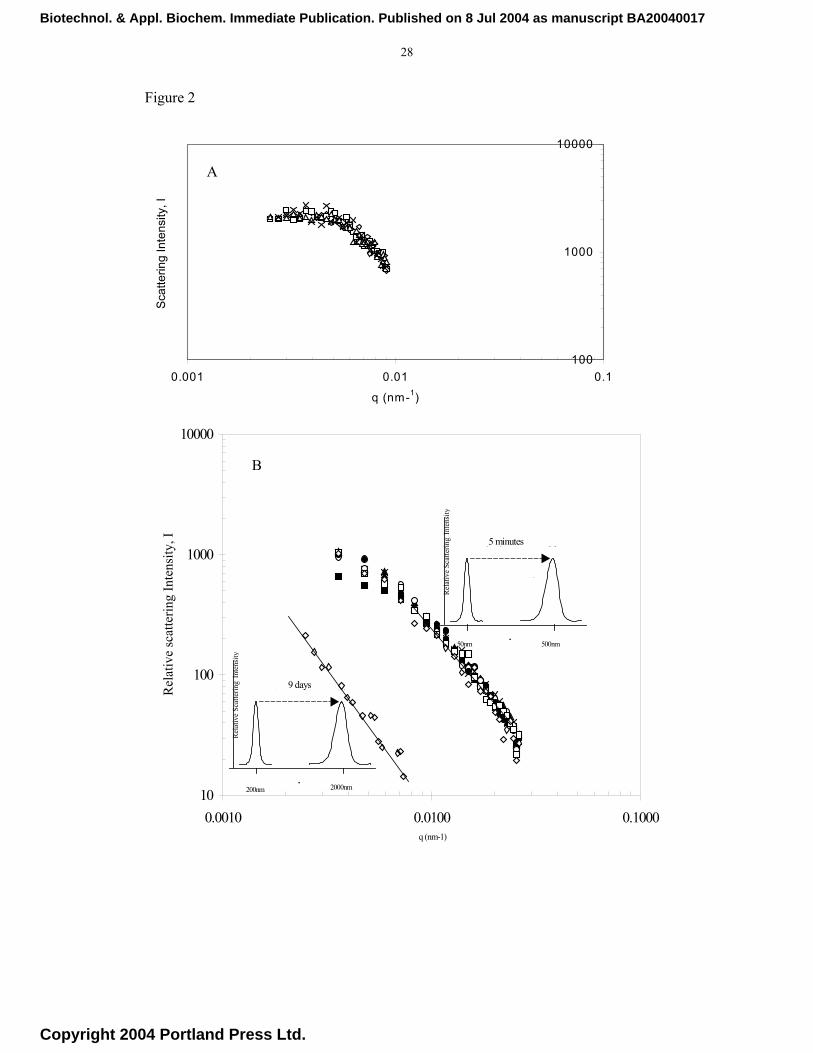
Figures 2a and 2b show the variation of the scattered intensity, I(q), of light with q,
with time as a parameter. The data refer to experiments with the LPD, PLL-DNA and
latex particles. The scattering vector, q, was calculated from Equation 2 with n = 1.33
Biotechnol. & Appl. Biochem. Immediate Publication. Published on 8 Jul 2004 as manuscript BA20040017
Copyright 2004 Portland Press Ltd.

13
(for water) and λ = 532 nm. For clarity of presentation only some of the data points are
shown. The conditions of the experiments always satisfied the basic requirements of the
Rayleigh-Debye model but for accuracy the calculations were confined to data in the
range 12° < θ < 68° corresponding to 0.2 < qa < 1.0 for PLL-DNA and 10O ≤ θ ≤ 30O for
LPD and latex, where the radius, a, of the scatterer within the aggregates was taken to
be 50 nm (PLL-DNA) and 150 nm (LPD). In the case of PLL_DNA and LPD systems.
the plots indicate show the cut-off point at q=1/l, below which the scattered intensity
I(q) becomes independent of wave number (q). Critically, in the range (q)l ≥1.0 and
(q)a ≤ 1.0, which is the scattering range for a mass fractal [37], a power-law
relationship a single gradient (-Df) adequately describe the measurements.. There is no
evidence of any secondary aggregation, which have been reported to occur in some
systems when primary aggregates collide to form larger entities. Such a phenomenon
has been reported to lead to two or more sub-regions in the intermediate regime, each
with a fractal dimension [44]. Based on the power-law relationship, fDqI(q) −∝ , in the
intermediate regime, we applied linear regression analysis to the data points in Figure 2.
The results gave a fractal dimension, Df, of 1.92 for LPD complexes at a salt
concentration of 100mM and 2.20 for buffers at physiological salt concentrations
between 100 and 150 mM in the case of PLL-DNA. Theoretical considerations based on
statistical physics of diffusion-limited colloidal aggregation (DLCA) and reaction-
limited colloidal aggregation (RLCA) suggest that the PLL-DNA complexes aggregated
in the RLCA regime, for which a theoretical mass fractal dimension, Df, of 2.1 ± 0.1 has
been cited [28] and confirmed by computer simulations [29]. In the absence of any
previous data, we performed experiments with latex particles aggregating under RLCA
conditions (Df = 2.2). These are also shown in Figure 2b. It is interesting to note
however that while the latex particles took nearly 9 days to produce aggregates with
Biotechnol. & Appl. Biochem. Immediate Publication. Published on 8 Jul 2004 as manuscript BA20040017
Copyright 2004 Portland Press Ltd.

14
measurable fractal properties, the aggregation of PLL-DNA particles was completed
within about one hour.
It is notable that the fractal dimension of aggregates of the PLL-DNA particles
remained effectively unchanged despite the fact that the aggregate size distribution
shifted continuously towards larger sizes throughout the period of measurement, as
shown in Figure 3. Taken together, these observations support the view that the addition
of poly-L-lysine rapidly induces condensation of the plasmid DNA by charge
neutralisation [30]. The decrease in the repulsive interaction force due to the electrical
double layers of the complexes, caused by the electrolyte in the medium, resulted in the
aggregation of the self-assembled complexes over a period of about one hour, forming
fairly compact structures, characteristic of aggregation in the RLCA regime. A constant
fractal dimension that was unaffected over time is evidence of little restructuring of the
aggregates. To our surprise, the fractal dimension of the PLL-DNA aggregates also
remained unaffected by minor changes (between 50 mM and 150 mM NaCl) in salt
concentration (data not shown). Similar results were obtained for the LPD particles, but,
crucially, we noted a change in fractal dimension for extreme values of electrolyte
concentration, as shown in Figure 4. For electrolyte concentrations of 750 mM and 1000
mM, the fractal dimension increased to 2.1 and 2.4 respectively, indicating more
compact structures. In contrast, we obtained a fractal value of 1.7 for aggregation
occurring at an electrolyte concentration of 40 mM, indicating the formation of loose
structures, as expected for growth in the DLCA regime, for which a theoretical value of
fractal dimension of 1.8 has been reported [28, 31].
Biotechnol. & Appl. Biochem. Immediate Publication. Published on 8 Jul 2004 as manuscript BA20040017
Copyright 2004 Portland Press Ltd.

15
The data in Figure 5 show the change in the average sizes of the LPD aggregates as a
function of time for different electrolyte concentrations. Examination of the data
indicate that aggregation slows down at both low and high electrolyte concentrations.
Crucially, aggregation rate is at its maximum for an electrolyte concentration of 150
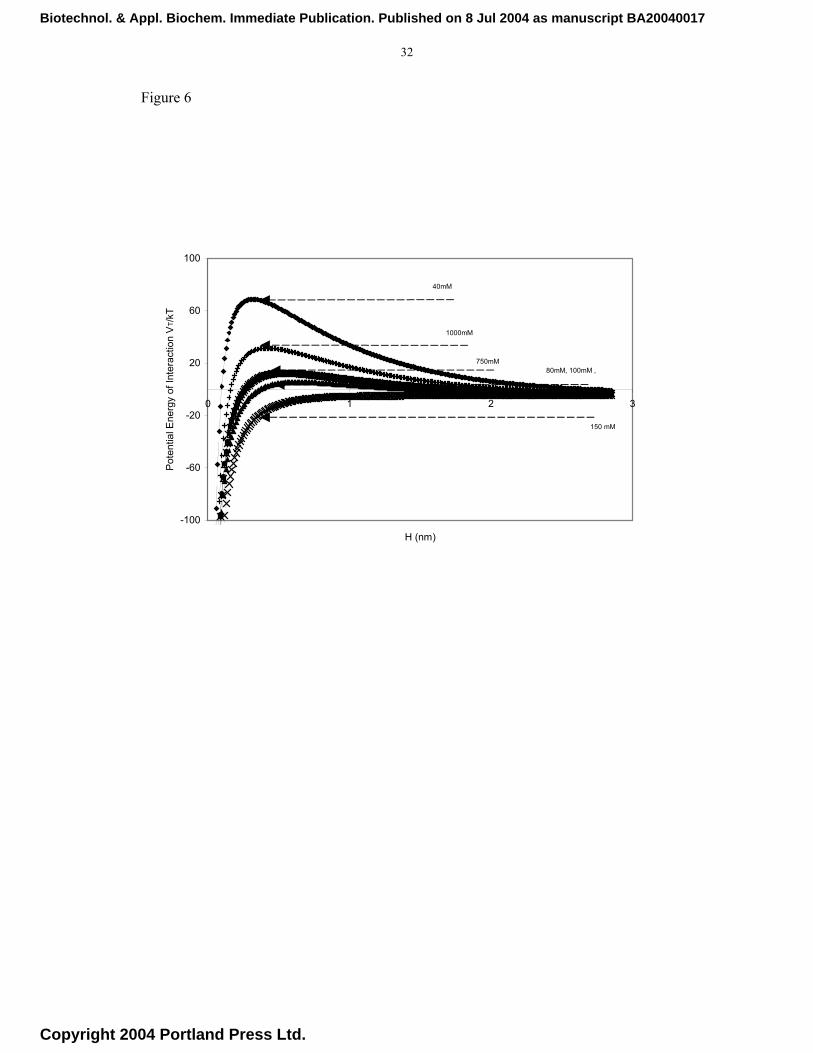
mM corresponding to physiological conditions. The energy plots for the different
systems shown in Figure 6 confirm that at the extremes of electrolyte concentrations,
the energy barrier increases reflecting the changes in the zeta potential of the system
(Figure 7). The increase in the energy barrier reduces the aggregation rate as seen in the
plots in Figure 5 for the extreme electrolyte concentration (40 mM NaCl). These results
may be explained via the concepts of the critical coagulation concentration (ccc) and the
critical stabilisation concentration (csc), both of which have found application in the
analysis of aggregation data for biological and non-biological systems. As the
electrolyte concentration is increased, the electrical double layer surrounding the
particles diminishes reducing the electrostatic repulsive force between the colliding
particles. Theoretically, the electrolyte concentration at which the double layer force
becomes zero corresponds to the critical coagulation constant (ccc). The impact of
electrolyte concentration on the stability of the particles and the ccc for a particular
system may be determined in terms of the stability ratio, W. According to the DLVO
theory, an increase in electrolyte concentration leads to a reduction in the sticking
probability following collision between particles. As result, only a fraction, 1/W, of the
encounters between particles lead to a permanent contact. The stability ratio, W, may be
obtained in a number of ways [32] a useful equation for its estimation is the Reerink and
Overbeek approximation [33], given by:
Biotechnol. & Appl. Biochem. Immediate Publication. Published on 8 Jul 2004 as manuscript BA20040017
Copyright 2004 Portland Press Ltd.

16
W≈
TK
Va B
maxexp21κ
(7)
where κ = [ ]NaCl3.288 nm-1is the Debye-Hückel parameter (e.g. 1.27 × 10⁻⁹ for 150
mM NaCl), a is the radius of a primary particle (i.e. 150 nm for the LPD system), KB is
Boltzmann’s constant (1.38 × 10⁻²³ J/K) and T is the absolute temperature (taken to be
298 K).
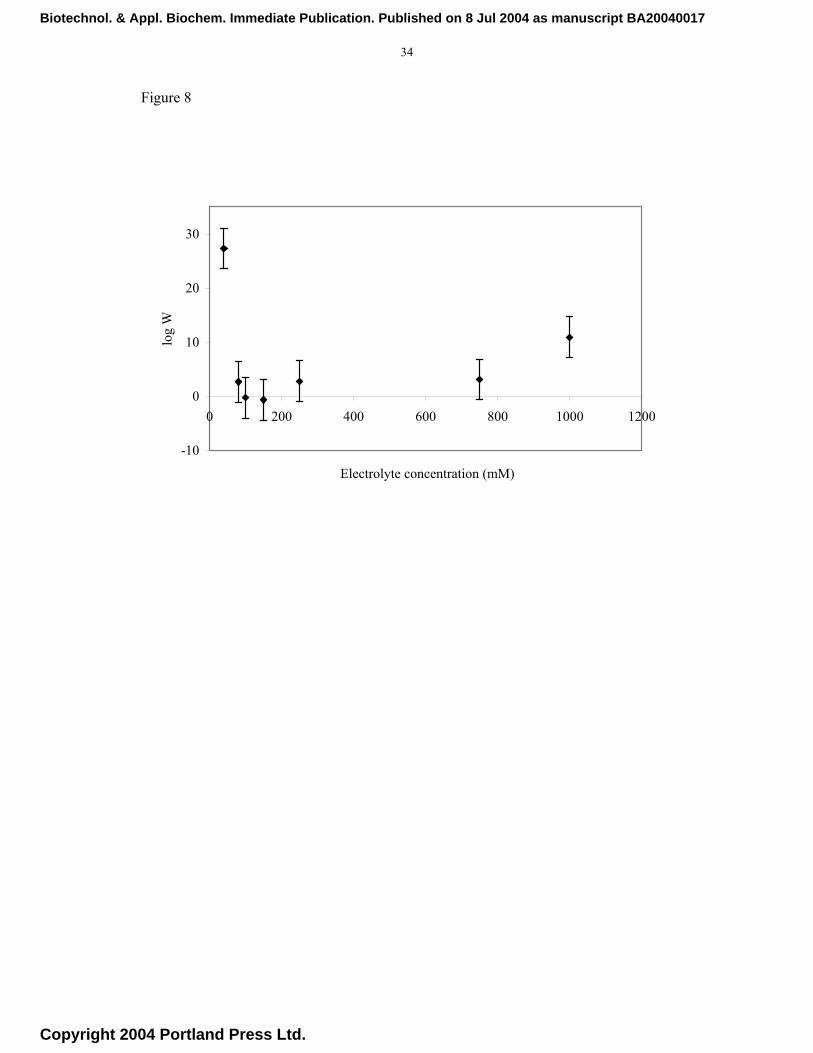
The energy barrier, Vmax, determined when dV/dH = 0, is obtained from Figure 6. Figure
8 shows the stability ratio (W) as a function of electrolyte concentration. As the salt
concentration is increased the colloidal stability decreases, as shown by a decrease in
the value of W until a minimum is reached that corresponds to the ccc. Interestingly,
beyond the ccc value (80-150 mM), the stability ratio increases with further increase in
the electrolyte concentration. This type of behaviour is contrary to what may be
expected from the DLVO theory but has been reported previously for proteins and other
systems. This form of stabilisation has been explained in terms of an additional
(hydration) force in the DLVO theory . It has been shown that under certain conditions
(high salt concentrations) the presence of water close to a hydrophilic surface causes the
formation of hydrated ions, which are adsorbed on the surface. The resulting thin layers
of adsorbed water molecules and ions (hydrated ions) cause repulsion between colliding
particles at close distances. It is hypothesised [19] that hydrophilic moieties on the
surfaces of protein (and peptide) molecules may induce the formation of hydrated ions
in solutions causing the observed anomalous behaviour of the particles in high salt
concentration aqueous buffers [19]. However, our current theoretical understanding of
the impact of key controlling factors on the strength of these hydration forces is limited,
Biotechnol. & Appl. Biochem. Immediate Publication. Published on 8 Jul 2004 as manuscript BA20040017
Copyright 2004 Portland Press Ltd.
17
particularly for practical systems such as the non-viral gene delivery particles of interest
in this study. In the absence of this information it is recommended that the stability
profiles shown in Figure 8 are determined experimentally as described in this study.
Conclusion
We have provided new measurements on the aggregation processes that cause
instability of condensed colloidal plasmid particles in suspension. The particles were
prepared by charge neutralisation of plasmid DNA using two different cationic agents,
poly-L-lysine with a molecular weight of 25,250 and a patented Lipofectin-integrin-
targetting peptide mixture. We have used dynamic light scattering to measure the
kinetics of aggregation and static light scattering to quantify the internal structure of the
aggregats. We have observed the existence of fractal aggregates and measured the
fractal dimension under both slow and rapid aggregation conditions. The fractal
dimension of these aggregates change from about 1.8, indicating a loose and open
morphology, to nearly 2.4 suggesting a tightly packed 3-dimensional structure.
Interestingly, we have observed that the fractal dimension is sensitive to changes in the
ionic strength of the buffer solution and our measurements of fractal dimension of the
aggregates over several weeks to months have found little evidence of restructuring over
the time. These results are consistent with established theories of colloidal stability and
fractal concepts, but we have observed a few anomalies. The dependency of aggregation
of the condensed particles on ionic strength followed the expected trend from theory for
salt (NaCl) concentrations between 40 mM and 250 mM. In this regime, the rate of
aggregation increased with increasing ionic strength. However, as ionic strength was
increased beyond 250 mM the aggregation slowed which was unexpected. Crucially,
Biotechnol. & Appl. Biochem. Immediate Publication. Published on 8 Jul 2004 as manuscript BA20040017
Copyright 2004 Portland Press Ltd.

18
these measurements indicate that aggregation is most rapid for ionic strengths between
80 mM and 200 mM which covers the physiological condition of 150 mM.
Acknowledgements
We would like to thank Mike Kaszuba and Stephen Ward-Smith from Malvern
Instruments (UK) for their expertise in particle sizing, and Aloke Dey-Chowdhury and
Susie Barker (Institute of Child Health) for help in plasmid fermentation.
Biotechnol. & Appl. Biochem. Immediate Publication. Published on 8 Jul 2004 as manuscript BA20040017
Copyright 2004 Portland Press Ltd.

19
References
1. Anderson,W.F. (1998) Nature 392, (Suppl) 25-30.
2. Crystal,R.G. (1995). Science 270, 404-410.
3. Mountain,A. (2000) Trends in Biotechnology 18, 119-128.
4. Lotfian, P., Levy, M.S., Coffin, R., Ward J., Ayazi Shamlou, P. (2003)
Biotechnology Progress 19, 209-215.
5. Lotfian, P., Levy, M.S., Coffin, R., Ward J., Ayazi Shamlou, P. (2003)
6. Lee,L.K., Mount, C.N., Ayazi Shamlou, P. (2001) Chemical Engineering Science
56, 3163-3172.
7. Mount, C.N., Lee, L.K., Yasin, A., Fearn, T., Scott, A., Ayazi Shamlou, P. (2003)
Biotechnology and Applied Biochemistry 37, 225-234
8. Sarkar.S., Zhang, H., Levy, M.S., Hart, S.L., Hailes, H.C., Tabor, A.B., Ayazi
Shamlou, P. (2003) Biotechnology and Applied Biochemistry 38, 95-102.
9. Rolland, A.P. (1998) Critical Reviews and Therapy in Drug Carrier Systems 15,
143-198
10. Zelphati, O., Nguyen, C., Ferrari, M., Felgner, M., Tsai, J., Felgner, P.L.(1998)
Gene Therapy 5, 1272-1282
11. Ferrari, M.E., Nguyen, C.M., Zelphati, O., Tsai, Y., and Felgner, P.L. (1998)
Human Gene Therapy 9, 341-351.
12. Kreiss, P., Cameron, B., Rangara, R., Mailhe, P., Aguerre-Charriol, O., Airiau,
M., Scherman, D., Crouzet, J., and Pitard, B. (1999) Nucleic Acids Research 27,
3792-2798
13. White, R.E., Wade-Martins, R., Hart, S.L., Frampton, J., Huey, B., Desai-Mehta,
A., Cerosaletti, K.M., Concannon, P., James, M.R. (2003) Journal of Gene Medicine
5, 883-892.
Biotechnol. & Appl. Biochem. Immediate Publication. Published on 8 Jul 2004 as manuscript BA20040017
Copyright 2004 Portland Press Ltd.
20
14. Wolfert, M.A. and L.W.Seymour. (1996) Gene Therapy 3, 269-273
15. Amal,R. and Raper, J.A. (1993) Particle & Particle Systems Characterisation
10, 239-245.
16. Ayazi Shamlou, P., Stavrinides, S., and Titchener-Hooker, N.J. (1996)
Bioprocess Engineering 14, 237-243.
17. Bohr,H., Kühle, K., Sørensen, A.H., and Bohr, J. (1997) Zeitschrift Für Physik
D 40, 513-515.
18. Magazu, S., Maisano, G., and Mallamace, F. (1989) Physical Review A 39,
4195-4200.
19. Molina-Bolívar, J.A., Galisteo-González, F., and Hidalgo-Álvarez, F. (1998)
Journal of Colloid and Interface Science 298, 445-454.
20. Ayazi Shamlou, P. (2003) Biotechnology and Applied Biochemistry 37, 207-
218
21. Levy, M.S., Collins, I.J., Tsai, J.T., Ayazi Shamlou,P., Ward, J.M., and Dunnill,
P. (2000) Journal of Biotechnology 76, 197-205.
22. Hart, S,L., Arancibia-Carcamo, C,V., Wolfert, M, A., Mailhos, C., O'Reilly, N,
J., Ali, R,R., Coutelle, C., George, A, J.T., Harbottle, R., Knight, A,M., Larkin,
D. F, P., Levinsky, R, J., Seymour, L, W., Thrasher, A, J., Kinnon, C., (1998)
Human Gene Therapy 9 575-585.
23. Hart, S.L. (1999) Current Opinions in Molecular Therapeutics 1(2) 197-203
24. Pedroso de Lima, M, C., Simoes, S., Pires, Pedro., Faneca, H., Duzgunes, N.
(2001) Advanced Drug Delivery Reviews 47, 277-294.
25. Lee, L.K., Siapati, E., Jenkins, R.G., McAnulty, R.J., Hart, S.L., Ayazi
Shamlou, P. (2003) Medical Science Monitor 9 (1) 54-61.
Biotechnol. & Appl. Biochem. Immediate Publication. Published on 8 Jul 2004 as manuscript BA20040017
Copyright 2004 Portland Press Ltd.
21
26. Schmidt, P.W. (1989) The Fractal Approach to Heterogeneous Chemistry:
Surfaces, Colloids, Polymers. Avnir, D. editor. John Wiley & Sons Ltd., New
York. 67-79.
27. Sorensen,C.M. (2001) Aerosol Science and Technology 35 648-687.
28. Lin,M.Y., Lindsay, H.M., Weitz, D.A., Ball, R.C., Klein, R., and Meakin, P.
(1989) Proceedings of the Royal Society of London A 423 71-87.
29. Ball, R.C., Weitz, D.A., Witten, T.A., Leyvraz, F. (1987) Physical Review
Letters 58 274-277
30. Bloomfield,V.A. (1996) Current Opinion in Structural Biology 6 334-341
31. Meakin,P. (1988) Advances in Colloid and Interface Science 28 249-331
32. Shaw, D.J., (1992) Colloid and Surface Chemistry. Butterworth-Heinemann,
Oxford.210-233.
33. Reerink, H, Overbeek, J. Th. G. (1954) Discuss. Faraday. Soc., 18, 74-84.
34. Großkinsky, S., Timme, M., Naundorf, B. (2002) Physical Review Letters, 88,
245501-1- 245501-4.
35. Yates, P., Yan Yao-de., Jameson, G.J., Biggs, S.(2001) 6th World Congress of
Chemical Engineering.
36. Tirado-Mirando, M., Schmitt, A., Callejas-Fernández, J., Fernández-Barbero,
A. (2000) Colloids and Surfaces, A: Physiochemical and Engineering Aspects
162, 67-73.
37. Tang, S., Preece, J.M., McFarlane, C.M., Zhang, Z. (1999) Colloids and
Surface A: Physiochemical and Engineering Aspects 157, 185-192.
38. Hart, S. L., Arancibia-Cárcamo C. V., Wolfert M. A., Mailhos, C., O'Reilly, N.
J., Ali R, R., Coutelle, C, George, A. J. T., Harbottle R.P., Knight A. M., Larkin
Biotechnol. & Appl. Biochem. Immediate Publication. Published on 8 Jul 2004 as manuscript BA20040017
Copyright 2004 Portland Press Ltd.

22
D. F. P., Levinsky R. J., Seymour L. W., Thrasher, A. J., Kinnon, C. (1998)
Human Gene Therapy. 9, 575-585
39. Lai, E., van Zanten, J.H., (2001) Biophysical Journal, 80, 864-873.
40. Lyubchenko, Y.L., Shlyakhtenko, L.S. (1997), Proc. Natl. Acad. Sci. USA, 94,
496-501
41. Hansma, H.G., Golan, R., Hsieh, W., Lollo, C.P., Mullen-Ley, P., Kwoh, D.
(1998) Nucleic Acids Research, 26, 2481-2487s.
42. Rybenkov, V.V., Vologodskii, A.V., Cozzarelli, N.R. (1997) Journal of
Molecular Biology, 267, 299-311.
43. Bloomfield, V.A., Crothers, D.M., Tinoco, Jr, I., (editors) Shape of Nucleic
Acid in Solution Structures (2000), 386-388, University Science Books,
Sausalito, CA.
44. Thill, A., Moustier, S., Aziz, J., Wiesner, M.R., Bottero, J.Y. (2001) Journal of
Colloid and Interface Science, 243, 171-182.
Biotechnol. & Appl. Biochem. Immediate Publication. Published on 8 Jul 2004 as manuscript BA20040017
Copyright 2004 Portland Press Ltd.

23
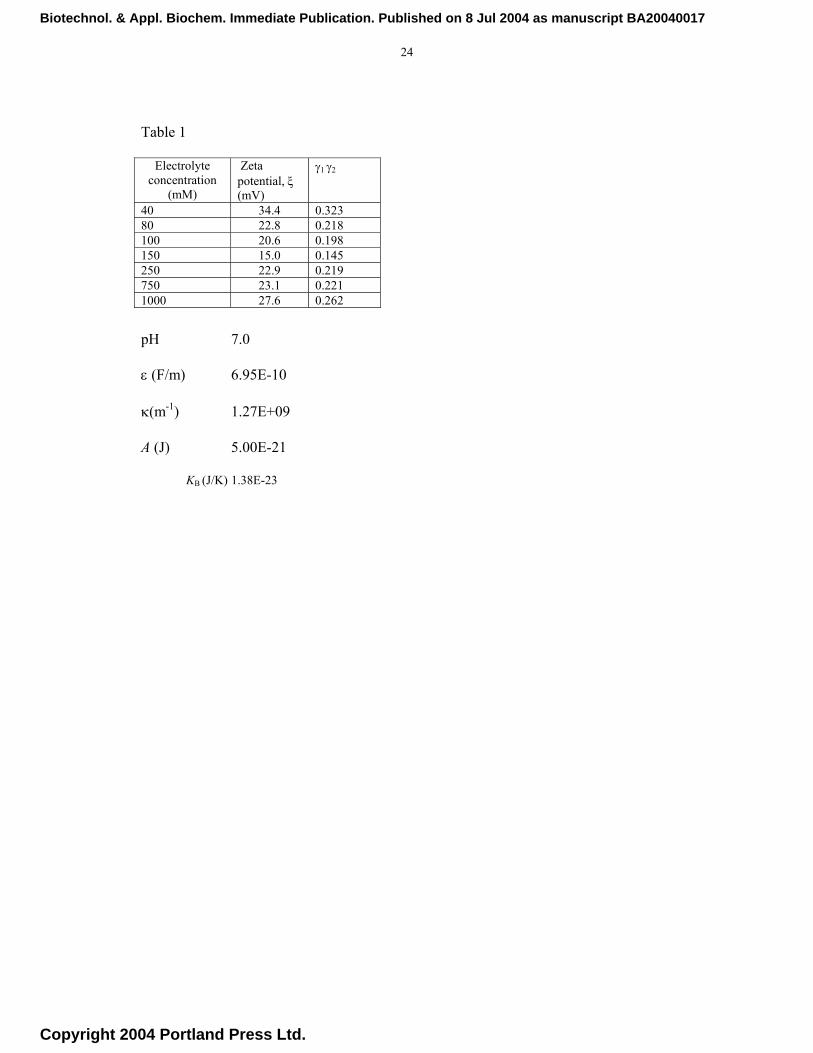
Table 1 The total energy of interaction, VT, between the particles was obtained by summing the van der Waals attractive potential, VA, and the repulsive double layer electrostatic potential, VR. [10,27]
+++
+++
++++
++−=
yxxyxxxyx
yxxyxy
xxyxyAVA 2
2
22 ln212
, where x = (H/a1+a2) and y
=a1/a2, A is the Hamaker constant, assumed to have a value of 5 × 10-21 J. H is the separation distance between the surfaces of two spherical particles of radii a1 and a2. The electrical double-layer repulsion force calculated from the following expression [10]:
( )[ ]H
zeaaTKaaV B
R κγγπε
−+
= exp6422
21
2122
21 , where ε is the permittivity of the medium, KB the
Boltzmann constant, T the absolute temperature (stated elsewhere), κ the Debye-Hückel reciprocal length has a value of 2.4×10⁹ m-1 and e is the elementary charge (stated elsewhere).The dimensionless
functions,γ1 and γ2, of the zeta potentials ζ1 and ζ2, respectively, are given by [ ][ ] 12/exp
12/exp+−
=kTzekTze
i ζζγ
Biotechnol. & Appl. Biochem. Immediate Publication. Published on 8 Jul 2004 as manuscript BA20040017
Copyright 2004 Portland Press Ltd.
24
Table 1
pH 7.0
ε (F/m) 6.95E-10
κ(m-1) 1.27E+09
A (J) 5.00E-21
KB (J/K) 1.38E-23
Electrolyte concentration
(mM)
Zeta potential, ξ (mV)
γ1 γ2
40 34.4 0.323 80 22.8 0.218 100 20.6 0.198 150 15.0 0.145 250 22.9 0.219 750 23.1 0.221 1000 27.6 0.262
Biotechnol. & Appl. Biochem. Immediate Publication. Published on 8 Jul 2004 as manuscript BA20040017
Copyright 2004 Portland Press Ltd.

25
Fig. 1a Particle size distributions of LPD complexes at a charge ratio of 7.0 in distilled
water, pH 7.4, as a function of time after preparation 240 sec (♦), 1800 sec (),
3600sec (), 10800 sec (∗). Measurements were taking using dynamic light
scattering measurements at 90o. Data shown is taken from an average of three
differing samples. Figure 1b shows a bimodial distribution of lipofectin in its
storage buffer (filtered water) at 150 sec after preparation.
Fig. 2a Fractal dimension of LPD particles at pH 7.2 in 100mM NaCl. LPD system for
various time points of 14 min (◊), 22 min(), 28 min () and 35 min(x). Fig.
2b Influence of salt concentration on the fractal dimension of latex particles at
pH 3.0, 250 mM NaCl (◊) and poly-L-lysine/plasmid DNA (PLL/DNA) at pH
7.0, for various time points of 5-150 min(closed symbols). Both systems present
exhibit aggregation in the RLCA regime. Insets show the time taken for the
measured aggregate to form in each instance.
Fig. 3. Particle size distributions of PLL/DNA complexes at a charge ratio of 2.0 in 20
mM HEPES, pH 7.2, 150mM NaCl, as a function of time after preparation. Size
distributions were determined as mean of diameter based on the intensity of
scattered light at 90o. The data shown was obtained from a single representative
sample.
Fig .4. The fractal dimension (Df ) of Lipofectin/integrin-targeting peptide/DNA (LPD)
aggregates as a function of electrolyte concentration (mM). Data is given for the
final Df of the system.
Fig. 5. Size distribution of LPD complexes as a function of time for varying electrolyte
concentrations at pH 7.0: 20 mM (), 40 mM (), 80 mM (), 100 mM (×), 150
mM (*), 250 mM (), 750 mM (+), and 1 M (-). All measurements were taken
using DLS.
Fig. 6. Influence of buffer conditions on the dimensionless total energy of interaction
between two spherical particles of a monomer hydrodynamic radius of 150 nm,
Biotechnol. & Appl. Biochem. Immediate Publication. Published on 8 Jul 2004 as manuscript BA20040017
Copyright 2004 Portland Press Ltd.
26
as a function of the distance H (nm) between their surfaces; data generated using
the DVLO theory of colloidal interactions.
Fig. 7. Dependence of electrolyte concentration on the LPD system zeta potential. All
systems were at pH 7.0. The zeta potential is calculated from the electrophoretic
mobility of the particles in the buffer.
Fig. 8. Experimental dependence of stability ratio (W) on electrolyte concentration.
Stability values were determined from the Reerink and Overbeek approximation.
Biotechnol. & Appl. Biochem. Immediate Publication. Published on 8 Jul 2004 as manuscript BA20040017
Copyright 2004 Portland Press Ltd.

27
Figure 1
0
5
10
15
20
1 10 100 1000 10000
size (nm)
% p
opul
atio
n
0
10
20
30
40
50
0 500 1000 1500 2000 2500 3000 3500
size (nm)
% p
opul
atio
n
A
B
Biotechnol. & Appl. Biochem. Immediate Publication. Published on 8 Jul 2004 as manuscript BA20040017
Copyright 2004 Portland Press Ltd.
28
Figure 2
100
1000
10000
0.001 0.01 0.1
q (nm-1)
Sca
tterin
g In
tens
ity, I
10
100
1000
10000
0.0010 0.0100 0.1000 q (nm-1)
Rel
ativ
e sc
atte
ring
Inte
nsity
, I
si
1MN Cl
250 MN Cl
si
1MN Cl
250 MN Cl
500nm50nm
5 minutes
Rel
ativ
e Sc
atte
ring In
tens
ity
9 days
Rel
ativ
e Sc
atte
ring In
tens
ity
200nm 2000nm
A
B
Biotechnol. & Appl. Biochem. Immediate Publication. Published on 8 Jul 2004 as manuscript BA20040017
Copyright 2004 Portland Press Ltd.

29
Figure 3
0
5
10
10 100 1000 10000 100000
Log mean diameter (nm)
Inte
nsity
%
3 min9 min18 min34 min64 min98 min
Biotechnol. & Appl. Biochem. Immediate Publication. Published on 8 Jul 2004 as manuscript BA20040017
Copyright 2004 Portland Press Ltd.

30
Figure 4
1.00
1.50
2.00
2.50
3.00
0 200 400 600 800 1000 1200
Electrolyte concentration (mM)
dF
Biotechnol. & Appl. Biochem. Immediate Publication. Published on 8 Jul 2004 as manuscript BA20040017
Copyright 2004 Portland Press Ltd.

31
Figure 5
0
1000
2000
0 250 500 750 1000
Time (sec)
Siz
e (n
m)
Biotechnol. & Appl. Biochem. Immediate Publication. Published on 8 Jul 2004 as manuscript BA20040017
Copyright 2004 Portland Press Ltd.
32
Figure 6
-100
-60
-20
20
60
100
0 1 2 3
H (nm)
Pot
entia
l Ene
rgy
of In
tera
ctio
n V
T /kT
40mM
80mM, 100mM ,
150mM
750mM
1000mM
150 mM
Biotechnol. & Appl. Biochem. Immediate Publication. Published on 8 Jul 2004 as manuscript BA20040017
Copyright 2004 Portland Press Ltd.

33
Figure 7
-40
-30
-20
-10
00 200 400 600 800 1000 1200
Electrolyte concentration (mM)
Zeta
pot
entia
l (m
V)
Biotechnol. & Appl. Biochem. Immediate Publication. Published on 8 Jul 2004 as manuscript BA20040017
Copyright 2004 Portland Press Ltd.
34
Figure 8
-10
0
10
20
30
0 200 400 600 800 1000 1200
Electrolyte concentration (mM)
log
W
Biotechnol. & Appl. Biochem. Immediate Publication. Published on 8 Jul 2004 as manuscript BA20040017
Copyright 2004 Portland Press Ltd.

35
Notation
a1, a2 radii of primary particles 1 and 2, m A Hamaker constant, J c ionic concentration, M DH particle hydrodynamic diameter, m e charge on electron (1.6 × 10⁻¹⁹ C) H separation distance between two primary particles, m K Boltzmann constant (1.381×10⁻²³ J/K) T absolute temperature, K VA, VR,VT interaction energies (van der Waals’ attraction, electrical repulsion and
total interaction), J x dimensionless (=(H/a1+a2)) y dimensionless (=a1/a2) z valence (charge number) of ionic species Df fractal deimension q wave vector W stability ratio Greek Letters
γ1 γ2 dimensionless functions of zeta potential ζ1,ζ2 zeta potentials of particles 1 and 2 ε permittivity, dimensionless κ Debye-Hückel parameter µ dynamic viscosity of liquid, kg/ms λ incident wavelength of light in a vacuum θ scattering angle
Biotechnol. & Appl. Biochem. Immediate Publication. Published on 8 Jul 2004 as manuscript BA20040017
Copyright 2004 Portland Press Ltd.