
Incorporating soil texture in soil moisture estimation from extended low-1 beam mode RADARSAT-1 SAR...
14
This article was downloaded by: [Indian Institute of Remote Sensing, ISRO] On: 12 November 2014, At: 03:45 Publisher: Taylor & Francis Informa Ltd Registered in England and Wales Registered Number: 1072954 Registered office: Mortimer House, 37-41 Mortimer Street, London W1T 3JH, UK International Journal of Remote Sensing Publication details, including instructions for authors and subscription information: http://www.tandfonline.com/loi/tres20 Incorporating soil texture in soil moisture estimation from extended low‐1 beam mode RADARSAT‐1 SAR data Hari Shanker Srivastava a , Parul Patel b & Ranganath R. Navalgund b a Regional Remote Sensing Service Centre (RRSSC) , Indian Space Research Organization (ISRO) , IIRS Campus , 4Kalidas Road, Dehradun – 248 001 (Uttaranchal), India b Space Applications Centre (ISRO) , Ahmedabad – 380 015, India Published online: 22 Feb 2007. To cite this article: Hari Shanker Srivastava , Parul Patel & Ranganath R. Navalgund (2006) Incorporating soil texture in soil moisture estimation from extended low‐1 beam mode RADARSAT‐1 SAR data, International Journal of Remote Sensing, 27:12, 2587-2598, DOI: 10.1080/01431160500497838 To link to this article: http://dx.doi.org/10.1080/01431160500497838 PLEASE SCROLL DOWN FOR ARTICLE Taylor & Francis makes every effort to ensure the accuracy of all the information (the “Content”) contained in the publications on our platform. However, Taylor & Francis, our agents, and our licensors make no representations or warranties whatsoever as to the accuracy, completeness, or suitability for any purpose of the Content. Any opinions and views expressed in this publication are the opinions and views of the authors, and are not the views of or endorsed by Taylor & Francis. The accuracy of the Content should not be relied upon and should be independently verified with primary sources of information. Taylor and Francis shall not be liable for any losses, actions, claims, proceedings, demands, costs, expenses, damages, and other liabilities whatsoever or howsoever caused arising directly or indirectly in connection with, in relation to or arising out of the use of the Content. This article may be used for research, teaching, and private study purposes. Any substantial or systematic reproduction, redistribution, reselling, loan, sub-licensing, NOT FOR COMMERCIAL USE ONLY FOR PERSONAL READING & REFERENCE PURPOSE
Transcript of Incorporating soil texture in soil moisture estimation from extended low-1 beam mode RADARSAT-1 SAR...

This article was downloaded by: [Indian Institute of Remote Sensing, ISRO]On: 12 November 2014, At: 03:45Publisher: Taylor & FrancisInforma Ltd Registered in England and Wales Registered Number: 1072954 Registeredoffice: Mortimer House, 37-41 Mortimer Street, London W1T 3JH, UK
International Journal of RemoteSensingPublication details, including instructions for authors andsubscription information:http://www.tandfonline.com/loi/tres20
Incorporating soil texture in soilmoisture estimation from extendedlow‐1 beam mode RADARSAT‐1 SARdataHari Shanker Srivastava a , Parul Patel b & Ranganath R. Navalgundb
a Regional Remote Sensing Service Centre (RRSSC) , Indian SpaceResearch Organization (ISRO) , IIRS Campus , 4Kalidas Road,Dehradun – 248 001 (Uttaranchal), Indiab Space Applications Centre (ISRO) , Ahmedabad – 380 015, IndiaPublished online: 22 Feb 2007.
To cite this article: Hari Shanker Srivastava , Parul Patel & Ranganath R. Navalgund (2006)Incorporating soil texture in soil moisture estimation from extended low‐1 beam modeRADARSAT‐1 SAR data, International Journal of Remote Sensing, 27:12, 2587-2598, DOI:10.1080/01431160500497838
To link to this article: http://dx.doi.org/10.1080/01431160500497838
PLEASE SCROLL DOWN FOR ARTICLE
Taylor & Francis makes every effort to ensure the accuracy of all the information (the“Content”) contained in the publications on our platform. However, Taylor & Francis,our agents, and our licensors make no representations or warranties whatsoever as tothe accuracy, completeness, or suitability for any purpose of the Content. Any opinionsand views expressed in this publication are the opinions and views of the authors,and are not the views of or endorsed by Taylor & Francis. The accuracy of the Contentshould not be relied upon and should be independently verified with primary sourcesof information. Taylor and Francis shall not be liable for any losses, actions, claims,proceedings, demands, costs, expenses, damages, and other liabilities whatsoever orhowsoever caused arising directly or indirectly in connection with, in relation to or arisingout of the use of the Content.
This article may be used for research, teaching, and private study purposes. Anysubstantial or systematic reproduction, redistribution, reselling, loan, sub-licensing,
NOT FOR COMMERCIAL U
SE ONLY
FOR
PERSONAL READIN
G & REFERENCE PURPOSE

systematic supply, or distribution in any form to anyone is expressly forbidden. Terms &Conditions of access and use can be found at http://www.tandfonline.com/page/terms-and-conditions
Dow
nloa
ded
by [
Indi
an I
nstit
ute
of R
emot
e Se
nsin
g, I
SRO
] at
03:
45 1
2 N
ovem
ber
2014
NOT FOR COMMERCIAL U
SE ONLY
FOR
PERSONAL READIN
G & REFERENCE PURPOSE
Incorporating soil texture in soil moisture estimation from extendedlow-1 beam mode RADARSAT-1 SAR data
HARI SHANKER SRIVASTAVA*{, PARUL PATEL{ and
RANGANATH R. NAVALGUND{{Regional Remote Sensing Service Centre (RRSSC),
Indian Space Research Organization (ISRO),
IIRS Campus, 4Kalidas Road, Dehradun – 248 001 (Uttaranchal), India
{Space Applications Centre (ISRO), Ahmedabad – 380 015, India
(Received 3 January 2005; in final form 23 November 2005 )
Sensitivity of microwaves towards soil moisture is well understood; still,
development of a practical algorithm for soil moisture estimation using
microwaves is difficult. This is due to the fact that along with their strong
sensitivity to soil moisture, microwave signals are also sensitive to other target
properties such as soil texture, surface roughness, and crop cover. In this paper,
an attempt has been made to incorporate the effect of soil texture in large area
soil moisture mapping using extended low-1 beam mode RADARSAT-1 SAR
data in such a way that knowledge of soil texture is not a prerequisite.
1. Introduction
The key factor behind soil moisture estimation using microwaves is the large
difference between the dielectric constant of water (,80) and of dry soil (3 to 4) at
microwave frequencies. The radar backscattering coefficient (su) is strongly related
to soil moisture due to the high dielectric constant of a mixture of soil and water
(Wang 1980). Though the radar backscattering coefficient is strongly related to soil
moisture, at the same time it is also sensitive to other target properties such as
surface roughness, crop cover, and soil texture (Henderson and Lewis 1998, Ulaby
et al. 1978, 1979, Dobson and Ulaby 1981). Hence, it is necessary to incorporate the
effects of these parameters in the soil moisture retrieval model. There have been
studies to understand the effects of surface roughness and crop cover in the soil
moisture retrieval model (Wooding 1995, Borgeaud et al. 1995, Patel et al. 2002). Oh
et al. (1992) have developed an empirical model using a ratio of co-polarized and
cross-polarized SAR backscatter. The model attempts to invert the soil moisture and
surface roughness in terms of ks, with the validity region over ks,3. Dubois et al.
(1995) have also developed an empirical algorithm for bare soils to retrieve soil
moisture and surface roughness using suHH and suVV SAR, which functions over
areas with low Normalized Difference Vegetation Index (NDVI) values. Attempts
have also been made by a few researchers to incorporate the effect of soil texture in
the soil moisture retrieval model (Ulaby et al. 1986a). Blumberg et al. (2000) have
also observed the influence of soil texture while assessing soil water content using a
P band airborne scatterometer. They noted that amongst sandy and clay soil, a
*Corresponding author. Email: [email protected]
International Journal of Remote Sensing
Vol. 27, No. 12, 20 June 2006, 2587–2598
International Journal of Remote SensingISSN 0143-1161 print/ISSN 1366-5901 online # 2006 Taylor & Francis
http://www.tandf.co.uk/journalsDOI: 10.1080/01431160500497838
Dow
nloa
ded
by [
Indi
an I
nstit
ute
of R
emot
e Se
nsin
g, I
SRO
] at
03:
45 1
2 N
ovem
ber
2014
NOT FOR COMMERCIAL U
SE ONLY
FOR
PERSONAL READIN
G & REFERENCE PURPOSE
higher correlation was detected for sandy soils. In the case of clay, it is the higher
content of clay that makes the water molecules to be tightly bound with soil
particles, which in turn restricts water molecules to align with the incident radar
signal.
The work presented in this manuscript is part of a study whereby attempts are
being made to incorporate the effect of surface roughness, crop cover, and soil
texture on SAR sensitivity to soil moisture to reach an operational methodology of
soil moisture estimation in such a way that one need not make any assumptions
about the distribution of these parameters and one should be able to extract
information on these parameters from the space platform alone. Thus ensuring that
knowledge of surface roughness, crop cover, and soil texture is not a prerequisite for
large area soil moisture estimation using SAR. In the future, it is proposed to merge
all three approaches to obtain an operational methodology that would be able to
cater for soil moisture estimation under all kinds of agricultural heterogeneity from
the space platform. Firstly, an attempt was made to incorporate the effect of surface
roughness in the soil moisture retrieval model using multi-incidence angle
RADARSAT-1 SAR. For this purpose, the angular behaviour of SAR backscatter
to surface roughness and soil moisture was exploited to include the effect of surface
roughness in the soil moisture retrieval model. Data from agricultural fallow fields
falling in the same soil texture class with varying surface roughness conditions were
used for this study to ensure that it is only the surface roughness other than soil
moisture that affects the SAR backscatter, thus eliminating the effect due to crop
cover and soil texture (Srivastava et al. 2003). Similarly, the sensitivity of lower and
higher incidence angle SAR to crop cover and soil moisture was exploited to arrive
at an empirical model to incorporate the effect due to crop cover in soil moisture
estimation, while controlling other parameters such as soil texture and surface
roughness (Srivastava et al. 2002).
Correspondingly, only bare, smooth fields are considered in the present study in
order to control the effect of crop cover and surface roughness on SAR backscatter
so that it is only the soil texture other than soil moisture that affects the SAR
backscatter. In the present paper, a soil moisture measure has been proposed that
incorporates the effect of soil texture on SAR response to the moisture content of
the soil in such a way that knowledge of soil texture is not a prerequisite. At the
same time, the proposed soil moisture measure, which is defined as the water that is
available to plant per unit volume of soil, is more realistic as it appeals directly to the
agricultural scientist.
2. Conceptualization
Wet soil is a heterogeneous mixture of soil, water, and air pockets. In general, the
water in wet soil can be further divided into bound water and free water. The bound
water refers to water molecules located in the first few molecular layers surrounding
the soil particles that are held tightly by the soil particles due to the effect of metric
and osmotic forces. These forces significantly reduce the free energy of the absorbed
water molecules and therefore these water molecules are termed as bound water. In
contrast to this, water molecules that are located several molecular layers away from
soil particles are able to move within the soil medium with relative ease and are
therefore termed as free water. The percentage of free water and bound water
present in a soil medium largely determines the dielectric constant of a soil medium
(Ulaby et al. 1986b).
2588 H. S. Srivastava et al.
Dow
nloa
ded
by [
Indi
an I
nstit
ute
of R
emot
e Se
nsin
g, I
SRO
] at
03:
45 1
2 N
ovem
ber
2014
NOT FOR COMMERCIAL U
SE ONLY
FOR
PERSONAL READIN
G & REFERENCE PURPOSE
The percentage of free water and bound water in a soil medium largely depends
upon the surface area of soil particles present. As the surface area of soil particles in
a soil medium depends upon the particle size and the relative proportions of the
various-sized particles in a given soil, the dielectric constant of wet soil varies with
soil texture. The change in dielectric constant in turn results in a change in
backscattering coefficient. Thus, it is required to incorporate the effect of soil
texture, which governs the surface area of soil particles and in turn the proportion of
free water and bound water in a given soil–water mixture, while developing models
to retrieve soil moisture information with the help of radar remote sensing. This calls
for defining a parameter that represents the critical component of soil moisture,
which is related to the physical interaction process between microwave signal and
the soil–water mixture.
In this paper, an attempt has been made to incorporate the effect of soil texture in
the soil moisture retrieval model by representing the soil moisture in a more realistic
term that would relate to the possible amount of free water in a given soil water
mixture. For this purpose, it was thought to represent the soil moisture in terms of
water that is available to plants in the soil medium. It is well known that plants
cannot extract the water below wilting point, i.e. the moisture at 15-bar pressure.
Due to this reason, out of the total observed soil moisture, the plant is not able to
extract the water that is below wilting point. Hence, the water that is actually
available to the plant is the difference between the observed soil moisture and the
wilting point. It is reasonable to assume that the amount of soil moisture at wilting
point is directly proportional to the amount of bound water as water molecules at
15-bar pressure are also very tightly held with soil particles. Therefore, the amount
of free water can be related easily to the difference between the observed soil
moisture and the wilting point for that soil. Thus, we can assume that the amount of
water in the soil that is free to interact with the incident microwaves and give
significant contribution to the SAR backscatter is close to the amount of water
available to plants per unit volume of soil, as given by equation (1):
SM WAP~ SMOBS�SM15-barð Þ|bulk density ð1Þ
where:
SM_WAP 5soil moisture in terms of water that is available to plant per unit
volume
SMOBS 5observed soil moisture from field
SM15-bar 5soil moisture at wilting point
(SMOBS2SM15-bar)5water that is available to the plant at the time of observation.
Thus, SM_WAP is not merely the volumetric soil moisture content but it is the
volumetric soil moisture content above wilting point. The minimum wilting point
for the soils residing in the study area happens to be 8% for sandy loam soil, whereas
the maximum is 15% for fine loamy soils. Let us consider the case of two fields, one
with sandy loam soil and the other having fine loamy soil, and both fields having the
same volumetric soil moisture of say, 20%. Thus, volumetric soil moisture of 20%
for the field with sandy loam soil would result in 12% (520%–8%) of water being
available to the plant (SM_WAP) and since bound water would also be relatively
less for sandy loam soil, there would be more free water particles to interact with the
incoming microwave signal, giving a higher dipole moment. This would, in turn,
result in higher backscatter from that field, whereas the field with fine loamy soil,
Effect of soil texture in soil moisture estimation 2589
Dow
nloa
ded
by [
Indi
an I
nstit
ute
of R
emot
e Se
nsin
g, I
SRO
] at
03:
45 1
2 N
ovem
ber
2014
NOT FOR COMMERCIAL U
SE ONLY
FOR
PERSONAL READIN
G & REFERENCE PURPOSE
which also has 20% volumetric soil moisture, would have a 5% (520%–15%)
SM_WAP. Since the bound water in this case would be relatively more, there would
be a higher number of water molecules tightly held with the soil particles, meaning
reduced free water particles to interact with the incoming SAR signal. Thus, there
would be a lesser dipole moment, which would in turn result in low backscatter from
that field. Therefore, variation in soil texture leads to a situation where two fields
having similar volumetric soil moisture would end up having higher or lower
available water to plants, which is effectively a higher or lower amount of free water
in the soil, resulting in higher or lower SAR backscatter. Hence, it is proposed to use
the soil moisture measure, SM_WAP, given by equation (1) as a representative of
the actual amount of soil moisture that interacts with the SAR signal.
3. Data set and study area
In order to validate the above concept, four scenes of RADARSAT-1 SAR at lower
incidence angle (beam mode: extended low-1 (EL1), incidence angle: 10u–23u) were
acquired on 13 March 1999, 10 December 1999, 27 January 2000 and 15 March 2000
over parts of the Agra, Mathura, and Bharatpur districts of India. Nominal
resolution of RADARSAT-1 EL1 beam mode is 35 m. Large coverage of
RADARSAT-1 (EL1) image (170km6170 km) provided data over a variety of soil
textures from very fine to very coarse. The study area broadly covers fine loamy, fine
silty, coarse loamy, sandy loam, and sandy soils. Geographic coordinates of
the study area are 77u29941.8299 to 78u48901.2499 east and 26u29905.9299 to
27u54901.0499 north. The study area is a flat terrain dominated by agricultural land.
The RADARSAT-1 operates at C-band SAR with HH polarization. It operates
under a variety of viewing modes with varying spatial and radiometric resolutions
(RSI 2000). In addition to SAR data, GPS and 1 : 50,000 scale Survey of India (SOI)
topographic maps have also been used to locate the ground truth sites onto the
image.
4. Methods
4.1 Reconnaissance survey and ground truth data collection
Sampling locations were selected carefully after reconnaissance field surveys near
the ground control points. Enough care was taken regarding homogeneity of
sampling locations in terms of soil moisture, size, and surface roughness. A sampling
unit size of 100 m6100 m was selected (Patel and Mohan 1993). In order to ensure
that it is only soil texture that influences the microwave backscatter other than soil
moisture, only smooth bare fields were chosen as sampling locations. Thus, major
factors such as crop cover and surface roughness affecting the sensitivity of SAR
backscatter to soil moisture were eliminated. During data acquisition in December
1999, wheat had just been sown. Hence, all these fields were treated as fallow fields
as the crop had not emerged on the surface. During March 1999 and March 2000,
the fallow fields consisted of harvested mustard fields, whereas in January 2000,
only agricultural fallow fields have been included in the analysis. A total of 57 fields
were included in the analysis, out of which 13 samples were taken for the 13 March
1999 pass, 30 samples for the 10 December 1999 pass, 4 samples for the 27 January
2000 pass, and 10 samples for the 15 March 2000 pass. Out of these 57 observations,
7 were randomly selected for validation of the models and the remaining 50 were
used to develop the model.
2590 H. S. Srivastava et al.
Dow
nloa
ded
by [
Indi
an I
nstit
ute
of R
emot
e Se
nsin
g, I
SRO
] at
03:
45 1
2 N
ovem
ber
2014
NOT FOR COMMERCIAL U
SE ONLY
FOR
PERSONAL READIN
G & REFERENCE PURPOSE
A ground truth data collection campaign was carried out in synchronization to the
RADARSAT-1 passes. The information gathered during ground truth data collection
consists of soil samples with the help of an auger and core sampler for the measurement
of gravimetric soil moisture, bulk density, field capacity, and wilting point of soil
samples. Fresh weights of soil samples were noted and they were oven dried for 24 h at
105uC temperature. The dried samples were weighed once again for dry weight. With the
help of fresh weight and dry weight for each of the 57 sampling fields, gravimetric soil
moisture (SM_G) has been calculated. Gravimetric soil moisture was then converted to
volumetric soil moisture (SM_V) by multiplying the gravimetric soil moisture of the
sample with their respective bulk densities. The bulk densities were calculated using
100 cc of undisturbed soil sample taken with the help of a core sampler.
Field capacity and wilting point of the soil samples have been estimated with the
help of a pressure plate instrument. This instrument was used to calculate the soil
moisture of all the 57 soil samples at 1/3-bar pressure for field capacity and at 15-bar
pressure for wilting point. Conversion of soil moisture values into percentage of field
capacity is as per the following equation (2):
SM FC~ 100 SMOBS�
SM1=3-barð2Þ�
where
SM_FC 5soil moisture in percentage of field capacity
SMOBS 5observed soil moisture from field
SM1/3-bar 5soil moisture at field capacity.
Soil moisture in terms of water available to plant per unit volume of soil, SM_WAP,
has also been calculated by multiplying the water currently available to the plant
with bulk density, i.e. [(SMOBS2SM15-bar) bulk density], as given by equation (1).
4.2 Data processing
4.2.1 DN to su conversion. For the RADARSAT-1 data supplied from CSA,
output scaling in terms of gain and offset are applied to the data to ensure optimum
utilization of the available dynamic range. DN image was converted to radar
backscatter (su) image using the following equation:
s0dB~10:0 log10 DN2zoffset� ��
gain� �
z10:0 log10 sin að Þð Þ ð3Þ
where DN is the digital number of the SAR image, which is in amplitude, and a is the
local incidence angle at that pixel position in the range direction. The header information
was used for the calculation of a, the local incidence angle at each pixel (RSI 2000).
4.2.2 Image processing. After conversion of DN to su, speckle suppression was
carried out using enhanced Lee-filtering algorithm (Lee 1986). The 10 December
1999 image of RADARSAT-1 EL1 beam mode was geo-referenced using the ground
control points (GCPs) from 1 : 50,000 scale Survey of India (SOI) topographic maps.
The registration accuracy for map to SAR image (10 December 1999) was of the
order of 1.4 pixels. The other three SAR images were then co-registered with this
geo-referenced image using the nearest neighbourhood method of resampling
(Duggin and Robinore 1990). The rail/road/canal networks and ground truth
locations were digitized and transferred onto the image. After registering all the four
SAR images, the 57 sampling locations were identified on the images and their
backscattering coefficient values were extracted from SAR images. Once the
Effect of soil texture in soil moisture estimation 2591
Dow
nloa
ded
by [
Indi
an I
nstit
ute
of R
emot
e Se
nsin
g, I
SRO
] at
03:
45 1
2 N
ovem
ber
2014
NOT FOR COMMERCIAL U
SE ONLY
FOR
PERSONAL READIN
G & REFERENCE PURPOSE
backscattering coefficient values were obtained, variation in SAR backscatter due to
soil moisture represented in terms of various units was studied. For this purpose, soil
moisture retrieval models have been developed for the following combinations using
linear regression analysis:
N backscattering coefficient with gravimetric soil moisture (SM_G)
N backscattering coefficient with volumetric soil moisture (SM_V)
N backscattering coefficient with soil moisture represented in terms of percentage
of field capacity (SM_FC)
N backscattering coefficient with soil moisture represented in terms of water
available to plant per unit volume of soil (SM_WAP)
5. Results and discussion
5.1 Model development
Since the objective of the present study was to incorporate the effect of soil texture in
the soil moisture retrieval model, enough care has been taken to avoid the effects ofother noise parameters such as crop cover and surface roughness by including only
smooth, bare fields in the analysis, as explained in the conceptualization section. The
absence of other noise parameters would enhance the effect of soil texture on the
radar backscatter. Regression analysis has been used to arrive at the soil moisture
estimators. Confidence level test using F statistic was performed for assessing
the significance of the regression analysis. For comparative evaluation of the
performance of the proposed soil moisture measure, four separate models have been
developed using the soil moisture values represented in terms of gravimetric soilmoisture, volumetric soil moisture, soil moisture in percentage of field capacity, and
soil moisture in terms of water available to plant per unit volume of soil. These
models are given by equation (4) to equation (7) and the results of regression analysis
for these models are given in table 1.
The model developed for gravimetric soil moisture is:
Gravimetric soil moisture SM Gð Þ~AzB s0 dBð Þ ð4Þ
The derived coefficients are as:
Gravimetric soil moisture SM Gð Þ~29:84z1:91 s0dBð Þ
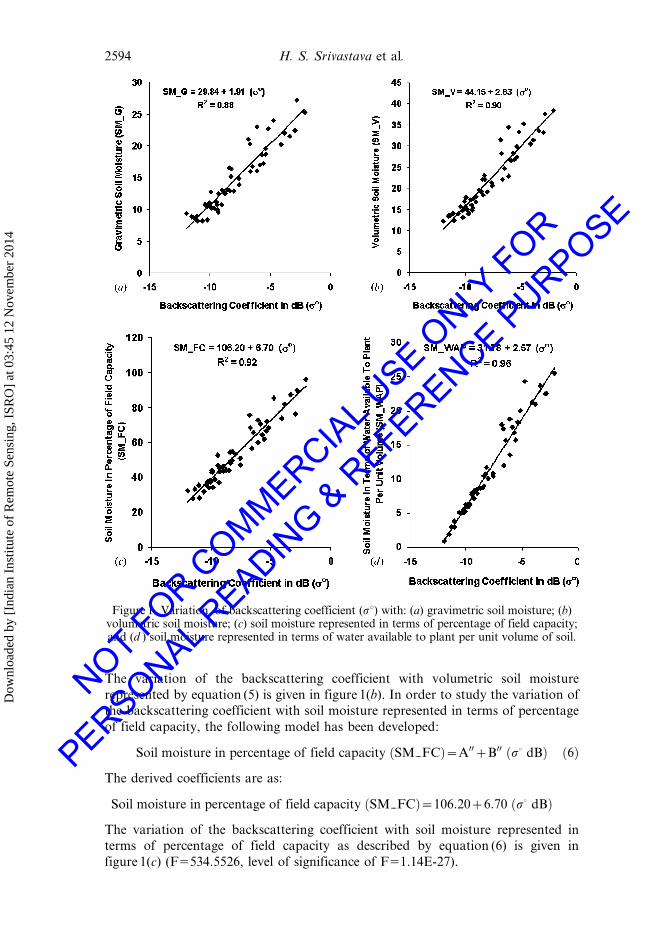
The coefficient of determination (R2) obtained in regression analysis for the
model given by equation (4) was 0.88, and the variation of the backscattering
coefficient with gravimetric soil moisture is shown in figure 1(a) (F5356.3875, level
of significance of F57.45E-24).
The model for volumetric soil moisture is given as:
Volumetric soil moisture SM Vð Þ~A0zB0 s0 dBð Þ ð5Þ
The derived coefficients are as:
Volumetric soil moisture SM Vð Þ~44:15z2:83 s0 dBð Þ
In this case, the coefficient of determination (R2) was obtained as 0.90, which was
slightly higher than the value of R2 obtained for equation (4) (F5446.0902, level of
significance of F56.01E-26).
2592 H. S. Srivastava et al.
Dow
nloa
ded
by [
Indi
an I
nstit
ute
of R
emot
e Se
nsin
g, I
SRO
] at
03:
45 1
2 N
ovem
ber
2014
NOT FOR COMMERCIAL U
SE ONLY
FOR
PERSONAL READIN
G & REFERENCE PURPOSE
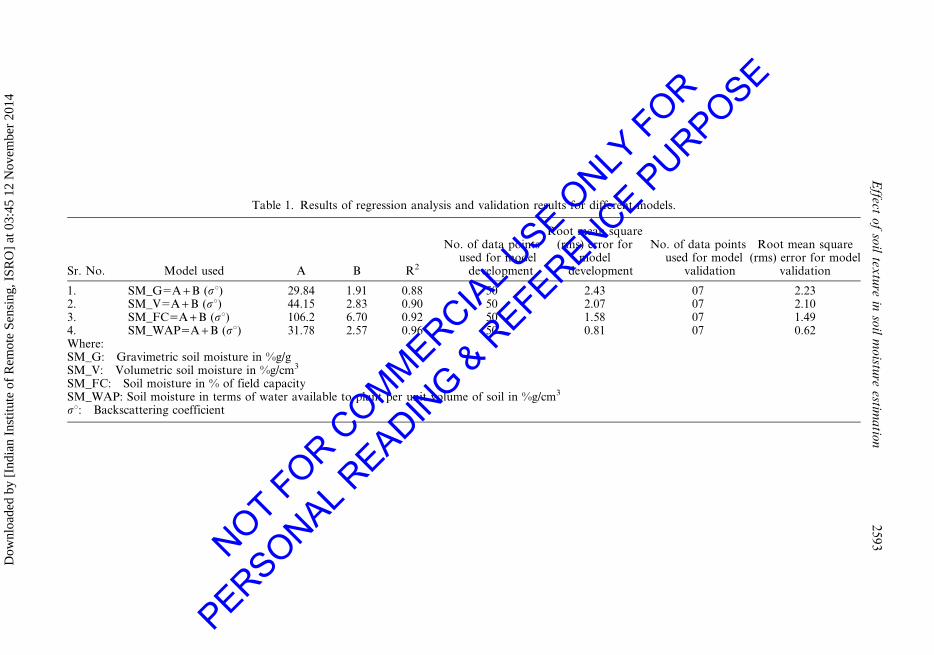
Table 1. Results of regression analysis and validation results for different models.
Sr. No. Model used A B R2
No. of data pointsused for model
development
Root mean square(rms) error for
modeldevelopment
No. of data pointsused for model
validation
Root mean square(rms) error for model
validation
1. SM_G5A + B (su) 29.84 1.91 0.88 50 2.43 07 2.232. SM_V5A + B (su) 44.15 2.83 0.90 50 2.07 07 2.103. SM_FC5A + B (su) 106.2 6.70 0.92 50 1.58 07 1.494. SM_WAP5A + B (su) 31.78 2.57 0.96 50 0.81 07 0.62Where:SM_G: Gravimetric soil moisture in %g/gSM_V: Volumetric soil moisture in %g/cm3
SM_FC: Soil moisture in % of field capacitySM_WAP: Soil moisture in terms of water available to plant per unit volume of soil in %g/cm3
su: Backscattering coefficient
Effect
of
soil
textu
rein
soil
mo
isture
estima
tion
25
93
Dow
nloa
ded
by [
Indi
an I
nstit
ute
of R
emot
e Se
nsin
g, I
SRO
] at
03:
45 1
2 N
ovem
ber
2014
NOT FOR COMMERCIAL U
SE ONLY
FOR
PERSONAL READIN
G & REFERENCE PURPOSE
The variation of the backscattering coefficient with volumetric soil moisture
represented by equation (5) is given in figure 1(b). In order to study the variation of
the backscattering coefficient with soil moisture represented in terms of percentage
of field capacity, the following model has been developed:
Soil moisture in percentage of field capacity SM FCð Þ~A00zB00 s0 dBð Þ ð6Þ
The derived coefficients are as:
Soil moisture in percentage of field capacity SM FCð Þ~106:20z6:70 s0 dBð Þ
The variation of the backscattering coefficient with soil moisture represented in
terms of percentage of field capacity as described by equation (6) is given in
figure 1(c) (F5534.5526, level of significance of F51.14E-27).
Figure 1. Variation of backscattering coefficient (su) with: (a) gravimetric soil moisture; (b)volumetric soil moisture; (c) soil moisture represented in terms of percentage of field capacity;and (d ) soil moisture represented in terms of water available to plant per unit volume of soil.
2594 H. S. Srivastava et al.
Dow
nloa
ded
by [
Indi
an I
nstit
ute
of R
emot
e Se
nsin
g, I
SRO
] at
03:
45 1
2 N
ovem
ber
2014
NOT FOR COMMERCIAL U
SE ONLY
FOR
PERSONAL READIN
G & REFERENCE PURPOSE
It was observed that for this model, R2 has increased moderately from 0.88 to 0.92
in comparison to that of gravimetric soil moisture. In order to explore the possibility
of further improvement in the model, in terms of improved sensitivity of SAR
backscatter towards the soil moisture over a large agricultural area and covering a
wide range of soil textures, a model representing soil moisture in terms of water
available to plant per unit volume of soil, as discussed in the conceptualization
section, was developed. This model is given by equation (7).
Soil moisture in terms of water available to plant SM WAPð Þ~A000zB000 s0 dBð Þ ð7Þ
The derived coefficients are as:
Soil moisture in terms of water available to plant SM WAPð Þ~31:78z2:57 s0 dBð Þ
Variation of the backscattering coefficient with soil moisture represented in terms of
water available to plant per unit volume of soil is shown in figure 1(d ) and the
coefficient of determination (R2) for the model given by equation (7) was found to
be 0.96 (F51043.101, level of significance of F53.23E-34).
Regression analysis was carried out to arrive at the soil moisture estimators. To
test the significance of the regression analysis, confidence level test using F statistic
was performed, which yielded the level of significance of F statistic as 3.23E-34,
1.14E-27, 6.01E-26, and 7.45E-24, respectively, for the soil moisture, represented in
terms of SM_WAP, SM_FC, SM_V, and SM_G, with the corresponding values of
the F statistic being 1043.101, 534.5526, 446.0902 and 356.3875. All four regression
estimators of soil moisture measures are statistically significant, with the SM_WAP
being most significant with the smallest value of level of significance (3.23E-34) and
the highest value of F statistic (1043.101). Thus, the results based on the regression
estimator supports the physical process-based concept of using the available water
as soil moisture measure, which is in reality taking place when SAR interacts with
the moist soil.
From equation (4) to equation (7) it is observed that there is an increase in
R2 when soil moisture was represented in volumetric percentage of field capacity
as well as in terms of water available to plant per unit volume of soil, as compared to
R2 obtained for gravimetric soil moisture (table 1). Similar results have been
observed by Ulaby et al. (1986a) by expressing the soil moisture in terms
of percentage of field capacity. It was also observed that the increase in R2
was marginal when soil moisture was represented in volumetric units (R2590),
whereas R2 was 0.92 when soil moisture was represented as percentage of
field capacity. In contrast to this, there was a considerable increase in the coefficient
of determination (R250.96), when the soil moisture was represented in terms
of water available to plant per unit volume of soil. The study indicated that for
large area mapping of soil moisture under a variety of soil textures, gravimetric
soil moisture and volumetric soil moisture are a comparatively less sensitive
way to represent soil moisture. In contrast to this, the model given by
equation (6) was found to be better than the first two models given by
equations (4) and (5). However, the considerable increase in the coefficient of
determination (R250.96), when soil moisture was represented in terms of water
available to plant per unit volume of soil, clearly indicates that it is this measure that
is closer to the actual free water to which SAR interacts. Interestingly it is also the
water that is usable by a plant and therefore it would directly appeal to agricultural
scientists.
Effect of soil texture in soil moisture estimation 2595
Dow
nloa
ded
by [
Indi
an I
nstit
ute
of R
emot
e Se
nsin
g, I
SRO
] at
03:
45 1
2 N
ovem
ber
2014
NOT FOR COMMERCIAL U
SE ONLY
FOR
PERSONAL READIN
G & REFERENCE PURPOSE
5.2 Model validation
Validation is an essential component of a statistical approach-based analysis. It is
necessary to have a validation set consisting of independent observations of the
parameter, and these observed values of the parameters should not be used to arrive
at an estimate of the parameter. Moreover, the size of the validation sample is
equally important. In our study, the minimum number of validation points required
for the meaningful validation exercise have been determined using the precision
power approach, as suggested by Brooks and Barcikowski (1996), keeping the
criteria that the sample correlation coefficient is not to decrease by more than 0.05,
no matter what the expected value of the correlation coefficient is. Using this
approach, with the R2 values of the original sample (with sample size550) being
0.96, 0.92, 0.90, and 0.88, respectively, for the soil moisture represented in terms
of SM_WAP, SM_FC, SM_V, and SM_G, the size of the validation set for
the case of one parameter is observed to be 2, 4, 4, and 5, respectively. This
validation sample size requirement analysis indicated that a minimum of five
validation points is required to form the validation sample. However, in the
present study, seven validation points were kept aside to form the validation
data set, which is more than the minimum data points required for model
validation.
In order to substantiate the results, validation has been carried out for seven
locations randomly selected out of the 57 sampling fields. Estimated values of soil
moisture were calculated using all four models developed during the study, as given
by equation (4) to equation (7). The rms (root mean square) error between the
observed soil moisture and estimated soil moisture using the models given by
equation (4) to equation (7) is given in table 1. The rms error for SM_WAP was
found to be the lowest at 0.62, as compared to that of 2.23 obtained for model (4).
The considerable reduction in rms error by representing soil moisture in terms of
water available to plant per unit volume of soil, instead of gravimetric soil moisture,
clearly indicated the soundness of the approach presented in the study. For SM_FC,
the rms error shows lower value at 1.49, which was better than the rms error of 2.10
and 2.23 obtained for SM_V and SM_G. Validation results clearly indicated that
representation of soil moisture in terms of percentage of water available to plant per
unit volume of soil appears to be the best approach to represent soil moisture while
mapping soil moisture with microwaves over a large agricultural area covering a
variety of soil textures.
6. Conclusions
The study indicated that the percentage of water available to plant per unit volume
of soil is a more realistic way to represent soil moisture as it describes the parameter
affecting microwave interaction in the soil medium. Thus, by adopting an
appropriate soil moisture measure, like the one proposed in this paper, it is possible
to incorporate the effect of soil texture in the soil moisture retrieval model. The
concept of water available to plant in a soil medium is based upon the assumption
that the water present in the soil medium at 15-bar pressure, which is unavailable to
plants, is directly proportional to the bound water. A considerable reduction in rms
error, from 2.23 to 0.62, was observed when the proposed measure was used in place
of gravimetric soil moisture. This suggests that it is possible to incorporate the effect
of soil texture in soil moisture estimation using microwave remote sensing by
2596 H. S. Srivastava et al.
Dow
nloa
ded
by [
Indi
an I
nstit
ute
of R
emot
e Se
nsin
g, I
SRO
] at
03:
45 1
2 N
ovem
ber
2014
NOT FOR COMMERCIAL U
SE ONLY
FOR
PERSONAL READIN
G & REFERENCE PURPOSE
representing the soil moisture in terms of water available to plant in that soil
medium. Moreover, the information on soil moisture in terms of water available to
plants would also be a more meaningful parameter as an input in many research
areas, particularly that of agriculture.
Acknowledgements
First author is extremely thankful to Mr Hari Shanker Srivastava, Director,
RRSSC/NNRMS and EOS, ISRO Headquarters, Bangalore, India and Prof. V. K.
Jha, Head, RRSSC, Dehradun, India for encouragement and support. Mrs Parul
Patel extends her thanks to Shri J. S. Parihar, Group Director, ARG, Space
Applications Centre, Ahmedabad, India and Mission Director, RSAM, and Dr
Sushma Panigrahi, Head, AMD, Space Applications Centre, Ahmedabad, India for
encouragement and support.
ReferencesBLUMBERGE, D.G., FREILIKHER, V., LYALKO, I.V., VULFSON, L.D., KOTLYAR, A.L.,
SHEVCHENKO, V.N. and RYABOKONENKO, A.D., 2000, Soil moisture (water-content)
assessement by an airborne scatterometer: the Chernobyl disaster area and the Neger
desert. Remote Sensing of Environment, 71, pp. 309–319.
BORGEAUD, M., ATTEMA, E., SALGADO-GISPERT, G., BELLINI, A. and NOLL, J., 1995,
Analysis of bare soil surface roughness parameter with ERS-1 SAR data. In
Symposium on the Extraction of Bio and Geophysical Parameter from SAR Data for
Land Applications. Poulouse, pp. 307–316.
BROOKS, G.P. and BARCIKOWSKI, R.S., 1996, Precision power and its application to the
selection of regression sample sizes. Mid-Western Educational Researcher, 9, pp.
10–17.
DOBSON, M.C. and ULABY, F.T., 1981, Microwave backscatter dependence on soil roughness,
soil moisture and soil texture: Part III Soil tension. IEEE Transactions on Geoscience
and Remote Sensing, 19, pp. 51–61.
DUBOIS, P.C., VAN ZYL, J. and ENGMAN, E.T., 1995, Measuring soil moisture with imaging
radar. IEEE Transactions on Geoscience and Remote Sensing, 33, pp. 915–926.
DUGGIN, M.J. and ROBINORE, C.J., 1990, Assumptions implicit in remote sensing
data acquisition and analysis. International Journal of Remote Sensing, 11, pp.
1669–1694.
HENDERSON, F.M. and LEWIS, J.L., 1998, Principles and Applications of Imaging Radar—
Manual of Remote Sensing, Volume II, pp. 407–425 (USA: John Wiley and Sons, Inc.).
LEE, J.S., 1986, Speckle suppression and analysis of SAR images. Optical Engineering, 25, pp.
636–643.
OH, Y., SARABANDI, K. and ULABY, F.T., 1992, Empirical model and inversion technique for
radar scattering for bare soil surfaces. IEEE Transactions on Geoscience and Remote
Sensing, 30, pp. 370–381.
PATEL, P. and MOHAN, S., 1993, Sampling Plan for ERS –1 Soil Moisture Estimation Project:
Statistical Considerations, ISRO Scientific Note, SAC/RSA/RSAG/ERS-1/SN/06/93,
SAC, Ahmedabad, India.
PATEL, P., PANIGRAHY, S. and CHAKRABORTY, M., 2002, Performance of RADARSAT-1
extended low beam mode SAR data for soil moisture retrieval. Asian Journal of
Geoinformatics: Special Issue on SAR Applications in Tropical Environment, 2, pp.
85–91.
RSI, 2000, RADARSAT Illuminated. Your Guide to Products and Services (Rich Mound,
Canada: RADARSAT International, Client Services).
SRIVASTAVA, H.S., PATEL, P., MANCHANDA, M.L. and ADIGA, S., 2002, An attempt to
incorporate the effect of crop cover in soil moisture estimation using multi-incidence
Effect of soil texture in soil moisture estimation 2597
Dow
nloa
ded
by [
Indi
an I
nstit
ute
of R
emot
e Se
nsin
g, I
SRO
] at
03:
45 1
2 N
ovem
ber
2014
NOT FOR COMMERCIAL U
SE ONLY
FOR
PERSONAL READIN
G & REFERENCE PURPOSE

angle RADARSAT-1 SAR data. Asian Journal of Geoinformatics: Special Issue on
SAR Applications in Tropical Environment, 2, pp. 33–40.
SRIVASTAVA, H.S., PATEL, P., MANCHANDA, M.L. and ADIGA, S., 2003, Use of multi-
incidence angle RADARSAT-1 SAR data to incorporate the effect of surface
roughness in soil moisture estimation. IEEE Transactions on Geoscience and Remote
Sensing: Special Issue on Retrieval of Bio and Geophysical Parameters from SAR Data
for Land Applications, 41, pp. 1638–1640.
ULABY, F.T., BATLIWALA, P.P. and DOBSON, M.C., 1978, Microwave backscatter dependence
on surface roughness, soil moisture and soil texture: Part I Bare soil. IEEE
Transactions on Geoscience Electronics, 16, pp. 286–295.
ULABY, F.T., BRADLEY, G.A. and DOBSON, M.C., 1979, Microwave backscatter dependence
on surface roughness, soil moisture and soil texture: Part II Vegetation-covered soil.
IEEE Transactions on Geoscience Electronics, 17, pp. 33–40.
ULABY, F.T., MOORE, R.K. and FUNG, A.K., 1986a, Microwave Remote Sensing: Active and
Passive, Volume II, pp. 860–863 (Artech House, 685 Canton Street, Norwood).
ULABY, F.T., MOORE, R.K. and FUNG, A.K., 1986b, Microwave Remote Sensing: Active and
Passive, Volume III, pp. 2086–2092 (Artech House, 685 Canton Street, Norwood).
WANG, J.R., 1980, The dielectric properties of soil–water mixtures at microwave frequencies.
Radio Science, 15, pp. 977–985.
WOODING, M.G., 1995, Satellite Radar in Agriculture: Experience with ERS-1. ESA
Publication 1185.
2598 Effect of soil texture in soil moisture estimation
Dow
nloa
ded
by [
Indi
an I
nstit
ute
of R
emot
e Se
nsin
g, I
SRO
] at
03:
45 1
2 N
ovem
ber
2014
NOT FOR COMMERCIAL U
SE ONLY
FOR
PERSONAL READIN
G & REFERENCE PURPOSE