An iterative Goldstein SAR interferogram filter
15
This article was downloaded by: [Hong Kong Polytechnic University] On: 17 March 2015, At: 03:20 Publisher: Taylor & Francis Informa Ltd Registered in England and Wales Registered Number: 1072954 Registered office: Mortimer House, 37-41 Mortimer Street, London W1T 3JH, UK International Journal of Remote Sensing Publication details, including instructions for authors and subscription information: http://www.tandfonline.com/loi/tres20 An iterative Goldstein SAR interferogram filter Chaoying Zhao a b , Qin Zhang a b , Xiaoli Ding c & Jing Zhang a a College of Geology, Engineering and Geomatics, Chang'an University , Xian , China b Key Laboratory of Western China's Mineral Resources and Geological Engineering, Ministry of Education , Xian , China c Department of Land Surveying and Geo-Informatics , Hong Kong Polytechnic University , Hung Hom , Hong Kong Published online: 24 Nov 2011. To cite this article: Chaoying Zhao , Qin Zhang , Xiaoli Ding & Jing Zhang (2012) An iterative Goldstein SAR interferogram filter, International Journal of Remote Sensing, 33:11, 3443-3455, DOI: 10.1080/01431161.2010.532171 To link to this article: http://dx.doi.org/10.1080/01431161.2010.532171 PLEASE SCROLL DOWN FOR ARTICLE Taylor & Francis makes every effort to ensure the accuracy of all the information (the “Content”) contained in the publications on our platform. However, Taylor & Francis, our agents, and our licensors make no representations or warranties whatsoever as to the accuracy, completeness, or suitability for any purpose of the Content. Any opinions and views expressed in this publication are the opinions and views of the authors, and are not the views of or endorsed by Taylor & Francis. The accuracy of the Content should not be relied upon and should be independently verified with primary sources of information. Taylor and Francis shall not be liable for any losses, actions, claims, proceedings, demands, costs, expenses, damages, and other liabilities whatsoever or howsoever caused arising directly or indirectly in connection with, in relation to or arising out of the use of the Content. This article may be used for research, teaching, and private study purposes. Any substantial or systematic reproduction, redistribution, reselling, loan, sub-licensing, systematic supply, or distribution in any form to anyone is expressly forbidden. Terms &
Transcript of An iterative Goldstein SAR interferogram filter

This article was downloaded by: [Hong Kong Polytechnic University]On: 17 March 2015, At: 03:20Publisher: Taylor & FrancisInforma Ltd Registered in England and Wales Registered Number: 1072954 Registeredoffice: Mortimer House, 37-41 Mortimer Street, London W1T 3JH, UK
International Journal of RemoteSensingPublication details, including instructions for authors andsubscription information:http://www.tandfonline.com/loi/tres20
An iterative Goldstein SARinterferogram filterChaoying Zhao a b , Qin Zhang a b , Xiaoli Ding c & Jing Zhang aa College of Geology, Engineering and Geomatics, Chang'anUniversity , Xian , Chinab Key Laboratory of Western China's Mineral Resources andGeological Engineering, Ministry of Education , Xian , Chinac Department of Land Surveying and Geo-Informatics , Hong KongPolytechnic University , Hung Hom , Hong KongPublished online: 24 Nov 2011.
To cite this article: Chaoying Zhao , Qin Zhang , Xiaoli Ding & Jing Zhang (2012) An iterativeGoldstein SAR interferogram filter, International Journal of Remote Sensing, 33:11, 3443-3455, DOI:10.1080/01431161.2010.532171
To link to this article: http://dx.doi.org/10.1080/01431161.2010.532171
PLEASE SCROLL DOWN FOR ARTICLE
Taylor & Francis makes every effort to ensure the accuracy of all the information (the“Content”) contained in the publications on our platform. However, Taylor & Francis,our agents, and our licensors make no representations or warranties whatsoever as tothe accuracy, completeness, or suitability for any purpose of the Content. Any opinionsand views expressed in this publication are the opinions and views of the authors,and are not the views of or endorsed by Taylor & Francis. The accuracy of the Contentshould not be relied upon and should be independently verified with primary sourcesof information. Taylor and Francis shall not be liable for any losses, actions, claims,proceedings, demands, costs, expenses, damages, and other liabilities whatsoever orhowsoever caused arising directly or indirectly in connection with, in relation to or arisingout of the use of the Content.
This article may be used for research, teaching, and private study purposes. Anysubstantial or systematic reproduction, redistribution, reselling, loan, sub-licensing,systematic supply, or distribution in any form to anyone is expressly forbidden. Terms &

Conditions of access and use can be found at http://www.tandfonline.com/page/terms-and-conditions
Dow
nloa
ded
by [
Hon
g K
ong
Poly
tech
nic
Uni
vers
ity]
at 0
3:20
17
Mar
ch 2
015

International Journal of Remote SensingVol. 33, No. 11, 10 June 2012, 3443–3455
An iterative Goldstein SAR interferogram filter
CHAOYING ZHAO*†‡, QIN ZHANG†‡, XIAOLI DING§ and JING ZHANG††College of Geology, Engineering and Geomatics, Chang’an University, Xian, China‡Key Laboratory of Western China’s Mineral Resources and Geological Engineering,
Ministry of Education, Xian, China§Department of Land Surveying and Geo-Informatics, Hong Kong Polytechnic
University, Hung Hom, Hong Kong
(Received 24 July 2009; in final form 13 October 2010)
This article presents a new modified Goldstein synthetic aperture radar (SAR)interferogram filter algorithm, named the iterative Goldstein filter. The main ideaof this approach is to iteratively filter the SAR interferogram, by determining thefiltering parameter alpha adaptively with respect to the pseudo-correlation valueof the original and/or last filtered interferograms several times. The filter can bestopped automatically by pre-setting the threshold of mean value and the improve-ment of pseudo-correlation in given filter windows. Experimental results with botha simulated digital elevation model (DEM) interferogram and real SAR deforma-tion interferogram show an improvement in the new algorithm results comparedwith those using the Goldstein filter, and its enhanced version, the Baran filter. Inaddition, from a pseudo-correlation map of the iteratively filtered interferogram,some valuable information can also be abstracted based on the signal residues.
1. Introduction
Although synthetic aperture radar interferometry (InSAR) has been widely appliedto measure surface topography and deformation in the last two decades (Zebker andGoldstein 1986, Massonnet and Feigl 1998), an improvement of the interferometrytechnique and the quality of its products is desirable to further enhance its capabili-ties. The accuracy of InSAR measurements is highly dependent on the quality of theinterferogram formed, based on two or more synthetic aperture radar (SAR) images.Due to the effects of various decorrelation factors, such as thermal, temporal, geomet-rical, Doppler centroid and data processing (Zebker and Villasenor 1992), the phasesof the SAR interferogram are often noisy, which can decrease the accuracy of thedigital elevation model (DEM) and deformation measurement.
Unlike applications such as monitoring of earthquakes and land subsidence, where,for example, a complex multilook operation with four looks in the range direction and20 looks in the azimuth direction was applied (Berardino et al. 2002), in monitoringfor mine collapse or ground fissure deformation, the high spatial resolution of InSARshould be kept for great subsidence gradient monitoring, so filtering is a key step forimproving the quality of the interferogram. Generally, interferogram filtering can be
*Corresponding author. Email: [email protected]
International Journal of Remote SensingISSN 0143-1161 print/ISSN 1366-5901 online © 2012 Taylor & Francis
http://www.tandf.co.uk/journalshttp://dx.doi.org/10.1080/01431161.2010.532171
Dow
nloa
ded
by [
Hon
g K
ong
Poly
tech
nic
Uni
vers
ity]
at 0
3:20
17
Mar
ch 2
015

3444 C. Zhao et al.
divided into two main classes: filtering in the spatial and the frequency domains. So-called Lee filtering (Lee et al. 1998) belongs to the spatial domain filtering class, whilethe filtering algorithm originally proposed by Goldstein and Werner (1998), and itsmodified versions by Baran et al. (2003) and Li et al. (2008), belong to the frequencydomain filtering methods. Based on the Goldstein filter, this article proposes anothermodified version, an iterative filtering algorithm, by determining the filtering parame-ter alpha according to the pseudo-correlation value of the original and/or last filteredinterferograms.
2. Review of filtering methods in the frequency domain
2.1 Goldstein filtering
Goldstein and Werner (1998) proposed an adaptive radar interferogram filter based onthe Fourier spectrum Z(u, v) of a small interferogram patch by its smoothed absolutevalue S {Z(u, v)} to the power of an exponent α, as shown as equation (1):
H(u, v) = S{|Z(u, v)|}α Z(u, v), (1)
where H(u, v) is the filter response (the spectrum of the filtered interferogram), S {·}is a smoothing operator, u, v are spatial frequencies, and α is the filtering parame-ter. Patches are defined as a small part of the interferogram and are overlapped toprevent discontinuities at the boundaries. The filter parameter α takes an a priorivalue between zero and one, and has the greatest impact on the filter performance.For the value of α = 0, the multiplication factor becomes one, and no filtering occurs.However, for large values of α, the filtering is significant. So a problem occurs when ahigh value of parameter α is chosen, as Goldstein and Werner (1998) demonstrated:the loss of resolution in the filtered phase. On the other hand, if a small value ofparameter α is applied, the filtered phases are still noisy. Therefore, there are severalconsiderations in determining a reasonable value for the parameter α.
2.2 Improved parameter determination for the Goldstein filter
As the noise level can be very different in different parts of an interferogram, andthe coherence is always used to estimate the quality of an interferogram, Baran et al.(2003) modified the filter parameter α as shown in equation (2):
α = 1 − γ̄ , (2)
where γ̄ denotes the mean coherence value over the effective patch (patch area minusthe overlap area) of an interferogram. In practice, the complex coherence γ betweentwo complex SAR images ωm and ωs (the interferometric pair) can be calculated withequation (3):
γ =∑N
i = 1 ωimωi∗
s√∑Ni = 1 |ωi
mωi∗m| ∑N
i = 1 |ωisω
i∗s |
, (3)
where ∗ denotes the complex conjunction, N is the number of pixels in the estimatedwindow and i stands for the pixel index. Therefore the modification relates the degreeof filtering to the coherence of an interferogram patch and makes the filter more
Dow
nloa
ded
by [
Hon
g K
ong
Poly
tech
nic
Uni
vers
ity]
at 0
3:20
17
Mar
ch 2
015

A novel interferogram filtering algorithm 3445
realistic and flexible for practical applications. By considering that phase noise is afunction of both coherence and number of looks (Bamler and Hartl 1998), Li et al.(2008) proposed another filter parameter factor, determined by applying the standarddeviation (SD) of phase noise.
However, both above-mentioned improved filters have their filtering parametersdetermined by the theoretical interferogram quality map, that is, coherence or SD. Inpractice, there are several drawbacks of coherence for assessing the quality of interfer-ograms, such as biased estimation for the deformation interferogram if there are somesystematic phases. Also, as pointed out by Li et al. (2004), when two mean values andSDs of coherences are quite similar, their coherence images can, however, be quite dif-ferent. Lastly, the quality map can also be applied for other research related to specificdecorrelation. Therefore, some other quality maps calculated from the interferogramitself will be discussed in the next §, which will be applied for filter parameter determi-nation, some specific information detection and interferogram quality assessment infollowing §§.
3. The iterative Goldstein filter
3.1 Review of interferogram quality maps
Several interferogram quality maps have been analysed for the phase unwrap-ping improvement, such as coherence, SD, maximum phase gradient and pseudo-correlation (Ghiglia and Pritt 1998). For coherence, Zebker and Katherine (2005)pointed out that it is biased by a finite data sample size and any underlying interferom-eter fringe pattern. Hanssen (2001) has proposed an unbiased correlation estimationmethod by first eliminating the systematic phase, as shown in equation (4):
γ =∑N
i = 1 ωimωi∗
s exp(−jφ)√∑Ni = 1 |ωi
mωi∗m| ∑N
i = 1 |ωisω
i∗s |
, (4)
where φ is the systematic phase for each pixel j means imaginary unit, and differentphases of φ can stand for flattened, differential and/or residual phase correction cases.Li et al. (2004) proposed another quality map, absolute phase difference (APD), asshown in equation (5):
APD(x, y) = 18
1∑l =−1
1∑k =−1
|φ(x, y) − φ(x + l, y + k)|, (5)
where l and k are the integral variables and the sum of phase difference (SPD) can beapplied as the quantitative measure for the whole interferogram quality, as in equation(6):
SPD =p∑
x = 1
q∑y = 1
(APD)(x, y), (6)
Where p and q are the pixel numbers in the x and y directions respectively. This will beapplied in this article for the quality assessment of interferograms.
The pseudo-correlation (Pc) map is calculated from the interferogram itself, definedas in equation (7):
Dow
nloa
ded
by [
Hon
g K
ong
Poly
tech
nic
Uni
vers
ity]
at 0
3:20
17
Mar
ch 2
015
3446 C. Zhao et al.
Pc =|
N∑i = 1
φi|N∑
i = 1|φi|
, (7)
where N is the total number of pixels in the estimated patch and φi is the inter-ferogram value. In this article, the pseudo-correlation quality map will be taken todetermine the filter factor iteratively and to detect the signal residues to show theground discontinuous region, that is, ground fissures, in the real SAR data test §.
3.2 The iterative Goldstein filter method
Originally, Katsaggelos and Tsai (2005) researched the theory and method of iterativeimage restoration, where the restoration algorithms, convergence and constraints forsolution of the amplitude image were analysed. Here, we focus only on the complexphase filtering under the framework of the Goldstein filter. Similarly, the filter parame-ter α is determined from the pseudo-correlation map of the interferogram to be filteredas shown in equation (8):
α = 1 − c̄, (8)
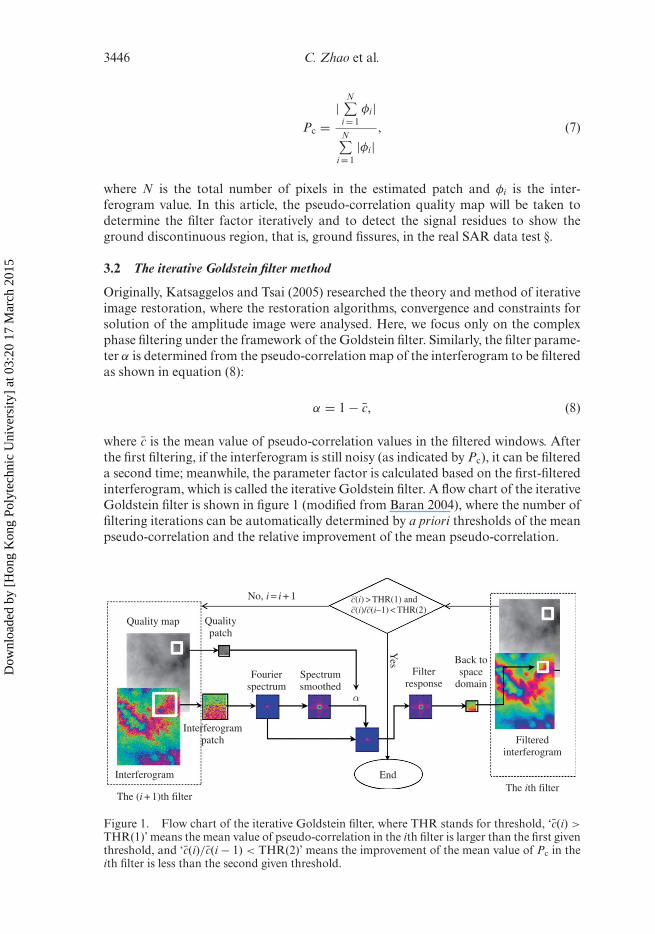
where c̄ is the mean value of pseudo-correlation values in the filtered windows. Afterthe first filtering, if the interferogram is still noisy (as indicated by Pc), it can be filtereda second time; meanwhile, the parameter factor is calculated based on the first-filteredinterferogram, which is called the iterative Goldstein filter. A flow chart of the iterativeGoldstein filter is shown in figure 1 (modified from Baran 2004), where the number offiltering iterations can be automatically determined by a priori thresholds of the meanpseudo-correlation and the relative improvement of the mean pseudo-correlation.
Quality map Qualitypatch
Fourierspectrum
Spectrumsmoothed
Yes
c(i) > THR(1) andc(i)/c(i–1) < THR(2)
Filterresponse
Back tospace
domain
Interferogrampatch
End
α
Interferogram
Filteredinterferogram
The (i + 1)th filterThe ith filter
No, i = i + 1 –– –
Figure 1. Flow chart of the iterative Goldstein filter, where THR stands for threshold, ‘c̄(i) >THR(1)’ means the mean value of pseudo-correlation in the ith filter is larger than the first giventhreshold, and ‘c̄(i)/c̄(i − 1) < THR(2)’ means the improvement of the mean value of Pc in theith filter is less than the second given threshold.
Dow
nloa
ded
by [
Hon
g K
ong
Poly
tech
nic
Uni
vers
ity]
at 0
3:20
17
Mar
ch 2
015

A novel interferogram filtering algorithm 3447
4. Numerical validation using a simulated data set
The performance of the modified filter will be evaluated with simulated data sets in thissection and with real data sets in the next. Comparisons with the Goldstein filter andone of the previous modifications of the Goldstein filter by Baran et al. (2003) will alsobe made. For simplicity, hereinafter, the modification proposed by Baran et al. (2003)and given in equation (2) will be named the Baran filter, and the new, modified filterwill be referred to as the iterative filter. First a simple example is given, to show thatthe iterative filter can work well, and then a complex real deformation interferogramwith high frequency signals is shown, to demonstrate the necessity for, and some newapplications of, the iterative filter.
A multifractal DEM with a resolution of 20 m × 20 m and size 512 × 512 pixels isfirst simulated, based on the common values of the multifractal parameters of topog-raphy given by Pecknold et al. (1993). The DEM, along with the European RemoteSensing 1/2 (ERS-1/2) imaging parameter and a perpendicular baseline of 200 m, isthen used to simulate ‘true’ interferometric phases (see figure 2(a)). A coherence map isalso simulated, considering the thermal, geometrical and temporal decorrelation (Leeand Liu 1999), and shown in figure 3(a). Based on the coherence map, a phase SDmap with single look numbers is then obtained. Then the interferometric phase noiseis simulated based on the corresponding phase SD map and the normal noise model.Finally, the simulated observed phase (figure 2(b)) is generated by adding the simu-lated noise to the true interferometric phase values. Here, no intensity is considered. Ashort black line in figure 2(a) indicates the cross-section location.
The simulated interferogram is filtered with the Goldstein, Baran and iterative filtersrespectively. The patch size chosen is 32 × 32 pixels and the overlaps between patchesare taken as 28 pixels to avoid discontinuities. The parameter of the Goldstein filteris 0.5 to avoid over-filtering, the parameter for the Baran filter is calculated basedon equation (2) and shown as figure 3(a); while for the iterative filter, two filteringiterations are performed and the parameters are calculated based on equation (8). Thepseudo-correlation maps of the observed and first-filtered interferograms are shownin figure 3(b) and (c), respectively. By comparing coherence and pseudo-correlationmaps, some differences are clear to see. The interferograms filtered with the Goldsteinand Baran filters, and second-filtered by the iterative method, are shown in figure 4.
50
100
150
200
250
300
350
400
450
500
100 200 300
Pixel
Pix
el
Pix
el
Pixel
400
(a) (b)
500
3 (rad) (rad)
2
1
0
–1
–3
–2
100 200 300 400 500
503
2
1
0
–1
–3
–2
100
150
200
250
300
350
400
450
500
Figure 2. Simulated (a) true phase and (b) observed phase maps of one known DEM.
Dow
nloa
ded
by [
Hon
g K
ong
Poly
tech
nic
Uni
vers
ity]
at 0
3:20
17
Mar
ch 2
015

3448 C. Zhao et al.
50
100
150
200
250
Pix
el
Pix
el
Pix
el
300
350
400
450
500
50
100
150
200
250
300
350
400
450
500
50
100
150
200
250
300
350
400
450
500
100 200 300 400 500
0.9
0.8
0.7
0.6
0.5
0.4
0.3
0.2
100 200 300 400 500 100 200 300 400 500
(a) (b)
(c)
Pixel
Pixel
Pixel
Figure 3. Quality map of simulated phase: (a) simulated coherence map, (b) pseudo-correlation map of simulated observed interferogram and (c) pseudo-correlation map offirst-filtered interferogram. Grey colour bar indicates range from 0 to 1.
For a quantitative evaluation, the sum of phase difference and sum of residues arecalculated and listed in table 1, where it can be seen that the added Gaussian noisemakes the sum of phase difference (SPD) of the observed interferogram about 16times that of the ‘true’ interferogram and the total number of residues increased to63 097 from 0, which accounts for 24.1% of total pixels. The Goldstein and Baran fil-ters can reduce the phase differences to 55% and 66% of the observed ones and reducethe phase residues to nearly one tenth and two tenths, respectively. As for the itera-tive filter, the first-filtered interferogram has fewer residues than those filtered by theGoldstein and Baran filters, and the second filtering can obtain a filtered interferogramwith zero residues. In this simulated test, in which only noise residues are contained,thus showing the advantages of adaptive filtering in the spatial region and iterativefiltering in the temporal region, the new proposed algorithm may slightly over-filterthe interferogram. Under these conditions, the fewer the residues, the more reliablethe unwrapping will be.
For a closer examination of the results, a cross-section, as marked on figure 2(a), isplotted for each of the interferograms, including the ‘true’, observed and filtered ones,
Dow
nloa
ded
by [
Hon
g K
ong
Poly
tech
nic
Uni
vers
ity]
at 0
3:20
17
Mar
ch 2
015
A novel interferogram filtering algorithm 3449
50
100
150
200
Pix
el
Pix
el
Pix
el
Pix
el
250
300
350
400
450
500
50
100
150
200
250
300
350
400
450
500
100 200 300 400 500 100 200 300 400 500
3 (rad)
2
1
0
–1
–2
–3
(a) (b)
50
100
150
200
250
300
350
400
450
500
50
100
150
200
250
300
350
400
450
500
100 200 300 400 500 100 200 300 400 500
(c) (d)
Pixel Pixel
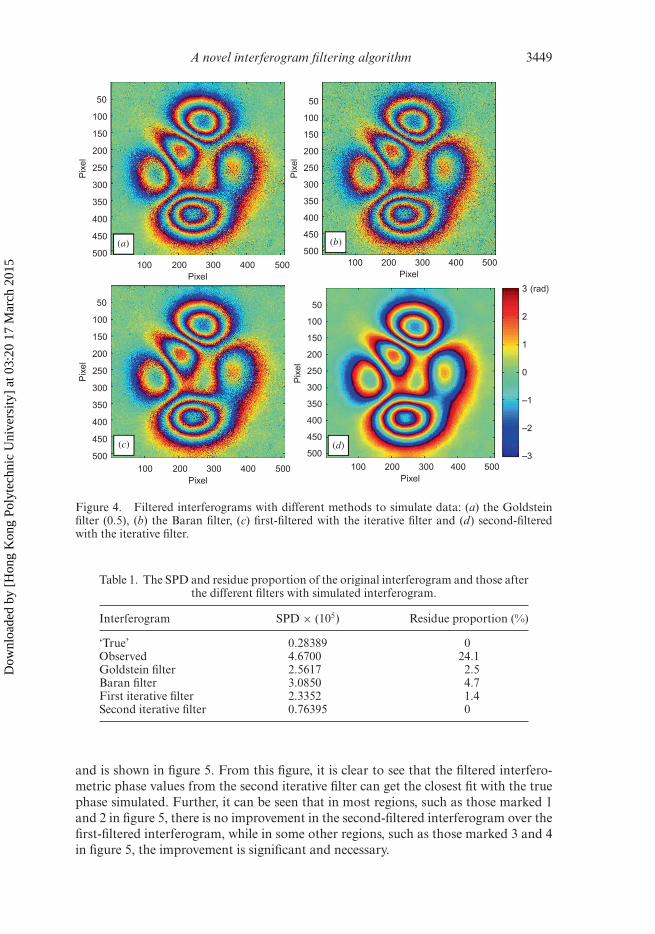
Pixel Pixel
Figure 4. Filtered interferograms with different methods to simulate data: (a) the Goldsteinfilter (0.5), (b) the Baran filter, (c) first-filtered with the iterative filter and (d) second-filteredwith the iterative filter.
Table 1. The SPD and residue proportion of the original interferogram and those afterthe different filters with simulated interferogram.
Interferogram SPD × (105) Residue proportion (%)
‘True’ 0.28389 0Observed 4.6700 24.1Goldstein filter 2.5617 2.5Baran filter 3.0850 4.7First iterative filter 2.3352 1.4Second iterative filter 0.76395 0
and is shown in figure 5. From this figure, it is clear to see that the filtered interfero-metric phase values from the second iterative filter can get the closest fit with the truephase simulated. Further, it can be seen that in most regions, such as those marked 1and 2 in figure 5, there is no improvement in the second-filtered interferogram over thefirst-filtered interferogram, while in some other regions, such as those marked 3 and 4in figure 5, the improvement is significant and necessary.
Dow
nloa
ded
by [
Hon
g K
ong
Poly
tech
nic
Uni
vers
ity]
at 0
3:20
17
Mar
ch 2
015

3450 C. Zhao et al.
0
1
32 4
–4
–2
0
2
4True phase
Observed phaseGoldsteinBaranIst lterative2nd lterative
40
Range (pixels)
Phase (
rad)
80 120
Figure 5. The cross-section of the simulated data over the unfiltered (observed) and filteredwrapped phase interferograms, filtered with the Goldstein, Baran and iterative filters.
5. Validation with real data
A real deformation pair of ERS data (frame: 2916, track: 161) acquired on 7 Januaryand 1 July 1996 over Xian, China, which suffers from heavy signal residues caused bya large deformation gradient (generally called a ground fissure), is used to assess theperformance of the iterative Goldstein filter. The perpendicular baseline of this pair isonly 21 metres and the temporal baseline only 176 days, so it is feasible for differentialinterferometry. Under these conditions, it is supposed that the signal residues do notresult from topographic effects and temporal decorrelation, but the high deformationgradient, which is larger than the InSAR monitoring limit – half a wavelength betweentwo neighbouring pixels (Massonnet and Feigl 1998) – in a certain direction. This com-plex interferogram has been multilooked with one look in the range direction and fivelooks in the azimuth direction respectively, therefore, in total, 1500 × 1500 pixels inSAR coordinates will be focused on. Figure 6 shows the original differential interfero-gram and its coherence map; the latter will be used for the Baran filter. Again, a shortblack bar in figure 6(a) indicates the location of the cross-section. From the coherencemap, the urban region in the central map is highly correlated, while the surroundingsare agricultural regions, which show heavy noise. Figure 7 shows the interferogramsfiltered with (a) the Goldstein filter with α = 0.5, (b) the Baran filter, and (c) and (d)the iterative filter for the first and second filters respectively.
Quantitative assessments of the iterative filter are also shown in table 2 using thesum of phase difference and residues criteria, where it can be seen that the Goldstein,Baran and first iterative filters can give similar results, but the second iterative filtercan greatly improve the results. The great number of residues after the second iterativefilter mainly results from the large agricultural area in this research region.
The cross-section marked on figure 6(a) is, as before, plotted for each of the fiveinterferograms, and shown in figure 8. As expected, the iterative filter gives a smoother
Dow
nloa
ded
by [
Hon
g K
ong
Poly
tech
nic
Uni
vers
ity]
at 0
3:20
17
Mar
ch 2
015

A novel interferogram filtering algorithm 3451
200
1400
1200
1000
800Pix
el
Pix
el
Pixel Pixel
600
400
200 400 600 800 10001200 1400
(a) (b)
3 (rad)
2
1
0
–1
–3
–2
200
1400
1200
1000
800
600
400
200 400 600 800 1000 1200 1400
0.9
0.8
0.7
0.6
0.5
0.4
0.3
0.2
0.1
Figure 6. (a) The original interferogram and (b) its coherence map of real SAR data.
200
400
600
800
1000
1200
1400
200 400 600
Pixel
Pix
el
Pix
el
Pix
el
Pix
el
Pixel
Pixel Pixel
800 1000 1200 1400 200 400 600 800 1000 1200 1400
200 400 600 800 1000 1200 1400
200
400
600
800
1000
1200
1400
200
400
600
800
1000
1200
1400
200
3 (rad)
2
1
0
–1
–2
–3
400
600
800
1000
1200
1400
(a) (b)
(c) (d)
200 400 600 800 1000 1200 1400
Figure 7. Interferograms filtered with different methods to the real SAR data: (a) theGoldstein filter (0.5), (b) the Baran filter, (c) first-filtered with the iterative filter and (d)second-filtered with the iterative filter.
phase than do the Goldstein and Baran filters, and the second-filtered result is bet-ter than the first-filtered one. Also, some improvement can be seen after the secondfiltering.
Dow
nloa
ded
by [
Hon
g K
ong
Poly
tech
nic
Uni
vers
ity]
at 0
3:20
17
Mar
ch 2
015

3452 C. Zhao et al.
Table 2. The SPD and residue proportion of the original interferogram and those afterthe different filters with real SAR data.
Interferogram SPD (× 106) Residue proportion (%)
Original 4.3020 24.0Goldstein filter 3.8652 18.2Baran filter 3.8085 16.7First iterative filter 3.7780 16.4Second iterative filter 2.9649 8.7
4Original phaseGoldsteinBaran1st Iterative2nd Iterative
2
0
–2
–4140 160 180 200
Range (pixels)
Phase (
rad)
220 240 260
Figure 8. Cross-section of interferometric phases with the real SAR data of the observed(original) and filtered interferograms, filtered with the Goldstein, Baran and iterative filters.
In order to closely assess the newly proposed filter algorithm, nine discrete spiritlevelling data recorded during a similar time span are used to validate the geocodeddeformation results after the second iterative filtering (shown in figure 9) (Zhao et al.2009a). The figure shows thirteen ground fissures and the spirit levelling benchmarkssuperimposed on the background of the intensity map. A comparison between theBaran and second-filtered deformation results is shown in table 3. As well as this, thepseudo-correlation map can also be applied to detect the location of signal residues,which are physically related to the active ground fissures in this example. To high-light the signal residues, we have generated a texture map by calculating the SD tomean value ratio for a given pixel within a 5 × 5 windows of the pseudo-correlationmap after the second filtering, which is superimposed with known ground fissures andshown in figure 10 (Zhao et al. 2009b).
Dow
nloa
ded
by [
Hon
g K
ong
Poly
tech
nic
Uni
vers
ity]
at 0
3:20
17
Mar
ch 2
015

A novel interferogram filtering algorithm 3453
3 800 000
3 795 000
3 790 000
3 785 000
300 000 305 000 310 000
Y
X
315 000 320 000
–11
–10
–9
–8
–7
–6
–5
–4
–3
–2
–1
0cm
(m)
(m)
Leveling point
Fissures
Fault
Figure 9. Geocoded deformation map between 7 January and 1 July 1996, where pink linesshow the location of active ground fissures in Xian city, the nine cyan triangles are the levellingpoints, the dark triangle is a reference point in a stable region, the black line is an active fault inXian and the background is the intensity map.
Table 3. Statistics of the Baran and second-filtered deformation with discrete levellingpoints (in cm).
No. Levelling Baran �∗ Iterative �* Location
1 −3.9 −4.5 0.6 −4.3 0.4 Xinjiamiao2 −5.3 −6.2 0.9 −5.8 0.5 Hujiamiao3 −4.3 −4.9 0.6 −4.8 0.5 Tielumiao4 −7.2 −6.5 −0.7 −7.2 0.0 Xiaozhai5 −6.8 −7.2 0.4 −7.2 0.4 Balicun6 −7.2 −6.0 −1.2 −6.3 −0.9 Hi-tech zone7 −5.3 −6.5 1.2 −6.3 1.08 −4.8 −5.4 0.6 −5.3 0.59 −6.3 −7.5 1.2 −7.2 1.1Standard deviation ±0.8 ±0.6
Note: ∗Difference between levelling result and the filtered InSAR deformation result.
The good results in comparison with the spirit-levelling data show an improvementfor unwrapping and deformation monitoring; the levelling benchmarks were originallysited for land subsidence monitoring, so they are not near the ground fissure region.
Figure 10 shows that the pseudo-correlation map can also be applied for positioningor tracing large deformation gradient regions, which would be beneficial to geologicalresearch.
Dow
nloa
ded
by [
Hon
g K
ong
Poly
tech
nic
Uni
vers
ity]
at 0
3:20
17
Mar
ch 2
015

3454 C. Zhao et al.
300 000 305 000 310 000
Y
X
315 000 320 000
3 800 000
3 795 000
3 790 000
3 785 000
Fissures
Fault
(m)
(m)
Figure 10. The overlay map of known ground fissures and detected active fissures during themonitoring time span in 1996; the background is the texture of the pseudo-correlation map aftersecond filtering.
6. Conclusion
A new modification of the Goldstein filter is proposed, which involves iterativelyfiltering the interferograms, and the filter parameter is determined from the pseudo-correlation of the original and/or last-filtered interferograms. In practice, the filterparameter alpha determined from pseudo-correlation is more reasonable than thatgiven an a priori value or determined by a theoretical coherence value. Results fromtwo tests carried out with a simulated DEM phase and real deformation phase haveshown the newly proposed iterative Goldstein filter can improve the interferogramquality, hence improve final results such as DEM or deformation. In addition, thepseudo-correlation map of the iteratively filtered interferogram can also abstractvaluable information, such as the position of active ground fissures.
AcknowledgementsThe SAR data were supplied by the European Space Agency (ESA) under category-1.This research was funded by the Natural Science Foundation of China (NSFC) (No.40802075, 41072266) and the key project of the Ministry of Land & Resources,China (No. 1212010914015). We greatly thank the two anonymous reviewers of thismanuscript for their helpful and constructive comments.
ReferencesBAMLER, R. and HARTL, P., 1998, Synthetic aperture radar interferometry. Inverse Problems,
14, pp. R1–R54.BARAN, I., 2004, Advanced satellite radar interferometry for small scale surface deformation
detection. PhD dissertation, Curtin University of Technology, Sydney.
Dow
nloa
ded
by [
Hon
g K
ong
Poly
tech
nic
Uni
vers
ity]
at 0
3:20
17
Mar
ch 2
015

A novel interferogram filtering algorithm 3455
BARAN, I., STEWART, M.P., KAMPES, B.M., PERSKI, Z. and LILLY, P., 2003, A modification tothe Goldstein radar interferogram filter. IEEE Transactions on Geoscience and RemoteSensing, 41, pp. 2114–2118.
BERARDINO, P., FORNARO, G., LANARI, R. and SANSOSTI, E., 2002, A new algorithm for surfacedeformation monitoring based on small baseline differential SAR interferometry. IEEETransactions on Geoscience and Remote Sensing, 40, pp. 2375–2383
GHIGLIA, D.C. and PRITT, M.D., 1998, Two-dimensional phase unwrapping: theory, algorithms,and software, pp. 70–82 (New York, NY: John Wiley & Sons).
GOLDSTEIN, R.M. and WERNER, C.L., 1998, Radar interferogram filtering for geophysicalapplications. Geophysical Research Letters, 25, pp. 4035–4038.
HANSSEN, R.F., 2001, Radar Interferometry – Data Interpretation and Error Analysis, 98 pp.(Dordrecht: Kluwer Academic).
KATSAGGELOS, A.K. and TSAI, C.J., 2005, Iterative image restoration. In Handbook of Imageand Video Processing, A. Bovik (Ed.), pp. 235–252 (Burlington, MA: Elsevier AcademicPress).
LEE, H. and LIU, J.G., 1999, Spatial decorrelation due to topography in the interferometry SARcoherence imagery. In Proceedings of IEEE 1999 International Geoscience and RemoteSensing Symposium, 28 June–2 July 1999, Hamburg, Germany (Burlinton, MA: ElsevierAcademic Press), pp. 485–487.
LEE, J.S., PAPATHANASSIOU, K., AINSWORTH, T.L., GRUNES, M.R. and REIGBER, A., 1998,A new technique for noise filtering of SAR interferometric phase images. IEEETransactions on Geoscience and Remote Sensing, 36, pp. 1456–1465.
LI, Z.L., ZOU, W.B., DING, X.L., CHEN, Y.Q. and LIU, G.X., 2004, A quantitative measurefor the quality of InSAR interferograms based on phase differences. PhotogrammetricEngineering and Remote Sensing, 70, pp. 1131–1137.
LI, Z.W., DING, X.L., HUANG, C., ZHU, J.J. and CHEN, Y.L., 2008, Improved filteringparameter determination for the Goldstein radar interferogram. ISPRS Journal ofPhotogrammetry and Remote Sensing, 63, pp. 621–634.
MASSONNET, D. and FEIGL, K.L., 1998, Radar interferometry and its application to changes inthe earth’s surface. Reviews of Geophysics, 36, pp. 441–500.
PECKNOLD, S., LOVEJOY, S., SCHERTZER, D., HOOGE, C. and MALOUIN, J.F., 1993, The sim-ulation of universal multifractals. In Cellular Automata: Prospects in AstrophysicalApplications, A. Lejeune and J. Perdang (Eds.), pp. 228–267 (Singapore: WorldScientific).
ZEBKER, H.A. and GOLDSTEIN, R.M., 1986, Topographic mapping from interferometric syn-thetic aperture radar observations. Journal of Geophysical Research, 91, pp. 4993–4999.
ZEBKER, H.A. and KATHERINE, C., 2005, Accurate estimation of correlation in InSARobservations. IEEE Geoscience and Remote Sensing letters, 2, pp. 124–127.
ZEBKER, H.A. and VILLASENOR, J., 1992, Decorrelation in interferometric radar echoes. IEEETransactions on Geoscience and Remote Sensing, 30, pp. 950–959.
ZHAO, C.Y., ZHANG, Q., DING, X.L., PENG, J.B. and YANG, C.S., 2009a, InSAR based evalu-ation of land subsidence and ground fissure evolution at Xian. Journal of EngineeringGeology, 17, pp. 389–393 [in Chinese].
ZHAO, C.Y., ZHANG, Q., DING, X.L. and QU, W., 2009b, Positioning of Xian active ground fis-sures with SAR interferometry. Geomatics and Information Science of Wuhan University,34, pp. 809–813 [in Chinese].
Dow
nloa
ded
by [
Hon
g K
ong
Poly
tech
nic
Uni
vers
ity]
at 0
3:20
17
Mar
ch 2
015