Response of buried steel pipelines subjected to relative axial soil movement
18
Response of buried steel pipelines subjected to relative axial soil movement Dharma Wijewickreme, Hamid Karimian, and Douglas Honegger Abstract: The performance of buried steel pipelines subjected to relative soil movements in the axial direction was inves- tigated using full-scale pullout testing in a soil chamber. Measured axial soil loads from pullout testing of pipes buried in loose dry sand were comparable to those predicted using guidelines commonly used in practice. The peak values of axial pullout resistance observed on pipes buried in dense dry sand were several-fold (in excess of 2 times) higher than the pre- dictions from guidelines; the observed high axial pullout resistance is primarily due to a significant increase in normal soil stresses on the pipelines, resulting from constrained dilation of dense sand during interface shear deformations. This rea- soning was confirmed by direct measurement of soil stresses on pipes during full-scale testing and numerical modeling. The research findings herein suggest that the use of the coefficient of lateral earth pressure at-rest (K0) to compute axial soil loads, employing equations recommended in common guidelines, should be undertaken with caution for pipes buried in soils that are likely to experience significant shear-induced dilation. Key words: buried pipelines, pipe–soil interaction, dilation, soil loading on pipes, interface friction. Re ´sume ´: La performance de tuyaux en acier enfouis soumis a ` des mouvements axiaux de sol a e ´te ´ investigue ´e a ` l’aide d’essais d’arrachement des tuyaux a ` l’e ´chelle re ´elle dans une boı ˆte de sol. Les charges axiales de sol mesure ´es dans les es- sais a ` l’e ´chelle re ´elle effectue ´s sur des tuyaux enfouis dans un sable sec non compacte ´e ´taient comparables a ` celles pre ´di- tes en utilisant les directives usuelles. Dans le cas d’un sable dense, le pic de re ´sistance axiale observe ´ sur les tuyaux enfouis e ´tait de plusieurs fois plus e ´leve ´ (plus de deux fois) que les pre ´dictions provenant des directives. Ceci est principa- lement du ˆa ` une augmentation significative des contraintes normales globales du sol sur les tuyaux en raison de la dilata- tion en milieu restreint du sable dense durant les de ´formations en cisaillement des interfaces. Cette explication a e ´te ´ confirme ´e par des mesures directes des contraintes du sol sur les tuyaux durant les essais a ` l’e ´chelle re ´elle, en plus d’e ˆtre supporte ´e par des mode ´lisations nume ´riques. L’utilisation du coefficient de pression late ´rale des terres au repos (K 0 ) pour repre ´senter les contraintes du sol sur les tuyaux lors des essais d’arrachement, tel que recommande ´ par les directives usuel- les, devrait e ˆtre faite avec pre ´cautions dans le cas de tuyaux enfouis dans des sols qui peuvent se dilater lors du cisaille- ment des interfaces. Mots-cle ´s : tuyaux enfouis, interaction tuyau–sol, dilatation, chargement du sol sur les tuyaux, friction a ` l’interface. [Traduit par la Re ´daction] Introduction Buried pipeline systems form a key part of global lifeline infrastructure and any significant disruption to the perform- ance of these systems often translates into undesirable im- pacts on regional businesses, economies or the living conditions of citizens. One of the major risks to buried pipe- lines arises from permanent ground movements where high soil loads can lead to potentially unacceptable strains in the pipelines. Common causes of permanent ground displace- ment are related to slope instability and ground subsidence, including earthquake-induced ground displacements. Based on the direction of relative soil displacement with respect to the pipe alignment, buried pipeline restraints against soil movement can be categorized into four different modes: vertical uplift, vertical bearing, transverse (or horizontal–lateral), and axial (or longitudinal). Effects aris- ing due to a combination of these modes are generally con- sidered in the evaluation of the response of buried pipelines subjected to differential ground movements. This paper fo- cuses on the estimation of loads on the pipe due to relative axial soil movements. Current understanding of the mobilized soil loads on pipes due to axial pipe restraint (or differential axial dis- placement between soil and pipe) is mainly based on soil– pipe interface parameters and an assumed failure mechanism of the soil. The commonly used approach for determination of axial loads on pipes buried in cohesionless soils is through the use of a simple formula ½1 F A ¼ g 0 H 1 þ K 0 2 tanðdÞðpDLÞ where F A is the axial soil load on the pipe (soil resistance), g ’ is the average effective unit weight of the soil, H is the depth from the ground surface to the pipe centreline (spring Received 30 November 2007. Accepted 9 February 2009. Published on the NRC Research Press Web site at cgj.nrc.ca on 17 June 2009. D. Wijewickreme. 1 Department of Civil Engineering, The University of British Columbia, 6250 Applied Science Lane, Vancouver, BC V6T 1Z4, Canada. H. Karimian. BGC Engineering Inc, 500 – 1045 Howe Street, Vancouver, BC V6Z 2A9, Canada. D. Honegger. D.G. Honegger Consulting, 2690 Shetland Place, Arroyo Grande, CA 93420, USA. 1 Corresponding author (e-mail: [email protected]). 735 Can. Geotech. J. 46: 735–752 (2009) doi:10.1139/T09-019 Published by NRC Research Press
Transcript of Response of buried steel pipelines subjected to relative axial soil movement
Response of buried steel pipelines subjected torelative axial soil movement
Dharma Wijewickreme, Hamid Karimian, and Douglas Honegger
Abstract: The performance of buried steel pipelines subjected to relative soil movements in the axial direction was inves-tigated using full-scale pullout testing in a soil chamber. Measured axial soil loads from pullout testing of pipes buried inloose dry sand were comparable to those predicted using guidelines commonly used in practice. The peak values of axialpullout resistance observed on pipes buried in dense dry sand were several-fold (in excess of 2 times) higher than the pre-dictions from guidelines; the observed high axial pullout resistance is primarily due to a significant increase in normal soilstresses on the pipelines, resulting from constrained dilation of dense sand during interface shear deformations. This rea-soning was confirmed by direct measurement of soil stresses on pipes during full-scale testing and numerical modeling.The research findings herein suggest that the use of the coefficient of lateral earth pressure at-rest (K0) to compute axialsoil loads, employing equations recommended in common guidelines, should be undertaken with caution for pipes buriedin soils that are likely to experience significant shear-induced dilation.
Key words: buried pipelines, pipe–soil interaction, dilation, soil loading on pipes, interface friction.
Resume : La performance de tuyaux en acier enfouis soumis a des mouvements axiaux de sol a ete investiguee a l’aided’essais d’arrachement des tuyaux a l’echelle reelle dans une boıte de sol. Les charges axiales de sol mesurees dans les es-sais a l’echelle reelle effectues sur des tuyaux enfouis dans un sable sec non compacte etaient comparables a celles predi-tes en utilisant les directives usuelles. Dans le cas d’un sable dense, le pic de resistance axiale observe sur les tuyauxenfouis etait de plusieurs fois plus eleve (plus de deux fois) que les predictions provenant des directives. Ceci est principa-lement du a une augmentation significative des contraintes normales globales du sol sur les tuyaux en raison de la dilata-tion en milieu restreint du sable dense durant les deformations en cisaillement des interfaces. Cette explication a eteconfirmee par des mesures directes des contraintes du sol sur les tuyaux durant les essais a l’echelle reelle, en plus d’etresupportee par des modelisations numeriques. L’utilisation du coefficient de pression laterale des terres au repos (K0) pourrepresenter les contraintes du sol sur les tuyaux lors des essais d’arrachement, tel que recommande par les directives usuel-les, devrait etre faite avec precautions dans le cas de tuyaux enfouis dans des sols qui peuvent se dilater lors du cisaille-ment des interfaces.
Mots-cles : tuyaux enfouis, interaction tuyau–sol, dilatation, chargement du sol sur les tuyaux, friction a l’interface.
[Traduit par la Redaction]
IntroductionBuried pipeline systems form a key part of global lifeline
infrastructure and any significant disruption to the perform-ance of these systems often translates into undesirable im-pacts on regional businesses, economies or the livingconditions of citizens. One of the major risks to buried pipe-lines arises from permanent ground movements where highsoil loads can lead to potentially unacceptable strains in thepipelines. Common causes of permanent ground displace-ment are related to slope instability and ground subsidence,including earthquake-induced ground displacements.
Based on the direction of relative soil displacement withrespect to the pipe alignment, buried pipeline restraintsagainst soil movement can be categorized into four differentmodes: vertical uplift, vertical bearing, transverse (orhorizontal–lateral), and axial (or longitudinal). Effects aris-ing due to a combination of these modes are generally con-sidered in the evaluation of the response of buried pipelinessubjected to differential ground movements. This paper fo-cuses on the estimation of loads on the pipe due to relativeaxial soil movements.
Current understanding of the mobilized soil loads onpipes due to axial pipe restraint (or differential axial dis-placement between soil and pipe) is mainly based on soil–pipe interface parameters and an assumed failure mechanismof the soil. The commonly used approach for determinationof axial loads on pipes buried in cohesionless soils isthrough the use of a simple formula
½1� FA ¼ g 0H1þ K0
2
� �tanðdÞðpDLÞ
where FA is the axial soil load on the pipe (soil resistance),g ’ is the average effective unit weight of the soil, H is thedepth from the ground surface to the pipe centreline (spring
Received 30 November 2007. Accepted 9 February 2009.Published on the NRC Research Press Web site at cgj.nrc.ca on17 June 2009.
D. Wijewickreme.1 Department of Civil Engineering, TheUniversity of British Columbia, 6250 Applied Science Lane,Vancouver, BC V6T 1Z4, Canada.H. Karimian. BGC Engineering Inc, 500 – 1045 Howe Street,Vancouver, BC V6Z 2A9, Canada.D. Honegger. D.G. Honegger Consulting, 2690 Shetland Place,Arroyo Grande, CA 93420, USA.
1Corresponding author (e-mail: [email protected]).
735
Can. Geotech. J. 46: 735–752 (2009) doi:10.1139/T09-019 Published by NRC Research Press
line), K0 is the coefficient of lateral earth pressure at rest forthe soil, d is the interface angle of friction between the soiland pipeline, D is the external pipeline diameter, and L isthe buried pipeline length. This formula has been in wideuse in the design of pipeline systems, and Newmark andHall (1975) used this equation to calculate axial soil loadson pipes subjected to strike-slip fault movement. Moreover,the equation has been recommended for the computation ofaxial soil loads in ASCE (1984) and Honegger and Nyman(2004).
In using eq. [1], the values of the geometric parameters(H, D, and L) are known and the material parameters (g ’and d) can be assessed reasonably well using laboratory ex-perimentation (Karimian et al. 2006); arguably, the most un-certainty would arise in determining the term [(1+K0)/2]used to represent the normal stress on the pipeline. This[(1+K0)/2] term is based on the implied assumption that theaverage normal soil stress on the perimeter of pipe is equalto the arithmetic mean of the effective vertical overburdenstress (s 0v0) and lateral effective stress at-rest (s 0v0 ¼ K0s
0v0)
computed at the centreline level of the pipe (i.e., springline). Considering that the stress conditions s 0v0 and K0s
0v0
would ideally correspond to those in a semi-infinite soilmass under ‘‘at rest’’ (or zero lateral strain) condition, it isof importance to review the suitability of this assumption torepresent average stresses around a pipe. It is also importantto note that, during axial displacement, there is a tendencyfor shear-induced volumetric strains to occur in an annularshear soil zone adjacent to the pipe. The response of thesoil mass surrounding the shear zone to these volumechanges will very likely affect the normal soil stresses onthe pipe (i.e., dilation in the shear zone could increase thenormal stress on the pipe).
The approach in eq. [1] does not account for the above-noted potential changes to the normal stress and there is aneed to understand the normal soil stress distribution aroundthe pipe surface under ‘‘at-rest’’ condition as well as its var-iation during relative axial soil movement. Data from con-trolled experimental work on pipelines subjected to axialmovement, particularly conducted at a full-scale level, isneeded to advance this knowledge. Reported experimentalresearch on this subject is very limited (e.g., Trautmann andO’Rourke 1983; Paulin et al. 1998; Anderson et al. 2004).Most of the research testing to investigate axial soil loadsduring ground movement have been performed (by privateentities) for specific uses and the results are either not pub-lished and documented or they cannot be generalized toother conditions.
For these reasons, full-scale laboratory testing was under-taken to study the response of buried steel pipes subjected torelative axial movements, as a part of an overall researchprogram to study the response of buried pipelines subjectedto ground movement. Full-scale laboratory testing was con-ducted on relatively large diameter pipes buried in a soilchamber. The pipes were subjected to axial pullout with di-rect measurement of axial soil loads and soil pressures de-veloped on the pipe surface with respect to the pipedisplacement. This paper presents the results from these ex-periments and corresponding interpretations with supportfrom numerical modeling that was conducted to mimic the
effects of soil dilation in the annular shear zone during rela-tive axial soil movement.
Materials, experimental system, and testprogram
Testing system and methodologyA testing apparatus that was designed and constructed at
The University of British Columbia (UBC), Vancouver,B.C., to conduct full-scale physical modeling research onpipe–soil interaction problems (Anderson et al. 2004) wasmodified for the present testing work. The published experi-ence of the work performed at Cornell University (Traut-mann and O’Rourke 1983) and C-CORE (Paulin et al.1997) was considered in the design process. The apparatusallows investigation of the force–displacement behaviour ofburied pipeline configurations subjected to axial andhorizontal–lateral loadings. The details of the testing cham-ber, loading mechanisms, and data acquisition system aredescribed in detail in Anderson (2004), Anderson et al.(2004), and Karimian (2006), and only the main featuresare presented herein for brevity.
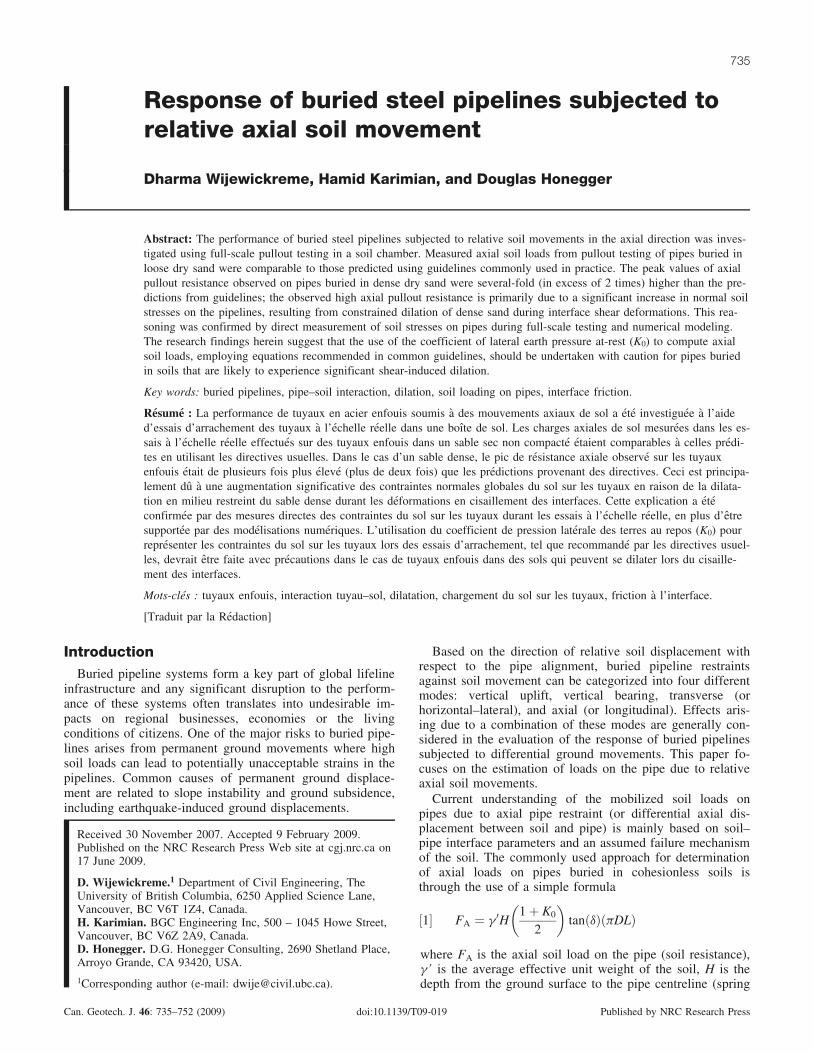
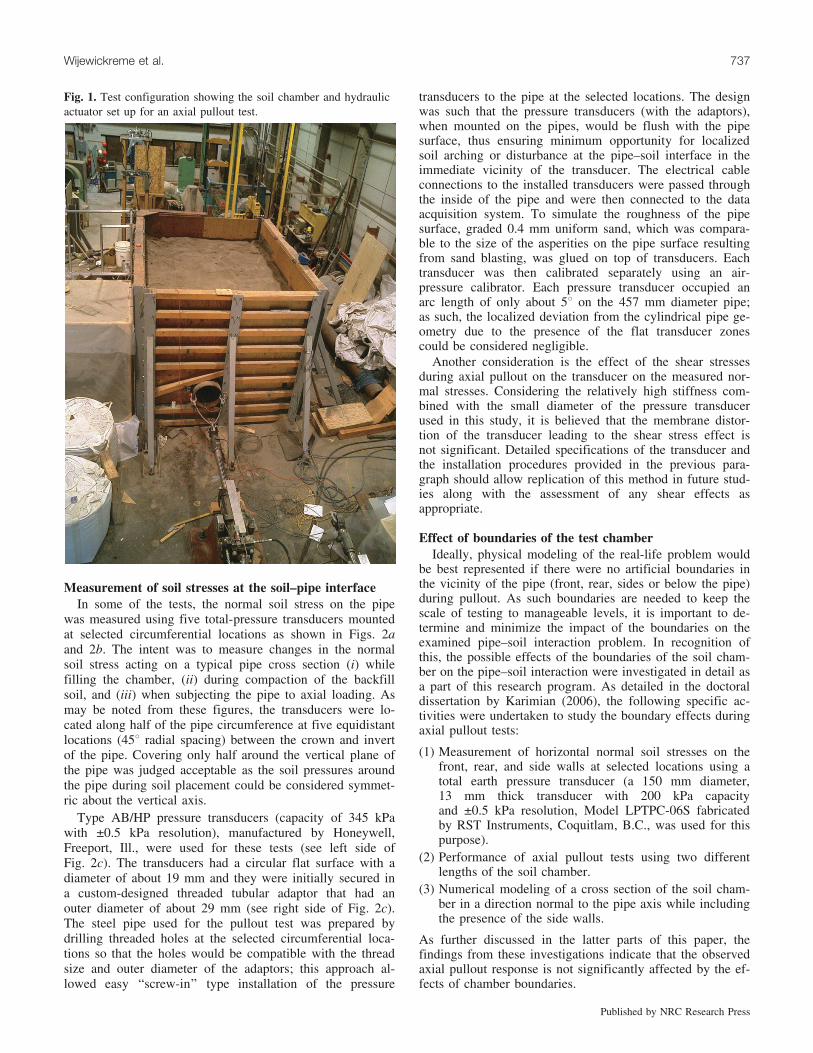
The test setup was mainly comprised of a 3.8 to 5.0 m(length) � 2.5 m (width) � 2.5 m (height) chamber, hy-draulic actuator, and a data acquisition system. A perspec-tive view of the soil chamber arranged for axial pullout isshown in Fig. 1. The pipe was buried in a given soil backfilland, for the tests considered in this study, the pipe axis wasaligned parallel to the longer direction of the chamber. Thelength of the pipeline test specimen was kept longer than thelength of the chamber so that the pipe extended throughboth ends of the soil chamber. This ensured a constant soil–pipe test length and also avoided soil disturbance at the backof the chamber during pullout. Relatively soft ‘‘foam gas-kets’’ were used at the soil chamber entry and exit locationsof the pipe to allow for free movement of the sand aroundthe pipe and to minimize frictional forces on the pipe atthese locations.
The buried pipe was then pulled from one end (referred toherein as the leading end) by a double-acting hydraulic ac-tuator while recording the resistance to axial pullout and theaxial displacement. A load cell, with a maximum load ca-pacity of 225 kN, was attached to the actuator and the pipethrough a shackle and cable to measure the pulling force.The actuator was mounted on a loading pedestal that wasbolted to the concrete strong-floor of the laboratory at a lo-cation separate from the soil chamber. Axial pipe displace-ments were measured relative to the strong-floor usingstring potentiometers passed through the inside of the pipe.All tests were performed at an ambient temperature of 20 ±1 8C.
In all test configurations, the pipe was loaded in a dis-placement-controlled manner. The displacement rate chosenfor the testing varied between 2 to 50 mm/s. Test results in-dicated that the loading rates selected had no noticeable ef-fect on the results. Other considerations that controlled theloading rates included the capacity of the hydraulic pumpsand costs related to the actuators. All measurements were re-corded at 10 samples per second, which was considered suit-able with respect to the rates used for axial pulloutdisplacements.
736 Can. Geotech. J. Vol. 46, 2009
Published by NRC Research Press
Measurement of soil stresses at the soil–pipe interfaceIn some of the tests, the normal soil stress on the pipe
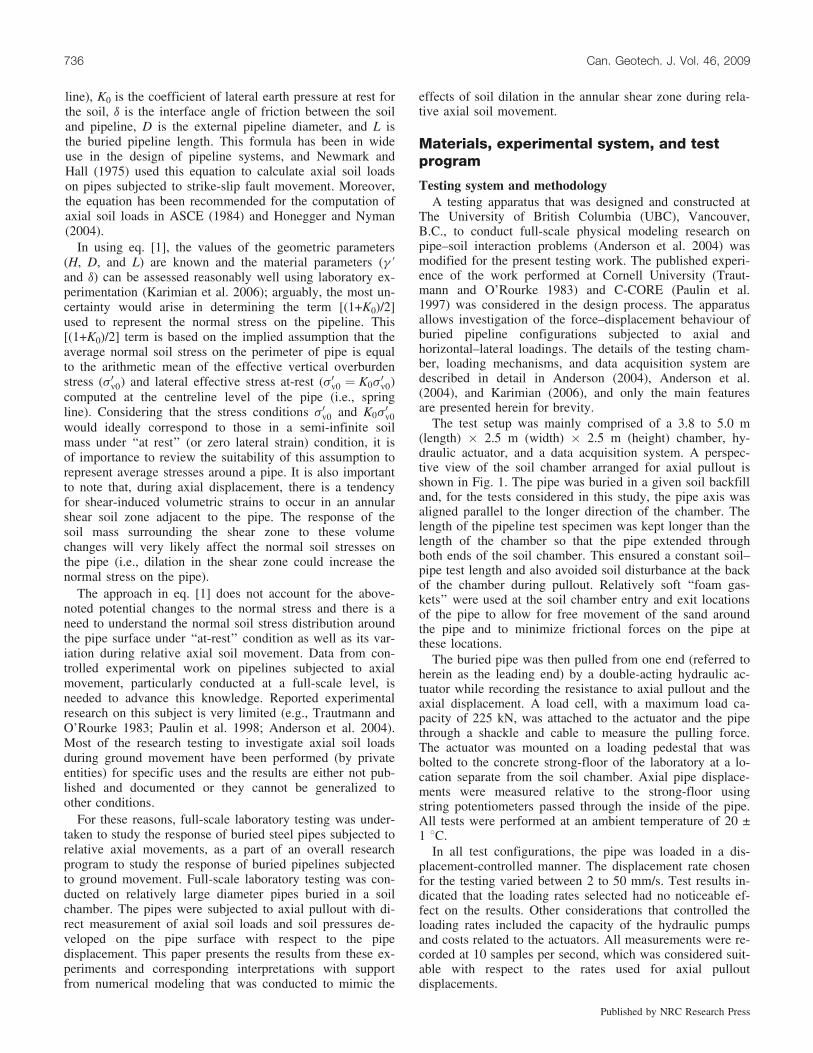
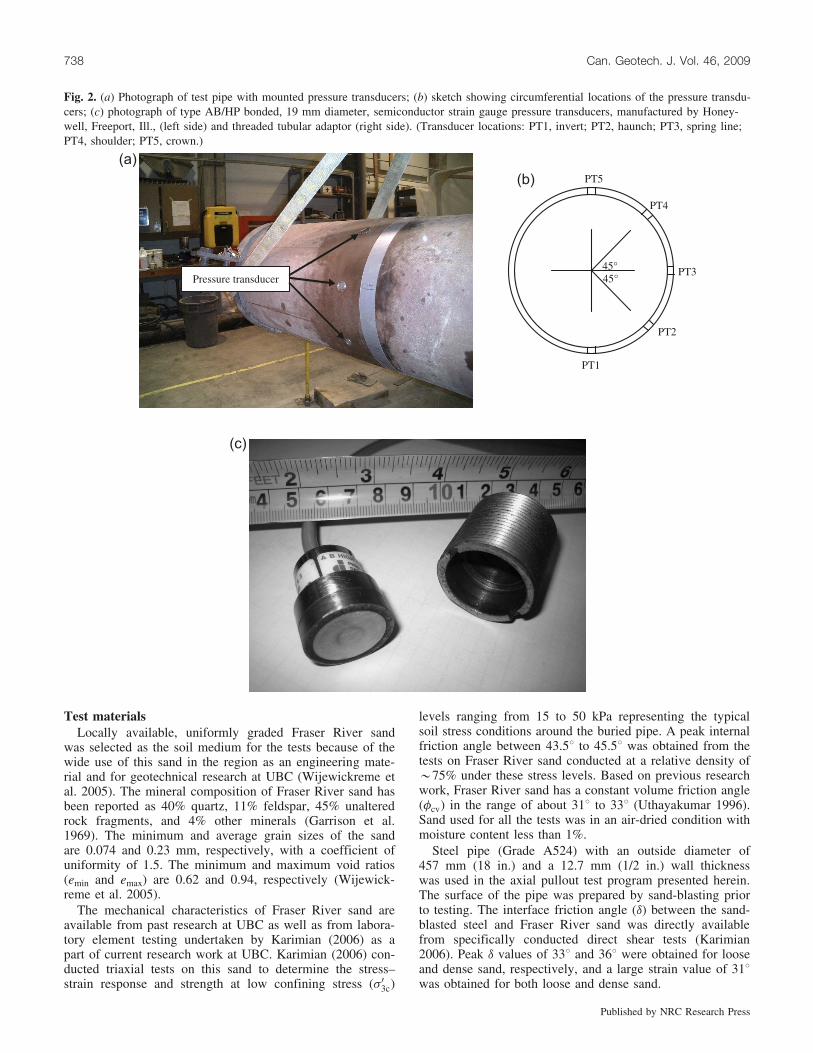
was measured using five total-pressure transducers mountedat selected circumferential locations as shown in Figs. 2aand 2b. The intent was to measure changes in the normalsoil stress acting on a typical pipe cross section (i) whilefilling the chamber, (ii) during compaction of the backfillsoil, and (iii) when subjecting the pipe to axial loading. Asmay be noted from these figures, the transducers were lo-cated along half of the pipe circumference at five equidistantlocations (458 radial spacing) between the crown and invertof the pipe. Covering only half around the vertical plane ofthe pipe was judged acceptable as the soil pressures aroundthe pipe during soil placement could be considered symmet-ric about the vertical axis.
Type AB/HP pressure transducers (capacity of 345 kPawith ±0.5 kPa resolution), manufactured by Honeywell,Freeport, Ill., were used for these tests (see left side ofFig. 2c). The transducers had a circular flat surface with adiameter of about 19 mm and they were initially secured ina custom-designed threaded tubular adaptor that had anouter diameter of about 29 mm (see right side of Fig. 2c).The steel pipe used for the pullout test was prepared bydrilling threaded holes at the selected circumferential loca-tions so that the holes would be compatible with the threadsize and outer diameter of the adaptors; this approach al-lowed easy ‘‘screw-in’’ type installation of the pressure
transducers to the pipe at the selected locations. The designwas such that the pressure transducers (with the adaptors),when mounted on the pipes, would be flush with the pipesurface, thus ensuring minimum opportunity for localizedsoil arching or disturbance at the pipe–soil interface in theimmediate vicinity of the transducer. The electrical cableconnections to the installed transducers were passed throughthe inside of the pipe and were then connected to the dataacquisition system. To simulate the roughness of the pipesurface, graded 0.4 mm uniform sand, which was compara-ble to the size of the asperities on the pipe surface resultingfrom sand blasting, was glued on top of transducers. Eachtransducer was then calibrated separately using an air-pressure calibrator. Each pressure transducer occupied anarc length of only about 58 on the 457 mm diameter pipe;as such, the localized deviation from the cylindrical pipe ge-ometry due to the presence of the flat transducer zonescould be considered negligible.
Another consideration is the effect of the shear stressesduring axial pullout on the transducer on the measured nor-mal stresses. Considering the relatively high stiffness com-bined with the small diameter of the pressure transducerused in this study, it is believed that the membrane distor-tion of the transducer leading to the shear stress effect isnot significant. Detailed specifications of the transducer andthe installation procedures provided in the previous para-graph should allow replication of this method in future stud-ies along with the assessment of any shear effects asappropriate.
Effect of boundaries of the test chamberIdeally, physical modeling of the real-life problem would
be best represented if there were no artificial boundaries inthe vicinity of the pipe (front, rear, sides or below the pipe)during pullout. As such boundaries are needed to keep thescale of testing to manageable levels, it is important to de-termine and minimize the impact of the boundaries on theexamined pipe–soil interaction problem. In recognition ofthis, the possible effects of the boundaries of the soil cham-ber on the pipe–soil interaction were investigated in detail asa part of this research program. As detailed in the doctoraldissertation by Karimian (2006), the following specific ac-tivities were undertaken to study the boundary effects duringaxial pullout tests:
(1) Measurement of horizontal normal soil stresses on thefront, rear, and side walls at selected locations using atotal earth pressure transducer (a 150 mm diameter,13 mm thick transducer with 200 kPa capacityand ±0.5 kPa resolution, Model LPTPC-06S fabricatedby RST Instruments, Coquitlam, B.C., was used for thispurpose).
(2) Performance of axial pullout tests using two differentlengths of the soil chamber.
(3) Numerical modeling of a cross section of the soil cham-ber in a direction normal to the pipe axis while includingthe presence of the side walls.
As further discussed in the latter parts of this paper, thefindings from these investigations indicate that the observedaxial pullout response is not significantly affected by the ef-fects of chamber boundaries.
Fig. 1. Test configuration showing the soil chamber and hydraulicactuator set up for an axial pullout test.
Wijewickreme et al. 737
Published by NRC Research Press
Test materialsLocally available, uniformly graded Fraser River sand
was selected as the soil medium for the tests because of thewide use of this sand in the region as an engineering mate-rial and for geotechnical research at UBC (Wijewickreme etal. 2005). The mineral composition of Fraser River sand hasbeen reported as 40% quartz, 11% feldspar, 45% unalteredrock fragments, and 4% other minerals (Garrison et al.1969). The minimum and average grain sizes of the sandare 0.074 and 0.23 mm, respectively, with a coefficient ofuniformity of 1.5. The minimum and maximum void ratios(emin and emax) are 0.62 and 0.94, respectively (Wijewick-reme et al. 2005).
The mechanical characteristics of Fraser River sand areavailable from past research at UBC as well as from labora-tory element testing undertaken by Karimian (2006) as apart of current research work at UBC. Karimian (2006) con-ducted triaxial tests on this sand to determine the stress–strain response and strength at low confining stress (s03c)
levels ranging from 15 to 50 kPa representing the typicalsoil stress conditions around the buried pipe. A peak internalfriction angle between 43.58 to 45.58 was obtained from thetests on Fraser River sand conducted at a relative density of*75% under these stress levels. Based on previous researchwork, Fraser River sand has a constant volume friction angle(fcv) in the range of about 318 to 338 (Uthayakumar 1996).Sand used for all the tests was in an air-dried condition withmoisture content less than 1%.
Steel pipe (Grade A524) with an outside diameter of457 mm (18 in.) and a 12.7 mm (1/2 in.) wall thicknesswas used in the axial pullout test program presented herein.The surface of the pipe was prepared by sand-blasting priorto testing. The interface friction angle (d) between the sand-blasted steel and Fraser River sand was directly availablefrom specifically conducted direct shear tests (Karimian2006). Peak d values of 338 and 368 were obtained for looseand dense sand, respectively, and a large strain value of 318was obtained for both loose and dense sand.
Fig. 2. (a) Photograph of test pipe with mounted pressure transducers; (b) sketch showing circumferential locations of the pressure transdu-cers; (c) photograph of type AB/HP bonded, 19 mm diameter, semiconductor strain gauge pressure transducers, manufactured by Honey-well, Freeport, Ill., (left side) and threaded tubular adaptor (right side). (Transducer locations: PT1, invert; PT2, haunch; PT3, spring line;PT4, shoulder; PT5, crown.)
738 Can. Geotech. J. Vol. 46, 2009
Published by NRC Research Press
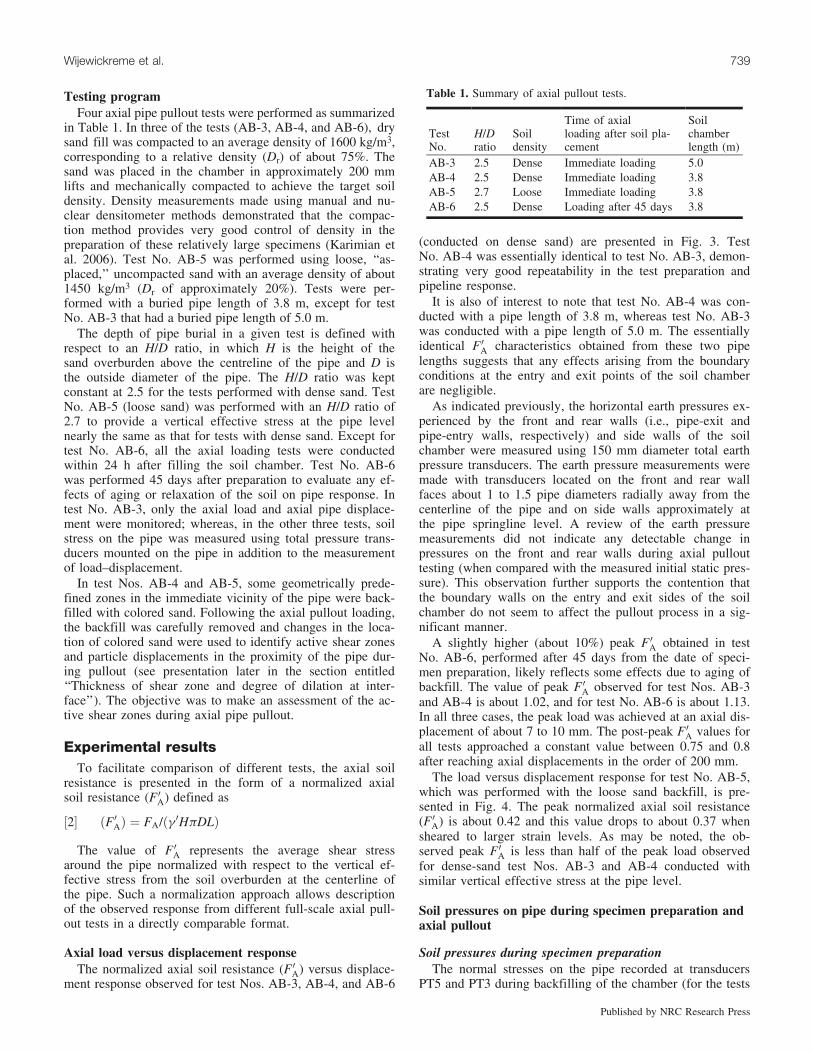
Testing programFour axial pipe pullout tests were performed as summarized
in Table 1. In three of the tests (AB-3, AB-4, and AB-6), drysand fill was compacted to an average density of 1600 kg/m3,corresponding to a relative density (Dr) of about 75%. Thesand was placed in the chamber in approximately 200 mmlifts and mechanically compacted to achieve the target soildensity. Density measurements made using manual and nu-clear densitometer methods demonstrated that the compac-tion method provides very good control of density in thepreparation of these relatively large specimens (Karimian etal. 2006). Test No. AB-5 was performed using loose, ‘‘as-placed,’’ uncompacted sand with an average density of about1450 kg/m3 (Dr of approximately 20%). Tests were per-formed with a buried pipe length of 3.8 m, except for testNo. AB-3 that had a buried pipe length of 5.0 m.
The depth of pipe burial in a given test is defined withrespect to an H/D ratio, in which H is the height of thesand overburden above the centreline of the pipe and D isthe outside diameter of the pipe. The H/D ratio was keptconstant at 2.5 for the tests performed with dense sand. TestNo. AB-5 (loose sand) was performed with an H/D ratio of2.7 to provide a vertical effective stress at the pipe levelnearly the same as that for tests with dense sand. Except fortest No. AB-6, all the axial loading tests were conductedwithin 24 h after filling the soil chamber. Test No. AB-6was performed 45 days after preparation to evaluate any ef-fects of aging or relaxation of the soil on pipe response. Intest No. AB-3, only the axial load and axial pipe displace-ment were monitored; whereas, in the other three tests, soilstress on the pipe was measured using total pressure trans-ducers mounted on the pipe in addition to the measurementof load–displacement.
In test Nos. AB-4 and AB-5, some geometrically prede-fined zones in the immediate vicinity of the pipe were back-filled with colored sand. Following the axial pullout loading,the backfill was carefully removed and changes in the loca-tion of colored sand were used to identify active shear zonesand particle displacements in the proximity of the pipe dur-ing pullout (see presentation later in the section entitled‘‘Thickness of shear zone and degree of dilation at inter-face’’). The objective was to make an assessment of the ac-tive shear zones during axial pipe pullout.
Experimental resultsTo facilitate comparison of different tests, the axial soil
resistance is presented in the form of a normalized axialsoil resistance (F 0A) defined as
½2� ðF0AÞ ¼ FA=ðg 0HpDLÞ
The value of F 0A represents the average shear stressaround the pipe normalized with respect to the vertical ef-fective stress from the soil overburden at the centerline ofthe pipe. Such a normalization approach allows descriptionof the observed response from different full-scale axial pull-out tests in a directly comparable format.
Axial load versus displacement responseThe normalized axial soil resistance (F0A) versus displace-
ment response observed for test Nos. AB-3, AB-4, and AB-6
(conducted on dense sand) are presented in Fig. 3. TestNo. AB-4 was essentially identical to test No. AB-3, demon-strating very good repeatability in the test preparation andpipeline response.
It is also of interest to note that test No. AB-4 was con-ducted with a pipe length of 3.8 m, whereas test No. AB-3was conducted with a pipe length of 5.0 m. The essentiallyidentical F0A characteristics obtained from these two pipelengths suggests that any effects arising from the boundaryconditions at the entry and exit points of the soil chamberare negligible.
As indicated previously, the horizontal earth pressures ex-perienced by the front and rear walls (i.e., pipe-exit andpipe-entry walls, respectively) and side walls of the soilchamber were measured using 150 mm diameter total earthpressure transducers. The earth pressure measurements weremade with transducers located on the front and rear wallfaces about 1 to 1.5 pipe diameters radially away from thecenterline of the pipe and on side walls approximately atthe pipe springline level. A review of the earth pressuremeasurements did not indicate any detectable change inpressures on the front and rear walls during axial pullouttesting (when compared with the measured initial static pres-sure). This observation further supports the contention thatthe boundary walls on the entry and exit sides of the soilchamber do not seem to affect the pullout process in a sig-nificant manner.
A slightly higher (about 10%) peak F 0A obtained in testNo. AB-6, performed after 45 days from the date of speci-men preparation, likely reflects some effects due to aging ofbackfill. The value of peak F 0A observed for test Nos. AB-3and AB-4 is about 1.02, and for test No. AB-6 is about 1.13.In all three cases, the peak load was achieved at an axial dis-placement of about 7 to 10 mm. The post-peak F 0A values forall tests approached a constant value between 0.75 and 0.8after reaching axial displacements in the order of 200 mm.
The load versus displacement response for test No. AB-5,which was performed with the loose sand backfill, is pre-sented in Fig. 4. The peak normalized axial soil resistance(F0A) is about 0.42 and this value drops to about 0.37 whensheared to larger strain levels. As may be noted, the ob-served peak F0A is less than half of the peak load observedfor dense-sand test Nos. AB-3 and AB-4 conducted withsimilar vertical effective stress at the pipe level.
Soil pressures on pipe during specimen preparation andaxial pullout
Soil pressures during specimen preparationThe normal stresses on the pipe recorded at transducers
PT5 and PT3 during backfilling of the chamber (for the tests
Table 1. Summary of axial pullout tests.
TestNo.
H/Dratio
Soildensity
Time of axialloading after soil pla-cement
Soilchamberlength (m)
AB-3 2.5 Dense Immediate loading 5.0AB-4 2.5 Dense Immediate loading 3.8AB-5 2.7 Loose Immediate loading 3.8AB-6 2.5 Dense Loading after 45 days 3.8
Wijewickreme et al. 739
Published by NRC Research Press

Nos. AB-4 through AB-6) are plotted with respect to the es-timated vertical effective overburden stress (s 0v0) at the samelocations, in Figs. 5 and 6, respectively (see Fig. 2 for theradial position of different pressure transducers on thepipe). The vertical effective stresses at the two transducerlocations were estimated using the average density of thebackfill soil. As may be noted, the measured vertical stresson the pipe at PT5 (crown of the pipe) is slightly higherthan the estimated overburden effective stress. This observa-tion is in accord with the vertical stresses computed using:(i) the concept of vertical arching factor (VAF) recom-mended for estimating vertical soil stresses on concretepipes as per Standard specifications for highway bridges(AASHTO 1996) and (ii) Fast Lagrangian analysis of con-
tinua (FLAC) 2D (Itasca Consulting Group Inc. 2005) anal-yses conducted as a part of this study (see ‘‘Numericalmodeling’’ section). As detailed in AASHTO (1996), in thepresence of a relatively rigid pipe, the vertical stress at thepipe location can be higher than the ‘‘free field’’ overburdenstress because of the attraction of more load to the relativelymore stiff area in the vicinity of the pipe.
The measured horizontal stress from PT3 for the case ofdense sand specimens (test Nos. AB-4 and AB-6, Fig. 6),was noted to be clearly higher than that obtained for theloosely prepared specimen (test No. AB-5), especially underlow stress levels. It was also observed that the ratio betweenlateral and vertical stress decreases with increasing verticalstress for both dense and loose soil conditions. However,
Fig. 3. Load–displacement response during axial pullout in dense sand (test Nos. AB-3, AB-4, and AB-6).
Fig. 4. Load–displacement response during axial pullout in loose sand (test No. AB-5).
740 Can. Geotech. J. Vol. 46, 2009
Published by NRC Research Press
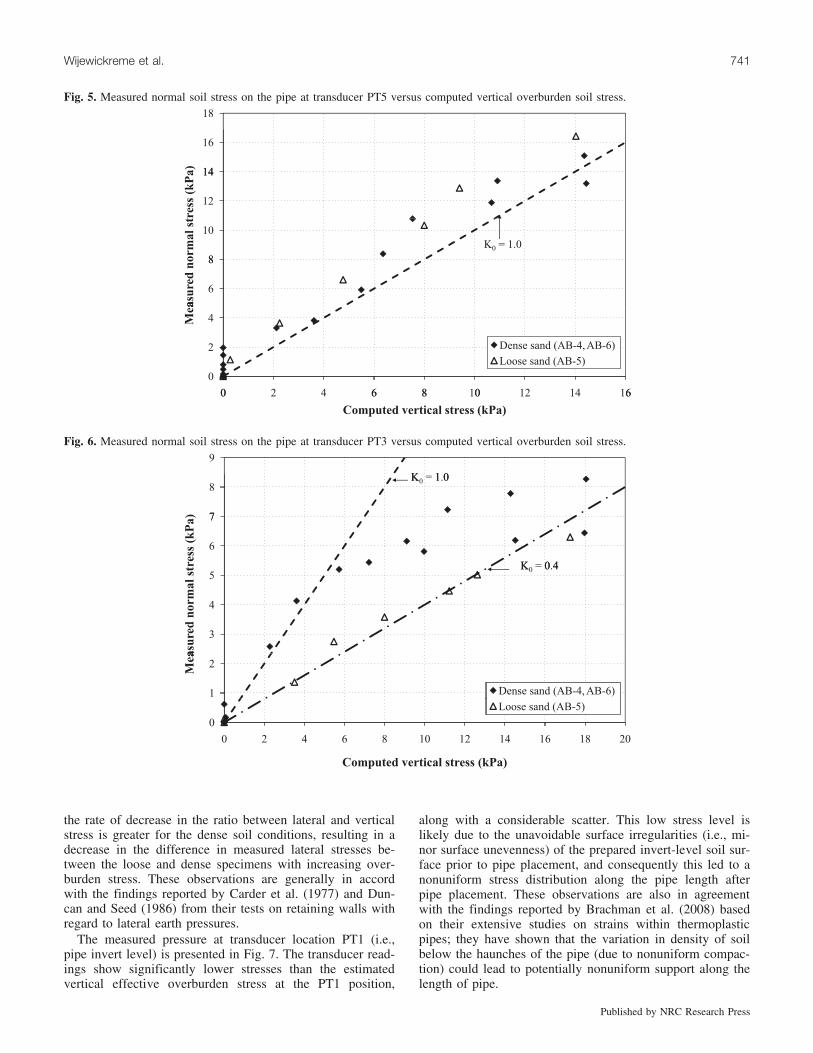
the rate of decrease in the ratio between lateral and verticalstress is greater for the dense soil conditions, resulting in adecrease in the difference in measured lateral stresses be-tween the loose and dense specimens with increasing over-burden stress. These observations are generally in accordwith the findings reported by Carder et al. (1977) and Dun-can and Seed (1986) from their tests on retaining walls withregard to lateral earth pressures.
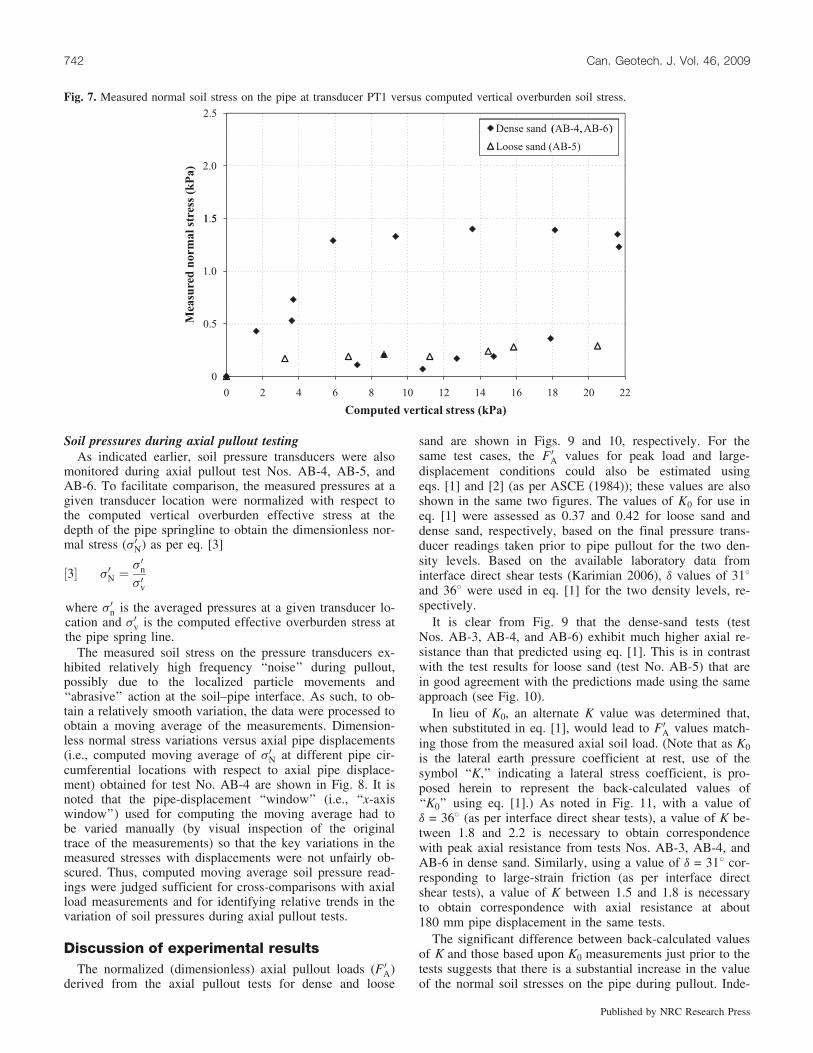
The measured pressure at transducer location PT1 (i.e.,pipe invert level) is presented in Fig. 7. The transducer read-ings show significantly lower stresses than the estimatedvertical effective overburden stress at the PT1 position,
along with a considerable scatter. This low stress level islikely due to the unavoidable surface irregularities (i.e., mi-nor surface unevenness) of the prepared invert-level soil sur-face prior to pipe placement, and consequently this led to anonuniform stress distribution along the pipe length afterpipe placement. These observations are also in agreementwith the findings reported by Brachman et al. (2008) basedon their extensive studies on strains within thermoplasticpipes; they have shown that the variation in density of soilbelow the haunches of the pipe (due to nonuniform compac-tion) could lead to potentially nonuniform support along thelength of pipe.
Fig. 5. Measured normal soil stress on the pipe at transducer PT5 versus computed vertical overburden soil stress.
Fig. 6. Measured normal soil stress on the pipe at transducer PT3 versus computed vertical overburden soil stress.
Wijewickreme et al. 741
Published by NRC Research Press
Soil pressures during axial pullout testingAs indicated earlier, soil pressure transducers were also
monitored during axial pullout test Nos. AB-4, AB-5, andAB-6. To facilitate comparison, the measured pressures at agiven transducer location were normalized with respect tothe computed vertical overburden effective stress at thedepth of the pipe springline to obtain the dimensionless nor-mal stress (s 0N) as per eq. [3]
½3� s0N ¼s 0ns 0v
where s 0n is the averaged pressures at a given transducer lo-cation and s 0v is the computed effective overburden stress atthe pipe spring line.
The measured soil stress on the pressure transducers ex-hibited relatively high frequency ‘‘noise’’ during pullout,possibly due to the localized particle movements and‘‘abrasive’’ action at the soil–pipe interface. As such, to ob-tain a relatively smooth variation, the data were processed toobtain a moving average of the measurements. Dimension-less normal stress variations versus axial pipe displacements(i.e., computed moving average of s 0N at different pipe cir-cumferential locations with respect to axial pipe displace-ment) obtained for test No. AB-4 are shown in Fig. 8. It isnoted that the pipe-displacement ‘‘window’’ (i.e., ‘‘x-axiswindow’’) used for computing the moving average had tobe varied manually (by visual inspection of the originaltrace of the measurements) so that the key variations in themeasured stresses with displacements were not unfairly ob-scured. Thus, computed moving average soil pressure read-ings were judged sufficient for cross-comparisons with axialload measurements and for identifying relative trends in thevariation of soil pressures during axial pullout tests.
Discussion of experimental resultsThe normalized (dimensionless) axial pullout loads (F 0A)
derived from the axial pullout tests for dense and loose
sand are shown in Figs. 9 and 10, respectively. For thesame test cases, the F 0A values for peak load and large-displacement conditions could also be estimated usingeqs. [1] and [2] (as per ASCE (1984)); these values are alsoshown in the same two figures. The values of 0 for use ineq. [1] were assessed as 0.37 and 0.42 for loose sand anddense sand, respectively, based on the final pressure trans-ducer readings taken prior to pipe pullout for the two den-sity levels. Based on the available laboratory data frominterface direct shear tests (Karimian 2006), d values of 318and 368 were used in eq. [1] for the two density levels, re-spectively.
It is clear from Fig. 9 that the dense-sand tests (testNos. AB-3, AB-4, and AB-6) exhibit much higher axial re-sistance than that predicted using eq. [1]. This is in contrastwith the test results for loose sand (test No. AB-5) that arein good agreement with the predictions made using the sameapproach (see Fig. 10).
In lieu of K0, an alternate K value was determined that,when substituted in eq. [1], would lead to F0A values match-ing those from the measured axial soil load. (Note that as K0is the lateral earth pressure coefficient at rest, use of thesymbol ‘‘K,’’ indicating a lateral stress coefficient, is pro-posed herein to represent the back-calculated values of‘‘K0’’ using eq. [1].) As noted in Fig. 11, with a value ofd = 368 (as per interface direct shear tests), a value of K be-tween 1.8 and 2.2 is necessary to obtain correspondencewith peak axial resistance from tests Nos. AB-3, AB-4, andAB-6 in dense sand. Similarly, using a value of d = 318 cor-responding to large-strain friction (as per interface directshear tests), a value of K between 1.5 and 1.8 is necessaryto obtain correspondence with axial resistance at about180 mm pipe displacement in the same tests.
The significant difference between back-calculated valuesof and those based upon K0 measurements just prior to thetests suggests that there is a substantial increase in the valueof the normal soil stresses on the pipe during pullout. Inde-
Fig. 7. Measured normal soil stress on the pipe at transducer PT1 versus computed vertical overburden soil stress.
742 Can. Geotech. J. Vol. 46, 2009
Published by NRC Research Press
K
K
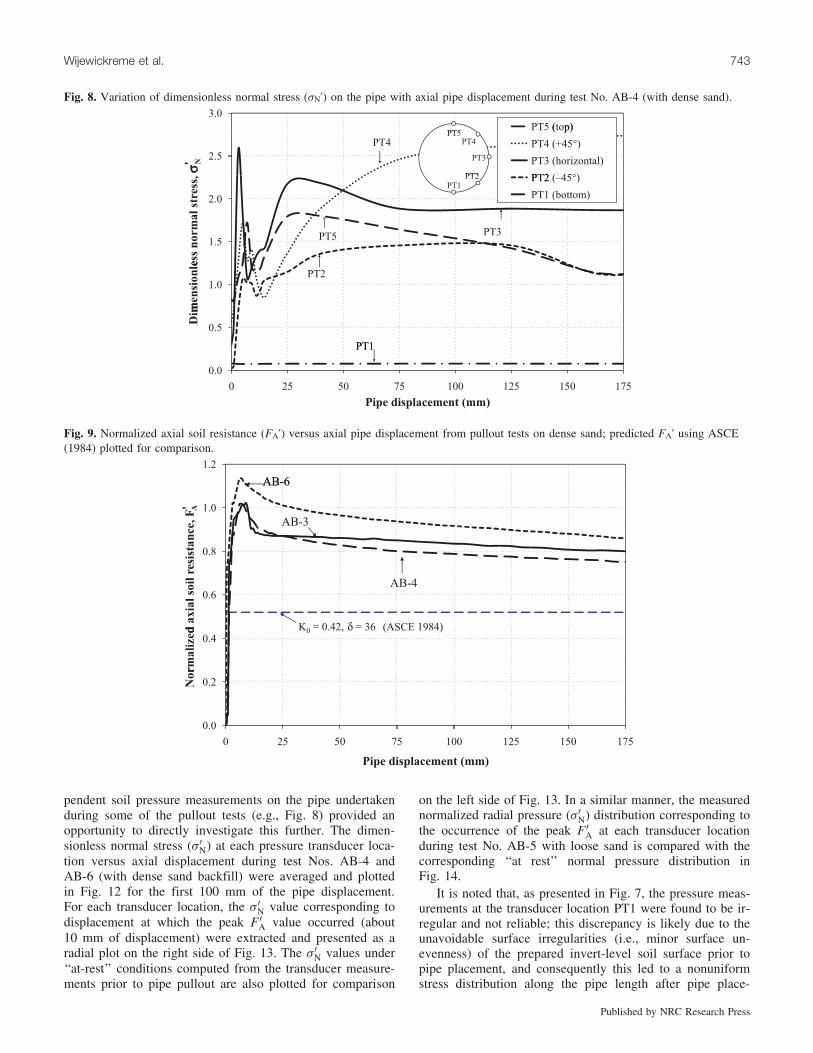
pendent soil pressure measurements on the pipe undertakenduring some of the pullout tests (e.g., Fig. 8) provided anopportunity to directly investigate this further. The dimen-sionless normal stress (s0N) at each pressure transducer loca-tion versus axial displacement during test Nos. AB-4 andAB-6 (with dense sand backfill) were averaged and plottedin Fig. 12 for the first 100 mm of the pipe displacement.For each transducer location, the s 0N value corresponding todisplacement at which the peak F 0A value occurred (about10 mm of displacement) were extracted and presented as aradial plot on the right side of Fig. 13. The s 0N values under‘‘at-rest’’ conditions computed from the transducer measure-ments prior to pipe pullout are also plotted for comparison
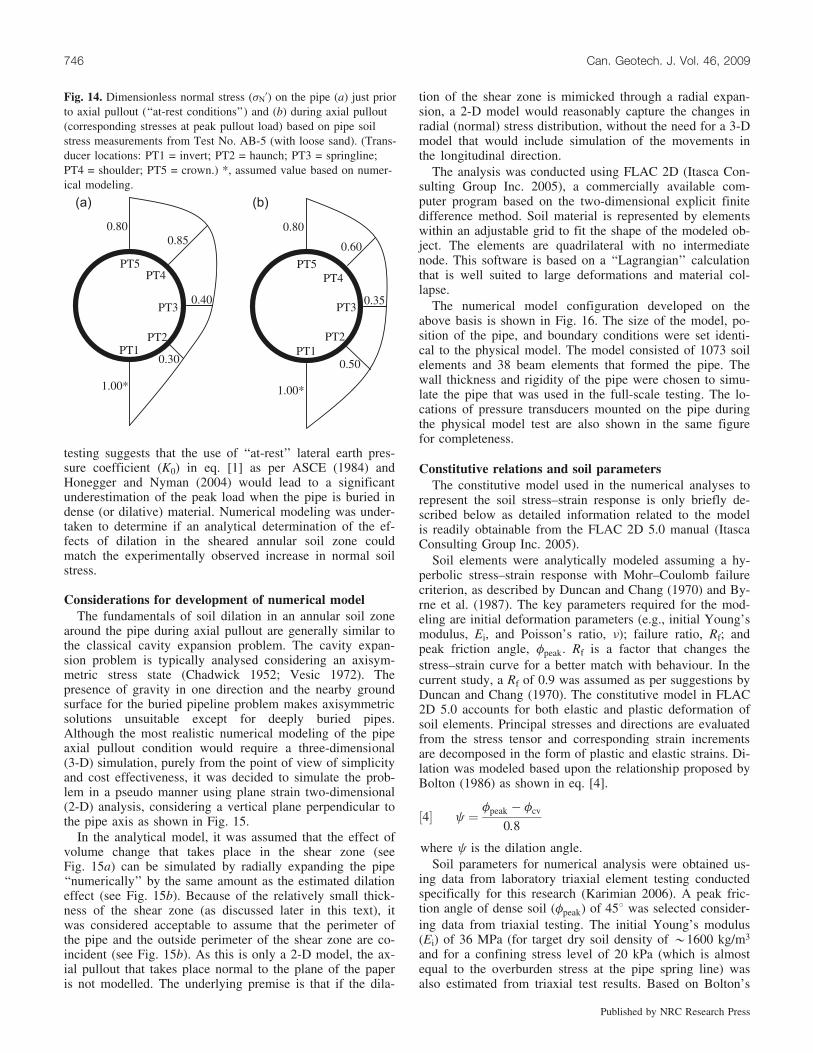
on the left side of Fig. 13. In a similar manner, the measurednormalized radial pressure (s 0N) distribution corresponding tothe occurrence of the peak F 0A at each transducer locationduring test No. AB-5 with loose sand is compared with thecorresponding ‘‘at rest’’ normal pressure distribution inFig. 14.
It is noted that, as presented in Fig. 7, the pressure meas-urements at the transducer location PT1 were found to be ir-regular and not reliable; this discrepancy is likely due to theunavoidable surface irregularities (i.e., minor surface un-evenness) of the prepared invert-level soil surface prior topipe placement, and consequently this led to a nonuniformstress distribution along the pipe length after pipe place-
Fig. 8. Variation of dimensionless normal stress (sN’) on the pipe with axial pipe displacement during test No. AB-4 (with dense sand).
Fig. 9. Normalized axial soil resistance (FA’) versus axial pipe displacement from pullout tests on dense sand; predicted FA’ using ASCE(1984) plotted for comparison.
Wijewickreme et al. 743
Published by NRC Research Press

ment. Therefore, for the purpose of completing the s 0N distri-butions presented in Figs. 13 and 14 over the full perimeterof pipe, it was judged reasonable to use the s 0N value for thelocation PT1 as the value of *1.0 estimated using the re-sults of numerical analyses of this study (see next section‘‘Numerical modeling’’).
It is clear from Fig. 13 that the average normal stresses onthe pipe during pullout in tests with dense sand are signifi-cantly higher in comparison to the ‘‘at-rest’’ values. As maybe noted, the largest stress increase appears to have occurredat the spring line, whereas the s 0N distribution on the pipeduring pullout in test No. AB-5 conducted in loose sand
(Fig. 14) did not change significantly from those observedunder ‘‘at-rest’’ conditions.
The term (1+ )/2 in eq. [1] represents an average s0Nvalue over the perimeter of the pipe; therefore, it shouldalso be possible to back-calculate the value of K, by averag-ing s 0N distributions obtained from soil stress measurementson the pipe for tests in dense and loose sand presented inFigs. 13 and 14, respectively. Alternatively, the values of Kcan also be assessed from eq. [1] using the measured axialloads for the tests in dense and loose sands as described pre-viously. The values of K determined using these two ap-proaches are compared in the second and third columns,
Fig. 10. Normalized axial soil resistance (FA’) versus axial pipe displacement from pullout test on loose sand; predicted FA’ using ASCE(1984) plotted for comparison.
Fig. 11. Normalized axial soil resistance (FA’) versus axial pipe displacement from pullout tests on dense sand; predicted FA’ using ASCE(1984) formula for different K values plotted for comparison.
744 Can. Geotech. J. Vol. 46, 2009
Published by NRC Research Press
K
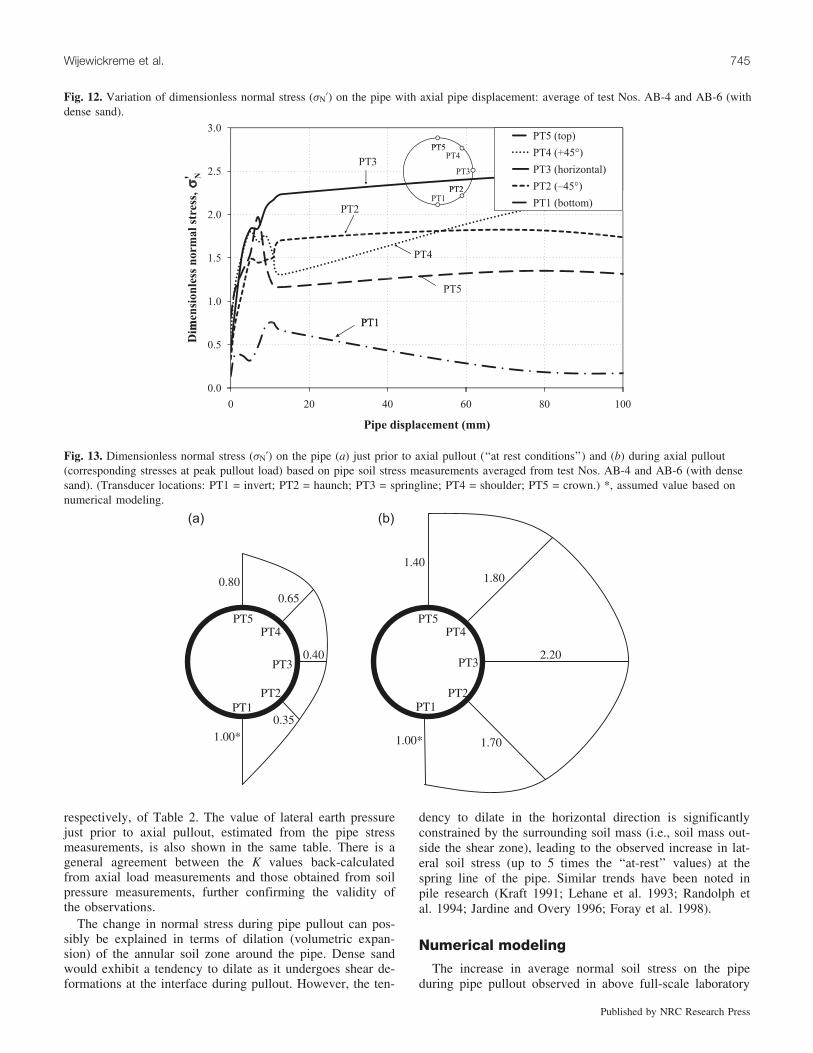
respectively, of Table 2. The value of lateral earth pressurejust prior to axial pullout, estimated from the pipe stressmeasurements, is also shown in the same table. There is ageneral agreement between the K values back-calculatedfrom axial load measurements and those obtained from soilpressure measurements, further confirming the validity ofthe observations.
The change in normal stress during pipe pullout can pos-sibly be explained in terms of dilation (volumetric expan-sion) of the annular soil zone around the pipe. Dense sandwould exhibit a tendency to dilate as it undergoes shear de-formations at the interface during pullout. However, the ten-
dency to dilate in the horizontal direction is significantlyconstrained by the surrounding soil mass (i.e., soil mass out-side the shear zone), leading to the observed increase in lat-eral soil stress (up to 5 times the ‘‘at-rest’’ values) at thespring line of the pipe. Similar trends have been noted inpile research (Kraft 1991; Lehane et al. 1993; Randolph etal. 1994; Jardine and Overy 1996; Foray et al. 1998).
Numerical modeling
The increase in average normal soil stress on the pipeduring pipe pullout observed in above full-scale laboratory
Fig. 12. Variation of dimensionless normal stress (sN’) on the pipe with axial pipe displacement: average of test Nos. AB-4 and AB-6 (withdense sand).
Fig. 13. Dimensionless normal stress (sN’) on the pipe (a) just prior to axial pullout (‘‘at rest conditions’’) and (b) during axial pullout(corresponding stresses at peak pullout load) based on pipe soil stress measurements averaged from test Nos. AB-4 and AB-6 (with densesand). (Transducer locations: PT1 = invert; PT2 = haunch; PT3 = springline; PT4 = shoulder; PT5 = crown.) *, assumed value based onnumerical modeling.
Wijewickreme et al. 745
Published by NRC Research Press
testing suggests that the use of ‘‘at-rest’’ lateral earth pres-sure coefficient (K0) in eq. [1] as per ASCE (1984) andHonegger and Nyman (2004) would lead to a significantunderestimation of the peak load when the pipe is buried indense (or dilative) material. Numerical modeling was under-taken to determine if an analytical determination of the ef-fects of dilation in the sheared annular soil zone couldmatch the experimentally observed increase in normal soilstress.
Considerations for development of numerical modelThe fundamentals of soil dilation in an annular soil zone
around the pipe during axial pullout are generally similar tothe classical cavity expansion problem. The cavity expan-sion problem is typically analysed considering an axisym-metric stress state (Chadwick 1952; Vesic 1972). Thepresence of gravity in one direction and the nearby groundsurface for the buried pipeline problem makes axisymmetricsolutions unsuitable except for deeply buried pipes.Although the most realistic numerical modeling of the pipeaxial pullout condition would require a three-dimensional(3-D) simulation, purely from the point of view of simplicityand cost effectiveness, it was decided to simulate the prob-lem in a pseudo manner using plane strain two-dimensional(2-D) analysis, considering a vertical plane perpendicular tothe pipe axis as shown in Fig. 15.
In the analytical model, it was assumed that the effect ofvolume change that takes place in the shear zone (seeFig. 15a) can be simulated by radially expanding the pipe‘‘numerically’’ by the same amount as the estimated dilationeffect (see Fig. 15b). Because of the relatively small thick-ness of the shear zone (as discussed later in this text), itwas considered acceptable to assume that the perimeter ofthe pipe and the outside perimeter of the shear zone are co-incident (see Fig. 15b). As this is only a 2-D model, the ax-ial pullout that takes place normal to the plane of the paperis not modelled. The underlying premise is that if the dila-
tion of the shear zone is mimicked through a radial expan-sion, a 2-D model would reasonably capture the changes inradial (normal) stress distribution, without the need for a 3-Dmodel that would include simulation of the movements inthe longitudinal direction.
The analysis was conducted using FLAC 2D (Itasca Con-sulting Group Inc. 2005), a commercially available com-puter program based on the two-dimensional explicit finitedifference method. Soil material is represented by elementswithin an adjustable grid to fit the shape of the modeled ob-ject. The elements are quadrilateral with no intermediatenode. This software is based on a ‘‘Lagrangian’’ calculationthat is well suited to large deformations and material col-lapse.
The numerical model configuration developed on theabove basis is shown in Fig. 16. The size of the model, po-sition of the pipe, and boundary conditions were set identi-cal to the physical model. The model consisted of 1073 soilelements and 38 beam elements that formed the pipe. Thewall thickness and rigidity of the pipe were chosen to simu-late the pipe that was used in the full-scale testing. The lo-cations of pressure transducers mounted on the pipe duringthe physical model test are also shown in the same figurefor completeness.
Constitutive relations and soil parametersThe constitutive model used in the numerical analyses to
represent the soil stress–strain response is only briefly de-scribed below as detailed information related to the modelis readily obtainable from the FLAC 2D 5.0 manual (ItascaConsulting Group Inc. 2005).
Soil elements were analytically modeled assuming a hy-perbolic stress–strain response with Mohr–Coulomb failurecriterion, as described by Duncan and Chang (1970) and By-rne et al. (1987). The key parameters required for the mod-eling are initial deformation parameters (e.g., initial Young’smodulus, Ei, and Poisson’s ratio, n); failure ratio, Rf; andpeak friction angle, fpeak. Rf is a factor that changes thestress–strain curve for a better match with behaviour. In thecurrent study, a Rf of 0.9 was assumed as per suggestions byDuncan and Chang (1970). The constitutive model in FLAC2D 5.0 accounts for both elastic and plastic deformation ofsoil elements. Principal stresses and directions are evaluatedfrom the stress tensor and corresponding strain incrementsare decomposed in the form of plastic and elastic strains. Di-lation was modeled based upon the relationship proposed byBolton (1986) as shown in eq. [4].
½4� j ¼fpeak � fcv
0:8
where j is the dilation angle.Soil parameters for numerical analysis were obtained us-
ing data from laboratory triaxial element testing conductedspecifically for this research (Karimian 2006). A peak fric-tion angle of dense soil (fpeak) of 458 was selected consider-ing data from triaxial testing. The initial Young’s modulus(Ei) of 36 MPa (for target dry soil density of *1600 kg/m3
and for a confining stress level of 20 kPa (which is almostequal to the overburden stress at the pipe spring line) wasalso estimated from triaxial test results. Based on Bolton’s
Fig. 14. Dimensionless normal stress (sN’) on the pipe (a) just priorto axial pullout (‘‘at-rest conditions’’) and (b) during axial pullout(corresponding stresses at peak pullout load) based on pipe soilstress measurements from Test No. AB-5 (with loose sand). (Trans-ducer locations: PT1 = invert; PT2 = haunch; PT3 = springline;PT4 = shoulder; PT5 = crown.) *, assumed value based on numer-ical modeling.
746 Can. Geotech. J. Vol. 46, 2009
Published by NRC Research Press

relationship and considering a fcv of 338, the dilation angleof Fraser River dense sand is calculated to be about 158. Itwas assumed that the Poisson’s ratio (n) is constant and hasa value of 0.3.
Unbonded interface elements with Coulomb shear-strength criterion as per eq. [5] were used to model the in-terface between the pipe and soil during radial expansion ofthe pipe.
½5� Fsmax ¼ clþ Fn tanðdÞ
where Fsmax is the shear force at the pipe–soil interface, c isthe cohesion (in stress units) along the interface, l is the ef-fective contact length along pipe, and Fn is the normal forceon the interface. In the current model, because cohesionlessmaterial is considered, Fsmax is only a function of interfacefriction and normal stress. The overall objective was to se-lect a model that represents the soil–pipe system within ac-ceptable error, yet is simple to use with parameters that areeasily obtainable from simple laboratory tests. As indicatedearlier, the peak and large-strain friction angle at the pipe–sand interface was estimated to be 368 and 318, respectively.A constant interface friction angle value of 318 was selectedfor numerical analysis in this study. Sensitivity analyses in-dicated that variations in the interface friction angle from318 to 368 have no significant effect.
Thickness of shear zone and degree of dilation at interfaceOne of the critical parameters for the proposed numerical
modeling is the anticipated expansion of the annular shearzone around the pipe during pullout (see Fig. 15) in densesand. Roscoe (1970) and Bridgewater (1980) suggested thatthe thickness of the actively sheared zone in a direct-shearmode of straining is about 10 times the mean particle size(d50); this was supported later by observations via the ra-diography method by Scarpelli and Wood (1982). Based onmicro-scale particle image velocimetry (PIV) observations,DeJong et al. (2006) observed that shear deformation andvolume change is concentrated within a shear band with athickness of 5–7 particle diameters adjacent to the interface.Accordingly, the thickness of the shear zone for FraserRiver sand that has a d50 of 0.23 mm can be estimated tobe in the order of 1 to 2.3 mm. Based on careful measure-ments of the movement of colored sand zones placed in thevicinity of the pipe during axial loading for sand-blastedsteel pipes as well as polyethylene (PE) pipes, which wasconducted as a part of the study presented herein, Karimian(2006) observed that only a small annular zone of about 1.2to 2.8 mm in thickness is being sheared actively during pipepullout (see Fig. 17 for an example); this compares wellwith the estimated shear zone thickness as per Scarpelli andWood (1982) and DeJong et al. (2006). Observations during
Table 2. Comparison of K values back-calculated from soil pressure measurements, axial load measure-ments, and numerical modeling.
Test backfilldensity
K derived from sN’estimated from soilpressure measure-ments on pipe
K back-calculatedfrom axial load mea-surements on pipe(using eq. [1])
K based onnumericalanalysis usingFLAC 2D
Coefficient of lateralsoil pressure on pipespringline prior topullout
Dense sand 2.4 (Fig. 13) 1.8 to 2.2 (Fig. 11) 1.9 to 2.2 0.42Loose sand 0.23 (Fig. 14) 0.37 (Fig. 10) N/A 0.37
Fig. 15. Configurations considered in modeling the effect of dilation on soil loads on pipe during axial pullout tests. (a) Size of annularshear zone before and after dilation; (b) expansion of pipe to mimic dilation effects in a simplified manner during numerical modeling.
Wijewickreme et al. 747
Published by NRC Research Press
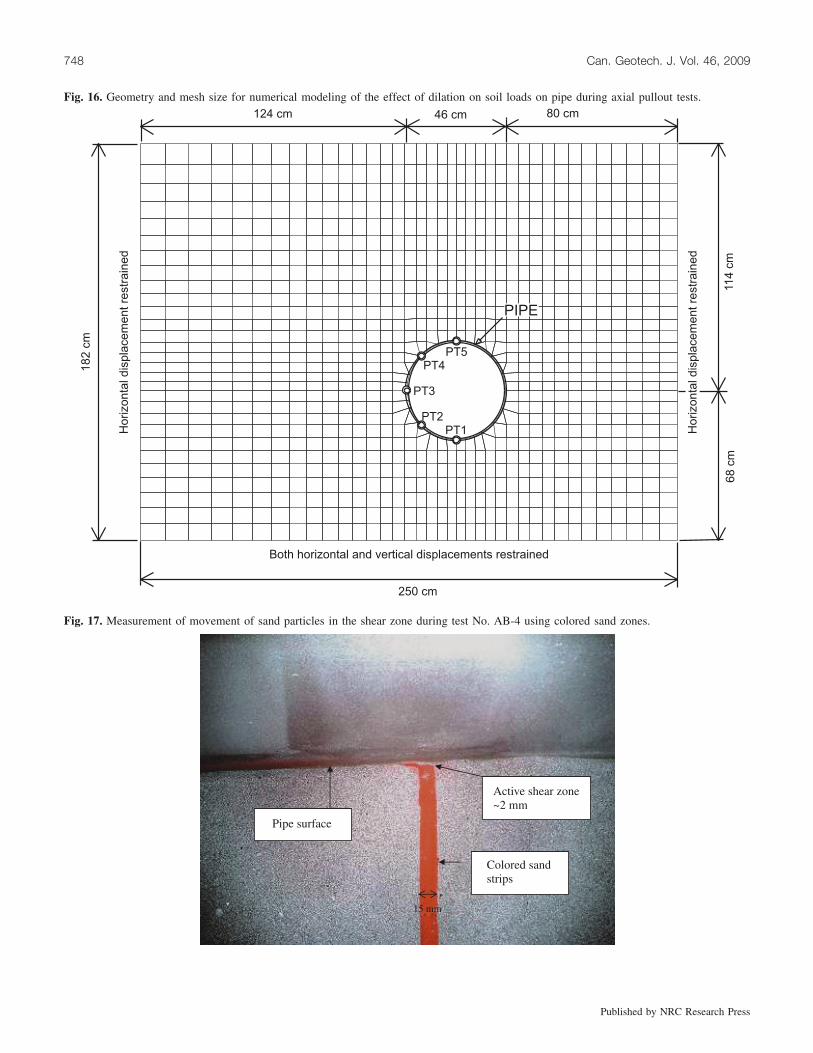
Fig. 16. Geometry and mesh size for numerical modeling of the effect of dilation on soil loads on pipe during axial pullout tests.
Fig. 17. Measurement of movement of sand particles in the shear zone during test No. AB-4 using colored sand zones.
748 Can. Geotech. J. Vol. 46, 2009
Published by NRC Research Press
direct shear tests of Fraser River sand were also available toassess the level of dilation when sheared up to the constant-volume phase. In this regard, the direct shear tests on com-pacted sand with an initial average relative density of 75%indicated that the average vertical deformation is about0.72 mm, which is almost 30% of the above-estimated thick-ness of the active shear zone (2.3 mm). With this back-ground, it was considered reasonable to assume a radialdilation of 0.7 to 1 mm at the interface for the purpose ofnumerical modeling.
Model validationThe measured normal stresses on the pipe at the locations
of the pressure transducers during filling of the soil chamberand pipe pullout were used for comparison with those com-puted from numerical modeling. Independent of the above,the calculated average normal stress on the pipe from thenumerical model could also be compared with average stressback-calculated from pullout loads in the tests.
Stresses under static conditions prior to pulloutTo simulate the static condition around the pipe prior to
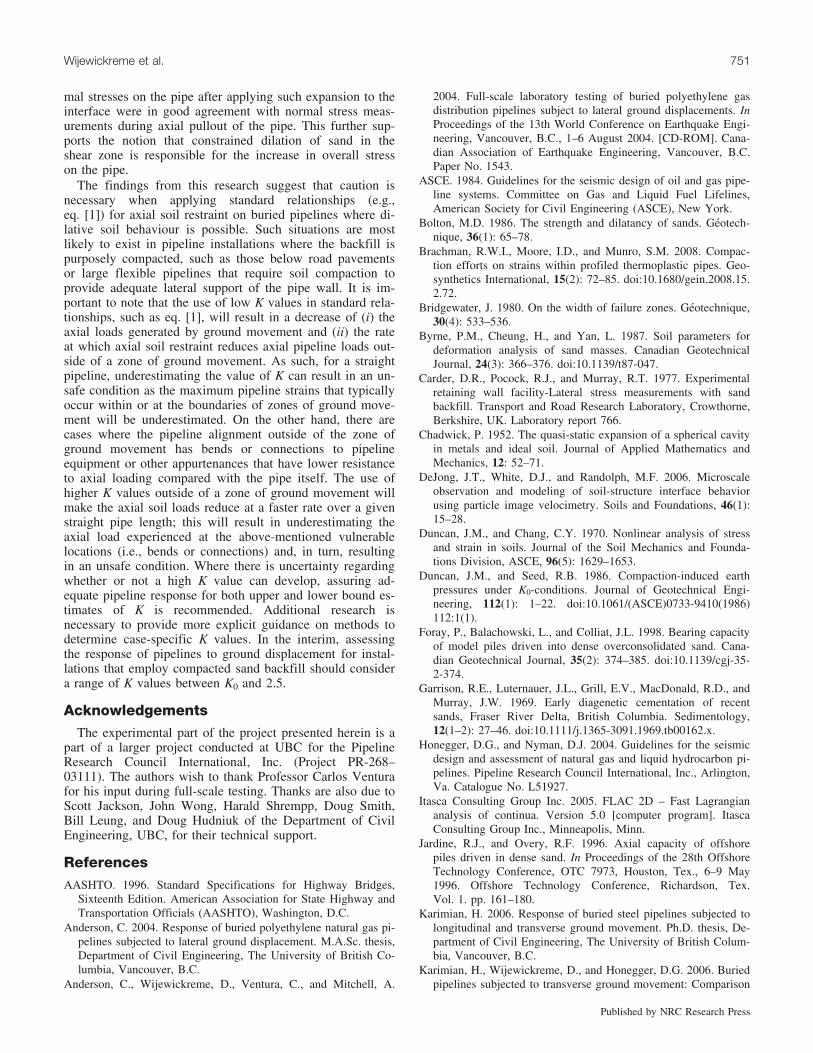
pullout, the soil weight was applied in two steps during nu-merical modeling. At first, the soil up to the level of thepipe invert, along with the weight of the pipe, were simu-lated by activating gravity for the respective elements in theFLAC 2D model. Once equilibrium was reached under thiscondition, gravity was activated for the remainder of themodel. Normal stress on the top (PT5) and bottom (PT1) ofthe pipe was directly available from the computed verticalstresses at those levels, and at spring line level (PT3) it wasequal to the computed horizontal stress. Normal stress at po-sitions PT2 and PT4 (on planes having –458 and +458 to thehorizontal, respectively) were computed assuming the valid-ity of Mohr’s circle. The computed dimensionless normalstresses (s 0N) at locations PT1 through PT5 are plotted inFig. 18a. The values of s 0N plotted for a given PT locationin this figure were derived by considering stresses computedin elements in the immediate vicinity of the correspondinglocations in the numerical model, and then averaging thosevalues as appropriate. The s 0N values derived from experi-mental measurements are depicted in Fig. 18b.
In an overall sense, the computed s 0N at and above thespring line (at positions PT3, PT4, and PT5) are in generalagreement with those derived from physical measurements.The agreement is poor at PT2; this, again, may be due tothe difficulties in uniformly compacting sand backfill in thehard-to-access areas below the spring line in the preparationof physical models. As the experimentally measured pres-sure at PT1 was irregular, the s 0N value at location PT1 wasassumed equal to the value estimated using the results of nu-merical analyses as previously made for the comparisons inFigs. 13 and 14 (i.e., s 0N at PT1 in Fig. 18b was assumedequal to that shown in Fig. 18a).
Normal stresses on pipe during pulloutThe computed s 0N from numerical modeling for the case
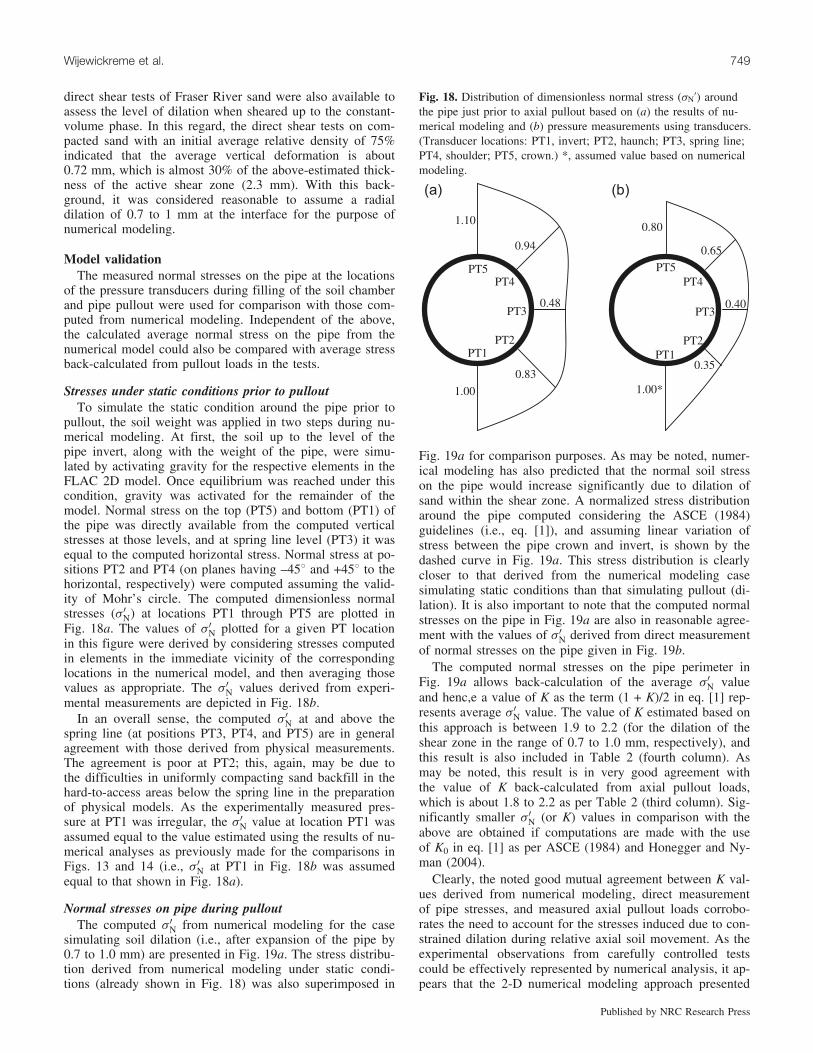
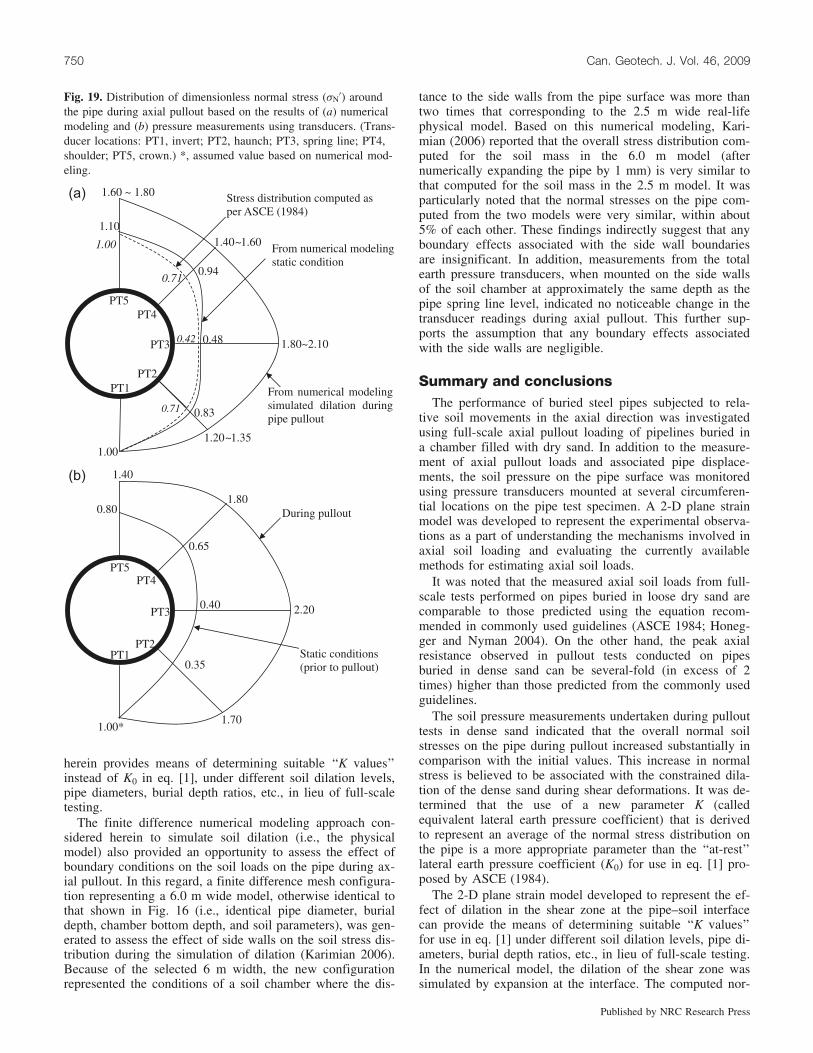
simulating soil dilation (i.e., after expansion of the pipe by0.7 to 1.0 mm) are presented in Fig. 19a. The stress distribu-tion derived from numerical modeling under static condi-tions (already shown in Fig. 18) was also superimposed in
Fig. 19a for comparison purposes. As may be noted, numer-ical modeling has also predicted that the normal soil stresson the pipe would increase significantly due to dilation ofsand within the shear zone. A normalized stress distributionaround the pipe computed considering the ASCE (1984)guidelines (i.e., eq. [1]), and assuming linear variation ofstress between the pipe crown and invert, is shown by thedashed curve in Fig. 19a. This stress distribution is clearlycloser to that derived from the numerical modeling casesimulating static conditions than that simulating pullout (di-lation). It is also important to note that the computed normalstresses on the pipe in Fig. 19a are also in reasonable agree-ment with the values of s 0N derived from direct measurementof normal stresses on the pipe given in Fig. 19b.
The computed normal stresses on the pipe perimeter inFig. 19a allows back-calculation of the average s 0N valueand henc,e a value of K as the term (1 + K)/2 in eq. [1] rep-resents average s 0N value. The value of K estimated based onthis approach is between 1.9 to 2.2 (for the dilation of theshear zone in the range of 0.7 to 1.0 mm, respectively), andthis result is also included in Table 2 (fourth column). Asmay be noted, this result is in very good agreement withthe value of K back-calculated from axial pullout loads,which is about 1.8 to 2.2 as per Table 2 (third column). Sig-nificantly smaller s 0N (or K) values in comparison with theabove are obtained if computations are made with the useof K0 in eq. [1] as per ASCE (1984) and Honegger and Ny-man (2004).
Clearly, the noted good mutual agreement between K val-ues derived from numerical modeling, direct measurementof pipe stresses, and measured axial pullout loads corrobo-rates the need to account for the stresses induced due to con-strained dilation during relative axial soil movement. As theexperimental observations from carefully controlled testscould be effectively represented by numerical analysis, it ap-pears that the 2-D numerical modeling approach presented
Fig. 18. Distribution of dimensionless normal stress (sN’) aroundthe pipe just prior to axial pullout based on (a) the results of nu-merical modeling and (b) pressure measurements using transducers.(Transducer locations: PT1, invert; PT2, haunch; PT3, spring line;PT4, shoulder; PT5, crown.) *, assumed value based on numericalmodeling.
Wijewickreme et al. 749
Published by NRC Research Press
herein provides means of determining suitable ‘‘K values’’instead of K0 in eq. [1], under different soil dilation levels,pipe diameters, burial depth ratios, etc., in lieu of full-scaletesting.
The finite difference numerical modeling approach con-sidered herein to simulate soil dilation (i.e., the physicalmodel) also provided an opportunity to assess the effect ofboundary conditions on the soil loads on the pipe during ax-ial pullout. In this regard, a finite difference mesh configura-tion representing a 6.0 m wide model, otherwise identical tothat shown in Fig. 16 (i.e., identical pipe diameter, burialdepth, chamber bottom depth, and soil parameters), was gen-erated to assess the effect of side walls on the soil stress dis-tribution during the simulation of dilation (Karimian 2006).Because of the selected 6 m width, the new configurationrepresented the conditions of a soil chamber where the dis-
tance to the side walls from the pipe surface was more thantwo times that corresponding to the 2.5 m wide real-lifephysical model. Based on this numerical modeling, Kari-mian (2006) reported that the overall stress distribution com-puted for the soil mass in the 6.0 m model (afternumerically expanding the pipe by 1 mm) is very similar tothat computed for the soil mass in the 2.5 m model. It wasparticularly noted that the normal stresses on the pipe com-puted from the two models were very similar, within about5% of each other. These findings indirectly suggest that anyboundary effects associated with the side wall boundariesare insignificant. In addition, measurements from the totalearth pressure transducers, when mounted on the side wallsof the soil chamber at approximately the same depth as thepipe spring line level, indicated no noticeable change in thetransducer readings during axial pullout. This further sup-ports the assumption that any boundary effects associatedwith the side walls are negligible.
Summary and conclusionsThe performance of buried steel pipes subjected to rela-
tive soil movements in the axial direction was investigatedusing full-scale axial pullout loading of pipelines buried ina chamber filled with dry sand. In addition to the measure-ment of axial pullout loads and associated pipe displace-ments, the soil pressure on the pipe surface was monitoredusing pressure transducers mounted at several circumferen-tial locations on the pipe test specimen. A 2-D plane strainmodel was developed to represent the experimental observa-tions as a part of understanding the mechanisms involved inaxial soil loading and evaluating the currently availablemethods for estimating axial soil loads.
It was noted that the measured axial soil loads from full-scale tests performed on pipes buried in loose dry sand arecomparable to those predicted using the equation recom-mended in commonly used guidelines (ASCE 1984; Honeg-ger and Nyman 2004). On the other hand, the peak axialresistance observed in pullout tests conducted on pipesburied in dense sand can be several-fold (in excess of 2times) higher than those predicted from the commonly usedguidelines.
The soil pressure measurements undertaken during pullouttests in dense sand indicated that the overall normal soilstresses on the pipe during pullout increased substantially incomparison with the initial values. This increase in normalstress is believed to be associated with the constrained dila-tion of the dense sand during shear deformations. It was de-termined that the use of a new parameter K (calledequivalent lateral earth pressure coefficient) that is derivedto represent an average of the normal stress distribution onthe pipe is a more appropriate parameter than the ‘‘at-rest’’lateral earth pressure coefficient (K0) for use in eq. [1] pro-posed by ASCE (1984).
The 2-D plane strain model developed to represent the ef-fect of dilation in the shear zone at the pipe–soil interfacecan provide the means of determining suitable ‘‘K values’’for use in eq. [1] under different soil dilation levels, pipe di-ameters, burial depth ratios, etc., in lieu of full-scale testing.In the numerical model, the dilation of the shear zone wassimulated by expansion at the interface. The computed nor-
Fig. 19. Distribution of dimensionless normal stress (sN’) aroundthe pipe during axial pullout based on the results of (a) numericalmodeling and (b) pressure measurements using transducers. (Trans-ducer locations: PT1, invert; PT2, haunch; PT3, spring line; PT4,shoulder; PT5, crown.) *, assumed value based on numerical mod-eling.
750 Can. Geotech. J. Vol. 46, 2009
Published by NRC Research Press
mal stresses on the pipe after applying such expansion to theinterface were in good agreement with normal stress meas-urements during axial pullout of the pipe. This further sup-ports the notion that constrained dilation of sand in theshear zone is responsible for the increase in overall stresson the pipe.
The findings from this research suggest that caution isnecessary when applying standard relationships (e.g.,eq. [1]) for axial soil restraint on buried pipelines where di-lative soil behaviour is possible. Such situations are mostlikely to exist in pipeline installations where the backfill ispurposely compacted, such as those below road pavementsor large flexible pipelines that require soil compaction toprovide adequate lateral support of the pipe wall. It is im-portant to note that the use of low K values in standard rela-tionships, such as eq. [1], will result in a decrease of (i) theaxial loads generated by ground movement and (ii) the rateat which axial soil restraint reduces axial pipeline loads out-side of a zone of ground movement. As such, for a straightpipeline, underestimating the value of K can result in an un-safe condition as the maximum pipeline strains that typicallyoccur within or at the boundaries of zones of ground move-ment will be underestimated. On the other hand, there arecases where the pipeline alignment outside of the zone ofground movement has bends or connections to pipelineequipment or other appurtenances that have lower resistanceto axial loading compared with the pipe itself. The use ofhigher K values outside of a zone of ground movement willmake the axial soil loads reduce at a faster rate over a givenstraight pipe length; this will result in underestimating theaxial load experienced at the above-mentioned vulnerablelocations (i.e., bends or connections) and, in turn, resultingin an unsafe condition. Where there is uncertainty regardingwhether or not a high K value can develop, assuring ad-equate pipeline response for both upper and lower bound es-timates of K is recommended. Additional research isnecessary to provide more explicit guidance on methods todetermine case-specific K values. In the interim, assessingthe response of pipelines to ground displacement for instal-lations that employ compacted sand backfill should considera range of K values between K0 and 2.5.
AcknowledgementsThe experimental part of the project presented herein is a
part of a larger project conducted at UBC for the PipelineResearch Council International, Inc. (Project PR-268–03111). The authors wish to thank Professor Carlos Venturafor his input during full-scale testing. Thanks are also due toScott Jackson, John Wong, Harald Shrempp, Doug Smith,Bill Leung, and Doug Hudniuk of the Department of CivilEngineering, UBC, for their technical support.
ReferencesAASHTO. 1996. Standard Specifications for Highway Bridges,
Sixteenth Edition. American Association for State Highway andTransportation Officials (AASHTO), Washington, D.C.
Anderson, C. 2004. Response of buried polyethylene natural gas pi-pelines subjected to lateral ground displacement. M.A.Sc. thesis,Department of Civil Engineering, The University of British Co-lumbia, Vancouver, B.C.
Anderson, C., Wijewickreme, D., Ventura, C., and Mitchell, A.
2004. Full-scale laboratory testing of buried polyethylene gasdistribution pipelines subject to lateral ground displacements. InProceedings of the 13th World Conference on Earthquake Engi-neering, Vancouver, B.C., 1–6 August 2004. [CD-ROM]. Cana-dian Association of Earthquake Engineering, Vancouver, B.C.Paper No. 1543.
ASCE. 1984. Guidelines for the seismic design of oil and gas pipe-line systems. Committee on Gas and Liquid Fuel Lifelines,American Society for Civil Engineering (ASCE), New York.
Bolton, M.D. 1986. The strength and dilatancy of sands. Geotech-nique, 36(1): 65–78.
Brachman, R.W.I., Moore, I.D., and Munro, S.M. 2008. Compac-tion efforts on strains within profiled thermoplastic pipes. Geo-synthetics International, 15(2): 72–85. doi:10.1680/gein.2008.15.2.72.
Bridgewater, J. 1980. On the width of failure zones. Geotechnique,30(4): 533–536.
Byrne, P.M., Cheung, H., and Yan, L. 1987. Soil parameters fordeformation analysis of sand masses. Canadian GeotechnicalJournal, 24(3): 366–376. doi:10.1139/t87-047.
Carder, D.R., Pocock, R.J., and Murray, R.T. 1977. Experimentalretaining wall facility-Lateral stress measurements with sandbackfill. Transport and Road Research Laboratory, Crowthorne,Berkshire, UK. Laboratory report 766.
Chadwick, P. 1952. The quasi-static expansion of a spherical cavityin metals and ideal soil. Journal of Applied Mathematics andMechanics, 12: 52–71.
DeJong, J.T., White, D.J., and Randolph, M.F. 2006. Microscaleobservation and modeling of soil-structure interface behaviorusing particle image velocimetry. Soils and Foundations, 46(1):15–28.
Duncan, J.M., and Chang, C.Y. 1970. Nonlinear analysis of stressand strain in soils. Journal of the Soil Mechanics and Founda-tions Division, ASCE, 96(5): 1629–1653.
Duncan, J.M., and Seed, R.B. 1986. Compaction-induced earthpressures under K0-conditions. Journal of Geotechnical Engi-neering, 112(1): 1–22. doi:10.1061/(ASCE)0733-9410(1986)112:1(1).
Foray, P., Balachowski, L., and Colliat, J.L. 1998. Bearing capacityof model piles driven into dense overconsolidated sand. Cana-dian Geotechnical Journal, 35(2): 374–385. doi:10.1139/cgj-35-2-374.
Garrison, R.E., Luternauer, J.L., Grill, E.V., MacDonald, R.D., andMurray, J.W. 1969. Early diagenetic cementation of recentsands, Fraser River Delta, British Columbia. Sedimentology,12(1–2): 27–46. doi:10.1111/j.1365-3091.1969.tb00162.x.
Honegger, D.G., and Nyman, D.J. 2004. Guidelines for the seismicdesign and assessment of natural gas and liquid hydrocarbon pi-pelines. Pipeline Research Council International, Inc., Arlington,Va. Catalogue No. L51927.
Itasca Consulting Group Inc. 2005. FLAC 2D – Fast Lagrangiananalysis of continua. Version 5.0 [computer program]. ItascaConsulting Group Inc., Minneapolis, Minn.
Jardine, R.J., and Overy, R.F. 1996. Axial capacity of offshorepiles driven in dense sand. In Proceedings of the 28th OffshoreTechnology Conference, OTC 7973, Houston, Tex., 6–9 May1996. Offshore Technology Conference, Richardson, Tex.Vol. 1. pp. 161–180.
Karimian, H. 2006. Response of buried steel pipelines subjected tolongitudinal and transverse ground movement. Ph.D. thesis, De-partment of Civil Engineering, The University of British Colum-bia, Vancouver, B.C.
Karimian, H., Wijewickreme, D., and Honegger, D.G. 2006. Buriedpipelines subjected to transverse ground movement: Comparison
Wijewickreme et al. 751
Published by NRC Research Press
between full-scale testing and numerical modeling. In Proceed-ings of the 25th International Conference on Offshore Me-chanics and Arctic Engineering, Hamburg, Germany, 4–9 June2006. [CD-ROM]. Ocean, Offshore and Arctic Engineering(OOAE) Division, American Society of Mechanical Engineers(ASME International), New York. Paper No. 92125.
Kraft, L.M. 1991. Performance of axially loaded pipe piles in sand.Journal of Geotechnical Engineering, 117(2): 272–296. doi:10.1061/(ASCE)0733-9410(1991)117:2(272).
Lehane, B.M., Jardine, R.J., Bond, A.J., and Frank, R. 1993. Me-chanisms of shaft friction in sand from instrumented pile tests.Journal of Geotechnical Engineering, 119(1): 19–35. doi:10.1061/(ASCE)0733-9410(1993)119:1(19).
Newmark, M., and Hall, W.J. 1975. Pipeline design to resist largefault displacement. In Proceedings of the U.S. National Confer-ence on Earthquake Engineering, Ann Arbor, Mich. 18–20 June1975. Earthquake Engineering Research Institute, Oakland, Ca-lif. Paper No. UILU-ENG-75?2011. pp. 416–425.
Paulin, M.J., Phillips, R., Clark, J.I., Hurley, S., and Trigg, A.1997. Establishment of a full-scale pipeline/soil interaction testfacility and results from lateral and axial investigations in sand.In Proceedings of the 16th International Conference of OffshoreMechanics and Arctic Engineering, Yokohama, Japan, 13–17 April 1997. Ocean, Offshore and Arctic Engineering(OOAE) Division, American Society of Mechanical Engineers(ASME International), New York. Vol. 5, Pipeline Technology.pp. 139–146.
Paulin, M.J., Phillips, R., Clark, J.I., Trigg, A., and Konuk, I. 1998.A full-scale investigation into pipeline/soil interaction. In Pro-ceedings of the International Pipeline Conference, Calgary,Alta., 7–11 June 1998. American Society of Mechanical Engi-neers (ASME International), New York. pp. 779–788.
Randolph, M.F., Dolwin, J., and Beck, R. 1994. Design of drivenpiles in sand. Geotechnique, 44(3): 427–448.
Roscoe, K.H. 1970. 10th Rankine lecture: The influence of strainsin soil mechanics. Geotechnique, 20(2): 129–170.
Scarpelli, G., and Wood, D.M. 1982. Experimental observations ofshear band patterns in direct shear tests. In Deformation andfailure of granular materials. Balkema, Rotterdam, the Nether-lands. pp. 473–484.
Trautmann, C.H., and O’Rourke, T.D. 1983. Behaviour of pipe indry sand under lateral and uplift loading. Cornell University,Ithaca, N.Y. Geotechnical Engineering Report 83–7.
Uthayakumar, M. 1996. Liquefaction of sands under multiaxialloading. Ph.D. thesis, Department of Civil Engineering, TheUniversity of British Columbia, Vancouver, B.C.
Vesic, A.S. 1972. Expansion of cavities in infinite soil mass. Jour-nal of the Soil Mechanics and Foundations Division, ASCE,98(3): 265–290.
Wijewickreme, D., Sriskandakumar, S., and Byrne, P.M. 2005.Cyclic loading response of loose air-pluviated Fraser River sandfor validation of numerical models simulating centrifuge tests.Canadian Geotechnical Journal, 42(2): 550–561. doi:10.1139/t04-119.
752 Can. Geotech. J. Vol. 46, 2009
Published by NRC Research Press