
Resonance energy transfer from a cylindrical distribution of donors to a plane of acceptors....
11
Resonance energy transfer from a cylindrical distribution of donors to a plane of acceptors Location of apo-B 100 protein on the human low-density lipoprotein particle Philippe Bastiaens, Anthony de Beus, Michael Lacker, Pentti Somerharju,* Matti Vauhkonen,* and Josef Eisinger Department of Physiology and Biophysics, Mount Sinai School of Medicine, New York 10029 USA; and *Department of Medical Chemistry, University of Helsinki, Helsinki, Finland ABSTRACT The resonance energy transfer (RET) from a cylindrical assembly of donors to acceptors in a plane was investigated, and the dependence the average RET rate (kT) on the cylinder's size, shape, and proximity to the acceptor plane was determined. This geometry provides a model for the RET from a donor-containing protein to acceptors embedded in an associated phospholipid mono- or bilayer. The determination of kT for a series of acceptors at different levels in the phospholipid layer is shown to provide information on the protein's relationship to the phospholipid layer. Two models for the donor (D) and acceptor (A) distributions are employed: (a) The D's and A's are uniformly distributed in the cylinder and the plane, respectively, and analytical expressions for kT in terms of experimental parameters are derived. (b) The RET rates between all D, A pairs within the cylinder and in the plane are calculated and averaged for a large number of random D and A distributions. The average transfer rates obtained by the two approaches are in agreement and the width of the frequency distribution of kT for the latter provides an estimate of the error to be expected when, as is usually the case, the true D and A locations are unknown. This methodology is illustrated by analyzing RET from the 37 tryptophan residues of the apo-B100 protein to a series of pyrenylphosphatidylcholine acceptors inserted in the phospholipid monolayer of the human low-density lipoprotein particle, and it is concluded that significant portions of the protein penetrate the phospholipid layer. 1. INTRODUCTION Resonance energy transfer (RET) is the mechanism by which the excitation energy of a donor chromophore is transferred nonradiatively to a nearby acceptor molecule. The rate of RET (kT) was shown by Forster to be a sensitive function of the separation and the relative orientations of the donor and acceptor moieties (Forster, 1948). Therefore, the measurement of kT provides the experimenter with a practical "spectroscopic ruler" for donor-acceptor separations of up to 10 nm (Stryer, 1978), as long as the donor and acceptor transition moment directions are at least approximately dynamically aver- aged (Dale et al., 1979). Because distances of this magnitude correspond to the dimensions of many biologi- cal structures (e.g., proteins, membranes), RET experi- ments have, for example, been used to estimate the separation of individual donor-acceptor pairs in hormones (Schiller, 1972) and proteins (Torgerson and Morales, 1984) and to determine the proximity of hemoglobin molecules to the membrane of red blood cells (Eisinger and Flores, 1983; Eisinger et al., 1984). In this paper, we consider RET from an assembly of donors within a right cylinder to acceptors in a plane parallel to the cylinder's base. This geometry is consid- ered to approximate that of a protein containing many donor chromophores in close proximity to a membrane in which lipid analogue receptors are embedded. It will be shown that within the limitations of this model, energy transfer experiments can provide useful information on the location of a protein with respect to the phospholipid layer it is associated with. Our analysis is presented in terms of dimensionless parameters to make its results readily applicable to any donor-acceptor pair. The methodology is illustrated by an analysis of the measured RET efficiency from the 37 tryptophan residues of the apo-B 100 protein to a series of different pyrenyl acceptors in the phospholipid monolayer at the surface of the human low-density lipoprotein (LDL) particle. 2. MODELS FOR DONOR AND ACCEPTOR ASSEMBLIES In order to make the analysis of RET between the donor (D) and acceptor (A) assemblies applicable to any D,A pair, all distances, concentrations and transfer rates are expressed as dimensionless quantities. Thus, the lengths (a, t, x, s, and E, to be defined below) are normalized to Ro, the Forster distance, where Ro is defined as the donor-acceptor separation for which the RET rate, kT, is equal to kD, the donor rate in the absence of any Biophys. J. Biophysical Society Volume 58 September 1990 665-675 0006-3495/90/09/665111 $2.00 665 0006-3495/90/09/665/11 $2.00 665
Transcript of Resonance energy transfer from a cylindrical distribution of donors to a plane of acceptors....

Resonance energy transfer from a cylindrical distribution ofdonors to a plane of acceptorsLocation of apo-B 100 protein on the human low-density lipoprotein particle
Philippe Bastiaens, Anthony de Beus, Michael Lacker, Pentti Somerharju,* Matti Vauhkonen,* andJosef EisingerDepartment of Physiology and Biophysics, Mount Sinai School of Medicine, New York 10029 USA; and *Department ofMedical Chemistry, University of Helsinki, Helsinki, Finland
ABSTRACT The resonance energy transfer (RET) from a cylindrical assembly of donors to acceptors in a plane was
investigated, and the dependence the average RET rate (kT) on the cylinder's size, shape, and proximity to the acceptorplane was determined. This geometry provides a model for the RET from a donor-containing protein to acceptors embeddedin an associated phospholipid mono- or bilayer. The determination of kT for a series of acceptors at different levels in thephospholipid layer is shown to provide information on the protein's relationship to the phospholipid layer. Two models for thedonor (D) and acceptor (A) distributions are employed: (a) The D's and A's are uniformly distributed in the cylinder and theplane, respectively, and analytical expressions for kT in terms of experimental parameters are derived. (b) The RET ratesbetween all D, A pairs within the cylinder and in the plane are calculated and averaged for a large number of random D and Adistributions. The average transfer rates obtained by the two approaches are in agreement and the width of the frequencydistribution of kT for the latter provides an estimate of the error to be expected when, as is usually the case, the true D and Alocations are unknown. This methodology is illustrated by analyzing RET from the 37 tryptophan residues of the apo-B100protein to a series of pyrenylphosphatidylcholine acceptors inserted in the phospholipid monolayer of the human low-densitylipoprotein particle, and it is concluded that significant portions of the protein penetrate the phospholipid layer.
1. INTRODUCTION
Resonance energy transfer (RET) is the mechanism bywhich the excitation energy of a donor chromophore istransferred nonradiatively to a nearby acceptor molecule.The rate of RET (kT) was shown by Forster to be a
sensitive function of the separation and the relativeorientations of the donor and acceptor moieties (Forster,1948). Therefore, the measurement of kT provides theexperimenter with a practical "spectroscopic ruler" fordonor-acceptor separations of up to 10 nm (Stryer, 1978),as long as the donor and acceptor transition momentdirections are at least approximately dynamically aver-
aged (Dale et al., 1979). Because distances of thismagnitude correspond to the dimensions of many biologi-cal structures (e.g., proteins, membranes), RET experi-ments have, for example, been used to estimate theseparation of individual donor-acceptor pairs in hormones(Schiller, 1972) and proteins (Torgerson and Morales,1984) and to determine the proximity of hemoglobinmolecules to the membrane of red blood cells (Eisingerand Flores, 1983; Eisinger et al., 1984).
In this paper, we consider RET from an assembly ofdonors within a right cylinder to acceptors in a planeparallel to the cylinder's base. This geometry is consid-ered to approximate that of a protein containing many
donor chromophores in close proximity to a membrane inwhich lipid analogue receptors are embedded. It will be
shown that within the limitations of this model, energy
transfer experiments can provide useful information on
the location of a protein with respect to the phospholipidlayer it is associated with.Our analysis is presented in terms of dimensionless
parameters to make its results readily applicable to any
donor-acceptor pair. The methodology is illustrated by an
analysis of the measured RET efficiency from the 37tryptophan residues of the apo-B100 protein to a series ofdifferent pyrenyl acceptors in the phospholipid monolayerat the surface of the human low-density lipoprotein(LDL) particle.
2. MODELS FOR DONOR ANDACCEPTOR ASSEMBLIES
In order to make the analysis of RET between the donor(D) and acceptor (A) assemblies applicable to any D,Apair, all distances, concentrations and transfer rates areexpressed as dimensionless quantities. Thus, the lengths(a, t, x, s, and E, to be defined below) are normalized toRo, the Forster distance, where Ro is defined as thedonor-acceptor separation for which the RET rate, kT, isequal to kD, the donor rate in the absence of any
Biophys. J. Biophysical SocietyVolume 58 September 1990 665-675
0006-3495/90/09/665111 $2.00 6650006-3495/90/09/665/11 $2.00 665

acceptors. Similarly, volumes are always given in units ofRo and the (dimensionless) RET rate is defined as k =kT/kD. Accordingly, the rate of RET between a D, A pairseparated by a distance R, is (Forster, 1948),
k = (RO/R)6, (1)
and the quantum efficiency of RET, (T, iS
T= k/(l + k). (2)
3. ENERGY TRANSFER FROM A DONORTO AN INFINITE ACCEPTOR PLANE
We first consider the case of a single donor, D, at a normal(dimensionless) distance x from an infinite acceptorplane. If the normal intercepts the acceptor plane at a
point C and z is the distance between D and all points of acircle of radius y, centered on C, then,
In the models discussed below the donors are containedwithin a right circular cylinder of height t and radius s,with volume v = irs2t and aspect ratio a e 2s/t. Thedonor concentration within the cylinder does not appearin the analysis presented here, because only the averageRET rate for all donors is measured in steady-state RETexperiments. If NA is the area concentration of acceptors(nanometers-2), the dimensionless planar acceptor concen-tration, nA, is defined as
nA = NAR2, (3)where Ro is in nanometers. In the present calculations theRET orientation factor, K2 (Forster, 1948), is assumed tobe 2/3 for all D-A pairs. This value is appropriate if theorientations of both the donor and acceptor chromophoressample all orientations in times which are short comparedto their excited-state lifetimes (dynamic averaging re-
gime) (Dale et al., 1979; Eisinger et al., 1981). While thisassumption is not in general a realistic one, it is unlikely tointroduce a serious error, as long as the donors are large innumber and both the donors and acceptors have some
orientational freedom (cf., section 7).It should be noted that the analysis presented here is in
any case only an approximate one, because the actuallocations of the donors and acceptors are in generalunknown. To evaluate the uncertainties this may cause,we compare two approaches for calculating the averagetransfer rate: In the first, the donors and acceptors are
assumed to be smeared out uniformly and continuouslywithin the cylinder and over the plane, respectively, andwith this assumption it is possible to obtain analyticalsolutions for the energy transfer problem. In the secondapproach, the donors and acceptors are discrete and are
positioned randomly within the cylinder and the plane,respectively. The RET rates for all donor-acceptor pairsfor many random distributions of donors and acceptorsare then calculated and averaged to obtain the averagetransfer rate. It will be seen that the transfer ratesobtained for the continuum and discrete random distribu-tions are in agreement and that the frequency distributionof k values for many random distributions provides thevariance in k which is to be expected when the truelocations of D and A are unknown.
2 = 2 2z =x +y . (4)
The RET rate from D to acceptors in an area element of acircular annulus of radius y and width dy, centered on Cand defined by the azimuthal angles 0 and 0 dO, is,according to Eq. 1,
dk = nAZ-dydyO. (5)
Integrating over the entire acceptor plane, the RET ratefrom the donor to all acceptors is, therefore,
k = nA 2x y dy do (2 4(x2 + 2) nAX . (6)
The rate of RET from a donor a normal distance Rofrom to an infinite acceptor plane with nA = 1, is,therefore, k = vr/2. Note that this is -50% greater thanthe RET rate between a donor and an acceptor separatedbyRo (cf., Eq. 1).
4. ENERGY TRANSFER FROM A DONORCYLINDER TO AN ACCEPTOR PLANE
We next consider the RET from a uniform donor distribu-tion confined to a right cylinder to an acceptor planewhich is parallel to the cylinder base. We deal separatelywith cylinders which do not and do penetrate the plane(cf., Fig. 1).
t
A
FIGURE 1 Relative locations of the donor cylinder and the acceptorplane (heavy solid line) for models la, lb, and 2.
666 Biophysical Journal Volume 58 September666 Biophysical Journal Volume 58 September 1990
mmm .m I............., ............
UWAIMU.10c [..( .Idc -IC
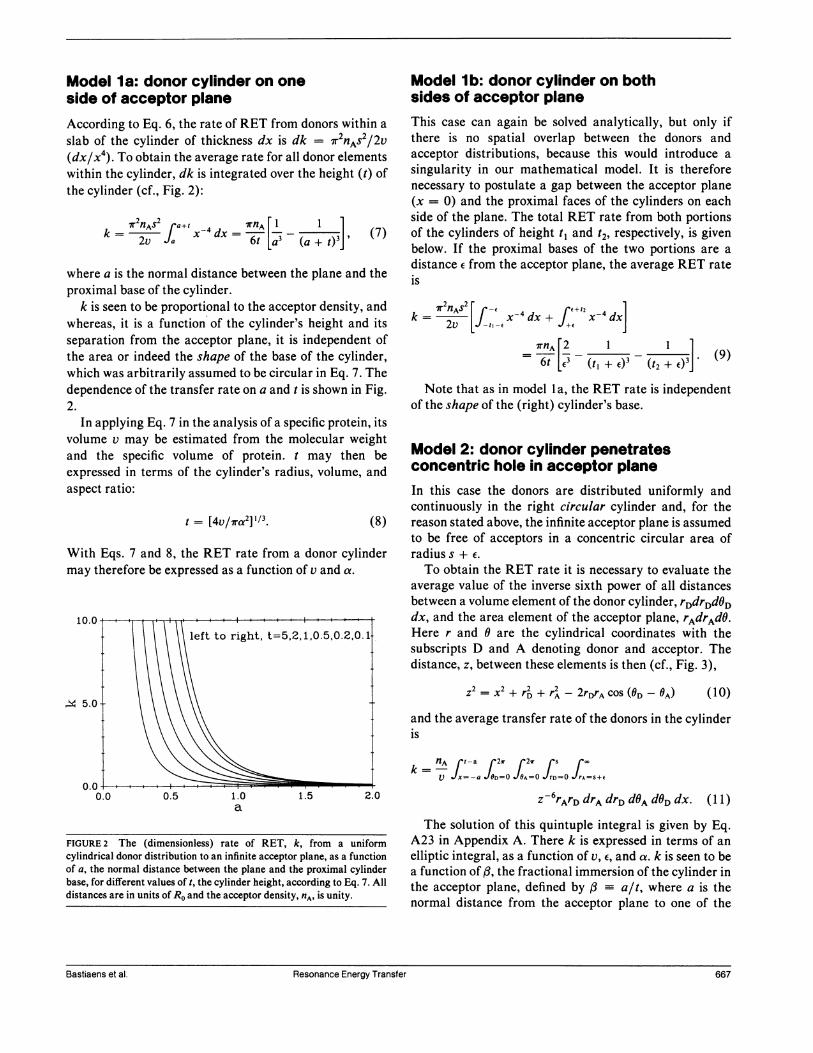
Model la: donor cylinder on oneside of acceptor planeAccording to Eq. 6, the rate of RET from donors within a
slab of the cylinder of thickness dx is dk = -r2nAS2/2v(dx/x4). To obtain the average rate for all donor elementswithin the cylinder, dk is integrated over the height (t) ofthe cylinder (cf., Fig. 2):
k
nASrl
a+t4dx lrnA[1 (7)
where a is the normal distance between the plane and theproximal base of the cylinder.
k is seen to be proportional to the acceptor density, andwhereas, it is a function of the cylinder's height and itsseparation from the acceptor plane, it is independent ofthe area or indeed the shape of the base of the cylinder,which was arbitrarily assumed to be circular in Eq. 7. Thedependence of the transfer rate on a and t is shown in Fig.2.
In applying Eq. 7 in the analysis of a specific protein, itsvolume v may be estimated from the molecular weightand the specific volume of protein. t may then beexpressed in terms of the cylinder's radius, volume, andaspect ratio:
t = [4v/lra2]'/3. (8)
With Eqs. 7 and 8, the RET rate from a donor cylindermay therefore be expressed as a function of v and a.
a 5.0-
if
a
Model lb: donor cylinder on bothsides of acceptor planeThis case can again be solved analytically, but only ifthere is no spatial overlap between the donors andacceptor distributions, because this would introduce a
singularity in our mathematical model. It is thereforenecessary to postulate a gap between the acceptor plane(x = 0) and the proximal faces of the cylinders on eachside of the plane. The total RET rate from both portionsof the cylinders of height t, and t2, respectively, is givenbelow. If the proximal bases of the two portions are a
distance e from the acceptor plane, the average RET rateis
k = 2A[n x-4dX + x-4dx]
6t 3[ (t + e)3 (t2 E (9)
Note that as in model la, the RET rate is independentof the shape of the (right) cylinder's base.
Model 2: donor cylinder penetratesconcentric hole in acceptor planeIn this case the donors are distributed uniformly andcontinuously in the right circular cylinder and, for thereason stated above, the infinite acceptor plane is assumedto be free of acceptors in a concentric circular area ofradius s + e.
To obtain the RET rate it is necessary to evaluate theaverage value of the inverse sixth power of all distancesbetween a volume element of the donor cylinder, rDdrDdODdx, and the area element of the acceptor plane, rAdrAdO.Here r and 0 are the cylindrical coordinates with thesubscripts D and A denoting donor and acceptor. Thedistance, z, between these elements is then (cf., Fig. 3),
z2 = x + rD +r2 2rDrA COS (OD -OA) (10)
and the average transfer rate of the donors in the cylinderis
k=-JfAaf2a f2w SV x= -a D=O A=O rD=O rA=S+(
z rArDdrA drD dOAdODdx. (11)
The solution of this quintuple integral is given by Eq.A23 in Appendix A. There k is expressed in terms of an
elliptic integral, as a function of v, E, and a. k is seen to bea function of ,B, the fractional immersion of the cylinder inthe acceptor plane, defined by f-a/t, where a is thenormal distance from the acceptor plane to one of the
Resonance Energy Transfer 667
FIGURE 2 The (dimensionless) rate of RET, k, from a uniformcylindrical donor distribution to an infinite acceptor plane, as a functionof a, the normal distance between the plane and the proximal cylinderbase, for different values of t, the cylinder height, according to Eq. 7. Alldistances are in units of Ro and the acceptor density, nA. is unity.
Bastiaens et al. Resonance Energy Transfer 667

independent of e. As expected, the curves of Fig. 4 aresymmetrical about ,B = 1/2, corresponding to half of thecylinder being on each side of the acceptor plane. Notealso that for small values of a, i.e., rod-shaped, as opposedto discoid donor cylinders, the transfer rate is almostindependent of /3, except when d is near 0 or 1.
5. RET BETWEEN RANDOMLYDISTRIBUTED DONORS ANDACCEPTORS
FIGURE 3 Coordinate system used to evaluate k, the RET rate,according to model 2. The acceptor element (A) lies in the acceptorplane AOy, whose orthonormal distance from the donor element (D) isDD' = x.
cylinder's bases. The dependence of k on /, v, a, and e isillustrated graphically in Fig. 4, where nA was set equal tounity without loss of generality, because k is alwaysproportional to the acceptor density.The curves of Fig. 4 show the transfer rates predicted
by model 2 as a function of ,B, for three aspect ratios, a =1/3, 1, and 3. They also illustrate the strong dependence ofk on E, and because the value of e is difficult to estimate,the model cannot be used to predict absolute transferrates with confidence. On the other hand, the relativedependence of k on ,B can be used to differentiate betweendifferent geometries, because it is seen to be almost
FIGURE 4 Dependence of the rate of RET from a donor cylinder to anacceptor plane penetrated by it (model 2, Eq. A23), as a function of thecylinder's fractional immersion, S, with aspect ratios a = 3, 1, and 1/3.(a)e = 0.5,v = 15;(b)e = O.5,v = 44;(c)e = 0.25,v = 15;(d) =
0.25, v = 44. The curves illustrate the weak dependence of k on ,, unlessa base of the cylinder is nearly coplanar with the acceptors (i.e., 0 - 0 or1), and the strong dependence of k on e.
Because the true locations of the donor and acceptormoieties are in general unknown, it is important toconsider how strongly the RET rate depends on theirspecific locations. To this end, we created a large numberof randomly chosen distributions of donors and acceptors,and by calculating the transfer rates for all D-A pairs foreach according to Eq. 1, one obtains (k)divs the average
for all distributions of discrete donors and acceptors. Fora sufficiently large number of such computer-generateddistributions (N), the frequency distribution of k valuesbecomes independent of N, and it is clear that this limit isreached sooner when the number of donors and acceptorsis large.The following algorithm was used to create a random
distribution of donors within a cylinder: Using cylindricalcoordinates (rD, ZD, OD), random numbers were generatedto obtain values for 0D and ZD and r2 for the first donor, theradial coordinate being squared to ensure that the donorsbe uniformly distributed. Only those values which corre-
spond to points within the cylinder (i.e., rD < s) were
retained. All donors chosen after the first are required tomeet the additional condition that they be separated by a
distance >0.4 nm from any previously selected donor,because that is the approximate minimum separationbetween aromatic residue centroids as determined fromthe known structures of proteins (Burley and Petsko,1985). A similar procedure was used to select the randomdistributions of the acceptors, which were required tohave a separation >0.8 nm, the average spacing betweenmembrane phospholipids. Because the RET rate de-creases rapidly with the D, A separation (cf., Eq. 1),transfer to acceptors whose radial distance from thecylinder perimeter was greater than 6Ro + e were
considered to be negligible.Fig. 5 shows p(k), the normalized probability distribu-
tions of average transfer rates (k;) calculated for 40,000random distributions of donors confined to cylinders withaspect ratios 1/3, 1, and 3 and acceptors in a plane,according to models la and 2. Their average values,(k )dis = Yp(kj)kj, are listed for some representativeparameters in Table 1, together with k, the transfer rates
668 Biophysical Journal Volume
z
rA eAA
668 Biophysical Journal Volume 58 September 1990

0.00 4 i i i I l
0.0 0.5 1.0 0.0 0.5 1.0k k
0.05 - 0.05b b
0.04-- a 1, = 0.04 a= 1, = 0.5
0.03 0.03
0.02 0.02
0.01 0.01
0.00 0.00
0.00 0.05 0.10 0.00 0.05 0.10
0.05 - 0.05 bb b
0.04 a z /3, p= 0.5 0.04 a 3, p= .5
0.03 ~~~~~~~~~~~~~~0.03
0.02 ~~~~~~~~~~~~~~0.02
0.01 ~~~~~~~~~~~~~~~0.01
0.00~~~~~~~~~~~~~~00 01o.oo 0.05 0.10 o.oo 0.05 0.10k k
FIGURE 5 Selected normalized probability distributions of the average transfer rates, p(k), for 40,000 random distributions of discrete donors andacceptors in the cylinder and plane. For each distribution of A and D positions, the transfer rates for all D, A pairs were evaluated according to Eq. 1
and averaged to obtain (k)di. As in Table 1, the values of the parameters correspond to the LDL experiment discussed in section 6. (a) Model la witha = 0.25 and 1 and different aspect ratios. Note that when the donor cylinder is much closer than Ro to the acceptor plane, as it is for a = 0.25, thedistribution in k is very wide and the assumption of uniform density, as in Eq. 7 is likely to cause considerable errors. (b) Model 2 with e= 0.5. Notethat the k distribution is widest for oblate donor cylinders, because of their greater circumference.
Bastiaens et al. Resonance Energy Transfer
a
0.04 a 3, a= 0.25
0.03 -
0.02 -.
0.01 - .
0.00 L , , , , ,
669Bastiaens et al. Resonance Energy Transfer

TABLE 1 Comparison between k, the RET rate for thecontinuum models, and (k)dil, the average rate for 40,000random distributions of discrete donors and acceptors
a 2s,t a k (k)di,
Model la1/3 8.0, 2.6 0.25 0.842 0.836
1.0 0.013 0.0121 3.8, 3.8 0.25 1.751 1.542
1.0 0.027 0.0263 1.8,5.5 0.25 3.637 3.111
1.0 0.054 0.048
Model 2 ,1/3 8.0, 2.6 0 0.021 0.021
0.5 0.042 0.0431 3.8, 3.8 0 0.030 0.028
0.5 0.057 0.0593 1.8,5.5 0 0.041 0.040
0.5 0.070 0.070
Data are shown for models 1 a and 2 for a donor cylinder of the samevolume (v = 44) as the apo-B100 protein with nA = 0.2 and e = 0.5 (cf.,section 6). The diameter and height of the cylinder for three aspectratios is given in column 2. As expected, k for model la has anapproximately inverse cubic dependence on a, whereas k for model 2 isabout twice as great for , = 0.5 than for ,l = 0. Whereas the agreementbetween k and (k)dis is excellent, Fig. 5 shows that the distributions in kfor random D, A locations are unacceptably wide for cases in whichdonors are in close proximity to the acceptor plane, as for a = 0.25 inmodel la.
for the corresponding uniform distributions, as deter-mined by Eqs. 7 and A23. The acceptor density for allcases was nA = 0.2, corresponding to a probe/lipid ratioof -5% within the phospholipid matrix and the volume(44) and number of donors (37) are those which apply tothe apo-B100 protein on the LDL particle, as discussed insection 6. Note that the excellent agreement between therates obtained from the analytical solutions for uniformdistributions (k) and (k)dis'The probability distributions of Fig. 5 are asymmetri-
cal with the value of (k)dis in all cases exceeding the ratefor which p(k) has its maximum value, i.e., the ratecorresponding to the most frequently encountered donorand acceptor distributions. The long tails of the probabil-ity distributions which are responsible for this representRET between D, A pairs at or near their minimumseparation, i.e., a or e. Comparison between the p(k)histograms of Fig. 5 and the average values shown inTable 1 suggest that the assumption of uniform donor andacceptor density is unlikely to introduce errors greaterthan a factor of 2 for aspect ratios of unity or less, but thatthis error can be considerably greater for cylinder-planegeometries which are very sensitive to the specific locationof the donors and acceptors, for example in model 1a, inwhich the cylinder is in close proximity to the acceptorplane (e.g., a = 0.25).
6. LOCATION OF APO-B100 PROTEIN ONTHE LDL PARTICLE
In this section we illustrate how RET experiments may beused to distinguish between different geometries of thedonor and acceptor assemblies by analyzing a study of thehuman LDL particle. The experimental details, includingthe method used to insert the acceptor probes by the use ofthe phosphatidylcholine-specific transfer protein, are pub-lished elsewhere (Vauhkonen and Somerharju, 1989).
Experimental dataThe LDL particle is quasispherical in shape with adiameter of 25 nm. Its core consists of neutral lipids andits surface is formed by a phospholipid monolayer whichcontains 50 mole percent of cholesterol (Shen et al., 1977;Goldstein and Brown, 1977). The particle carries a singlereceptor protein, apo-B100, whose molecular weight is512,000 and which contains 37 tryptophan residues. Thelocation of this unusually large protein within the LDLparticle is unknown, but its apolar segments are thoughtto be associated with the phospholipid monolayer at theparticle's surface (Knott et al., 1986; Yang et al., 1986;Olofsson et al., 1987).Vauhkonen and Somerharju labeled the lipid mono-
layer with a series of pyrenyl phosphatidylcholine probes,pynPC, whose pyrene moiety is covalently linked to theterminal carbon of molecule's sn-2 acyl chain, of nmethylene groups in length. They then measured theefficiency of RET from the tryptophan residues of theapo-B100 protein to the acceptor probes, as a function ofacceptor concentration, nA. From the emission spectrumof tryptophan and the absorption spectrum of pynPC theForster distance was determined to be Ro = 2.5 nm(Vauhkonen and Somerharju, 1989). The level within thephospholipid monolayer where the pyrene moieties arelocated was estimated from the efficiency with which theirfluorescence was quenched by brominated phospholipids.In doing so, a length of 0.095 nm per methylene unit wasused, this value having been determined previously forbrominated phospholipid vesicles in an x-ray diffractionexperiment (Lewis and Engelman, 1983; McIntosh andHolloway, 1987).
Table 2 lists the estimated depth (d) of the pyrenemoieties for the five pyrenyl acceptor probes, togetherwith the measured average RET rates (k), normalized toan acceptor concentration of nA = 1. These values of k foreach acceptor and at each acceptor concentration werederived from the measured RET efficiency, 4rT, accordingto the relationship (cf., Eq. 2),
k = - T (12)
670 Biophysical Journal Volume 58 September 1990Biophysical Journal Volume 58 September 1990670

TABLE 2 Experimentally determined rate of RET (k) Indimensionless units for a series of pyrenyl acceptors at differentlevels In the phospholipid monolayer
kProbe Probe depth (d) (nA= 1)
nm Ro unitspy6PC 0.81 0.32 3.61py8PC 0.99 0.40 3.85pyloPC 1.17 0.47 3.43pyI2PC 1.35 0.54 2.85py14PC 1.53 0.61 2.65
The "depth" of the pyrene moieties below the phospholipid headgroups(d) was estimated from quenching experiments as described in the textand is given in columns 2 and 3 in nanometers and in Ro units (Ro = 2.5nm). Column 4 gives the transfer rates k for an acceptor concentration(nA) of unity, and was obtained by extrapolating the linear dependenceof k on nA for each of the probes (cf., Fig. 6).
When plotted against nA, the expected linear dependenceof k on nA was obtained, and is illustrated for py6PC inFig. 6, and the value of k corresponding to nA = 1 wasobtained by extrapolation.Note that the straight line in Fig. 6 does not pass
through the origin, i.e., that the slope dk/dnA is greaterfor very small acceptor densities (nA < 0.025) than theslope of the line shown. This is probably due to the factthat the apo-B100 protein possesses a small number ofhigh affinity sites for the pyrenyl acceptors and thattransfer to them more efficient than to the randomlydistributed acceptors (Vauhkonen and Somerharju, 1989),as has also been reported for other membrane proteins(Jones and Lee, 1985).
In Table 2, the depths of the pyrene moiety below thephospholipid headgroups for the PYnPC probes are givenin nanometers and in units of Ro using Ro = 2.5 nm. Thisvalue for Ro was calculated from the tryptophan emission
a
and pyrene absorption spectra, with K2 = 2/3 (Forster,1948). The volume of the donor distribution, derived fromthe molecular weight of apo-B 100 and the specific volumeof proteins (0.74 ml/g), is v = 44 R3 units (i.e., v = 44).
Comparison of experiment withmodel laIn Fig. 7 the observed dependence of k on probe depth iscompared with the predictions of model la according toEq. 7, with the experimental data normalized to nA = 1.
The curves were generated for five values of the aspectratio, a, for a fixed volume of v = 44, by making use ofEq. 8.
If the proximal face of the donor cylinder is a distance c
above the phospholipid headgroup level and d is the probedepth below that plane (cf., Table 2), then a = c + d. (cmay be negative but because the acceptor plane cannotpenetrate the protein, c> - d). In Fig. 7 the experimen-tal transfer rates are plotted as a function of a, whichequals d when c = 0, i.e., when the cylinder base iscoplanar with the phospholipid headgroup level. If c
differs from 0, the points shown in the figure are displacedto the left (for c < 0) or to the right (for c > 0) by themagnitude of c. It is clear from Fig. 7 that the experimen-tal dependence of k on d is much weaker than thatpredicted by model 1 a, independently of c or a.
Comparison of experiment withmodel 2The considerations above suggest that significant portionsof the apo-B 100 protein penetrate deeply into the phospho-lipid monolayer, for only then can the weak dependence ofk on probe depth be explained. For that case an increasein RET from donors in the one portion compensates forthe decrease from donors in the other. In this section wedemonstrate that the dependence of k on d which ispredicted by model 2 is indeed consistent with theobserved RET rates for acceptor probes at differentdepths.To compare the observed dependence of k on probe
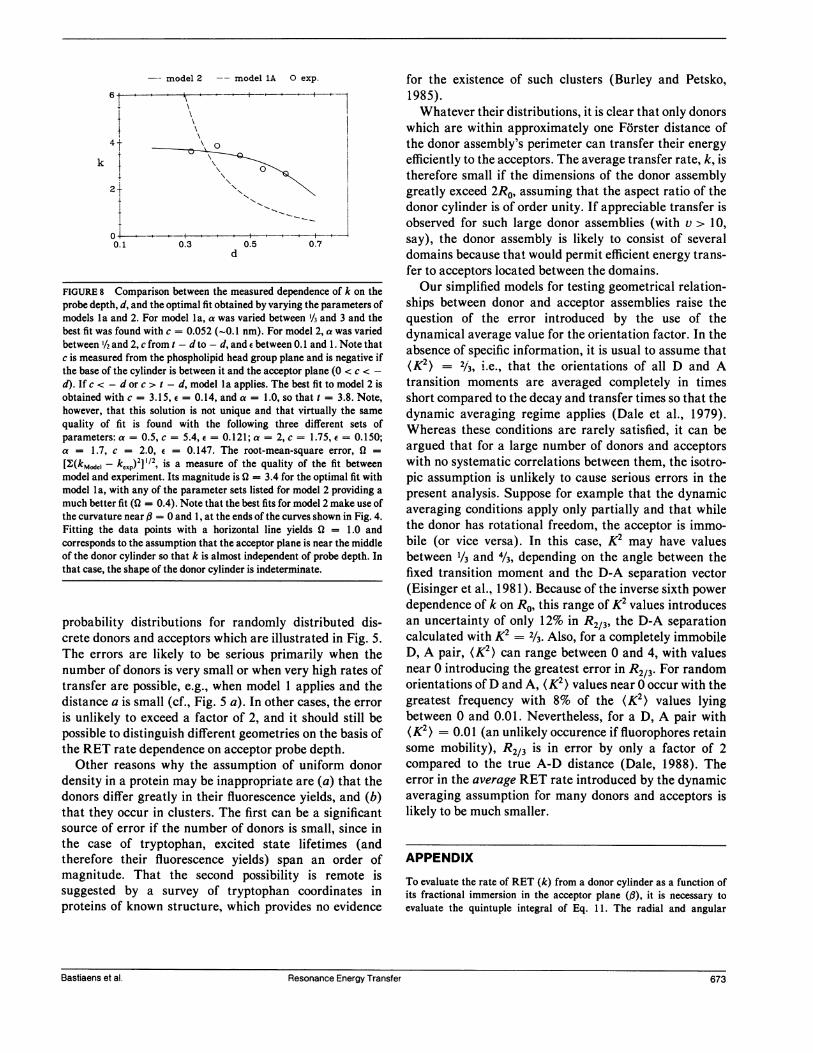
depth (cf., Table 2) with the predictions of models 1 a and2 directly, we compared the optimum fits of Eqs. 7 andA23 to the data in Fig. 8. For model 2, the immersiondepth of the cylinder were expressed as i = (c + d)/tand the values of the unknown parameters (c, a, e) were
obtained from the best nonlinear least square fit to thedata points. As explained in the caption to Fig. 8, thequality of fit was found to be 10 times better for model 2than for model la.
Whereas Fig. 8 indicates the superiority of model 2,this conclusion should not be accepted without some
Resonance Energy Transfer 671
FIGURE 6 The experimentally determined dependence of the averagerate of RET from the tryptophan residues in apoB-100 to py6PCacceptors in the phospholipid monolayer of the LDL particle, on nA, theacceptor concentration. The linear relationship is in accord with bothmodel la and 2 (Eqs. 7 and 1 1).
Bastiaens et al. Resonance Energy Transfer 671

- a= 1/3 -- a-1.0 a=3.0
0.75
t -0.25 0
0.000.00 0.25 0.50 0.75 1.00
e5v15 p
- a=-1/3 -- a=1.0 a=3.0
0.5;b
0.4t
0.3 +
0.2 -
0.1 -
0.00
e5v44
/ '2/ "I
0.25 0.50
p
.7
0.75
a=1/3 -- a=1.0 a=3.0 - a=1/3 -- a=1.0
2.
3.0 ..
2.0t / N 4.1.0
1.0
...
0.25 0.50 0.75
p
1.51
X 1.0
0.5
O.1.00
v.v
0.00 0.25
e25v44
a=3.0
FIGURE 7 Comparison between the experimentally determined average RET rates from the tryptophan residues of apoB- 100 to a series of acceptors,py,PC with n = 6, 8, 10, 12, and 14 (circles, from left to right), and the k dependence predicted by model la. The theoretical curves for aspect ratiosa = 0.1, 0.33, 1, 3, and 10 (from left to right) were obtained by use of Eq. 7. In plotting the experimental k values, a was set equal to d, the probedepths of Table 2, i.e., with the assumption that c = O so that the base of the donor cylinder is coplanar with the phospholipid headgroups. For all othercases, the points are displaced laterally by the distance c. Note that whatever is the magnitude of c, the experimental points have a much weakerdependence on probe depth than is predicted by model Ia.
significant caveats: First, a mixture of the two models,corresponding to much of the protein being outside thephospholipid layer with some portions penetrating it, islikely to provide as good a fit as model 2. Second, anotherway of improving the agreement of experiment witheither model is to consider the apo-B100 protein consist-ing of several domains with the same total volume(v = 44), since this would provide the donors with greateraccess to acceptors located between these domains. How-ever, these and similar modifications of the two basicmodels considered here yield improved fits to the data atthe price of introducing additional model parameters.
In summary, the results indicate that the apo-B100protein is partially immersed in the surface of the LDLparticle and probably consists of several distinct domains.The possibility that the protein lies wholly outside thephospholipid monolayer can be discounted.
7. DISCUSSION
The most important result of our analysis is that the RETefficiency from a donor assembly located one side of anacceptor plane (model la) has a much greater depen-dence on its separation from the plane than does a donorassembly which pierces the acceptor plane. By employingacceptor probes which are located at different levels of aphospholipid layer, the experimenter is in effect able tovary the separation between the donors and acceptors anddraw conclusions about their relative location, as isillustrated in section 6.A fundamental assumption in deriving the analytical
results of Eqs. 7 and A23 is the uniformity of the donorand acceptor distributions. The magnitude of the errorintroduced by it depends, of course, on the true donorlocations in an experiment but may be estimated from the
672 Biophysical Journal Volume 58 September
1.00
0.00
e25vl5
d
r
.
., N.....\
.-
0.50 0.75
p1.00
u u -I
.u
,u ,
n.v
Ae
Volume 58 September 1990672 Biophysical Journal
k
model 2 --model 1A 0 exp.
T~~~~~~
4T
-------
0.1 0.3 0.5 0.7d
FIGURE 8 Comparison between the measured dependence of k on theprobe depth, d, and the optimal fit obtained by varying the parameters ofmodels 1 a and 2. For model 1 a, a was varied between 1/3 and 3 and thebest fit was found with c = 0.052 (-0.1 nm). For model 2, a was variedbetween 1/2 and 2, c from t - d to - d, and e between 0.1 and 1. Note thatc is measured from the phospholipid head group plane and is negative ifthe base of the cylinder is between it and the acceptor plane (0 < c < -d). If c < - d or c > t - d, model la applies. The best fit to model 2 isobtained with c = 3.15, = 0.14, and a = 1.0, so that t = 3.8. Note,however, that this solution is not unique and that virtually the samequality of fit is found with the following three different sets ofparameters: a = 0.5, c = 5.4, e = 0.121; a = 2, c = 1.75, e = 0.150;a = 1.7, c = 2.0, e = 0.147. The root-mean-square error, Q =[2;(km.de- k,,p)21 1/2, is a measure of the quality of the fit betweenmodel and experiment. Its magnitude is Q = 3.4 for the optimal fit withmodel 1 a, with any of the parameter sets listed for model 2 providing amuch better fit (0 = 0.4). Note that the best fits for model 2 make use ofthe curvature near ,B = 0 and 1, at the ends of the curves shown in Fig. 4.Fitting the data points with a horizontal line yields 0 = 1.0 andcorresponds to the assumption that the acceptor plane is near the middleof the donor cylinder so that k is almost independent of probe depth. Inthat case, the shape of the donor cylinder is indeterminate.
probability distributions for randomly distributed dis-crete donors and acceptors which are illustrated in Fig. 5.The errors are likely to be serious primarily when thenumber of donors is very small or when very high rates oftransfer are possible, e.g., when model 1 applies and thedistance a is small (cf., Fig. 5 a). In other cases, the error
is unlikely to exceed a factor of 2, and it should still bepossible to distinguish different geometries on the basis ofthe RET rate dependence on acceptor probe depth.
Other reasons why the assumption of uniform donordensity in a protein may be inappropriate are (a) that thedonors differ greatly in their fluorescence yields, and (b)that they occur in clusters. The first can be a significantsource of error if the number of donors is small, since inthe case of tryptophan, excited state lifetimes (andtherefore their fluorescence yields) span an order ofmagnitude. That the second possibility is remote issuggested by a survey of tryptophan coordinates inproteins of known structure, which provides no evidence
for the existence of such clusters (Burley and Petsko,1985).Whatever their distributions, it is clear that only donors
which are within approximately one Forster distance ofthe donor assembly's perimeter can transfer their energyefficiently to the acceptors. The average transfer rate, k, istherefore small if the dimensions of the donor assemblygreatly exceed 2RO, assuming that the aspect ratio of thedonor cylinder is of order unity. If appreciable transfer isobserved for such large donor assemblies (with v > 10,say), the donor assembly is likely to consist of severaldomains because that would permit efficient energy trans-fer to acceptors located between the domains.Our simplified models for testing geometrical relation-
ships between donor and acceptor assemblies raise thequestion of the error introduced by the use of thedynamical average value for the orientation factor. In theabsence of specific information, it is usual to assume that(K2) = 2/3, i.e., that the orientations of all D and Atransition moments are averaged completely in timesshort compared to the decay and transfer times so that thedynamic averaging regime applies (Dale et al., 1979).Whereas these conditions are rarely satisfied, it can beargued that for a large number of donors and acceptorswith no systematic correlations between them, the isotro-pic assumption is unlikely to cause serious errors in thepresent analysis. Suppose for example that the dynamicaveraging conditions apply only partially and that whilethe donor has rotational freedom, the acceptor is immo-bile (or vice versa). In this case, K2 may have valuesbetween 1/3 and 4/3, depending on the angle between thefixed transition moment and the D-A separation vector(Eisinger et al., 1981). Because of the inverse sixth powerdependence of k on Ro, this range of K2 values introducesan uncertainty of only 12% in R2/3, the D-A separationcalculated with K2 = 2/3. Also, for a completely immobileD, A pair, (K2) can range between 0 and 4, with valuesnear 0 introducing the greatest error in R2/3. For randomorientations ofD and A, (K2) values near 0 occur with thegreatest frequency with 8% of the (K2) values lyingbetween 0 and 0.01. Nevertheless, for a D, A pair with( K2) = 0.01 (an unlikely occurence if fluorophores retainsome mobility), R2/3 is in error by only a factor of 2compared to the true A-D distance (Dale, 1988). Theerror in the average RET rate introduced by the dynamicaveraging assumption for many donors and acceptors islikely to be much smaller.
APPENDIX
To evaluate the rate of RET (k) from a donor cylinder as a function ofits fractional immersion in the acceptor plane (a), it is necessary toevaluate the quintuple integral of Eq. 11. The radial and angular
Bastiaens et al. Resonance Energy Transfer 673Bastiaens et al. Resonance Energy Transfer 673

coordinates for the donor and acceptor distributions are illustrated inFig. 3.By defining the lumped coordinates,
0 = OD OA (Al)
u = x 2+r+ r2 (A2)
w = -2rDrA. (A3)
Eq. 11 may be rewritten as the quintuple integral
k = ft-adxf rA drA f rD drDV x=-a rAs+f rD=O
2d0 dO (4J 0d=oJ6A o=- (U + W cos 0)3 (A)
I., the integral over 0 in Eq. A4, may be evaluated by use of a dummyvariable for tan (0/2) to obtain
~r[1 3(U2 + w2)11 = 2 [(U2 -w2)3/2 2 _ w2)5 (A5)
Substituting Eq. A5 in Eq. A4 and integrating over OA,
7r2nA flr-a d w d |k ~~dx rA drAV x=-a S+f rD=
[ 1 3(U2 + w2) 1
[(u2 -w2)3/2 U(U2 _ w2)5/2JrDdrD. (A6)
By introducing further changes in variables,
p =r2D (A7)2
y =r2 (A8)
g =2 (x2 _ y) (A9)
q = (x2 + y)2 (A10)
X(p) =p2 + gp + q. (All)
Eq. A6 becomes
2nAf f21=-a dx f()2 dy Sok
I
L[X(p)]32 [X(p)]/j2which may be integrated with respect top by making use of the followingstandard forms:
f dp 2(2p + g) (A13)
X-X (4q -g2)\I1X
x2 aX- 3X2 2fx 2 NfX (14
I dp 2(2x+g) 1 8JX2I 3(4q - g2) f[X X (4q ) (A15)
to obtain
7r2nA t-a dxJk'AV x=-a 4x4 y=(S+E)2
1[_ (y + x2 - s2) 2x2s2 (x2 + s2 - Y)]dy (A16)[y(y)l' /2 + [y(y)]P/2 dy (A )
where
y(y) = y2 + 2(X2 - S2)y + (x2 + S2)2. (A17)
After integrating over x, the remaining integration over y is similar tothat with respect to p above. Making use of the same standard forms,Eqs. A13-A15, in addition to
f pdp 2-Xfg fr (A18)
one obtains the following expression for the average RET rate
72nAk = {F [m, (t - a)/s] + F [m, a/s]l, (A19)
where F[m, F] is the following elliptic integral:
F(m, r)r (m + 1) dx
JO M(m, x)[(m + 2)X2 + m2 + mM(m,x)]' (A )
with
M(m,9x) = [x4 + 2(m + 2)x2 + mi2]1/2 (A21)
and
m = (E/s)[(e/s) + 21. (A22)
The rate k may be expressed as a function of v, a, fl, and e by rewritingEq. A19 as
k = nA (27r/laV4)'l3{F [m, 2 ( - f)/lal + F [m, 213/all,(A23)
with
m = (2ir/lav)1/3, [2 + (27r/av)'/3E], (A24)
and was plotted as a function of ,B in Fig. 7, a-c.
We thank Massimo Sassaroli for useful discussions and for his generoushelp in creating the illustrations.
This work was supported by National Institutes of Health grantsHL21016 and R24 RR05272.
Receivedfor publication 19 February 1990 and infinalform 7May 1990.
REFERENCES
Burley, S. K., and G. A. Petsko. 1985. Aromatic-aromatic interaction: amechanism of protein structure stabilization. Science (Wash. DC).229:23-28.
674 Biophysical Journal Volume 58 September 1990

Dale, R. E. 1988. Some aspects of excited-state emission spectroscopyfor structure and dynamics of model and biological membranes. InPolarized Spectroscopy of Ordered Systems. B. Samori and E. W.Thulstrup, editors. Kluwer Academic Publishers, Dordrecht, FRG.491-567.
Dale, R. E., J. Eisinger, and W. E. Blumberg. 1979. The orientationalfreedom of molecular probes: the orientation factor in intramolecularenergy transfer. Biophys. J. 26:161-194.
Eisinger, J., and J. Flores. 1983. Cytosol-membrane interface of humanerythrocytes: a resonance energy transfer study. Biophys. J. 41:367-379.
Eisinger, J., W. E. Blumberg, and R. E. Dale. 1981. Orientationaleffects in intra- and intermolecular long range excitation energytransfer. Ann. NYAcad. Sci. 366:155-175.
Eisinger, J., J. Flores, and R. M. Bookchin. 1984. The cytosol-membrane interface of normal and sickle erythrocytes. J. Biol. Chem.259:7169-7177.
Forster, Th. 1948. Zwischenmolekulare Energiewanderung und Fluo-reszenz. Ann. Physik. 2:55-75.
Goldstein, J. L., and M. S. Brown. 1977. The low density lipoproteinpathway and its relation to atherosclerosis. Annu. Rev. Biochem.46:897-930.
Jones, 0. T., and A. G. Lee. 1985. Interactions of pyrene derivativeswith lipid bilayers and with (Ca- Mg)-ATPase. Biochemistry. 24:2195-2202.
Knott, T. J., R. J. Pease, L. M. Powell, S. C. Wallis, S. C. Rall, Jr., T. L.Innerarity, B. Blackhart, W. H. Taylor, Y. Marcel, R. Milne, D.Johnson, M. Fuller, A. J. Lusis, B. J. McCarthy, R. W. Mahley, B.Levy-Wilson, and J. Scott. 1986. Complete protein sequence andidentification of structural domains of human apolipoprotein B.Nature (Lond.). 323:734-738.
Lewis, B. A., and D. M. Engelman. 1983. Lipid bilayer thickness varieslinearly with acyl chain length in fluid phosphatidylcholine vesicles. J.Mol. Biol. 166:211-217.
McIntosh, T. J., and P. W. Holloway. 1987. Determination of the depthof bromine atoms in bilayers formed from bromolipid probes. Biochem-istry. 26:1783-1788.
Olofsson, S-O., K. Bjursell, K. Bostr6m, P. Carlsson, J. Elovson, A. A.Protter, M. A. Reuben, and G. Bonjers. 1987. Apolipoprotein B:structure, biosynthesis and role in the lipoprotein assembly process.Atherosclerosis. 68:1-17.
Schiller, P. W. 1972. Study of adrenocorticotropic hormone conforma-tion by evaluation of intramolecular resonance energy transfer inN-dansyllysine-ACTH-(1-24)-tetrakosipeptide. Proc. Nati. Acad. Sci.USA. 69:975-979.
Shen, B. W., A. M. Scanu, and F. J. Kezdy. 1977. Structure of humanserum lipoproteins inferred from compositional analysis. Proc. Natl.Acad. Sci. USA. 74:837-841.
Stryer, L. 1978. Fluorescence energy transfer as a spectroscopic ruler.Annu. Rev. Biochem. 47:819-846.
Torgerson, P. M., and M. F. Morales. 1984. Application of theDale-Eisinger analysis to proximity mapping in the contractilesystem. Proc. Natl. Acad. Sci. USA. 81:3723-3727.
Vauhkonen, M., and P. Somerharju. 1989. Parinaryol and pyrenylphospholipids as probes for the lipid surface layer of human lowdensity lipoproteins. Biochim. Biophys. Acta. 984:81-87.
Yang, C.-Y., S.-H. Chen, S. H. Giaturco, W. A. Bradley, J. T. Sparrow,M. Tanimura, W.-H. Li, D. A. Sparrow, H. DeLoof, M. Rosseneu,F.-S. Lee, Z.-W. Gu, A. M. Gotto, Jr., and L. Chan. 1986. Sequence,structure, receptor binding domains and internal repeats of humanapolipoprotein B-100. Nature (Lond.). 323:738-742.
Bastiaens et al. Resonance Energy Transfer 675