Mathematical modeling of the apo and holo transcriptional regulation in Escherichia coli
11
Molecular BioSystems Interfacing chemical biology with the -omic sciences and systems biology www.rsc.org/molecularbiosystems ISSN 1742-206X PAPER Fernando J. Alvarez-Vasquez et al. Mathematical modeling of the apo and holo transcriptional regulation in Escherichia coli Volume 11 Number 4 April 2015 Pages 971–1206 Indexed in Medline!
Transcript of Mathematical modeling of the apo and holo transcriptional regulation in Escherichia coli

Molecular BioSystemsInterfacing chemical biology with the -omic sciences and systems biologywww.rsc.org/molecularbiosystems
ISSN 1742-206X
PAPERFernando J. Alvarez-Vasquez et al.Mathematical modeling of the apo and holo transcriptional regulation in Escherichia coli
Volume 11 Number 4 April 2015 Pages 971–1206
Indexe
d in
Medlin
e!

994 | Mol. BioSyst., 2015, 11, 994--1003 This journal is©The Royal Society of Chemistry 2015
Cite this:Mol. BioSyst., 2015,
11, 994
Mathematical modeling of the apo and holotranscriptional regulation in Escherichia coli†
Fernando J. Alvarez-Vasquez,*a Julio A. Freyre-Gonzalez,b Yalbi I. Balderas-Martınez,‡c Monica I. Delgado-Carrillod and Julio Collado-Videsc
Transcription factors (TFs) modulate gene expression as a consequence of internal or exogenous
changes in cell signaling. TFs can bind to DNA either with their effector bound (holo conformation),
or as free proteins (apo conformation). With the aim of contributing to the understanding of the
evolutionary fitness and organizational principles behind the different TF conformations, we inquire into
the origins of these conformational differences by analyzing these two TF conformations from the
perspective of Savageau’s demand theory. For the control of a gene whose function is in high demand,
we found that evolutionary constraints are responsible for activator TFs binding to DNA mainly in holo
conformation whereas apo activation is under-represented. The mathematically controlled comparison
of the apo and holo conformations reveals formal and evolutionary arguments in favor of this TF control
asymmetry, which suggests that evolution favors holo activation under environmental conditions
commonly found by E. coli in the human digestive tract. Specifically, the sensibility analysis performed
for the holo conformation, in the positive mode of regulation, shows that the wild-type is more robust
for situations where realizable changes in the model’s parameters favored a better performance under
non-stressful environmental conditions commonly found by E. coli in the human digestive tract. By
contrast, the positive apo conformation is better adapted to adverse situations. On the other hand, the
sensibility analysis performed for the negative mode of regulation showing none of the TF active
conformations presents an advantage.
Introduction
Based on the active conformation of 149 TFs collected fromthe RegulonDB database, Balderas-Martınez et al.1 reported ageneral trend for activator TFs to bind in holo conformation inEscherichia coli K-12, suggesting that apo activation is under-represented.
Why is the transcription factor in holo conformation dominantin the Escherichia coli K-12 bacteria as the mode of regulation?Why is the apo active conformation under-represented? Are thesealternative TFs conformations historical accidents or have theybeen evolved in base of their functional differences?
In this work, we inquire into the possible evolutionaryorigins of this asymmetry from a population genomics perspec-tive. We explored how mutations and selection could affect thepreference for certain TF active conformations, and presentevolutionary and mathematical arguments for the apo–holoasymmetry as a product of adaptations allowing the bacteriato respond optimally to the challenges it faces inside themammalian gut.
Warm-blooded animals provide a favorable habitat and repro-duction niche for Escherichia coli.2,3 However, even inside the hostthis enterobacteriaceae member faces stress-induced situationssuch as host diet, competition with other microbiota, etc.4
We evaluate the possible influence of the TF–DNA protectiveinteraction on the different TF active conformations and modesof regulation of the environmental conditions for E. coli insidethe gut.
Theoretical studies have suggested a functional explanationfor the demand theory of gene regulation (DTGR) predictions,claiming that the TF can protect the DNA from errors producedby unspecific interactions between DNA and proteins or otherbiological components.5 Recently, the possibility of TF–DNAerror minimization has been tested experimentally with syntheti-cally engineered organisms.6
a National Institute of Agronomic Research, UR1115 PSH, Avignon, France.
E-mail: [email protected] Evolutionary Genomics Program, Center for Genomic Sciences, Universidad
Nacional Autonoma de Mexico, A.P. 565-A, Cuernavaca, Morelos 62100, Mexicoc Computational Genomics Program, Center for Genomic Sciences, Universidad
Nacional Autonoma de Mexico, A.P. 565-A, Cuernavaca, Morelos 62100, Mexicod Institute of Applied Mathematics, University of British Columbia, Vancouver,
British Columbia, V6T 1Z4, Canada
† Electronic supplementary information (ESI) available. See DOI: 10.1039/c4mb00561a‡ Current address: Facultad de Ciencias, Universidad Nacional Autonoma deMexico, Mexico City, Mexico.
Received 21st September 2014,Accepted 30th January 2015
DOI: 10.1039/c4mb00561a
www.rsc.org/molecularbiosystems
MolecularBioSystems
PAPER
Publ
ishe
d on
02
Febr
uary
201
5. D
ownl
oade
d by
FA
C D
E Q
UIM
ICA
on
21/0
3/20
15 1
5:15
:30.
View Article OnlineView Journal | View Issue
This journal is©The Royal Society of Chemistry 2015 Mol. BioSyst., 2015, 11, 994--1003 | 995
Model description
The DTGR establishes an evolutionary framework predictinga positive control if the expression of a structural gene isnecessary for the majority of the organism’s cycle time (highdemand) and a negative control if that gene is only necessaryduring a small fraction of the cycle time (low demand).7–9
Gerland and Hwa10 analyzed genetic robustness as a possibleevolutionary-driving force when transcriptional functionality isminimally used during definite biological periods. This groupfound that both modes of gene regulation (i.e. DTGR driven bythe transcriptional rate and the regulation driven by geneticrobustness) can have an effect on the organism, depending onthe time scales and nutrient fluctuations involved. They showedthat DTGR is more appropriate in describing relatively smallpopulations and long-time scales of environmental variation.
Nevertheless, metabolism and gene regulation are stronglycoupled by allosterism in bacteria. Interactions betweenmetabolic effectors and their cognate TFs play a fundamentalrole in controlling genetic output,11,12 given that geneticresponse not only depends on the presence/absence of the TFbut also on the combinatorial control exerted by both the TFand the metabolic effector. Based on information collectedfrom the RegulonDB database13 a recent study found thatactivator TFs mainly regulate in holo conformation, and providedevidence of statistical under-representation of the apo activationin Escherichia coli K-12.1
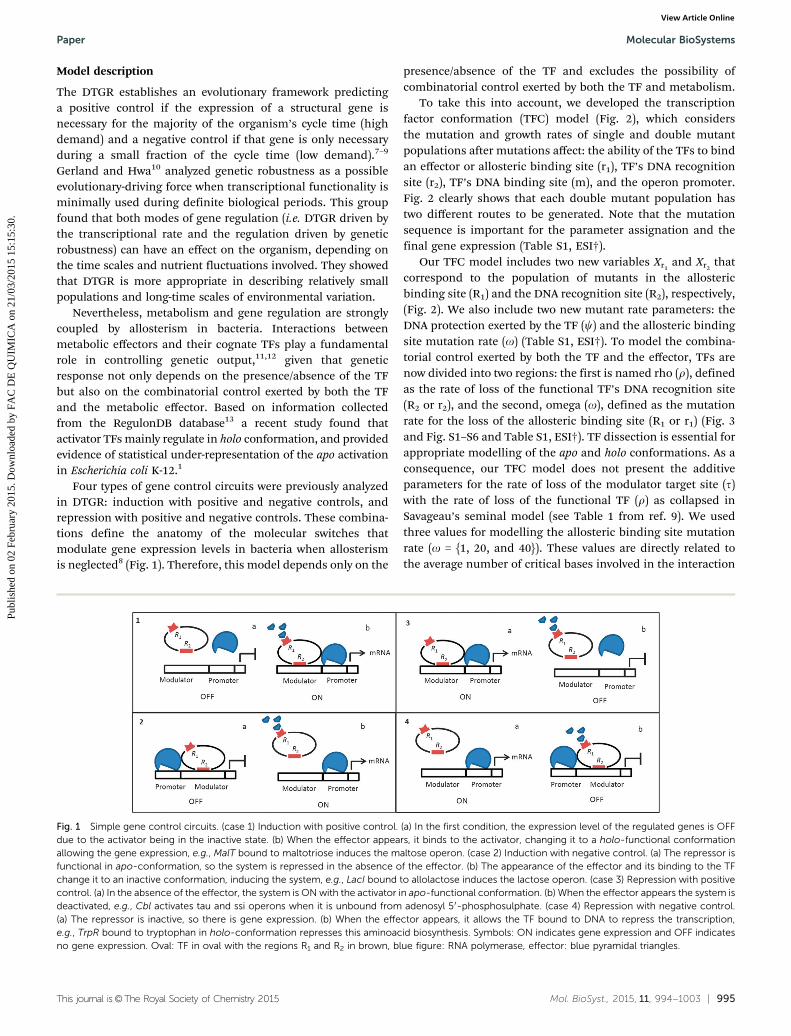
Four types of gene control circuits were previously analyzedin DTGR: induction with positive and negative controls, andrepression with positive and negative controls. These combina-tions define the anatomy of the molecular switches thatmodulate gene expression levels in bacteria when allosterismis neglected8 (Fig. 1). Therefore, this model depends only on the
presence/absence of the TF and excludes the possibility ofcombinatorial control exerted by both the TF and metabolism.
To take this into account, we developed the transcriptionfactor conformation (TFC) model (Fig. 2), which considersthe mutation and growth rates of single and double mutantpopulations after mutations affect: the ability of the TFs to bindan effector or allosteric binding site (r1), TF’s DNA recognitionsite (r2), TF’s DNA binding site (m), and the operon promoter.Fig. 2 clearly shows that each double mutant population hastwo different routes to be generated. Note that the mutationsequence is important for the parameter assignation and thefinal gene expression (Table S1, ESI†).
Our TFC model includes two new variables Xr1and Xr2
thatcorrespond to the population of mutants in the allostericbinding site (R1) and the DNA recognition site (R2), respectively,(Fig. 2). We also include two new mutant rate parameters: theDNA protection exerted by the TF (c) and the allosteric bindingsite mutation rate (o) (Table S1, ESI†). To model the combina-torial control exerted by both the TF and the effector, TFs arenow divided into two regions: the first is named rho (r), definedas the rate of loss of the functional TF’s DNA recognition site(R2 or r2), and the second, omega (o), defined as the mutationrate for the loss of the allosteric binding site (R1 or r1) (Fig. 3and Fig. S1–S6 and Table S1, ESI†). TF dissection is essential forappropriate modelling of the apo and holo conformations. As aconsequence, our TFC model does not present the additiveparameters for the rate of loss of the modulator target site (t)with the rate of loss of the functional TF (r) as collapsed inSavageau’s seminal model (see Table 1 from ref. 9). We usedthree values for modelling the allosteric binding site mutationrate (o = {1, 20, and 40}). These values are directly related tothe average number of critical bases involved in the interaction
Fig. 1 Simple gene control circuits. (case 1) Induction with positive control. (a) In the first condition, the expression level of the regulated genes is OFFdue to the activator being in the inactive state. (b) When the effector appears, it binds to the activator, changing it to a holo-functional conformationallowing the gene expression, e.g., MalT bound to maltotriose induces the maltose operon. (case 2) Induction with negative control. (a) The repressor isfunctional in apo-conformation, so the system is repressed in the absence of the effector. (b) The appearance of the effector and its binding to the TFchange it to an inactive conformation, inducing the system, e.g., LacI bound to allolactose induces the lactose operon. (case 3) Repression with positivecontrol. (a) In the absence of the effector, the system is ON with the activator in apo-functional conformation. (b) When the effector appears the system isdeactivated, e.g., Cbl activates tau and ssi operons when it is unbound from adenosyl 5 0-phosphosulphate. (case 4) Repression with negative control.(a) The repressor is inactive, so there is gene expression. (b) When the effector appears, it allows the TF bound to DNA to repress the transcription,e.g., TrpR bound to tryptophan in holo-conformation represses this aminoacid biosynthesis. Symbols: ON indicates gene expression and OFF indicatesno gene expression. Oval: TF in oval with the regions R1 and R2 in brown, blue figure: RNA polymerase, effector: blue pyramidal triangles.
Paper Molecular BioSystems
Publ
ishe
d on
02
Febr
uary
201
5. D
ownl
oade
d by
FA
C D
E Q
UIM
ICA
on
21/0
3/20
15 1
5:15
:30.
View Article Online

996 | Mol. BioSyst., 2015, 11, 994--1003 This journal is©The Royal Society of Chemistry 2015
between TFs and their cognate metabolic effectors, and corre-spond to around 1, 10, and 20 amino acids, respectively,because the third codon position is the wobble position.We chose these values in agreement with experimental datafor LacI showing that the region encoding the essential residuesinvolved in the interaction with allolactose is in the range of20 to 40 critical bases.14 Please note that o = 1 is an extremevalue that assumes that a single base mutation could disturbthe functionality of a fragile TF interaction with its effector.
Model assumptions
To perform a mathematically controlled comparison betweenregulatory modes (repressor and activator) of TFs and the twopossible active conformations (holo and apo), we selected fourTFs, each representative of a corresponding combination of theregulatory mode and active conformation: LacI (repressor, apo)and MalT (activator, holo), TrpR (repressor, holo) and Cbl (activator,apo). LacI and MalT numerical parameters were collected fromref. 8, and extrapolated to TrpR and Cbl (Table S3, ESI†), given thelimited amount of information on the specific TF parametervalues, especially for Cbl.
For all the TF conformations analyzed, it is assumed that theTF–effector interaction produces a conformational change in theTF that affects the TF–DNA binding site. In mathematical terms,this implies an additive effect of o and r over the mutation rates,c, i1, j2, and k2, (Table S1, ESI†). This intrinsic TF interaction hasbeen experimentally reported, at least for the well-documentedLacI, by molecular structure analysis,15 and by changing residuesthat affect the binding site,16 among others.
In all the TFs analyzed, it is assumed that the regulatoryproteins follow a classical coupled circuit regulation where theTF itself is unregulated,17 as has been experimentally reported forLacI operon regulation.18 Mathematically, the implication is thatepsilon’s (e) mutation rate does not affect the TF expression whenthe structural gene expression is enhanced (Table S1, ESI†).
Following the same assumption as in the DTGR model,we did not include the analysis of possible combinationsof double, triple or quadruple mutant populations due to thelow probability of their occurrence. Nevertheless the universeof double mutants is presented in Fig. 2 and eqn (S25)–(S30)(ESI†).
As represented by the unidirectional arrows in Fig. 2, it isassumed that the possible reverse mutations restoring theoriginal DNA functionality or compensating the mutationeffects are low and were neglected.
It is also assumed that the TF–modulator interactionreduces the basal rate of the mutation by a factor of c = 1/10.The parameter c represents the DNA mutation rate reductionas a consequence of DNA protection under extreme environ-mental conditions. This protein–DNA protection can occurunder oxidative stress or starvation (e.g. ref. 19 and 20) and isassociated with the non-specific binding of other TFs, metabo-lites, and/or other proteins to the free binding site.5
The growth parameter delta (d) was assigned accordingto the more nutritionally deficient environment along theproximal and distal portions of the human digestive tract(Table S2, ESI†).
In the case of Cbl, the d assignation during the high demandfraction of the E. coli cycle was made in spite of the presence ofsulphur nutrients in the colon,21 under the assumption ofstarvation for sulphur scavenging as a consequence of competi-tion with other sulphur-specialized microorganisms and/or bycompetition with the host22 (see Discussion for details).
Given that the idea was to make mathematically-controlledcomparisons of the active conformations within the activatorand repressor modes of regulation, the TFs with dual modes ofcontrol are not included in this work.
Results and discussion
The diagrams in Fig. 3 and Fig. S1–S6 (ESI†) represent all thedifferent possible conditions under which the wild-type andsingle or double mutant regulate or deregulate the expressionof the structural genes during high and low demand.
Thresholds of selection (TS) for the wild-type regulatorymechanism
The thresholds of selection from Fig. 4 and 5 and Fig. S7–S10(ESI†) define the population’s boundary between the wild typeand the corresponding single mutant. These were obtained byequating eqn (S33) and (S34) (ESI†) with the criterion ofselection (y) (whichever gives the maximum ratio) and solvedby using the method of bisection to find C with respect to D(or D with respect to C) (see ESI† for details).
Fig. 2 Schematic diagram representing the wild-type and mutantpopulations. The symbols are as follows: Xw the number of wild-typeorganisms; Xp the number of promoter mutants; Xm the number ofmodulator mutants; Xr1
the number of regulator mutants at the ligandbinding domain; Xr2
the number of regulator mutants at the DNA bindingdomain; Xd1
� � �Xd2double mutants. The growth rates are represented by
gi where i can take the symbols {w, m, p, r1, r2, d1, d2, d3, d4, d5, and d6}. Thesymbols inside the square frames correspond to the mutation taking place.The alpha-numbers at one side of the arrows correspond to the mutationrates in Table S1 (ESI†) key.
Molecular BioSystems Paper
Publ
ishe
d on
02
Febr
uary
201
5. D
ownl
oade
d by
FA
C D
E Q
UIM
ICA
on
21/0
3/20
15 1
5:15
:30.
View Article Online

This journal is©The Royal Society of Chemistry 2015 Mol. BioSyst., 2015, 11, 994--1003 | 997
LacI threshold of selection. LacI is negatively regulated in apoconformation when the demand for lactose catabolism is low.23
Fig. 4a and Fig. S7 (ESI†) show that LacI wild-type TS aresimilar to Savageau’s seminal model with respect to theirshapes and demand extreme values (Fig. 2A from ref. 8) butdifferent with respect to the TS enclosing the wild-type region.When omega equals 20 and 40, the wild-type boundariesare delimited by Xr1
/Xw and Xr2/Xw with the TS for Xm/Xw and
promoter Xp/Xw at the periphery. When o increases, the Xr1/Xw
curve moves to the right and the Xr2/Xw curve is displaced
slightly to the left; these two migrations act in conjunction,narrowing the wild-type region.
TrpR thresholds of selection. The TrpR regulon is involvedin tryptophan biosynthesis, transport, and regulation.24 It is
negatively regulated in holo conformation when the demand fortryptophan is low.
Fig. 4b and Fig. S8 (ESI†) show the following: first, that thecurves of the modulator and promoter are similar in shape tothose obtained with LacI (Fig. 4a and Fig. S7, ESI†); second, thatwhen o increases, the Xr2
/Xw threshold moves inwards throughsmaller values of the demand, narrowing the wild-type region;and third, that in all the simulations, the wild-type region isdelimited by Xp/Xw on the left side of the demand and by Xr2
/Xw
on the right side.MalT thresholds of selection. The MalT regulon is active
when the demand for the maltose catabolism is high.25 Duringhigh demand, MalT is holo positively regulated, acting over thesite of action of regulatory DNA.
Fig. 3 Regulation for LacI of an inducible system with negative control during high (a) and low demands (b). The DNA can mutate (diagonal red line)in the modulator (M), promoter (P), and/or in the regulator site R1 if the mutation occurs in the TF-ligand domain or in R2 if the mutation occurs in theTF–DNA binding domain. The horizontal arrow represents the gene expression of the structural gene (E). A blue line starting from R2 and ending in anarrowhead indicates the interaction of the TF with the DNA; if the blue line ends in an X, it represents no TF–DNA interaction with the operon. (a) Highdemand; (a) wild type, (b–e) four single mutants, (f–k) six double mutants. (b) Low demand; (a–k) similar to Fig. 3a.
Paper Molecular BioSystems
Publ
ishe
d on
02
Febr
uary
201
5. D
ownl
oade
d by
FA
C D
E Q
UIM
ICA
on
21/0
3/20
15 1
5:15
:30.
View Article Online

998 | Mol. BioSyst., 2015, 11, 994--1003 This journal is©The Royal Society of Chemistry 2015
Fig. 4c and Fig. S9 (ESI†) show that the shapes for thethreshold of selection for the modulator and promoter aresimilar to those obtained with Savageau’s model (ref. 8,Fig. 3A). However, the wild-type boundaries Xp/Xw and Xr2
/Xw
are delimited now. When o is increased, the Xr2/Xw thresholds
shift to the left increasing the wild-type region.Cbl thresholds of selection. In the colon, Cbl activates
two transcription units, tauABCD and ssuEADCB, coding forproteins responsible for the transport and catabolism oftaurine and aliphatic sulphonates, respectively – two alternativesources of sulphur.26
Cbl regulation is intimately associated with the hierarchicalpreference of E. coli for sulphur sources: cysteine 4 sulphate 4sulphonates.27 In the presence of cysteine, the preferred sulphursource, the Cbl associate regulon is not expressed. This isbecause CysB, the major regulator of sulphur utilization, isinactive.
When sulphur is present, N-acetyl-L-serine (NAS) binds to CysBto change its state into the functional holo conformation.28 In theabsence of sulphur, the APS concentration decreases, so Cbl canregulate its regulon in its functional apo conformation.
Fig. 4d and Fig. S10 (ESI†) show the wild-type TS boundariesof the wild-type region delimited by Xr1
/Xw and Xr2/Xw. When o
increases, Xr1/Xw and Xr2
/Xw thresholds shift to the right and theleft, respectively, narrowing the wild-type region.
Overlapping between the TF wild-type areas. Fig. 5 presentsthe TS with the abscissa in a linear scale for ease of comparisonbetween the TF wild-type regions. As in the seminal Savageaumodel, there are no wild-type regions overlapping between thenegative (Fig. 5a and b) and positive (Fig. 5c and d) modes ofregulation. Please note that the Xr2
/Xw threshold determines forall the cases the boundary for the wild type between the positiveand negative modes of regulation.
Within the two modes of regulation, there is an almost completeoverlapping of the wild-type regions, indicating that the apo andholo conformations do not differentiate in this aspect (Fig. 5).
Tables S4–S6 (ESI†) offer an overview of the population areasframed by the TS from Fig. 4 and Fig. S7–S10 (ESI†) after ovariation. They mark the wild-type as well as the realizablefavorable (F) and unfavorable (U) single mutant populationregions under high demand. The regions not marked representzones of coexistence of single mutants.
Fig. 4 TS of the wild-type regulatory mechanism. Curves when o = 40, region for the wild-type and mutants as Ci,j with i = {1. . .3}; j = {1. . .3}. Thethresholds are represented on a logarithmic scale as functions of the demand for gene expression (D) and the cycle time (C). The thresholdsare for the promoter (p) in blue, modulator (m) in black, TF-effector regulatory section (r1) in green, and TF-DNA regulatory section (r2) in red.The solid and dotted line intervals for each curve represent the low- and high-C asymptotes, respectively, where the root finding methodwas implemented. The blue arrows, perpendicular to the TS, point in the direction of the population’s realizable regions. (a) LacI; (b) TrpR;(c) MalT; and (d) Cbl.
Molecular BioSystems Paper
Publ
ishe
d on
02
Febr
uary
201
5. D
ownl
oade
d by
FA
C D
E Q
UIM
ICA
on
21/0
3/20
15 1
5:15
:30.
View Article Online

This journal is©The Royal Society of Chemistry 2015 Mol. BioSyst., 2015, 11, 994--1003 | 999
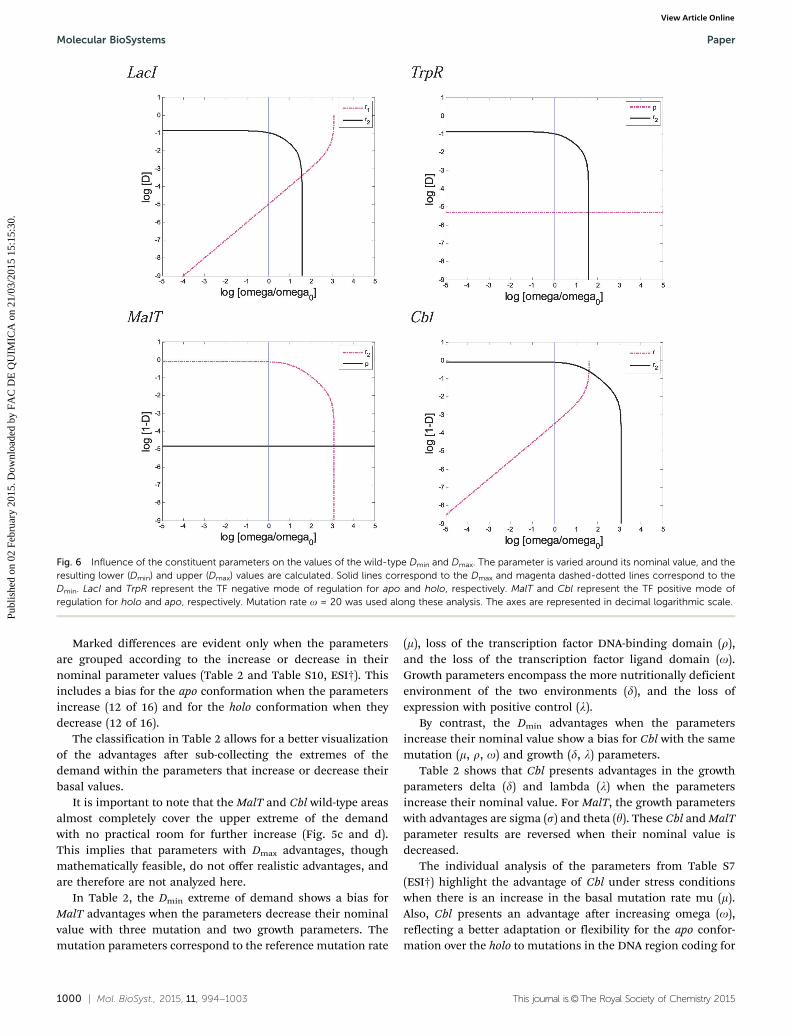
Influence of parameters on minimum and maximum values ofdemand
Wild-type TS from Fig. S7–S10 (ESI†), when o = 20, were usedalong this sensitivity analysis.
Fig. 6 and Fig. S15 (ESI†) display the influence of theparameter change on the extreme values of the demand.Fig. S16 (ESI†) presents the influence of the parameters overthe TS not surrounding the wild-type region.
Each TFC model parameter (Table 1 and Table S3, ESI†) wasevaluated around its nominal value and its influence over Dmin andDmax were analyzed (see the ESI† Model description for details).
The sensitivities were analyzed by comparing their effectover the area of the wild-type region. A change that producesan increase in the wild-type region is considered to be advanta-geous over other changes that do not have discernible effectsor that produce a decrease of the wild-type region. If nodiscernible difference is found, then no advantage is selectedfor any TF conformation.
Negative mode of regulation
With the exception of p ando, there is almost complete equilibriumof the advantages between the two TF conformations (Table 2 andTable S7 and S8, ESI†). When the parameters p and o increase in
value, they present advantages for LacI and TrpR; the opposite is truewhen p and o decrease in their nominal values.
These TF mirror advantages for p and o are for both theDmin sides of the demand (Table 2). However, because there isno significant room to additionally increase the wild-typeregion from the Dmin side, there is no practical implementationor advantage, even if it is theoretically possible (see Fig. 4a, b,5a, b and Fig. S7, S8, ESI†).
On the whole, from the point of view of the parametersensitivities, the apo and holo conformations are both well-adapted at the negative mode of regulation. At least, this is thecase if one does not take into consideration other factors thatcould bias the advantages. Possible examples of this mightinvolve mechanisms not included in the model, such as the TrpRattenuation29,30 or gene regulation by auto-regulation.13,24,31
Positive mode of regulation. Table 2 and Tables S7 and S9(ESI†) show that the advantages of one parameter frequentlyappears in tandem for both extremes of the demand.
Globally, the parameters with advantages are equally distri-buted between the two conformations, with 16 cases each(first row Table S10, ESI†). In addition, Table S10 (ESI†) showsthat the advantages are equally distributed after groupingwith respect to the extremes of the demand or according tothe mutation and growth parameters.
Fig. 5 TS of a wild-type regulatory mechanism. The demand (D) vs. total cycle (C) are represented in linear and logarithmic scales, respectively.Dynamics with o = 20. (a) LacI; (b) TrpR, curves for the thresholds for Xr1
/Xw and Xm/Xw are superimposed; (c) MalT, curves for Xr1/Xw and Xm/Xw are
superimposed; and (d) Cbl.
Paper Molecular BioSystems
Publ
ishe
d on
02
Febr
uary
201
5. D
ownl
oade
d by
FA
C D
E Q
UIM
ICA
on
21/0
3/20
15 1
5:15
:30.
View Article Online
1000 | Mol. BioSyst., 2015, 11, 994--1003 This journal is©The Royal Society of Chemistry 2015
Marked differences are evident only when the parametersare grouped according to the increase or decrease in theirnominal parameter values (Table 2 and Table S10, ESI†). Thisincludes a bias for the apo conformation when the parametersincrease (12 of 16) and for the holo conformation when theydecrease (12 of 16).
The classification in Table 2 allows for a better visualizationof the advantages after sub-collecting the extremes of thedemand within the parameters that increase or decrease theirbasal values.
It is important to note that the MalT and Cbl wild-type areasalmost completely cover the upper extreme of the demandwith no practical room for further increase (Fig. 5c and d).This implies that parameters with Dmax advantages, thoughmathematically feasible, do not offer realistic advantages, andare therefore are not analyzed here.
In Table 2, the Dmin extreme of demand shows a bias forMalT advantages when the parameters decrease their nominalvalue with three mutation and two growth parameters. Themutation parameters correspond to the reference mutation rate
(m), loss of the transcription factor DNA-binding domain (r),and the loss of the transcription factor ligand domain (o).Growth parameters encompass the more nutritionally deficientenvironment of the two environments (d), and the loss ofexpression with positive control (l).
By contrast, the Dmin advantages when the parametersincrease their nominal value show a bias for Cbl with the samemutation (m, r, o) and growth (d, l) parameters.
Table 2 shows that Cbl presents advantages in the growthparameters delta (d) and lambda (l) when the parametersincrease their nominal value. For MalT, the growth parameterswith advantages are sigma (s) and theta (y). These Cbl and MalTparameter results are reversed when their nominal value isdecreased.
The individual analysis of the parameters from Table S7(ESI†) highlight the advantage of Cbl under stress conditionswhen there is an increase in the basal mutation rate mu (m).Also, Cbl presents an advantage after increasing omega (o),reflecting a better adaptation or flexibility for the apo confor-mation over the holo to mutations in the DNA region coding for
Fig. 6 Influence of the constituent parameters on the values of the wild-type Dmin and Dmax. The parameter is varied around its nominal value, and theresulting lower (Dmin) and upper (Dmax) values are calculated. Solid lines correspond to the Dmax and magenta dashed-dotted lines correspond to theDmin. LacI and TrpR represent the TF negative mode of regulation for apo and holo, respectively. MalT and Cbl represent the TF positive mode ofregulation for holo and apo, respectively. Mutation rate o = 20 was used along these analysis. The axes are represented in decimal logarithmic scale.
Molecular BioSystems Paper
Publ
ishe
d on
02
Febr
uary
201
5. D
ownl
oade
d by
FA
C D
E Q
UIM
ICA
on
21/0
3/20
15 1
5:15
:30.
View Article Online

This journal is©The Royal Society of Chemistry 2015 Mol. BioSyst., 2015, 11, 994--1003 | 1001
the effector TF binding site. In addition, Cbl better tacklesmutations that increase rho (r) than MalT. The parameter rho(r) represents the rate of mutations at the level of the TF-site ofinteraction with the DNA (Table 1).
The criterion of selection theta (y) represents the minimalfraction a mutant population can decrease with respect to thewild type before it disappears in a given environment.32 A lowvalue of y indicates better adaptation under extreme condi-tions. Table S9 (ESI†) shows that a decreasing y is advantageousfor Cbl over MalT.
In summary, individual analyses of the parameter sensitiv-ities indicate that Cbl apo conformation is better adapted tostress situations where the rates of the mutation are likely to beincreased and the selection coefficient theta (y) decreased.
Two parameters, gamma (g) and psi (c), exhibit no influence inany of the cases (Fig. S15h and S16i, ESI†). The parameter grepresents the reference mutation rate in the richer of the twoenvironments.
The parameter c represents the decrease in the mutationbasal rate when the TF interacts with the DNA binding site(Table 1). Fig. S15g and S16h (ESI†) do not reveal sensibilityeffects to the changes in c around their nominal value. However,Fig. S16h (ESI†) shows that a 20-fold and 40-fold increase in thenominal value for the negative and positive modes of regulation,respectively, produces an abrupt decrease in the threshold ofselection modulator sensitivities. In addition, simulations (notshown) can reproduce these abrupt sensitivity changes around thenominal value if the basal mutation rate (m) is increased 100-fold.These simulations indicate that c can become an importantparameter that affects the boundaries delimited by Xm/Xw in stresssituations when the basal mutation rate is incremented (e.g. underheat shock, starvation, or oxidative stress).
From an evolutionary standpoint, the results indicate thatthe positive apo conformation (Cbl) has been under selectivepressure, likely due to the particular stress suffered due tosulfate limitation in the distal digestive tract. By contrast,positive holo conformation (MalT) adapts better to the ‘‘normal’’conditions that E. coli more frequently faces in the colon of thedigestive tract.
Conclusions
To the best of our knowledge, this is the first mathematicalmodel explicitly comparing the evolutionary adaptations of theapo–holo TF conformations in any organism.
Thresholds of selection
There is no wild type region overlap between negative (Fig. 5aand b) and positive (Fig. 5c and d) modes of regulation. Incontrast, within each of the separate modes of regulation thereis almost complete overlap.
With the exception of LacI, where the Dmin threshold ofselection changes from Xp/Xw (when o = 1) to Xr1
/Xw (wheno = 20 and 40), the rest of the TFs analyzed maintain the sameTS boundaries for the wild-type region along the differento values studied (Fig. 4 and 5 and Fig. S7–S10, ESI†).
In Fig. 4, 5 and Fig. S7–S10 (ESI†), it can be seen that theXm/Xw TS are never part of the boundary limits for the wild-typepopulation in either mode of regulation. Rather, Xp/Xw isfrequently the wild-type lower limit of the demand. In manycases, at least one of the TS enclosing the wild-type regionscorresponds to Xr1
/Xw or Xr2/Xw.
As expected, the promoter and modulator LacI and MalT TSpresented in Savageau’s model8 have shapes similar to thoseobtained with the TFC model, although slight differences canbe observed with respect to the wild-type extent of selections.The reason behind these differences can be found in theincrease in the details of the regulation, as seen with thedissection of the TF in two sectors r1 and r2.
Sensitivity analysis
Within the positive mode of regulation, there is a markeddifference between the two conformations when they are grouped
Table 2 Summary of the advantages from Tables S8 and S9 (ESI) aftersubdivisions. Advantages are classified according to the increase and decreasearound the nominal value, sub-grouped according to the extremes of thedemand and further sub-grouped between mutation or growth parameters
Negative Positive
LacI TrpR MalT Cbl
Increase (-) Dmin Mutation p o — m, r, oGrowth — — s, y d, l
Dmax Mutation — — — m, u, r, o, eGrowth — — l, y d, s
Decrease (’) Dmin Mutation o p m, r, o —Growth — — d, l s, y
Dmax Mutation — — m, u, r, o, e —Growth — — d, s l, y
Table 1 Definition for the model mutation and growth rate parameters
Mutation rate parameters
m Reference mutation ratep Relative to m, for loss of a strong promoter with negative controlu Relative to m, for gain of an up-promoter with positive controlt Relative to m, for loss of a regulator’s functional target siter Relative to m, for loss of the transcription factor DNA binding
domaino Relative to m, for loss of the transcription factor ligand domaine Relative to m, when expression is increased 100-foldc Relative to m, for a 10-fold decrease in m when the transcription
factor interacts with its functional DNA binding domain
Growth rate parameters
g Reference growth rate in the nutritionally richer of the twoenvironments
d Relative to g, for the more nutritionally deficient of the twoenvironments
l Relative to g, when there is a loss of expression with negativecontrol
l Relative to gd, when there is a loss of expression with positivecontrol
s Relative to g, when there is superfluous expression with positivecontrol
s Relative to gd, when there is superfluous expression with negativecontrol
Paper Molecular BioSystems
Publ
ishe
d on
02
Febr
uary
201
5. D
ownl
oade
d by
FA
C D
E Q
UIM
ICA
on
21/0
3/20
15 1
5:15
:30.
View Article Online

1002 | Mol. BioSyst., 2015, 11, 994--1003 This journal is©The Royal Society of Chemistry 2015
according to the parameter increase or decrease and furthersubdivided according to the extremes of the demand (Table 2).
The parameter advantages for the positive mode of regula-tion are biologically realizable from the Dmin side (see Fig. 5cand d), which indicates that the organism can deal well withmutations related to short periods of high demand. The reverseis true for the case of negative regulation, which is betteradapted to dealing with increasing periods of high demand(Dmax); in this case, the sensibility parameters do not exhibit abias for either transcriptional configuration (Table 2), whichis in accordance with the more balanced frequencies reportedin ref. 1. The selection of one or the other transcriptionalmechanism is probably made on the basis of other selectionistarguments.
Exploratory studies for the six LacI double mutants (notshown) produced a range of different TS but with low-level totallife cycle (C) curves as the common denominator. These resultswould indicate a better adaptation of these mutants to largertotal life cycles or, in other words, a predominant presence ofthe wild type for shorter life cycles.
Cbl positive apo active conformation
The reported presence of inorganic sulfate along the mammalianintestine21 predicts that Cbl should be in its non-functional holoconformation when E. coli colonizes the colon.
In principle, this is in contradiction with our model assump-tion that Cbl should be in its functional apo conformation inthat later section of the intestine. A possible reason behind thisassumption is that E. coli could face starvation for inorganicsulphur during the period spent in the distal region of theintestine as a consequence of competition for the element withsulfate-reducing bacteria in the large intestine33 (see deltaassignation (d) for Cbl in Table S2, ESI†). This is a highlycompetitive environmental situation where cysteine andsulphate could be effectively unavailable for E. coli (or withlow scavenging capacity). This would force the organism to useother sulphate sources such as taurine, which is found in highconcentrations in the colon, where it is key for chelating bileacids, or sulphonates, whose assimilation and catabolism intosulfite are activated by Cbl under its active apo conformation.This situation for Cbl apo conformation could also probablyoccur in unpredictable sulphate detrimental situations outsideof the host as well.
In conclusion, the results presented here furnish evolutionaryarguments favoring the holo conformation over the apo TFrepresentation under the positive modes of control, as reportedrecently.1 In addition, the observed unbiased distribution forthe negative apo or holo frequencies is also in accordance withthe no-preference model parameter sensitivities for the two TFconfigurations studied.
Future considerations
Other E. coli genetic regulations such as the dual TF orattenuation can encompass control systems of relevance notanalyzed here. The extension of the TFC model to the other
transcriptional mechanisms of regulation is an open researchtopic that might be developed.
A better comprehension of the apo and holo transcriptionalregulation connected to an organism’s life cycle is fundamentalfor improving the design of ‘‘a la carte’’ bacteria that may notbe as robust as the wild type,34 but will offer specific fitnessadvantages of human interest. In this respect, there is evidencein the literature for E. coli systems built on the basis of a deepunderstanding of the transcriptional regulation mechanisms.35
The TFC model consists of a set of binary S-system equations(eqn (S20)–(S30)) and can be log-transformed into linearequations allowing for reverse engineering with classic linearoptimization techniques for the design of mutants able to growin the demand and total cycle ranges of human interest.36 Thistechnique promises to rationalize the search for mutants ableto live during a given period of time and under certainenvironmental conditions from a universe of bacteria withdifferent modes of transcriptional regulation.
Acknowledgements
We acknowledge fruitful discussions with Dr Nestor TorresDarias, Dr Martın Peralta Gil, and members of the Computa-tional Genomics Research Program from the CCG-UNAM. Thiswork was partially supported by grant IA200614-2 from PAPIIT-UNAM to JAF-G. YIB-M acknowledges the PDCB of CCG-UNAMand her support by a PhD fellowship (228320/210360) fromCONACyT-Mexico.
References
1 Y. I. Balderas-Martınez, M. Savageau, H. Salgado, E. Perez-Rueda, E. Morett and J. Collado-Vides, PLoS One, 2013,8, e65723.
2 M. Savageau, Am. Nat., 1983, 122, 732–744.3 G. W. Tannock and D. C. Savage, Infect. Immun., 1974, 9,
591–598.4 M. T. Bailey, Horm. Behav., 2012, 62, 286–294.5 G. Shinar, E. Dekel, T. Tlusty and U. Alon, Proc. Natl. Acad.
Sci. U. S. A., 2006, 103, 3999–4004.6 V. Sasson, I. Shachrai, A. Bren, E. Dekel and U. Alon, Mol.
Cell, 2012, 46, 399–407.7 M. A. Savageau, Proc. Natl. Acad. Sci. U. S. A., 1977, 74,
5647–5651.8 M. A. Savageau, Genetics, 1998, 149, 1677–1691.9 M. A. Savageau, Genetics, 1998, 149, 1665–1676.
10 U. Gerland and T. Hwa, Proc. Natl. Acad. Sci. U. S. A., 2009,106, 8841–8846.
11 V. Baldazzi, D. Ropers, Y. Markowicz, D. Kahn, J. Geiselmannand H. de Jong, PLoS Comput. Biol., 2010, 6, e1000812.
12 O. Kotte, J. B. Zaugg and M. Heinemann, Mol. Syst. Biol.,2010, 6, 355.
13 H. Salgado, M. Peralta-Gil, S. Gama-Castro, A. Santos-Zavaleta,L. Muniz-Rascado, J. S. Garcia-Sotelo, V. Weiss, H. Solano-Lira,I. Martinez-Flores, A. Medina-Rivera, G. Salgado-Osorio,
Molecular BioSystems Paper
Publ
ishe
d on
02
Febr
uary
201
5. D
ownl
oade
d by
FA
C D
E Q
UIM
ICA
on
21/0
3/20
15 1
5:15
:30.
View Article Online
This journal is©The Royal Society of Chemistry 2015 Mol. BioSyst., 2015, 11, 994--1003 | 1003
S. Alquicira-Hernandez, K. Alquicira-Hernandez, A. Lopez-Fuentes, L. Porron-Sotelo, A. M. Huerta, C. Bonavides-Martinez, Y. I. Balderas-Martinez, L. Pannier, M. Olvera,A. Labastida, V. Jimenez-Jacinto, L. Vega-Alvarado, V. DelMoral-Chavez, A. Hernandez-Alvarez, E. Morett andJ. Collado-Vides, Nucleic Acids Res., 2013, 41, D203–D213.
14 P. Markiewicz, L. G. Kleina, C. Cruz, S. Ehret andJ. H. Miller, J. Mol. Biol., 1994, 240, 421–433.
15 M. Lewis, G. Chang, N. C. Horton, M. A. Kercher, H. C. Pace,M. A. Schumacher, R. G. Brennan and P. Lu, Science, 1996,271, 1247–1254.
16 S. Tungtur, S. M. Egan and L. Swint-Kruse, Proteins, 2007,68, 375–388.
17 M. Savageau, in Coupled circuits of gene regulation. In: Sequencespecificity in transcription and translation, ed. A. R. Liss,New York, 1985.
18 B. Muller-Hill and J. Kania, Nature, 1974, 249, 561–563.19 M. Almiron, A. J. Link, D. Furlong and R. Kolter, Genes Dev.,
1992, 6, 2646–2654.20 A. Martinez and R. Kolter, J. Bacteriol., 1997, 179, 5188–5194.21 T. Florin, G. Neale, G. R. Gibson, S. U. Christl and
J. H. Cummings, Gut, 1991, 32, 766–773.22 F. Carbonero, A. C. Benefiel, A. H. Alizadeh-Ghamsari and
H. R. Gaskins, Front. Physiol., 2012, 3, 448.23 J. H. Miller and W. S. Reznikoff, The Operon, Cold Spring
Harbor Laboratory, Cold Spring Harbor, NY, 2nd edn, 1980.24 I. M. Keseler, J. Collado-Vides, A. Santos-Zavaleta, M. Peralta-
Gil, S. Gama-Castro, L. Muniz-Rascado, C. Bonavides-Martinez,
S. Paley, M. Krummenacker, T. Altman, P. Kaipa, A. Spaulding,J. Pacheco, M. Latendresse, C. Fulcher, M. Sarker, A. G.Shearer, A. Mackie, I. Paulsen, R. P. Gunsalus and P. D.Karp, Nucleic Acids Res., 2011, 39, D583–D590.
25 O. Raibaud and E. Richet, J. Bacteriol., 1987, 169, 3059–3061.26 T. Bykowski, J. R. van der Ploeg, R. Iwanicka-Nowicka and
M. M. Hryniewicz, Mol. Microbiol., 2002, 43, 1347–1358.27 E. Stec, M. Witkowska-Zimny, M. M. Hryniewicz, P. Neumann,
A. J. Wilkinson, A. M. Brzozowski, C. S. Verma, J. Zaim,S. Wysocki and G. D. Bujacz, J. Mol. Biol., 2006, 364, 309–322.
28 A. Lochowska, R. Iwanicka-Nowicka, D. Plochocka andM. M. Hryniewicz, J. Biol. Chem., 2001, 276, 2098–2107.
29 E. Merino and C. Yanofsky, Trends Genet., 2005, 21,260–264.
30 C. Yanofsky, J. Bacteriol., 2000, 182, 1–8.31 R. Hermsen, B. Ursem and P. R. ten Wolde, PLoS Comput.
Biol., 2010, 6, e1000813.32 J. E. LeClerc, B. Li, W. L. Payne and T. A. Cebula, Science,
1996, 274, 1208–1211.33 B. Deplancke, K. R. Hristova, H. A. Oakley, V. J. McCracken,
R. Aminov, R. I. Mackie and H. R. Gaskins, Appl. Environ.Microbiol., 2000, 66, 2166–2174.
34 M. E. Csete and J. C. Doyle, Science, 2002, 295, 1664–1669.35 M. R. Atkinson, M. A. Savageau, J. T. Myers and A. J. Ninfa,
Cell, 2003, 113, 597–607.36 N. V. Torres and E. O. Voit, Pathway analysis and optimization in
metabolic engineering, Cambridge University Press, New York,2002.
Paper Molecular BioSystems
Publ
ishe
d on
02
Febr
uary
201
5. D
ownl
oade
d by
FA
C D
E Q
UIM
ICA
on
21/0
3/20
15 1
5:15
:30.
View Article Online