Transcriptional regulation by the numbers: applications
26
Transcriptional Regulation by the Numbers 2: Applications Lacramioara Bintu 1 , Nicolas E. Buchler 2 , Hernan G. Garcia 3 , Ulrich Gerland 4 , Terence Hwa 5 , Jané Kondev 1 , Thomas Kuhlman 5 and Rob Phillips 6 1 Physics Department, Brandeis University, Waltham, MA 02454 2 Center for Studies in Physics and Biology, The Rockefeller University, New York, NY 10021 3 Department of Physics, California Institute of Technology, Pasadena, CA 91125 4 Physics Department and CENS, Ludwig-Maximilians University, Munich, Germany 5 Physics Department and Center for Theoretical Biological Physics, University of California at San Diego, La Jolla, CA 92093-0374 6 Division of Engineering and Applied Science and Kavli Nanoscience Institute, California Institute of Technology, Pasadena, CA 91125 ABSTRACT With the increasing amount of experimental data on gene expression and regulation, there is a growing need for quantitative models to describe the data and relate them to the different contexts. The thermodynamic models reviewed in the preceding paper provide a useful framework for the quantitative analysis of bacterial transcription regulation. We review a number of well-characterized bacterial promoters that are regulated by one or two species of transcription factors, and apply the thermodynamic framework to these promoters. We show that the framework allows one to quantify vastly different forms of gene expression using a few parameters. As such, it provides a compact description useful for higher-level studies, e.g., of genetic networks, without the need to invoke the biochemical details of every component. Moreover, it can be used to generate hypotheses on the likely mechanisms of transcriptional control.
Transcript of Transcriptional regulation by the numbers: applications

Transcriptional Regulation by the Numbers 2: Applications
Lacramioara Bintu1, Nicolas E. Buchler2, Hernan G. Garcia3, Ulrich Gerland4, Terence Hwa5,
Jané Kondev1, Thomas Kuhlman5 and Rob Phillips6
1Physics Department, Brandeis University, Waltham, MA 02454
2Center for Studies in Physics and Biology, The Rockefeller University, New York, NY 10021
3Department of Physics, California Institute of Technology, Pasadena, CA 91125
4Physics Department and CENS, Ludwig-Maximilians University, Munich, Germany
5Physics Department and Center for Theoretical Biological Physics, University of California at San Diego, La Jolla, CA 92093-0374
6Division of Engineering and Applied Science and Kavli Nanoscience Institute, California Institute of Technology, Pasadena, CA 91125
ABSTRACT With the increasing amount of experimental data on gene expression and regulation, there is a
growing need for quantitative models to describe the data and relate them to the different
contexts. The thermodynamic models reviewed in the preceding paper provide a useful
framework for the quantitative analysis of bacterial transcription regulation. We review a number
of well-characterized bacterial promoters that are regulated by one or two species of transcription
factors, and apply the thermodynamic framework to these promoters. We show that the
framework allows one to quantify vastly different forms of gene expression using a few
parameters. As such, it provides a compact description useful for higher-level studies, e.g., of
genetic networks, without the need to invoke the biochemical details of every component.
Moreover, it can be used to generate hypotheses on the likely mechanisms of transcriptional
control.
Introduction
Biology is undergoing a transformation from a component-centric focus on the parts towards
a system-level focus on how a limited number of parts work together to perform complex
functions. For gene regulation, this theme has been discussed extensively in the context of simple
genetic circuits [1,2,3,4] as well as complex, developmental networks [5]. The functional
properties of a genetic circuit often depend critically on the degree of cooperativity in the
interactions between the molecular components [6]. For gene regulation, this cooperativity is
dictated to a large extent by the architecture of the cis-regulatory region [7] and the specific
mechanism of transcription activation or repression [8] mediated through interactions among
various transcription factors (TF) and the RNA polymerase complex (RNAP). Often, even
qualitative features of a gene circuit (e.g., whether a circuit can be bistable or can spontaneously
oscillate) cannot be determined without quantitative knowledge of the transcription regulation of
key genes in the circuit [3].
Quantifying the level of gene expression from a promoter starting from the underlying
biochemistry/biophysics is a difficult task, due most notably to ignorance of many biochemical
parameters, especially their relevant in vivo values. On the other hand, the thermodynamic model
reviewed in the preceding article [9] yields several general mathematical forms for the
dependence of the fold-change in gene expression on the concentration(s) of the TF(s) regulating
transcription. These general forms contain only a few parameters characterizing the effective
interactions between the molecular players. Thus, from a practical standpoint, it seems expedient
to quantify the transcription regulation of a gene by fitting expression data to the appropriate
model function to obtain effective parameters that best describe the promoter [10,11]. This
procedure may be useful even when the simplifying assumptions made by the thermodynamic
models are not satisfied [9]. By analyzing gene expression data within the thermodynamic
framework, one can elucidate whether an assumed set of interactions between TFs and RNAP
can consistently explain the data. Failure of the analysis can suggest important missing
ingredients, such as unknown mechanisms of cooperativity, while success can lead to predictions
for new experiments, e.g., how operator deletion would affect gene expression.
There has been much recent progress in understanding the mechanistic aspect of bacterial
gene regulation [8]. However, the systematic quantification of gene expression is still in its
infancy. In this paper, we review a number of experimentally characterized cis-regulatory
systems in bacteria, and provide for each case what we believe to be the most appropriate form
for the dependence of the fold-change in promoter activity on the TF concentration(s). For each
system, we show graphically how the expected form depends on the effective parameters. We
hope to demonstrate how the thermodynamic models can provide a direct link between the
arrangements of interactions in a promoter region and the quantitative characteristics of gene
expression.
Quantitative Characteristics of Activation and Repression
Our quantitative discussion focuses on a number of well-characterized bacterial promoters
controlled by one or two species of TFs. We use the results of the thermodynamic model listed in
Table 1 of the preceding paper [9] and reproduced as Table 1 in this paper. We make the
additional simplifying assumption that the in vivo promoters are weak, so that even at full
activation, the equilibrium gene expression is still small (e.g., < 10% of the strongest promoters).
Indeed for a large number of bacterial promoters, the expression is small in the exponential
growth phase when compared to the ribosomal genes, for example, which are fully turned on
[12]. In this weak promoter limit, the fold-change in promoter activity (henceforth simply
referred to as “fold-change”) is given directly by the regulation factor Freg listed in Table 1.
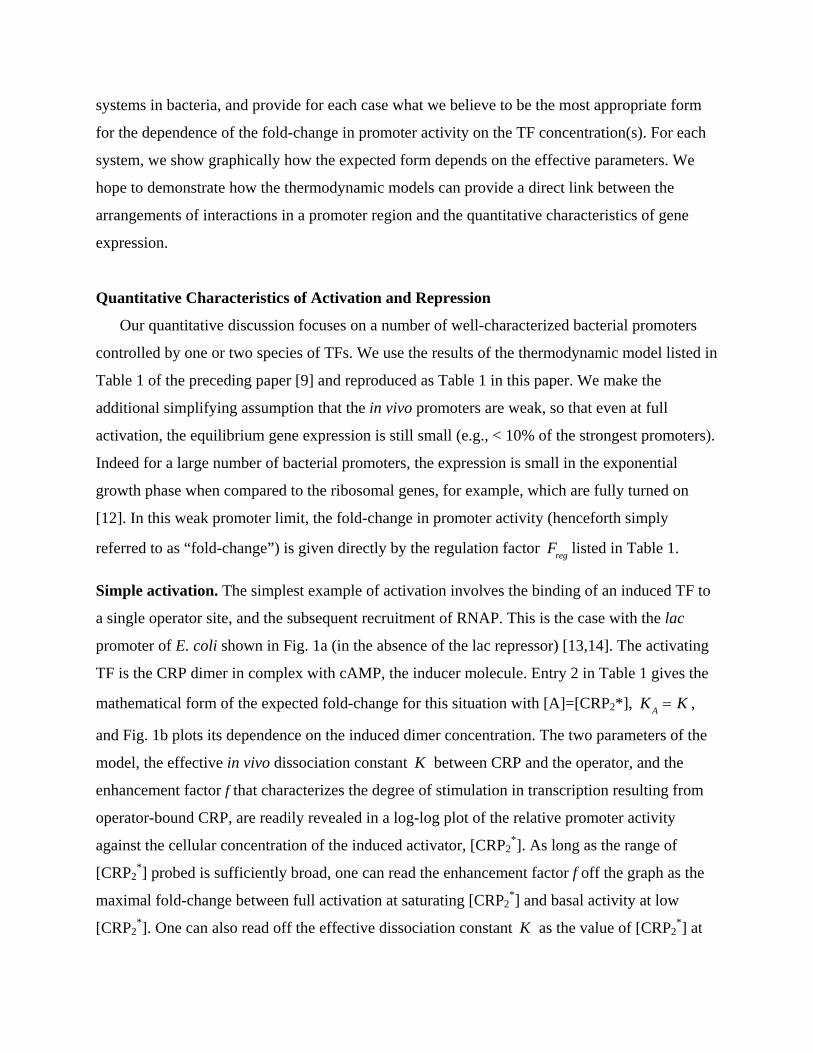
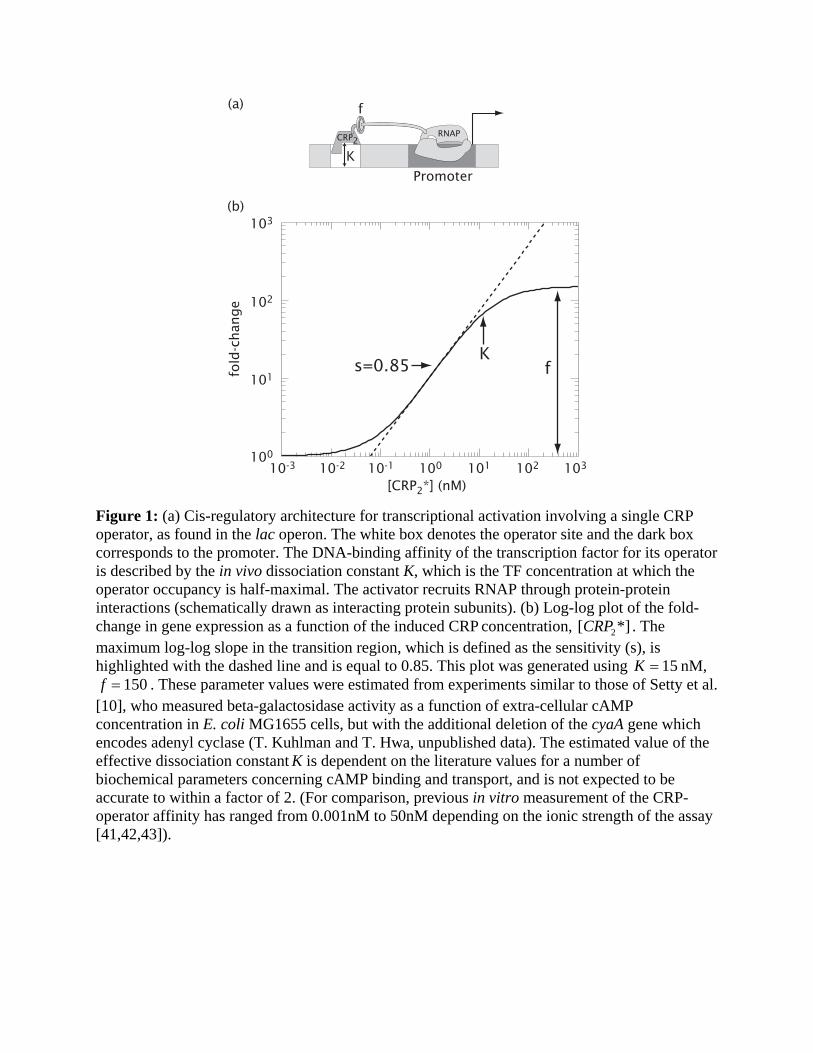
Simple activation. The simplest example of activation involves the binding of an induced TF to
a single operator site, and the subsequent recruitment of RNAP. This is the case with the lac
promoter of E. coli shown in Fig. 1a (in the absence of the lac repressor) [13,14]. The activating
TF is the CRP dimer in complex with cAMP, the inducer molecule. Entry 2 in Table 1 gives the
mathematical form of the expected fold-change for this situation with [A]=[CRP2*], K A = K ,
and Fig. 1b plots its dependence on the induced dimer concentration. The two parameters of the
model, the effective in vivo dissociation constant K between CRP and the operator, and the
enhancement factor f that characterizes the degree of stimulation in transcription resulting from
operator-bound CRP, are readily revealed in a log-log plot of the relative promoter activity
against the cellular concentration of the induced activator, [CRP2*]. As long as the range of
[CRP2*] probed is sufficiently broad, one can read the enhancement factor f off the graph as the
maximal fold-change between full activation at saturating [CRP2*] and basal activity at low
[CRP2*]. One can also read off the effective dissociation constant K as the value of [CRP2
*] at
half-activation. The steepness of the transition region, called the “sensitivity” in the signal
transfer literature [15], plays an important role in the function of genetic circuits. Here we
quantify transcriptional sensitivity by the log-log slope ( s ) at the mid-point of the transition
region. For promoters containing a single operator, s ≤ 1 and it approaches 1 only for very large
f’s. In comparison, functions such as amplification, bistability, or spontaneous oscillation all
require circuit components to have high sensitivity with s > 1 [6,15]
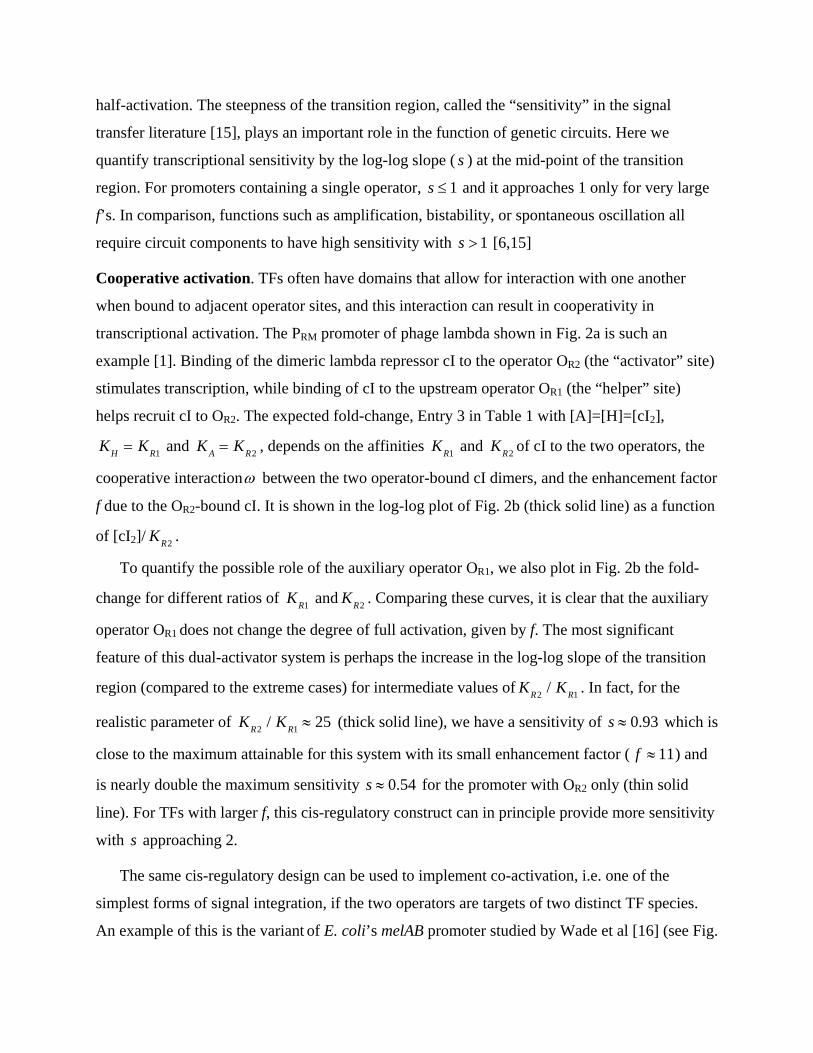
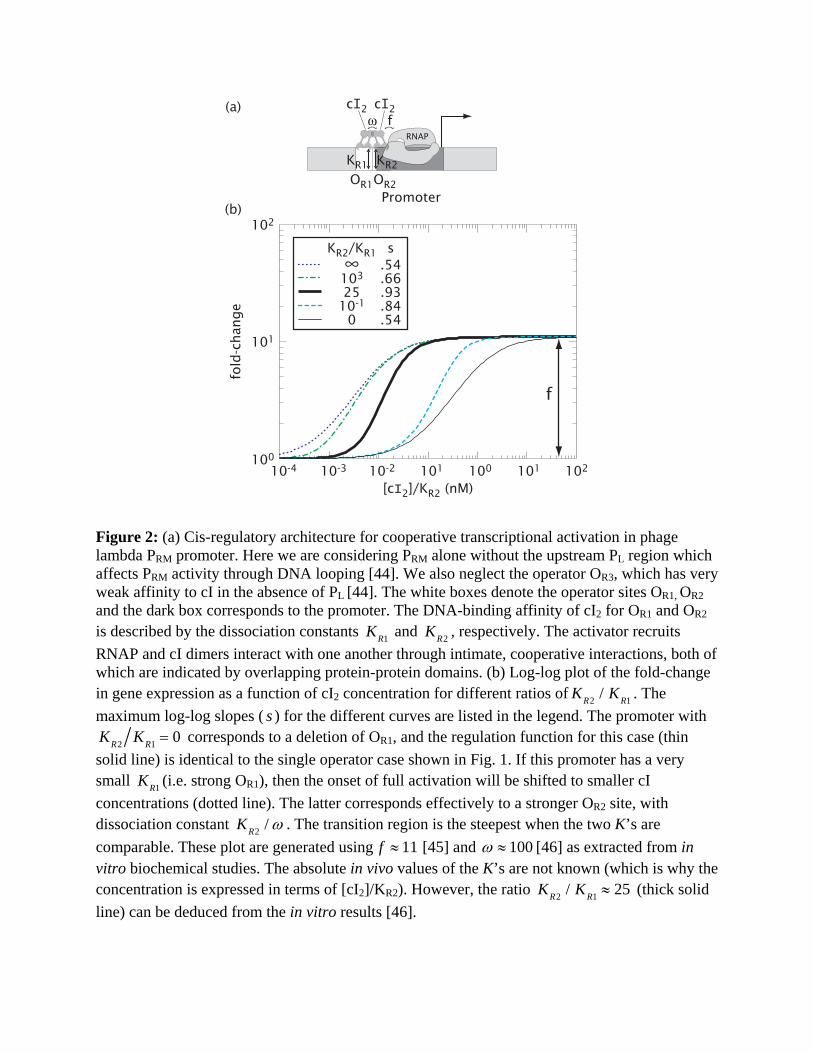
Cooperative activation. TFs often have domains that allow for interaction with one another
when bound to adjacent operator sites, and this interaction can result in cooperativity in
transcriptional activation. The PRM promoter of phage lambda shown in Fig. 2a is such an
example [1]. Binding of the dimeric lambda repressor cI to the operator OR2 (the “activator” site)
stimulates transcription, while binding of cI to the upstream operator OR1 (the “helper” site)
helps recruit cI to OR2. The expected fold-change, Entry 3 in Table 1 with [A]=[H]=[cI2],
KH = KR1 and K A = KR2 , depends on the affinities KR1 and KR2 of cI to the two operators, the
cooperative interactionω between the two operator-bound cI dimers, and the enhancement factor
f due to the OR2-bound cI. It is shown in the log-log plot of Fig. 2b (thick solid line) as a function
of [cI2]/ KR2 .
To quantify the possible role of the auxiliary operator OR1, we also plot in Fig. 2b the fold-
change for different ratios of KR1 and KR2 . Comparing these curves, it is clear that the auxiliary
operator OR1 does not change the degree of full activation, given by f. The most significant
feature of this dual-activator system is perhaps the increase in the log-log slope of the transition
region (compared to the extreme cases) for intermediate values of KR2 / KR1 . In fact, for the
realistic parameter of KR2 / KR1 ≈ 25 (thick solid line), we have a sensitivity of s ≈ 0.93 which is
close to the maximum attainable for this system with its small enhancement factor ( f ≈ 11) and
is nearly double the maximum sensitivity s ≈ 0.54 for the promoter with OR2 only (thin solid
line). For TFs with larger f, this cis-regulatory construct can in principle provide more sensitivity
with s approaching 2.
The same cis-regulatory design can be used to implement co-activation, i.e. one of the
simplest forms of signal integration, if the two operators are targets of two distinct TF species.
An example of this is the variant of E. coli’s melAB promoter studied by Wade et al [16] (see Fig.
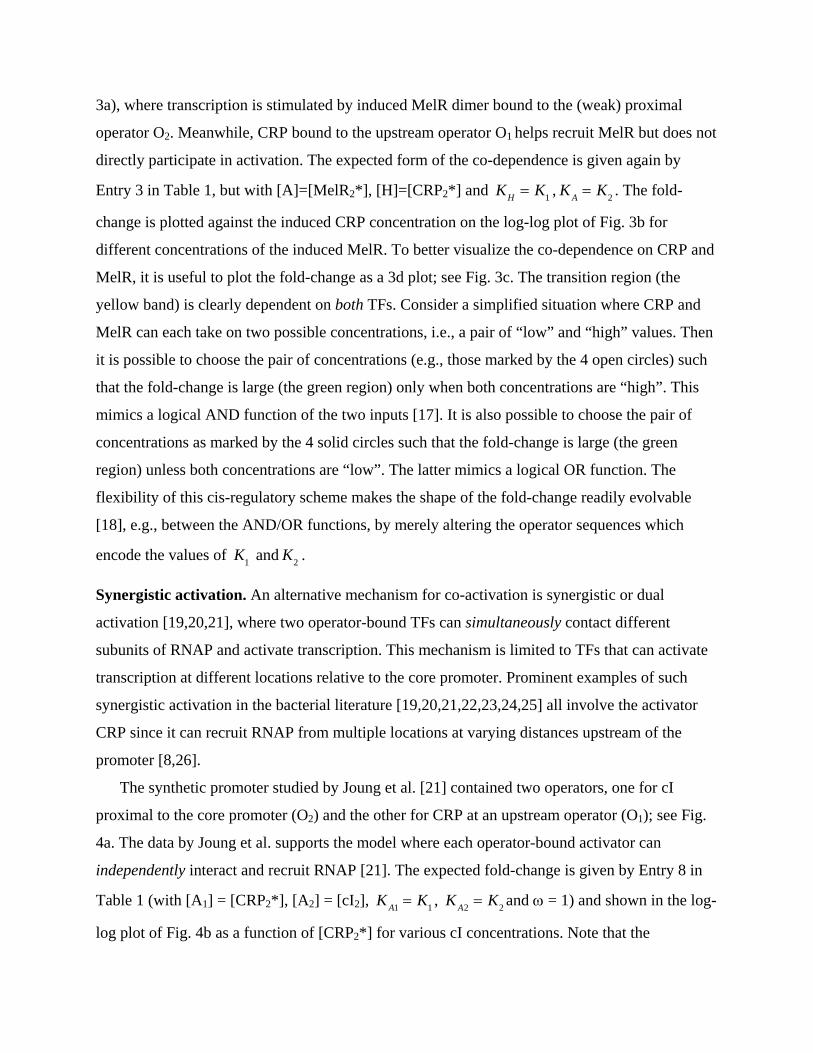
3a), where transcription is stimulated by induced MelR dimer bound to the (weak) proximal
operator O2. Meanwhile, CRP bound to the upstream operator O1 helps recruit MelR but does not
directly participate in activation. The expected form of the co-dependence is given again by
Entry 3 in Table 1, but with [A]=[MelR2*], [H]=[CRP2*] and KH = K1 , K A = K2 . The fold-
change is plotted against the induced CRP concentration on the log-log plot of Fig. 3b for
different concentrations of the induced MelR. To better visualize the co-dependence on CRP and
MelR, it is useful to plot the fold-change as a 3d plot; see Fig. 3c. The transition region (the
yellow band) is clearly dependent on both TFs. Consider a simplified situation where CRP and
MelR can each take on two possible concentrations, i.e., a pair of “low” and “high” values. Then
it is possible to choose the pair of concentrations (e.g., those marked by the 4 open circles) such
that the fold-change is large (the green region) only when both concentrations are “high”. This
mimics a logical AND function of the two inputs [17]. It is also possible to choose the pair of
concentrations as marked by the 4 solid circles such that the fold-change is large (the green
region) unless both concentrations are “low”. The latter mimics a logical OR function. The
flexibility of this cis-regulatory scheme makes the shape of the fold-change readily evolvable
[18], e.g., between the AND/OR functions, by merely altering the operator sequences which
encode the values of K1 and K2 .
Synergistic activation. An alternative mechanism for co-activation is synergistic or dual
activation [19,20,21], where two operator-bound TFs can simultaneously contact different
subunits of RNAP and activate transcription. This mechanism is limited to TFs that can activate
transcription at different locations relative to the core promoter. Prominent examples of such
synergistic activation in the bacterial literature [19,20,21,22,23,24,25] all involve the activator
CRP since it can recruit RNAP from multiple locations at varying distances upstream of the
promoter [8,26].
The synthetic promoter studied by Joung et al. [21] contained two operators, one for cI
proximal to the core promoter (O2) and the other for CRP at an upstream operator (O1); see Fig.
4a. The data by Joung et al. supports the model where each operator-bound activator can
independently interact and recruit RNAP [21]. The expected fold-change is given by Entry 8 in
Table 1 (with [A1] = [CRP2*], [A2] = [cI2], K A1 = K1 , K A2 = K2 and ω = 1) and shown in the log-
log plot of Fig. 4b as a function of [CRP2*] for various cI concentrations. Note that the
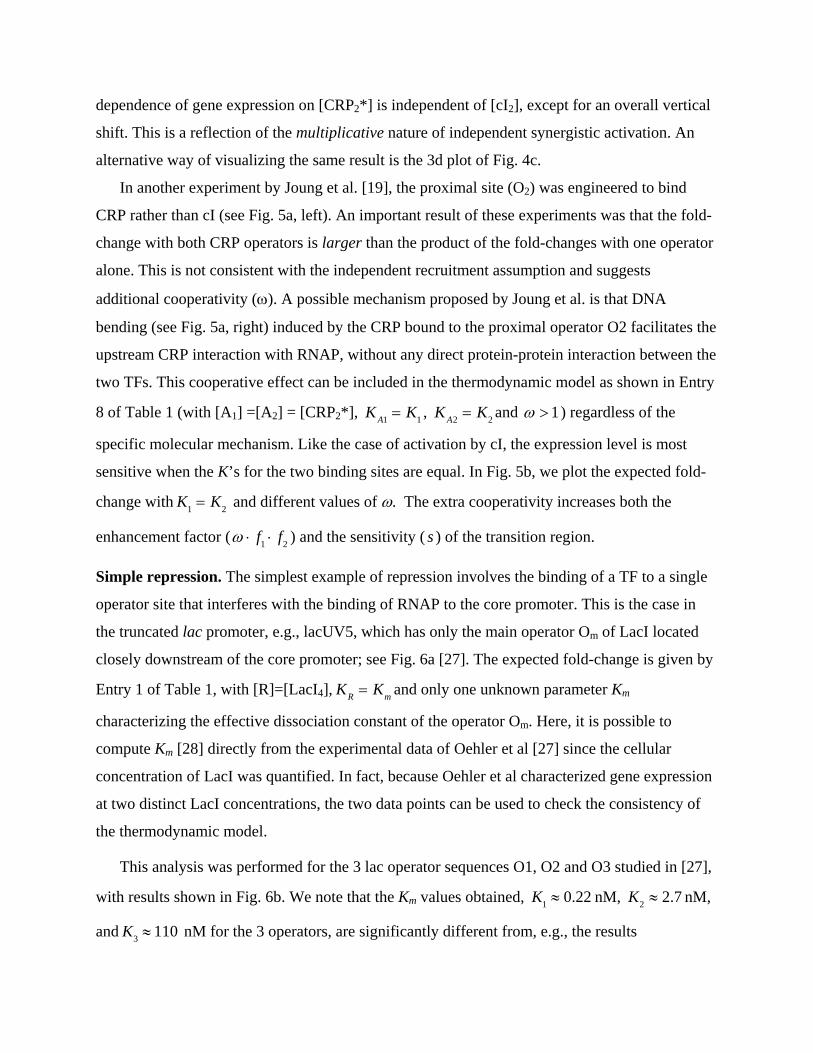
dependence of gene expression on [CRP2*] is independent of [cI2], except for an overall vertical
shift. This is a reflection of the multiplicative nature of independent synergistic activation. An
alternative way of visualizing the same result is the 3d plot of Fig. 4c.
In another experiment by Joung et al. [19], the proximal site (O2) was engineered to bind
CRP rather than cI (see Fig. 5a, left). An important result of these experiments was that the fold-
change with both CRP operators is larger than the product of the fold-changes with one operator
alone. This is not consistent with the independent recruitment assumption and suggests
additional cooperativity (ω). A possible mechanism proposed by Joung et al. is that DNA
bending (see Fig. 5a, right) induced by the CRP bound to the proximal operator O2 facilitates the
upstream CRP interaction with RNAP, without any direct protein-protein interaction between the
two TFs. This cooperative effect can be included in the thermodynamic model as shown in Entry
8 of Table 1 (with [A1] =[A2] = [CRP2*], K A1 = K1 , K A2 = K2 and ω > 1) regardless of the
specific molecular mechanism. Like the case of activation by cI, the expression level is most
sensitive when the K’s for the two binding sites are equal. In Fig. 5b, we plot the expected fold-
change with K1 = K2 and different values of ω. The extra cooperativity increases both the
enhancement factor ( ω ⋅ f1 ⋅ f2 ) and the sensitivity ( s ) of the transition region.
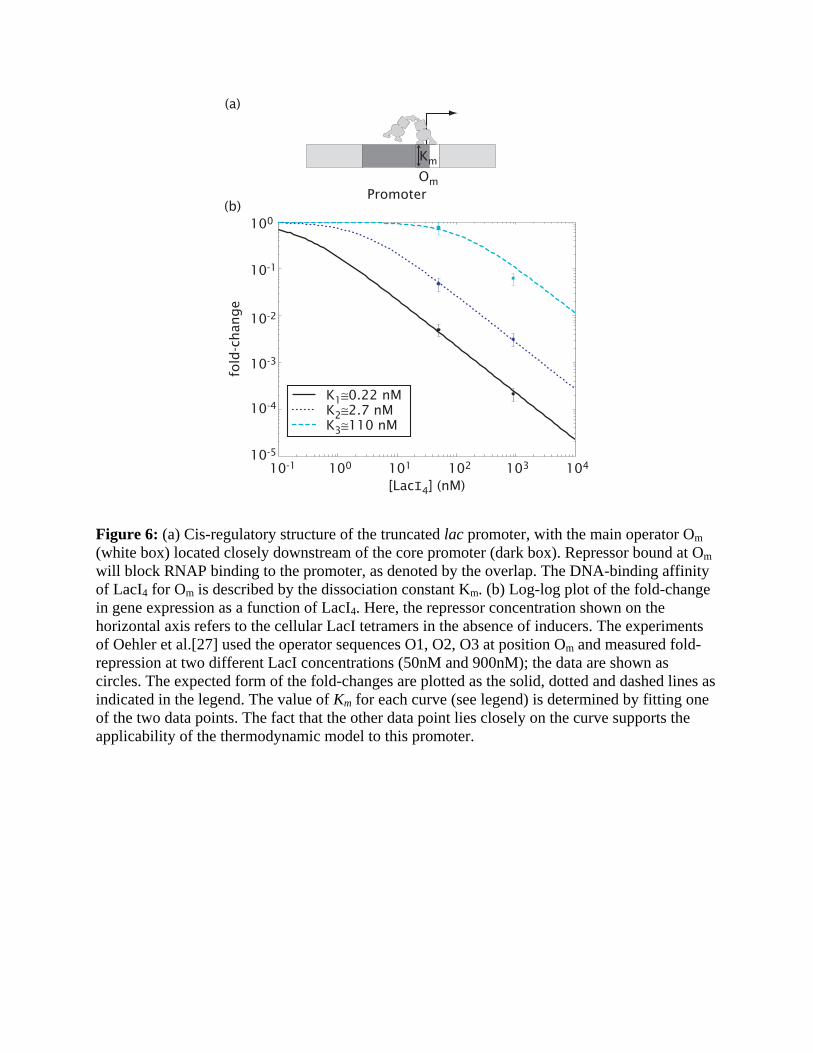
Simple repression. The simplest example of repression involves the binding of a TF to a single
operator site that interferes with the binding of RNAP to the core promoter. This is the case in
the truncated lac promoter, e.g., lacUV5, which has only the main operator Om of LacI located
closely downstream of the core promoter; see Fig. 6a [27]. The expected fold-change is given by
Entry 1 of Table 1, with [R]=[LacI4], KR = Km and only one unknown parameter Km
characterizing the effective dissociation constant of the operator Om. Here, it is possible to
compute Km [28] directly from the experimental data of Oehler et al [27] since the cellular
concentration of LacI was quantified. In fact, because Oehler et al characterized gene expression
at two distinct LacI concentrations, the two data points can be used to check the consistency of
the thermodynamic model.
This analysis was performed for the 3 lac operator sequences O1, O2 and O3 studied in [27],
with results shown in Fig. 6b. We note that the Km values obtained, K1 ≈ 0.22 nM, K2 ≈ 2.7 nM,
and K3 ≈ 110 nM for the 3 operators, are significantly different from, e.g., the results
K1 ≈ 10−3 nM K2 ≈ 10−2 nM and K3 ≈ 0.016 nM to 1nM obtained from in vitro assays [29,30,31].
These results underscore the fact that the relevant TF-operator binding constant for the
thermodynamic model is not given by the in vitro measurement (even if the appropriate
physiological conditions are used), but must be corrected for by the interaction of the TF with the
genomic background [9,32]. Consistent with the theoretical expectation, the ratios of the K’s are
in reasonable agreement between the in vivo and in vitro results. We note also that the expected
range of promoter activities is much larger than those for the activator-controlled promoters
described above. This follows from the strong excluded-volume interaction between the
repressor and RNAP, such that more repressor proteins generally lead to stronger repression1. In
contrast, the sensitivity is limited to 1s ≤ with a single operator site.
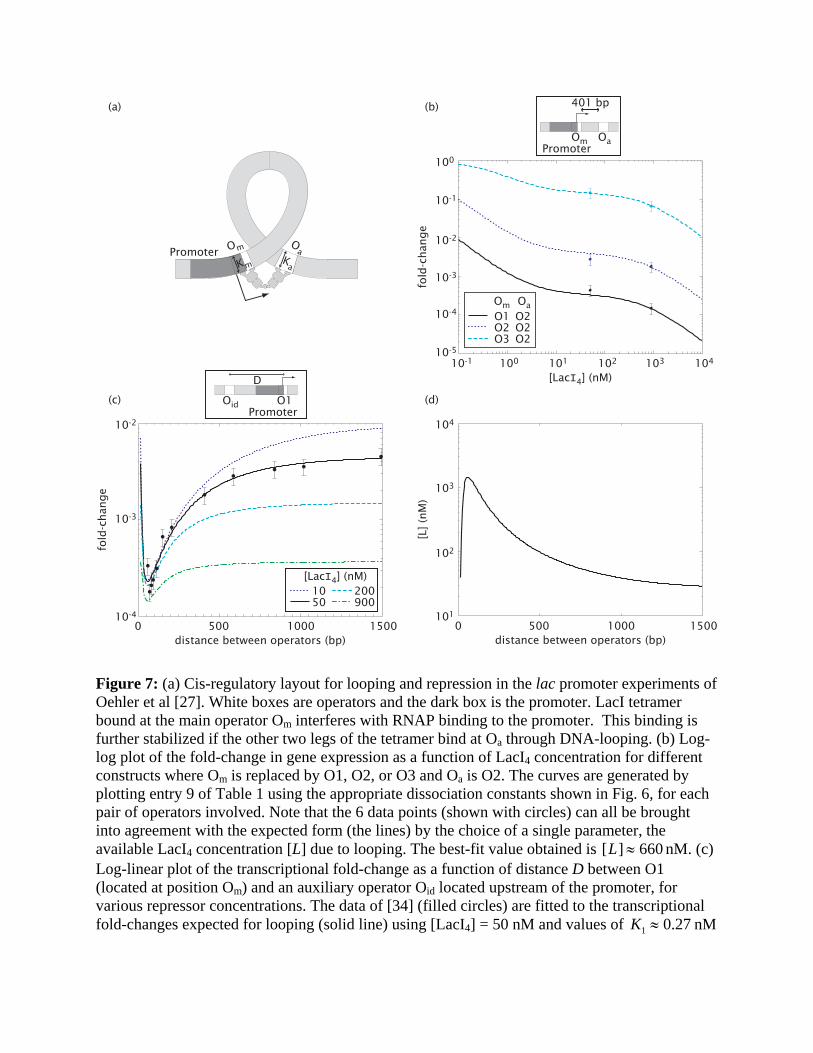
Repression by DNA looping. For the wild-type lac promoter, the degree of repression exceeds
1000-fold with merely ~10 repressor molecules in a cell [14]. This is substantially larger than the
< 100-fold repression achievable by the best of the truncated promoters (Fig. 6) at the same
repressor concentration. The additional repression is facilitated by the stabilization of the Om-
bound Lac tetramer which can simultaneously bind to an auxiliary operator Oa through DNA
looping (see Fig. 7a). The wildtype lac promoter has two such auxiliary operators, O2 located
401 bases downstream and O3 located 92 bases upstream. Here we describe the simpler case
studied experimentally by Oehler et al [27], which involves repression and looping only between
the main operator Om and the downstream auxiliary operator O2. The expected fold-change is
given by Entry 9 of Table 1, with [R]=[LacI4] and K1 = Km , K2 = Ka .
Given that the three K’s are already determined (see Fig. 6b), there is only one unknown
parameter in this case in the form for the fold-change (Entry 9 of Table 1). It is the effective
repressor concentration [L] made available via DNA-looping for binding to one of the two
operators, due to the binding of a repressor to the other operator. Oehler et al [27] did
experiments with the main operator Om as one of the 3 operator sequences (O1, O2, O3), each
for two concentrations of LacI. The results of all 6 experiments are consistently described by the
expected fold-changes according to the thermodynamic model (see Fig. 7b), with [L] ≈ 660 nM
[28].
1 Not discussed here is a lower plateau of promoter activity set by promoter leakage.
Quantitatively, the strong repression effect (compare Fig. 6b and Fig. 7b) results directly
from the large value of [L] generated by DNA looping, which effectively amplifies one operator-
bound repressor 660 fold. This enhancement of the local repressor concentration is due to the
linkage between Om and Oa, as already described qualitatively in Refs. [27,33]. Intuitively, once
a LacI tetramer binds to one of the two operators, say Om, it is available within a small volume
for binding to Oa. The actual value of [L] is clearly dependent on the spacing between the two
operators, as well as the energetics of bending the DNA backbone. We have deduced the
dependence of [L] on operator spacing (shown in Fig. 7d) by analyzing the data of Müller et al
[34], who measured the fold-changes in repression for promoter constructs with different spacing
between the main and auxiliary operators; see Fig. 7c. In Fig. 7c, we also show the predicted
transcriptional fold-changes for the same constructs of Muller et al [34] but at different LacI
concentrations.
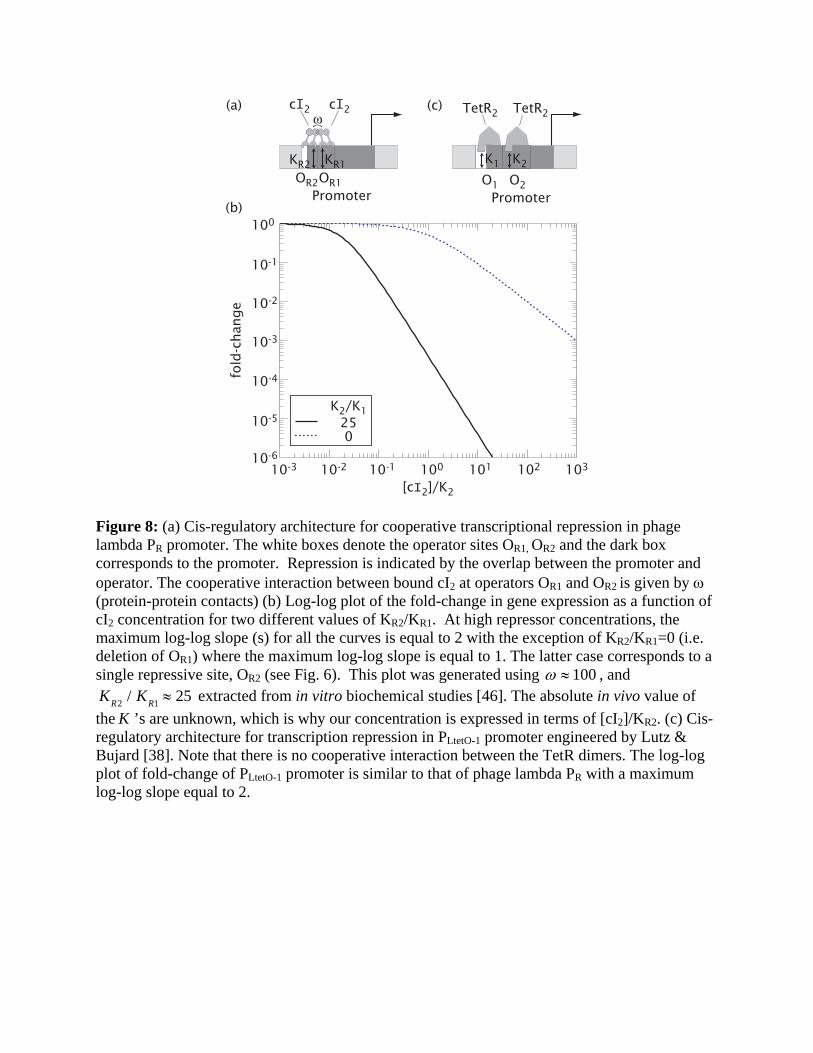
Cooperative repression. Interaction between the TFs can also promote the sensitivity in
transcriptional repression. The PR promoter, which controls the expression of cro in phage
lambda (illustrated in Fig. 8a), is a good example of this mode of repression [1]. When bound to
either the operator OR1 or OR2, the lambda repressor cI blocks the access of RNAP to the core
promoter, thereby repressing transcription. The combined effect of two repressive operators,
reinforced by the cooperative interaction between the operator-bound cI’s, results in further
repression. The expected form of fold-change is given by Entry 6 in Table 1 ([R1]=[R2]= [cI2]
and KR1 = KR2 , KR2 = KR1 ) and plotted in Fig. 8b. As with the case of cooperative activation
(Fig. 2), maximum log-log slope (i.e. sensitivity) in repression is the largest when K1 and K2
are comparable. Similar schemes have been generalized for co-repression by two species of
repressors [35,36,37], and can be used to mimic the logical NAND function [17].
Cooperativity in repression in fact does not require direct interaction between the repressor
molecules. An example is the PLtetO-1 promoter [38], which contains two operators of TetR; see
Fig. 8c. The expected form of the fold-change is given by Entry 5 in Table 1 with [R1] =[R2] =
[TetR2*], and KR1 = K1 , KR2 = K2 . Because the occupation of either operator is sufficient to
block RNAP from the core promoter, it follows that the fold-changes (not shown) are almost
identical to those of Fig. 8b even though the TetR dimers do not interact [39]. We expect that a
similar construct where the two operators are targets of different, non-interacting TFs can

implement co-repression. Comparing the activating and repressive modes of transcription
control, we find repressive control to be advantageous because (i) high sensitivity can be
generated by TFs without the need of TF-TF interaction, and (ii) fold changes are not limited by
the magnitude of the (typically weak) TF-RNAP interaction [40].
Phenomenological Model of Transcription Control.
The mathematical description for the different activation and repression mechanisms
discussed above can be summarized by very simple forms. For a single TF species with up to
two operators in the cis-regulatory region, all of the fold-changes described in Table 1 can be
compactly represented by the general form
Freg ([TF]) =
1+ a1[TF] + a2[TF]2
1+ b1[TF] + b2[TF]2 . (1)
Similarly for co-regulation by two TFs with cellular concentrations [TF1] and [TF2], and for no
more than one operator each in the regulatory region, the fold-change has the form
Freg [TF1],[TF2 ]( )=
1+ a1,0[TF1] + a0,1[TF2] + a1,1[TF1] ⋅[TF2 ]1+ b1,0[TF1] + b0,1[TF2 ] + b1,1[TF1] ⋅[TF2 ]
. (2)
The general forms (1) and (2) include many possible mechanisms of activation and repression not
discussed above. If 3 binding sites for the TF are involved in the regulatory process, then Eq. (1)
or (2) would be generalized to the ratio of 3rd degree polynomials of the [TF]’s.
The above analysis indicates that by quantitatively measuring the fold-change as a function
of the activated TF concentration(s), we can achieve two important goals: (i) By fitting
experimental results to an expression such as (1) or (2), one would obtain a quantitative
characterization of the promoter at all TF concentrations by only a few (e.g., 4 or 6) parameters.
This can be done regardless of the validity of the thermodynamic model itself. As discussed
previously, the compact description will facilitate quantitative higher-level study of gene circuits.
(ii) By comparing the values of these parameters to the expected forms according to the
thermodynamic model (e.g., Table 1), one can generate hypotheses on the likely mechanisms of
transcriptional control for further experiments. Thus the form of the fold-change in gene
expression itself can be an effective diagnostic tool to distinguish subtle mechanisms of
transcriptional control.
Conclusion
We have illustrated a variety of promoter activities implemented in different cis-regulatory
designs. Also illustrated are important functional differences (e.g., in transcriptional
cooperativity, and in the nature of combinatorial control) among promoters characterized by
different parameters of the same cis-regulatory construct. These differences often cannot be
discriminated by the qualitative characterization of promoter activity predominantly practiced in
molecular biology today (e.g., fold-change in gene expression due to deletion of a regulatory
protein). Instead, they call for more quantitative characterization, particularly the quantification
of the TF concentrations (or their relative concentrations) controlling promoter activity. The
reward of quantitative characterization includes a compact phenomenological description of
promoter activity for higher-level analysis and the elucidation of unknown mechanisms of
transcriptional control.
Acknowledgements
We are grateful to Steve Busby, Ann Hochschild, Bill Loomis, Mark Ptashne, Milton Saier
Jr, and Jon Widom for discussions and comments. This research is supported by the NIH
Director’s Pioneer Award (RP), NSF through grants 9984471, 0403997 (JK), and 0211308,
0216576, 0225630 (TH, TK). JK is a Cottrell Scholar of Research Corporation. UG
acknowledges an ‘Emmy Noether’ research grant from the DFG.

References:
1. *Ptashne, M: Genetic switch: Phage lambda revisited. Cold Spring Harbor, New York:
Cold Spring Harbor Laboratory Press; 2004.
. The latest (third) edition of this classic book on gene regulation summarizes much recent progress towards more quantitative understanding of the genetic control mechanisms that determine the life-style of Phage lambda
. 2. Guet CC, Elowitz MB, Hsing W, Leibler S: Combinatorial synthesis of genetic
networks. Science. 2002, 296:1466-1470
3. Hasty J, McMillen D., Isaacs F, Collins JJ: Computational studies of gene regulation
networks: in numero molecular biology. Nat. Rev. Genet. 2002, 2: 268-279.
4. McAdams HH, Srinivasan B, Arkin AP: The evolution of genetic regulatory systems in
bacteria. Nat Rev Genet. 2004, 5:169-178.
5. Davidson EH, Rast JP, Oliveri P, Ransick A, Calestani C, Yuh CH, Minokawa T, Amore
G, Hinman V, Arenas-Mena C, et al.: A genomic regulatory network for development.
Science. 2002, 295:1669-1678.
6. Thomas, R. and D’Ari, R: Biological feedback. Boca Raton, Florida: CRC Press, 1990.
7. Wolf DM, Eeckman FH: On the relationship between genomic regulatory element
organization and gene regulatory dynamics. J. Theor. Biol. 1998, 195:167-186.
8. ** Browning DF, Busby SJW: The regulation of bacterial transcription initiation. Nat
Rev. Microbiol 2004, 2: 1-9.
. An excellent review on transcriptional regulation in bacteria, with special emphasis on the different mechanisms and cis-regulatory architectures involved in transcriptional activation, repression, and co-dependence between two activators.
. 9. Bintu L, Buchler NE, Garcia HG, Gerland U, Hwa T, Kondev J, Phillips R:
Transcriptional Regulation by the Numbers 1: Models. arXiv:q-bio.MN/0412010
10. Setty Y, Mayo AE, Surette MG, Alon U: Detailed map of a cis-regulatory input
function. Proc Natl Acad Sci U S A. 2003, 100:7702-7707.
11. Kalir S, Alon U: Using a quantitative blueprint to reprogram the dynamics of the
flagella gene network. Cell 2004, 117:713-720.
12. Wei Y, Lee JM, Richmond C, Blattner FR, Rafalski JA, LaRossa RA: High-density
microarray-mediated gene expression profiling of Escherichia coli. J. Bacteriol.
2001, 83: 545-556.
13. Ebright RH. Transcription activation at Class I CAP-dependent promoters. Mol.
Microbiol. 192, 8: 797-802.
14. Müller-Hill, B: The lac operon: A short history of a genetic paradigm. New York,
New York: Walter de Gruyter; 1996.
15. Kholodenko BN, Hoek JB, Westerhoff HV, Brown GC: Quantification of information
transfer via cellular signal transduction pathways. FEBS Lett. 1997, 8: 430-434.
16. Wade JT, Belyaeva TA, Hyde EI, Busby SJ: A simple mechanism for co-dependence
on two activators at an Escherichia coli promoter. EMBO J. 2001, 20:7160-7167.
17. * Buchler NE, Gerland U, Hwa T: On schemes of combinatorial transcription control.
Proc Natl Acad Sci U S A. 2003, 100: 5136-5141.
. A theoretical paper on transcriptional control that explores how far “regulated recruitment” between regulatory factors in the cis-regulatory region can go towards integrating signals and generating complex combinatorial logic.
. 18. Ptashne M, Gann A: Imposing specificity by localization: mechanism and
evolvability. Curr Biol. 1998, 8:R897
19. Joung JK, Le LU, Hochschild A: Synergistic activation of transcription by E. coli
cAMP receptor protein. Proc Natl Acad Sci U S A. 1993, 90:3083-3087.
20. Busby S, West D, Lawes M, Webster C, Ishihama A, Kolb A: Transcription activation
by the Escherichia coli cyclic AMP receptor protein. Receptors bound in tandem at
promoters can interact synergistically. J. Mol. Biol. 1994, 241:341-352.
21. Joung JK, Koepp DM, Hochschild A: Synergistic activation of transcription by
bacteriophage lambda cI protein and E. coli cAMP receptor protein. Science 1994,
265:1863-1866.
22. Scott S, Busby S, Beacham I: Transcriptional co-activation at the ansB promoters:
involvement of the activating regions of CRP and FNR when bound in tandem. Mol
Microbiol.1995, 18:521-531.
23. Belyaeva TA, Rhodius VA, Webster CL, Busby SJ: Transcription activation at
promoters carrying tandem DNA sites for the Escherichia coli cyclic AMP receptor

protein: organisation of the RNA polymerase alpha subunits. J Mol Biol 1998,
277:789-804.
24. Tebbutt J, Rhodius V, Webster C, Busby S. Architectural requirements for optimal
activation by tandem CRP molecules at a Class I CRP-dependent promoter. FEMS
Lett. 2002, 210: 55-60.
25. Beatty C, Browning D, Busby S, Wolfe A. CRP-dependent activation of the E. coli
acsP2 promoter by a synergistic Class III mechanism. J. Bacteriol. 2003, 185: 5148-
5157.
26. Busby S, Ebright RH: Transcription activation by catabolite activator protein (CAP).
J Mol Biol. 1999, 293:199-213
27. Oehler S, Amouyal M, Kolkhof P, von Wilcken-Bergmann B, Müller-Hill B: Quality
and position of the three lac operators of E. coli define efficiency of repression.
EMBO J. 1994, 13: 3348-3355.
28. ** Vilar JM, Leibler S: DNA looping and physical constraints on transcription
regulation. J Mol Biol. 2003, 331:981-989.
. An example of using thermodynamic models to interpret in vivo looping data in the lac operon of Oehler et al [27]. The authors explore the possible role of DNA looping and auxiliary operators to help suppress stochastic fluctuations in lac gene expression.
. 29. Lin S, Riggs A: The General Affinity of lac Repressor for E. coli DNA: Implications
for Gene Regulation in Procaryotes and Eucaryotes. Cell 1975, 4: 107-111.
30. Pfahl M, Gulde V, Bourgeois S: "Second" and "third operator" of the lac operon: an
investigation of their role in the regulatory mechanism. J. Mol. Biol. 1979, 127: 339-
344.
31. Winter RB and von Hippel PH: Diffusion-driven mechanisms of protein translocation
on nucleic acids. 2. The Escherichia coli repressor--operator interaction:
equilibrium measurements. Biochemistry. 1981, 20: 6948-6960.
32. Gerland U, Moroz JD, Hwa T: Physical constraints and functional characteristics of
transcription factor-DNA interaction. Proc Natl Acad Sci U S A. 2002, 99:12015-
12020.
33. Bellomy GR, Record MT Jr: Stable DNA loops in vivo and in vitro: roles in gene
regulation at a distance and in biophysical characterization of DNA. Prog Nucleic
Acid Res Mol Biol. 1990, 39:81-128.
34. Müller J, Oehler S, Müller-Hill B: Repression of lac promoter as a function of
distance, phase and quality of an auxiliary lac operator. J Mol Biol. 1996, 257:21-29
35. Dmitrova M, Younes-Cauet G, Oertel-Buchheit P, Porte D, Schnarr M, Granger-Schnarr
M: A new LexA-based genetic system for monitoring and analyzing protein
heterodimerization in Escherichia coli. Mol Gen Genet. 1998, 257:205-212.
36. Hu JC, Kornacker MG, Hochschild, A: E. coli one- and two-hybrid systems for the
analysis and identification of protein–protein interactions. Methods 2000, 20: 80-94.
37. Hays LB, Chen YS, Hu JC: Two-hybrid system for characterization of protein-
protein interactions in E. coli. Biotechniques 2000, 29:288-294
38. Lutz R & Bujard H: Independent and tight regulation of transcriptional units in
Escherichia coli via the LacR/O, the TetR/O and AraC/I1-I2 regulatory elements.
Nucleic Acids Res 1997, 25: 1203-1210.
39. Miller JA and Widom J: Collaborative competition mechanism for gene activation in
vivo. Mol Cell Biol. 2003, 23:1623-1632.
40. ** Ptashne, M, Gann, A: Genes and signals. Cold Spring Harbor, New York: Cold
Spring Harbor Laboratory Press; 2002
. This book is an extended elaboration on “regulated recruitment” in biology with examples spanning gene regulation and signaling. A well-written book that proposes the provocative idea that much of the complexity in regulation can arise from simple mechanisms of localization and interaction between regulatory proteins.
. 41. Garner MM, and Revzin A: Stoichiometry of catabolite activator protein/adenosine
cyclic 3',5'-monophosphate interactions at the lac promoter of Escherichia coli.
Biochemistry. 1982, 21:6032-6036.
42. Fried MG, and Crothers DM: Equilibrium studies of the cyclic AMP receptor protein-
DNA interaction. J. Mol. Biol. 1984, 172:241-262.
43. Takahashi M, Blazy B, Baudras A: Ligand-modulated binding of a gene regulatory
protein to DNA: quantitative analysis of cyclic-AMP induced binding of CRP from
Escherichia coli to non-specific and specific DNA targets. J. Mol. Biol. 1989, 207:783-
796.
44. Dodd IB, Shearwin KE, Perkins AJ, Burr T, Hochschild A, Egan JB: Cooperativity in
long-range gene regulation by the lambda cI repressor. Genes Dev. 2004, 18: 344-
354.
45. Hawley DK, McClure WR: Mechanism of activation of transcription initiation from
the lambda PRM promoter. J. Mol. Biol. 1982, 157:493– 525.
46. Koblan KS and Ackers GK: Site-specific enthalpic regulation of DNA transcription at
bacteriophage lambda OR. Biochemistry. 1992, 31:57–65
47. Yamakawa, H: In Helical Wormlike Chains in Polymer Solutions, Springer, New
York, 1997.

A2A1
R
A
AH
RH
R2R1
R2R1
A2A1
R1R2
ANR2A1 Table 1 (reproduced from [9]): Regulation factors for a number of different regulatory motifs. The second column gives the regulation factor in terms of the number of transcription factors (TFs) in the cell and their binding energies, while the third column provides a translation of the regulation factor into the language of concentrations and equilibrium dissociation constants. For an arbitrary TF we introduce the
following symbols: in the second column x is the combination X
NNS
e−∆εxd /kBT , while [X] in the third
column denotes the concentration of transcription factor X. KX = [X] / x is the effective equilibrium dissociation constant of the TF and its operator sequence on the DNA. Furthermore, in the third column we introduce f = e−εxp /kBT for the “glue-like” interaction of a TF and RNAP, and for ω = e−εx1x 2 /kBT the
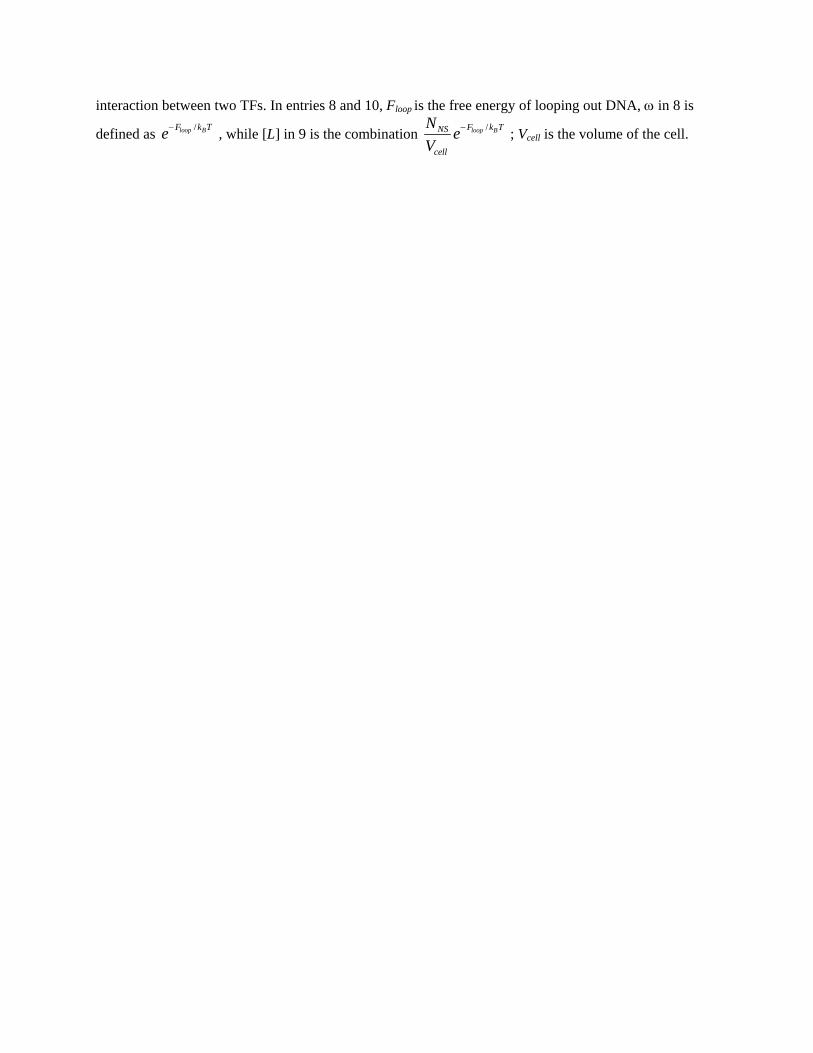
interaction between two TFs. In entries 8 and 10, Floop is the free energy of looping out DNA, ω in 8 is
defined as e−Floop /kBT , while [L] in 9 is the combination
NNS
Vcell
e− Floop /kBT ; Vcell is the volume of the cell.
RNAP
Promoter
f
CRP2
K
103
102
101
100
[CRP2*] (nM)
fold
-chan
ge
10-3 10-2 10110010-1 102 103
s=0.85K
f
(a)
(b)
Figure 1: (a) Cis-regulatory architecture for transcriptional activation involving a single CRP operator, as found in the lac operon. The white box denotes the operator site and the dark box corresponds to the promoter. The DNA-binding affinity of the transcription factor for its operator is described by the in vivo dissociation constant K, which is the TF concentration at which the operator occupancy is half-maximal. The activator recruits RNAP through protein-protein interactions (schematically drawn as interacting protein subunits). (b) Log-log plot of the fold-change in gene expression as a function of the induced CRP concentration, [CRP2*] . The maximum log-log slope in the transition region, which is defined as the sensitivity (s), is highlighted with the dashed line and is equal to 0.85. This plot was generated using K = 15 nM, f = 150 . These parameter values were estimated from experiments similar to those of Setty et al.
[10], who measured beta-galactosidase activity as a function of extra-cellular cAMP concentration in E. coli MG1655 cells, but with the additional deletion of the cyaA gene which encodes adenyl cyclase (T. Kuhlman and T. Hwa, unpublished data). The estimated value of the effective dissociation constant K is dependent on the literature values for a number of biochemical parameters concerning cAMP binding and transport, and is not expected to be accurate to within a factor of 2. (For comparison, previous in vitro measurement of the CRP-operator affinity has ranged from 0.001nM to 50nM depending on the ionic strength of the assay [41,42,43]).
(a)
(b)
OR1OR2
w f
KR2
cI2 cI2
RNAP
Promoter
KR1
102
101
100
[cI2]/KR2 (nM)
fold
-chan
ge
10-4 10-3 10010110-2 101 102
f
.54∞
.66103
.9325
.8410-1
.540
KR2/KR1 s
Figure 2: (a) Cis-regulatory architecture for cooperative transcriptional activation in phage lambda PRM promoter. Here we are considering PRM alone without the upstream PL region which affects PRM activity through DNA looping [44]. We also neglect the operator OR3, which has very weak affinity to cI in the absence of PL [44]. The white boxes denote the operator sites OR1, OR2 and the dark box corresponds to the promoter. The DNA-binding affinity of cI2 for OR1 and OR2 is described by the dissociation constants KR1 and KR2 , respectively. The activator recruits RNAP and cI dimers interact with one another through intimate, cooperative interactions, both of which are indicated by overlapping protein-protein domains. (b) Log-log plot of the fold-change in gene expression as a function of cI2 concentration for different ratios of KR2 / KR1 . The maximum log-log slopes ( s ) for the different curves are listed in the legend. The promoter with
KR2 KR1 = 0 corresponds to a deletion of OR1, and the regulation function for this case (thin solid line) is identical to the single operator case shown in Fig. 1. If this promoter has a very small KR1 (i.e. strong OR1), then the onset of full activation will be shifted to smaller cI concentrations (dotted line). The latter corresponds effectively to a stronger OR2 site, with dissociation constant KR2 / ω . The transition region is the steepest when the two K’s are comparable. These plot are generated using f ≈ 11 [45] and ω ≈ 100 [46] as extracted from in vitro biochemical studies. The absolute in vivo values of the K’s are not known (which is why the concentration is expressed in terms of [cI2]/KR2). However, the ratio KR2 / KR1 ≈ 25 (thick solid line) can be deduced from the in vitro results [46].
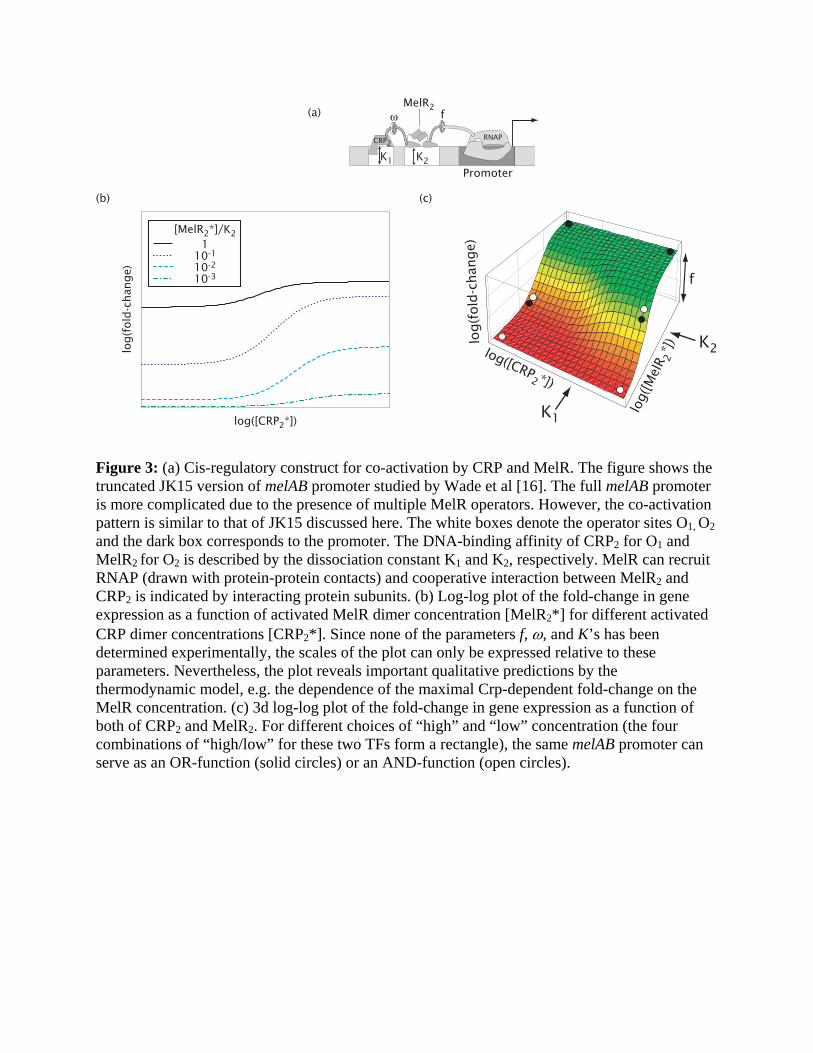
(a)
(b) (c)
CRP2
fw
RNAP
PromoterK1 K2
MelR2
log([CRP2*])
log(f
old
-chan
ge)
110-1
10-2
10-3
[MelR2*]/K2
log([CRP2*])
log(
[Mel
R 2*]
)
K1
K2
log(f
old
-chan
ge)
f
Figure 3: (a) Cis-regulatory construct for co-activation by CRP and MelR. The figure shows the truncated JK15 version of melAB promoter studied by Wade et al [16]. The full melAB promoter is more complicated due to the presence of multiple MelR operators. However, the co-activation pattern is similar to that of JK15 discussed here. The white boxes denote the operator sites O1, O2 and the dark box corresponds to the promoter. The DNA-binding affinity of CRP2 for O1 and MelR2 for O2 is described by the dissociation constant K1 and K2, respectively. MelR can recruit RNAP (drawn with protein-protein contacts) and cooperative interaction between MelR2 and CRP2 is indicated by interacting protein subunits. (b) Log-log plot of the fold-change in gene expression as a function of activated MelR dimer concentration [MelR2*] for different activated CRP dimer concentrations [CRP2*]. Since none of the parameters f, ω, and K’s has been determined experimentally, the scales of the plot can only be expressed relative to these parameters. Nevertheless, the plot reveals important qualitative predictions by the thermodynamic model, e.g. the dependence of the maximal Crp-dependent fold-change on the MelR concentration. (c) 3d log-log plot of the fold-change in gene expression as a function of both of CRP2 and MelR2. For different choices of “high” and “low” concentration (the four combinations of “high/low” for these two TFs form a rectangle), the same melAB promoter can serve as an OR-function (solid circles) or an AND-function (open circles).
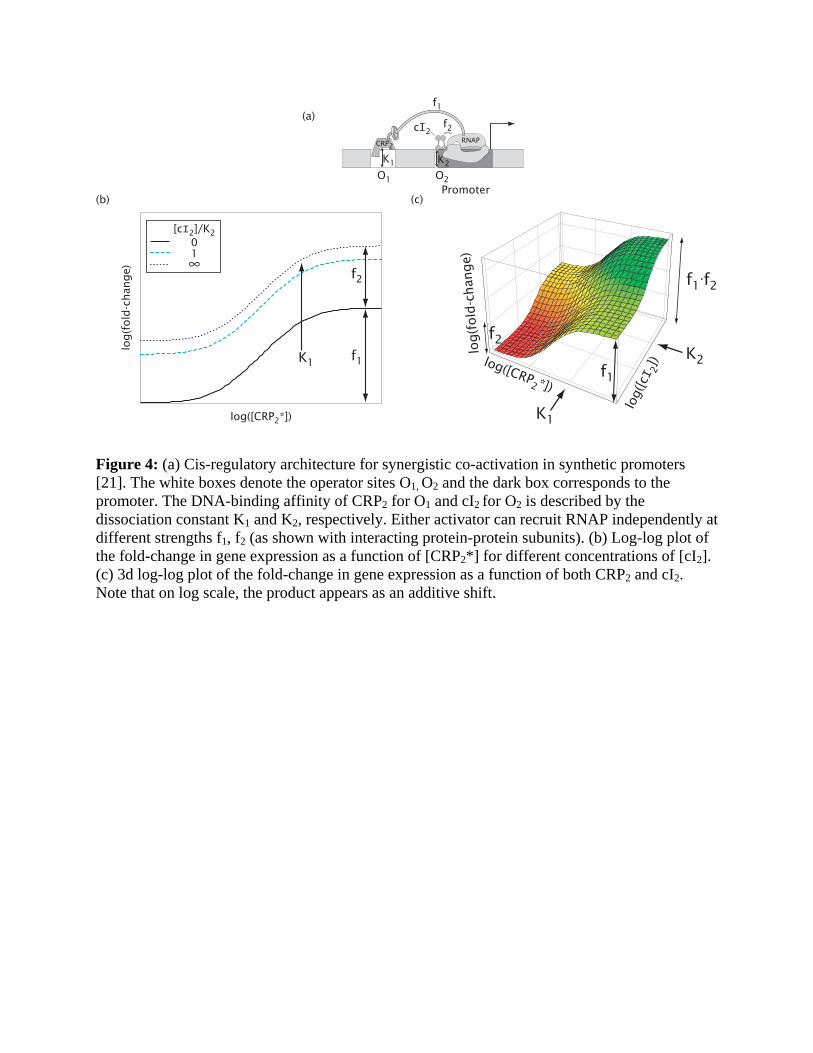
(a)
(b) (c)
O2O1
K2
RNAP
Promoter
f1
CRP2
K1
f2
log([CRP2*])
log(f
old
-chan
ge)
K1
∞
[cI2]/K201
f1
f2
log([CRP2*])
log(
[cI2])
K1
f1.f2
K2
f2
f1
log(f
old
-chan
ge)
cI2
Figure 4: (a) Cis-regulatory architecture for synergistic co-activation in synthetic promoters [21]. The white boxes denote the operator sites O1, O2 and the dark box corresponds to the promoter. The DNA-binding affinity of CRP2 for O1 and cI2 for O2 is described by the dissociation constant K1 and K2, respectively. Either activator can recruit RNAP independently at different strengths f1, f2 (as shown with interacting protein-protein subunits). (b) Log-log plot of the fold-change in gene expression as a function of [CRP2*] for different concentrations of [cI2]. (c) 3d log-log plot of the fold-change in gene expression as a function of both CRP2 and cI2. Note that on log scale, the product appears as an additive shift.

(a)
(b)
log([CRP2*])
log(f
old
-chan
ge)
110
100
w
w.f1
.f2
K1=K2
RNAPCRP2
O1
f2
CRP2
O2
K1 K2
f1
Promoter
Figure 5: (a) To the left is the cis-regulatory architecture for synergistic activation by the same TF in synthetic promoters [19]. The white boxes denote the operator sites O1, O2 and the dark box corresponds to the promoter. The DNA-binding affinity of CRP2 for O1 and O2 is described by the dissociation constants K1 and K2, respectively. Activators at each operator can recruit RNAP independently at different strengths f1, f2 (as shown with interacting protein-protein subunits). As illustrated to the right, the binding of CRP to proximal O2 bends DNA and facilitates the “bent” interaction of RNAP to CRP bound at upstream O1 (b) Log-log plot of the fold-change in gene expression as a function of [CRP*
2] for equal dissociation constants (K1=K2). We have included the additional cooperativity ω that can occur when the binding of CRP to O1 promotes the interaction of RNAP to CRP bound at O2. The maximal fold-change is ω ⋅ f1 ⋅ f2 .
(a)
(b)
OmPromoter
Km
100
10-1
10-2
10-3
10-4
10-5
[LacI4] (nM)
fold
-chan
ge
10-1 100 103102101 104
[email protected] [email protected] nMK3@110 nM
Figure 6: (a) Cis-regulatory structure of the truncated lac promoter, with the main operator Om (white box) located closely downstream of the core promoter (dark box). Repressor bound at Om will block RNAP binding to the promoter, as denoted by the overlap. The DNA-binding affinity of LacI4 for Om is described by the dissociation constant Km. (b) Log-log plot of the fold-change in gene expression as a function of LacI4. Here, the repressor concentration shown on the horizontal axis refers to the cellular LacI tetramers in the absence of inducers. The experiments of Oehler et al.[27] used the operator sequences O1, O2, O3 at position Om and measured fold-repression at two different LacI concentrations (50nM and 900nM); the data are shown as circles. The expected form of the fold-changes are plotted as the solid, dotted and dashed lines as indicated in the legend. The value of Km for each curve (see legend) is determined by fitting one of the two data points. The fact that the other data point lies closely on the curve supports the applicability of the thermodynamic model to this promoter.
(a)
OmPromoterKm
Oa
Ka
(b)
100
10-1
10-2
10-3
10-4
10-5
[LacI4] (nM)
fold
-chan
ge
10-1 100 103102101 104
401 bp
Om OaPromoter
OaO2O1O2O2O2O3
Om
(c)
10-2
10-3
10-4
distance between operators (bp)
fold
-chan
ge
0 500 1000 1500
O1OidPromoter
5010 200
900
[LacI4] (nM)
(d)
104
103
101
102
distance between operators (bp)
[L]
(nM
)
0 500 1000 1500
D
Figure 7: (a) Cis-regulatory layout for looping and repression in the lac promoter experiments of Oehler et al [27]. White boxes are operators and the dark box is the promoter. LacI tetramer bound at the main operator Om interferes with RNAP binding to the promoter. This binding is further stabilized if the other two legs of the tetramer bind at Oa through DNA-looping. (b) Log-log plot of the fold-change in gene expression as a function of LacI4 concentration for different constructs where Om is replaced by O1, O2, or O3 and Oa is O2. The curves are generated by plotting entry 9 of Table 1 using the appropriate dissociation constants shown in Fig. 6, for each pair of operators involved. Note that the 6 data points (shown with circles) can all be brought into agreement with the expected form (the lines) by the choice of a single parameter, the available LacI4 concentration [L] due to looping. The best-fit value obtained is [L] ≈ 660 nM. (c) Log-linear plot of the transcriptional fold-change as a function of distance D between O1 (located at position Om) and an auxiliary operator Oid located upstream of the promoter, for various repressor concentrations. The data of [34] (filled circles) are fitted to the transcriptional fold-changes expected for looping (solid line) using [LacI4] = 50 nM and values of K1 ≈ 0.27 nM
and Kid ≈ 0.05 nM determined from the data of [27]. The fitting function is the dependence of the available concentration due to looping, [L], on the operator spacing D. We use the form [L] = exp(−a / D − b ⋅ ln D + c ⋅ D + e) motivated by the worm-like chain model of DNA bending [47]. The other lines correspond to the predicted gene expression of the same constructs at different LacI concentrations as indicated in the legend. (d) Log-linear plot of [L] vs D obtained from the fit described in (d), with a = 140.6, b = 2.52, c = 1.4 × 10⁻³ , e = 19.9.
(a) (c)
(b)
OR2OR1
w
Promoter
KR2 KR1
PromoterO1 O2
K1 K2
TetR2 TetR2
[cI2]/K2
fold
-chan
ge
100
10-2
10-1
10-4
10-3
10-6
10-5
10-3 10-2 10110010-1 102 103
K2/K1250
cI2 cI2
Figure 8: (a) Cis-regulatory architecture for cooperative transcriptional repression in phage lambda PR promoter. The white boxes denote the operator sites OR1, OR2 and the dark box corresponds to the promoter. Repression is indicated by the overlap between the promoter and operator. The cooperative interaction between bound cI2 at operators OR1 and OR2 is given by ω (protein-protein contacts) (b) Log-log plot of the fold-change in gene expression as a function of cI2 concentration for two different values of KR2/KR1. At high repressor concentrations, the maximum log-log slope (s) for all the curves is equal to 2 with the exception of KR2/KR1=0 (i.e. deletion of OR1) where the maximum log-log slope is equal to 1. The latter case corresponds to a single repressive site, OR2 (see Fig. 6). This plot was generated using ω ≈ 100 , and KR2 / KR1 ≈ 25 extracted from in vitro biochemical studies [46]. The absolute in vivo value of the K ’s are unknown, which is why our concentration is expressed in terms of [cI2]/KR2. (c) Cis-regulatory architecture for transcription repression in PLtetO-1 promoter engineered by Lutz & Bujard [38]. Note that there is no cooperative interaction between the TetR dimers. The log-log plot of fold-change of PLtetO-1 promoter is similar to that of phage lambda PR with a maximum log-log slope equal to 2.