Residual stresses and elastic modulus of thermal barrier coatings graded in porosity
9
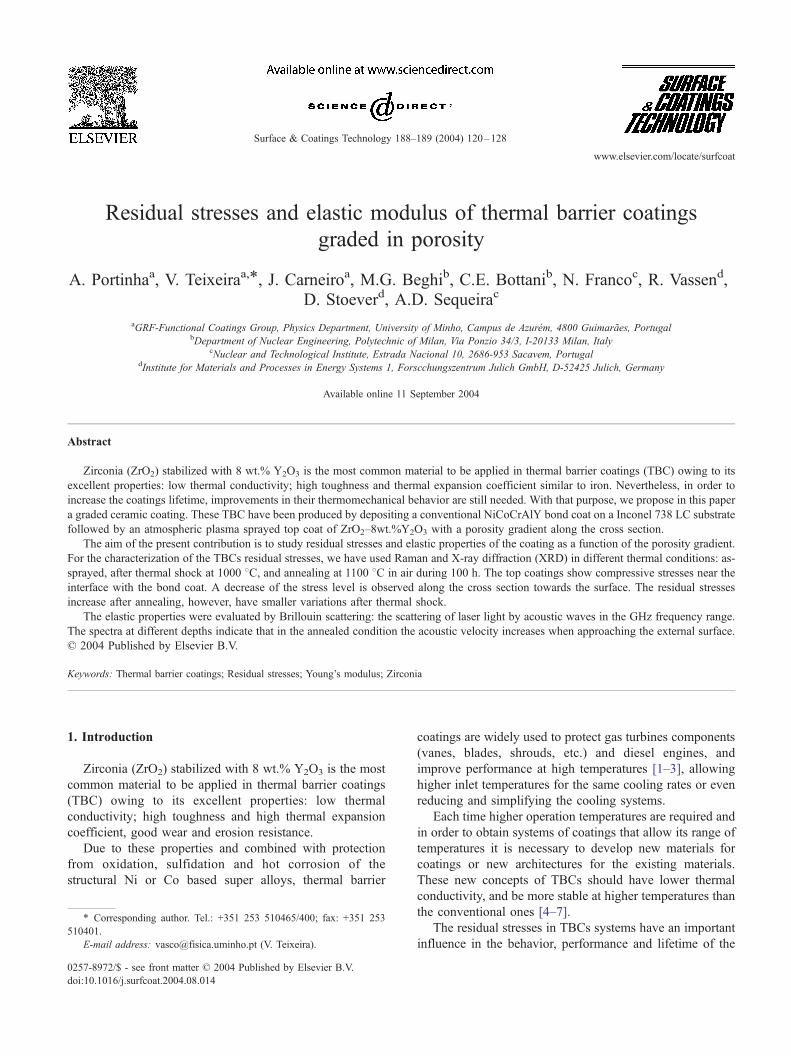
Residual stresses and elastic modulus of thermal barrier coatings graded in porosity A. Portinha a , V. Teixeira a, * , J. Carneiro a , M.G. Beghi b , C.E. Bottani b , N. Franco c , R. Vassen d , D. Stoever d , A.D. Sequeira c a GRF-Functional Coatings Group, Physics Department, University of Minho, Campus de Azure ´m, 4800 Guimara ˜es, Portugal b Department of Nuclear Engineering, Polytechnic of Milan, Via Ponzio 34/3, I-20133 Milan, Italy c Nuclear and Technological Institute, Estrada Nacional 10, 2686-953 Sacavem, Portugal d Institute for Materials and Processes in Energy Systems 1, Forscchungszentrum Julich GmbH, D-52425 Julich, Germany Available online 11 September 2004 Abstract Zirconia (ZrO 2 ) stabilized with 8 wt.% Y 2 O 3 is the most common material to be applied in thermal barrier coatings (TBC) owing to its excellent properties: low thermal conductivity; high toughness and thermal expansion coefficient similar to iron. Nevertheless, in order to increase the coatings lifetime, improvements in their thermomechanical behavior are still needed. With that purpose, we propose in this paper a graded ceramic coating. These TBC have been produced by depositing a conventional NiCoCrAlY bond coat on a Inconel 738 LC substrate followed by an atmospheric plasma sprayed top coat of ZrO 2 –8wt.%Y 2 O 3 with a porosity gradient along the cross section. The aim of the present contribution is to study residual stresses and elastic properties of the coating as a function of the porosity gradient. For the characterization of the TBCs residual stresses, we have used Raman and X-ray diffraction (XRD) in different thermal conditions: as- sprayed, after thermal shock at 1000 8C, and annealing at 1100 8C in air during 100 h. The top coatings show compressive stresses near the interface with the bond coat. A decrease of the stress level is observed along the cross section towards the surface. The residual stresses increase after annealing, however, have smaller variations after thermal shock. The elastic properties were evaluated by Brillouin scattering: the scattering of laser light by acoustic waves in the GHz frequency range. The spectra at different depths indicate that in the annealed condition the acoustic velocity increases when approaching the external surface. D 2004 Published by Elsevier B.V. Keywords: Thermal barrier coatings; Residual stresses; Young’s modulus; Zirconia 1. Introduction Zirconia (ZrO 2 ) stabilized with 8 wt.% Y 2 O 3 is the most common material to be applied in thermal barrier coatings (TBC) owing to its excellent properties: low thermal conductivity; high toughness and high thermal expansion coefficient, good wear and erosion resistance. Due to these properties and combined with protection from oxidation, sulfidation and hot corrosion of the structural Ni or Co based super alloys, thermal barrier coatings are widely used to protect gas turbines components (vanes, blades, shrouds, etc.) and diesel engines, and improve performance at high temperatures [1–3], allowing higher inlet temperatures for the same cooling rates or even reducing and simplifying the cooling systems. Each time higher operation temperatures are required and in order to obtain systems of coatings that allow its range of temperatures it is necessary to develop new materials for coatings or new architectures for the existing materials. These new concepts of TBCs should have lower thermal conductivity, and be more stable at higher temperatures than the conventional ones [4–7]. The residual stresses in TBCs systems have an important influence in the behavior, performance and lifetime of the 0257-8972/$ - see front matter D 2004 Published by Elsevier B.V. doi:10.1016/j.surfcoat.2004.08.014 * Corresponding author. Tel.: +351 253 510465/400; fax: +351 253 510401. E-mail address: [email protected] (V. Teixeira). Surface & Coatings Technology 188–189 (2004) 120 – 128 www.elsevier.com/locate/surfcoat
Transcript of Residual stresses and elastic modulus of thermal barrier coatings graded in porosity
www.elsevier.com/locate/surfcoat
Surface & Coatings Technology
Residual stresses and elastic modulus of thermal barrier coatings
graded in porosity
A. Portinhaa, V. Teixeiraa,*, J. Carneiroa, M.G. Beghib, C.E. Bottanib, N. Francoc, R. Vassend,
D. Stoeverd, A.D. Sequeirac
aGRF-Functional Coatings Group, Physics Department, University of Minho, Campus de Azurem, 4800 Guimaraes, PortugalbDepartment of Nuclear Engineering, Polytechnic of Milan, Via Ponzio 34/3, I-20133 Milan, Italy
cNuclear and Technological Institute, Estrada Nacional 10, 2686-953 Sacavem, PortugaldInstitute for Materials and Processes in Energy Systems 1, Forscchungszentrum Julich GmbH, D-52425 Julich, Germany
Available online 11 September 2004
Abstract
Zirconia (ZrO2) stabilized with 8 wt.% Y2O3 is the most common material to be applied in thermal barrier coatings (TBC) owing to its
excellent properties: low thermal conductivity; high toughness and thermal expansion coefficient similar to iron. Nevertheless, in order to
increase the coatings lifetime, improvements in their thermomechanical behavior are still needed. With that purpose, we propose in this paper
a graded ceramic coating. These TBC have been produced by depositing a conventional NiCoCrAlY bond coat on a Inconel 738 LC substrate
followed by an atmospheric plasma sprayed top coat of ZrO2–8wt.%Y2O3 with a porosity gradient along the cross section.
The aim of the present contribution is to study residual stresses and elastic properties of the coating as a function of the porosity gradient.
For the characterization of the TBCs residual stresses, we have used Raman and X-ray diffraction (XRD) in different thermal conditions: as-
sprayed, after thermal shock at 1000 8C, and annealing at 1100 8C in air during 100 h. The top coatings show compressive stresses near the
interface with the bond coat. A decrease of the stress level is observed along the cross section towards the surface. The residual stresses
increase after annealing, however, have smaller variations after thermal shock.
The elastic properties were evaluated by Brillouin scattering: the scattering of laser light by acoustic waves in the GHz frequency range.
The spectra at different depths indicate that in the annealed condition the acoustic velocity increases when approaching the external surface.
D 2004 Published by Elsevier B.V.
Keywords: Thermal barrier coatings; Residual stresses; Young’s modulus; Zirconia
1. Introduction
Zirconia (ZrO2) stabilized with 8 wt.% Y2O3 is the most
common material to be applied in thermal barrier coatings
(TBC) owing to its excellent properties: low thermal
conductivity; high toughness and high thermal expansion
coefficient, good wear and erosion resistance.
Due to these properties and combined with protection
from oxidation, sulfidation and hot corrosion of the
structural Ni or Co based super alloys, thermal barrier
0257-8972/$ - see front matter D 2004 Published by Elsevier B.V.
doi:10.1016/j.surfcoat.2004.08.014
* Corresponding author. Tel.: +351 253 510465/400; fax: +351 253
510401.
E-mail address: [email protected] (V. Teixeira).
coatings are widely used to protect gas turbines components
(vanes, blades, shrouds, etc.) and diesel engines, and
improve performance at high temperatures [1–3], allowing
higher inlet temperatures for the same cooling rates or even
reducing and simplifying the cooling systems.
Each time higher operation temperatures are required and
in order to obtain systems of coatings that allow its range of
temperatures it is necessary to develop new materials for
coatings or new architectures for the existing materials.
These new concepts of TBCs should have lower thermal
conductivity, and be more stable at higher temperatures than
the conventional ones [4–7].
The residual stresses in TBCs systems have an important
influence in the behavior, performance and lifetime of the
188–189 (2004) 120–128

A. Portinha et al. / Surface & Coatings Technology 188–189 (2004) 120–128 121
coated parts. In fact, the integrity and performance of
coatings applied with different purposes (corrosion, thermal
and hard protection) are strongly dependent on the nature
and magnitude of the residual stresses. In the case of high
tensile stresses, film cracking will be present and in an
excessive compressive stress field a film decohesion caused
by buckling will be installed. It is important to consider two
different origins for the residual stresses in the TBCs [8],
one is the coating deposition process and another is the
service conditions on the coated parts. One source of
intrinsic residual stress of as-sprayed ceramic top coating by
plasma spraying is the thermal residual stress that arises
from the nature of the plasma spraying process associated
with the quenching effect of the splashed molten droplets
arriving to the cool substrate or with lower temperature of
the solidified coating during the coating growth.
The other is due to the different coefficients of thermal
expansion (CTE) and/or temperature gradients of the
ceramic top layers, the bond coats and metallic components.
After heat treatments or during service, the stress states of
the as-sprayed condition can be largely changed due to
stress relaxation during high temperature operation. Besides
the residual stress changes, an additional thermal growth
oxide (TGO) also causes an interface stress field. The
overall stresses are responsible for delamination or fracture
of the material at the interface between the thermal growth
oxide (TGO) and the ceramic top layer [9–11].
At the surface of the as-sprayed coatings, the residual
stresses are almost zero or have lower tensile state [1,12].
However, within the coatings in the plane parallel to the
interface the stress state shows a biaxial compressive stress
distribution with a gradient across the section.
X-ray diffraction (XRD) is a nondestructive technique that
can be used to determine stresses at the near surface region of
materials. XRD can be used to measure the strains within the
coatings and from there one can determine the residual
stresses. The state of the elastic strain promotes changes in the
lattice plane spacing when compared with the ones free of
stresses allowing for the determination of the stress state in
the material. The most commonly used process is the sin2wmethod [13,14]. If one needs to evaluate the stress state as a
function of depth along the cross section of the coatings, one
can use a destructive approach and remove layer by layer.
Micro-Raman spectroscopy is a powerful technique to
study the structural changes in the coatings because Raman
scattering depends on electron–phonon interactions that are
very sensitive to local environments [15,16] and due to its
sensitivity it is a suitable technique to identify and study
small changes in the stress states of the coatings [12,17,18].
The Brillouin scattering technique is an optical method to
probe the elastic properties: the inelastic scattering of light
by ultrasonic waves of sub-micrometric wavelength is
observed. This provides a contact-less and nondestructive
way to measure the acoustic properties, with a spatial
resolution of tens of micrometers. While X-ray and Raman
techniques are most sensitive to local order at the atomic
scale, Brillouin scattering probes the behavior of sub-
micrometric acoustic waves, and is therefore sensitive to
the structure at a mesoscopic scale, comparable to the
characteristic sizes of ceramic grains and of porosity.
This contribution presents the results of residual stresses in
plasma sprayed coatings: (i) for as-sprayed condition, (ii)
after thermal shock (100 cycles, heating at 1000 8C in air
during 1 h and then cooling down in water), (iii) after annea-
ling at 1100 8C in air during 100 h. This study was well done
at the surface and along the cross section in order to under-
stand the residual stresses gradient through the interface to-
wards the surface of the ceramic top coat and was also related
with the porosity gradient. By Brillouin measurements, the
elastic properties for the TBCs were also evaluated.
2. Experimental
2.1. Preparation and characterization
The TBC have been produced by depositing a conven-
tional NiCoCrAlY bond coat deposited by vacuum spraying
on an Inconel 738 LC substrate, followed by an atmospheric
plasma sprayed top coat of ZrO2–8wt.%Y2O3 with a
porosity gradient along the cross section. The coatings
porosity levels were quantitatively evaluated by mercury
intrusion technique and by image analysis. The porosity
increases from the bond coat interface towards the surface of
the top coat. In as-sprayed condition, the porosity increases
typically 8% near the interface to 18% at the surface. After
annealing condition, we observe a significant reduction in
its variation due to the sintering effects at high temperature
[19]. The details of deposition parameters and process
characterization are extensively explained elsewhere [19].
X-ray measurements in the mode h–2h angles in the range
of 20–808 using Cu Ka (40 kV, 30 mA) radiation in steps of
0.02 were performed in order to access the structural
characterization of the coatings. The average crystallite
dimension of coatings was determined by the Scherrer
equation after full with at half weight of maximum intensity
(FWHM) determination. Residual stresses were determined
by X-ray diffraction using the sin2w technique, using the
high resolution diffractometer Hotbird at ITN (Cu Ka1, 40
kW, 200 mA) with a beam of 0.4�1 mm2. Measurements on
[620] lattice plane of ZrO2 were performed to obtain the
coatings surface strains. The diffraction angle for this plane
occurred at about 2h=144.58. The w angle was scanned from
�258 to 258 by steps of 58 in order to get the interplanar
distance dw (the main parameters are listed in Table 1). The
biaxial stresses in the plane parallel to the interface were
calculated considering an isotropic biaxial stress distribution
with r33=0 (see Fig. 1).
The XRD spectra were acquired for the as-sprayed
coatings at three different depths, after annealing at 1100 8Cin air during 100 h and after 100 cycles thermal shock at
1000 8C with quenching in water.

Fig. 2. Cross section example of thermal barrier coating indicating the
positions where the Raman residual stresses were measured (A, B, C).
Table 1
XRD parameters used in the residual stress measurements
Diffractometer Hotbird (at ITN)
Anode current (mA) 200
Anode power (kW) 40
Radiation Cu Ka1
Lattice plane in analysis [620]
Range of measurement, 2h (8) 138 to 150
w range (8) �25 to 25
A. Portinha et al. / Surface & Coatings Technology 188–189 (2004) 120–128122
Raman spectroscopy measurements have been done
using an HeNe laser line at 633 nm wavelength with 1
mW power in order to obtain the Raman shift for the
coatings at various states as described before. A laser spot
(with a size of 2 Am) was positioned and scanned along the
cross section of the sample as represented in Fig. 2, in order
to collect the spectra at different depths of the coating. In
our case, we use the shift for the tetragonal ZrO2 Raman line
located at about 640 cm�1 to calculate the residual stresses.
This technique requires a previous calibration [12] and for
our material each cm�1 corresponds to 220 MPa.
Brillouin spectra were recorded at different depths on the
cross section of an annealed coating. Measurements were
performed in backscattering, with the 515.5 nm line of an Ar
ion laser. The focusing spot is of the order of 10 nm, and the
spectrum is analyzed by a 3+3 passes tandem Fabry–Perot
interferometer of the Sandercock type [20]. The fine-grained
ceramic structure, not completely opaque and rich of
internal surfaces, introduces a strong elastic scattering and
multiple scattering effects. These show up in the spectra as a
strong background noise and a peak broadening, which limit
the obtained information. In particular, peaks due to surface
acoustic waves could not be observed, while peaks due to
bulk waves were measured and characterized. As discussed
below, the probed acoustic wavelength is around 120 nm.
3. Theoretical background
3.1. X-ray residual stresses
3.1.1. h–2h mode
There are numerous experimental techniques to deter-
mine accurately the residual stresses in coatings and the
methods based in X-ray diffraction are well suitable for the
Fig. 1. Model of the in-plane elastic residual stresses (method sin2w).
assessment of the stress states in thin or thick films. In
general, the coatings have stresses in two or three directions
(principal stresses, r11, r22 and r33) forming orthogonal
angles called the principal directions [13,14]. In the surface
of the coatings usually a biaxial stress state is considered
where the r33 component perpendicular to the surface is
zero.
For this stress state, the strain perpendicular to the
surface, e33, being different of zero is calculated by:
e33 ¼ � vðe11 þ e22Þ ¼ � v
Er11 þ r22Þð ð1Þ
the e33 strain component is determined measuring the dhklinterplanar spacing of planes parallel to the surface:
e33 ¼dhkl � d0
d0ð2Þ
Combining Eqs. (1) and (2) and considering that
r11=r22=rc, we obtain the value of the residual stress
parallel to the surface, which is given by:
rc ¼ � E
2v
dhkl � d0
d0ð3Þ
where dhkl is the measured plane spacing of the coatings,
and d0 is the standard plane spacing from X-ray diffraction
files (2.96 2) for h111i planes of the ZrO2 tetragonal phase.
However, this method gives only approximate values due to
the uncertainty d0 and high diffraction angles should be
used. The so-called sin2w method is largely used for precise
quantitatively stress measurements.
3.1.2. Sin2w method
Considering Fig. 1, for a biaxial stress in the irradiated
layers of the surface TBC coating the lattice strains are
related to the stress by:
e/;w ¼ d/;w � d0
d0¼ 1þ v
Er/sin
2w � v
Er11 þ r22Þð ð4Þ
where d0 is the unstressed lattice spacing, d/,w is the lattice
spacing under stress, r/ is the stress present in the /direction defined in the plane of the coating, w is the tilt
angle, r11 and r22 are the stresses along the principal
directions, E is the Young’s modulus and t is the Poisson’s
ratio of the material. Eq. (1) predicts a linear relationship

A. Portinha et al. / Surface & Coatings Technology 188–189 (2004) 120–128 123
between d/,w and sin2w, and the stresses can be obtained
from a least squares fit of experimentally determined d-
spacing measured at a number of tilts, see Fig. 5.
The r/ stress is given by:
r/ ¼ r11cos2/ þ r22sin
2/ ð5Þ
and for w0=0 the strain in the perpendicular direction e33come as:
e33 ¼d/;w¼0 � d0
d0¼ � v
�e11 þ e22
�¼ � v
Er11 þ r22Þð
ð6Þ
Relating Eqs. (5) and (6), we get the following relation:
d/;w � d/;w¼0
d0¼ 1þ v
Er/sin
2w ð7Þ
which means that the strain difference between two
directions on a material under stress is only dependent of
the stress applied in this plane.
From this equation, we can calculate the r/ stress along
the / direction by the following equation:
r/ ¼ E
1þ vð Þsin2wd/;w � d/;w¼0
d0
��ð8Þ
Eq. (8) allows to calculate the stress in any direction on
the plane and the stresses in the / direction can be obtained
directly from the slope of a least-squares line fitted to
experimental data, measured at various w (see Fig. 5). If d0is not available, dw=0 can be used; this change normally
introduces an error lower than 0.1% in the stresses values
[14].
3.2. Raman stresses
The micro-Raman spectroscopy is also a powerful
technique to determine the phase structure and the residual
stresses of materials. This technique allows measurements in
very small areas (micrometer range) for the assessment of
the residual stresses in the coatings cross section as well in
the thin interlayer such as the thermal growth oxides in
TBCs [21]. The stress state evaluated by Raman spectro-
scopy requires a previous calibration curve where a stress
value determined by other technique is usually assumed.
Using this calibration sample, the relation between the
Raman shift and imposed external bending stress is
determined in order to obtain the calibration curve. The
shift in the peak position versus the intensity of the applied
stress is based on a linear fit of the experimental data. For
the ZrO2–8wt.%Y2O3 plasma sprayed coatings, Teixeira et
al. [21] found a linear relationship between the applied
stress and the peak shift and each cm�1 shift corresponds to
220 MPa. It is well known that the Raman shifts towards
higher wave numbers corresponding to an increase in the in-
plane compressive residual stresses and, in the inverse order,
a tensile residual stress.
3.3. Brillouin scattering
Brillouin scattering by longitudinal bulk waves was
observed. In a homogeneous medium of refractive index n,
mass density q and tensor of elastic constants Cij, back-
scattering of light of wavelength (in vacuum) k0 exchanges a
wave vector 2(2p/k0)n. Acoustic waves having wavelength
k=k0/2n are thus probed. The velocity of longitudinal bulk
waves [22] being vl ¼ffiffiffiffiffiffiffiffiffiffiffiffiC11=q
p, such waves have frequency
f ¼ffiffiffiffiffiffiffiffiC11
q
s2n
k0ð9Þ
and give, in the Brillouin spectrum, a peak at this frequency
shift. If the values of q and n are known, the elastic constant
C11 is measured. For an isotropic medium C11 is given, in
terms of Young’s modulus E and Poisson’s ratio m, by
C11=E(1�m)/(1+m)(1�2m).In the application of the method to a porous medium like
the TBC, the pore size distribution has to be carefully
considered. In general, for the propagation of a wave in a
porous (or, more generally, inhomogeneous) medium, the
waves sees the pores (much) smaller than the wavelength
only by an averaged effect: the wave propagates in an
effective equivalent homogeneous medium, whose proper-
ties are an average of the solid and pore properties. The
pores being much larger than the wavelength are seen as
external surfaces instead of pores, which simply reflect the
wave, while the pores of intermediate size diffract the wave,
dispersing its direction. In the TBC, since the laser wave-
length is k0=514.5 nm and the refractive index is of the
order of 2 (see below), the probed optical wavelength is
~250 nm, and the acoustical wavelength is half of it.
Therefore, the total porosity (void fraction) p can be
decomposed as p=p1+p2+p3 where p1 is due to dsmallTpores, below ~100 nm, p2 is due to dmediumT pores,
between ~100 nm and ~2 Am, and p3 is due to dlargeT pores,above ~2 Am. While dlargeT pores are seen by both optical
and acoustical waves considered here as external surfaces
which cause reflections only, dmediumT pores contribute to
diffraction, implying spectral peak broadening. Only the
dsmallT pores, being smaller than wavelength, are seen by
both types of waves as contributing to the properties of the
equivalent homogeneous medium in which they propagate.
Brillouin spectroscopy therefore probes the properties
of this equivalent medium formed by the compact
ceramics of properties nV, qV and CV11, and only the
fraction p1 of the porosity. The properties of such a
medium are q=qV(1�p1) (by definition) and CV11cC11(1�p1)
2/3; thus for acoustic waves vlcvVl(1�p1)�1/6.
For optical waves, a detailed analysis [23] gives the implicit
result 1� p1 ¼ ð1�n2ÞðnV2þ2n2Þ3n2ð1�nV2Þ ; for nVV3 and p1V0.15, the
decrease of n due to porosity remains below 0.3; the simple
average weighted by volume fractions ncnV(1�p1)+
p1=nV[1+(1/nV�1)p1] predicts this decrease to within 0.005
(absolute difference) and is therefore acceptable in this

A. Portinha et al. / Surface & Coatings Technology 188–189 (2004) 120–128124
range. Eq. (9) therefore gives ( fVis the frequency given by
nV, qVand CV11)
fcf Vð1� p1Þ�1=61þ 1
nV� 1
�p1
� �;
ð10Þ
Computation of df/dp gives Df/fV=(1/nV�5/6)p1; with
nVc2.2 this means Df/fVc�0.38p1: a 1% porosity in small
pores implies a 0.38% decrease in spectral peak frequency.
Fig. 4. Raman spectra of the coatings at various conditions (as-sprayed,
annealed and thermal cycled).
4. Results and discussion
4.1. Structural analysis and phase transformation
The structural analysis was performed to determine the
structure for all coatings and to determine the volume of
phase modification. Fig. 3 shows some typical XRD patterns
at lower angles and at high angles for the ZrO2–8wt.%Y2O3
plasma sprayed coatings in condition: as-sprayed, annealed
and thermal cycled coatings. All the as-sprayed coatings
present a polycrystalline tetragonal structure where the main
diffraction peak corresponds to the h111i planes. After
annealing and thermal shock for some of the tested samples,
a very small amount (less than 1–2%) of themonoclinic phase
was observed. The main diffraction peaks correspond to the
mh111i and mh�111i planes and due to the magnification
Fig. 3. XRD patterns of the coatings for the different conditions: (a) at
lower angles and (b) at high angles.
used in the plots these peaks are not visible. In Fig. 3b, the
high temperature tetragonal phases, which are well identified
as h004i and h400i peaks, are shown. After heat treatments,
no significant changes were observed which means a good
thermal stability of the coatings even after thermal cycling
exposure at high temperatures. TBCs during service at high
temperature the nontransformable tetragonal phases tend to
transform to the cubic phase and after cooling down, a
transformation to the monoclinic phase occurs [24]. It is well
known that the presence of monoclinic phase in TBCs should
be avoided because it reduces TBCs lifetime due to the 3% to
5% volume increase during the tetragonal to monoclinic
transformation inducing coating failure. A small shift in the
XRD peak positions, which can be explained by the changes
in the thermal stresses after heat treatments, is well observed.
Using a Pseudo-Voigt function, the main peaks were
fitted and determined for each peak the Gaussian and
Lorentzian components that represent the micro-strain and
grain size, respectively [25]. The grain size was determined
using the Scherrer equation. An increase in the grain size
after heat treatments was observed. These values are 31 nm
for the as-sprayed coatings, 68 nm for annealed and 60 nm
for the thermal cycled samples.
Fig. 4 shows the micro-Raman spectra of the ceramic top
layer of the TBCs studied where the typical Raman bands
for the tetragonal phase of stabilized zirconia coatings (146,
260, 320, 470, 612, 640 cm�1) are present. No monoclinic
bands were observed which confirms the results obtained by
XRD and no changes were observed after thermal cycling.
The principal Raman bands of zirconia tetragonal phase are
at 260 and 640 cm�1 and are related with the stretching
modes of Zr–OII and Zr–OI, respectively. Considering the
Raman band at about 640 cm�1, some shifts are observed
due to the presence of different in-plane stress states.
4.2. Residual stresses analysis
The low stress intensity in the plasma sprayed ZrO2–
8wt.%Y2O3 top coat can be understood by its low stiffness,

Fig. 5. d-spacing of the tetragonal h620i crystallographic planes of ZrO2
function of the sin2w measured at the surface of the coatings. Three
measurements are presented, each one for each condition of the samples. By
these slopes, it is shown that there is an increase in compressive stresses
with the heat treatments.
A. Portinha et al. / Surface & Coatings Technology 188–189 (2004) 120–128 125
which arises from its typical microstructure containing inter-
splat porosity and an intralamellar micro-crack that leads to
a high strain tolerance. After annealing and thermal cycling,
due to the sintering effects and microstructural changes, the
stiffness of the ceramic top coats increases which develops
higher stresses and a higher probability to failure [26].
The main factor affecting the lifetime of TBCs is the
resistance of the coatings to spallation after thermal
exposure due to the residual stresses generated [27,28].
During heat treatments or/and in service, a TGO grows
between bond coat and top coat and the sintering of the top
coat microstructure changes the stress states and reduces the
fracture toughness.
The average values of the residual stresses at the surface
obtained for the samples by various techniques are in Table 2
for the different conditions of the samples at room temper-
ature. An increase in the compressive residual stresses after
thermal cycling and annealing treatments can be seen.
Tensile stresses at the surface of the coatings are mainly
due to the rapid quenching of the splashed plasma sprayed
droplets, arriving to the substrate and to the surface of the
coating in growth process which is at lower temperature
than the molten sprayed particles. Fig. 5 represents the d-
spacing of the tetragonal h620i crystallographic planes of
ZrO2 versus sin2w measured at the coatings surface. These
data were used to calculate the stresses presented in Table 2.
The changes in the slopes indicate an increase in compres-
sive stresses with the heat treatments. For the as-sprayed
samples, a lower tensile stress at the surface due to the
typical growth of the coatings and quenching effects is
observed. The stresses are more compressive near the
interface and decrease towards the surface. After annealing,
the residual stresses increase in compression as expected,
due to relaxation at high temperature. The in-plane
compression stress state is related with an increase in the
elastic modulus of the material due to the sintering effects
like homogeneity of the pores and reduction in the cracks
width. After thermal cycling, the state of tensile stress also
increases in compression but reaches lower values than for
the annealed samples. This difference can be explained by
some relaxation effects due to quenching. This rapid cooling
develops some micro-cracks within the coatings that have
an opposite effect to the sintering process developed during
the exposure at high temperature.
At high temperature, a residual stress relaxation on the
ceramic top layers is observed. After cooling down to room
temperature, a higher compressive stress is developed
Table 2
Residual stresses measured at the surface determined with different
techniques
Sample condition Measurement method
XRD (MPa) XRD–sin2w (MPa) Raman (MPa)
As-sprayed �92 37 c0
Annealed �404 �22 �594
Thermal cycled �37 �14 �462
within the coatings due to the differences between the
coefficients of thermal expansion of substrate and coatings.
Another factor which influences the residual stresses at the
interface between the top coat and bond coat is the growth
of the thermal growth oxide developed at high temperatures,
which is mainly a-Al2O3.
As it is presented in Fig. 6a, the residual stresses
evaluated by micro-Raman spectroscopy along the cross
section in the annealed samples increase in compression
from a small traction at the free surface towards the interface
near the TGO where a value of 660 MPa is reached.
Measurements inside the TGO were also performed but it
was not possible to assess the residual stresses due to the
background of the spectra which was high enough to absorb
any peak of the TGO. These results are in agreement with
the theory [29].
Fig. 6. Residual stresses evolution along the cross section: (a) for the
annealed samples determined by Raman analyses; (b) for the as-sprayed
samples determined by XRD–sin2w, and the residual stresses for the
annealed and thermal cycled samples at the surface is also represented by
this method.

A. Portinha et al. / Surface & Coatings Technology 188–189 (2004) 120–128126
In Fig. 6b, the values of the residual stresses measured by
XRD–sin2w method for the samples in the three conditions
studied are plotted. These values are plotted for the surface
position and for the as-sprayed condition the evolution of the
residual stresses along the cross section towards the interface
with bond coat is also plotted. These measurements along the
cross section have been done after successive remotion of
material by polishing which means that these values can be
affected by the stresses imposed with the polishing process;
however, this operation had been done carefully and at very
low loads. The residual stresses for the as-sprayed condition
change gradually within the coating with the maximum in-
plane compressive stresses at the interface and very low
values at the free surface. These results are in agreement with
the modeled residual stresses done by Teixeira et al.
[1,21,30] which show a gradient in the residual stresses
with higher compressive stresses at the interface decreasing
to very low values of the stresses on the surface.
The results plotted in Fig. 6 show a similar behavior in
the evolution of the residual stresses through the cross
section for the coatings after deposition and after annealing
in a furnace at 1100 8C during 100 h. From the theoretical
concepts, the residual stresses increase in compression
towards the interface with the bond coat for the annealed
samples. The differences in the values before and after
annealing can be justified by the stress relaxation, sintering
effects, mismatch of thermal expansion coefficients between
the top layer and the metallic part. Near the interface the
residual stresses can be affected by strains developed during
TGO growth. For the as-sprayed samples, the values of the
residual stresses can be affected by the preparation
technique because the material layer removing after layer
tends to increase slightly the compressive stresses due to
some densification promoted by the low pressure polishing
of the surface.
The results plotted in Fig. 7 relate the residual stresses
with the porosity. It is well observed that for the lower
Fig. 7. Changes in the residual stresses as function of the porosity contents
along the cross section for the as-sprayed coatings (measurements
effectuated by sin2w).
porous structure the residual stress increase in compression.
This effect means that the control on the level of porosity
within the coatings could be used to produce graded
coatings in porosity in order to control the residual stress
distribution. This is in agreement with theory because
coatings with lower porosity have higher elastic modulus
and also higher stiffness which predicts higher levels in
compressive residual stresses; nevertheless, this alone is not
the only reason for compressive stress. The porosity level
and the shape of porous have an important influence in the
elastic modulus. In fact, an adequate porosity control
enables to obtain an optimized lifetime of thermal barrier
coatings [30].
4.3. Elastic properties
The main findings from Brillouin spectra are as follows:
a single peak is observed, which is due to a bulk wave
because its frequency does not change with the incidence
angle (the frequencies of peaks due to surface waves scale
as the sine of the incidence angle). Since in backscattering
peaks due to transverse waves are much weaker, this peak is
attributed to the longitudinal bulk wave. The first result is
that the frequency of this peak is around 17 GHz,
throughout the thickness. From Eq. (9), assuming for the
effective medium, due to small pores only, qc5500 kg/m3
and nc2, this frequency gives C11c26 GPa; assuming
mc0.23 (the value of tetragonal zirconia) this means for
Young’s modulus Ec22 GPa. The precision of this value is
limited by the precision of the measured frequency of the
spectral peaks, and of the estimates of values of q and n due
to small pores only, not to the total porosity. This is a
relatively low stiffness, and could be attributed to defects at
grain boundaries, implying nonperfect adhesion among
grains, and also to the influence of the boundaries
themselves. The grain size being of the order of 60 nm
(half of the acoustic wavelength), even if boundaries are
defect free they contribute to scattering and diffraction of
the acoustic wave, possibly affecting the effective prop-
agation velocity.
The second finding comes from the comparison of the
spectra at different depths. Residual stresses are non-
influential, because their effect on the acoustic velocity is
only through the third order elastic constants; porosity
instead changes with depth. Experimentally as it is plotted in
Fig. 8, in an outer layer of approximately 20% of the TBC
thickness, peaks are relatively sharp and well defined; in the
rest of the thickness peaks become significantly weaker and
broad (they extend from 13 up to 18 GHz, their weak and
noisy aspect making rather erratic a statistical fit to attribute
a more precise frequency). Light scattering and diffraction
by small pores and internal surfaces tend to broaden the
peaks toward lower frequencies, because light emerging
from scattering events not perfectly in backscattering (and
therefore of lower frequency) can, by successive elastic
scattering, be deviated and collected. The sharper peaks in

Fig. 8. Brillouin spectra measured in the cross section of an annealed TBC,
close to the external surface (dots) and at mid-depth (crosses). Continuous
lines are smoothed interpolants. (The anti-Stokes part is shown, while
interpolation is performed on the average of Stokes and anti-Stokes parts.)
A. Portinha et al. / Surface & Coatings Technology 188–189 (2004) 120–128 127
the outer layer therefore suggest a lower fraction of dsmallTand dmediumT pores in the outermost layer. This is
consistent with the indication coming from frequency:
although for spectra from deeper layers the peak frequency
cannot be precisely attributed, these broad peaks tend to be
at slightly lower frequencies than those measured from the
outer layer. According to the analysis presented above, an
increase of porosity in dsmallT pores induces a decrease in
spectral peak frequency.
In conclusion, a precise analysis of Brillouin data is not
possible because of the poor quality of spectra, due to the
nature of ceramic materials; the YoungTs modulus turns to
be around 22 GPa, and there are consistent indications
(although not a conclusive evidence) that in the annealed
specimen the porosity due to either dsmallT pores (below
~100 nm) or dmediumT pores (below ~2 Am) decreases
towards the outer surface, although the overall porosity
increases due to the dlargeT pores.
5. Conclusions
The residual stresses and elastic properties of graded
plasma sprayed ZrO2–8wt.%Y2O3 coatings have been
measured at room temperature for the as-sprayed coatings,
annealed and thermal cycled.
It was demonstrated that both X-ray diffraction and
micro-Raman spectroscopy are powerful techniques to
determine the microstructure and the residual stresses in
the coated parts.
Brillouin scattering detects bulk acoustic waves only,
allowing an estimation of Young’s modulus; since it is a
dmesoscopicT technique, it gives an indication on the
structure and porosity at the ~100 nm scale.
The coatings presents a tetragonal phase with a preferred
orientation on the h111i direction and no significant changesoccurs after thermal exposure. The most important change
was the grain size growth after heat treatments which
increase from 31 to 68 nm.
These graded thermal barrier coatings presents a tensile
stress state at the free surface which increase in compression
towards the interface. The residual stresses show an increase
in compression after annealing; however, for thermal
shocked samples, this increase is smaller.
It has been shown that the residual stresses increase in
compression when the porosity levels decrease; however,
more detailed studies are being performed in order to detect
or not the real physical correlation between coating gradient
porosity and residual stress distributions.
Acknowledgments
This work was financially supported by FCT-Portuguese
Foundation for Science and Technology under the project
POCTI/EME/39316/2001: bPVDCOAT—Composite and
multilayered protective coatings for efficient energy sys-
temsQ. The cooperative work is also supported by German-
Portuguese Cooperative Programme ICCTI-DAAD and
European Commission-DG-XII under contracts: ICCTI-
DAAD/423/2000, bComposite coatings for high temper-
ature applicationsQ and COST 522, WP2/SP2-1999/01:
bResidual stresses and failure in multilayered and function-
ally graded coatings for advanced energy systemsQ (projectsleader: V. Teixeira). A. Portinha is grateful for the Research
Grant supported by F.C.T.-Portuguese Foundation for
Science and Technology.
References
[1] V. Teixeira, M. Andritschky, W. Fischer, H.P. Buchkremer, D. Stfver,Surf. Coat. Technol. 120–121 (1999) 103.
[2] Jeanine T. DeMasi-Marcin, Dinesh K. Gupta, Surf. Coat. Technol. 68/
69 (1994) 1.
[3] G. Johner, K.K. Schweitzer, J. Vac. Sci. Technol. A3 (6) (1985) 2516.
[4] R. Vahen, D. Stfver, Functional Gradient Materials and Surface
Layers Prepared by fine Particles Technology, Kluwer Academic
Publishing, Netherlands, 2001, p. 199.
[5] S. Raghavan, H. Wang, W.D. Porter, R.B. Dinwiddie, M.J. Mayo,
Actra Mater. 49 (2001) 169.
[6] J.R. Nicholls, K.J. Lawson, A. Johnstone, D.S. Rickerby, Surf. Coat.
Technol. 151–152 (2002) 383.
[7] D. Stfver, C. Funke, J. Mater. Process. Technol. 92–93 (1999) 195.
[8] S. Kuroda, T.W. Clyne, Thin Solid Films 200 (1991) 49.
[9] T.W. Clyne, S.C. Gill, J. Therm. Spray Technol. 5 (1991) 401.
[10] V. Teixeira, M. Andritschky, H. Gruhn, W. Mallener, H.P.
Buchkremer, D. Stfver, in: C. Berndt (Ed.), Proc. of 8th National
Thermal Spray Conference, ASM International, Houston, USA,
1995, p. 515.
[11] G. Chang, Phucharoen, R. Miller, Surf. Coat. Technol. 30 (1987) 13.
[12] V. Teixeira, M. Andritschky, W. Fischer, H.P. Buchkremer, D. Stfver,J. Mater. Process. Technol. 92–93 (1999) 209.
[13] I.C. Noyan, J.B. Cohen, Residual Stresses—Measurement by Dif-
fraction and Interpretation, Springer-Verlag, New York, 1987, p. 117.
[14] B.D. Cullity, Elements of X-ray Difraction, Second Edition, Addison-
Wesley Publishing, 1978, p. 447.

A. Portinha et al. / Surface & Coatings Technology 188–189 (2004) 120–128128
[15] J. Gonzalez-Hernandez, G.H. Azarbayejani, R. Tsu, F.H. Pollak, Appl.
Phys. Lett. 47 (1985) 1350.
[16] Y. Shigesato, A. Murayama, T. Kamimori, K. Matsuhiro, Appl. Surf.
Sci. 33–34 (1988) 804.
[17] Joel W. Ager III, Michael D. Drory, Phys. Rev., B 48 (4) (1993) 2601.
[18] Q.H. Fan, J. Gracio, E. Pereira, J. Appl. Physi. 87 (6) (2000) 2880.
[19] A. Portinha, V. Teixeira, J. Martins, M.F. Costa, R. Vahen, D. Stfver,Advanced Research Workshop on Nanomaterials and Coatings, Kiev,
NATO series E-Appl Sci., Kluwer Academic Publishing, 2002.
[20] M.G. Beghi, C.E. Bottani, R. Pastorelli, in: C. Muhlstein, B. Brown
(Eds.), Mechanical Properties of Structural Films, ASTM STP 1413,
American Society for Testing and Materials, West Conshohocken, PA,
2001.
[21] V. Teixeira, M. Andritschky, W. Fischer, H.P. Buchkremer, D. Stfver,J. Mater. Process. Technol. 92–93 (1999) 209.
[22] M. Grimsditch, in: M. Levy, H. Bass, R. Stern, V. Keppens (Eds.),
Brillouin Scattering, Handbook of Elastic Properties of Solids, Liquids
and Gases, vol. 1, Academic Press/Harcourt Publishers Ltd., Sidcup,
UK, 2000.
[23] D.E. Aspnes, J.B. Theeten, F. Hottier, Phys. Rev., B 20 (1979) 3292.
[24] Jaeyun Moon, Hanshin Choi, Hyungjun Kim, Changhee Lee, Surf.
Coat. Technol. 155 (2002) 1.
[25] Th.H. De Keijser, J.I. Langford, E.J. Mittemeijer, A.B.P. Vogels,
J. Appl. Crystallogr. 15 (1982) 308.
[26] J.A. Thompson, T.W. Clyne, Acta Mater. 49 (2001) 1565.
[27] A.G. Evans, M.Y. He, J.W. Hutchinson, Prog. Mater. Sci. 46 (2001)
249.
[28] A.G. Evans, D.R. Mumm, J.W. Hutchinson, G.H. Meier, F.S. Pettit,
Prog. Mater. Sci. 46 (2001) 505.
[29] Y.C. Tsui, T.W. Clyne, Thin Solid Films 306 (1997) 23.
[30] V. Teixeira, Surf. Coat. Technol. 146–147 (2001) 79.