
Econometric Estimation of the Wage Penalty for the Motherhood
Upload
u-bourgogneCategory
view
1download
0
Research and Development, Innovation, Training, Quality and Profitability:
Evidence from France1
Fabrice Galia and Diègo Legros2
ERMES-UMR-7017-CNRS Université Panthéon-Assas Paris II
Abstract: This paper simultaneously explores the firm-level relationships between R&D investments, innovation, training investments, quality and firm performance. It offers empirical evidence on how innovation, training and quality affect firm profitability. One new feature we introduce is the link between training and quality. Using asymptotic least square, we estimate a five-equation model including censored, dichotomous and linear variables with a specific circular scheme. The data are from the French innovation survey combined with firm-level register data. This allows us to consider a number of training and quality related variables which are usually neglected in the literature. While traditional determinants are controlled for, our results show there exists a virtuous circle. Our results are also in line with a number of stylized facts.
Keywords: R&D, Innovation, Training, Quality, Profitability, Limited Dependent and Qualitative Variables, Asymptotic Least Squares. JEL Classification: C31, C34, L60, O31, O33.
1 We are grateful to G. Ballot, J. Belin, G. Bresson, E. Duguet, L. Earl, B. Hall, J. Mairesse, P. Mohnen, participants to the 2003 ESEM, Stockholm, 2003 NBER CRIW CREST Conference, Paris, 2003 SESAME, Caen, 2002 ESSID Summer School for their helpful comments. The usual disclaimer applies. 2 ERMES - CNRS UMR 7017- Université Panthéon-Assas Paris II - 12, place du Panthéon - 75270 PARIS Cedex 05 - Tél. : +33 (0)1 44 41 89 91 - Fax . : +33 (0)1 40 51 81 30 - Corresponding author : [email protected].
1
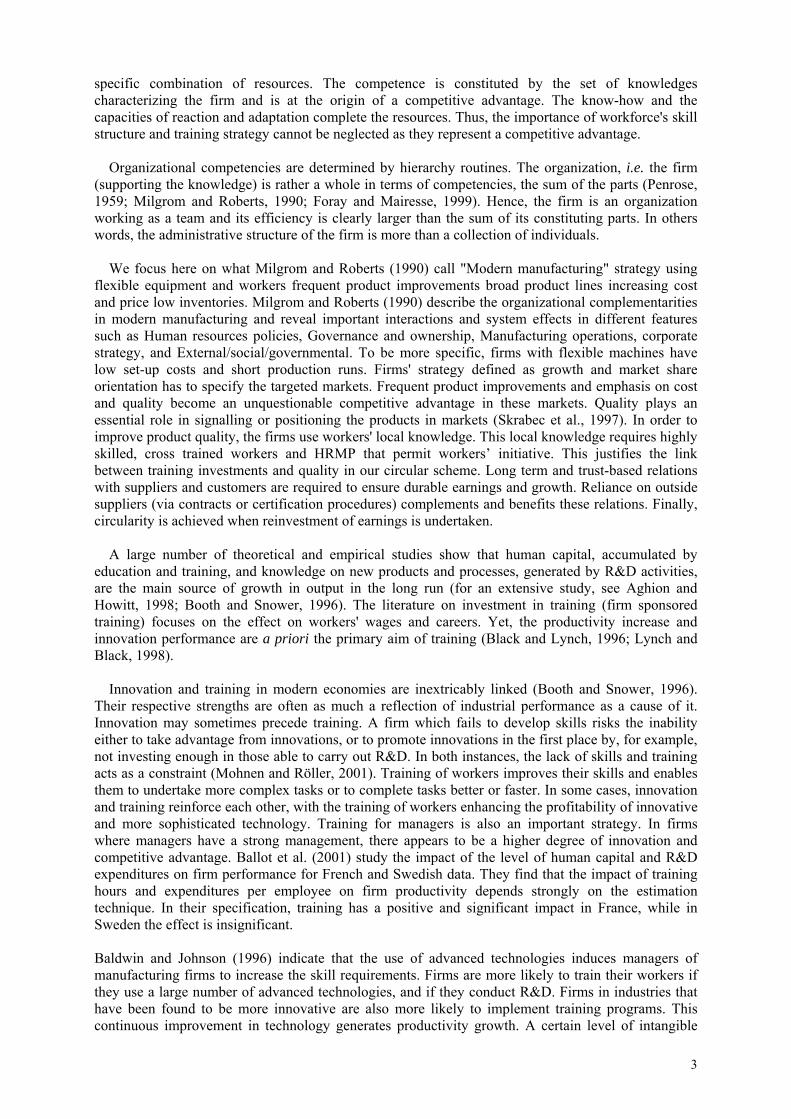
1 Introduction The link between innovation and firm performance has been the main focus of a large number of studies in the recent decades3. The impact of various variables on R&D investments and innovation has been studied in the "Schumpetarian tradition"4: size, industry effects, market share, and group membership, importance of demand, technological opportunities, and information sources. Crépon, Duguet and Mairesse (1998a and 1998b, henceforth CDM), Duguet and Kabla (1998) and Duguet and Greenan (1999) offer an attractive empirical model and an appropriate econometric method (which correct for selectivity and simultaneity biases) to better understand of the processes containing what has been called the "black box" by Rosenberg (1982). CDM explore the relationship between French R&D investments and firm performance via innovation strategies (patent or innovative sales). They estimate a four-equation model, similar to the basic idea outlined in Griliches' model (1995). They find results that are consistent with many stylized facts in the empirical literature5. Ballot et al. (2001) explore the relationship between two forms of intangible capital, namely training sponsored by the firm and R&D, innovation and exports. This study is based on a sample of French firms and it establishes a circular scheme between training, R&D, innovation and exports. However, the innovation literature does not simultaneously account for the relationships between R&D investments, innovation, training investments, quality and firm performance. This paper aims at describing these relationships and the firms' specific characteristics conducive to performance. As far as we know, the specific relationship between training, quality and firm performance has never been studied. We overcome this limitation thanks to a French data set which provides us with a number of training investments and quality related variables which are usually neglected in the literature. Our analysis is based on five-equation system describing a specific circular scheme (see Fig. 1 in Appendix) where: 1- R&D investments are endogenous in the innovation equation; 2- innovation is endogenous in the training investments equation; 3- training investments are endogenous in the quality equation; 4- quality is endogenous in the profitability equation; and finally 5- profitability is endogenous in the R&D investments equation. This last relationship permits to establish the circularity of our scheme. This paper uses the theoretical tools of microeconometrics of innovation, adapted to our data, such as probit models, tobit models, simultaneous equations and asymptotic least squares (ALS). The paper is organized as follows. Section 2 reviews the literature on training and quality. Section 3 introduces the model.and the variables of interest. Section 4 describes the econometric setup. The main results are presented and discussed in section 5. Section 6 concludes the paper. 2 Integrate training and quality in the innovation process Employees, competencies and knowledge are a major asset of innovative firm's. The firm can be presented as a competent team where a tacit organizational competence improves the productivity and performance through selecting and allocating competent people. Therefore, human resource management practices (henceforth, HRMP) are an important strategic relevant resource (Milgrom and Roberts, 1990 and 1995). The approach in terms of competencies has been developed since the 1990's in order to understand the internal design of the firm. Penrose’s (1959) early work presents the firm as a collection of resources associated with an administrative structure6. The firm is characterized by one
3 See Griliches, (1984); Cohen, (1995); Stoneman, (1995); Cohen and Klepper, (1996); Dogson and Rothwell, (1994); Grupp, (1998); Hall and Mairesse, (1995); Encaoua et al., (2000); Foray and Mairesse, (1999); Kleinknecht and Mohnen, (2001). 4. For a survey of the empirical studies, see Cohen and Levin, (1989); Mairesse and Sassenou, (1991) and Mairesse and Mohnen, (1999). 5 The probability of engaging in R&D and research effort for a firm increases with its size, its market share and diversification, and with the demand pull and technology push indicators. The firm innovation output, as measured as patent numbers or innovative sales, rises with its research effort and with the demand pull and technology push indicators (either directly or indirectly through their effects on research). Finally, firm productivity correlates positively with an higher innovation output, even when controlling for the skill composition of labor as well as for physical capital intensity. Using ALS method, Duguet and Kabla (1998) estimate two equations modelling the propensity to patent and the number of patent. Duguet and Greenan (1999) estimate simultaneously innovation function and factors demand (conception labor, excution labor and capital). 6 The resources are defined as tangibles and intangibles factors, and services extracting from these factors.
2
specific combination of resources. The competence is constituted by the set of knowledges characterizing the firm and is at the origin of a competitive advantage. The know-how and the capacities of reaction and adaptation complete the resources. Thus, the importance of workforce's skill structure and training strategy cannot be neglected as they represent a competitive advantage. Organizational competencies are determined by hierarchy routines. The organization, i.e. the firm (supporting the knowledge) is rather a whole in terms of competencies, the sum of the parts (Penrose, 1959; Milgrom and Roberts, 1990; Foray and Mairesse, 1999). Hence, the firm is an organization working as a team and its efficiency is clearly larger than the sum of its constituting parts. In others words, the administrative structure of the firm is more than a collection of individuals. We focus here on what Milgrom and Roberts (1990) call "Modern manufacturing" strategy using flexible equipment and workers frequent product improvements broad product lines increasing cost and price low inventories. Milgrom and Roberts (1990) describe the organizational complementarities in modern manufacturing and reveal important interactions and system effects in different features such as Human resources policies, Governance and ownership, Manufacturing operations, corporate strategy, and External/social/governmental. To be more specific, firms with flexible machines have low set-up costs and short production runs. Firms' strategy defined as growth and market share orientation has to specify the targeted markets. Frequent product improvements and emphasis on cost and quality become an unquestionable competitive advantage in these markets. Quality plays an essential role in signalling or positioning the products in markets (Skrabec et al., 1997). In order to improve product quality, the firms use workers' local knowledge. This local knowledge requires highly skilled, cross trained workers and HRMP that permit workers’ initiative. This justifies the link between training investments and quality in our circular scheme. Long term and trust-based relations with suppliers and customers are required to ensure durable earnings and growth. Reliance on outside suppliers (via contracts or certification procedures) complements and benefits these relations. Finally, circularity is achieved when reinvestment of earnings is undertaken. A large number of theoretical and empirical studies show that human capital, accumulated by education and training, and knowledge on new products and processes, generated by R&D activities, are the main source of growth in output in the long run (for an extensive study, see Aghion and Howitt, 1998; Booth and Snower, 1996). The literature on investment in training (firm sponsored training) focuses on the effect on workers' wages and careers. Yet, the productivity increase and innovation performance are a priori the primary aim of training (Black and Lynch, 1996; Lynch and Black, 1998). Innovation and training in modern economies are inextricably linked (Booth and Snower, 1996). Their respective strengths are often as much a reflection of industrial performance as a cause of it. Innovation may sometimes precede training. A firm which fails to develop skills risks the inability either to take advantage from innovations, or to promote innovations in the first place by, for example, not investing enough in those able to carry out R&D. In both instances, the lack of skills and training acts as a constraint (Mohnen and Röller, 2001). Training of workers improves their skills and enables them to undertake more complex tasks or to complete tasks better or faster. In some cases, innovation and training reinforce each other, with the training of workers enhancing the profitability of innovative and more sophisticated technology. Training for managers is also an important strategy. In firms where managers have a strong management, there appears to be a higher degree of innovation and competitive advantage. Ballot et al. (2001) study the impact of the level of human capital and R&D expenditures on firm performance for French and Swedish data. They find that the impact of training hours and expenditures per employee on firm productivity depends strongly on the estimation technique. In their specification, training has a positive and significant impact in France, while in Sweden the effect is insignificant. Baldwin and Johnson (1996) indicate that the use of advanced technologies induces managers of manufacturing firms to increase the skill requirements. Firms are more likely to train their workers if they use a large number of advanced technologies, and if they conduct R&D. Firms in industries that have been found to be more innovative are also more likely to implement training programs. This continuous improvement in technology generates productivity growth. A certain level of intangible
3
capital then favours productivity growth. Characteristics such as higher firm growth rates, difficulties in hiring, large size are also associated with a greater probability of training. Baldwin and Johnson (1996) confirm the close connections between training, labour skills and innovation. Training leads to an increase in the quality of labour, by equipping employees with greater skills and knowledge. Training is also positively related to the emphasis that a firm gives a total quality management. Economists' work on product differentiation has generally neglected considerations of R&D in the choices of product variety. Typically, it is assumed that firms choose a variety and begin production immediately without having to learn how to produce it (Grossman and Helpman, 1995). In this paper, R&D expenditures, innovation, training expenditures are treated as important determinants of quality. Better quality usually command bigger market shares and higher profits for the firm. However, developing better quality also requires higher R&D expenditures and longer development schedules, during which a competing firm may develop and introduce its product first and then capture market share (Lehmann-Grube, 1997; Li and Rajagopalan, 1998 and Anderton, 1999). Grossman and Helpman (1995) acknowledge the role of innovation in the development of new varieties of a horizontally differentiated product, but they also stress the importance of innovation in developing new products that are of higher quality available on the market. Booth and Snower (1996) and Abowd et al. (1996) provide evidence that there exists an interaction between workforce skills, product quality and economic performance. As the data provide us with information on Iso 9000 qualification, we proxy quality by Iso certification (for more details on Iso certification, see in Appendix). 3 Data and empirical setup 3.1 Data and variable definitions The sample used for this study results from matching six different French data sources. The first four convey information on innovation activity in French manufacturing firms, while the last two provide accounting and qualification information. 1- The first one is the French Community Innovation Survey 1997, "L'Innovation Technologique dans l'Industrie" (CIS2) over the period 1994 to 1996 carried out by SESSI7. This investigation belongs to the Community Survey8 on technological innovation. The CIS2 survey asks French manufacturing firms, with more than 20 employees, on the way that they have innovated as well as the origins of the technological innovations, the objectives of the technological innovation, the information sources used in the innovation process and finally the obstacles to the projects of innovation. Innovating firms are those which have introduced technological product and/or process innovation during the period 1994-1996. We know if the firm is engaged in internal and/or external R&D. We know also if it received a public financing (dummy variable: "yes" or "no") and if it engaged in cooperations agreements with others firms or organisms (dummy variable also). Data are available on training ("training directly linked to technological innovation"). We compute the logarithm of training expenditures per employee. Dummy variables are available for the group membership: independent firm, french group and foreign group. Finally, the firm informs us if it has encountered the obstacle of lack of skilled workers. 2- The second one is the "Enquête Recherche et Développement" 1996 (Research and Development Survey) which is an annual survey, carried out by the MENRT9. This survey collects precise data on research expenditures of firms with at least one full-time employee in research activities. We use this data set to measure the total amount dedicated to R&D, we compute the logarithm of R&D expenditures per employee. 3- The third one is the "Compétences pour Innover" 1997 survey (Competencies Survey) carried out by the SESSI over the period 1994-1996. This is a non-mandatory survey with a sample of manufacturing firms with at least 20 employees. The firms answered to the detention of 9 large class of competencies given 73 elementary competencies, considered as organizational practices and 7 The SESSI is the industrial statistics department of the French Ministry Finance. For a detailed description of CIS2 in France see François and Favre (1998). 8 Survey CIS2 is based on the Oslo Manual drawn up by the OCDE, and revised in 1996. 9 The MENRT is the French Ministry of Education, Research and Technology.
4
defined as dummy variables (see Foray and Mairesse, 1999; François, 1998). We know if the firm is qualified or in progress to ISO 9000 qualification, we use it to perform the quality dummy variable. Firms reveal if they analyse consumers’ needs, engineers’ publications, competing patents, products’ defects and competing products (reverse-engineering). We know also if firms adopt quickly new equipments, do consumers’ tests. 4- The fourth data set is the survey on Industrial Property in 1996, carried out by the INPI10. It includes informations on firms' patents. We use this data set to compute the firm-level stock of patents during the period 1994-1996. 5- The fifth one is the "Enquête Annuelle d'Entreprises" 1996 (Yearly firm data set). It provides most financial and accounting information such as sales of firms, capital assets. The market share, capital intensity and profitability index are computed from this data set. The sectoral decomposition at the NAF 114 level allows to compute the Herfindhal concentration index. Let be the domestic sales of firm i in the k sector, the market share is: ikS
∑=
= n
iik
ikik
S
Ss
1
ki,∀
Herfindhal index is: 2
1
n
k iki
H s k=
= ∀∑
Capital intensity, i.e. physical capital per employee, is defined as the ratio of capital stock on number of employees. In order to compute the real capital stock for each firm, we use the stock method that take into account the gross value of the stock of physical assets in the balance sheets assets and deflate them by a price index of capital stock11. We compute also the indicator of firms' profitability called gross margin. This one is defined by operating margin divided by the total sales before taxes. Sectorial effects are taken into account by using four sectors at the NAF 16 level of the French industrial classification: consumer goods (NAF EC), car industry (NAF ED), other equipment goods (NAF EE) and intermediate goods (NAF EF). 6- The last one is the annual survey on jobs' structure "Enquête sur la Structure des Emplois" 1996 (ESE). It informs us on the distribution of employees by occupational categories. We form four main share of engineers in manufacturing and construction in production lines, marketing personnel, skilled workers (including technicians and foremen), and unskilled workers in total employment of the firm. The merger of these six data sets provides a final sample of 2165 firms, including 1220 innovating firms. All descriptive statistics are available in Table 1 and 2 in Appendix. In the following subsection, we present each of the five equations of the model because each of them requires a specific treatment. 3.2 R&D equation The empirical evidence shows that only a minority of firms is engaged in formal R&D activities. Hence, studies restricted to samples of firms engaged in formal R&D are prone to a selectivity bias. Contrary to these studies, our sample is composed by firms engaged in formal R&D and also firms non engaged in formal R&D. Therefore R&D expenditure is a censored dependent variable. So we use a tobit model. The tobit model is defined as follows:
* *1 1 1 1 1
10
0i i i i
iy if y X u
yotherwise
β⎧ = + >= ⎨
⎩
where is an unobservable latent variable and is a disturbance that take into account unobservable heterogeneity. We model the logarithm of R&D investments per employee. We explain
*1iy 1iu
10 Institut National de la Propriété Intellectuelle. 11 We are grateful to Jean Belin for giving us the capital stock variable.
5
the R&D expenditures by: index of firms' profitability ( describe below), size of firm and Herfindhal index. We introduce also several dummy variables such as public financing, consumers’ needs, innovation project too high-risk, industry effects and group membership.
5iy
3.3 Innovation equation The CIS2 survey contains some alternative measures of innovation output. Innovation can take the form of new products as well as new processes. We know if firms have innovated12 or not. Following the empirical literature on topics, we assume that the implementation of process and/or product innovation depends on knowledge accumulation that is an unobservable latent variable. We use a binary choice model so as to estimate the following innovation function:
*2 2 2 2
21 00
i i ii
if y X uy
otherwiseβ⎧ = + >
= ⎨⎩
where is an unobservable latent variable and is the disturbance. We assume that this disturbance is normally distributed. Therefore, we can estimate the innovation equation by a probit model. Explanatory variables
*2iy 2iu
2X are: size of the firm, number of patents per employee owned by the firm13, dummy variables : cooperation agreements, analysis of competing products, analysis of engineers’ publications, analysis of competing products, analysis of competing patents, sectorial effects and group membership. These explanatory variables we are able to measure are most of the ones usually considered in the literature on R&D determinants, i.e. in the “Schumpetarian tradition”. Moreover, 2X include our latent R&D variable. *
1y 3.4 Training equation Like R&D investments, specific training expenditures are a censored dependent variable. So, we use a tobit model:
* *3 3 3 3 3
30
0i i i i
iy if y X u
yotherwise
β⎧ = + >= ⎨
⎩
The 3iX variables in this equation consist of innovation ( ), share of marketing personnel, share of skilled workers, share of unskilled workers, size of firm. The dummies are lack of skilled workers, adopt quickly new equipments, industry effects and group membership.
*2y
3.5 Quality equation Iso 9000 is a dummy variable. So for the reasons mentioned in equation of innovation, we estimate the quality by a probit model. We have:
*4 4 4 4
41 00
i i ii
if y X uy
otherwiseβ⎧ = + >
= ⎨⎩
4X is the matrix of explanatory variables containing training expenditures ( ), shares of the skills and unskilled workers, analysis of products defects, consumers tests, industry effects, number of employees and group membership.
*3y
12 Firms which have introduced technological product and/or process innovation. 13 This variable mostly measures the weight of past innovations in generating new knowledge, as far as they were protected by property rights.
6
3.6 Profitability equation There are many indicators of firms’ performance including the rate of profit, labour productivity, capital productivity... In this paper, the focus is on the profitability defined by the ratio gross operating surplus divided by sales. We suppose that this last relationship is linear. We use an augmented Cobb-Douglas function in order to estimate the profitability:
5 5i iy X u5i= +
Explanatory variables 5X are quality ( ), capital intensity, skills composition, market share, size of firm. Firms' profitability is also explained by dummy variables: industrial effects and group membership.
*4y
4 Econometric specification The econometric literature distinguishes two types of methods to estimate such simultaneous systems: on the one hand, the two step method, similar to the non linear two stage least squares and on the other hand, asymptotic least squares also known as Amemiya's method. This last one accounts for selection biases and the statistical features of our data: R&D investments and training expenditures are censored variables, innovation and quality are dichotomous variables, and profitability is continuous. Moreover, the method also corrects for simultaneity bias. In this paper, we estimate a five equations simultaneous system that forms a circular scheme (see Fig. 1 in Appendix) where: 1- R&D investments are endogenous in the innovation equation, 2- Innovation is endogenous in the training investments equation, 3- Training investments are endogenous in the quality equation, 4- Quality is endogenous in the profitability equation, and finally, 5- Profitability is endogenous in the R&D investments equation. Consider the following five-equation model associated to our circular scheme:
1 15 5 1 1 1
2 21 1 2 2 2
3 32 2 3 3 3
4 43 3 4 4
5 54 4 5 5
y y X uy y Xy y Xy y Xy y X
γ βγ βγ βγ βγ β
= + +⎧⎪
4
5
uuuu
= + +⎪⎪ = + +⎨⎪ = + +⎪⎪ = + +⎩
(1)
Where( )1
1,N k
X ,( )2
2,N k
X ,( )3
3,N k
X ,( )4
4,N k
X ,( )5
5,N k
X are the matrices of explanatory variables of, respectively, R&D
investments, probability to innovate, training investments, quality, firm profitability. We have to estimate a system that includes tobit, probit and linear equations. Following CDM (1998a and 1998b), Duguet and Kabla (1998), Duguet and Greenan (1999), we use nonlinear asymptotic least square (ALS) method developed by Gouriéroux, Monfort and Trognon (1982, 1985, henceforth GMT). GMT (1982, 1985) show that many estimation problems can be formalized as a set of relationships
between the parameters of interest ( ),g β θ = 0 β and the parameters θ for which a consistent
estimate θ is available. The relationships ( ),g β θ 0= are called the asymptotic model by the
authors. The asymptotic least-squares estimators of β minimizes the distances of ( ,g )β θ to zero in
the metric of a given weighting matrix . GMT (1982, 1985) show that the asymptotic least square estimator is strongly consistent and normally distributed. ALS method is close to what is known in the econometric literature as Amemiya's method (Lee, 1981). ALS method provides, in two steps,
S
7
consistent estimators of the structural form parameters directly from the reduced form parameters. In the first step, we estimate the reduced form and calculate the joint covariance matrix of parameters. At this point, we need to reinterpret the maximum likelihood estimators as a specific case of M-estimators14. In the second step, we need to establish relationships between the parameters of the reduced form and the parameters of the structural form. See in Appendix for a description of the estimation method. 5 Results and comments The following section presents the main results of estimating our system. The estimation results are in Appendix. The first result is based on the confirmation of the existence of one circular scheme with positive links which goes from R&D to innovation, from innovation to training, from training to quality, from quality to profitability and from profitability to R&D. The second result concerns the explanatory variables of each equation. They are the following: Concerning R&D expenditures, industry effects are not significant contrary to the previous literature on innovation (Cohen and Levin, 1989). Once these effects are controlled for, we find that firm size does not affect the R&D expenditures. This non significant impact of firm size agrees wholeheartedly with Cohen and Klepper (1996), who find that R&D intensity is independent of firm size. CDM (1998) also find that intensity of the firms engaging in R&D does not depend on their size. Market demand, measured in this paper by one dummy variable appears to have a positive effect on the R&D expenditures. Public subsidies dummy is positive and significant. Following Duguet (2003), we find no substitution effect between private R&D expenditures and subsidies. We find that R&D subsidies add to private R&D. Belong to a foreign group increases the R&D expenditures. We find a positive relationship between R&D investments and innovation. Firm size does not affect innovation output. Small firms have the same probability to innovate than large firms Different sources of knowledge such as cooperation agreements and analyze of competing products, competing patents, competing engineers publications raise the probability to innovate. Firms that concentrate their effort on acquiring external knowledge increase their probability to innovate. In order to do so, they have to integrate the innovation strategy in the whole organization. Looking at the patent stock, we find positive effect. Patent stock can be viewed as a knowledge stock. Innovative firms and large firms are more prone to invest more in training. This confirms the idea of Booth and Snower (1996) and Baldwin and Johnson (1996). The aim of training programs is to respond to the potential lack of competencies and abilities of employees. These programs are also a solution to the lack of skilled workers. Finally firms invest more in training when they adopt new equipment. Training permit to fit the employees’ skills to the innovation strategy. In order to produce a new product, personnel have to be informed and trained about it. Training permit to diffuse innovation in the whole firms and imply all employees. Employees are more prone to understand and to produce the considered innovative product. Using process innovation implies a specific training program that permit to personnel using it to be performing rapidly. Innovation requires companies to increase the skill of their employees in order to have a good implementation of the new technologies. Training expenditures increase the probability to obtain quality certification. This confirms our third relationship. In order to be quality certified, firms have to make an inspection of its working order. During this inspection, firms can realize that employees are not in "perfect" suitability to their quality objectives. In response, firms have to communicate and inform its employees on the certification procedure and can may to train them. We find a positive impact between worker quality (via the skill composition) and quality certification. Consumers’ tests have a positive effect on quality. This imply that firms' strategy have to be in line with customers' needs. Quality certification act as an information process for customers and suppliers. Skill and unskilled share have a positive effect on quality.
14 Also called extremum estimators.
8

Implication of employees seems to be an essential determinant of quality. This result agrees with Booth and Snower (1996), Abowd et al. (1996) and Gabszewicz (1998). In other words, when firms are more profitable, they are less prone to financial constraints. They have more equity capital and can consequently be more self-financed. They can engage one part of this profit in an innovation strategy. As a consequence, they can obtain more easily subsidies by banks and institutions. Then, financially speaking, R&D investments are less risky. So, they can invest more in R&D in order to reinforce its existing market share and to acquire new ones. Finally, these markets share permit to be more profitable. The circular scheme is then closed.This confirms the idea of reinvestment of earnings.
9
6 Conclusions This study was aimed at investigating the sensitivity of the estimated relationships between R&D investments, innovation, training investments, quality and firm performance simultaneously. The first novelty of our paper is in its first attempt to estimate the impact of training on quality in a R&D-innovation-profitability perspective. We use French data set and neglected information on training investments and quality. A five-equation system is specified and forms a circular scheme. In order to estimate consistently our model, we use appropriate econometric methods (ALS) which correct for simultaneity biases. The results are consistent with many stylized facts of the empirical literature and show that the feedback effects are important. The first link between R&D investment and innovation is established. Higher research budgets are associated with a higher probability to innovate. The second relationship is confirmed. In effect, technological innovation raises the training investments. Training permits to diffuse innovation in the whole firm. Employees are more prone to understand and to produce the considered innovative product. Innovation requires firms to increase the skill of their employees in order to have a good implementation of the new technologies. The third link between training expenditures and probability to have quality certification is verified. The fourth relationship is verified. Firm profitability is positively correlated with a higher quality. The controls are not significant: a large size does not affect R&D investments; worker quality and quality certification affect positively firms' profitability. Finally, the last relationship between profitability and R&D expenditures is significant and positive. These results are consistent with previous evidence. Separately, they testify the significance of innovation, training and quality in firms' profitability. This paper confirms the existence of a virtuous circle which links innovation to profitability via training and quality. It permits to take into account simultaneously the important role of training and quality in an innovation perspective. This study advocate for more empirical evidence that permit to highlights the role of training and quality.
10
Bibliography Abowd, J., F. Kramarz and A. Moreau (1996), "Product Quality and Worker Quality", Annales d'Economie et de Statistiques, Special Issue 41/42, January/June.
Aghion, P. and P. Howitt (1998), Endogenous Growth Theory, MIT Press.
Amemiya, T. (1985), Advanced Econometrics, Basil Blackwell.
Anderton, B. (1999), "Innovation, Product Quality, Variety, and Trade Performance : an Empirical Analysis of Germany and the UK", Oxford Economics Papers, 51, pp. 152-167.
Baldwin, J. and J. Johnson (1996), "Human Capital Development and Innovation : A Sectoral Policies Analysis" in P. Howitt (ed.), The implications of Knowledge-Based Growth for Micro-Economic, Calgary : Calgary University Press.
Ballot, G., F. Fakhfakh and E. Taymaz (2001), "Firm's Human Capital, R&D and Performance : A Study on French and Swedish Firms", Labour Economics, 8(4), pp. 443-462.
Ballot , G., G. Bresson, F. Fakhfakh and H. Hammoudi (2001), "Capital Humain, R&D, Formes de l'Innovation et Exportations", Rapport au Commissariat Général du Plan, Paris.
Black, S. and L. Lynch (1996), "Human Capital Investments and Productivity", American Economic Review, 86(2), pp. 263-267.
Booth, A. and D. Snower (1996), Acquiring Skills, Market Failures, Their Symptoms and Policy Responses, Cambridge University Press.
Charre, B.-T., G. Fazio and A. Grenard (1998), "Les Normes ISO 9000 et le Partenariat Industriel", Le 4 Pages, SESSI, No. 88, March.
Cohen, W. (1995), "Empirical Studies of Innovatives Activities", in Stoneman, P. (ed.), Handbook of the Economics of Innovation and Technological Change, Blackwell Publishers Ltd., Oxford.
Cohen, W. and R. Levin (1989), "Empirical Studies of Innovation and Market Structure", in Schmalansee, R. and R. Willig (eds.), Handbook of Industrial Organisation, Vol. II , pp.1060-1107, North Holland, Elsevier Science Publishers BV, Amsterdam.
Cohen, W. and S. Klepper (1996), "A Reprise of Size and R&D", Economic Journal, 106, pp. 925-951.
Crépon, B., E. Duguet and J. Mairesse (1998a), "Research and Development, Innovation and Productivity: An Econometric Analysis at the Firm Level", Economics of Innovation and New Technology, 7(2), pp. 115-158.
Crépon, B., E. Duguet and J. Mairesse (1998b), "Research, Innovation and Productivity: an Econometric Analysis at the Firm Level", NBER Working Paper, No. W6696, August.
DIGITP (2001), La Qualité dans l'Industrie Française : Conceptions et Stratégies, Editions de l'Industrie, Collection Etudes.
Dogson, M. and R. Rothwell (1994), The Handbook of Industrial Innovation, Edward Elgar, UK.
Duguet, E. and N. Greenan (1999): "Skilled Biased Technological Change at the Firm Level: Econometric Evidence from French Manufacturing", Les Cahiers de l'Innovation, cahier n° 99006, Université Paris I Panthéon-Sorbonne.
Duguet, E. and I. Kabla (1998), "Appropriation Strategy and the Motivations to Use the Patent System : An Econometric Analysis at the Firm Level", Annales d'Economie et de Statistiques, Numéro Special 49/50, Janvier/Juin 1998, pp. 289-328.
Encaoua, D., B. Hall, F. Laisney and J. Mairesse (2000), The Economics and Econometrics of Innovation, Kluwer Academic Publishers, Boston.
Foray, D. and J. Mairesse (1999), Innovations et Performances, Approches Interdisciplinaires, Edition de l'EHESS, Paris.
11
François, J.-P. (1998), Les Compétences pour Innover dans l'Industrie, Chiffres Clés Référence, SESSI.
François, J.-P. and F. Favre (1998), L'Innovation Technologique dans l'Industrie, Chiffres Clés Référence, SESSI.
Gouriéroux, C. and A. Monfort (1996), Statistics and Econometric Models, Cambridge University Press.
Gouriéroux, C., A. Monfort and A. Trognon (1996), "Moindres Carrés Asymptotiques", Annales de l'Insee, 58, pp. 91-122.
Griliches, Z. (1984), R&D, Patents and Productivity, NBER, Chicago: University of Chicago Press. Griliches, Z. (1995), "R&D and Productivity : Econometric Results and Measurement Issues", in P. Stoneman (ed.), Handbook of the Economics of Innovation and Technological Change, Blackwell Publishers Ltd., Oxford.
Grossman, G. and E. Helpman (1995), Innovation and Growth in the Global Economy, MIT Press.
Grupp, H. (1998), Foundations of the Economics of Innovation: Theory, Measurement and Practice, Edward Elgar Publishing Limited.
Hall, B. and J. Mairesse (1995), "Exploring the Relationship between R&D and Productivity in French Manufacturing Firms", Journal of Econometrics, 65(1), pp. 263-293.
Kleinknecht, A. and P. Mohnen (2001), Innovation and Firm Performance: Econometric Explorations of Survey Data, Palgrave Publishers Ltd.
Lehmann-Grube, U. (1997), "Strategic Choice of Quality when Quality is Costly: the Persistence of High-Quality Advantage", RAND Journal of Economics, 28(2), Summer, pp. 372-384.
Lee (1981), "Simultaneous Equations Models with Discrete and Censored Dependent Variables", in Manski, C. and D. Mc Fadden (eds.), Structural Analysis of Discrete Data with Econometric Applications, MIT Press, pp. 346-364.
Li, G. and S. Rajagopalan (1998), "Process Improvement, Quality, and Learning Effects", Management Science, 44(11), November, pp. 1517-1532.
Lynch, L. and S. Black (1998), "Beyond the Incidence of Employer-Provided Training", Industrial and Labor Relations Review, Vol. 52, No. 1, pp. 64-81.
Maddala, G. (1983), Limited-Dependent and Qualitative Variables in Econometrics, Cambridge University Press, Cambridge.
Mairesse, J. and P. Mohnen (1999), "Recherche-Développement, Externalités et Productivité : un Survol de la Littérature Econométrique", Les Cahiers de l'Innovation, CNRS, No. 99019, Université Paris I Panthéon-Sorbonne.
Mairesse, J. and M. Sassenou (1991), "R&D and Productivity: A Survey of Econometric Studies at the Firm Level", NBER Working Paper, No. W3666, March.
Milgrom, P. and J. Roberts (1990), "The Economics of Modern Manufacturing : Technology, Strategy, and Organization", American Economic Review, 80(3), pp. 511-528, June.
Mohnen, P. and L.-H. Röller, (2001), "Complementarities in Innovation Policy", Cahiers du CIRANO, No. 2001s-28, April.
OCDE (1997), Principes Directeurs Proposés par l'OCDE pour le Recueil et l'Interprétation des Données sur l'Innovation, Manuel d'Oslo, Paris.
Penrose, E. (1959), The Theory of the Growth of the Firm, Oxford Basil Blackwell.
Rosenberg, N. (1982), Inside the Black Box: Technology and Economics, Cambridge University Press.
Skrabec, Q., T. Ragu-Nathan, S. Subba Rao and B. Bhatt (1997), "Iso 9000: Do Benefits Outweigh the Costs ?", Industrial Management, Nov/Dec.
12

Stoneman, P. (1995), Handbook of the Economics of Innovation and Technological Change, Blackwell Publishers Ltd., Oxford.
Weil, M. (2001), Le Management de la Qualité, Collection Repères, La Découverte.
13
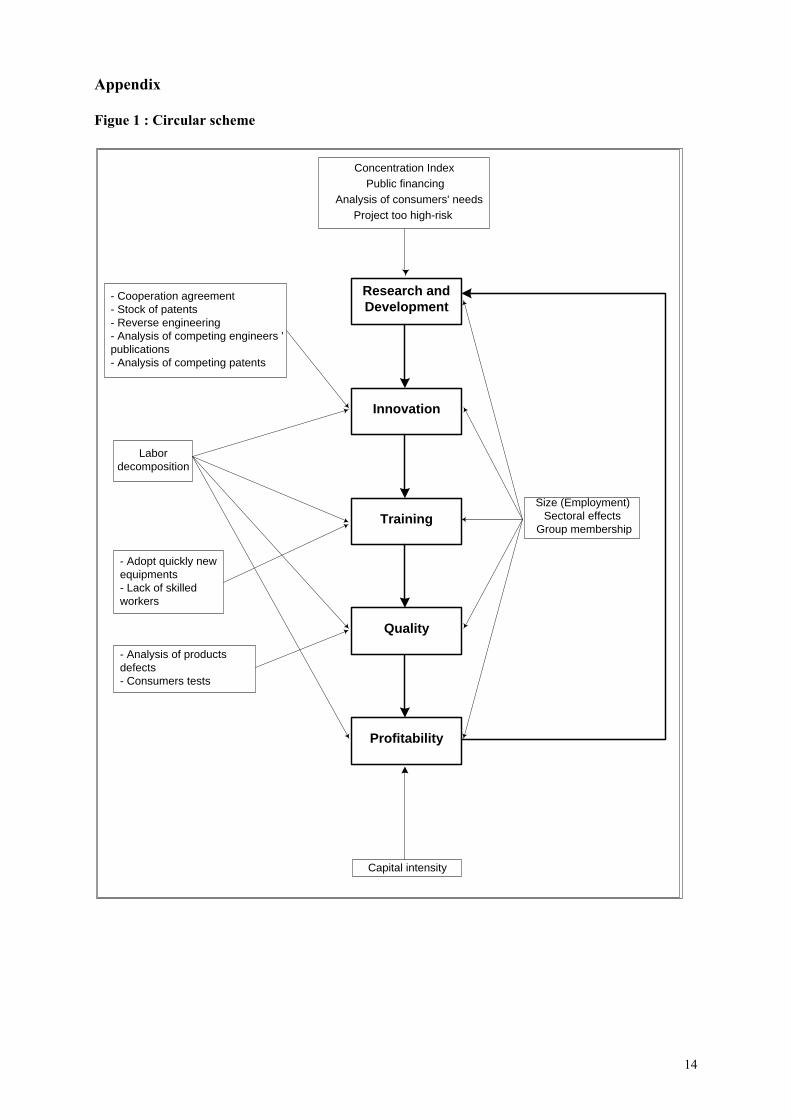
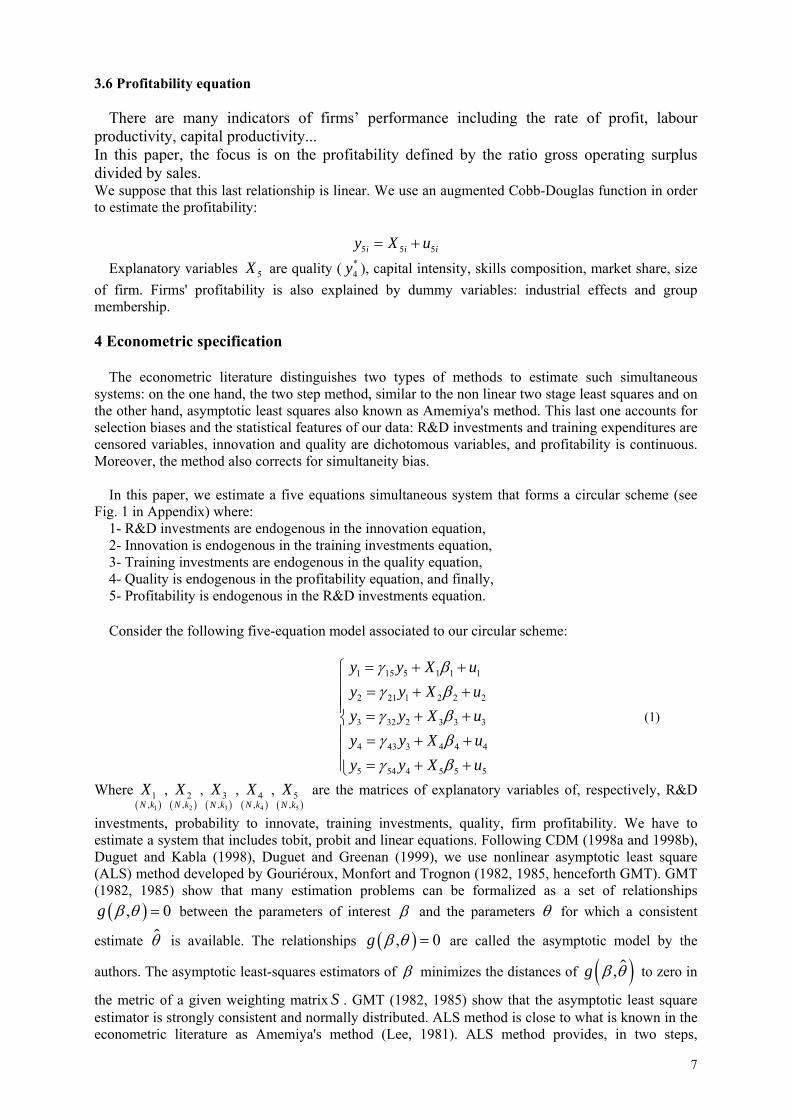
Appendix Figue 1 : Circular scheme
Research andDevelopment
Innovation
Training
Quality
Profitability
Capital intensity
Size (Employment)Sectoral effects
Group membership
Concentration Index
Analysis of consumers' needsPublic financing
- Cooperation agreement- Stock of patents- Reverse engineering- Analysis of competing engineers 'publications- Analysis of competing patents
Labordecomposition
- Adopt quickly newequipments- Lack of skilledworkers
- Analysis of productsdefects- Consumers tests
Project too high-risk
14
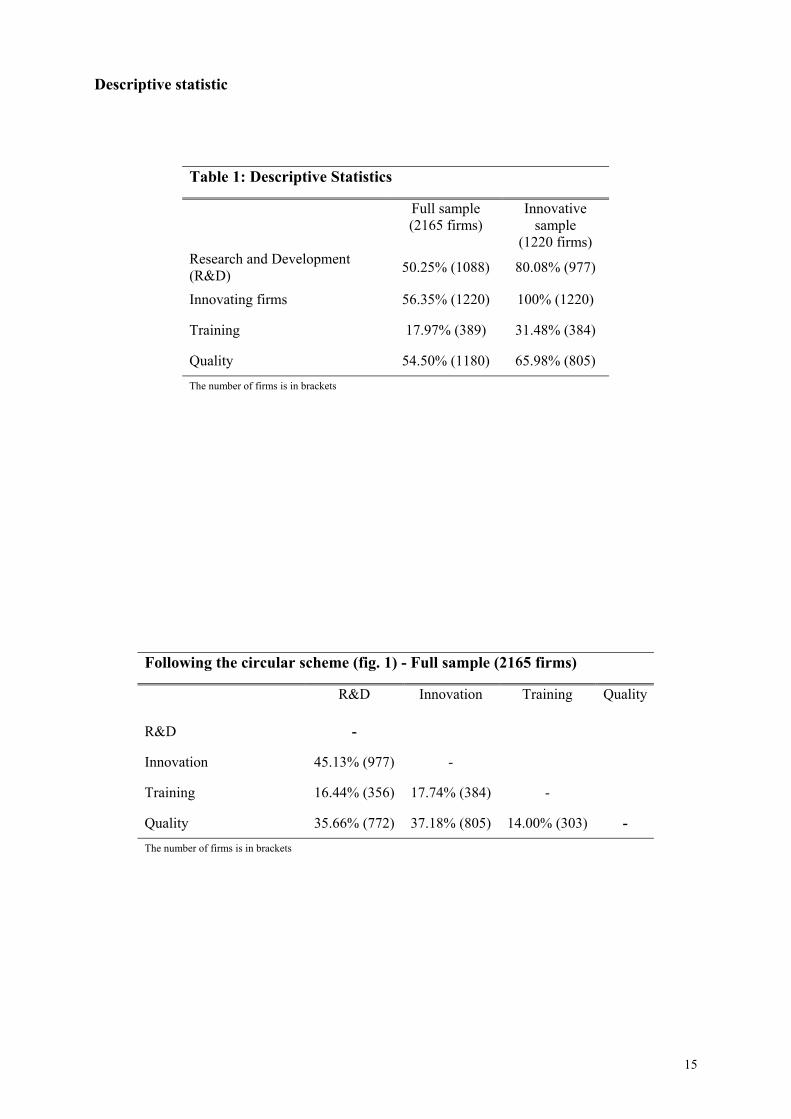
Descriptive statistic
Table 1: Descriptive Statistics
Full sample (2165 firms)
Innovative sample
(1220 firms) Research and Development (R&D) 50.25% (1088) 80.08% (977)
Innovating firms 56.35% (1220) 100% (1220)
Training 17.97% (389) 31.48% (384)
Quality 54.50% (1180) 65.98% (805) The number of firms is in brackets
Following the circular scheme (fig. 1) - Full sample (2165 firms)
R&D Innovation Training Quality
R&D -
Innovation 45.13% (977) -
Training 16.44% (356) 17.74% (384) -
Quality 35.66% (772) 37.18% (805) 14.00% (303) - The number of firms is in brackets
15
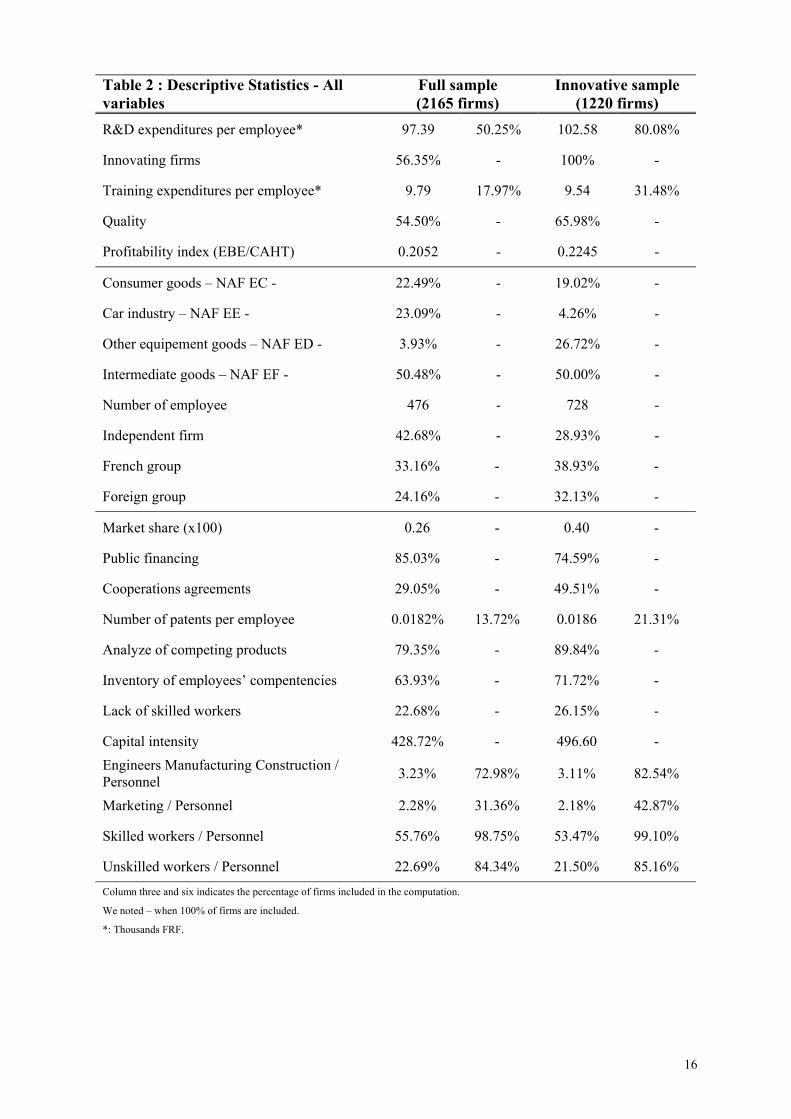
Table 2 : Descriptive Statistics - All variables
Full sample (2165 firms)
Innovative sample (1220 firms)
R&D expenditures per employee* 97.39 50.25% 102.58 80.08%
Innovating firms 56.35% - 100% -
Training expenditures per employee* 9.79 17.97% 9.54 31.48%
Quality 54.50% - 65.98% -
Profitability index (EBE/CAHT) 0.2052 - 0.2245 -
Consumer goods – NAF EC - 22.49% - 19.02% -
Car industry – NAF EE - 23.09% - 4.26% -
Other equipement goods – NAF ED - 3.93% - 26.72% -
Intermediate goods – NAF EF - 50.48% - 50.00% -
Number of employee 476 - 728 -
Independent firm 42.68% - 28.93% -
French group 33.16% - 38.93% -
Foreign group 24.16% - 32.13% -
Market share (x100) 0.26 - 0.40 -
Public financing 85.03% - 74.59% -
Cooperations agreements 29.05% - 49.51% -
Number of patents per employee 0.0182% 13.72% 0.0186 21.31%
Analyze of competing products 79.35% - 89.84% -
Inventory of employees’ compentencies 63.93% - 71.72% -
Lack of skilled workers 22.68% - 26.15% -
Capital intensity 428.72% - 496.60 - Engineers Manufacturing Construction / Personnel 3.23% 72.98% 3.11% 82.54%
Marketing / Personnel 2.28% 31.36% 2.18% 42.87%
Skilled workers / Personnel 55.76% 98.75% 53.47% 99.10%
Unskilled workers / Personnel 22.69% 84.34% 21.50% 85.16% Column three and six indicates the percentage of firms included in the computation. We noted – when 100% of firms are included. *: Thousands FRF.
16
Iso certification Iso is the word that represents the International Organization for Standardization (see Charre et al., 1998; DIGITIP, 2001 and Weil, 2001). It is the worldwide federation of national standards bodies for approximately 130 countries. The Iso 9000 standards, published the first time in 1987 and regularly revised (1994 and 2000) are produced with the aim of creating global standards of product and service quality. These sets of standards form a quality management system and are applicable to any organization regardless of product, service, organizational size, or whether it's a public or private company. Iso certification attests that firms have made an inspection and an inventory of fixtures, in writing, concerning the working order of the different entities (services, departments, and production units) and their appropriateness in comparison with theirs objectives. Iso covers all technical fields and is not limited to any particular discipline. It does not, however, cover electrical or electronic engineering which are the responsibility of the IEC. The responsibility for information technology is performed by a joint ISO/IEC technical committee. The firms' business can be certified against one of three quality systems: Iso 9001, Iso 9002 or Iso 9003. Iso 9001 sets out the requirements for an organization whose business processes range all the way from design and development, to production, installation and servicing. Iso 9002 is the appropriate standard for organizations that do not design and develop products, since it does not include the design control requirements of Iso 9001. Its requirements are identical aside from that distinction. Iso 9003 is the appropriate standard for an organization whose business processes do not include design control, process control, purchasing or servicing. It focuses on inspection and testing to ensure that final products and services meet specified requirements. To become Iso certified, a firm must develop a quality system that meets the requirements specified by one of the preceding three standards: Iso 9001, Iso 9002 or Iso 9003, depending on the business product or service. Once the quality system and practices has been documented, in a standard language, and implemented, the firm must invite an accredited external auditor15. This auditor track and manage evidence that these quality system and practices are instituted and evaluate the effectiveness of the system. If the auditor determines that the quality system meets all of Iso's requirements, they will certify the system. Firm can then announce to the world that the quality of the products/services is managed, controlled, and assured by a registered Iso 9000 quality systems for three years
15 In France, it is the AFAQ (Association Française pour l'Assurance de la Qualité), an independent organism of customers and suppliers.
17
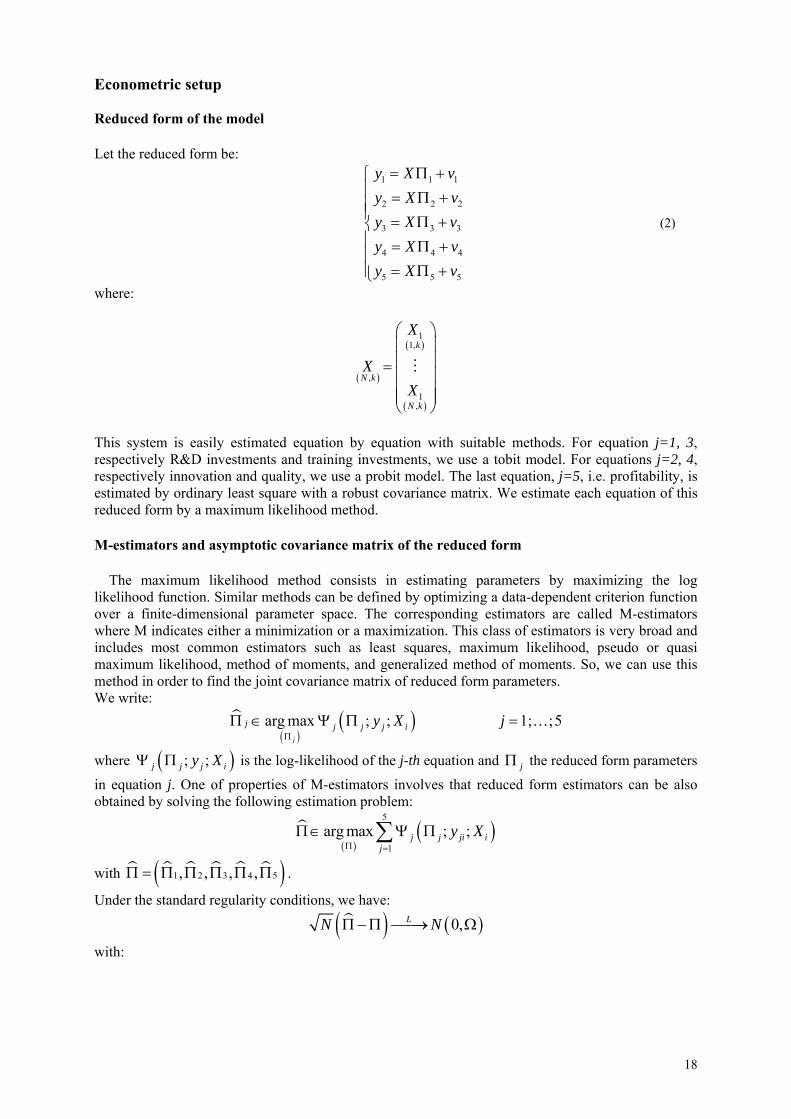
Econometric setup Reduced form of the model Let the reduced form be:
1 1
2 2
3 3
4 4
5 5
y X vy X vy X vy X vy X v
1
2
3
4
5
= Π +⎧⎪ = Π +⎪⎪ = Π +⎨⎪ = Π +⎪⎪ = Π +⎩
(2)
where:
( )
( )
( )
11,
,
1,
k
N k
N k
X
XX
⎛ ⎞⎜ ⎟⎜ ⎟=⎜ ⎟⎜ ⎟⎜ ⎟⎝ ⎠
This system is easily estimated equation by equation with suitable methods. For equation j=1, 3, respectively R&D investments and training investments, we use a tobit model. For equations j=2, 4, respectively innovation and quality, we use a probit model. The last equation, j=5, i.e. profitability, is estimated by ordinary least square with a robust covariance matrix. We estimate each equation of this reduced form by a maximum likelihood method. M-estimators and asymptotic covariance matrix of the reduced form The maximum likelihood method consists in estimating parameters by maximizing the log likelihood function. Similar methods can be defined by optimizing a data-dependent criterion function over a finite-dimensional parameter space. The corresponding estimators are called M-estimators where M indicates either a minimization or a maximization. This class of estimators is very broad and includes most common estimators such as least squares, maximum likelihood, pseudo or quasi maximum likelihood, method of moments, and generalized method of moments. So, we can use this method in order to find the joint covariance matrix of reduced form parameters. We write:
( )( )arg max ; ;
j
j j j j iy XΠ
Π ∈ Ψ Π 1; ;5j = …
where ( ; ; )j j j iy XΨ Π is the log-likelihood of the j-th equation and jΠ the reduced form parameters
in equation j. One of properties of M-estimators involves that reduced form estimators can be also obtained by solving the following estimation problem:
( )( )
5
1
arg max ; ;j j ji ij
y XΠ =
Π ∈ Ψ Π∑
with ( )1 2 3 4 5, , , ,Π = Π Π Π Π Π .
Under the standard regularity conditions, we have:
( ) ( )0,LN NΠ − Π ⎯⎯→ Ω
with:
18
( )
( ) ( )
1 1
2
, ,
, , , ,
J IJ
J E y X
I E y X y
− −
Τ
Τ
Ω =
⎡ ⎤∂ Ψ= − Π⎢ ⎥∂Π∂Τ⎣ ⎦
∂Ψ ∂Ψ⎡ ⎤= Π Π⎢ ⎥∂Π ∂Π⎣ ⎦X
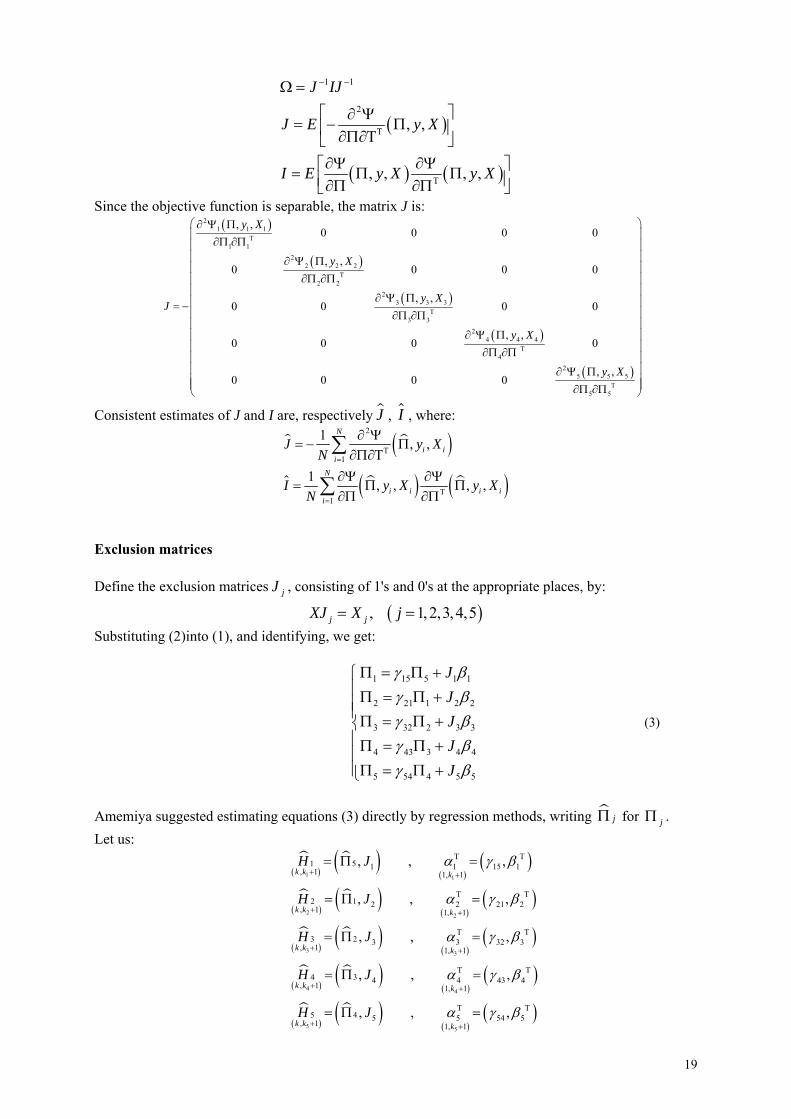
Since the objective function is separable, the matrix J is: ( )
( )
( )
( )
( )
21 1 1
1 12
2 2 2
2 22
3 3 3
3 32
4 4 4
42
5 5 5
5 5
, ,0 0 0 0
, ,0 0 0
, ,0 0 0 0
, ,0 0 0 0
, ,0 0 0 0
y X
y X
y XJ
y X
y X
Τ
Τ
Τ
Τ
Τ
⎛ ⎞∂ Ψ Π⎜ ⎟
∂Π ∂Π⎜ ⎟⎜ ⎟∂ Ψ Π⎜ ⎟
∂Π ∂Π⎜ ⎟⎜ ⎟
∂ Ψ Π⎜ ⎟= −⎜ ⎟∂Π ∂Π⎜ ⎟
∂ Ψ Π⎜ ⎟⎜ ⎟∂Π ∂Π⎜ ⎟⎜ ⎟∂ Ψ Π⎜ ⎟⎜ ⎟∂Π ∂Π⎝ ⎠
0
Consistent estimates of J and I are, respectively , J I , where:
( )
( ) ( )
2
1
1
1 , ,
1 , , , ,
N
i ii
N
i i i ii
J y XN
I y X y XN
Τ=
Τ=
∂ Ψ= − Π
∂Π∂Τ∂Ψ ∂Ψ
= Π Π∂Π ∂Π
∑
∑
Exclusion matrices Define the exclusion matrices jJ , consisting of 1's and 0's at the appropriate places, by:
( ), 1,2,3,4,5j jXJ X j= = Substituting (2)into (1), and identifying, we get:
1 15 5 1 1
2 21 1 2
3 32 2 3
4 43 3 4
5 54 4 5
JJJJJ
2
3
4
5
γ βγ βγ βγ βγ β
Π = Π +⎧⎪Π = Π +⎪⎪Π = Π +⎨⎪Π = Π +⎪⎪Π = Π +⎩
(3)
Amemiya suggested estimating equations (3) directly by regression methods, writing jΠ for jΠ . Let us:
( )( )
( )( )
( )( )
( )( )
( )( )
( )( )
( ) ( )( )
( )
( )( )
( )( )
1 1
2 2
3 3
4 4
5 5
1 5 1 1 15, 1 1, 1
2 1 2 2 21, 1 1, 1
3 2 3 3 32, 1 1, 1
4 3 4 4 43, 1 1, 1
5 4 5 5 54, 1 1, 1
, , ,
, , ,
, , ,
, , ,
, , ,
k k k
k k k
k k k
k k k
k k k
H J
H J
H J
H J
H J
α γ β
α γ β
1
2
3
4
5
α γ β
α γ β
α γ β
Τ Τ
+ +
Τ Τ
+ +
Τ Τ
+ +
Τ Τ
+ +
Τ Τ
+ +
= Π =
= Π =
= Π =
= Π =
= Π =
19

and
( ) ( )( )
5
11, ,5j mj j jm m
m j
jη γ≠ =
= Π − Π − Π − Π =∑ …
We obtain:
1 1 1 1
2 2 2 2
3 3 3 3
4 4 4 4
5 5 5 5
H
H
H
H
H
α η
α η
α η
α η
α η
⎧Π = +⎪⎪Π = +⎪⎪Π = +⎨⎪
Π = +⎪⎪Π = +⎪⎩
With matricial notations, we have: ( ),Π Hα η η α Πwith g= + = (4)
At this point, we can use the ALS method in order to estimate the parameters of the structural form. In this method, the true value of parameters, (α and Π), are assumed to be linked via a system of implicit functions:
( ), 0g =α Π
The idea is to use the estimators, , of reduced form parameters, Π, obtained in the first step and
calculate in a second step, one estimator
Πα of α such as ( ),g α Π is as close to zero as possible. So we
have to solve the following program:
( ) ( )1arg min , ,g gα
Τ−= Ψα α Π α Π
where Ψ is a metric. The optimal value of Ψ is:
( ) ( ) (, ,α Π α Π α ΠΠ Πasympt
g gVar gΤ
Τ
∂ ∂⎡ ⎤Ψ = = Ω⎣ ⎦ ∂ ∂ ), (5)
Because we need α to obtain the optimal metric, we use in a first step an Euclidian metric (Ψ=I). So, we have:
( ) ( )arg min , ,g gα
Τ=α α Π α Π
which is the Ordinary Least Square applied to (4). So the first step estimators are:
( ) 1−Τ Τ=α H H H Π
Its asymptotic distribution is:
( ) ( )α α 0,dN N− ⎯⎯→ Σ
where:
( )( )
( )
1 1
15
21
32 ,5 ,5
43
54
1 0 0 01 0 0 0
, 0 1 0 00 0 1 00 0 0 1
k kk k
g g g g g g g g
g I
γγ
γγ
γ
− −Τ Τ Τ Τ
Τ Τ Τ
Τ
⎛ ⎞ ⎛ ⎞ ⎛ ⎞∂ ∂ ∂ ∂ ∂ ∂ ∂ ∂Σ = Ω⎜ ⎟ ⎜ ⎟ ⎜ ⎟∂ ∂ ∂ ∂ ∂ ∂ ∂ ∂⎝ ⎠ ⎝ ⎠ ⎝ ⎠
−⎛ ⎞⎜ ⎟−⎜ ⎟∂ ⎜ ⎟= − ⊗
∂ ⎜ ⎟−⎜ ⎟
⎜ ⎟−⎝ ⎠
α α α Π Π α α α
α ΠΠ
Τ
and
20

( )
( )
( )
( )
( )
( )
1
2
3
5
1 4
5
1, 1
2, 1
3, 1
5 , 5 4, 1
5, 1
0 0 0 0
0 0 0 0
0 0 0 0,
0 0 0 0
0 0 0 0
α Πα
jj
k k
k k
k k
k kk k
k k
H
H
g H
H
H=
+
+
Τ +
⎛ ⎞⎜ ⎟+⎜ ⎟
+⎝ ⎠
+
−⎛ ⎞⎜ ⎟⎜ ⎟−⎜ ⎟⎜ ⎟∂ −⎜ ⎟=
∂ ⎜ ⎟⎜ ⎟−∑ ⎜ ⎟⎜ ⎟−⎜ ⎟⎜ ⎟⎝ ⎠
Substituting α, Π and Ω by their consistent estimators , and α Π Ω , we obtain the covariance matrix of structural form coefficients. In a second step, we calculate the optimal metric defined by*******. The ALS estimator of structural form is:
( ) ( )1arg min , ,g g
α
Τ −= Ψα α Π α Π
which is the GLS applied to (5):
( ) 11 1−Τ − Τ −= Ψ Ψα H H H Π
Its asymptotic distribution is:
( ) ( )*α α 0,dN N− ⎯⎯→ Σ
where:
( ) ( )1
1* , ,g g−Τ −
Τ
⎡ ⎤∂ ∂Σ = Ψ⎢ ⎥∂ ∂⎣ ⎦
α Π α Πα α
21
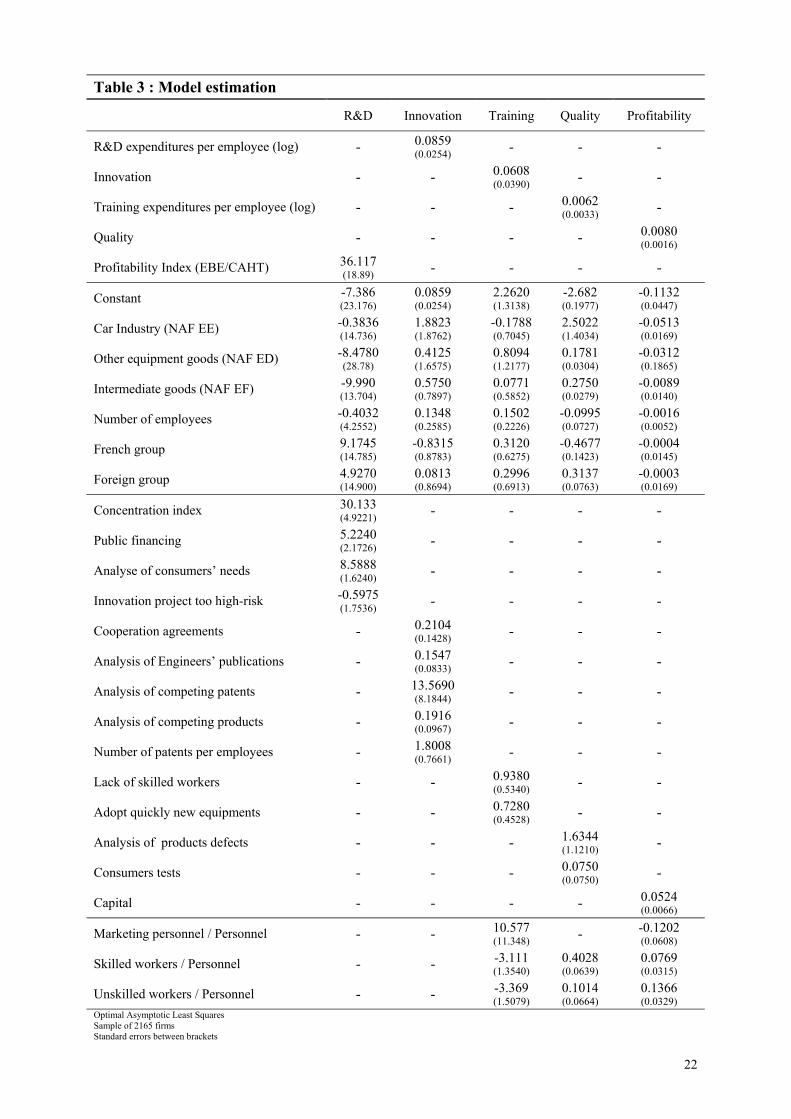
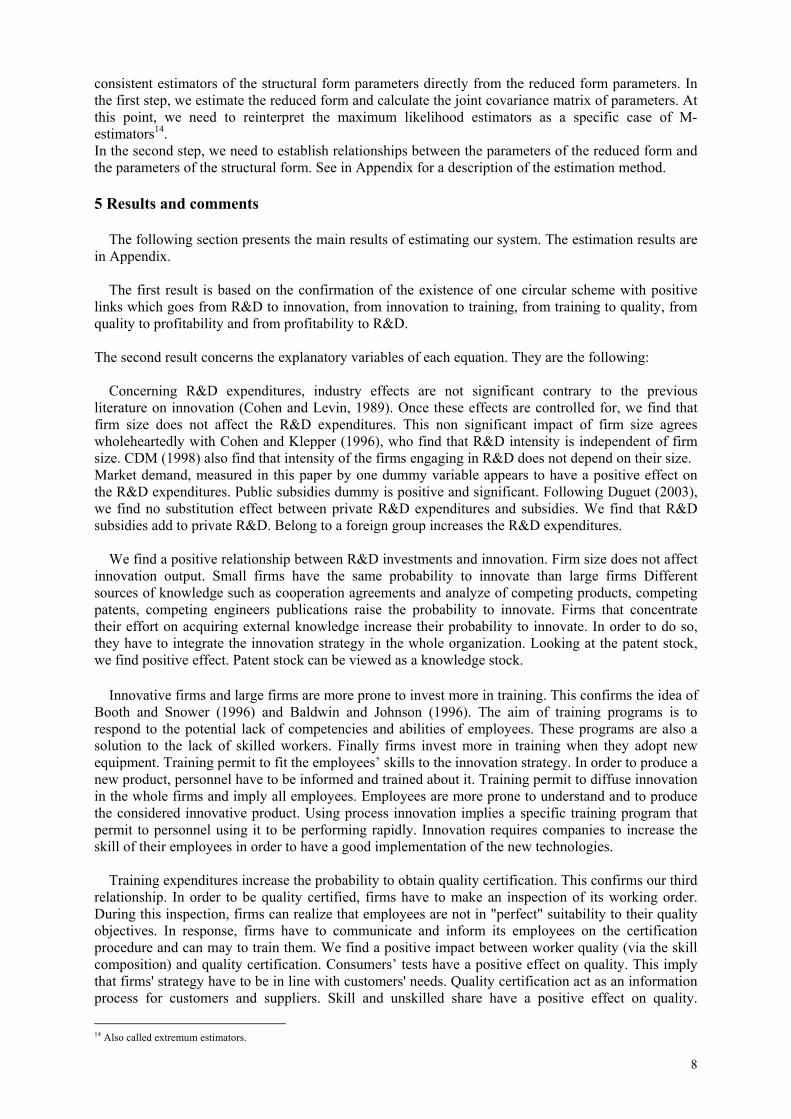
Table 3 : Model estimation
R&D Innovation Training Quality Profitability
R&D expenditures per employee (log) - 0.0859 (0.0254) - - -
Innovation - - 0.0608 (0.0390) - -
Training expenditures per employee (log) - - - 0.0062 (0.0033) -
Quality - - - - 0.0080 (0.0016)
Profitability Index (EBE/CAHT) 36.117 (18.89) - - - -
Constant -7.386 (23.176)
0.0859 (0.0254)
2.2620 (1.3138)
-2.682 (0.1977)
-0.1132 (0.0447)
Car Industry (NAF EE) -0.3836 (14.736)
1.8823 (1.8762)
-0.1788 (0.7045)
2.5022 (1.4034)
-0.0513 (0.0169)
Other equipment goods (NAF ED) -8.4780 (28.78)
0.4125 (1.6575)
0.8094 (1.2177)
0.1781 (0.0304)
-0.0312 (0.1865)
Intermediate goods (NAF EF) -9.990 (13.704)
0.5750 (0.7897)
0.0771 (0.5852)
0.2750 (0.0279)
-0.0089 (0.0140)
Number of employees -0.4032 (4.2552)
0.1348 (0.2585)
0.1502 (0.2226)
-0.0995 (0.0727)
-0.0016 (0.0052)
French group 9.1745 (14.785)
-0.8315 (0.8783)
0.3120 (0.6275)
-0.4677 (0.1423)
-0.0004 (0.0145)
Foreign group 4.9270 (14.900)
0.0813 (0.8694)
0.2996 (0.6913)
0.3137 (0.0763)
-0.0003 (0.0169)
Concentration index 30.133 (4.9221) - - - -
Public financing 5.2240 (2.1726) - - - -
Analyse of consumers’ needs 8.5888 (1.6240) - - - -
Innovation project too high-risk -0.5975 (1.7536) - - - -
Cooperation agreements - 0.2104 (0.1428) - - -
Analysis of Engineers’ publications - 0.1547 (0.0833) - - -
Analysis of competing patents - 13.5690 (8.1844) - - -
Analysis of competing products - 0.1916 (0.0967) - - -
Number of patents per employees - 1.8008 (0.7661) - - -
Lack of skilled workers - - 0.9380 (0.5340) - -
Adopt quickly new equipments - - 0.7280 (0.4528) - -
Analysis of products defects - - - 1.6344 (1.1210) -
Consumers tests - - - 0.0750 (0.0750) -
Capital - - - - 0.0524 (0.0066)
Marketing personnel / Personnel - - 10.577 (11.348) - -0.1202
(0.0608)
Skilled workers / Personnel - - -3.111 (1.3540)
0.4028 (0.0639)
0.0769 (0.0315)
Unskilled workers / Personnel - - -3.369 (1.5079)
0.1014 (0.0664)
0.1366 (0.0329)
Optimal Asymptotic Least Squares Sample of 2165 firms Standard errors between brackets
22

23
Copyright © 2022 FDOKUMEN