Econometric Models of Armed Forces Enlistment Levels - DTIC
160
U.S. OEPARTMENT OF COMMERCE NatiOMl Ttchnicil iHformtiM Smict AD-A031 596 Econometric Models of Armed Forces Enlistment Levels General Research Corp Mclean Vo Operations Analysis Div Oct 76
-
Upload
khangminh22 -
Category
Documents
-
view
0 -
download
0
Transcript of Econometric Models of Armed Forces Enlistment Levels - DTIC

U.S. OEPARTMENT OF COMMERCE NatiOMl Ttchnicil iHformtiM Smict
AD-A031 596
Econometric Models of Armed
Forces Enlistment Levels
General Research Corp Mclean Vo Operations Analysis Div
Oct 76

Best Available
Copy

J
to
CO
313118
neponfc OAD-CR 160
Econometric Models of
Armed Forces Enlistment Levels
by
Dorothy M. Amey Alan E. Fechter Daniel F. Huck Kenneth D. Midlam
Prepared for:
Department of the Navy Office of Naval Research
Contract No. N0014 75 C 0975
October 1976
UOSSSTD D
I
GENERA RESEARCH \u CORPORATION
WESTCATE RESEARCH PARK, McLEAN, VIRGINIA 22101
KPtoouao rr NATIONAL TECHNICAL
INFORMATION SERVICE U. S. DEPARTMENT OF COMMERtt
SPtlNfif IEL0. VA. 22161
DISTRIBUTION ST.
Approved ic: publi DistTituiio/. »;. :

This report was prepared under the Navy Manpower R&D Program for the Office of Nava! Research under Contract No. N0014-75-C-0975. Reproduct on in whole or in part is per- mitted for any purpose of the U. S. Government.

SECURITV CLASSIFICATION OF THIS PACE (Wttti Dmim Enltrtd)
t
1 I
I g "
•
1
REPORT DOCUMENTATION PAGE 2. GOVT ACCESSION NO
4. TITLE (mtd Sublill»)
iconometric Models of Armed Forces inlistment Levels
7 AUTHOR porothy M. Amey Alan E. Fechter Daniel F. Huck Kenneth D. Midlam
* FCHFOMMINC OnCANIZATION NAME AND ADDRESS
General Research Corp. McLean, Virginia
II. CONTROLLING OFFICE NAME AND AOORESS
ONR, Dept. of Navy, Arlington, Va. 22217
U MONITORING AGENCY NAME * AOORESVlf dilUrmil Irom Conlrolllnt Ollict)
READ INSTRUCTIONS BEFORE COMPLETING FORM
1. RECIPIENT-S CATALOG NUMBER
S. TYRE OF REPORT / PERIOD COVERED
Final May LäZSalulA! lQ7fi
* PERFORMING ORC REPORT NUMBER
I. CONTRACT OR GRAN7 NUMBERfU
N00014-75-C-0975
10 PROGRAM ELEMENT. PROJECT. TASK AREA A «ORK UNIT NUMBERS
IJ. REPORT DATE
October 1976 II. NUMBER OF PASES
is. SECURITY CLASS, (OI m-» «ponj
Uncl.
ISa. OECLASSlFICATION DOONCRADlNG SCHEOU' E
I«. DISTRIBUTION STATEMENT fol Iflr. Rtparll
Distribution and reprodiK^tion is permitted for any purpose of the U.S. Government DISTRIBUTION 'TViTr
Approved fc: pull;c i~ Distribution U.u.n.., .-J
<? DISTRIBUTION STATEMENT (»I lh» mbtlrmtl tntmnd In Block 30. il dillmrfil Irom Ripen)
Distribution Unlimited.
II SUPPLEMENTARY NOTES
If. KEY 0ORDS fContmum on r«r«r«« »id* tl nmc9*»mrY and idmntlly bv block numbor)
Recruiting, nonlinear regression, time series analysis, Army enlistments. Navy enlistments, econometric models, cross-sectional analysis
20 *fSTRACT fContmu» «l rmwtmm $idm it n«c*ta«rr and identity by block nutnbmt)
This study has had two primary objectives. First, to conduct a detailed review of the major, past, time-series analyses which
covered the 1958-1965 time frame, attempting to discern differences among them in methodology, time intervals, and in the data used. This review was followed by an attempt to reconcile some of these differ- ences and to reproduce these analyses using a common data base and a more nearly standardized set of variable specifications. (over)
OD | J«N"J 1473 EDITION OF I NOV «5 IS OBSOLETE
d Reproduced from best available copy.
SICURlTY CLASSIFICATION OF THIS PAGE 'Whon Dbim Enltfd)
PRICES SüBJtCl TO CHANGE

■•;
secjBlTv CLASSIFICATION OF THIS PAOErKTian Ott* Enlmn4)
The second objective was to attempt a pooled, time series cross-sectional analysis of enlistments. This was accomplished for certain preferred enlistment groups for the Army and Navy using nine census regions and five yearly time intervals (1970-1974). The results of this model were to be compared to prior modeling efforts.
Finally, the significance of these studies was reviewed in the context of the enlistment environment of the mid-1970's and forward into the 1980's.
SCCuKITY CLASSIFICATION OF -».IS "AG€'»''i•" Daf Snttrtd)

t ■
i
CONTENTS
CHAPTER PAGE
SUMMARY 1
I INTRODUCTION 13
II REVIEW OF LITERATURE: SOME METHODOLOGICAL ISSUES 15
The Theory of Enlistment Supply 15
Specification of an Estimating Equation 21
Methods of Estimating Variables 23
Simultaneous Equations Bias 31
III REVIEW OF LITERATURE: SUMMARY OF FINDINGS 37
Time Series Studies 40
Cross Section Studies 49
IV RECONCILIATION OF THE FINDINGS OF THE FISHER AND KLOTZ STUDIES 59
The Fisher Study 59
The Klotz Study 95
V POOLED TIME-SERIES CROSS-SECTIONAL ANALYSIS 105
Purpose and Scope of the Analysis 105
Methodology 107
Results of Army Regressions 109
Results for Navy Enlistments 115
Summary of Findings 118
APPENDICES
A. Analysis of Fisher's Method of Estimating W and W 123
Bt Comparison of Fisher Data Base with Common Data Base 127
C. Descriptions of Variables Used in the Pooled Time-Series Cross-Sectional Model Regressions 136
D. Determination of True Volunteers and Mental Category Groups 149
E. Geographic Regions 150
iii

TABLES PAGE
SI. Marginal Cost Per Enlistment, Mental Group I-III, High School Graduate 10
1. Summary of Enlistment Studies 38
2. Summary of Time-Series Findings: Elasticitias with Respect to Expected Pecuniary Returns to Enlisting 42
3. Summary of Effects of Klotz Modifications 44
4. Comparison of Military Pay Variation 49
5. Summary of Cross-Section Findings: Elasticities with Respect to Expected Pecuniary Returns to Enlisting 51
6. Comparison of Altman and Gray Estimates of Relative Pay Elasticity 53
7. Comparison of Estimated Enlistment Supplv Parameters Derived Using Original Fishe:. Data Base 62
8. Comparison of Elasticities with Respect to W /W and (1-U) with and without Draft and
of the Proportion of Enlistees in Mental Groups 1-3 Who Were Draft-Motivated 63
9. Summary of Results of Alternative Model Assumptions on Parameters of Fisher's DOD Enlistment Supply Model 67
10. Effects of Dropping 1957 and Using Alternative Functional Form on the Estimated Parameters of the Fisher Model 71
11. Comparison of Results from Fisher Ett:l&«ting Equation, Using Alternative Data Bases, Original Fisher Data, vs New Data from Common Data Base 76
12. Summary of Estimates of Impact of Viet Nam War on Enlistment Behavior 78
13. Estimates of Relative Pay Elasticities Derived from Fisher Enlistment Model 80
14. Estimates of Absolute Pay Elasticities Derived from Fisher Enlistment Model 83
15. Estimates of Employment Rate Elasticities Derived from Fisher Enlistment Model 86
16. Estimates of the Proportion of Enlistees Who Are Draft-Motivated Derived from the Fisher Enlistment Model 87
iv

TABLES PAGE
I
1
i
f
17. Effects of Using (1-A/P) as a Measure of Draft Pressure on Estimates of Proportion of Enlistees Who Are Draft-Motivated
18. Effects of Using Real W on Relative
Pay Elasticities for Alternative Measures of Draft Pressure and Alternative Assumptions About a Viet Nam Effect
19. Comparison of Estimated Enlistment Supply Parameters Reported by Fisher and Klotz
20. Comparison of Enlistment Supply Parameters Derived from Klotz Model Using Original Data Base and Alternative Sample Periods
21. Comparison of Enlistment Supply Elasticities With and Without a Draft and Proportion of Enlistees in Mental Groups 1-3 Who Were Draft-Motivated Derived from Klotz Model Using Original Data Base and Alternative Sample Periods
22. Army Enlistment Supply Parameter Estimates Regression Model Ml
23. Army Enlistment Supply Parameter Estimates Regression Model Ml-R
24. Army Enlistment Supply Parameter Estimates Regression Model M2
25. Army Enlistment Supply Parameter Estimates Regression Model M2-R
26. Regressions for Army Category 1-2 High School Graduates Regional Variation
27. Navy Enlistment Supply Parameter Estimates Regression Model Ml
28. Navy Enlistment Supply Parameter Estimates Regression Model Ml-R
29. Navy Enlistment Supply Parameter Estimates Regression Model M2
30. Navy Enlistment Supply Parameter Estimates Regression Model M2-R
31. Regression Results for Navy Category 1-2 High School Graduates Regional Variation
91
9A
97
99
101
110
110
111
111
114
116
116
117
117
119

TABLES (Appendices) PAGE
Al. Estimates of W Derived from CPR and
Reported by Fisher 124
A2. Estimates of Ww Reported by Fisher 126 rl
Bl. Comparison of DOD Enlistments and Accessions, Mental Groups 1-3 128
B2. Comparison of Estimates of the 17-20 Year Old Male Civilian Noninstitutional Population 130
B3. Comparison of Estimates of the 18-19 Year Old Male Unemployment Rates 131
BA. Comparison of Estimates of W 133
B5. Comparison of Estimates of W^., 1958-1965,
Fisher vs Common Data Base 135
vi

0
I
i I
4
I f. i: i: r.
1
i. i.
EXECUTIVE SUMMARY
by
Daniel F. Buck and Kenneth D. Midlam
BACKGROUND
In recent years several studies have been undertaken to estimate the
relationships between certain key economic and policy variables and the
supply of enlistees to the armed forces. The Impetus for most of the early
studies came from the need to determine the feasibility of an all-volunteer
force and the subsequent need to know cost-effective ways to obtain the
enlistment levels necessary to sustain such an all-volunteer force.
Of primary Interest In these studies were the effects on the voluntary
enlistment supply of the following variables:
e Compensation - expressed either In absolute terns for
civilian pay and military pay (including in kind as well
as subsistence and quarters allowances), or as the ratio
of military to civilian pay for the age groups which
constitute the apparent preferred supply groups,
e Unemployment Rate - usually estimated specifically for
the 17-21 year old age group either by conversion from
overall unemployment rates or by direct measurement.
Occasionally the overall unemployment rate is used,
e Draft Pressure - expressed as the fraction of enlistees
motivated to enlist by an apparent likelihood of being
drafted. This had been estimated or scaled in various
ways by the several studies.

.
• Recruit In«; Resources - usually measured In terns of Che
number of active duty recruiters.
Though'these definitions appear reasonably consistent here, a major
potential source of variation In the results of past studies has been the
different ways these variables have actually been measured or estimated.
The kinds of analyses that have been attempted fall Into two groups —
time-series and cross-sectional. Typically, the time-series analyses
have measured variables at the gross, national level over time. The time
Intervals have usually been quarterly, though some recent studies have
used monthly data. The cross-sectional studies have measured the variables
over a single,fixed time Interval for various geographic breakdowns
(usually,census regions; sometimes, states)«
OBJECTIVES OF THIS STUDY
This study has had two primary objectives. First, to conduct a
detailed review of the major, past, time-series analyses which covered the
1958-1965 time frame, attempting to discern differences among them In
methodology, time Intervals, and In the data used. This review was
followed by an attempt to reconcile some of these differences and to
reproduce these analyses using a common data base and a more nearly
standardized set of variable specifications.
The second objective was to attempt a pooled,time series cross-
sectional analysis of enlistments. This was accomplished for certain
preferred enlistment groups for the Army and Navy using nine census
regions and five yearly time Intervals (1970-1974). The results of this
model were to be compared to prior modeling efforts.
mm ... . .

.. iwwwww——
0 0
r. i.
i [
Finally, the significance of these studies was reviewed in the context
of the enlistment environment of the mld-1970's and forward Into the 1980's.
REVIEW OF PREVIOUS TIME-SERIES STUDIES
Many of the studies reviewed were done as part of feasibility studies
on moving to an all-volunteer force. Particular attention In this review
1 2 3 was given to the analyses of A. C. Fisher, A. E. Fechter, B. J. Klotz, A
and D. W. Grlssmer, et al. The first three studies attempted time series
analyses on quarterly data covering time Intervals from 1958 to 1965
(basically prior to the major Vietnam build-up). In general, each used
enlistments as a fraction of the Qualified Military Avallables (QMAs) as
a dependent variable and used various functional formulations of compensa-
tion, unemployment and draft pressure as independent variables. Fisher and
Klotz dealt with total DOD enlistments; Fechter, with Army enlistments. All
used Mental Group I-III enlistees without further disaggregatlon by such
factors as race and education. The fourth study analyzed all four services
and broke enlistments down further by education. That study covered 1971-1973.
The results of the various studies have yielded a wide variety of
[ estimates of the relationships between these factors and the supply of
enlistees. Generally speaking, they have found a statistically signifi-
{ , cant relationship between levels of relative compensation and enlistment
levels and a large but statistically doubtful relationship between unem-
ployment and the enlistment supply. Those studies which included recruit-
ing variables found large, significant relationships between recruiting
levels and enlistment supply. Estimates of the fraction of enlistees
draft-Induced ranged from 15-40% in the early 1960*8.

.
Because of the gross level of aggregation of enllstaents over
groups, education levels and services« the first three studies, chough
iaportant to the development of econoaetric analyses of enlistment behavior,
are not nearly as relevant under the current (1976) enlistment environment.
Better, more disaggregated data on more recent enlistments has led to the
clear conclusion (Grissmer and other recent studies) that both pay and
unemployment effects are Inversely related to the quality level of the
enlistee, i.e., the preferred enlistment grou^ (Mental Group I-III, high
school graduates) is the least responsive to dianges in relative militaiy
pay and to civilian employment opportunities. Also, this preferred group
appears more responsive to the activities of recruiters in the field and
to the availability of program options.
Based on the Grissmer analyses, the relative pay (ratio of military
to civilian compensation) elasticity for Army Mental Group I-III high school
graduates is about .6, and for the Navy, about .45. The elasticity is
defined as the rate of change In a dependent variable in response to a
change in ap independent variable. As an example, an elasticity of .45
fot relative pay with respect to Navy enlistments means that a 10 percent
increase in relative pay should result in a 4.5 percent increase In Navy
Mental Group I-III diploma enlistments. The employment rate elasticity
for the Army is estimated to be about 3.7 (about .5 for unemployment). Ho
significant unemployment relationship could be established for Navy enlist-
ments.
REVIEW OF PREVIOUS CROSS-SECTIONAL STUDIES
Three major cross-sectional studies are reviewed here. * * These
studies were all based on limited data from the early 1970's. As with

!D ■
tlM tlae-aerles studies > serious Inadequsdes are «ppsrsat la those studies
«falch did not dissggregste soilstasats on edocstlon sod eentsl quality. In
general, they report elsstielties for pay snd seployeent which, for the
gross aggregations of enlistnsnts, era larger than found la lef 4 using
only Mental Group I-III, high school graduates. This latter cross-sectional
study, using 1973 data, eatlaates elasticities for relative pay and uaea
ployaent of .68 snd .70, respectively, for the Aray's preferred enllstasnt
group. As with all the tlac-series studies reviewed, statistical slgaifi-
csnee was alaost always stronger for relative pay than for the unsaployaent
variable.
RESULTS OF POOLED TDffi-SERIES/CFDSS-SECTIOHAL ANALYSIS
A pooled tlas series, cross-sectional analysis wss conducted by GRC to
atteapt to capitalize on the best festures of the separate sralyses described
earlier. By coabioing the tlae-serles snd the cross-sectional data, a sig-
nificant Increase in observations wss obtained. This frequently yielded
sn increase in variability in soas of the Independent variables which aay
have been quite "flat" in a tlae-serles or single cross-sectional sst of •
observations. In this study, data were obtained on an annual basis for
1970-1974 enlistasnts, QMAs, civilisn pay, youth unsaployaent, recruiting,
paid advertising sad the black proportion of the MA for each of the nine
census regions for Any snd Navy enlistees la the preferred quality groups.
The results of these saalyses differ strikingly froa those discussed
earlier. In no case was a statistically significant relative pay or eaploy-
aent effect obtained. In the Aray saalysis only two factors are statistically
sigaificsat — regional differences snd recruiters per QUA. In other words,
reglonel variations In either propensity to enlist or In disqualification

■
rates «re auch «ore significant than variation in pay or tmaaployacnt rates
in Measuring enlistment ratea for these quality groups. Estimates of the
recruiter elasticity range fro« .1 to ■' for Mental Group I-III high school
graduates. Pay elasticities, though never statistically significant, range
fro» .10 to .18. Uncaployaent elasticities were usually in the wrong
direction, but not statistically significant.
In the analysis of Navy enlistments, the only :statistically significant
factor was recruiters per QMA, with elasticities ii. the range of .60 - 1.0
for the preferred enlistment groups. Relative pay and uneaployeent effects
were consistently in the wrong direction and not significant. Regional
differences were relatively minor.
SUMMARY OF FINDINGS
« Based on the previous studies reviewed, incr.*ases in the level of
■ilitary pay should cause some positive response in the Army and Navy's
supply of preferred enlistees. This response most probably has an elas-
ticity less than .5. The pooled time-series/cross-sectional model did not
find any statistically supportable relationship between pay and enlistment
rates as defined in this study for either Army or Navy. The appearance
of the recruiter variables in supply sodels has the effect of significantly
lessening the Impact of relative pay seaaurements from those obtained in
other models which excluded the recruiting and advertising variables. It
seeas probable that the pay and recruiting programs are supportive rather
than simply additive; increases in the recruiting program have effects which
are aaplified by an improved ailitary compensation systea.
« The increases in recruiter levels and distribution in recent years
appear to have had a significant impact on the level of enlistees. The

obMrrad MMur—nf do not, however, preclud« tbm posslbllltj of m direct
tracking of th« «nllstaont supply by th« services. That is, it reaelns to
be detemlned how anch this is s reflection of continuing iaproveatnts In
the geogrsphlcel sssignaent of recruiters, or how auch of this is due to the
ability of recruiters to foster s aore favorable general propensity to enlist.
e Few of the studies discussed in this report were able to dcaonstrate
any statistically significant relationship between uneapioyaent levels sad
enllstasnt rates. The aost reliable estiaates show the higher quality en-
listee groups being responsive to changes in eaployaent levels; but these
estiaates are not always obtained froa stable paraaeters. Since it is
generally assuaed that there aust be soas relationship, it aust be concluded
that the specification of the uneapioyaent variables has been inadequate.
Several difficulties with aeasuring uneapioyaent effects have been discussed
by the various authors. A basic problea is siaply that observed uneapioyaent
rates aay be poor estlaators of an individual's perceived attractiveness of
his short-term, future, civilian eaployaent opportunities. A second problea
arises in aeasuring the effects of uneapioyaent on volunteer enllstasnt
rates when there is a sizeable variation in accession levels over tlae.
High levels of public sector eaployaent ere bound to affect eaployaent con-
ditions in the private sector. This was particularly true during the Viet
era. Tracking the effects of uneapioyaent on volunteer enlistasnts during
this period csn lead to spurious results; it is better to obtain aeasure-
aants of uneapioyaent effects during periods of stable accession rates with
varying uneapioyaent ratea. The 1972-76 tiae period is probably best for
this kind of aeasursasot since accession levels were aoving into s steady-
stste period and uneapioyaent was rising with the onset of the econoalc
--- ■
1 ■ ■- —

■ .. ■ . "
■
:
recession. Possibly studies that Incorporate acre recent enlistaent dsts
will provide sore reliable results.
e Sododemographic characteristics of potential enlistees sre sig-
nificant determinants of enlistment levels and response to economic end
policy variables for the Army and Navy. Econometric models used in fore-
casting supply levels should disaggregate the supply by (st lesst) the
racial and educational characteristics of the population.
e A pooled time series, cross-sectional model can be useful in pro-
viding estimates of supply parameters across census regions. The analyses
of Army accessions show clearly that regional differences in accession
levels are more clearly defined and persistent than the policy variables
Included in the analysis.
• These regional variations can represent several factors affecting
the supply enlistees, including differences in higher education enrollment
rates (which to some extent may also reflect differences in racial distri-
butions, as evidenced by the fact the pooled time-series, cross-sectional
analysis found the black percentage of the QMA a significant variable only
when basic regional variations were not included explicitly as independent
variables).
RELEVANCE OF FINDINGS TO CURRENT POLICY-MAKING ENVIRONMENT
The early econometric analyses of accessions were motivated by the
need to assess the feasibility of maintaining an all-volunteer force.
Primary attention was given to the question of the effects of military
compensation and civilian employment levels on accessions sad the esti-
mation of the proportion of recent enlistees who had been draft-motivated.

1. [ [ c
i:
i; [
[ i i
fMslblllty »tudiM t*v* little attcnclon to qoMtioa« of tho quality
of tht «ollsteea and soldo« «ttooptod to separate au^ply offocta for the
iadlTldttal services. They did, in general, dowmatrato that the all-
▼olunteor force vaa at leaat nunerically feasible and that achieving a
■era attractive balance betvecn ailitary and civilian conpeasation could
aignificantly enhance the likelihood of aucceaa of JA all-volunteer force.
Generally speaking, the all-volunteer force has now been achieved
with increaalngly favorable distributions of enlistees by education and
■ental quality. Since it haa been clearly shown that cnliataanta neceaaary
to auatain a force of the current also can be achieved, currant attention
la focuaed aore on raising the overall quality of accaaaiona and on dater-
nining the noat nearly optimal «ay of obtaining the deaired higher quality
enlistees. Recent studies (e.g., lefs 7 and 8) have deaonatrated that even
1. with an aaaunption of a large relative pay elaaticity, the coat-effectiveness
of a ailitary pay Increase aa a tool for increasing accaaaiona la very un-
I. favorable «hen compared to alternative ways of obtaining enlistees such aa
paying quality and/or skill specific enlistment bonuses or Increasing
reaource allocations to the recruiting and advertising programs. These
recant atudles have dearly ahown the attractiveness of selective adjuat-
aenta in ailitary compenaation «hen coopered to the vary costly across-the-
board increaae. Table SI coaparea the cost-effectiveness of aeveral prograaa
for increaalng high achool graduate. Mental Group I-III anliataanta baaed on
reaulta in lefa 4 aad 8.
The aajor reason for the lapracticality of increaalng basic pay to
attxact aore volunteara is the compenaation pollciea that are currently
la effect. The very large marginal coat for baaic pay la in large part

* •
Table SI
MARGINAL COST PER ENLISTMENT
MENTAL GROUP I-II1, HIGH SCHOOL GRADUATE
Prosrn
Increase relative pay (elasticity — Army .6
Navy .45
Increase recruiters
Increase paid advertising
Offer $1,500 combat arms bonus for four-year enlistment
Cost of One Additional Enlistee
«fiOL
$104,700 -' $146.SOO^7
4,000
7,000
3,900
2,300
5,200
— Assumes the Increase Is In enlisted pay only.
a xeflectlon of the need to Inflate the entire pay structure to maintain
the Integrity of the compensation system. Thus, If a pay raise were given
to new entrants, all remaining enlisted members would be entitled to a
similar percentage Increase If differential salaries among pay grades were
to be preserved.
Because the pay elasticities differ for each service, a free market
approach to compensation would yield radically different pay scales. Under
this approach, basic pay would be adjusted to bring supply and demand for
new accessions Into rough balance for all services. Obviously this repre-
sents a significant change In military compensation policy by DOD and we
are not suggesting that such a practice be adopted. We raise the point
only to demonstrate that manpower policies that are optimal In an economic
sense are often unacceptable by other criteria — social equity being one.
10
■ ■* - .

0 i: c c i: c i: r
■H ~<»
•
Whatever the tüw tttmm considered, the effect of ▼eriatloss in the
UMoploysent rate continues to he an laportsat issue sad Invest igst ions
Co refine estlastes of the relationship between uneaployaent rstes and 7 9
enlistaents ere clearly indicated. Recent Investigations * are
shedding new light on this relationship and have produced results which
have been more statistically significant than the results of analyses re-
viewed in this study. These recent studies also show sore clearly the
substitution of higher quality enlistees for lower quality In the presence
of high uneaployaent rstes*
Inasauch as the siss of the QUA will be declining in future year», a
significant decline In the uneaployeent rate could generate a serious
shortfall of high quality enlistees in those services with the least bsslc
attractiveness to the preferred quality group.
RECOMffiNDATIONS FOR FUTURE ANALYSIS
Continuing studies of enllstaent levels In the Araed Forces should
concentrate on the issues which currently occupy the attentions of policy
■akers and program planners. Such studies should concentrate on the
following:
e Understanding more thoroughly the effects of changes in unem-
ployment rstes on enlistment levels of ths various quality groups,
e Projecting future enlistment levels with primary attention given
to current policy options,
e Evaluating the extent to which the significant effects of re-
cruiting on secessions sre simply reflections of Improved
positioning of recruiting resources by the services. This
can probably not be done using ths methodologies which sre
11 - • ■ - - -' -- - >■■. ., ,■■>■-■ t, ,, .fc... ■*-■ -..---.

■ r
■
the subject of this study. It will require a more alcro-
aaaljrtic cross-sectional study of the hind used to assess
the effectiveness of paid advertising campaigns. It nay.
In fact, require planned experimental variation In regional
recruiter assignments rather than simply an analysis of
available historical data.
e Refining the QMA and other key policy variables by explicitly
considering race, education and mental quality.
e Determining the effect renewed emphasis on recruiting for
the Reserves is going to have on active duty accessions.
Given the appropriate data, this issue could be studied
using many of the basic techniques discussed in this study.
• Makizs a more detailed assessment of inter-service competition
for quality enlistees,
e Continuing to compare, in a more nearly uniform way, the
cost-effectiveness of enlistment policy options,
e Continuing to recognize that responsiveness to economic as
well as policy variables differs widely among various quality
and sodoeconomlc subgroups of the total potential supply of
enlistees.
12

<• «N mm «M ■
I.
• -
1. [ c I
REFERENCES i: II. A. C. Flahftt, "The Cost of the Draft and the Coat of Ending tha
i—rlcan Ecoiwlc laviaa. LIZ, Ho. 3 (June 1969)» pp. 239-255.
[ [
Draft,'
2. A. I. Fechter, "Xapact of Pay and Draft Policy on Any Enllstaent Behavior," loc. dt.; and Arr Eallafenta and the All-Voluateer Force: The Application of an Econometric Hodel, Institute for Defense Analysis Paper P-8A5, February 1972.
3. B. J. Klots, "The Coat of Ending the Draft: Co—ant," Aaerlcan Econoalc Wmrim. LX. So. 5 (December 1970), pp. 970-979.
[^ 4. D. tf. Grlsaaer, D. M. Aaay, R. L. Arms, D. F. Buck, J. F. laperlal, L« D. Eoenlg, W. S. Moore, G. P. Slca, R. Ssynanakl, An Ecc- jaetrle
f Aaalyala of Volunteer Enllafanta by Service and Coat Effactlveneaa Coa^arlson of Service Incentive Prograa». General Research Corporation
*' Report OAD-CR-66, October 1974.
15. S. B. Altaan, "Earnings, Unenployaent, and the Supply of Enllated Volunteer a," Journal of Bvan Reaourcea, IV, !Io. 1 (Winter 1969), pp. 38-59.
6. R. B. Rla, S. Farrell, E. Clague, The All-Volunteer Ar»y; An Analyala of Daaind and Supply (Hew Tork: Praeger Publishers, 1971), pp. 79-120.
7. D. F. Buck, K. D. Mldlae, An Evaluation of the Effectlveneaa of U.S. hrmf Enllataent Bonuaea. General Research Corporation Report, August 1976.
1 • 8. D. F. Buck and J. L. Janea, Recmltlng Projections for the Arned Services, General Research Corporation Report, Deceeber 1975.
T
i. 9. Dorothy M. 4aey, Allen E. Fechter, Devld W. Grlaaaar, Gerry P. Slca, Supply Eatlaatlon of Enllataea to the Military. General Research
f* Corporation Paper, June 1976 (prepared for The Defense Manpower Co—Isslon).
12(a)
'•^al*'*'* • - ■ - - ■ m

* •
I I i
Chapter I
INTRODUCTION
by
Dorothy Amey
The several econometric analyses of the supply of volunteer enlistments
to the Armed Forces which have surfaced over the past eight years have
reported a broad range of estimates for supply parameters. Most notable,
the estimates of military and civilian pay, and unemployment elasticities
have been as diverse as the methodologies employed by the different studies.
Consequently, the decision maker analyst has been presented with a confusing
I choice of options in deciding the best model specification to use for policy
making. The main accomplishment of this study has been ro review, explain
and reconcile in many ways the breadth of findings resulting from the major
studies or enlistment supply that were performed in recent years.
This report consists of an extensive review of most of the published
studies on enlistment supply. A brief description of the types of econo-
metric models and methods employed to estimate supply parameters is pre-
sented in Chapter II. The basic assumptions that are made in studies on
the supply of enlistees to the services are explained and examined In Chap-
ter II. In Chapter III, the different analyses reviewed are listed ard
presented with the major findings from each. Some comparisons of variable
specifications, model structure and functional form, and methodology are
made in Chapter III. In addition, the detailing of the differences found
among the findings of these studies is set forth in Chapter III, thereby
providing the reader with the major discrepancies which have so concerned
decision makers.
13

In an effort to reconcile all of the major differences among the
findings of the studies reviewed, a reworking of the analyses performed
by Fisher and Klotz is reported in Appendix C. The findings from these
analyses based on a uniform data base are compared with the results of
other studies which are reviewed but not duplicated here.
Perhaps the most disputed difference in the methodology of the vari-
ous econometric analyses of enlistment supply has been the choice of time
series models versus cross sectional models. In Chapter IV, results of an
analysis of the supply of volunteer enlistments using a pooled time series
cross sectional model are reported. The analysis was made in an effort to
determine measurements of variable impact which might bridge the gap be-
tween disputed findings of studies which differed mainly in the structural
form of the model.
Interpretations of the findings of this study and the conclusions made
from our survey of econometric analyses of enlistment supply are included
in the chapters and in the summary of this report.
14

Chapter II
REVIEW OF LITERATURE: SOME METHODOLOGICAL ISSUES
by
Alan Fechter
Many of the enlistment supply studies reviewed here were generated as
part of the two major governmental studies of the feasibility of moving to an
all-volunteer armed force. These supply studies concar.crated their efforts
on the derivation of estimates of two important factors required to calculate
the incremental cost to the government of moving to an all-volunteer nilitary;
the supply of enlistments in the absence of a draft and the responsiveness
2 of enlistments to changes in military pay. The move to an all-volunteer
armed force in January 1973 has made moot the issue of draft-motivated
enlistments. In response to new policy issues, more recent studies, using
estimates of voluntary enlistments, have concentrated their attention on
deriving estimates of the impact of other enlistment determinam s, such as
recruiting effort and advertising, and on the socio-deraographic distribution
3 of enlistments.
THE THEORY OF ENLISTMENT SUPPLY
The studies of enlistment supply are based on an economic theory of
occupational choice in which individuals are assumed to pick their occupa-
tions so as to maximize their utility, subject to the constraint that they
can only engage in one occupation at a time and that thty can only devote
some fraction of their time to working in that occupation. One of the
earliest expositions of this theory applied to enlistment behavior is the
4 work of Fisher. Since most of the literature reviewed is based more or
15

less on a model like the one developed by Fisher, general aspects of his
ir.'idel are summarized below.
Fisher assumes that a potential enlistee is faced with two options:
to enlist or not to enlist. He defines the returns associated with these two
options as follows: Let V be the present value of the pecuniary and
nonpecuniary returns to enlisting; let V be the present value of the
pecuniary and nonpecuniary returns to net enlisting. V and V can be
written as follows:
n u
v = T -Mt
t-1 ^+i>t
v.- E n w
Ct c Z a-i)'
where W is the expected pecniary and nonpecuniary return to enlisting
for any given yea- t, W is the expected pecuniary and nonpecuniary return
to not enlisting in any given year t, and i is the subjective rate of discount,
He further refines his definition of Vw to account for the finite duration M
of the first enlistment decision, m.
m u n y
v = T ^ + T MCt
t-i a + " t^i a + l>t
where W is the expected posc-railitary returns in year t to an enlistee
after completing his first term of enlistment. He assumes that W is roughly
equal to W based on a comparison of earnings of veterans and nonveterans
made by Oilman. This allows hin to conclude that the relevant coiuparison
for potential enlistees is between
16

I
m w m w V- Mt . T- Ct E 1 and ^ 1
He further assumes that the time profiles of these two streams of return
are roughly similar. This allows him to ignore discounting and to conclude
that the appropriate cc-nparison for potential enlistees is between
Z WMc-WM and E "ct^C '' t=l t-1
Given Fisher's assumptions, a potential enlistee will prefer enlisting over
not enlisting if Ww > W„ . M C
In order to drive empirically testable implications from this model,
Fisher shifts his attention to the pecuniary returns to enlisting and not
enlisting, W and Wrp- He introduces a variable d, which represents the
net nonpecuniary disadvantage to enlisting. Thus, if V' > W (1+d) a Mr Cr
potential enlistee will prefer to enlist. He assumes that the distribution
of d among potential enlistees is lognormal and that it is stable over tiae.
This allows him to derive an enlistment function of the following form:
(1) | - f (In Wjjp, In Wcp)
He further assumes that equation (1) is linear and that the enlistment
response to a one percent change in W is equal in magnitude, but opposite Mr
in sign compared to the enlistment response to a one percent change in '.%'.
This allows him to derive the following explicit enlistment equation:
/-,N E /, WMP\ - a. «- , WMP , (2) p = f In —I = a + ß In — + e \ CP/ CP
17

Fisher furLhcr assumes that W is full-tine earuings and makes the
following modification for unemployment. He adjusts W for unemployment
using the following identity:
(3) WCP* = PeWCP + PuWCPU
where W-_. is full-time earnings, adjusted for the probability of not
being employed, p is the probability of being employed, p is the proba-
bility of not being employed, and W--.. is the earnings received while
unemployed.
If W„p = 0, then W ,. = p W . And equation (2) can be rewritten:
Equation (^) describes the enlistment function in a no-draft environ-
ment. To account for the presence of the draft. Fisher modifies his
definition of the pecuniary returns to not enlisting as follovs:
(5) W,,,,. = p U' + p. U w CP 'c CP"' Kd MP
where W ' is the expected pecuniary return to not enlisting, p is the
probability of remaining a civilian, and p, is the probability of not
remaining a civilian. From equation (3) (assuming W-p« is zero) and
equation (5), equation (2) can be rewritten to account for uncn?loy-.ent
and the draft as follows:
(6) | = a' + p^ 3n WMP \
+ Z "c?'/
\? a' + 5' In ~ ^r— + E
PePcUCP-- + VMP /
18

r i [
Further manipulation of (6) produces:
(7) E , - / ^r • O + 3 I In p + In
W Pe + ln M
CP
Fisher further assumes the following:
MP + E
(8) p^ = 6. (1-A/P) c i
(9) Pe - Yi (1 - U) Y2
where A/P is the obser\'ed military accession irate, defined to include
enlistments and inductions, and U is the observed unemployment rate.
This allows him to revnrite (7) as follows:
W (10) | - a + ß. In rr^ + ß. In (1 - U) + ß, 1 W. MP "(-f) + e
where:
a + 6i + Yl
6i'
K h *i S2
The relative pay elasticity, r, , can be estimatad fron equation (10)
"p'6!
T
The elasticity of expectations with respect to changes in probabilities
of being employed (y ) and remaining a civilian ((50) can also be computed
fron equation (10): Y2 - ß2 ^ S,
19
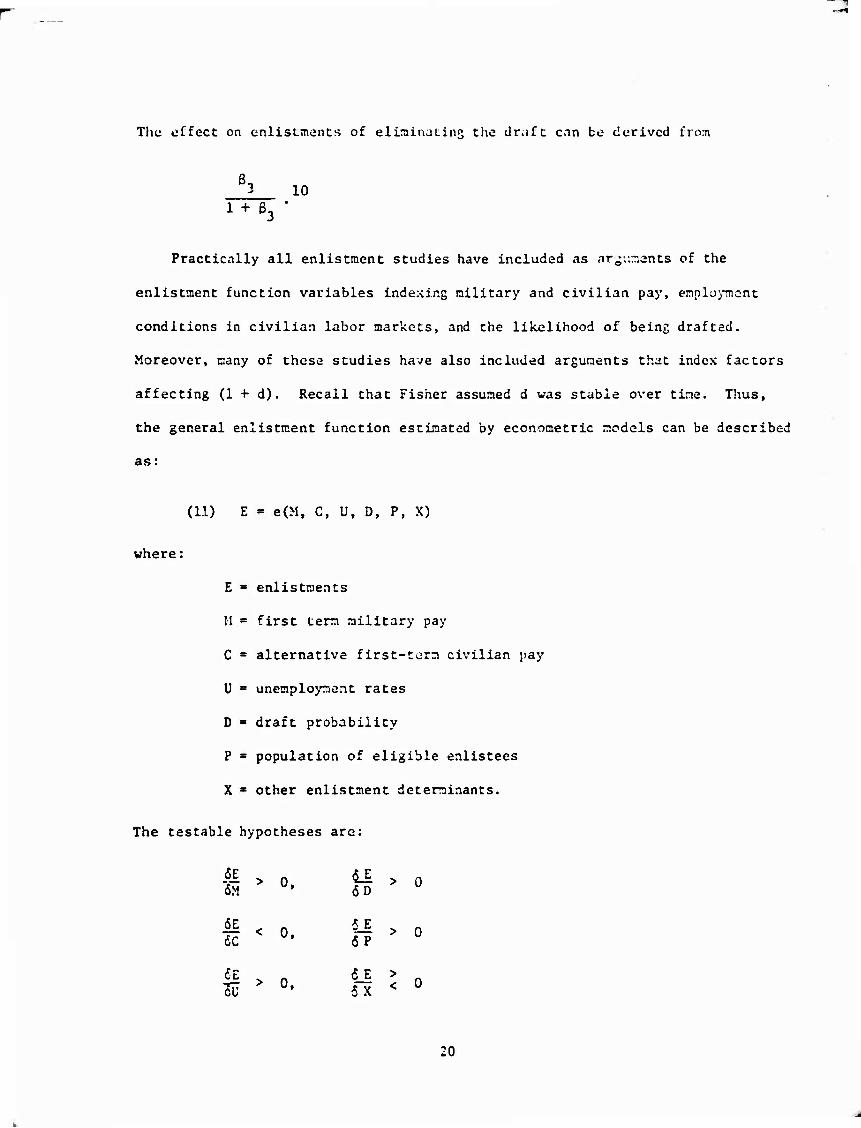
The effect on enlistnients of eliminating the dmft cnn be derived from
B3 10 i*e3-
Practically all enlistment studies have included as nr^r.nents of the
enlistment function variables indexing military and civilian pay, employmont
conditions in civilian labor markets, and the likelihood of being drafted.
Moreover, many of these studies have also included arguments that index factors
affecting (1 + d). Recall that Fisher assumed d was stable over tine. Thus,
the general enlistment function estimated by econometric models can be described
as:
(11) E = e(M, C, U, D, P, X)
where:
E = enlistments
11 = first term military pay
C ■ alternative first-term civilian pay
U ■ unemployment rates
D ■ draft probability
P ■ population of eligible enlistees
X * other enlistment determinants.
The testable hypotheses are:
i > •• H > "

I
•
SrECIFICATION OF AN ESTIMATING EQUATIO:,'
A number of decisions must be made in moving from (11) to an estimating
equation. First, an explicit functional form must be chosen; then methods for
estimation of the variables must be decided on; finally, an appropriate
estimation technique must be employed.
Choosing a Functional Form
The theory of enlistment supply developed by Fisher suggests that the
enlistment have a nonlinear form. Fisher selects a semilogarithnic function
based on an assumed lognormal distribution of W and (1 + d). Other studies
have not constrained themselves to this particular functional form. By selecting
alternative functional forms, these studies imply alternative, but unspecified,
assumptions about these distributions.
Specifying the Dependent Variable
Most other studies, following Fisher's lead, assume that the enlistment
function is homogeneous of degree one in P and use an enlistment rate as their
dependent variable.
Specifying the Effect of Pay
Fisher assumes that equiproportionate changes in M and C will generate
equal, but opposite in sign, responses in enlistments. This allows him to
specify his enlistment function in terms of the ratio, M/C. This particular
specification of enlistment behavior was convenient for many of the studies
reviewed here because they lacked sufficient variation in M to derive a
statistically reliable estimate of the enlistment response to changes in M.
The problem was particularly acute in the cross section studies, in which
M was assumed to be a constant that was independent of region. The relative
21

pay i-.pecification was also convcT.iont to t!>.c early time scries studies because
of the united amount of variation in military pay observed during the period
of their analyses. This data limitation necessitated reliance on the
variation in C for estimating the effect of military pay on enlistments.
However, there are reasons for questioning the validity of this assumption.
Fechter argues that the pecuniary return to not enlisting is not fully
captured by C. He suggests that the expected pecuniary return to remaining
in school is a particuxarly relevant return to not enlisting and that failure
to account for it could conceivably bias estimates of military pay elasticity
12 derived only from variations in C.
These arguments can be used to defend an alternative specification
of the effect on enlistments of M and C that does not rest on the assumption
of symmetrical enlistment response to equiproportionate changes in M and C.
An alternative specification would describe the enlistment function in terms
of the levels of both M and C. Two studies, these of Fechter and Withers,
experiment with enlistment functions specific-d in terms of absolute pay.
An additional argument in opposition to the assumption can be based
on an assumption that nonpecuniary factors, such as working conditions, are
33 superior goods. " The military can be characterized as comparatively risky
and regimented. There is evidence that, on the average, workers want to be
14 compensated for such risks as the likelihood of injury or death. On this
account alone, the expected nonpecuniary return to enlisting might be lower
than the expected nonpecuniary return to not enlisting. Thus, if non-
pecuniary returns are assumed to be superior goods and if the military can
be characterized as offering relatively small amounts of nonpecuniary returns,
one could e::pect enlistment rates to decline with equiproportionate changes
22
i 11
1 1
in M and C even when C is correctly specified. This would imply that the
enlistment response to changes in C would be greater in absolute terras than
the enlistment response to equiproportionate changes in M.
METMODS OF ESTIMATING VARIABLES
The studies of enllstoent supply differ most dramatically in their
methods of estimating the arguments of equation (11). Since these dif-
ferences could be a major reason for variations in findings summarized
above» they are discussed In some detail.
Enlistments
Enlistments were assumed to be demand determined during the period of
the draft. In general, most of the .studies followed Fisher in assuming that
enlistments from the lowest two of the five mental categories, category A
and category 5, were denand determined. Some studies liraltcd their
estimate of enlistments to cental categories 1-3; others used enlistments
classified by mental category and level of school conpleted (high school
graduate vs. non high school graduate); still others used all enlistees
and controlled for quotas by including a screening variable in their enlist-
ment function.
Eligible Population
The population of eliglbles (?) can. In principle, be Identified as the
product of the total population (TP) and the fraction of the total population
who are able to meet the mental and physical standards for enlistment (q).
The time series studies, following Fisher, assume a stable q and estimnte P
from the civilian noninstitutlonal male population age 17-20. (A notable
exception is the time series study by Kim, et al., in which P is estimated
as the number of Selective Service registrants between the nges of 19 and
26 who are classified as 1-A.) The cross section studies generally adjust
their estimates of TP by an estimate of q derived from the results
23

of preinduction examinations or examinations of enlistment applicants. A
problem with tliis procedure is that potential inductees or enlistment
applicants arc not a representative sample of TP because they exclude those
who have been prcscrcencd before their exams and those who are able to ob-
tain deferments. One cross section study, by Altman, further restricts its
estimate of P to full-time members of the civilian labor force.
Time Horizons, Dtscounr Rates, and Expectations Functions for Pay VarlahK'3
Estimates of M and C require assumpulons about the time horizon of the
potential enlistee. All studies follow Fisher in assuming that the time
horizon is the terra of the initial'enlistment contract. With the exception
of Cook, who uses a 4 year time horizon, the studies uniformly assume a
3 year time horizon. Recall that Fisher is able to limit the time horizon
to this period by assuming that the present value of post-military returns
to enlisting is equal to the present value of post-military returns to not
enlisting.
His evidence in support of this assumption is an unpublished study by
Oilman which compares earnings of veterans and nonveterans. This comparison
was made for comparable males standardized by age and education. It is poss-
ible that there are systematic differences between enlistees and noncnlistees
in the amount of school they complete. Some noncnlistees may choose not
to enlist in order to remain in school because of the perceived higher
present value of post-school returns relative to Che value of comparable
returns to enlisting. Other noncnlistees may remain in school as a means
of avoiding the draft. Both sets of behavior on the part of noncn-
listees would be consistent with a higher amount of school completed by
nonenlistees — and a resultant greater post-military return to not enlisting.
24
-. - . . . . -
Offsetting this tendency however, many enlistees cake advemtago of the pro-
visions of the C.I. Bill and return to school upon completion of their
military service.
It is not clear, a priori, which of these tendencies would be dominant;
however, both tendencies operate on Fisher's assumption of equality in post-
military returns. Therefore, factors affecting these tendencies ou^ht to be
considered in evaluating this formulation of M and C. In particular,
policy changes with respect to the G.I. Bill and evidence related to the
returns to additional schooling would be relevant, particularly to the time-
series studies.
An additional factor to consider in estimating M and C is the appro-
priate discount rate to use. Studies have varied in their choice of discount
rates to apply to first term pay. Some studies have eschewed discount rates
19 20 for simple averages; others have used rates of 20 and 30 per cent. A
final factor relevant co estimation of both M and C is the nature of the
expectations function used to form the variables. Most studies-particularly
the cross-section studies-use a static formulation in which expected future
values of M and C are based solely on the current value. Some of the time-
series studies use linear interpolation of annual values of M and C to derive
21 quarterly values. ' Still other time-series studies utilize a more dynamic
procedure in which current trends are extrapolated to produce estimates of M
22 and C beyond the initial year of enlistment.
Military Pay
Methods of estimating M have differed mainly in tbj components of pay
included. A unique feature of military pay is the substantial amount of
pay that is provided in-kind in the form of quarters, subsistence, and
25

medical services. Roughly half of military pay was provided in the form of
these in-kind benefits in the early 1960's. This fraction has fallen as
a result of the pay increases Instituted to move to an all-volunteer force; -
but it is still considerably larger than it is in the civilian sector.
Studies have varied considerably in their assessment of these in-kind benefits.
Most studies have valued these benefits according to the allowances awarded
for them by the military for enlistees who must purchase them on the open
23 market. Other studies, notably the Cook study, completely excluded
24 them from their estimates ot M. The cross-section studies form a unique
sub-set by assuming that their estimates of M, however defined, are constant
over regions. This means their estimates of military pay elasticity must
be derived from variations in estimates of C. The analytic problems and
potential biases associated with the method of estimation are discussed
below.
Fstlaating Civilian Pay; The Risk of Unemployment
Estimation of C involves a slightly different set of analytic issues.
First, while enlisting assures employment in the military, not enlisting
i-.vclves the risk of enduring some periods of unemployment. One must there-
fore determine a method for accounting for the effects of these periods of
unemployment on C. Recall that Fisher discounted an estimate of full-time
earnings by the complement of the unemployment rate (1-U) to account f jr
unemployment. An alternative method, used by Hause, adjusts full-time
25 earnings according to the duration of unemployment (DU).
These methods of accounting for unemployment assume that the risk of
unemployment operates on enlistments primarily through its effects on C.
Under these conditions, C can be measured as the product of full-time earnings,
26

.
C*, and the duration of employment, proxied by (1-U) or (1-DU). Sonc have
argued that the risk of unemployment also operates on enlistments through il-
effects on d. Assuming risk-aversion on the part of potential enlistees,
variations in the risk of unemployment can be expected to be inversely
related to d; i.e., the higher the risk of unemployment, the smaller the
net nonpecuniary disadvantage to enlisting. Under these conditions, the
enlistment response to changes in the risk of unemployment that are equivalent
to a given change in C will be greater than the enlistment response to an
equivalent change in C*.
The argument that the risk of unemployment is a determinant of the net
nonpecuniary disadvantage to enlisting can be used to justify specifying an
enlistment function in which C* and (1-U) are included as separate arguments.
Recall that Fisher's estimating equation is so specified—only Fisher's
justification is based on differences between measured and expected values
of his variable, p . which he proxies by (1-U). Both assumptions, risk
aversion .'nd differences in expectations, lead to formulation of an enlistment
function like (11) in which U appears as an explicit argument. However,
the risk aversion assumption leads to an expectation that:
6E ÖE 6(1-U) ÖC*
Most enlistment studies include U or 1-U as an explicit independent argument
in their enlistment functions. Most studies use global unemployment rates
for teenagers to index U; some studies have used unemployment rates of youth
26 whose major activity was other than school.
27

Civilian Pay: Full-Time Earnings
Most studies have followed Fisher in cstiraating C* from Ulie incomes
of age-specific year round full-tine workers. Soxe studies base their estimates
on C* on manufacturing payroll dat-a. Some use manufacturing payrolls bench-
marked to age-specific statistics, /-ll estimates are biased in that they
include the earnings experience of potential enlistees in mental category
5 and in other excluded mental categories. Consequently, the estimated en-
listment response to a given change in measured C''< may be a biased estimate
of the enlistment response to a given change in the mental-group-specific C*.
In addition, the studies which base their estimate of C* on manufacturing pay-
rolls are further biassd by their exclusion of potential enlistees in non-
manufacturing industries. These biases may be important in evaluating the
validity of estimates of military pay elasticities generated from variations
in civilian earnings only. They will be particularly relevant for the cross
section studies; they will also be important in both tine series and cross
section to understanding differences in pay elasticities generated for
different enlistment groups from estimates of relative military pay (M/C*).
Draft Probability
There are a number of methodological issues associated with estimating
this probability. First, the rules by which Selective Service is administered
would lead one to expect little or no regional variation in D. Thus, some
cross section studies were constrained to estimates of the enlistment
effect of the draft that are derived from survey data. Enlistees who in-
dicated on the survey that they would not have enlisted in the absence of
the draft are considered "draft-motivated" enlistees. These draft-motivated
enlistees, expressed as a proportion of all enlistees, can be considered an
estimate of the enlistment elasticity with respect to D; i.e., the proportional
28

1 ■ " •••"•• »" I" i. I»-». —...
change in enlistments that can be expected fron a 100 per cent decline in
draft probability. These studies relied on a 1964 survey of first-term
enlistee for their estimates of draft-motivated enlistments. Thus, their
findings reflect the factors affecting D that were prevalent during the
1961-64 period. Estimates of the enlistment elasticity with respect to
D derived from surveys taken at other periods might differ from those used
in these cross-section studies. A fortiori, estimates generated frem time-
series analyses based on observed variations in indexes of D can also be
expected to differ from those generated from the 1964 survey.
The time series studies relied mainly on an induction rate as an index
of draft-probability. As noted earlier, some of the time series studies,
in order to minimize the possibility of simultaneous equations bias, used
an overall accession rate as their index of D. While these rates are
undoubtedly important elements in an index of D, they are not necessarily
the only elements. The effect of a given draft-probability on the enlistment
behavior of a potential draft-motivated enlistee will depend on the options
he has available to avoid the draft. Historically, these options included
staying in school, getting married and having children, and, for a brief
period, just getting married. Considering draft-avoidance as an option
to enlisting can result in a more complex formulation of D. In principle,
the effect of any draft-avoidance option may depend on the level of D; i.e.,
the effort one makes to take advantage of these options may depend on the
perceived likelihood of being drafted. Moreover, the effect may differ between
peacetime and wartime environments. This would suggest some sort of inter-
active model of D. Some studies have tried to include draft-avoidance options
27 in their analysis in relatively simple ways ; most time-series studies do not
address the issue.
29

Other Enlistment Determinants
A number of studies have assumed that d varies with race, region, risk
of injury, level of school completed, public opinion, or resources devoted
to advertising and recruiting. Cross section studies focussed on race, region
28 and recruiting; time series studies examined the effects of risk, public
29 opinion, and level of school completed. The race effect was estimated by
including an estimate of the racial composition of a region as an additional
argument in the enlistment function. The regional effect was estimated by
Gray as a South-nonSouth effect. He used a dummy variable to indicate Southern
states. The recruiting effect was estimated through a recruiter variable, the
ratio of recruiters to P, the number.of qualified military available. The
effect of risk was estimated through dummy variables indexing the Berlin crisis,
the Cuban missile crisis and the involvement o* U.S. forces in Viet Nam. Viet
Nam involvement was also proxied by the total number of U.S. military casualties
in Southeast Asia.
Seasonality in Enlistments. Time series enlistments display strong
seasonal patterns reflecting two kinds of seasonal events; 1) the surge in
enlistments in June, when most enlistment eligibles complete school, and
2) the seasonal dip in enlistments in December, when the Armed Forces Enlist- -
ment and Examination Stations (AFEES) are closed for the Christmas and Mew
Years holidays, followed by a surge in January, when the AFEES catches up
on the backlog created by the December holidays.
With one notable exception, the Klotz study, all the tine scries
studies control for this seasonal pattern in enlistments by including
seasonal durmy variables. As we shall see, the method of dealing wJth
seasonality has a strong effect on estimates of several key parameters,
30

1. the estimated coefficient o£ U and the estimated coefficient of D. More-
over, the sensitivity of these parameters also affects the estimates of
the voluntary enlistment supply elasticity of M and C.
The reason for this sensitivity lies in the strong seasonal components
found in the series used to estimate U and D. This seasonality makes then
highly colllnear with the seasonal dummies included to control for the
seasonal effects on enlistments described above. Including the
seasonal dummies assumes that there is enough independent nonseasonal
variations in them. Excluding the seasonal dummies results in attribution
of the entire seasonal effect on enlistments to these seasonally sensitive
variables. One could speculate that including the seasonal dummies should
produce a lover-bound estimate of the effects of D and U, whereas excluding
the seasonal dummies should produce an upper-bound estimate of tneir effects,
SIMULTANEOUS EQUATIONS BIAS
The issue of potential simultaneous equations bias arises from the
possibility that some of the variables on the right hand side of (11) may
be affected by enlistments, in which case ordinary least squares techniques
of estimating the parameters (11) may be biased. The possibility of such
bias is strongest in the case of the variables C, U, and D.
The potentiality of an enlistment effect on C and U arises from the
role of enlistments as a shift variable in the civilian labor supply
function of potential enlistees. Other things equal, this supply can be
expected to be inversely related to the number of enlistments; i.e., an
increase fn enlistments is expected to shift the civilian labor supply
schedule to the left. This shift is expected to reduce unemployment rates
and, under the appropriate demand conditions, to increase C. Given the
first-order partials hypothesized for (11), the result of this reverse
31

causality would be to bias Che estimated effect of U and C toward zero. The
bias could be expected to be more pronounced for the variable U because of
short-run wage rigidities and fairly elastic long-run deaand functions for
potential enlistees In the civilian sector. Some of the tiwe-series studies
(notably, Fisher, Klotz, and Kim, et al.) have attempted to minimize the
potential simultaneous equations bias I r lagging their estimates of C, U, and
M one quarter. Otherwise, the studies have not attempted to deal with the
problem of simultaneous equation bias In C and Ü. From the evidence, we shall
see that such neglect Is probably justifiable In the case of C, but is riskier
In the case of U.
The Issue of simultaneous determination of E and D would arise from an
assumed fixed demand for military accessions. Given this demand, one would expect
to find an inverse relationship between enlistments and inductions, i.e., given
the demand for accessions, higher enlistments arc expected to result in a smaller
number of inductions. The result of this reverse causality would be to bias
the estimated impact of inductions on enlistments toward zero. Steady-state
accession demand arises from the need to replace individuals who are expected
to separate from service. This steady-state replaccnent demand is modified
by an appropriate increment (or decrement) when the desired stock of
military manpower changes. Thus, steady-state accessions are auQcented
for force build-ups and are reduced for force reductions. Replacement demand
is determined largely by first-tern accessions lagged an appropriate number
of years. The length of the lag would be the length of obligated service
of the average first-term accession. Force build-ups and reductions can
be assumed to be exogenously determined. Thus, the issue of simultaneity
between £ and D does not appear to be OAC that requires special treatment.
Some studies attempt to minimize the problem by using accessions as an
index of D.
32

FOOTNOTES. CHAPTER II
1. The first, initiated by President Johnson, was undertaken by the Departoent of Defense in 1964. The second, initiated by President Nixon, vas undertaken by the President's Commission on an All- Volunteer Armed Force (hereafter referred to as the Gates Cocralssion) in 1969. The findings of these analyses are sursnarized in: US Congress, House Coonittae on Anted Service, Hearings. Revit:'./ of the Administration and Operation of the Selective Service Syscom (89ch Congress, 2d Session, 1966), pp. 9?23-53 (hereafter abbreviated House hearings); US President's Comission on an All-Volunteer Arced Force, The Renort of the President's Comission on an All-Volunteer Armed Force (Wasiiingcon: US Governoent Printing Off ice, 1^70), (hereafter abbreviated Report).
2. The literature pertaining to these studies includes: A.C. Fisher, "The Cost of the Draft and the Cost of Ending the Draft," An-.arican Economic Review. LIX, No. 3 (June 1969), pp. 239-255; S.H. Altrsaa, "Earnings, Unemployment, and the Supply of Enlisted Volunteers," Journal of Human Resourses, IV, No. 1 (Winter 1959), pp. 38-59; B.J. Klotz, "The Cost of Ending the 3raft: Consnent," American Economic Review. LX, No. 5 (Decenber 1970), pp. 970-979; A.C. Fisher, 'The Cost of Ending the Draft: Reply," loc. cit., pp. 979-9S:i; B.C. Gray, "Supply of First-Term Military Enlistees," Studies Prepared For the President's Comission on an All-Volunteer Armed Ft'rca, Vol. 1 (Washington: US GovemEent Printinj Office, 1970), (herearcer abbreviated Studies); A.E. Fechter, "Impact of Pay and Draft Policy on Army Enlistment Behavior," loc. cit.; and Amy Enlistments and the All-Volunteers Force; The Application of an Econometric Model, Institute for Defense Analysis Paper P-843 (Arlington, Va.: Irstitutc for Defense Analysis, February 1972); A.A. Cook, Jr., "Supply of Air Force Volunteers," Studies;and "Quality Adjustments and the Excess Supply of Air Force Volunteers," Review of Econcrdcs and Statistics, LIV, (May, 1972), No. 2, pp. 166-171; A.A. Cook, Jr., and J.P. White, "Estimating the Quality of Airman Recruits," Studies, K.H. Rim, S. Farrell, E. Clague, The All-Volunteer Army; An Analysis of Demand and Supply (New York: Praeger Publishers, 1971), pp. 79-120.
2. See, for example, J.T. Bennett, S.E. Haber and P.J. Kinn, "The Supply of Volunteers to the Armed Forces Revisited," unpub. ms., George Washington University, School of Engineering and Applied Science Institute for Management Science and Engineering, March, 1972; D.W. Grissmer, D.M. Amey, R.L. Arms, D.F. Huck, J.F. Imperial, L.D. Koenig, W.S. Moore, G.P. Sica, R. Szymanski, An Econometric Analysis of Volunteer Enlistments by Service and Cost Effectiveness Comparison of Service Incentive Prograns. General Research Corporation Report OAD-CR-66, October, 1974. Glenn A. Withers, "International Comparisons in Manpower Supply," Unpub. ms., Instlture of Advanced Studies, Australian National University, December, 1975.
4. Fisher, "The Cost of the Draft...," loc. cit., csp. pp. 240-246.
33

5. Ibid.. p. 241.
6. Ibid.
7. The lognonr.al distribucion also allows him Co define W as median rather Chan mean earnings. Ibid.. pp. 243-244.
8. Fisher further assumes thac Che draftee and Che volunteer receive Che sane compensation, W .
9. Full details of Che derivation arc presented in A.C. Fisher, The Supply of Enlisted Volunteers for Military Service, unpublished Ph.D. dissertation, Coiuabia University, 1568.
A -A -A 10. Z£ p is close co zero, in ln(l —) can be approxiaatcd by =-. Thus,
equation (10) can be written:
If (IQ') f-a+ßj^ln^ + e2ln (1-U) -ß3 ^
MP
A E since ■£ is Che sun of Che enlistnenu race, =-, and Che laduccion race, I p, we can rewrite (10) in cenns of the induction race as follows:
<w"> f-p^ ♦ lap »«^ * ^J ^ (1"l,)" ^T * IE ^3 Thus, if ^ becomes zero, =■ will fall by an aaounc equal Co 773— r r —^— i+p-
T J
times the current level of —.
11. F irst tern military pay. Indexed by ehe basic pay of an E-l, was unchanged from 1952 Co 1965. It rose by about ten percent in 1965 and at above five percent per year in 1966-67. Major pay increases were not experienced until 1969, when basic pay was raised by about ten percent. The most dramatic pay increase cccured in 1971 when basic pay was doubled to move Co an all-volunteer force. See U.S. Congress, House Armed Services ComniCCee, Pay and Allowances of the U niforned Services, (Washington: U S Government Printing Office, 1973, pp. 91-93.
12. Fechter, Army Enlistnents ..., pp. 61-62, and Appendix C. The exact nature of the bias will depend on the first order partial differential between Rs and C, holding constant the other independent variables in the enlistment function.
13. Richard B. Freeman, The Market for College Trained Manpower; A Study in the Eccnomics of Career Choice (Cambridge: Harvard University Press, 1969), pp. 14-15.
34

|!
i. 1. I.
14. Richard Tlialar and Shen:in Rosen, "Estimating Che Value of a Life," unpub. ms., October, 1973; Robert S. Smith, "Compensating Wage Differentials and Hazardous Work," Technical Analysis Paper No. 5, Office of Hvaluation, Office of the Assistant Secretary for Policy and Research, August, 1973.
13. Mental categories are percentile distributions based on performance of enlistment applicants and potential inductees on tests designed to assess the ability of new recruits to absorb training within a specified period. The five mental categories used by the military in classifying potential recruits are
Mental Category Percentile
93-100 66-92 31-65 11-30 0-10
A discussion of the tests used to generate these mental categories can be found in B. Karpinos, "Mental Test Failures," in S. Tax, ed.. The Draft; A Handbook of Facts and Alternativej, (Chicago: University of Chicago Press, 1967), pp. 35. 35-49. Applicants in mental category 5 were not qualified for either induction or enlistment. For several years—between January, 1959 and May, 1963—the Army accepted no regular enlistments from mental category A. The other services accepted applicants from the upper half of mental category 4, but only if they achieved minimum scores on aptitude test batteries or if they had high school diplomas. The Army adopted a similar policy in 1962. A detailed chronology of mental standards since 1948 can be found in H. Wool, The Military Specialist; Skilled Manpower for the Amed Forces. (Baltimore: Johns Hopkins University Press: 19'36), pp. b3-69; See also Hearings before the House Conaittee on Amed Services, Review c: the Adniaistra- tion and Operation of the Selective Service System, Juv.c, 1966 (ivashing- ton: Government Printing Offica, 1966), pp. 10019-10020.
16. Fisher; op. cit.; Klotz, op. cit.; Kim et al., op. cit.; Fechter, op. cit.; Altman, op. cit.; Gray, op. cit.
17. Grissmer, et al., op. cit.; Grissmer, op. cit.
18. Cook, op. cit.
19. Fisher, op. cit.; Altman, op. cit.; Klotz, cp. cit.; Kim, et al., op. cit.
20. Fechter, op. cit.; Cook, op. cit.; Gray, on. cit.; Grissmer, op. cit.
21. Fechter, op. cit.
22. Cook, op. cit.
23. Fechter, on. cit.; also includes the tax advantage on these allowances.
35
*4
24. Cook, op. cit.
25. John C. Hause, "Enlistment Rates for Military Service and Unemployment," Journal of Human Resources, VIII, (Winter, 1973), Ho. 1; pp. 98-109.
26. Altman, op. clt.; Gray, op. cit.
27. Fechter, op. clt.; Cook, op. cit.
28. Altman, op. clt.; Gray, op. clt.; Bennett, et al., op. cit.; Grlssmer, et al., op. clt.
29. Fechter, op. clt.; Cook, op. clt.; Withers, op. clt.; Grlssmer, op. clt.
30. Fisher, op. clt.; Klotz, op. clt.; Kim, et al., op. clt.
36

f!
Chapter III
REVIEW OF LITERATURE: SOTMARY OF FINDINGS
by
Alan Fechter and Dorothy Aaey
The findltii'.s üf 17 <\acrican enlistuu-nt Hiudio« arc sumnnrirod In
thin chapter. Studies selected for review were those in which there was
soac uconoaetrlc model cither explicitly or iapllcitly stated froo which
the poraactcrs of the variables sucaarir.od in (11) were cstiinated. Table
1 catalogs those studies and provides information about the service for
which the analysis was performed, the time period of the analysis, the
units of observation, and the particular enlistees studied. Fur a number
of reasons, it is desirable to stratify the studios into those based on
time series data and those based on cross section data.
First, the cross öecLion studies faced problems in deriving esti^aLes
of military pay elasticities because they could not observe variation in
military pay at a moment in time. They were therefore constrained to deriving
their estimate of nilitcry pay elasticity from the •aUstaant effect of the
civilian pay variable. To seme extent, the earlier time series analyses
were also so constrained. As noted earlier, derivation of military pay
elasticities from civilian pay parameters creates the possibility of bias
arising from the assumption of symmetric enlistment responses to equi-
proportionate pay changes and from potential systenp.tic measurement err^r
in the civilian pay variable. The time series analyses, on the ether
hand, were able to observe at least some variability ir. the military pay
variable. Thus, they were able to base their estimates on some of the
observed variation.
37

Table 1
SUMMARY OF ENLISTMENT STUDIES
Author Period of
Sarvlet* { Analysis Units of
Observation i Units of Analysis
Tims ssrlss
Flshsr D 3:37-4:65 Quartärs
Uocs 0 i
3:37-4:63 Quarters I
Kla, «c si. i
; D, A 3:37-4:63 Quarters
1 : Fsehcsr 1» 1:38-3:68 Quarters
Cook AF ■
1:39-2:67 Quartärs
Raus« t
: 0 1 1:37-4:63 Quarters
Ulthsrs i
A 2:66-4:73 Quarters
Grlssaar. sc si. is N. MC, 1:71-12:73 Months
Grissaer
(
A, N, MC, 1:70-12*73 Months
Enlistees, Mental Croups I-IIIb
Enlistees, Metnal | Groups I-III
j Enlistees, Mental : Croups I-IZI
White enlistees In j Mentsl Groups I-III
' Enlistees In Mental ! Groups Z-II. 7-III, , I-IV
' Enlistees in Menial ! Groups II. I
Enlist» s, Mentsl Groups I-IV
Voluntsry enlistees ' by Mentsl Croup and ! level of school 1 coapleted i Voluntary enlistees by aantsl group and level of school coapleted
Cross Section
Aleeen. 01
Kla, «t si.
Crsy
D, A
0. A
0. A. N, MC, AT
1963
1963
1964
1967
Census regions
Enlistees in Mental Croups I-II, I-III
Enlist in Mentsl Croups I-III
State-groups , White enlistees in j Mental Groups I-III
State-groups ' Enlistees by level J of school coapleted
»tt, ec si.
Grissaer,
1970
Lockaso. et al.
0. A. N. MC. AP
! A, H, MC, 1972, 1973 State-groups Enlistees by age
I (17-18, 19-21) Enlistees by Mental Croups (I-II, I-III)
, Enlistees by level j of school coapleted
i (high school grsd.- ' Blsck enlistees by
level of school coa- pleted
Nevy reerui- All enlistees, : Districts School-eligible high- > , school graduates.
1973
Notes:sT b.
D»sll Services; A-Any; S-Sivy; MC-Msrlns Corps; AF-Air Pores. See Fechter, op. dt.. p. 48, fn 8. for s description of Mentsl Croups.

^^»
—
i. - ■
i. .
.
Second, Che cross section and Che time series studies differed In
methods used Co esCimnte Che impact of D on enlistments. Most of Che time r 1. series studies derived their estimates from the estimated regression
coefficient of some index (or indexes) of draft probability. (A few even
Cried Co control for other changes In draft policy, such as shifts in priority
of enlistment). With Che advene of Che lottery draft, direct estimation
of voluntary enlistments became possible, ellminaclng Che need Co estimate
the Impact of D. Thus, the later time scries analyses (notably those of
Grlssmer et al. and Grissmer) finesse the problem by estimating voluntary
enlistments from Che fraction of total enlistees with low-prlorlcy loccery
numbers. As noced In the preceding chapters, most of the early cross section
studies, notably Chose of Fisher, Kim et al., and Gray, used responses of
first-term enlistees to a survey question about their enlistment motivation
2 Co derive their estimates of voluntary enllscmencs.
Third, ehe Cime series studies had to come to grips with the problem
of seasonallty In the enlistment series and in the series used Co estimate
D and U. In contrasC, the cross section studies were able to work with
observed variability that was by and large nonseasonal in nature. Thus,
the Cine series results reflects in one way or another, depending en how
seasonallty Is handled in the study, this seasonal factor, whereas the cross
section results can be considered relatively free of seasonal Influences.
In addition, there Is reason to expect the all-service results to differ
from the service-specific results because of what may be called the "Intcrscrvicc"
effect. This effect can be attributed in large part to changes in the return
to enlisting in service i relative to the return to enlisting in the other
services. This variation in relative returns should result in a change in the
39

share of total enlistment supply goiuc to service 1. The presence of an inter-
servlce effect implies that total service elasticities should he no larger
than service-specific elasticities and frequently, they should be smaller.
Moreover, results can be expected to differ from service to service
according to the amount of excess supply faced by any individual service.
The conventional wisdom of military manpower experts is that the Air Force
and Navy, because of their relatively good conditions of service (and the
relatively high nonpecuniary returns they imply), are most likely to enjoy
circumstances of excess supply.
For these reasons, it would also be desirable to analyse the results
by service.
TIME SERIES STUDIES
There are really four distinct sets of data on which time series analysis
were performed; the Fisher, Klotz, and Kim et al. studies were performed
on total enlistment data for the period 1958-1965; the Fechter and the Cook
studies were performed on total enlistment data for the period 1958-1968 and
1959 and 1967, respectively; the Withers study was performed on total enlist-
ment data for the period 1966-1973; and the Grissmer et al. and the Grissmer
study was of voluntary enlistments for the periods 1971-1973 and 1970-1975,
respectively and used monthly rather than quarterly data. Moreover, these
monthly studies were able to stratify by level of school completed. The
results are reported for high school graduates in Mental Croups 1-3. In
addition, the Fechter and the Cook studies were of individual services; the
Fisher and Klotz studies were for all services. And Withers and Kim
et al. studied both Arr.y and DOD enlistments. Finally, because of the
peculiar nature of the Air Force enlistment market. Cook had to deal with the
40

i. possibility of an excess supply of enlistment applicants.
The results of these studies are summarized in Table 2. In order to
standardize for methodological differences among models, the flndinp,;*.
related to enlistments In Mental Croups 1-3 are reported, a group that
has generally been assumed to be supply-determined. Moreover, the sunuiary
In restricted to relative pay models that assume instantaneous adJustniM .
Finally, only the results of models in which male civilian populations (or
their equivalents) are used to estimate P are discussed. Other findlm^
•re reported only when they differ notably from the findings summarized
In Table 2. . f.
i Several general aspects of these findings are notable at the outset.
First, there is a consistent tendency to find a significantly positive
relative pay elasticity, a negative but statistically insignificant employ-
ment rate elasticity, and a significant enlistment elasticity with respect to
draft pressure. Klotz is the only exception to the relative pay and employ-
ment rate findings. Withers is the only exception to the draft pressure
finding. Only Fisher and Withers find a pay elasticity consistently less
3 than one.
Third, although generally not statistically significant, the employ-
ment rate elasticities exceed the relative pay elasticities in eight of
the twelve cases displayed in Table 2, and these employment rate elasticities
exceed one in ten of these twelve cases. The tendency for the employment • *
rate elasticity to exceed the relative pay elasticity Is consistent with the -
risk averting behavior on the part of potential enlistees with respect to
imploynent discussed in the preceeding chapter.
The statistical Insignificance of the coefficient of (1-U) may be the
result of measurement error; i.e., (1-U) may be a very poor proxy for p .
41

Table 2
tUtUKt OF TIME-SFKir.S FINDINGS: CIASTICITirS WIT» RESPECT TO LXrL'CTCD PECfMAr.v uToms TO LNLIS:I:;G (w^./'^p). mc EXHüCTEO ncjuiiun
OF KtM CMPLOYED (l-V) .\N3 TliE ^r.OU.OILITY OF BEING INDIICIED (A/P OR I/P)
Study Equation estlnatcd
Type of Service-1
Elasticities
MP CP
i
1 ! (i-u)
Proportion 3rafL-"otivuted
With draft
No draft
m th draft
No draft
Fisher Seal-log D .«7 .62 -.59«» ..73b .24
Klotz Serai-log D .87«» l.«7b -2.08 1-3.53 .41
Kim. it «1. Senl-log D 1.68 2.78 -1.92«> ri.l* .38
A 1.94 2.40 -2.63 -3.56 .20
Fechter Linear A 1.39 1.74 c e .20
Cook Log-linear AT 2.23 2.23 -1.36«> -1.36b n.a.
Withers Linear D .52 .55 e e .05
A .28*» .35«» c c .18
Grissmer, et «1.
Non-linear«1 A
N
n.a.
n.a.
.62
.44
n.a.
n.a.
3.67
n.a.
n.a.
n.a.
MC n.a. .15 n.a. 2.09 n.a.
AT n.a. .53 n.a. 2.16 n.a.
Crlssraer Log-linear A n.a. 1.33 n.a. 1.47b.t n.a.
N n.a. 1.45 n.a. n.a. n.a.
MC n.a. .38 n.a. e n.a.
AF n.a. .94 n.a. 3.40« n.a.
Sources: Fisher, "The Ccst of the Draft...," p. 248; Klotz, "The Cost of Ending the Draft...," ?p. 972-973; Kin, et al.. The All-Volur.:£->r Aray.... pp. 94-95, 200-201; Fechter, Arr.y Enli?c-ents.... ??. 93-9:. 9}; "I-?act of Pay...," pp. 24, 27, 29, 3i, 37; Cocit, "Supply of Air Force Volunteers., p. 17; Withers, "International Comparisons...," p. 12; Crissser, «t al., "An Eeonozatric Analysis...," pp. 108. Ill, 123. 140. 153. 161.
Notes: a. D-all Services (DCD); A>-Arny; AF«Alr Force b. Based on a regression coefficient that vas not statistically
slgnificrnt fron zero at Che .05 lev«l. c. Regression coefficient had "wrorV sign. d. Crlssaer. et al., "An £cor.c=etrie Analysis...," p. 1E9.
42

It seems reasonable to assume that p , which is a lone-run concept, would be
better approximated by a function that included lagged values 01 (1-U) (such
as a moving average or a distributed lag function).
These general tendencies with respect to sign and significance hide a
considerable amount of variation among these studies io the magnitude of the
relationships. Much of the variation arises from differences in units of
analysis. To standardize for this, comparisons are made of the findings
from the all-service enlistment equations estimated by Fisher, Klotz, Kim
et al., and Withers; then findings from the Army equations estimated by
Kim et al., Fechter, and Withers are compared. Finally differences between
the all-service and the specific-service enlistment equations are itmettiMMHl,
Within the all-service enlistment equations there were several notable
differences in research methods that could generate differences in findings.
Klotz, for example, excludes seasonal dummies from this cstixating equations
and derives his estimate of draft-sotivated enlistments from the coefficient
of the induction rate (rather than from the coefficient of the military
accession rete). Kim, ec al. use an estimate of P that encompasses a broader
age group, but excludes potential inductees who were found to be ineligible
for induction. Withers uses a different method of estimating pay, includes
variables to account for quality and taste variation, and estimates his
parameters from a later sample used. Both Fisher and Withers derive relative
pay elasticities that range between 0.47 and 0.62. The effect of Klotz's
modification of Fisher's analysis is summarized in Table 3. His use of an
induction rate to estimate draft-motivated enlistees raises the pay and the
employment elasticities. However, it lowers the estimate of the fraction
of enlistees who were draft-motivated. The latter finding can be attributed
43

to biases inherent in the oltcrnative specifLcaLions of draft pressure. In
Fisher's case, A/P is equal to the sum of H/P and I/P. Thus, regresssing
(1-A/P) on E/P produces a certain amount of spurious built-in negative
correlation that biases Fisher's estimated proportion of draft-motivated
enlistees upward. In Klotz*s case, given a level of required accessions, one
would expect to find a negative correlation between E/P and I/P. Thus,
deriving draft-motivated enlistments from I/P could bias Klotz's estimated
proportion of draft-motivated enlistees downward.
Table 3
SUMMARY OF EFFECTS OF KLOTZ MODIFICATIOKS
Elasticities WMP/WCP (1-U)
Proportion draft-motivated
With No draft draft
With draft
No draft
Fisher
Klotz -
Klotz -
using I/P
excluding seasonal
.47 .62
.67 .83
.87 1.47
-.59
-.84
-2.08
-.78
-1.05
-3.53
.24a
.20b
.41^
Source: Fisher, loc. cit.; Klotz, loc. cit.
Notes: a. Estimate based on equation using In (1-A/P). b. Estimate based on using as the appropriate argument of the original
enlistment function.
Klotz's exclusion of the seasonal dummies increases all elasticities
and also increases his estimate of draft-motivated enlistments. In addition,
it makes his pay coefficient statistically insignificant and his unemployment
coefficient statistically significant—exactly the reverse of Fisher's findings
(see Table 2). The effects are most dramatic for the probability of being
44

I I I J
employed (l-U) and for the induction rate (l-I/r)t sussesCai;*, that seasonal
variations in uneraploymenr. and induction activity have been innortaat
determinants of the seasonal pattern of enlistments and that Fisher's use of
seasonal dnmnies tended to obscure this relationship.
The pay elasticities derived from the Kim, et al. study are considerably
larger than those derived by Fisher and Klotz. In part, this Is the result
of differences between the two studies In their «ethod of estissting the
eligible population. Fisher uses a male civilian population age 17-20,
whereas Kim, et al. use an estimate of qualified and available Selective
Service registrants age 19-26. A comparison of the two estimates shows that
the Kim, et al. estimate is consistently larger than the Fisher estimate and
that the difference increases from slightly under 4 percent in 1958 to
slightly over 40 percent in 1965, averaging around 10 percent.
Since estimates of elasticities are inversely related to estimates
of E/P in semi-logarithmic functions, one would expect part of the difference
between these two studies to reflect the smaller E/P of the Kis, et al. studv.
Moreover, the secular widening of the differential could have caused differences
in some of the estimated parameters of variables displaying string trends,
such as the relative pay variable. Since the average enlistnent rates of
the two studies differ by only ten percent, it is apparent that only a snail
fraction of the observed difference in pay elasticities can be attributed to
differences in estimated population. The remainder must be due to factors
that produce differences in estimated parameters of the enlistment function.
Turning to the Army studies, we find that the Kla et al. pay elastici-
ties are roughly 35 percent higher than Fechtcr's, whereas the Withers v!:.»-
tlcities are 60 percent lower than Fechter's. Again, part of the differu-nce
can be attributed to differences between Kim ct al. and the others in archod«
45

of estimating P. The enployv.t nt race eiastir.itlos of Kim, et al. are
over 130 percent higher then riiosc of Fuehrer and Wiuicrs and arc statistically
significant. In contrast, their induction rate elasticities are exactly
the saae as Fechtcr's, end both elasticities are substantially bcluw those
of all service enlistment studies. The Fechter and Withers study diTfer fron
the Kim, et al., stuJy in their use of the civilian male population, age
17-20, to estimate P. And the Fechter study also differs from the Kim, et al.
study in its restriction to white enlistees, and in its coverage of a longer
time period. Both Fecater and Withers also include additional independent
variables in their analyses. Reconciliation of these findings can be accomp-
lished by reestinating these Arr.y enlistaent equations in a manner that
standardizes for the differences discussed above.
Fechter also e-periaents with absolute pay models and distributed
lag mcd«l<t <->nd finds that his esclaatss of pay elasticity are sensitive
to model specification. In particular, he finds that military pay elasticities
estimated from absolute pay models are higher than military pay elasticities
estimated from equivalent relative pay models. He also finds that, in the
absolute pay models, the point estimate of the military pay elasticity exceeds
the point estiaate of the civilian pay elasticity in three of the four cases
presented. This finding is inconsistent with the hypothesis that the net
nonpecuniary returns to enlisting would result in a declining enlistaent
rates with equiproportionate increased in L' and a correctly specified
W . However, since '*' may not be correctly specified, this finding can
not be considered strong evidence refuting this hypothesis. The distributed
lag model increases Fechter's estimate of the proportion of enlistees who
are draft-motivated.
46

[ ::
The nost direct compiriscn between DOD enlistment» and specific service
cnlistnents can be made by examiuins the findings of Kin:, et al. They find
that point estimates of the fraction of DOS enlistments that are draft-
notivated is almost double that of the Array. This finding is strengthened
when one brondens the coraparison to include the less comparable specific-
service study of Fechter and DOD studies of Fisher and Klotz.
Their finding with respect to pay elasticity is less clear. The point
estimate of the no-draft DOD pay elasticity exceeds the point estiaate of
the no-draft Army pay elasticity by 16 percent, but the point, estiaate
of the DOD pay elasticity of enlistment in a draft environment is 13 percent
less than the point estimate of the equivalent Army pay elasticity.
Extending the comparison to the less comparcble studies noted earlier, we
find that the specific-service studies of Fechter and Cook produce point
estimates of pay elasticities that exceed those of the DOD studies of
Fisher and Klotz, but fall short of the DOD pay elasticity estimated by
Kim, ct al. Recall that a major difference between the Kim, et al. study
and the other studies in their estimates of P. Also note that the Fechter
and Cook studies extend their samples beyond 1963, whereas the samples of
the other studies stop with 1963. Finally, consider the fact that both
Fechter and Cook include variables to control for the influence of the
cold war, and the hot war in Southeast Asia, and that Cook also includes
variables to control for a possible excess supply of enlistment applicants
and for the effects of a chinge in the draft-priority of married men. Thus.
while the comparisons betveer Fechter-Cook and Fisher-Klotz arc standardized
so that there are no differences in their estimates of P, one cannot
standardize them for differences in periods of analysis and model specification
without reestimating the enlistment equations.
47

A hypothesis explaining the observed difference in pay elasticities
is the longer period of analysis in Che studies Ly Cook and Fechter.
Military pay remained virtually unchanged during the years 1958-1963 and
began to advance rapidly thereafter. Since military pay is not estimated
precisely it is possible that its error cenpenent vras a larger fraction
of its total variation from 1958-1965 than it was from 1958-196S. Table 4
sumsiarizies some of the salient aspects of military pay variation for the
two periods discussed above. By any criterion, the studies by Cook and
Fechter had more pay variation to work with than did the earlier studies.
Measurement errors in variables can, under the appropriate circumstances,
bias estimated regression coefficients toward zero. And this bias will
be stronger, the larger is the proportion of the observed variation Chat
can be attributed to the error component. Thus, it is conceivable Chat the
observed higher pay elasticities estimated by Cook and Fechter can be
attributed in part to larger amounts of military pay variation in their data.
Unfortunately, there is no way to test this hypothesis directly. One
must either reestimate the parameters of the Cook and Fechter equations on
a subset of their data or one must reestir.ate the parameters of the earlier
studies using the more recent data. In addition, cor.parisions between (Cia
et al., and Fechter and Cook will require further adjustments for differences
in their estimates of P.
The Cook study also departs from earlier studies by accounting for
the possibility of excess supplies of enlistment applicants to the Air
Force. He assumes that recruiters "cream" enlistment applicants by taking
applicants from the top mental group first, and attempts to control for
this effect by using an estimate of average score on the mental test as
48

I I I I
au additional tadcpcodcnC variable in his analysis. Unfortunacely, it is
noc possible to dctercinu whether inclusion of this variablsj significantly
effects his MClnat« of the military pay elasticity since he does not present
results in which the test score variable is excluded fror, his analysis.
Table 4
COMPARISO:.' 0? MILITARY PAY VARIATION. 1958-65 AKD 1958-68
1958-65 1958-63
Average 4688 4987
Variance (in thousands) 20 301
Standard deviation 143 548
Coefficiant of variation .03 .11
Range 659 1872
Suurct»: A. Fechcer. Amy En 1 i3tn:ents..., p. 9J.
CROSS SrCTION STUDIES
The aajor cross section studies are those of Allman, 01, Kia et at..
Cray, Bennett et al., and Crissaer ec al. Altnan, Oi, at-.d Kia ei at.
each fit enlistsent functions to nine regional observations for the year
1964. Cray fit enlistment functions ta the sana nine regional observations
and to 34 "state" observations for the sase year. Bennett, et al. and
Crissner, et al. arc the first studies to use direct estimates of voluntary
enliscsants in their analysis. Sennett, et al. fit enlistment functions to
29-33 state groups using data for the year 1970. Grisscer, et al. lie cnlist-
nent functions to 47 state observations for the years 1972 and 1973.
49

In addition Co beln^ able to fit enlistment functions to voluntary enlist-
ment data, these latter two studies also included measures of recruiting
resources spent by the services in each of these areas. However, offsetting
their strength in the superior enlistment data they use, they are weak in
the methods used to estimating their pay variables.
Table 5 summarizes the cross section findings. We confine ourselves
to the findings for all services and for the Army since the findings for
the other services were either statistically insignificant or had the wrong
sign. Like the time series studies, the pay elasticities are positive and,
by and large, significant whereas the employment rate elasticities are r.en-
«rally positive, but based on coefficients that are not statistically dif-
ferent from zero. Eighteen of the twenty-two pay coefficients repcrtod wore
significantly positive, whereas only five of the sixteen employment rate
coefficients are significantly positive. The cross section pay elasticities
are. considerably lower than the time series elasticities, exceeding one in only
six of the cases reported. However, as in the time series findings, the
pay elasticity for the Army consistently exceeds the pay elasticity for
all services and the pay elasticities for volunteers exceeds the pay
elasticity for total enlistees. Only Gray reports reasonably consistent
pay elasticities in excess of one. Like the time series findings, the
point estimates of the employment rate coefficient, although generally
not statistically different from zero, usually exceed the point estimates
of the relative pay coefficient, falling short of one in only four of the
cases reported. These employment rate findings are also consistent with
the speculations concerning risk and measurement error discussed above in
the interpretation of time scries findings. The lower relative pay coefficients
50

Table 5
SUKl'.KY OF CUKS-SECTTO*; PKOISCS: EL\SnClTirS ■..'ITU RLS.'MICT TO E-^ECTED KCtUXAn REl'": s TO ^LISTING lWM.-»/Ka.)t Till CXPECTCO
p^oB^iLm OF itniG EMPLOveo d-i'). .^.'ü "!;:: T.DPOKTIC:; OF TOr.U. EILZS1CSS ..'ilO UESE UiUFT^tOTIVAiCO (CM)
Study Equation estisatcd
Type of Service«1
Elasticities
MP7 C? (1- U)
DM mth :;o Jr^rt draft
With draft
No draft
Altsum Log-linear D .38 .80- .-1.5: -2.73b .39
A .5-4b I.IO» -2.02b -3.23 .45
Log- coapleacnc
• .44 .88b .-1.13b -2.0Sb .39
A .62 1.13 1.35b -2.59b .45
Kin, «c al. Seal-log D .12b .82 n.a. -2.44b .39
A .46 1.19 1
n.a. -2.44b .45
Cray Linear D .84 1.05 c c .39
A 1.54 1.77 c c .45
Bennett, et al. Leg-linear A* .35 .65 .72b -.48 n.a.
A« .45 .75 ] .96b -.48 n.a.
Crissaer, et «1. Log-linear A' .20^ -2.30 n.a.
AS .68 1
-.70b n.a.
;
'
Sources: Altaan, ^arnlnfS, Unersloyaent and the Supply of Volunteers," p. 56; Kla, et al.. The All Volunteer Arry..., p. 105; Gray, "Supply of First-Tera Military Enlistees," pp. 15-]'/; Bennett, et al., "The Supply of Volunteers to the Araed Forces Revisited," p. 9; Crissaar, et al.( An Econoaetric Analysis..., pp. 21-22.
Nocas: a. D-all services (DCD); AaAray. b. Based on a regression coefficient that was net significantly
different froe zero at the .10 level. c. Hot included in this estiaatin? equation. d. Recruiting effort is included as a resress^r. a. Recruitir.s effort is excluded as a re^rcssor. f. Estiaates are for fiscal year 1972; recruiting effort is
excluded as a rtgrtssor. g. Estiaates arc for fiscal year 1973.
n.a. Kot applicable.
51

•
seem Co be ehe result of the tendeucj- in Che cross secdon studies Co adjust
P for pocenclal enlistees who may not. jc qualified to enlist.
As in Che Lixe scries findings, chuse general Lcndcncics with respect
Co sign and significance hide a considerable amount of variation among
studies in their findings with respect Co magniri'Je of ehe relationships.
(e.g., Army vs. DCD) and some of these differences reflect nethodological
differences or differences in periods or units of observations among studies.
To standardize for chese difference, like services are compared wliuin sim-
ilar time periods. First the findings of the three early studios (Alcaan,
Kim et sl.t and Cray) are compared and then Che two later studies (Qcnnett
•t «1. and Crissmer et al.) are compared.
The findings of the Aldnan study and ehe Kim, et al., study differ
only because of the difference between them in Che assumed sxpliclt functional
form of Che enlistment function. Gray, however, differs from these studies
in several ways. He estimates a different functional form; he confines
his analysis to white enlistees only; he uses state rather than regional
data; and he estimates U * directly rather than estimating separate
i components of W (i.e., W and p ). He finds much higher pay elasticities
than the other two early cross section studies. He reports that his findings
are not sensitive to alternative specifications of functional form. This
makes intuitive sense. Unless there is a large variance in the independent
variables, elasticities estimated at mean values will not differ by much
even if one functional form might better describe the entire range of
the function Chan do Che oChers. Moreover, Che relatively small difference
between Altman and Kim, et al. in their findings reinforces the likelihood
that Gray's higher elasticity is not merely a reflection of the functional
form he used.
52

( I I I I
*<
' »
The effect on Cray's findings using state data is sumrcirizcd in
Table 6. This cable also suamarizus the combined effect on Cray's findings
of his use of white enlistees only, his inclusion of enrolled persons in
his estimate of eligible enlistees, and his use of W as his independent
variable. The effects of these methodological differences between Alteon
and Gray (other than their choice of units of observation) can be observed
by comparing the first two rows of the table. The combined effect of the
three major differences between these studies is to raise the estimated
pay elasticity in three of the five cases presented—and to raise their
elasticities by a substantial amount for the DOD enlistment functions.
The effect of using state data can be determined by comparing the second
and third row of the table. His use of state data substantially increases
his estimated pay elasticities for Army enlistees, but reduces his estimates
for DOD enlistees.
Table 6
COMPARISON OF ALTMAN AMD CRAY ESTDIATES OF RELATIVE PAY ELASTICITY AND COMPARISON OF GRAY ESTIMATES OF RELATIVE PAY ELASTICITIES
DERIVED FROM REGIONAL AND STATE-GROUP DATA
All Services ! Army
With draft No draft : With draft j No draft |
Altman
Cray - 9 Census regions
Gray - 34 state-groups
.38
.91
.84
.80
1.78
1.05
.54
.43
1.54
1.10
1.31 !
1.77 1 |
Source: Table 5 and Gray, Table 4.
53

ßased on evidence pivs^nceJ nb.»vc, •*» would o>:njct Gray's inclusion
of school cnrollciü in his •J-sLimaCo of oligiblM and his use of *rp* to
increases his relative pay elasticity. The inclusion of school enrollees
raises his escimace of P. loeer'ng his cstinacc of Z/T. If enlistment
elasticities are inversely related to E/P, this should raise the pay
elasticity. The use of W--^ should increase the estimated pay elasticities
because the enpluynent rate elasticity, althoi^h statistically insignificant,
has been shown to be substantially largsr than the elasticity of '^up/'vp
in the cross section studies (Table 5}.
On a priori grounds, we would not be able to predict the effect of
race on enllstaent elasticities. We would expect enlistaent elasticities
for blacks to be smaller than enlistsent elasticities for whites if black
enlistment rates exceed white enlist.iont races. One night expect black
•nlistiaent rates to txCMd ublM enlirtr.er.t rates because of discriaination
against blacks in civilian labor markets. However, offsetting this tendency,
one olght expect black enlistment rates to be lower than white enlistment
rates because of higher disqualification rates for blacks (resulting in 7
a smaller number of eligible:;, other things equal.) There is evidence from g
the Grissraer, et al. study that enlistment elasticities are larger for blacks,
suggesting that the disqualification rate effect overwhelms the discrimination
effect. However, methodological shortcomings In this particular study make
this evidence very weak.
In contrast to the earlier cross section studies, the studies of
Army enlistments by Sennet, ct al. and Crissmer, et al. find substantially
lower pay and unemployment rate elasticities. Major difference betveen
the earlier and later cross section studies include differences in the time
period of the analysis and the inclusion in the letter studies of variables
54

h
•
■
to control for recruiting effort. Compnrisons of findings fron the Bennett,
ct al. study (iublc 6) tfugsost that inclusion of the recruiter variable
lowers tlie estiuate pay ulasiicitics slightly. However, their estimates of
pay elasticity from the equation that excludes the recruiter variable suggests
that the other differences arc also important. To standardize for differences
in estimates of eligibles, co.apare the Bennett, et al. findings with those
of Gray. Gray's estimated pay elasticities are three times as large as the
elasticities of Bennett, et al. Gray's study Is restricted to white enlistees
only and Gray estimates W . In addition, Sennett, et al. use a much cruder
proxy for H , the year-round, full-time equivalent of average hourly wages
in manufacturing. Gray's restriction of his analysis to white enlistees
only should have resulted in a lower pay elasticity, other things equal,
if one is willing to accept the validity of the findings of Grissmer, et
al. noted earlier. Thus, the lower pay elasticities of Bennett, et al.
•re probably attributable to differences in methods of estimating H„,
The lower pay elasticity estimated by Bennett et al. appears to retlect
measurement error in their estimate of W .
Similar conclusions apply to the study of Grissmer, et al., except
that their proxy for W is even cruder than the one used by Bennett, et
al. In brief, they create estimates of U _ by adjusting national benchmarks
of incomes of 17-21 year olds by the ratio of state-specific to national o
«ages In manufacturing. They estimated the national benchmarks on the
basis of Incomes of all persons 14-19 and 20-24 rather than on the basis
of incomes of year-round, full-time workers. This biases their estimate
downward since many persons in these age groups are voluntarily working
part-time or psrt-year while they attend school.
55
In addition, Grissracr, et al. include variables proxyinp, for the effect
of enrollment in college and the presence of military facilities in their
analysis. They find that both variables have significant effects on
Army enlistments; college enrollment tends to inhibit enlistment and a
military presence tends to encourage enlistments. Both of these variables
can be justified as appropriate enlistments determinants. The college
enrollment variable reflects an aspect of the return to not enlisting that
is not captured by W ; the return to investment in higher education.
The military presence variable can be interpreted as reflecting differences
in perceived nonpecuniary returns to enlisting (i.e., taste differences)
arising from exposure to the military environment. Since both are found
by Grissmer, et al. to be statistically significant, they could have
affected the coefficient of the relative pay variablc-particularly if
they are statistically related to relative pay.
56
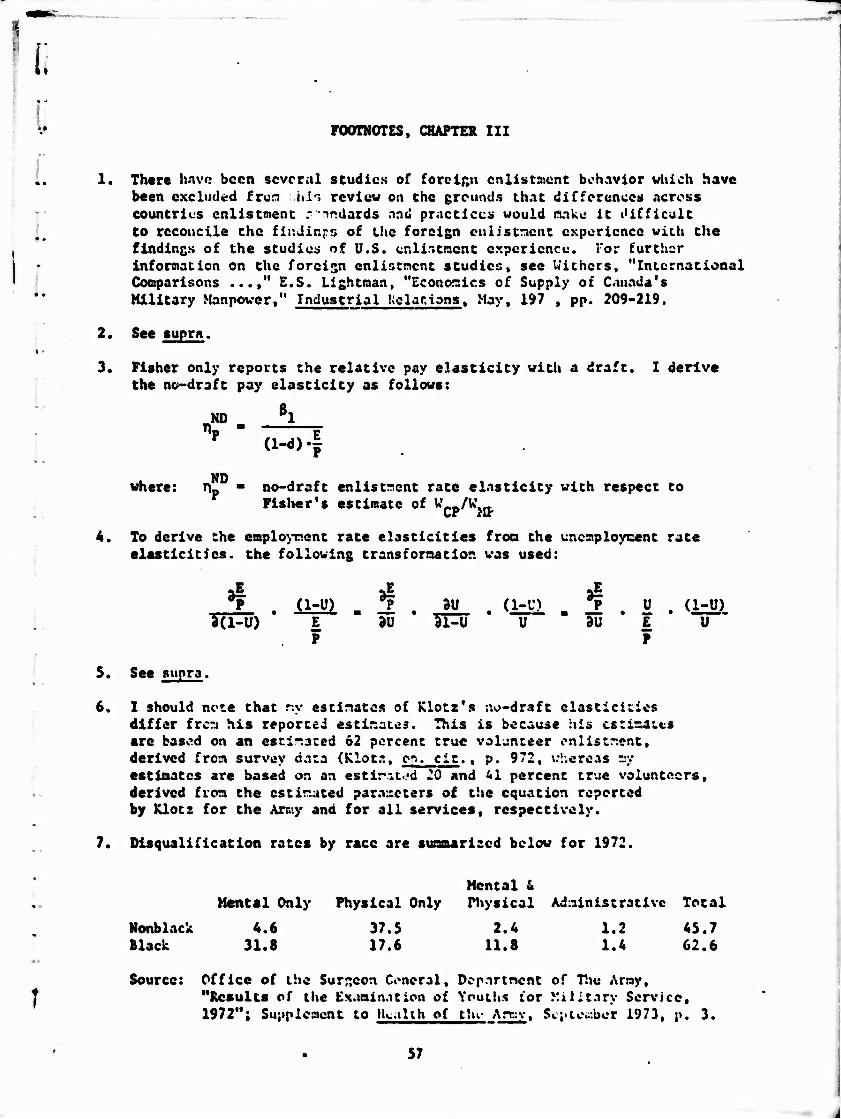
i
..
FOOTNOTES, CHAPTER III
1. There hnvr: been several studies of foreign cnlistaicnt behavior which have been excluded fron hli review on chc grounds that difference* across countries enlistment ." T<iards nnd practices would Make it difficult to reconcile the findinjta of the foreign cuijstnent experience with the findings of the studies of U.S. cnlittracnt experiencu. Tor further information on the foreign enliscncnt studies, sec Withers, "Inicrnational Comparisons ...," E.S. Lightman, "Economics of Supply of Canada's Military Manpower," Industrial Kolar.ions, May, 197 , pp. 209-219.
2. See supra.
3. Fisher only reports the relative pay elasticity with a draft. I derive the no-draft pay elasticity as follows:
n ND ßl
P (l-d).|
where: rip ■ no-draft enlistment rate elasticity with respect to Fisher's estimate of W/U'
CP MP
4. To derive the eraployncnt rate elasticities from the uncaploycent rate elasticities, the following transformation was used:
»1 ici-u)
(1-U) , E P
au U " äü
u E P
. d-U) U
See supra. 5.
6. I should note that r.y estinates of Klotz's no-draft elasticities differ froa his reported estimates. This is because hia caciascaa are based on an esri-.ated 62 percent true volunteer enlistment, derived froa survey data (Klot.-., a. cit.. p. 972, vV.ereas ojf estimates are based on an estlm*d 20 and 41 percent true volunteers, derived from the estimated parameters of the equation reported by Klotz for the Arciy and for all services, respectively.
7. Disqualification rates by race are summarized below for 1972.
Mental & Mental Only Physical Only Physical Administrative Tot a
Nonblack 4.6 37.5 2.4 1.2 45.7 Black 31.8 17.6 11.8 1.4 62.6
Source: Office of the Surr.eon General, Department of The Amy, J "Results of the Examination of Youths tor Military Service,
1972"; Supplement to Health of tlu- Arr-.y, September 1973, p. 3.
57

_- . —,
I
8. Grissmcr, ec al., op. clt.t pp. 85-90. '
9. Ibid.. pp. 18A-195. Unfortunntely, details of how they ccncratcd the income estimate for 17-21 years old and of exactly which manu- facturing wage statistic was used are not presented.
. i
58

I Chapter IV
RECONCILIATION OF THE FINDINGS OF THE FISHER AND KLOTZ STUDIES
Alan Fechter
I In this chapter, the Fisher and Klotz studies are reviewed in great
detail. An attempt is made to reconcile the differences among their find-
I
I ings with respect to the Impact of military and civilian pay, employment
conditions and the draft, and the results of ocher studies discussed in the
literature review of Chapter III. Among the differences investigated are
differences in functional form, differences in sample period, differences in
units of analysis, and differences in the model and variable specifications.
In Chapter III, a wide range in published estimates of the Impact of
pay, employment conditions and other variables was reported. The process of
reconciliation of the findings consists of attempts to standardize for the
methodological differences among the studies by means of a uniform data base
compiled for this purpose. First, the original data for each of the studies
are replicated whenever possible. The findings are then benchmarked to the
uniform data base. The uniform data base is then used to investigate the
sensitivity of the findings to a number of methodological differences among
the studies in deriving parameter estimates.
THE FISHER STUDY
The estimating equation from the original Fisher model had the form:
W CD | - 2« + 3, in— ♦ 3, tad - U) + 5, n(l - #) * v
? oh utvT '2 cr'U " ^ z3 nu " ?'
where:
E - DOD enlistments, all races. Mental Groups 1-3
P » Civilian aale population, age 18-19
59

W - Average earnings of civilian oale year-round, full-tine workers,
age 18-201
2 W * Average earnings of first-term enlistees
Ü ■ Unenploynent rate, male civilian labor force, age 18-19 3
A ■ Total D00 accessions
v - Error t.«4
The equation was fit to quarterly data in which the variables W /W
and (1-Ü) were lagged one quarter in order to reduce possible simultaneous
equations bias. Dummy variables were also included to control for seasonal
effects. Fisher reports he fit this equation to quarterly data for the period
starting with the third quarter of calendar year 1957 ( :57) and ending with
the fourth quarter of 1965 (4:65).
In analyzing the Fisher data base, it was discovered that Fisher deflated
his estimate of V by the Consumer Price Index (CPI) so that civilian earn-
ings are expressed in real terms. (Details of this analysis are described
in Appendix A.) In contrast. Fisher does not deflate his estimate of VL. by
the CPI; rather, he leaves his estimate of military pay in current dollars.
There is no published explanation of why be opted for this method of esti-
mating relative military pay. However, Fisher has indicated that he chose
this method of account for income in kind. An alternative procedure would
express both W and VL^ in either real or nominal dollars. Consequently,
his estimating equation was fit using alternative estimates of V /V^* More-
over, the size of Fisher's sample was uncertain. While he reports having
fit the equation to a sample beginning in 3:57, experiments with that
sample did not conform very well to the results he reported. Consequently,
experiments were made with two sample frames: one beginning in 3:57, and
one beginning in 4:57.
60
7
Result» with Original Fl»h«r Data Ba»g
Table 7 conpares the findings reported by Fisher with the findings
generated by the CRC experiaents. FISH A suanarizes the results using
Fisher's estlaate of relative pay on a saople beginning In 3:57; FISH B
suHurizes the results of the experlaent using Fisher's estlaate of rela-
tive pay on a saaple beginning In 4:57; FISH C suanarizes the results
using CRC's estlaate of relative pay on a saaple beginning In 4:57.
FISH B produces a better approxlaatlon of Fisher's findings than
FISH A. Also, while the relative pay coefficient is sensitive to the
acthod used to estlaate relative pay, the other results are relatively
insensitive to this issue. The estiaated relative pay coefficient falls
froa -0.00706 in FISH B to -0.00502 in FISH C. a drop of 29 percent. This
reduces the relative pay elasticity estiaated using the Fisher aodel on
the Fisher data base froa .67 to .48 with a draft, and froa .82 to .59
without a draft.
Table 8 siaaarizes estimates of the elasticities of U /^ and (1-C)
both with and without a draft. The pay elasticities are less than unity.
The elasticities with respect to (1-U), although derived froa regression
coefficients that were not statistically significant, always exceed, in
absolute terms, the relative pay elasticities. The voluntary enlistment
elasticities with respect to (1-U) exceed unity.
Fisher's aodel attribute« the differences between the variables *
WC/
WM «nd (1-U) in estiaated elasticities to differences in the way expec-
tations are formulated about the two variables. Recall that Fisher assuaes
the coefficient of (1-U) is composed of two components: a pecuniary com-
ponent, reflected by the coefficient of W ^ «ad an "expectations"
61

Table 7
COMPARISON OF ESTIMATED ENLISTMENT SUPPLY PARAMETERS DERIVED USING ORIGINAL FISHER DATA BASE
Estimated coefficients (and t-statistlcs)
Fisuer (AER)a FISH Ab FISH BC FISH Cd
^Wt-i -.00709®
(-2.19)
-.00619®
(-2.02)
-.00706®
(-2.17)
-.00502®
(-2.27)
Än(l-A/P)t -.312f
(-7.61)
-.311f
(-7.56)
-.313f
(-7.54)
-.311f
(-7.57)
Zn(l-U)t_1 -.00891
(-.87)
-.01160
(-1.20)
-.00901
(-.89)
-.00881
(-.87)
R2 .90 .91 .90 .91
Durbln-Uatson Statistic .31 .28 .28 .29
aPeported in Klotz, op. cit.. p. 971.
w Wc and WM.
Computer from the sample, 3:57-4:65, using Fisher's estimate of i
I
'Same as FISH A, only sample is 4:57-4:65.
Same as FISH B, only WC/WM is estimated using nominal values of both
®t-statistic > |2.0|
t-statistic > 13.01
62

I [ Table 8
COMPARISON OF ELASTICITIES WITH RESPECT TO Ug/Ug AND (1-U) WITH AND
WITHOUT DRAFT AND OF THE PROPORTION OF ENLISTEES IN MENTAL
GROUPS 1-3 WHO WERE DRAFT MOTIVATED (FROM FISHER MODEL
USING ORIGINAL DATA BASE AND ALTERNATIVE SAMPLE PERIODS)
FlihS " * I (AER) FISH A FISH B FISH C
Elasticities (with draft)b
VWM (1-Ü)
Proportion draft aotivatedc
Elasticities (no draft)
WC/WM (1-U)
See Table 1 notes b, c, and d for explanation of these aodels.
Derived by dividing regression coefficient by (1+S.) * e, where
ß- is the regression coefficient of Ind-A/P and (I/P) and e is the
average enlistaent rste for the saaple period.
-.68 -.58 -.67 -.48
-.85 -1.10 -.86 -.84
.19 .19 .19 .19
-.83 -.71 -.82 -.59
-1.04 -1.35 -1.25 -1.03
'Derived froa the expression -rrg- (l/e)(I/P).
Derived by dividing the elasticities (with draft) by 1-D, where D is the proportion of total enlistees in Mental Groups 1-3 who are draft
■otivated.
63

coefficient which relates the conceptual variable, the probability of
eoploynent (p ) to the observable variable, (1-U).
Alternative explanations of the difference include the possible
effects of risk-aversion or timing. As noted earlier, the variable (1-U)
may be indexing the relative variability of expected returns to not enlist-
ing as veil as being a component of the expected value of these returns.
This should serve to strengthen the effect of (1-U) on enlistments if
potential enlistees tend to be risk-averse. In addition, it can be argued
that employment conditions affect the timing of the enlistment decision as
well as the decision whether or not to enlist. (That is, given a decision
to enlist based on long-run expectations, it is best to enlist when oppor-
tunities are not good.) If the variable (1-U) reflects a timing decision
as well as an enlistment choice decision, then its coefficient can be
expected to be greater than that of other pecuniary variables reflecting
only the enlistment choice decision.
Fisher derives his estimate of draft-motivated enlistments for the
coefficient of in(l-A/P). He makes the following assumptions:
A A A (a) in(l - —) ■ - — for — close to zero.
(b) *.|*i lD; p p p
Given (a) and (b), equation (1) can be rewritten:
M*% I 8o Sl > WC ^2 • ,, „x £3 I ^ \ (1) p ■ r*; * i^Zn ^ i^ '•n(1-ü) - rpq P * I^J
and the voluntary enlistment rate can be derived by subtracting
(ö-Zl^s-XI/P) fro« the observed E/P. Fisher reports a voluntary enlist-
ment rate 9l 0.0117. Given a total enlistnent rate of 0.0133, it can be
6,

' !:
estimated, as Fisher does, chat 24 percent of enlistees in Mental Cate-
gories 1-3 are draft motivated. However, an estimate of 19 percent based
on average values of enlistment and induction rates is derived at CRC.
The differences between GRC's estimates and Fisher's appears to be due to
Fisher's use of the third and fourth quarter of 1965 for his estimates of
I/P. These were quarters in which inductions were very high.
When reestinating the parameters of Fisher's enlistment supply func-
tion using his data base, the following assumptions are modified: (1) the
assumption of synmetry of enlistment response to equiproportionate changes
in W and W ; (2) the assumption of stability in the mean of the taste
distribution; and (3) the assumption of instantaneous supply adjustment.
The assumption of symmetry is tested by including as separate argu-
ments in the estimating equation the real values of W and W (in place of
the ratio, U /VLJ. This estimating equation is not strictly comparable to
the original Fisher estimating equation since Fisher uses the real value
of W and the nominal value of W .
A major factor that could have caused a change in the taste distribu-
tion is the perceived risk of death or injury associated with enlisting.
An event that occurred during Fisher's sample period that could have
changes this perception was the U.S.-Russian confrontation in late 1961-
early 1962 over the erection of the Berlin Wall. A duemy variable for
this period of tension, during which draft calls were increased dramat-
ically and 75,000 reservists were called to active duty, was added cc the
estimating equation to determine whether the conflict had any isdependen:
effect on enlistment behavior. Recall that both Fechter and Cook utilix«
this variable in their enlistment analvses.
65

The assumption of Instantaneous adjustment is tested by adopting a
distributed lag model of supply adjustment. This adjustment model was
used with some success by Fechter in his analysis of Army enlistments.
It assumes that the observed quarterly enlistment response to exogenous
changes in enlistment determinants only represents some fraction of the
long-run equilibrium response and that this fraction can be estimated by
adding the enlistment rate (E/P) lagged one quarter as an additional inde-
pendent argument to the enlistment function. Its estimated regression
coefficient can be used to derive estimates of the fraction of the observed
enlistment response that represents the long-run equilibrating response and
can also be used, together with the other estimated regression coefficients,
to estimate long-run response coefficients for the other Independent vari-
ables included in the estimating equation.
The parameters of the eight estimating equations representing the
various combinations and permutations of these assumptions are displayed
in Table 9. The results are disappointing. Relaxation of the symmetry
assumption consistently produces military pay coefficients with the "wrong"
sign (I.e., coefficients that differ in sign from what the theoretical
model predicts). While these models produce the theoretically expected
negative coefficients for civilian pay, these coefficients are only statis-
tically significant in the models which assume instantaneous adjustment.
Pay elasticities estimated from the significant coefficients are only
slightly larger than the pay elasticities estimated from comparable rela-
tive pay models. Recall, however, that the estimating equations (or the
absolute pay models 'equations 3 -<'3» are not strictly comparable to the
original fisher equation represented by equations (l)-(«). Equations 5)-
(S) are expressed la terms of the real values of '•„ aac • . wherea« equatlsns

I ..
r
>
a
m
u. o
i as in
s-
ii
It > tt
p z
i M -
si 3 «i
g % «4 U «I
u n <• O h >
£ 2
s
*i — i H
S 5
§
u
s 8 «
* o
KM <o » • • • • p4 i ml «n «^ «M »- I I
M Ii O »
an « — oö »i <• T
u 4 u r»
Si *• I
i i
S 3
«4 ** •
O O no
o «^ o
S 7
O «8 * —
o o T ?
■Am g «•> <n ao « «^
• O MO I T *»
O «^
<n « « o
II II
!«. » --30
e M «9 r« i i T
I
It 1
m w
1 • 2 s J
1 C • t w
1 •
S J
e -» IM »» , « 7 <>< r* e | o • • • • i •* ii i i , e
I J ' — « » >» B
O "" ^ rf»
■h M — O II il
O — •> ^ — o — » — r« OS
7 7 t t
4
9
» i
a s
I > — £
1 i = ii :
«
-: f ^ ■ it : — - M
i Z -
e « «
•7

(l)-(4) are expressed ir. ceras of Che noainal value of U . II
The consistently negative coefficient for W nay be due in part to the H
Lack of statistical variation in W over Fisher's sample period. It is
possible that the results with respect to W will be sensitive to a longer li
sampling period over which there will be enough statistical variation in W
to produce coefficients wich the theoretically expected signs.
The Berlin dxmmy is statistically significant in only one of the four
estimating equations in which it appears, suggesting that it was not an
important independent enlistment factor during this period. Not surpris-
ingly, therefore, it had little Impact on the parameters of the other
enlistment variables.
The coefficient of E/P lagged one quarter was statistically signifi-
cant with the theoretically expected positive value between zero and one
in all four estimating equations in which it appears. The magnitude of the
coefficients suggests an adjustment lag thac ranges from four to seven
quarters. The coefficient of E/P lagged on quarter is particularly sensi-
tive to the presence of serial correlation and can be a biased estimator
of the adjustment process on this account. Since the estimating equations
that assume Instantaneous adjustment display significant positive serial
correlation, these results should be treated with some caution. Introduc-
tion of the lagged enlistment rate also reduces the estimated effects of
the pav variables to the point where they are no longer statistically sig-
nificant and raises the estiaated Ions-run effect of inductions on enlist-
ments and the proportion of enlistees who were draf:-activated that is esti-
aated fros tnis long-run effect frou a range that varies bet'.'een 0.17 and
0.23 to a ran** that varies betveer
•>•

'-^y-fW'*--:-"-*- •- -v.«... .".■'— TJ
I I
The most satisfying results from a theoretical point of view are pro-
duced by the model using the original Fisher assumptions. This model pro-
duces statistically significant coefficients with the theoretically expected
signs for the relative pay and the accession rate variables. The assumption
of synmetrv Is not supported by the findings of equations (5)-(8); moreover,
the unsatisfactory findings with respect to the military pay variable con-
strain us to deriving Implications about the effects of military pay vari-
able from the coefficient of the civilian pay variables — which Is equiva-
lent to the assumption of symmetry that we are trying to relax In this
experiment — In which case, the equations embodying the original Fisher
assumption would seem more appealing.
The evidence from the Berlin dummy does not strongly support any shift
In the distribution of tastes for military service during the Berlin crisis.
And the addition of the variable E/P, lagged one quarter, while Increasing
the explanatory power of the estimating equations and reducing the degree of
positive serial correlation produced by these equations, also reduces the
estimated coefficients of the pay variables to the point where they are no
longer statistically significant.
The most satisfying results from the statistical point of view are
those produced by the assumption of a lagged supply adjustment. These
models produce uniforaly higher R-squares and uniformly lower degrees of
serial correlation.
None of the results described above alter two of the fundamental find-
ings of the original Fisher study: pay elasticities that are less than one
and statistically insignificant employment rate effects. However, the
assuar:ion of a lagged supply adjustment raises the estimated proportion
of enlistees who are draft-motivated from around .20 to around .35. The
latter estimates accord more closely to the findings based en survey data.
69

Next, Fisher's findings are benchmarked to those of the uniform data
base. Table 10 compares the regression coefficients derived using the
Fisher estimating equation and the Fisher data base over two sample periods:
the Fisher sample period (3:57-4:65) and the sample period of the conmon
base (2:58-4:65). Dropping 19S7 from the sample period raises the relative
pay elasticity from -0.68 to -0.99, an increase of almost 50 percent. Other-
wise, dropping these observations has little effect on the findings.
Table 4 also summarizes the results of experiments with the original
Fisher data base in which the original Fisher enlistment function is esti-
mated using alternative nonlinear functional forms. The relative pay
elasticity is also slightly sensitive to the choice of functional form.
Fisher's semi-log function produces the highest elasticity; estimates of
relative pay elasticity derived from the log linear and logit functions
are -0.75 and -0.70, respectively, roughly 15-20 percent below the -0.99
estimate generated from the semi-log function. The estimated proportion
of enlistees who are draft-motivated is also sensitive to choice of func-
tional form. Estimates generated by the log-linear and logit functions
range around 0.14, roughly 25 percent lower than the 0.19 estimated from
the semi-log function.
The semi-log function produces a slightly larger R" and a slightly
lower Ourbin-Uatson statistic. Indicating more positive serial correlation
than the log-linear and logit functions.
The findings from the Fisher data base may be siamarized as follows:
1. Relatively inelastic pay elasticities which are somewhat sensi-
tive to sample period and functional forms.
2. Relatively low cslis^tes of draft-motivated enlistments which
are quite sensitive to sample period and functional form.

-a «
a. H
ad
u
■
«N
e a o "O
— «
9 m > a. u •* O O 4i
£ i
a e
«I ! « »
o a« i
e — s .3 .,!•'
! SI? •-» a i
oo m »N o fM r> lO in • • • • o O O C
o 9> s S
a
>»«?-' w 3 ^ »K, CO 9« in u ac <c o» p«» - » . • • w w 1 1 i
re ; e
e v
I
K »n in in o 3
o 00
:N r»
^ (M o
1
— » O 00
Oi (^ ^ —
9« O ^i 3
.a
>r x 3s —
l 3 I
- O c in
— i i I M
8 1
w
i a
a x
o c s • • a M PM f~ « 32
c
» •* «* G
§ ■■pa • a « a fs SI • u <e at V • u a «^ 11 Q £ U
— a <xf3 3 a ^ 1 *i e b u — 90 « «1 X s u 3 a
•o . i 1 w i •-
1 w a 5 »•
< ai«— < —
i —: — -^
I
1 a >
I 9>
i
3 --» y . —
a a
- -
— S X
H a a & a a
v: — — u T X - -5
t —
> - It
a
a M
i
b ■o
2.
9»
a.
e
6 a i 2
i
"I

3. No evidence of a statistically significant eoploymenc rate
effect.
Results with Unlfons Data Base
The Fisher aodel parameters are reestlaated now using the quarterly
tlae series data base coaplled at GRC for th's study. The sensitivity of
these paraaeters Is Investigated for variation in the size of the sample
period, functional form, model assumptions, and estimates of variables.
The particular sample periods that are examined include the Kin et al.
sample (3:58-4:65), the Fechter sample (2:58-3:68), and the Cook sample
(1:59-2:67). There are three additional time series studies: one by
Withers, a quarterly time series for the years 1966-1973, one by Grissmer
and others using monthly time series data for the period 1970-1973, and
one by Grissmer using monthly time series data for the period 1970-1975.
The latter two time series studies are unique in that they estimate enlist-
ment functions for voluntary enlistees only. Separate enlistment functions
are estimated for 00D, Army and Air Force enlistments in order to compare
findings from Fisher's model with those of Fechter and Cook.
The theory of occupational choice used to generate our enlistment
supply functions suggests a non-linear functlona1 form. A number of func-
tional forms (including a linear function) have been used to estimate
enlistment supply equations. As part of this invest- r.tion, analyses are
made with the following types of functional form: log linear, semi-log,
and logic. We have seen that the choice of functional form has some
effect on ehe estimated proportion of enlistees who are draft-motivated.
Different functional forms may also produce different results when it
comes to forecasting accuracy — particularly in cases where the data in
the forecasting period go beyond ehe range of ehe data used to estimate
the original enlistment equation.
72

-•
The nose laportant factor Co consider la ezcetkdlat ehe Fisher seapl«
perlud is probably Che effects of the Viet Saa var. Earlier studies pro-
duced inconclusive evidence about the effect of this war on enlistment
behavior. Fechter Lound no effect on Aray enlistaents when he aeasured
the war in tents of casualties; Cook foima a significant negative effect
on Air Force enliscaencs when he aeasured the war as a z-jamv variable.
The iapact of the war on the Fisher results is evaluated in two
ways: (1) by including a Viet Saa war duaw variable in equations cat:-
aated over the larger saaple period; and • 2 by testing :-r instabilere
in the estimated enliscaent supply pariaeters between the period encoapa»-
slng the war and the reaainder of the saaple. Parameter instability will
be evaluated on the basis of the Chow test.)
»xthcvgh tie aodels that do not assuae syaaetric pay resoonse and
ins'-antaceous supply adjustment produce disappointing results when fit ta
the original Fisher data base, better results aay be obtained when a longer
saaple period is used. Therefore, these assuaptions are tested again using
. the new data base. In addition co the three assuaptiens tested earlier,
the assumption of no excess enlistment supply is gl&3 examined by follow-
ing Cook's model and including an enlistment quality variable as an addi-
tional argument to capture the potential effect of "creaming."
Finally, the effects of alternative methods of estimating draft
pressure, employment rates, and military pay on the estimated enlistment
supply parameters was Investigated. Recall that Fisher estimated draft
pressure In terms of the accession rate (1-A/P), a method that tends to
produce an upward bias In the estimated draft pressure coefficient because
of the inclusion of E/P as a sizable fraction of A/P.
73

Jm «iccnucive specificacion would cast the draft pressure variable
ia cervs of chs iaductioo race. 'Klotz sakes this arguattit in hi« comment
on Fisher's »tudr> * Uafortuaately. this fsrvulacion aay bias the aagnitudc
3: the draft pressure variable doteiuard »ecsusc jf the pcssible simultan-
eous determinstio« .f £.'? and I'?.
Fisher's peculiar treacaent si silitarr and civilian pay raises inter-
est inc ;uestions ibout aodel asstapci^ns with respect to these variables.
The silitanr is a onicue occupation in that it pars a coasiiershle jsount
oi Its wates in-eind aafi in :he ion si aedical ser/i^es. f jod anc .cdfinf.
Fisher values taesc in-kind benefits on :ne sasis oi allcwances «warded for
the purchase of f^od and quarters by trtose not living or. axlitary posts
and as « flat SZ52 per /ear for aedical services. 5y refusing to deflate
m^ he is iaplicitly 'and correctly» arguing that, on the one hand, in-kind
benefits ought to be inflated to account for tneir rising value tc the
enlistee while, or. the other hand, cash benefits ought to be deflated to
account for the erosion of their purchasing power. He estiaates that
roughly half of his estlaated W is cash and half is in-kind. Therefore,
Che need to inflate the value of in-kind benefits is just about offset by
the need to deflate the cash benefits, and the use of nominal (rather than
real) ailitary dollars is justified. His estimate of W , on the other
hand, is in real dollars.
The issue is how should one treat military pay. Fisher has implicitly
argued that, while one should include both cash and in-kind pay, one should
use different methods c», adjusting them for changes in purchasing power.
Cook implicitly argued that only cash pay mattered and that potential
enlistees evaluated In-kind benefits at a constant value over his sample
74
I period. (This vaiu« could, in . mciplc. be zero.) Fechter iaplici:lv
arguod that both cash and ia-kind pay vmrt ^aportant. and that sotr. fjra«
of par should be treated siailarlv. The results of experiments with Fisher's
original nodcl 'discussed earlier> indicate that the pay elasticities are
sensitive to how one treats silitary par. Recall that the pay elasticities
estimated fro« the ?isher estisating equatior is wtuc*. -oth silitary anc
civilian pay are treated siailarlv ware roughly one-third lower ttvan the
pav «lasticitv estimated asing aosiaal values ;f -v and real value af •_.
Estiaatcs :i enlistaent supply parameters derived from a gives esti-
nating equation over a caamor. sample period usisg Fisher's sriginal data
base are first rompared with those obtained usisf the data base prepared
at ZKC for this study. Fisher's data base consists of six variables —
enlistments, accessions, useaploymest rates, population, ailirary pav, sno
civilian pay. Detailed coaparisor.s between Fisher's estimates and csti-
aates generated for this study indicate that they approximate each ether
quite wall. The relative difference between them is rarely more than 3
percent. (For details of this comparison, see Appendix B.) This suggests
that there should be little difference between the estimated enlistment
supply parameters generated by the original Fisher data base and parameters
generated by the new data base. Table 11 compares these estimates. Qual-
itatively, the results are similar. The relative pay and the accession
rate parameters are both negative and statistically significant, while
the unemployment rate parameter Is positive, but statistically Insignifi-
cant. However, the point estimate of the relative pay elasticity derived
from the new data base is -0.8S, or roughly 15 percent lower in absolute
terms than the -0.99 generated by the original Fisher data base.
75
■

- ma
« 3
4
X
< ^ — t » g =■ c « > -* -.
^ — • • • *. 2 ^ mm
> M
k * v y. < < z = ^ X ■ H < -^ — — > w — < - * < z . r 9 ■ a z - 3 • •
If ^ r ) i
» — •• w w •
■ —
m f * — — S. ä b ^ ^ «* r- '*. • 9 -? — T < »* • • • ^
— < -? •* — ^ S i — ""
- s i» •• «n w W *-
< —• ■ • • ^ • •• 5 3 • — u. — ** • ^ r- Z . ■ 3 3 • ^ — ir. w« ~. M x -« •^ ^ r- > V ^^^ »> N ^y ^ »1 • ^ * N •^ C ^ • •^ £ 1 • • • •
< — «« ru c X c X r- r
^^ ^ ^0
£ 5 u 2 m — c^
3: — X ■1 u. u • «•• M
X c - i
$12 9C «1 - 4| X ■ ̂ u^ t*. *- X ^
ar* X x X (^ JN « £ 1 3 «T SO * (N
M M C • ■
V5 < "H y d <N 00 fM
5 2 .3 1 1 i^ 1 *■'' y^ 5 3 e •
M — •5 «s ^— U X
V C • C
as O • u CN r^
s z
b in i ■ • A A
Q J •• in ««t U u 35 CB -» M •PN •^ h- ■a i «M V u *J Qg b « l-l ■ M ^ in * A •H •H P^ ■-• .. (0 tt u 4-1
£ fl ^4 w H « !8 Q e «d 4J 4J Q •H K •o 0) U3 (0 s 00 (fl m 0) 1 1
0 •H «J 9 so M u U ■rt W (9 0) •• fl J2 'J
es 3
O -o z <» /-\ <*>
C iH cs Cd W ^^
76

:
StaadardtzUn for 3iffT«ttc«» xa Imp'.** MU 3;ffTtnc»« :a r.il:t*rT S<mc«
An Unresti(«ttoo of th« effects of ilfference« la «eayle fUTtti *ac
differeaces ;a the braich rf «em;c .»«4 «s tbe «kit ^f «malrsi» A :!M
performance of the Fi»her e«t:*«t:a( imtlm '.* anfte aext. i:»»6»xtisia%
for differences la perforaax^c i-e :; differences :a fimctlonnl fern jsed
as tae estmstiag equation is accjs^lisae« >* -us« * lofllnnar esciaatln«
equation, iecall the eaperlaents with fjnctlona: l;m ^sin« the arlglnal
rishcr lata hase produced silently lower ahaolut« valans .f tae tcta. «n-
llstannt clastlcltv of W."« sad silfatly iaaller estiaaces »f tne prtypcr-
tloa 9f *tantsl ^roup 3 enlistees wtac were draf t-«ot ivated. The sensitlritv
of the findings to our ailitarr ;avclvcaent la Viet XSB IS also investlgsted.
Effects ot Viet Sa«
The analysis of the impact of Viet Naa J-.I enlistment henavior consisted
of including 'D a immy variable fcr the ^nod of our ailltary mvrlvement
as an independent argument in the Flshev estimating equation; and (2) test-
ing the parameters of the original Fxsher estimating equation excluding
th« Viet Nam dummy) for structursl differences between the Viet Nam and
the non-Viet Nam periods of the sample.
Table 12 summarizes the findings. Viet Nam did not appear to be an
important factor in enlistment behavior for any of the services analysed
and for any of the samples. The estimated parameter of the Viet Nam dummy
is generally negative, implying that, other things equal, enlistments were
lower during the Viet Nam era. However, the coefficient is statistically a
significant In only one of the 12 cases examined. The Chow test for dif-
ferences In enlistment parameters between the pre-Vlet Nam sample and the
Viet Nam sample rejects the null hypothesis of no difference In only one
77

« • • • • > — —
••
5 - . < j - c = *-
i -. « ; >
•r v •
t
< 5
Z X < <
>i
> « « — ? — .- — _ — x
-~ — .* « — ^ <«— — — ■*-. i— ^ l£
I r < < • ^ >- Z Z
< >■
ß
:■
>
I
ö i ]
o
I
Q CO
j CO
S) ■ 0 JS a e u o
(fa ^ tu U
i 00
I 00
00 N
• • •• l I
00 9i u-l IT»
00 o
00
• • I
00 u-i
r« vD M
i cr>
I — « o > CM ft
- s A M
O <*
i •^ C0
ce a» « u X u
CO I
(0 X)
fM Ct «N iH OJ fl
78

iascaac« — for DCO eali»taeat» m :a« MS^I« perl** 2:SA«3:«4. Siac« :%*
««r grew xacre««uitlv ^tpopultr wich ta« ;*«»«{« of tva«. « L*rf«r vi«t
X*» MB^I« >«r:.-4 It likely to 7ro4uc* t:rra4«r fiAi^f* J: »cn^tmr«! ili-
f*r«ac«s :a «alitcant >Arj*c:crk
Effxe» gj ?*- Ilagtlcttigg
TAOIC I! »jiBftriz«« :ac ?«r «iA*tlcxti«« <stl»«t«c for ««ca of ta« ««r-
vic** uslat il:«rr-4t;v« »«a^.e ^«riods. !>.« cttlatttat €^«*t:oi for :s«
Arar (xv»t ttM b«st r*sulct. Ts« r«.«tiv« ^av 9*Tim»x.*f It ;^o«i»t€at.
a*t«civ«. AS pr*4i::«4 or :a« ao4«i. «nc «:«ci»ticaIlT •ifBlflcaat. irlth
C-valu«« la excess of -.Z. ?:;at estimate« of the rclsclv« ?«v tl—tlflfT
raag« between 1.1S and 1.33. !a contrast, tr.e «stiaatiac equation» for
DOO are »ore disappoiatiax- While the 300 estlaatiaf equation |ives coo-
fistcrtly negative relative pay paraaeters. they arc not ss stable as the
Amy elasticities. They are statistically significant In three of the
four saaple periods, but vlth t-value« ranging around 2.0. Point estimates
of the relative pay elasticity are considerably lower than chose estimated
for the Army, ranging between 0.19 an i 0.71. The Air force results are
oost disappointing. The relative pay parameter Is consistently positive,
contrary to theoretical expectations, and significantly positive in one
of the samples.
Based on the results described above, we conclude chat the relative
pay parameters of the enlistment supply function are very sensitive to
the particular service for which they are estimated. Moreover, while
there are other methodological differences between Fechter and Fisher, it
would appear that choice of service (i.e., DOD vs. Army) explains a large
9 fraction of the difference in their relative pay findings. On the other
79

ill ?*:u;i. u: z >u?
ATB? r.- >C »«r:ü .j«ff;:l*«: : - #* . jr CM # fti ««: : ~**.J* CM i:::i«at :-**.*«
::S«-.:tS •4 « *• — .5 s: .4 _ »•: - J. •
JrJi-^^S -IS* -..s ..: • • • • * - • -:.r
::M-):»4 ...:J4 -«.% :.:» 1. > -.:> ■
l:^-::*' -:.:9J • • * .:8 1 • - -. sr -:.*
I.
80

n r%äs4. »4l*Mm—t for try« at Mr»::« <!.«.. XO v*. kit Torzn vti«eis CM
10 itf<«r«nc« d«ciM>*n Flft**r «AC Cock is. th*U rtiizirt f*y :;s4:a4».* TM*
•v^U«»:t :a-»t :=* 4iff«r«ttc« >«tv««- f:fth«r «a4 Cook la Ktoif r«Uc:v« ?IT
fla4iac« an*«* irjm »ckM a«c^o«ological ilff«r«su*« :*:v««r: :h« cvc
*:-odi*«.
A ltk«lT r*Mco far :te «a«*ttsf«ctorT ?«r; jrm*act »f :a« Ftftter
»o4«l oa Air Fore« data 1« tu« *»toMption in FlsiMr's «nl;«tacsc *od«l oi
MO «xcess suf^lT »£ «lit:»«*, fhia Attumptix. is srabablr :«*«: t«nabl<
for :a« Air Fore«. i«c«ll :iuc Cook's «aliscMrae aodol differs :ra«
Fisher's la that it »skes explicit provision for cht «ffect •! raticniag
so «aliscscncs.
Another possible resson for the differeace betvten the Fisher sad the
Couk fiadiags is ehe differeace in their methods of estiaucing ailitanr
pay. Cook confines hiaself t3 oase pay only and coapltcely ignores aili-
tary pay received in kind, whereas Fisher includes in-kind pay in his
estlaace of allltary pay. Cook also foras his psy variables fro« a four-
year stream of incone, whereas Fisher uses a three-year stream. Since
Air Force enlistment contracts are usually four-year contracts. Cook's
method would be more appropriate for Air Force enlistments. In addition.
Cook's formulation of civilian pay accounts for changes in the age com-
position of enlistments. Finally, his estimates of both military and
civilian pay account for expectations about future levels of pay. Fisher1?
formulation ignores both age and expectations.
The causes of the difference among services in estimated relative
pay elasticities are further Illuminated by examining the results of abso-
lute pay models estimated for these services over the same time periods.
81

Sllitar» t.'~ civilian p*y ela«tiri:ic* «sti»*:ei trim t.^* rish«r aodel arc
tjHur.;«i la Table 1«. The military pmf 9l*»ticitf is c«—it—Kly nega-
tive, ccotrarv t- theoretical expectations, tor trs« Air Force ao>i MD: it
is al*o negative in tlM Aniv sample : or the pre-Viet Naa peruc. The
civilian pav elasticitT is conaistent1 • negative, as theoretically expected.
for the Arav; bu: it is con*i»:ently and significantly positiv«, contrarv
to theoretical expectations, for the Air Force. Ic is negative, never
scatisticailv significant, la two of the three «aaple periods for 3C€.
These result.« reveal that the major ieterainacts of the relative pav
results are a relatively well-behaved civi.ian pay variable and a poorly
performing ailitarv pay variable. These findings support the speculation
that the method used by Fisher to foraulate his pay variables may nave been
inadequate. This speculation is reinforced by the fact (discussed in sore
detail in later sections of this chapter) that both Fechter and Cook were
able to derive well-behaved and statistically significant ailitarv and
civilian pay elasticities from absolute pay models which they estimated
for the Army and the Air Force.
Effects on Employment Rate Elasticities
Table 15, Panel A, summarizes estimates of employment rate elasticities
by service for the sample periods of Fisher, Kim et al., Fechter, and C ok.
The results stand in marked contrast to the pay results. Unlike the pay
elasticities, the employment rate elasticities are about the same across
services, given the sample period and vary considerably across sample
periods for a given service.
The Fechter and the Cook samples generally produce satisfactory re-
sults. The elasticities have the correct sign in all the equations, with
S2

• I
i-"-l 6 • I
1 !
2
•T.
— «»
it £ > ** ■
> • — u
«i »» «
A
t
H <
■j
Cd
i?5 « CO < M
'* s o u
!
5^1
Sa m\ o -.
I
x <c
C I
I
7
»n I
«n I
a*
ac
CM
o
I r-t -H
m r^
o
A
O
n
in vo • •
l 00 «n • • CM
00
I 00 m • •
VO • • I
Ov m
2 r
83
A

absolute c-values that <xc««d 2>0 in tour of the six equations. Moreover.
the absolute value of the elasticity is greater than 2.0 in tour of the
six equations and is greater than }.Q m one ot these s^uatloM.
The Fisher and the Kim et al. sasples consistently produce unsatis-
factory results. The elasticity has the "wrong" sign in three of the six
equations and the absolute t-value never exceeds 0.6.
The results reflect the pattern of variation in uncaployaent rates
during the period 2:Sf-3:M. These rates ranged between 13 and 20 percent
fro« 2:58-2:65. They fell abruptly thereafter, ranging between 9 and 12
percent from 3:65-3:68. While auch of this decline can be attributed to
a surge in econonic actl^v.y ir. the late 1960*5 that reduced overall unea-
ploynent rates to rates below 4 percent, some of the decline could be
attributed to our military involvement in Viet Nam. Quarterly military
accessions, while never exceeding an annual rate of 500,000 prior to 1965,
jumped to an annual rate that ranged between 750,000 and 1 million from
3:65 to 4:66. The annual rate ranged between 500,000 and 1 million in
1967 and 1968. The effect on enlistments of this Increase in demand .would
be most pronounced in Che Fechter and the Cook sample periods.
This dramatic increase in Che demand for military manpower pulled
subscancial numbers of young men out of Che civilian labor force and could
have had an impact on unemployment races that was independent of Che impact
of Che expansion in business activity during this period. IC is likely,
however, that Che effecC of Che increase in demand for military manpower
was most pronounced on Che unemployment rates of males in the 20-24 year
old age group, the group that would be most affected by the draft.
84

In view at this, 1c Is possibi« that ch« ncgaciv« «sploywnc rate
ela«tlclty in Ch« Fechter and the C.ok seaples is »erely reflecting the
negative enlistaeat effect of the war. The sensitivity of the estimated
«■ployacnt rate elasticity to the presence of a Viet Naa d\amy variable in
the estiBating equation OR the grounds that the «aployvcnt rate variable
night be picking up scae of the enlistment effects of the war is examined
next. The results are sunmarized in Panel B of Table 15. The effect of
the Viet Nam dummy is to reduce the employmmt rate elasticities, espe-
cially for the Fechter and the Cook sanples. In these samples, the elas-
ticities continue to have the "correct" signs in five of the six equations,
but the absolute t-values no longer exceed 2.0 in any of the equations and
exceed 1.8 in only one equation.
Effects on Estimated Proportion Draft-Motivated
Estimates of the proportion of enlistees in Mental Categories 1-3 who
are draft-motivated for the Army, Air Force, and DOD In each of the sample
periods are suamarized in Table 16. The estimates are much lower than
comparable estimates reported in Table 11. The reason for the discrepancy
appears to be that Fisher used an induction rate that was substantially
larger than the average to compute his estimate. Fisher does not report
the value of the induction rate he used, but his estimate of the voluntary
enlistment rate is consistent with an Induction rate of approximately 0.0147.
The mean Induction rate for these quarters is 0.0137, calculated from the
common data base compiled for this study. The mear induction rate for the
period 2:58-4:65 calculated from the common data base is 0.00626.
The estimates do not vary much across services for a given sample
period. DOD generally has the largest proportion of draft-motivated en-
listees and the Air Force usually has the lowest proportion. A notable
85

Table 13
ESTir^TES OF DTLOYMEST RATI EUSTICITIES DERIVED FROM FISHER EXLIST?ffXT MODEL FOR ARMY. AIR PCRCE AND DOD EJO-ISTMENTS
Staple Arsv Air Force DOD Period Coefficient t-value Coefficient t-value Coefficient; t-value
Panel A (No Vietnam)
2:58-*:t)5 -.26 m i .70 .3 .58 .6
3:5d-4:6S -.©* -.6 -.42 *> •• <■ .15 .2
2:58-3:68 -.89 -1.6 -2.13 -1.4 -1.34* -2.2
l:59-2;67 -2.01* -2.5 -3.4* -2.0 -2.05* -2.7
Panel 3 (Vietnaa)
2:58-4:65 -.29 -.3 .48 .2 .66 .7
3:58-4:63 -.66 -.6 -.63 -.3 .23 .2
2:58-3:68 -.55 -.7 .96 .5 -.31 -.4
1:59-2:67 -1 .76 -1.8 -1.44 7 -1.32 -1.5
t-statistic > '2.0.
86

\0
J3 cd H
co
w
i
§1 ■H
0
0]
> 1
4-1
• 1 lU 01 0 0
o IM o
•H
c 0
—1
I-1
0
51 H
CU
0) 3 '-,
CO >
1 ■u
• 0) 0
<
c 0
0 CM
t-1
p-
(U 3
•-, fll > 1
«i U-l
QJ 0 O
0
H a, 0)
a to|
U fl
in u-i v£l 00 <u r-i iH rH rH c • • fc • •H
iH 1 00 0
rH
\0 O <r O 01 • • ■ » J2
1 1 1 00
1 U
u ja ja J3 £
p«. a\ 00 ITI T3 • • • • ai «^ m Ov sr > 1
CM 1
H 1
CM 1
•H U ai
0) C ON 1—1 CN 0 « O i-t rH CM • • •
•0 0O CM CM m 0) • • ■ • 4J rH
1 CM
1 CM
1 1 CO >
o 00 -a- • • sr r^ H CM
I I
fl C") 10 vO
co ID M
I 1 I I
X. JZ & A a> ON CM o
• • • • ON O 00 rH iH CM rH CM
I I I I
SO vO
sr 1
00 1
00 u-i
00
■ •
CO I
00 m
CM I
ON U-I
CM f>
d
(U h cO ••
O H s: a se
CO o a) u-i
4J OC en c
•H -H H 3 C 0 9) iH
iH >H O O IM
0 i
u 00 o c a-H 0 si »- 3
fl IH 0 0 -H
4J cn co 0) 3 u o* n o)
CO c o
c •H c o c
c CO
0) rH
CO E u OJ a
cn e o
•H 4J U 3
•a c
1
c
c
0) o u
c o
o CM
I 3 o
rH at
a 4) >
•H 90
0)
CO 3 a ca o "O a o
(U 00 CO
c o 4J CO
CO c o
3 4J •H U CO c
•H c o c
c CO
(U
s
(CO I
a 1
co 01 < a 0) u 00 a> IM
o CM
I r-
•H 00 u C CO -H U 4J
CO ca B
•H U 99 0)
<ca IH
<0Q
Q 0) u
3
1) a.
a ■ CO cn
c 01
01
0)
M O
S < (0 V- H
a •o c
cn co c O <-H
•H ■J) UH CO « o o CO
CO 90 I !0
c a
3 a 0 a
0 ^^ ^ ^ CM sr < CO r» r- >T u^
cn 1 r^ r>» r* r^ 01 H ON ON ON ON 3 ^-^ • • • • CO >
c CO 0) S <-Hi
01
cn 0) u CO E
vO in «* ON — «SJ rH O CM 0 O NO VO 00 c^ • 8§8§ CO CM
• • • • A A
O O
cn u
00
-3- -a- CO CM
00
• • 00 in
• ■
CO m ••
ON u-i
cn co
CM CO CM rH
Cf I u
I
87

exception is the Cook sample period, during which the Air Force had the
largest prooportion. A possible reason for the pattern observed in Table
16 is spurious correlation. Enlistments in Mental Categories 1-3 constitute
a part of total accessions, the variable used by Fisher to index draft pres-
sure. Consequently, there should be spurious negative correlation between
the enlistment rate and the complement of the accession rate tending to
bias the regression coefficient toward -1. Moreover, the larger enlistments
are as a fraction of accessions, the more serious this spurious correlation
will be. Thus, one would expect to find more negative spurious correlation
for DOD enlistments than for specific service enlistments. The findings
in Table 16 are consistent with the presence of such spurious correlation.
There also does not appear to be much variability in the estimates
over sample periods for a given service. The results from the Fechter and
the Cook sample periods consistently produce larger estimates that the
Fisher or the Kim et al. samples. This is especially notable for the Air
Force. There are a number of possible reasons for this finding. First,
as indicated in the footnote to Table 16, induction rates were higher dur-
ing the Fechter and the Cook sample periods. Indeed, if one controlled
for differences in induction rates, one would find practically no dif-
ferences among sample periods for the Army and for DOD. Second, there
was relatively less variability in the accession rate statistic during the
Fisher and the Kim et al. sample periods. Lack of variability could have
had the effect of biasing the estimated enlistment effect toward zero.
The results are not generally sensitive to inclusion of a Viet Nam
variable. Including a Viet Nam variable raises the estimated proportion
88

'l ■
4» slightly for the Army and for DOD; it has a more substantial effect on the
estimated proportion for the Air Force. The results for ehe Air Force are
summarized below:
Sample Period No Viet Nam Viet Nam
2:58-4:65 .09 .12
3;58-4:65 .11 .14
2:58-3:68 .12 .22
1:59-2:67 .20 .25
The results in Table 10 suggest that the draft had a relatively small
impact on enlistments much smaller than the impact suggested by the surveys.
A number of reasons can be offered to explain this finding. Among them is
the possibility that the parameters of the estimating equation are captur-
ing short-run effects. The existence of lags in enlistment response would
mean that long-run effects would be larger. The findings reported above
in Table 3 for estimating equations which assume a distributed lag partial
adjustment are consistent with this explanation. Estimates of the long-run
enlistment impact of the draft are roughly twice the estimates of the short-
run impact. An additional reason for expecting low estimates of the effects
of the draft on enlistments is the possibility of simultaneous equations
bias. This possibility was discussed earlier in Chapter II and was con-
sidered to be a highly unlikely prospect. A final reason, suggested by
Klotz, is that the seasonal dummy variable may be picking up some of the
effect of the accession rate variable (which has a strong seasonal compo-
nent).
Effects of Differences in Estimates of Draft Probability
Recall that there are differences between Fisher and others in the
method used to estimate the effects of the draft. Fisher assumes that the
89

appropriate theoretical variable is the probability of remaining a civil-
ian, p . His model has p operate through the expected pecuniary return
to not enlisting:
wj - pcwc + (i - pc)wM
where W is the expected pecuniary return to enlisting in the absence of w
a draft and Ww is expected first-term military pay. Fisher approximates
p by using the complement of the military accession rate, (1-A/P). As
we have noted, this estimate should tend to bias the regression coefficient
of (1-A/P) toward -1 because the enlistment rate is part of the accession
rate. Moreover, this bias should be more pronounced in circumstances where
E/P represents a large fraction of A/P, such as in the case of DOD acces-
sions.
Other studies have approximated p by using the induction rate I/P
directly. As we have noted, this could bias the regression coefficient
toward zero if Inductions are not truly exogenous. Toikka has demonstrated
that these two methods of measuring draft pressure represent two alterna-
12 tive assumptions about the length of the military planning horizon.
Using (1-A/P) assumes that military planners target their inductions to
meet accession requirements over a one period planning horizon; using
(1-I/P) assumes that military planners target their inductions to meet
accession requirements over a very long planning horizon.
GRC investigates the effects of alternative methods of approximating
p by substituting (1-I/P) for (1-A/P) in Fisher's estimating equation.
Table 17 summarizes these findings. Panel A describes the regression
coefficients and t-values derived from the modified estimating equation;
90

0) iH
< O
1
3
n > u
u C 01
•H U
•H
O 0 o
0) Ü u & u
•H <
3
> 1 u
u C V
•H u
•H
<4-l
c
<
3 iH
> i
4J
c 0)
u •H U-l «u 01 0 O
o
V rH a B C3
W
CM a» N
I I
o u a to m c>4 • • • m <H o CM PJ PO
l l l
<N
I I CNJ
r-» oo U1 • • •
CM 1 i 1
a u • •
ON fM rH fS
I I
O in
oo CM
I
in oo vO
>T ■ CM
■ 1 oo m • •
1 oo m • •
1
m ••
•a
5
u n
c o
■H
§i
Pu
M
rH >
«M <M
CT> r^ r-l NO m CM 1 1 •• O rH pg CM m r>* 00 3 • • • • •
1 «
wo lo
belo
0 m vO 00 NO -T ON u no t-H rH rH r^ m NO 01 u
■ • * •
ja
• • 1
rom the
descrlb
c 0)
■H u
•H IM HH
■J-l sO oo r^ ON CM «H 0) rH rH r-t vO rH m CO o
« • • • • • 1
derived
e formul a
•H « 01 01
•
rH o vO fNj NO 0) JZ M •a rH CM m CM rH u u 00 • • •
rH •
DM) a
sing
«
0) M
■a
rH in O en r^ NO "«-' 3 |<H u O o fsj NO rH rH <^H 1 § • • • • • •a u |H
rH
tlvate
ting p •
•H 1
•H U
1)
0) ON CM o M iH ON 00 0 CO rH J: o rH CM OJ m CM CM e E ^w* u • •
u •H O tH U CO «
• • rH
•
e draft
of estl <ai
ii
M
en •H
/—s •H
1 rH
a\ ~» ON rH rH sf o U CO •*-/ o rH r-l Uu r» n m CO "O • • «a • • • • • • o ^^
>N rH rH rH 0 -c & T3 CO 1 1 1 £ « C
PH a V o S|
HH
1 to
cs oo vO 01 ON CM r» co rH * • H rH rH > f) fl sf <U 0) »w o c • •
4-1
CO rH
Si
• i-H
U
■
rH 1
y
• rH
1
U enllste
emativ
0 IM
rH
0) rH .o <0
H
00 ■H cn
£ 00 c
en m vO CM oo o> u <« o rH rH rH n rH CM t*H rH «•H 1 c s • • • • • • 0 CO rH IH
rH rH 1
i-H 1
ates of the proportion
mating equations using •
/-v CO
1 rH
<<n
r ^^ Pu
<
•a 0) c
•H IM 0 •a 0) M CO
< CO
CO
(•H
o • «M
A
U •H U W
•H
o • «n
A
o •H
cn •H
=
4J c 0)
•H
u •H <4H <*H
a o o
g ■H
CO
1 ^N 4J 4J cn J "H iH CO CO CO 0)
■H 4J N-X 1 • u 4J )H
m OO r» m 00 ^. LJ CO i-H ^ en tn 03 v£ SO vO ■ ^ NO NO <0 0) U •N-^ CU I I tl • • • • •• u • • * • u o cea u 4J cd
i 1 CM
1 rH «a-
I I CM
1 CO u
•8 (K
« rH
1 x> O "O
oo 0^ ON 0) oo oo ON 01 Vi rH
m m m c m m m < c 0) >—' ■ • • • • • (0 •• • • • • •H £ C
CM CM rH PH CM CM rH tH » o<
91

Panel B compares estimates of the proportion of enlistees who are draft-
motivated derived from the Fisher model to comparable estimates generated
by the coefficients described in Panel A. Panel C compares estimates of
relative pay elasticities derived from the estimating equations summarized
in Panel B.
The t-values in Panel A are substantially lower in absolute value
than the t-values reported in Table 16. In part, this reflects the re-
moval of E/P from the estimating draft pressure variable in Table 11 and
the consequent reduction in built-in spurious correlation.
Estimates of the proportion of enlistees who are draft-motivated are
fairly similar to those found in Table 16 except for the Air Force, where
use of (1-I/P) reduces this proportion to levels where they are no longer
statistically significant for the Fisher and Fechter samples. The Air
Force results may be reflecting the existence of quotas which are biasing
the estimated regression coefficients toward zero. Panel B also indicates
that the results are not particularly sensitive to inclusion of a Viet Nam
dummy variable.
Panel C describes the sensitivity of the relative pay elasticities
to methods of estimating draft pressure and to Viet Nam. Use of (1-I/P)
raises the absolute value of the pay elasticities slightly for the Army
and for DOD; it makes the elasticity less positive for the Air Force,
which is moving it in the "right" direction. Adding the Viet Nam dummy
variable has little Impact on these elasticities except for the Fisher
sample, where it raises the absolute values of the Army and DOD pay
elasticities by 66 percent tor DOD and by 23 percent for the Army. It
is interesting to note that the combined effect of using I/P to estimate
92

T.„-"»^ ■-••■- xy&Qmai n
I
draft pressure and accounting for Viet Nan by means of a dummy variable
Is to raise Fisher's estimate of the DOD relative pay elasticity by almost
100 percent.
The Effects of Alternative Methods of Measuring Military Pay
In replicating Fisher's original findings, it was observed that Fisher's
relative pay variable was estimated as the ratio of the real value of W
to the nominal value of l-T.. Further, the relative pay elasticity estimated M
using Fisher's relative pay variable was found to be roughly 25 percent
lower in absolute terms than the relative pay elasticity estimated from a
relative pay measure which treats W and W« consistently. Since the time
series studies that do not use the Fisher data base (i.e., Fechter, Cook,
Withers, Grissmer et al., and Grissmer) use the latter measure of relative
pay, we now report on findings derived from the Fisher estimating equation
modified so that the latter relative pay measure is substituted for the
Fisher relative pay measure.
Table 18 summarizes the effects of this substitution on estimated
relative pay elasticities by service over differing sample periods for
alternative measures of draft pressure and alternative assumptions about a
l1 Viet Nam effect. The results are by and large similar to those reported
in TablelS; the Army consistently shows the "best" results (i.e., coef-
ficients that have the "correct" sign and t-values in excess of 3.0). The
Air Force consistently displays the "worst" results (i.e., coefficients
that have the "wrong" sign). And the DOD results, which reflect both the
Army and the Air Force results, tend to fall between the Army results and
the Air Force results.
93

Table 18
EiTECTS OF USING REAL It- ON RELATIVE PAY ELASTICITIES FOR
ALTERNATIVE MEASURES OF DRAFT PRESSURE AND ALTERNATIVE
ASSUMPTIONS ABOUT A VIET NAM EFFECT FOR ARMY,
AIR FORCE, AND DOD ENLISTMENTS
Army Air Force DOD
Sample Period Nominal WM
Real WM
Nominal WM
Real WM
Nominal WM
Real WM
Panel A, A/P
No Viet Nam Effect
2:58-4:65 -1.32a -.96a .51 .31 -.67b -.50b
2:58-3:68 -1.18a -.94a 1.29 .34 -.19 -.40
1:59-2:67 -1.29a -1.03a .28 -.02 -.52 -.56b
Viet Nam Effect
2:58-4:65 -1.29a -.92a .89 .51 -.82b -.59b
2:58-3:68 -1.16a -.96a .79 .81 -.11 -.56
1:59-2:67 -1.26a -1.06a .51 .27 -.42 -.49b
Panel B, I/P
No Viet Nam Effect
2:58-4:65 -1.39a -.97a .63 .36 -.76 -.60b
2:58-3:68 -1.32 -1.07a 1.17 .31 -.34 -.52
1:59-2:67 -1.47a -1.22a .16 -.14 -.69 -.74b
at-statlstic > | 3.0|
t-statlstlc > | 2.0|
94

The models which measure draft pressure in terms of I/P and which
assume a Viet Nam effect consistently produce the largest estimates of the
relative pay elasticity (in absolute terms). Neither factor, i.e., either
using I/P or accounting for Viet Nam, has an independent effect; it is
their joint effect that increases the relative pay elasticities.
Again, the original Fechter finding of an Army relative pay elasticity
of 0.87 may be compared to the Army relative pay elasticity of 1.16 reported
in Table 18. Similarly, the original Cook finding of an Air Force rela-
tive pay elasticity of 2.23 may be compared to the -0.16 reported in Table
18. These comparisons reinforce the earlier conclusion that the Fisher
model is probably not appropriate for explaining Air Force enlistment
behavior because it fails to account for the existence of excess supply
of applicants to the Air Force and because it is deficient in its method
of estimating the military and civilian pay variables.
THE KLOTZ STUDY
Klotz modified Fisher's estimating equation (equation (1)) by dropping
the seasonal dummy variables and reestimating the enlistment supply param-
eters. He argues that seasonal dummies do not belong in the estimating
equation because they obscure the effects of the draft pressure surrogate,
(1-A/P), which he claims has a strong seasonal component. Although
Klotz does not make it, a similar argument could have been made for the
effects of the employment rate variable which, it can be argued, also has
a strong seasonal component.
Klotz claims to fit his modification of Fisher's estimating equation
to Fisher's estimates of variables using Fisher's data base and reports
that excluding the seasonal dummies raises the estimated impact of the
95

draft pressure and the employment rate variables (Table 1). He further
reports that dropping the seasonal dummies has no effect on the estimated
relative pay coefficient. Finally, he reports that omitting the seasonal
dummies reduces the explanatory power of the estimating equation (from an
2 2 R of 0.9 to an R of 0.7) and eliminates serial correlation from the
residuals. Table 19 summarizes these differences.
Klotz reports estimates of relative pay elasticities with respect to
voluntary enlistments of -1.11 with seasonal dummies, and -1.44 excluding
seasonal dummies. The former estimate is based on the parameters of
Fisher's estimating equation (see Table 7), but is considerably higher
than the estimate of -0.74 reported by Fisher. This is because Klotz
estimates the adjustment factor for the draft differently than Fisher.
S3 Recall that Fisher derives his adjustment factor as (rrs )» where 6- is
the coefficient of the draft surrogate, 2,n(l-A/P). This adjustment factor
18 can be interpreted as the marginal effect of inductions on enlistments.
19 Using the parameters reported in Table 7, Klotz reports a value of .4394.
To derive voluntary enlistments, one subtracts .4394 • I/P, or .0065, from
the total enlistment rate of 0.015 reported by Klotz, giving a voluntary
20 enlistment rate of .0084. Dividing this voluntary rate into the struc-
tural estimate of the relative pay variab]» reported by Klotz, -0.01,
produces an estimated elasticity of 1.13; Klotz reports an estimated
elasticity of 1.11. The difference bef-^en GRC estimates and Klotz's
appears to be due to rounding. As noted earlier, the difference between
Fisher and Klotz in their reported estimates of relative pay elasticities
is due to Fisher's erroneous method of deriving his elasticity for volun-
tary enlistments. Although he does not state his method explicitly, we
96

•mm mvwu
• >
Table 19
COMPARISON OF ESTIMATED ENLISTMENT SUPPLY PARAMETERS REPORTED BY FISHER AND KLOTZ
Estimated Coefficient (t-statistic in parentheses) Fisher Klotz
^Wt-i
Jlnd-A/P),
Und-U) t-1
Durbin-Watson Statistic
-7.09 -7.0
(-2.19) (-1.4)
312. -444.
(-7.61) (-7.40)
-8.91 -17.
(-.87) (-1.89)
.90 .70
.31 2.14
97

see that he estimated his voluntary enlistTnent elasticity by simply divid-
ing his total enlistment elasticity, -0.46, by .62, the estimated propor-
21 tion of enlistees who are true volunteers derived from a 1964 DOD survey.
In addition, he should have adjusted his reduced form coefficient of
Jln(W /W..} n by the factor , .0 to derive an estimate of the structural C M t-i i+P-,
coefficient of Ä.n(W„/W„)k -, • C M t-1
To summarize Klotz's empirical contribution, by excluding seasonal
variables from his estimating equation. Klotz allows all seasonal factors
to be captured by the included variables with large seasonal components,
Än(l-A/P) and Jin(l-U) ,. The result is a dramatic increase in the abso-
lute size and statistical significance of the reduced form coefficients
of these variables. Moreover, the larger absolute value of the reduced
form parameters of Jin(l-A/P) results in further increases in the volun-
tary enlistment rate elasticities of (W /W ) and (1-U) that are independent
of any changes that might have been produced in their reduced form coef-
ficients.
Results with Original Data Base
The Klotz experime-it is replicated using the same data base used in
replicating Fisher's results. Since Fisher's reported findings could be
duplicated with this data base, there should be no reason why one should
not be able to duplicate Klotz's findings. Unfortunately, simply dropping
the seasonal dummies from the estimating equation summarized in Table 7 as
FISH B does not produce the same results reported by Klotz. Therefore,
an experiment with alternative samples allows one to come closest to
reproducing Klotz's results when using the sample period 2:58-4:65.
Results of these experiments are summarized in Table 20 as KLOTZ A and
98

Table 20
COMPARISON OF ENLISTMENT SUPPLY PARAMETERS DERIVED FROM KLOTZ MODEL USING ORIGINAL DATA BASE AND ALTERNATIVE SAMPLE PERIODS
Estimated Coefficient (t-statistic in parentheses)
Klotz (AER)a KLOTZ AD KLOTZ Bc KLOTZ"!?
n(WC/WM)t-l
n(l-A/P)
n(l-U) t-1
Durbin-Watson Statistic
-7.0 -4.996 -7.054 -5.332
(-1.4) (-0.9) (-1.2) (-1.2)
444.e -452.e -450.e -449.e
(-7.4) (-7.7) (-7.3) (-7.3)
-17. -22.9 -17.2 -16.3
(-1.9) (-1.9) (-1.2) (-1.1)
.70 .69 .68 .68
2.14 2.05 2.05 2.08
tleported in Klotz, op. cit., p. 971.
Computed from the sample 4:57-4:65 using Fisher's estimate of W^/W , CSame as KLOTZ A, only sample is 2:58-4:65.
Same as KLOTZ B, only W /W is estimated using nominal values for both W„ and W„.
L M et-statistic > I 3.0!
99

KLOTZ B. This table also summarizes the results of an experiment in which
the seasonals are dropped from the results summarized in Table 7 as FISH C
(i.e., the estimating equation in which both W„ and W_ are measured in M C
nominal terms). These results are described as KLOTZ C.
Qualitatively, the results are about the same as the reported results.
Dropping the seasonal dummies increases the absolute values of the coef-
ficients of J,n(l-A/P) and J-nCl-U)^. However, in KLOTZ B the coefficient
of lln(l-U) , is one-third larger (in absolute value than that reported by
Klotz, while the coefficient of Jln(W_/W.,) . is almost one-third lower (in L M t—i
absolute value). In KLOTZ C, the coefficients are about the same as those
reported by Klotz, but the t-statistic for the coefficient of Zn(l-U) ,
is -1.2 compared to the -1.9 reported by Klotz. As in FISHC, the coef-
ficient of Ä.n(W_/W,.) . is notable lower in absolute terms when military L n t—i
and civilian pay are both measured in nominal terms. The coefficient falls
from -7.054 in KLOTZ B to -5.332 in KLOTZ C. The explanatory power of the
2 estimating equations hover near »n R of 0.7 and there is no significant
serial correlation in the residuals.
These results alter the findings with respect to the effects of the
draft and of (1-U) on enlistment behavior (Table 21>. Estimates of the
proportion of enlistees in Mental Groups 1-3 who were draft-motivated
hover around one-;hird, much closer to the 39 percc it derived from the
1964 DOD survey. Estimates of the elasticity of (1-U) both with and with-
out a draft exceed unity by substantial margins. Finally, the smaller
proportion of voluntary enlistees tends to further increase the voluntary
supply elasticities of W /W^ and (1-U) relative to those derived from the
Fisher estimating equation.
100

*
«
I
Table 21
COMPARISON OF ENLISTMENT SUPPLY ELASTICITIES WITH AND WITHOUT A DRAFT AND PROPORTION OF ENLISTEES IN MENTAL GROUPS 1-3 WHO WERE DRAFT
MOTIVATED DERIVED FROM KLOTZ MODEL USING ORIGINAL DATA BASE AND ALTERNATIVE SAMPLE PERIODS
Klotz (AER) KLOTZ A KLOTZ B KLOTZ C
Elasticities (with draft)3
WC/WM -.82 -.60 -.83 -.63
1-Ü -1.99 -2.73 -2.03 -1.92
Proportion draft motivated .33 .34 .33 .33
Elasticities (without draft)c
WC/WM -1.22 -.91 -1.24 -.94
1-U -2.97 -4.14 -3.03 -2.87
Estimated from the fo Ho wing formula:
Ei l+ß3 5" '
where: e. ■ total enlistment elasticity of the ith variable; 8. ■
regression coefficient of ith variable; 3^ ■ regression coefficient of
Jln(l-A/P) ; e ■ average enlistment rate for the sample period.
b Estimated from the formula:
ß3 T D ■ —=- • ■=• '
1+B3 V
where: T ■ average induction rate for the sample period; D ■ propor- tion of enlistees in Mental Groups 1-3 who are draft motivated.
c Estimated from the formula:
V ■ —=— • e 1 1-D i
where: V ■ voluntary enlistment elasticity of ith variable.
101

While the magnitude of the parameters summarized In Table 21 are more
In accord with a priori reasoning and with evidence derived from related
sources, the larger degree of Imprecision of the parameters of the Klotz
estimating equation (signified by their low t-values) Is disappointing and
may be reflecting the lack of statistical variation In W../W_ and (1-U)
discussed earlier In this chapter.
102

\
FOOTNOTES. CHAPTER IV
1. See Kim et al., pp. 196-197, for details of how this variable was estimated.
2. Ibid., pp. 187-198 for details of the estimating procedure.
3. Presumably, this includes inductees and enlistees in Mental Group 4.
4. Assumed to have the standard stochastic properties.
5. For elaboration of the adjustment model and how one dervies these estimates, see Fechter, op. cit., pp. 5-6.
6. The accession rate was unusually high during the period of the Berlin crisis because of unusually high draft calls. Thus, the major enlistment effect of this crisis appears to have been the increase in draft-motivated enlistments prompted by the higher draft calls.
7. The Viet Nam period is assumed to begin in 3:65, the quarter that the United States Congress passed the Tonkin Gulf resolution.
8. Results derived from the absolute pay models of enlistment behavior are somewhat different from those summarized in Table 6 for relative pay models. The estimated coefficient of the Viet Nam dummy is consistently positive, but never statistically significant.
9. Fechter*s comparable Army relative pay elasticity with a draft was .87. However, Fechter's estimate is derived from a model comparable to FISH C in which both military and civilian pay are both estimated in real (or nominal) dollars. Recall that the relative pay elas- ticity estimated from FISH B was about 41.1 percent larger in abso- lute terms than the relative pay elasticity estimated from FISH C. Adjusting Fechter's relative pay elasticity to reflect this dif- ference produces a comparable elasticity of 1.23.
10. Recall that Cook's Air Force relative pay elasticity was 2.23.
11. The Cook results for absolute pay models were not reported in the original Cook study. They were found in unpublished tabulations of regression results that were provided by Cook. The author is indebted to him for his generosity and assistance.
12. Richard S. Toikka, "A Note on Estimating the Fisher Model of Mili- tary Enlistments," unpublished manuscript, undated.
13. Similar experiments were performed using absolute pay models but the results were essentially the same as those summarized in Table 7; the military pay variable had a significantly negative coef- ficient, contrary to theoretical expectations, in all the equa- tions that were fit.
103

14. The simple correlations between £n(l-A/P) and the seasonal duntmles for the period 4:57-4:65 were statistically significant.
15. The simple correlations between £n(l-U) and the seasonal dummies for the period 4:57-4:65 were statistically significant.
16. Klotz, op. cit., p. 972.
17. Fisher, op. cit., p. 249.
18. See supra, equation 1'.
19. Klotz, op. cit., p. 972, especially footnote 6.
20. It is assumed in this exercise that I equals .0147.
21. Fisher, op. cit., p. 249.
104

*l^» „ j, ■ • ' ' ""- ■■ «»«wr
::
Chapter V
POOLED TIME-SERIES CROSS-SECTIONAL ANALYSIS
by
Dorothy Amey and
Dale Mldlam
PURPOSE AND SCOPE OF THE ANALYSIS
The focus of this chapter Is on combined time series and cross-
sectional models for estimating the supply levels of Army and Navy vol-
unteers. The strength of the models being tested rests in their ability
to adequately account for the variance in enlistment patterns across the
nine census regions and variance due to longitudinal changes in the enlist-
ment data. The major purpose of this analysis, however, is to determine
the rates of change in the supply parameters given an effective pooled
time serie;; cross-sectional model for different quality enlistment groups.
The models tested by regression analysis fall into two main categor-
ies: (1) strictly linear nudeis and (2) log-linear models. The general
form of the models is given below.
(1) Ei - X^i . 1-1. 2, ..., 9
where:
E. is a 5 x 1 vector representing the number of enlistees in region
1 during the five years 1970-1974.
X, is a 5 x K matrix of K independent variables in the analysis per-
taining to region 1.
a is a K x 1 vector representing the coefficients of the independt i t
variables.
e. is an error term (5 x 1) for the equation representing regional
variation from the linear fit
105

It should be noted that the general form of the model assumes a test
of the hypothesis of constant slopes and intercepts in the regressions.
This means that with a single set of coefficients a supply parameter
estimates will be made for each region. Hence regional variance exhibited
by e. becomes extremely important in determining the adequacy of a model
for use in regional forecasting. It is also Important that the models
tested contain as many as possible of the independent variable« which
r-y be significant variates in each region's enlistment pattern.
The set of variables used in the study are presented and explained in
detail in Appendix C. Brief descriptions of these variables are given
below.
o E/QMA ■ the ratio of 17-21 year old male volunteer enlistees to a
branch of service to the number of 17-21 year old qualified military avail-
ables as the dependent variable.
o PAYR > the ratio of average military pay and benefits to average
civilian income for 17-21 year old males working full-time the year round.
o UND1P ■ the unempJ.oyttent rate for 17-21 year old males who were in
the full-time labor forca,
o ADV - the amount of money spent in print media advertising and
related advertising funds.
o REC/QMA - the ratio of recruiters assigned by a branch of service
to the number of 17-21 year old qualified military availables.
o PROB ■ the proportion of 17-21 year old black military availables
to the total number of 17-21 year old military availables.
106

I
The necessary tests of significance for all of these variables to be
Included In the original model were performed in studies performed prior
to this analysis. Equation (1) could therefore be written in the follow-
ing manner for strictly linear models:
(2) (E/QMA)i - a0 + a PAY^ + O^UNEJfl^ + c^ADVj, + o^CREC/QMA^
+ a-PROBj^ + e^ i 1 - 1, 2 9
The volunteer enlistee groups studied in this analysis were lir !.ted
to high school graduates of Mental Category 1, 2 and 3 and non-high school
graduates of the same mental categories. Regression results presented here
are for the following separate classes as dependent variables:
1. Category 1-2 high school graduate enlistment rates
2. Category 3 high school graduate enlistment rates
3. Category 1-3 total volunteer enlistment rates
A. Category 1-3 non-high school graduate enlistment rates
The method for determining service volunteers prior to July 1973
is described in Appendix D. The traditional method for determining the
mental category groups is presented in Appendix D.
The analysis of Army enlistment rates included regressions on groups
1, 2, and 3 described above. The analysis of Navy enlistments included
groups 1, 2, and 4 above as dependent variables in regressions. An anal-
ysis of Mental Category 4 volunteer enlistees was not attempted since
enlistment levels for the group are usually determined by service policies
regarding quotas.
METHODOLOGY
The rationale for the use of models with constant slopes versus random
component models varies with different studies of time series cross-seotional
107

structures. One major reason for constant slopes in this analysis Is the
fact that the principal exogenous variables available for enlistment
supply estimation are policy variables such as pay, recruiting and advertis-
ing. It is important to test the likelihood of estimating all parameters
under the assumption of the same directional response to policies across
all regions. Other reasons for the use of a fixed parameter model includes
the desire on the part of analysts to measure the effectiveness of nation-
wide policies — or policies in the aggregate.
To test the pooled time series cross-sectional models for bignificance
and adequacy, the following procedure was employed:
1. First, perform regressions by ordinary least squares ochniques
with both linear and log-linear forms on only the exogenous variables most
highly correlated with the dependent variable.
2. Perform regressions Including all exogenous variables.
3. Perform regressions with all variables and include dummy vari-
ables as proxies for regional components of variance.
4. Perform a two-stage analysis regressing the dependent variable on
the exogenous variables as in 2 above and then regress the residuals on
the regional dummy variables.
This approach to the analysis provided important and varied informa-
tion at each step. From steps 1 and 2, a determination was made on just
how well the national scale model performs without regional component
proxies. Steps 3 and 4 were employed to show the adequacy of the models
as forecasting tools.
The linear model employed in steps 1 and 2 will be referred to as
Model 1 in this chapter; the log-linear model for steps 1 and 2 is Model
108

2. The respective models used in step 3 are Model 1-R and Model 2-R.
The step A process was designed as a check on residual variation.
RESULTS OF ARMY REGRESSIONS
The Army's concern for obtaining a sufficient supply of high school
graduate enlistees has prompted the analysis of Mental Category 1, 2 and
3 high school graduate enlistment levels in most recent studies. In this
analysis, regressions were run against Mental Category 1-2 high school
graduate enlistment levels separate from those run against Category 3
high school graduate enlistments. This was done in order to estimate
variable elasticities pertaining to the most supply-limited group of vol-
unteer enlistees — Mental Category 1-2 high school graduates.
The results of the regressions are presented in Tables 22-25.
Tables 22 and 24 show the results of recessions which did not include
regionals (regional dummy variables); Tables 23 and 25 show results on
2 regressions with regionals. The results for all variables in the same
table were obtained from the same regression. The following information
is provided in each table.
o The coefficient estimated via the regression.
o The significance level based on a t-statistic for that variable.
o The elasticity or rate of change for the dependent variable per
unit change in the independent variable.
Regression results for Army Mental Category 1-2 high school graduate
volunteer rates indicate no statistically significant response to increases
in military pay across regions.
109

H CO
> u <H u
•H
u ■ u ^-* u
w o 01 H u M i
1 O -H pri •< 0
<« > >. •^1 «1 Ui c « o 60 « >H il M i-l
(J u e 9
•F4
u •H «M
iw «1 0 O
fri
u <H
J) U ■J •H u u a IS = i ■a F4 « Id
« ^^ a § i J: U -1 o •H tl « <u >
«rt 01 £ C iH M es ~* T^
(A
w >. e w. ti o v4 5; U « u IU fl «*- U 1
0 u
>> ai u a «4 -» u 0 <H 9 W
■a 09 « a M PH
Ü hi
O 01 O 0
e u 9 to O 'H
— 01 J3 •" > CK X 01
■^ c — X 00
CO
>. 41 i-> e 0 01 M ■N II u i-l fl IU
U IM
V 0 u
u C a g U
•0 -» e J= 4) 4 a. -• U b
•^ « c > »-*
o« o» n ^ M SO O (S IN vO O -H -I »o o
<g o
00 ^J" an 00 rsi O O >0 00 o o o >o <M O O O C3V O
I I
-» ^T r^ *-* -» m U1 in U1 •■» ^H CN O U^ -H
o o «OO
1-1 a _ — o V] u «M O O
o >o 00 O Ö O ON « o O O m o
» ■» 00 r» r» FH 00 «» -H O O r*
• OO
^. o -H in n »^ O O n o O o O 00 <N O O O r- O
t I
e « a o -• i u
—1 M 5, n w -« 0 -J « U M ^ U b a 3 «re >, > IV J <g -a e «i a. < ^> oc
r
I-
> u •* u
•*4
U ■ a
F4 W ^
n u 0 01 H 0
c n i
1 U -H t~4 ■* 01
u- > >■ •H 01 u e -i 0 ea m «H 01 «0 u 10 O
M a i 0
^4 u-t
IM 01
3
>. u v4 » y
J ^H
u u 10 1 a •
■3 F-
!0 H
41 H U 0 a 0 a s: u — u ■H 01 «) ■M >
■* 0) M e ^ U 00
^H ■H
X M
ro >• U u e 0 01 oc •** 01 u •^ n (^ 0 <4M
SI
3
> ai 4i
01 ^ -J u M •w 3 w
T3 01 i a u H Ü M
0 01 0 O £ e tJ a
U1 u rt «4 a
r "< > 9 ■H 01 •H e -H X 00
•H tN
1 «
>■ 4J U e 0 01 at (H a U «J ^J ■ IM
0 IM
SI 0 0
u C •) V «1
■0 -- e J5 v a Q.-« «1 b
■O ^ c >
o« •» m m <s pg (N m »1 o< «» ^H O <M ^
-1 o o o
0000
<n m «n 00 -^ o» o O 00 o ^H O o r^* 01 O O O 00 o
J-l i/-i r-i <N '-* ~T ■O CM r^ (^ m (N Oi *■* >T ft O O CM -* ~I rt (N <N O O O O O O O O
I
00 vO
O (M
I
o 10 o •H p^ O OOO
<N O r^ o o <n o o o -J O O vO O
s o o
CT» ** GO CN in rv in ^ Q FH FH i-H OOOO
I
CN OS ON 9^ ON cn CN O O r-* en PH
o O fM (9 ^ a o
00 ON O ^ rs. ON o o m o O O i« -4 o o >o o
3cn O 'J3 ^^ I** ^^ r^ o <r —. o o vo -1
OOOOOOOO OOOOOOOO
1 •-" I 1 1
C > O -• 9 u M — ,1 >, 'J
y _ 0 hi -^ <3 Q M -^ -4 u c u U 2. 3 fl 0
F U H •^ ^ > V U a Ofl u 0 • C Ü n Bd 2 .?: z a. < 3 oc »>! ac z UJ 3 Q a.
/
nn
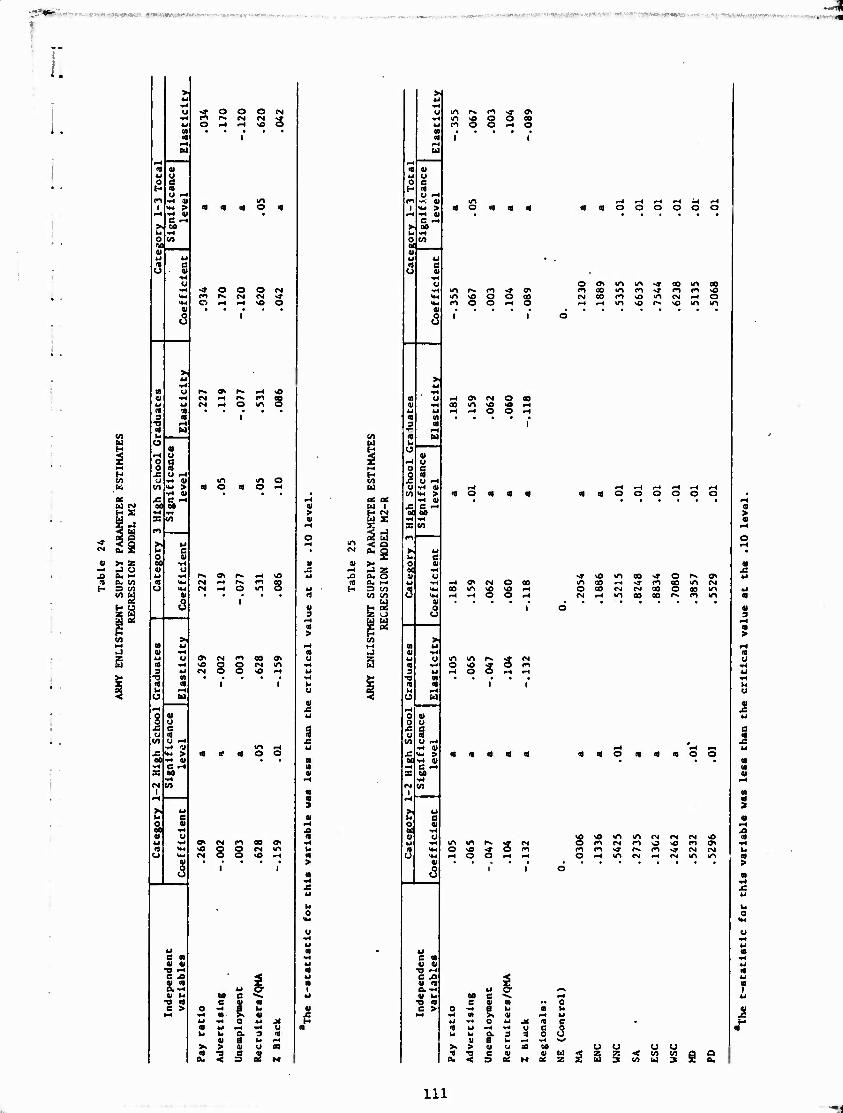
■ ,.._^^ ., - ■ ■ «>,•■--»-.•■ ...*» 'T^l^^9r.^p^«J.^^.
r.
; .
s
« u a a u ■-<
C -I CO
*r o o o <M m r» M CM ■* O ^ rH vO O
o
o o O iH «H >0 O
01 o c u
>M > ■H 01 e 00
c « « at
e -o v a a -< ot u
•a « c >
r^. (y\ r^ «M FH ^ N «4 O
o O -4
tr\ O
<7i
CM
<N l"1 00 ON
O vO ^
SO o
oo o>
oo e
o 5 I »J — O a u ^^ i. u, a.
« a >> > 01 nj -3 C a. < 3
I
4
as a« U I E rj
< o
>• J z a. o a, M
U-i > « O
a
u 0 H
i
u
5
>■ w
u
4i 09 a
pH u
« u s 1« u -^
•K 01 <M > »< 01
a- •H M
W e 01
^H U
v4
01
3
Ul
a
« u U r^ 0 0
JC o
01
•s ■H X <n
> u o 01 u ij
3
>■ u
u
■ ■-4 M
01 U
s o ^ •rf 01 1« > ■H 01 e -H 00 •H Ul
w
g •H u
3
n 01 *J n 3
u
0
o Ul
-4 X
CM 1
->
I s 01 4-t ■
> u ^4 Ü
«4 U 0) a
w
« u
1 •H 01 VM > •H 01 c ^ 00 <**
en
4J 0 0)
u
■M 01
5
u e a OJ 01
•O -H e JO 0) n Q. -H 01 w.
i 5
m ^T ON O O 00 O -I o
id o o o o o
o o u-l ur» •» on in on u-l r* m <!• Oi <-l 00 m CO -J m in -o lO >o o O to IN 00 m vO m <N fi o n O o rH o M rH m vO r^ vO u-i in
CJ\ <N O 00 m vo so w r-l O O rH
O O O O O O
ON CM O 00 U-l NO NO iH -i O O -(
«» iO m m 00 rt O oo rg es IH m
O rv ON ep IO <NI
O 00 1 O 00
ul r~ 4 «NI >o -T O n O O »-I iH
m r~ .» <s NO ^ O m O O -< -i
g>o rl o
m rfi «N4 M CN» es m NO NO «*i •* r* n %» (N in CM F^ e>j in
<7N
00 B -v. e oi
o 'M a u ■ u •4 <a >> u >4 u u "4 0 u j< 4 e <« u -H — o e p ki b a 3 t3 0 U
u a L. —i —< w >\ > O U 39 DO ■g -Q C V U U a. < s o« M of z
01
OI
c I«
JO a u <0 >
Jj
u u z z U 3
u u < VI VI VI ul 3
a a.
Ill -1

The recruiting variable appeared in all regressions without regional
components for Army enlistment rates with a coefficient significantJy posi-
tive at the .05 level or better. Inclusion of regional components reduced
the significance of the recruiting variable substantially. In fact, the
regional components are, in general, of much higher statistical significance
than any of the exogenous variables as deiined in this analysis. It is also
seen that including regional components significantly reduced the recruiter
elasticities from .60-.75 without regionals to a range of .10-.30 with
regianal components.
The amount of advertising by the Army appears to have a significant
effect on only one enlistment group — the Category 3 high school graduates.
Advertising elasticities for this group range from .16 to .25 at the .05-.01
significance level. Other volunteer groups appear to be rather less respon-
sive to increases in advertising expenditures.
The unemployment rate variable did not appear in significant prop r-
tions in any of the regressions. The results for this variable do not
immediately rule out its in. ortance for enlistment projections where post
1974 unemployment data can be used in the analysis.
The variable used in the analysis to represent the proportion of black
male youth in the population enters the high school graduate regressions in
significant proportions. The percentage of blacks in a region, however, may
be only a partial proxy variable in effect for attitudes toward the military
or a particular branch of service. This is reinforced by the occurrence of a
significantly positive coefficient in regressions without regional dummy
variables and the occurrence of negative coefficients in regressions with
regional dummy variables with a decidedly reduced significance for the black
proportion variable.
112

JWMJ—KMM 'WHWI.»—W«»* ■ wr i •*-■•*
The overall significance of the Army pooled time series cross-sectional
models for Category 1-2 high school graduates is summarized in Table 26.
The amount of variation in the enlistment data explained by ehe models
with no regional components is slightly greater than 50 percent. The
standard error of the regression ranges between 6 and 23 percent on the
mean of the dependent variable. With the inclusion of regional proxy vari-
ables in all regressions, the variables explain an additional 28 to 30 per-
cent of the variance and the standard error of the regression is decreased.
2 2 R values for Model 1-R and Model 2-R are .80 and .82, respectively. R
and standard error measures are almost identical for regressions on the
other mental category groups.
Pay ratio elasticities are generally the same for both sets of models
tested in the regressions; however, the recruiting variable elasticities
tend to be sensitive to the inclusion of dummy variables representing
regional components. The apparent reason for this occurrence is the
attempt by the Army to place recruiters where larger elements of the mili-
tary available population are to be found. Based or this assumption, the
recruiting variable elasticity ranges between .10 and .33 for Category 1-2
high school graduates.
Regional dummy variables for census regions 4, 8 and 9 entered the re-
gressions at a significance level of .01 consistently. These proxy variables
represent variation in enlistment patterns for the West North Central,
Mountain and Pacific census regions. Appendix E contains a list of the
census subdivisions or regions for population estimation and the states con-
tained within these regions.
113

Table 26
REGRESSIONS FOR ARMY CATEGORY 1-2 HIGH SCHOOL GRADUATES REGIONAL VARIATION
R2
Standard Error of the Regression
Black Prop. Elasticity
Recruiter Elasticity
Model 1 Regressions
With regionalsa .835 .0017 (15%) -.109 .329
Without regionals .517 .0026 (24%) -.204 .747
Model 2 Regressions
With regionals .813 .160 (3.5%) -.132 .104
Without regionals .490 .236 (5.2%) -.159 .628
flegionals « regional dummy variables.
114

g^Wm—fc#«^*>w ruf^yi^^n y< ■ ««-«j- . .■ **-L-*■**£,wf*w ■ ■i»'iw^--y ^ ^IWI . rwwwmi nil ii > ■y--.
RESULTS FOR NAVY ENLISTMENTS
Regressions were perfomed against three different Navy enlistment
levels: these were Mental Category 1-2 high school graduate, Mental
Category 3 high school graduate and Mental Category 1-3 non-high school
graduate volunteer rates. The results of the analysis showed a dominance
of the recruiters per QMA variable in explaining the variance in the pooled
data. The only other significant variable in the analysis was the percentage
black youth population variable when no regional components were considered.
The results of regressions on Navy enlistment levels are summarized
in Tables 27-30. It is not possible to estimate the true range of
elasticity measurements from the results for the pay ratio, advertising
and unemployment variables. However, since no pair of the exogenous variables
exhibited high multicollinearity, the implication is that the effect of
changes in military pay, the youth unemployment rate and the Navy advertising
effort are only supportive at best to the service's recruiting effort.
The recruiting variable elasticity is measured at about .75-.90 for
Category 1-2 high school graduates and .85-1.20 for Category ?, high school
and Category 1-3 non-high school graduates. The predominance of the recruit-
ing variable in all the regressions was tested by examining different forms
of the recruiter variable in regressions for Model 1 and Model 2. The number
of recruiters was always a significant variable in the regressions.
Another exogenous variable of importance in the Navy regression results
is the proportion of black youth in the population (PROB). This variable
enters most log-linear regressions with a negative sign and is significant
at the .01 or .05 level when no regional components are included. The
115

6-
■ « » «J u n v4 \ u
•e «4 t U u • u a
p4 W c
c « i u u s
U -i ■C -< «I a *l > *^ ■H || X C rH
1 M c <«4 o M
35
W U 1 s ^ V -«^ > u u •»4 e «*- 0 <M I ■ 4- 0 u u u
^ a u u «4 4J u fl ■**
3 4i ■o a t « U ^
M
• 0 3 0 e xt 1 u U **
en •W ■ <U >
£ -< « a S -H ^^ M z ^4
cn
4J u e 0 1 « «4 01 u *J ^ **■ t; <M
1 5
>■ • 4i D «4 w u n 3 u
-3 ■ 1 i t. •^
u
0 • 0 u J: u s m O ** — • M >« > * — ■ -« e -• X a*
«4
1 M
X u u e 0 ■ ae 31 u w
3 3
u e ■ « a ^ — e x J n a.- «1 la
■0 1 E >
S 3 -» o O ^4
O 4
O <n -» 00 O -» O <N *T O O »A l^ O O O f~ -» O O O r-. O
I I
oo r. «# ^« ■* CI Irt oo o o o
O CN <0 sO —< O ^ f^- M o o o o o o o ™ *>4 OOO^O
• r f» i
u-> (jv 00 <M 8vO o —
O » ^
« o
ü fl H
§-< * o Q ■» <-> O r^ -^
o e o> o
.1 •• s ^ cum
o — i K — a >s a w — 3 ^ fl ^ -. — k. I. 3. 3 » r h K > » U O -3 = S a. < => oc
M U
< z
u od<u >
u x e -4 i c 0
c 4 U -H -. « M >
e -<
>■
u
«I u c <g Ü r^ <4 «I Ui > -4 a e « a« -4
e a u » ^ —
12 e >
I
oo •«
O O
oo
•( o o
It -I «
^H <»l <-1 *-4 r>4 (N f-l tM <M «M *-t <M
>^ •■^ ^^ ^ "^ >^ ^ N-^ N^ s^ ^-^ v^ u u u M u UJ Cal III Ul Ctl u u <M r*. -^ (-1 »» p^ n (7> <N Ov m o> o« o «n <N >» r> »o oo m «» -Ü n <N o< ^4 ^H ^H 00 (N w-t Cl CM -4 o r-l r^ m
■^ r^ r» (j> n CN oo wi o o o o
(N 1 1 1
u tu III ~* <N <N o * 00 -» 00 »»
I CM CN I I
(N CN CN CN CN I I I
UlilUUllalldUlM
oo tn CN CN (^ oo «H W CM CN CM O CN ^
I I I I I I
-^ oo -H r» CN m >o r» o O oo o
(N -» -T CN
>-^ ^ w Ul Ul 111 III o PN. o <n m oe 00 f-» •o o> -T -» o> ^o 00
I *-* Ul
I I I fM «N
I I
w w u w u u m r^ «n oo oo oo sü —• —" r* X ON CN -H O -» Cl «N
I I I 1
M e 3 «a n u a w
■ S. ■ 4-1 -j s *J J< -1 c 1 *J — «4 •J e 0 b i. & 3 •» 0 u
V a u «4
>s > a U oa tt 0 •a c II K III £. < = X M X a:
0)
s
a a •-^
: > a
r-l
a 4H 14 a > a
•44
a M
w O a -H
i 4J ^-\
M « I J: *" I- M
a ^>
<zz<v)7)ga r: ^ 5 -.-i JJ s s a.
116

1 '.'■WW'"»»* «*" •
I
Si
5
a 41 u n 3
-3
o
0 0 -c <J tn
X oc
X 1
§ z (-1
>.
ä V
«
>
u u
4 1-4 u
■ u 1
■H « w > •rf «I
u e 41
g
IM IM
a 5J
3 ■o l» b U
•-^
1 u w £
=
>> U 0 M U
!5
U
4i
3
41 U
s u -* M « •M > ■H 91 e -^ M
4^ «0
w c 41
^4 ■J
«4 UN 144
0)
a 3
b U
0
i « 1 X
CM
*-4
>■ b
s Q u
> W «4
u u «1 "0
UJ
• g
s 'J ^
■H « «4 > -< 41 \ -4
(A
4J
s u
«-( V
3
w c ■ « 41
C JO
g b is
OB r* m ID 40 V i/> 9 CO Q O —* tn >T o CS O CM 00 <N
I I I
• o o
ao r« to ao »A cv O -< m <N O IN
90 00
ee <N
i
v0 «
I
oe m >o •» f* -» CI >4 >o
O -4 Ot >4
I
O r» ao >o >o ■« w «M <»( -J o -<
r i'
mm«i iO o« n <» •< • - o o
-4 <o
u-i O
I I
Kl 1/-1 0> >0 >/1 m 9 d PO Q sT —t ON (A O -« O O I*- IN
I I I
«0 c ^. e « •
o — a b — m - 9> hi «4 0 w J4 1 *J —4 --4 U b b & 3 4
n a b — >. > 91 U 00 « T e • a. < a at M
41 -N
e
JO
o 1*4
u
■ •44 44 I»
.C
CO M
I »-• to H
u I H (N u z
% -1 ac bl < a
> -} z a. o flu — 3 M
HS Z "J
Sal U)
s
<
-4 41
O O -» 00 ^T a» -< n *n m so ^r moo»
I
O
a e •% ■J i
— 41 »4 > >4 41
q (44 U 91
91 u e u U I — «
ib >
e —
e « u si
■o — e x v l) o. - U b
e >
o
o o I
IN
r
-4 in P* «1 « p^ -» (N ■» 00 r*. IN ^1 ■o -o » r~ vO O -I ^-1 « IN o m <N -X -» o ts f*. ■*
<0 O« CO CM ■ 4 <o a> en O -4 OO IN
« o
<e ^ CM •* IN vO (> 30 n -^ \ö CT1
m o 4^ 90
aoao^cc^Ocncn r^cN9i^.in«6<M^« — nw-ivxaoOi^tA
O O C m ~4 4-4 CM
I I
o I I I
ao -o NO o no -N rt rt A o ^ p <n en rn CM O «4 <0 CM , . .
« o
00 NO >o O 00 -N m m m O ^ Q en en CM IN O ^ NO IN
I
m^TN0NO^4^4ONCN r^aoiNNOC0^4in-4 oi-^-Nin^cMVcn ooiNO^mo-H
I i
-I e
o — -4 «
ro *4 -4 -^
91 >. > I« -3 a. <
am " o 8 b au >N s -< .4 o u J4 4 c ^ »< u c o CL 3 « O U a u —. — ^^ J, U CO M C -J 41 Ul a oe M x z
91 .c
e 5
m M I« I
44
91
r z i 5
U Li cn M Q UJ 3 S
117

results indicate a possible .2 percent decrease In the quality group enlist-
ment levels for 1 percent increase in the proportion of black youth in the
regional populations.
The regional dummy variables in the analysis were almost uniformly not
statistically significant for the Navy accessions groups analyzed here. The
overall results for the analysis on Navy enlistments are presented in
2 Table 31. The R measurements show that a significant proportion of the
variance in the enlistment data for Mental Category 1-2 high school graduates
is explained by the Model 1 equation alone. The addition of the regional
components in Model 1-R account for only an additional 4 or 5 percent of the
variance.
SUMMARY 0/ FINDINGS
The pooled time series cross-sectional models used in this analysis
provide for an evaluation of the Army and Navy pay and recruiting policies
across the diverse nine census regions. The results obtained from testing
these models may be summarized with the following observations:
1. The number of recruiters per QMA variable is the most significant
factor in the pooled models. Recruiter elasticities range from .08 to .68
for Army results and from .70 to 1.20 for Navy results. It must be con-
sidered, though, that this observation of recruiter impact may be due to a
very successful tracking of enlistment potential supply by service recruiters
and not simply a productivity measure.
2. The pay ratio variable defined in this analysis elicits no sig-
nificant response in regressions on Army volunteers nor in regressions on
Navy volunteers. Since the standard error of regression is smaller for Army
118

Table 31
REGRESSION RESXTLTS FOR NAVY CATEGORY 1-2 HIGH SCHOOL GRADUATES REGIONAL VARIATION
R2
Standard Error of the Regression
Black Prop. Elasticity
Recruiter Elasticity
Model 1 Regressions
With regionals3 .901 .0035 (272) -.077 .861
Without regionals .860 .0037 (29%) -.112 .908
Model 2 Regressions
With regionals .8A6 .315 (6.9%) -.201 .633
Without regionals .733 .370 (8.5%) -.201 .758
Regionals ■ regional dummy variables.
119

regressions than for Navy regressions, It Is possible that more conclusive
results for the Navy could be obtained via a different method, perhaps
separate regional cxme series models.
3. The youth u.itzployment rate does not appear to have a significant
effect on enlistment patterns across geographic regions. The unemployment
rate variable enters regressions with a non-significant and usually negative
coefficient. A regional time series analysis could possibly dispute the
measured elasticities from this analysis provided the most recent trends
(1974-1975) In unemployment rates are considered.
4. The percentage of blacks In the male youth population enters re-
gressions on volunteer levels In statistically significant proportions.
This Indicates a sensitivity of Army and Navy enlistment patterns to the
black population distribution. The presence of this variable in the re-
gressions Is assumed to be that of a proxy variable for service attitudes
or attitudes toward the two branches of service. The variable occurs with
greater significance in Navy regressions than in Army regressions. This
variable also performs as a camouflage for quality levels within the
services.
5. The amount of advertising appears to be an Important factor in
the volunteer supply level of Army Category 3 high school graduates. It
Is not, however, of significant determination for other enlistee groups.
6. The tradeoffs between the use of type 1 and type 2 models are
not always apparent. In most regressions, the standard errors of the re-
gressions as well as the standard errors of the coefficients are less than
20 percent, generally about 14 percent for statistically significant coef-
9 flclents. R" values are greater for Model 1 type regressions than for
120

!i 'm*mm*m*mHmmt**mmm'*'>mmßmmr-~~~ wmm'i'mrttmvtm «■ r- ■
i. Model 2 types. Because there is also a lack of complexity in the structure
of the type 1 equation with regional component proxies, the use of Model 1-R
is considered the best choice as a forecasting tool among the pooled models
considered in this study.
121
.
.~~~*M~Mf^*r~.-~~r!rnlrTrmrimmimmtll | m ||..||| [|ir.^rrn(TirfTr1|ir|rn|r-Tr|
I ::
• -
-
Appendix A
ANALYSIS OF FISHER'S METHOD OF ESTIMATING W„ AND W^
Fisher's method of estimating W using data from Census Current Popu-
lation Reports for year-round, full-time male workers, age 14-19 (Y14-19)
and 20-24 (Y20-24) is replicated In this analysis. Fisher's estimating
equation was:
WC * 2yi4-18 + Y20-24
The results of GRC calculations and Fisher's estimates (as reported In 2
several publications) are summarized in Table Al, which also contains an
I estimate of the Consumer Price Index derived from monthly data. Following
the description of Fisher's estimating procedure described in Kim, Farrell
and Clague, it was assumed that the statistics reported in the Current
Population Report for a given year were for the third quarter of that year.
Comparison of the rates of W estimated from the CRP to W reported
by Fisher (column 3) with the Consumer Price Index for that quarter pro-
duces strikingly similar numbers. This comparison constitutes strong
evidence in support of the notion that Fisher used the real value of W as
his estimate of the returns to not enlisting.
U.S. Bureau of the Census, Current Population Reports, Series R60, Consumer Income.
2 Kim, et al., pp. 200-201; Hause-Fisher, pp. 131-132.
123
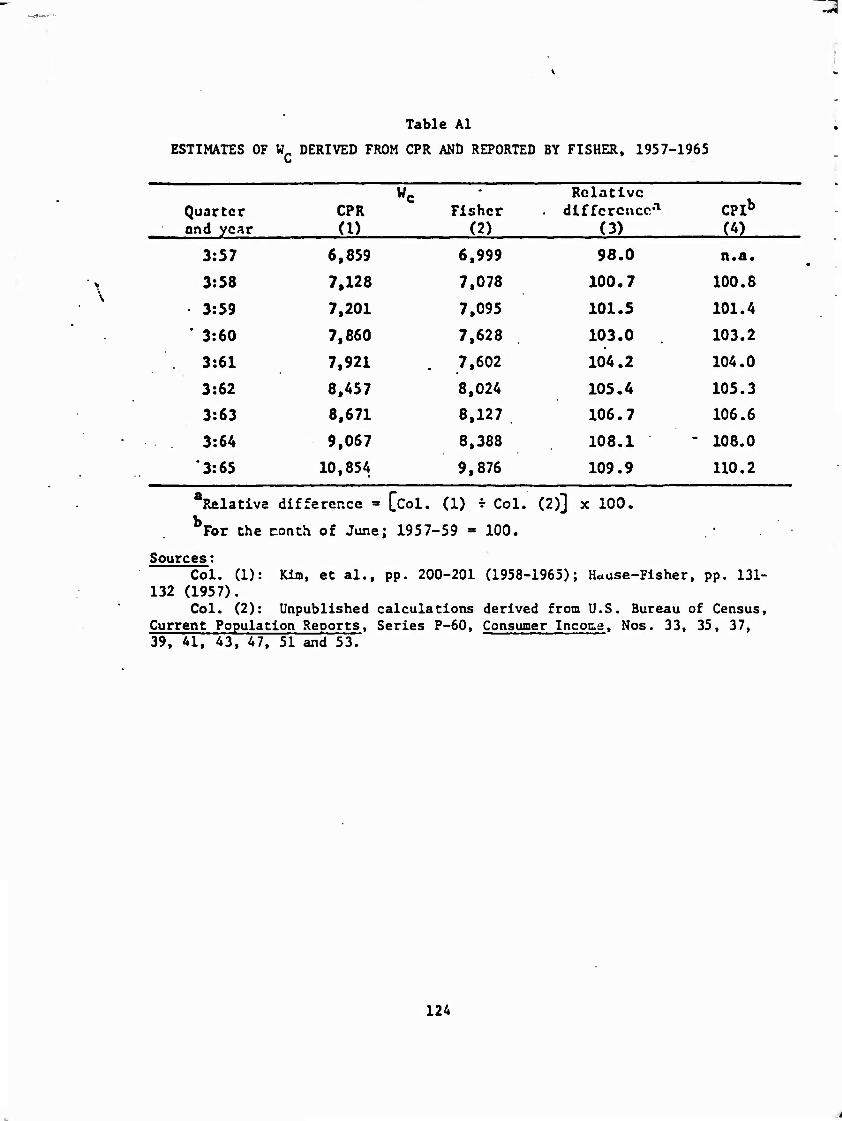
Table Al
ESTIMATES OF W DERIVED FROM CPR AND REPORTED BY FISHER, 1957-1965
we - Relative Quarter CPR Fisher difference*1 CPIb
and year (I) (2) (3) (4)
3:57 6.859 6.999 98.0 n.a.
> 3:58 7,128 7.078 100.7 100.8 \
• 3:59 7,201 7,095 101.5 101.4
• ' 3:60 7,860 7,628 103.0 103.2
3:61 7,921 . 7,602 104.2 104.0
3:62 8.457 8,024 105.4 105.3
3:63 8,671 8,127 106.7 106.6 • 3:64 9.067 8,388 108.1 - 108.0
■-
3:65 10,854 9,876 109.9 110.2
aRelativa difference =» [col. (1) ♦ Col. (2)] x 100.
For the conth of June; 1957-59 » 100.
Sources; Col. (1): Kim, et al., pp. 200-201 (1958-1965); Hcuse-Fisher, pp. 131-
132 (1957). Col. (2): Unpublished calculations derived from U.S. Bureau of Census,
Current Population Reports, Series P-60, Consumer Incoce. Nos. 33, 35, 37, 39, 41, 43, 47, 51 and 53.
124

-*--■•»«'**■.*■•*•»■- ■-• turn-. '•»»WiMWjlMi'W M *•■*.->* w+n
Table A2 summarizes Fisher's estimate and Is shown below. Since
nominal military pay rates are subject to Congressional control, they
would be expected to display a fairly discrete pattern of movement over
time, changing only when Congress approved changes In military pay rates.
There, one would expect to find an estimate of nominal W^, to display a
step-line pattern of movement with the steps occurring at the time of
Congresslonally approved pay Increases. Until recently, the Congress has
not been Inclined to award nominal pav Increases to first-term enlistees.
Fisher's estimates, contained In Table Al display a step-function pattern
of movement that Is consistent with the notion that his estimates of
nominal (as opposed to real) returns to enlisting. Wu remains extremely M
stable In the earlier quarter and begins to rise more rapidly in the later
quarter. This pattern Is consistent with Congressional neglect of nominal
first-term Ww in the earlier years of Fisher's analysis. Presumably an M
estimate of real W would have shown some decline In these early years n
because of inflation.
125

~l
Table A2
ESTIMVTES OF Wy REPORTED BY FISIER, 1957-1965
Quarter and year WJJ Quarter and year WJJ
3:58 6869 1:62 6933 4:58 6869 2:62 6933 1:59 6933 3:62 6933 2:59 6933 4:62 6933 3:59 6933 1:63 7074 4:59 6933 2:63 7074 1:60 6933 3:63 7074 2:60 6933 4:63 7276 3:60 6933 1:6^ 7276 4:60 6933 2:64 7276 1:61 6933 3:64 7276 2:ul 6933 4:64 7307 3:61 6933 1:65 7307 4:61 6933 2:65 7307 '
3:65 7884 4:65 7884
Source: Hause-Fisher, p. 132; see also Kin, et.al., pp. 200-201.
126

■ K/tn*»*** ,-.s» .-^fk—*■" .■■ - ■ Ml mT awvvm
I
Appendix B
COMPARISON OF FISHER DATA BASE WITH COMMON DATA BASE
Fisher's data base consists of six variables: enlistments, accessions,
population, uncnployTr.cnt rates, military pay, and civilian pay. Enlistinants
and accessions arc generated on the sane data source by both the Fisher
data base and the com.T.on data base. They therefore should-net differ from
one another by any substantial amount. Table 31 compares Fisher's enlist-
ment and accession estimates with those derived for this study. With the
exception of four quarters, 1:53, 3:58, 3:43 and 1:65, the estimates differ
by no more than three percent. Fisher estimates his population variable to
include the male civilian population in the age range 17 through 20. Fisher
reports that he derives his estimates from the Current Population Reports,
which present annual observations. Quarterly estimates of population are
derived from these annual observations by linear interpolation. The Current
Population Reports include tv.'o possible sources of population statistics.
One source reports population estimates as of July; the other source,
derived 'ron school enrollment reports, reports population figures as of
October. Unfortunately, Fisher does not report which of these two series
be uses to generate his population estimates. The common data base uses the
population series generated from the October figures.
Estimates of the male civilian noninstitutional population age
17-20 were derived for the common data base from the Current Population
Reports. These estimates were obtained by linear interpolat-on of the
127

Table Bl
COMPARISON OF DOD ENLISTMENTS AND ACCESSIONS, MENTAL GROUPS 1-3 (IN THOUSANDS), 1957-1965
Enlistments(in thousands) Accessions(in thousands)
(I) (2) (3) (4) ^5) (6) Fisher Comon
Data Base (2) - (1) Fisher Cosunon
Data Base (5) + (A)
1957:3 68.9 :4 38.8
1958:1 60.5 60.7 1.003 101.4 106.3 1.048 :2 55.2 55.5 1.005 96.6 98.8 1.022 :3 81.2 77.5 - .954 124.3 121.8 .930 :4 54.8 55.0 1.004 96.6 97.8 1.012
1959:1 63.4 63.6 1.003 93.7 94.9 1.012 :2 54.4 54.6 1.004 72.6 73.4 I.Oil :3 80.4 80.9 1.006 109.5 111.1 1.014 :4 58.8 59.0 1.003 87.0 88.0 1.011
1960:1 69.5 69.6 1.001 90.4 91.4 1.011 :2 67.7 67.8 1.001 97.6 98.8 1.012 :3 97.0 97.5 1.005 130.1 131.5 1.011 :4 63.7 63.8 1.001 94.0 95.2 1.013
1961:1 76.0 76.3 1.004 92.7 93.5 1.009 :2 67.4 67.6 1.003 73.8 74.1 1.004 :3 108.9 109.6 1.006 158.8 161.8 1.018 :4 76.3 76.8 1,007 139.0 141.2 1.015
1962:1 83.7 W.l 1.005 112.8 124.9 . 1.017 :2 66. . 66.6 1.008 89.1 90.1 1.010 :3 90 0 91.8 1.020 113.9 114.0 1.001 :4 57.3 58.4 1.019 76.7 78.4 1.022
1963:1 67.3 69.3 1.030 91.5 92.6 1.012 :2 57.8 59.6 1.031 88.3 88.7 1.00A :3 91.4 91.A 1. 130.6 130.4 .993 :4 61.3 61.3 1. 115.3 115.3 1.000
1964:1 77.6 77.6 1. 129.6 129.4 .999 •2 65.3 65.3 1. 95.8 95.7 .999 :3 90.1 90.1 1. 112.9 112.6 .998
^ 51.3 51.3 1. 78.7 73.6 .999
1965:1 63.5 57.5 .906 89.6 83.7 .935 :2 66.7 66.7 1. 120.3 120.1 .999 :3 113.9 113.9 1. 183.0 1S6.6 .993 :4 102.7 102.7 1. 220.0 216.0 .952
Source: (1), (4) Hausc-Flshcr, p. 129
128

»
: ;
October statistics Chac are reported by the Census annually. Estimates
for 17-20 year olds were derived froa the followins equation:
P1720 » 1/2 F1617 + P1819 + 1/2 P2021,
where P1720 is the 17-20 year old civilian, noninscitucional population,
P1617 is the 16-17 year old civilian noninstitutional population, P1S19
is Che 18-19 year old civilian noninstitutional population, and P2021 is
the 20-21 year old population. The equation is modified for the years 1957
and 1938 to acconodate the fact that 20 year olds are reported with 20-24
year olds (20-21 year olds are not reported separately). For these years,
1/2 P2021 is replaced by 0.2 P2024, where P2024 is the 20-24 year old population.
Fisher reports th. •. he derives his statistics fron the Current
Population Reports, but does not provide any further details as to how his
series is constructed. Table B2 compares the two population series, for
the period 3:57-4:65. On average, the scries developed for the connon
data base is one percent higher than the series reported by Fisher. This
overstatement is quite pronounced in the early part of the series, where the
population estir^tcs developed for the cennon data base are as auch as seven
percent above those developed by Fisher. This discrepancy narrows to less
than two percent by late 1959 and remains within two percent (in absolute
terns) thereafter, except for one quarter, when it reaches 2.5 percent.
Fisher's unemployment rate is the rate for all males age 13
and 19. His series is taken frcn unpublished Bureau of Labor statistics
figures. Table B3 compares Fisher's unenploynent rite estiaates
with those derived for this study. The estimates are exactly the saae
in all but one quarter (2:65).
'.29

Table B2
COMPARISON OF ESTIMATES OF THE 17-20 YEAR OLD MALE CIVILIAN NONINSTITUTIONAL POPULATION, 1957-1965
(1) (2) (3)
Fisher Common Dat i Base
(2) + (1)
1957:3 :4
3633 3717
3890 3935
1.071 1.060
1958 .1 :2 3
:4
3787 3861 3935 3997
3979 4025 4069 4118
1.051 1.042 1.034 1.030
1959:1 :2 :3 :4
4058 4119 4180 4261
4168 4219 4271 4327
1.027 1.024 1.022 1.015
1960:1 :2 :3 :4
4342 4423 4503 4565
4396 4465 4533 4594
1.012 1.009 1.007 1.006
1961:1 :2 :3 :4
4628 .691
4754 4787
4637 4683 4727 4762
1.002 .998 .994 .995
1962:1 • :2
:3 :4
4820 4853 4886 4900
4780 4797 4814 4850
.992
.984
.985
.990
1963:1 :2 :3 :4
4913 4927 4940 5042
4922 4994 5067 5136
1.002 1.013 1.025 1.019
1964:1 :2 :3 :4
5145 5248 5351 5492
5204 5270 5337 5426
1.011 1.004
.997
.998
1965:1 :2 :3 :4
5634 5776 5918 5973
5555 5685 5813 5912
■nsus. Current Populatl School Enrollments.
.986
.984
.982
.990
Source: (1) Hause-Flsher, p. 130. (2) U.S. Bureau of Che Cc
P-20, Population Characteristics, on Reports
130

Table B3
COMPARISON OF ESTIMATES OF THE 18-19 YEAR OLD MALE UNEMPLOYMENT RATES, 1957-1965
(1) (2) Fisher Conmon
Daca Base
1957:3 .098 .098
:4 .124 .124
1958:1 .204 .204
:2 .182 .184
• 3 .173 .173
:4 .157 .157
1959:1 .170 .169
:2 .145 .146 • 3 .138 .139
:4 .146 4
.146
1960:1 .162 .162
2 .150 .150 3 .135 .135
4 .159 .159
1961:1 .203 .203
2 .176 .176
3 .136 .136 ■J
4 .146 .146
1962:1 .170 .170
2 .139 .139 3 .119 .119
4 .131 .132
1963:1 .178 .178
:2 .178 .178
:3 .140 .140
:4 .144 .144
1964:1 .160 .160
:2 .161 .161
: 3 .133 .132
:4 .135 .135
1965:1 .140 .140
:2 .157 .165
• 3 .106 .107
:4 .099 .099
Sour ce: [I) Hause-Fisher, p. 133.
131

Fisher's cstlnatc of civilian pay is Generated as a weighted sura
of Che year-round, full-tir.ie earnings of male workers in the age groups
14 to 19 and 20 to 24. (Fisher, p. 247. He assumes enlistment at age 18.)
Table B4 compares Fisher's estimates to those generated from the common
data base compiled for this study. With the exception of one quarter,
4:65, the estimates are within three per cent of each other; they are
vittun one percent of each other in all but six quarters, 64:3 - 65:4.
The most difficult variable to replicate was Fisher's estimate of
military pay. Recall that Fisher's estimate included basic pay, quarters
and subsistence allowances, and an imputed value for medical services
(Hause-Flsher, p. 64). He reports that his estimate of basic pay and
allowances Is taken from schedules giving base pay by pay grade that were
in force at the time of the observation. These estimates are used together
with estimates of average time in grade provided by the services to produce
a-erage pay for the first three-year enlistment In the military. Fisher
reports an estimate of military pay for 1957-58 that is equivalent to a
monthly average of approximately $193 for basic pay, allowances, and
medical benefits. Medical benefits are reported valued at $253 per year
(Kim, et al., p. 198). Thus we can estimate Fisher's measure of average
basic pay and allowances to be about $171. Using reasonable assumptions
about promotion rates and basic pay scales for 1957-63, the average monthly
value of basic pay over a three-year enlistment should have ranged between
$102 and $113. Deducting this estimate of basic pay from Fisher's estimate
'Two promotion rates (slow and rapid) were used. The time in grade assumptions associated with these rates, together with the relevant value of basic pay, are described below:
132

I i:
-—,—~. - ■
Table BA
COMPARISON OF ESTIMATES OF Wc, 1958-1965
**
i
i.
(1) (2) (3) Cocrr.on Data Fisher (2) * (1)
Base
1958:1 7016.00 7039.00 1.00328 1958:2 7033.76 705 9.00 1.00359 1953:3 7077.33 7078.00 1.00009 1958:4 7095.24 7082.00 .998134
1959:1 7114.09 7086.00 .996052 1959:2 7111.77 7090.00 .996939 1959:3 7123.63 7095.00 .995275 1959:4 7255.13 7228.00 .996260
1960:1 7416.42 7361.00 .992527 1960:2 7535.47 7494.00 .994497 1960:3 7625.00 7623.00 1.00039 1960:4 7594.41 7622.00 1.00363
1961:1 7607.90 7615.00 1.00093 1961:2 7615.01 7609.00 .999210 1961:3 7629.31 7602.00 .996420 1961:4 7750.24 7707.00 .994421
19C2:1 7863.42 7813.00 .5935SS 1962:2 7953.42 7918.00 .995546 1962:3 8017.03 8024.00 1.00037 1962:4 8052.88 8050.00 .999642
1963:1 8088.60 8076.00 .998443 1963:2 8122.30 8102.00 .997501 1963:3 8126.93 ■ 8127.00 1.000000 1963:4 8197.39 8192.00 .999342
1964:1 8272.30 8257.00 .998150 1964:2 8349.72 8322.00 .996680 1964:3 8509.70 8338.00 .979824 1564:4 8897.79 8760.00 .984514
1965:1 9274.31 9132.00 .984655 1965:2 9614.75 9504.00 .938481 1965:3 9776.77 9876.00 1.01015 1965:4 9512.20 10248.0 1.07735
Source: (2) ii-use-Fisher, p.
133

of basic pay and allowances, it appears chat Fisher valued Che allowances
at'$56-$69 per month. Since Che quarters allowance for enlisted men was
$55.20 per month at Che time, it is assumed that Fisher added the value of
Che quarters allowance to his estimates of basic pay (using a liberal pro-
motion assumption) and his imputed value of medical services. Table B5
compared our estimates of W with those reported by Fisher. The estimates
range within 3 percent of each other, suggesting Chat Che assumptions newly
adopted In generating an estimate of military pay for the common data base
2 were reasonable proxies for chose employed by Fisher.
Tine-in-grade; (in months) Monthly Basic Pay Pay Grade Slow Prococion napid Promotion Less than 2 2 years, less
El A A £2 8 6 £3 2A 6 E4 IG
3 year monthly avorasc base pay $102 $115
The relacively large differences occurring in the third and fourth quarters of 1965 are the result of an error in Fisher's estimates. He assumed the 1965 base pay increase occurred at the beginning of the third quarter, when it actually became effective in September, the end of the third quarter. Adjusting Fisher's estimates for this error brings his estimates to within three dollars of our estimates.
years Chan 3 years $78.00 $85.80 $99.37 $124.00
$122.30 $150.00
134

**}.<**** fKT*rvr^m>mirK\'*W**i!iieni^>**'vr* ■-»«■«»f. v~'
[ Table B5
COMPARISON OF ESTIMATES OF W„, 1958-1985, HSHER VS. COMMON DATA BASE
(I) (2) (3) Comon (2) - (1)
Data Base Fisher Difference
1956:1 6755.02 6869.00 113.980 1953:2 6755.02 6869.00 113.980 1953:3 6755.02 6933.00 177.980 1958:4 6755.02 6933.00 177.930
1959:1 6755.02 6933.00 177.980 1959:2 6755.02 6933.00 177.980 1559:3 6755.02 6933.00 177.980 1959:4 6755.02 6933.00 177.980
1960:1 6755.02 6933.00 177.980 1960:2 6755.02 6933.00 177.980 1960:3 6755.02 6933.00 177.980 1960:4 6755.02 6933.00 177.980
1961:1 6755.f 6933.00 177.980 1961:2 6755.02 6933.00 177.930 1961:3 6755.02 6933.00 177.980 1961:4 6755.02 6933.00 1^7.980
1962:1 6755.02 6933.00 177.930 1962:2 6755.02 6933.00 177.980 1962:3 6755.02 6933.00 177.930 1962.4 6755.02 6933.00 177.980
1963:1 6895.42 7074.00 178.580 1963:2 6895.42 7074.00 178.530 1963:3 6895.42 7074.00 178.580 1963:4 7255.42 7276.00 20.530
1964:1 7255.42 7276.Ü0 20.580 1964:2 7255.42 7276.00 20.580 1964:3 7273.42 7276.00 2.57996 1964:4 7305.42 7307.00 -2.42004
1965:1 7309.42 7307.00 -2.42004 1965:2 7309.42 7307.00 -2.42004 1965:3 7555.95 7SS4.00 328.053 1965:4 8049.00 7834.00 -165.00
Source: (2) lUuso-risiicr, p. 132
135
Appendix C
DESCRIPTIONS OF VARIABLES USED IN THE POOLED TIME SEPiES CROSS SECTIONAL MODEL REGRESSIONS
The specifications of variables used In the pooled time series cross
sectional regressions were the result of an expansive effort to obtain the
best estimates of the primary factors in the analysis. No reliance was made
on published estimates of civilian pay, youth unemployment rates, the edu-
cational stratification of the population, nor the supply of accessions
from different geographical locations. All data variables except recruiting
and advertising were derived in-house by GRC staff.
The methods for obtaining the population variable estimates Included
the processing of Bureau of the Census "Current Population Survey" tapes
for the years 1970 through 1974. The 1975 taae was not available to GRC
analysts. Also derived from the CPS tapes were the estimates of the 17-21
year old male unemployment rates and the civilian pay received by 17-21
year old males in the diverse regional locations.
True volunteer accession variables were derived from the USAREC files
for 1970-1975 and were extracted by region, race, mental category and edu-
cational group. The method for determining the enlistee mental categories
is explained in Appendix D. More prospective dependent variables were
derived than were in the analysis due to limitations of the independent
variables. The data were extracted on a monthly basis, then summed for
yearly estimates.
united States Army Recruiting Command.
136

Although the 17-21 year old male civilian population, the military
availables, was derived from census tapes, estimates of the physically and
mentally qualified population had to be obtained from different sources.
The use of disqualification rates against population variables is assumed
to provide a better measure of the potential enlistees to a branch of ser-
vice. A set of disqualification rates was obtained for this study fron the 2
HumRRC master file of the mental category and physical acceptance rate
distribi tions of pre-inductees for the year 1972.
Disqualification rates were extracted at GRC from the HumRRO file by
3 race and by state of residence of the pre-Inductee. State qualification
rates were grouped according to regional location and a set of nine qual-
ification factors was derived by weighted averaging. The disqualification
rates per region were assumed constant over time.
The military pay variables for the Army and Navy were derived by a
sequence of averaging processes on the total of basic pay, quarters and
subsistence allowances and the tax advantage on those allowances for pay
grades E1-E6 by years of service. The Army pay variable assumes expected
income by a new recruit is for three years of service, whereas the Navy
pay variable assumes a four-year expectation of pay. The military pay
variable does not change crom region to region in the series; however,
the civilian pay variable had both regional and yearly differences. This
provided variation in the pay ratio variable attributable to regional dif-
ferences.
2 Human Resources Research Organization.
3"rY77 Qualified Military Available (QMA) Inventory." prepared for Headquarters, US Army Recruiting Command, General Research Corporation, 25 November 1975.
137

The recruiting and advertising data were obtained from the services.
Yearly estimates were derived from monthly Amy recruiting data and from
Navy fiscal year data. Army recruiting data were broken out by recruiting
command regions and state distributions had to be calculated at GRC. The
state recruiting data were then grouped into regional data.
The variables used in the pooled time series cross sectional analysis
are listed on the following pages and have the structural form shown below.
Data Series Structure
Region 1
Region 2
1970 Value for 1970 1
1971 Value for 1971 2
1972 • 3
1973 • 4
1974 • 5
1970 Value for 1970 6
1971 • 7
1972 • 8
1970 Value for 1970 41
1971 ; 42
Region 9 1972 ; 43
1973 ; 44
1974 * 45
138

QUALIFIED MILITARY AVAILABLES MILITARY AVAILABLES
r ? .. v
t
"'% 19
' It' 1» -fr i*
"15 1« ir M
?a zi tt zi' Zi>
?*" ?i ?» ?< "> II Jl Sl 33 I« 3*
'36~ 3»
"J5 3»
_*3_
??Sk^^.i.^
_ ^<i!»^9.?l. _
fc:et^?.«.5
i3<»:i<.>.5_
?l33r5.t.S -
itndi.fk"
l-51!.«.<.«i US»!».«!"
t««..'0.a" »?<.*«:. o :
~HtU.3*3'"" _»:n';.7s:
isi^'.'»;"
»i7S75.iS
?7l.7l<t.jt i
1 12(756.00 • t 170105.90
3 212369.0C - * 22(627.00
5 26;6«5.3e —e - - *2392C.0( r »e82<>9.ac ... |
- 565551.00 « 61<<232.03
it t9i.757.00 ii 567061.Of
" 12 — — 693955.01 13 609227.09 1* a03M2.0C 11 • 9925<..39 16 167515.9C 17 «01399.53
—ia— -- J35755.C3 • 11 321.717.0C 29 35337£.g9 ii 617795.9C « 1.9 7981.9 3 23 56:11*.Jt
-ik —719686.90 25 7Zli.5-.CC 26 18 3732.0 0 27 189334.00 21 23<.585.09 r^ £70^55.30
—39 —29?a5i.95 - 31 <71<.3S.:0 32 308452.CC 33 33513;.0C
• 3* ■ • 38(867.9C 35 6«.9:8l..C0 36 93;<.3.cg: 37 i63S<.e.9e 38 lS301<..9e 3< - - 152907.09 61 is27gc.9: <•! 337359.01 «.2 36(772. 3 ( «.3 '.3339..09 66 wieaas.oc
■65 465627.9C - 1
Copy «Tvailab> penr.it fully k-7
139

ARMY ADVERTISING EXPENDITURES (IN THOUSANDS)
AVERAGE PAY FOR ARMY ENLISTEES
i Ki'^.^'CJ I •fcrti.i'OJ J ifc?»*.«?! * iSTM.t«S s l«f »'.7t? t . _ Ifc'a.flIC! t *«.▼«..*«c: t 1<.S?|,.?55 % M7S5.«.!3
11 •••f 77. TCI 11 lli«9.9r:! n _ •tTi.S*01 1! l«.57i..755 1« 1^755.155 1! l*f77.7C1 It tfi.v.t; 1? 9fc7«..6«Ca It ii.5ri..f5i 1« •^•i5.«.«3 iO i«r7'.r:?
21 ii."«.«!:! II 9fcTfc.6f05 12 !l.S7fc.?53
1«. .... n'ss.ns II 10077.70 1« ii»*».^!:! IT 9«.TI..fif:7 II tfc^rk.rti 11 nrs5.«.53 IC i<»rT7.7n 11 li.-9.'T'i? II •u?i..i»c: JJ ib97«,rfa 3* •r?«.«.«: JS i«r77.7C'; M !«.*9.9Tt5 IT 01.71..ftfCJ II 1<.57<..?53 J* n7S5.«.«3 «0 19r77.7Cl »1 •.•.-«.sic; tl 91.71..*«»3
<•! . ll.«.7i..f53 *.•■ 1» »«.<■? 5
.»} 19r77.7C1
«.sq'.iocc f3<.5.ACr.O 5K9.SCCC (S56.1CCa 6823.^30 ii392.1C00 <3i.5.mC 5»J9.e::t t<.36.icsa t4C3.<.3äO S3S?.I:;ü
12 '.Joi.f.'.i S5??.9:ac ti.if..i;C3 eso3.<.:3s ij«2.JCOÜ i3«.5.<::c 5^39.«-c^a ui^.iasi tSC'3.1.33: <.392.1C0C utf.ic:: 5925.9t:0 U<«.1C99 fc8C3.i.LJC •.3S2.1CaG £3-.S.8:3C 5929.eCCJ c<.i6.UJC eü33.4,:c: «•392.uaa f3<.5.a;co siis.eac: (<>vö. 1 C3 3 g«C3.<.C0a «.J92.133C 53<.5.«CCC 5929.»CCC l«.it.l03C t^;3.i.03C «.J'.Z.iSSS ms.icsc 59 29.<>C33 (•.5«.ica:
<•> .tsai.ioaa
Copy ovci'ab'c '~ penu»t iuily iegiul. n
140
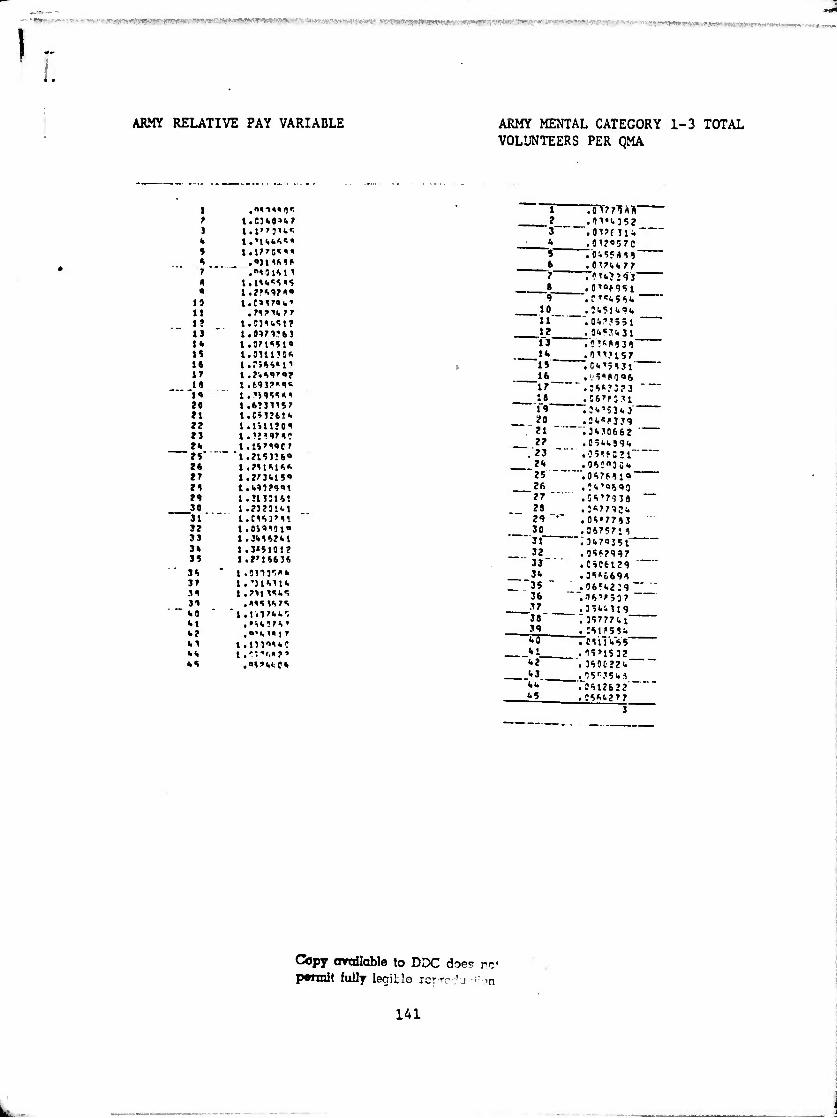
■*" ■ -1•^mrwmiAifMaf'mKtSlar'»«■nwvm-r. ■•..-.•..
..
ARMY RELATIVE PAY VARIABLE ARMY MENTAL CATEGORY 1-3 TOTAL VOLUNTEERS PER QMA
1 an<1<4()r. J l.e)6l«62 3 i.i":'«.'. k l.^Hk«.'!» * 1.12*8564 4 .•)t6«t» 7 " .•<0l61 ' » t.1665565 a l.2»6<^^^a
15 l.C»170(.» 11 ,71^I,M J» llt)66<tT 1J 1.1421213 1* 1.0711510 IS 1.031130* 16 i.r;6s<ii w 1.24 657 0? i« l.fc5J?15«;
'i« t..«)555«1 20 1.6?33'57 21 1.0532616 22 1.1)11201 2J t.3{M26! 2* 1.1S71HC7
"25 '1.215J?6« 26 1.211616«. 27 1.2736150 2< 1.6112901 2<» i.nisui 30 1.23231<.l
"31 l.C1637^. 32 1.0»5*0IO 33 1.31.162 «.1 3I> 1.3>510]2 35 1.2'16636
36 * t .oni'.i» 37 i.')i6im ^ 1.711111.5 31 .11S1«.7S 60 " ' I. 1.17665 «•t ,»66076» <■? .«'■.'•17 61 i.m'»56c fcs t. r:->.» 7-> ".■; ,01»t.tC6
1 :at»2iA» 2 3 " .0T(11W 6 .fl^?057C 5 .OiSe^H 6 ,0126622 7 . CU?29J 8 .O'0f951 9 " .CifcSSi.
10 11
.;i.5l<.96
.0!..'j5;i 12 . 86«3631 13 ,0368838 16 15
.0117157
.0<ii513l 16 17 ".:6*.':?3 18 19
.CS'PMl ;56»SJO-
20 "21 - "
.36<P3.19
.36^0662 ' 22 .D5l<i.J9<,
.23 ■"" .05^5 21 26 25 "~
.OSCnSü". ,0628814
26 .?i.Ta693 27 .06'7^-5a ~~ 28 .;«.77iji. 29 •" .06»7783 30 .3675711 31 -- .3<.70J51 32 .35f?997 33" .C6Cfcl29 3fc
"35 " 36
.35tt,696
.0l?6m~ - ".'16V;07
37 .3561.319 38 39
.3577761 ,561 »5 »6
60 . Cllli.65 61 62
.15»IS32 ' .3SDC22I.
63 ".3612622
US .C66I.J77 3
!■!■! !■ _
Copy available to DDC does ne' permit fully legitl© rcr-T^j -»ion
141
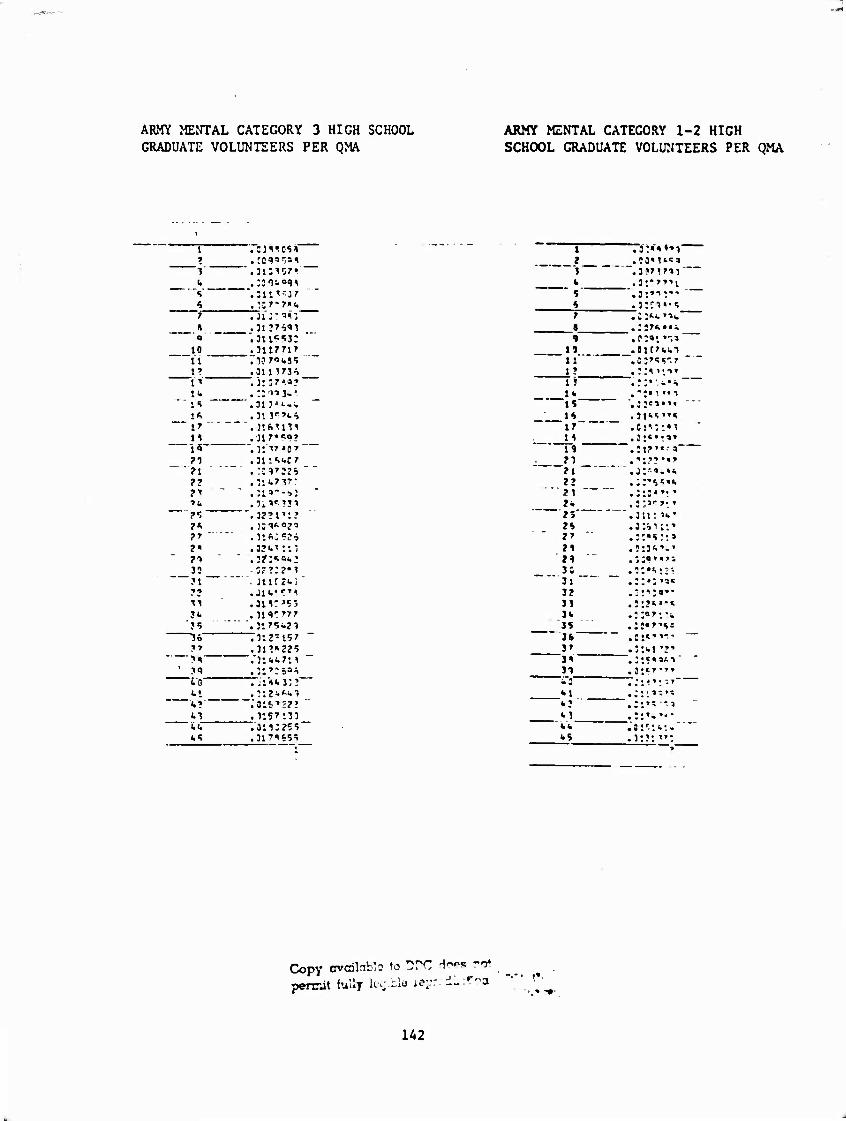
ARMY MENTAL CATEGORY 3 HIGH SCHOOL GRADUATE VOLUNTEERS PER QMA
ARMY MENTAL CATEGORY 1-2 HIGH SCHOOL GRADUATE VOLUNTEERS PER QMA
"o^^csV . CO^r.a, nsiori
J 311*137 r:r'7ii<. JU'^;
J 3177^11
3117717 UTO^SS aiivsö hsr*«?
— 1«! . — IT -•
3! 3^'i.S
\9 •jl7»«;o>
)1TT«0»
" 311«.'.C7
31 «.717 • fr :i3*-53
34'C.7I1
32 ?1'1? jsqtcj-. 3ifi;=?i a?".» in
71 j?:*«^:
" JliC2<.; JH.«CTS 3H:'5J inrrTT 31 75 »21
,"312-157 31?«« 225
■jiM.m i - q
j:»:i«^ jiHts:?
—v» Ill* «■'.1
■Olf'327 ,3157 133 ,311:265
k% 3l7*«.55
7
« 9
1) i:
_i? i r
_:«. ts- is
'lf~ 11 19 ' 23
"2 I " 2» 21 2<. 25" 25 2^ 21 29 3: 3l * 3? 33 3«. J5 J»-
J7 "31" 31
M
•«3
.3!«1»->1"
.:?7^7ii"
.5l"TT'»l
.•l»V
.3;:i«-5
.::«•«'1«." _.;57<,««i
_. OlC'i.i.1 .C3»^5-.7
_.!: i' • ■«» • ::•• .«^ "
• Ciill'l .5i«,:i'_
~.;i?'«-a .,:.'7,«T
.J:-«.««.
.::'5S".
. 3 :*r »I' ".3n: ^k' . J 3» 111' .::«5::' ^IS«.'-' .;:•»•'--
.::*: »•« • 3 fi**** .:'.}'■'•'■ .::e7:«4
.::«7»s« • Cl«'»*^ .311.1 '?'
~. :i««ai->
.:ii»! •'-■
.8iri.i.:- ,3i7i":
Copy cvdlcrb!? to !:rC rfo« rrt permit fully leg.bla lepr l-^-a
••-■ ,r
142

ARMY RECRUITERS PER QMA PROPORTION OF BLACKS IN THE YOUTH POPULATION
1 Tfj H*1 > , »war«
" "1 ~ ■ " . ■ i ?:s*" k tc n«.«. t * J !••.•. « C i :,»:• 7 »«.« 4 r •» »;»> -. ^ ..^
• y 1057
ta j 3 mj it C3 l»»7 11 r j;*«
i? " j; :;.r
it ■ j '.«7 1 is • J nti t« • * mi _;r 33 r?:-> i« -1 <-i*
*"H :; ■•'.7
?J - - '•.7: .. ?i J ] I'll
I? J J »%!.7 ' ^^ ]] »»•*
?<. J. ••5ft Z5 n ' '* ? ?S ■ - 1*31 ?» e: »1?» ?< - 1 »!53 21 " j 3 ?J7; 11 3 j : 7^*
• »I 1 'I« 3? w ■ »7-3
' I! 9] •»5;« U 7:»4
" J* • <« J
,03
IH.1 IH ■•:J'! 37 ^ ■•'.J4 _Jl.. . .:: •»»51 31 i « 4 ?i ; o • w ?' Ts fcl 1513 fcZ * - ?5:? k] < d i »<.:J fct .8] »Sftl «•5 ■ a »3:?
'. ;uMi.t .:i75::t
■.ci:«>i?"
~ intty» .C7»5*44
.i3:".s-»
.iv:'55 ■.i:>3?3i.
.:n7?»»
.J»71!1fc
.CS1571.?
.C7S«!?''
.Cb?771,S
.?i;'7»-»
.JMS«,7»
.25T7S1»«! ■,?it:»i«i .2375*?' -. S7ii;<» :
.•.^l.i'■0■,
.175'San
.J?19^.i.■,
■.S?7*s0? _:_ai?2<>7t_ .!5:S217 .51Jla45 .:<57?T'
■.:S2S52 4" .:S5S5«1
Co|»f trrnilabl« to DDC does not pwtnil fully legible reprcf' ; »; n
143

AVERAGE PAY FOR NAVY ENLISTEES NAVY RECRUITERS
<.s
k]|7.tCCI J]*«.10C3 MM.»:te Mii.ssei W.,Sitt «]t>.l!CI •Ski.ti;c 5«M.S:C: iiti.scei »/«(.sees m».et:: D«. •.!'.:: 5«f !.«e:c Ull.ICCt
till>.IC(| IIM.1ISI
t7e(.]3l3 <.J*7.JC:: Ilkl.llCI >«7i»i:t: 6tc3.J::; »;«t.!t:< kiti.ict:
}<./«.»C3} itcj.jcc: trtf.isct
SJht.lCCO •in.IDS: tiH.itt:
(•jei.tc:: MM.13CC s<78.soc: «ftldCCS f>7t».:'.:c «••t!.:::: si<.4.:ec) •«Tt.lCCC »«cj.seec »rtt.icei
i
t r s h
"'< &
« _ >..
19
• ^ ' t »"
tfc ' I*
!•> 'it
t« ~t •
»: »i
;r
U «1
1^
in" ^» J* '
«t.ioic «i.ieie
t2«.0O3 in.a:fi ttl.CSJ t.n.::c %n.tec »33.«33 • (t.433 4/3.333 »2!.1)9 bU.IIS * 11. i a i »•.cm »ik.a«: i>«.):e • <.e.3i: 301.333 joi.:c: 333.33:
»ItdlS 2ft.330 iti.i;: 3k«» tat
«.>/.33: -•«•1.333 l!3.3:3 :!J.3:: >3k.l]l 332.::: 2k«.3&0 2M.::: 21li.3c: lt%.3i: 211.3C: 3rk.::c 342.333 I?«.is:
M.U4C 13*.63.
Copy ovato1« to penrjt tul.T
rTyr w-
144
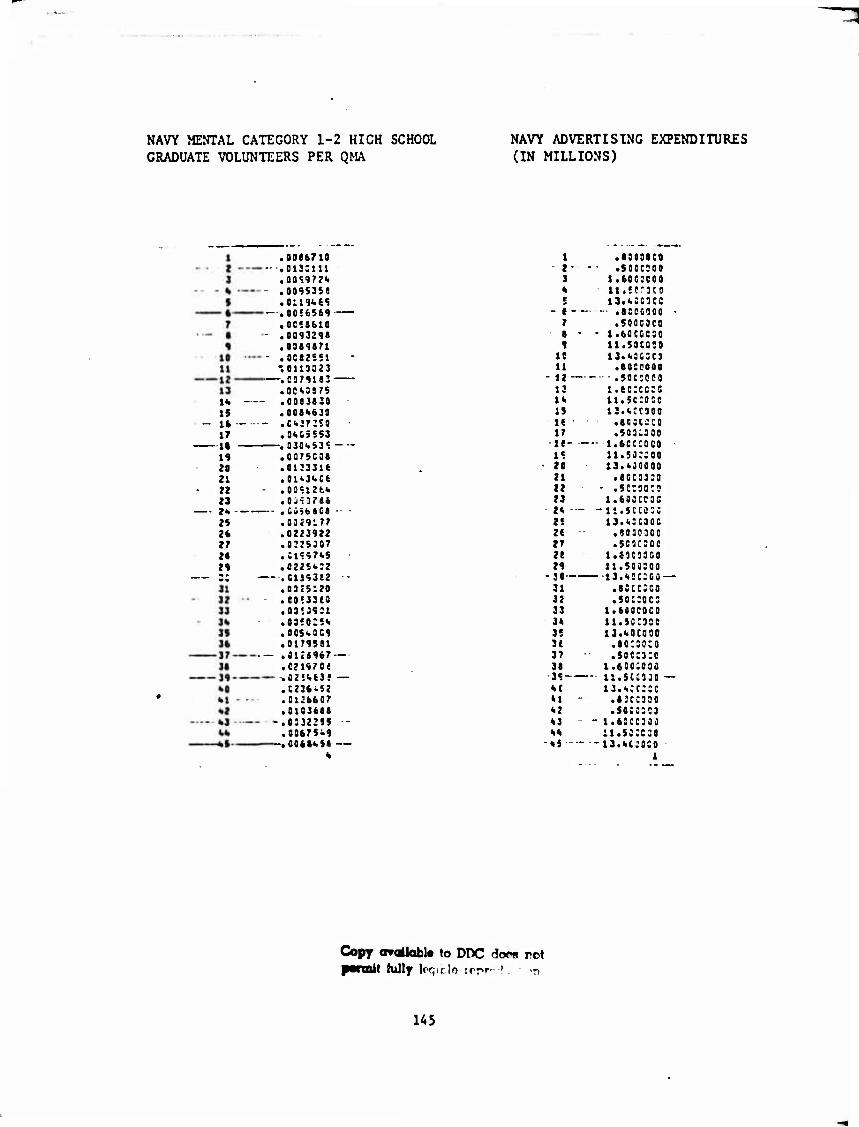
NAVY MENTAL CATEGORY 1-2 HIGH SCHOOL GRADUATE VOLUNTEERS PER QMA
NAVY ADVERTISING EXPENDITURES (IN MILLIONS)
t« 15 16 17 IB 19 20 21 22 23 2*. 25 2b tT 2« 29
.0086710 - .oijcm
.00<97?«i - .009535«
.o:i9<.es - .0056569
.0C!S610 - .009329«
.0369871 - .0C82S51
-.0110323 -.COMISJ .0Cii3S7S
-- .0083830 .0084630
- .c<.j7:5o .3SC3553
. 030W53? .0375338 .0133316 .OtObCt
- .00«l2fc<. .0J>37ie
.0ii5b«C8 • • .fla<9l77 .0223922 .8225307 .Sl?97<.5 .0225<<32
.01893(2 - .8325120 .80*33(0 . 03 < 39 31 .03*0:5<> .005<.8C9 .0179581
- .ai:«9b7 — .021970« .02'.(.63 • — .C226.;j .0136607 .0103688 .0332255 - .88675^.9 • fiobt^s«—
6
1 .83880C« 2 - .SOOC308 3 1.68CCCO0 * ll.5Cr3t0 i 13.t;CKC
- * - .8CeC<300 7 .5000300 8 - " 1.6000000 1 11.500000
18 13.<>9C3C3 11 .SOCOOOO 12 ■■.5000000 13 i.8c:cc:!: 1* ll.SCOOCC 15 i3.<.:caflo It .803C3C0 17 .500.000 18- —- J.6CCC0C0 1^ ii.5a::oo 20 13.400000 21 .8003338 22 - .sctoocs 23 i.6aacc3S 2«. - -11.500303 25 IJ.tSCOOO 28 .8030300 27 .5C003OC 28 1.83:9300 29 11.500300 3 0 ■13.<IOC300'
31 .8scc:co 32 .5o::ocs 33 1.600COC0 14 11.50:3:0 35 13.V0C3C0 3£ • scoGoa 37 .500:3:0 38 1.6300000 39 11.500330 6C tJ.6cc:co »I .«:CC330 61 .MCSSSJ 63 " " 1.6000000 66 11.50:0:0 65 is.tczoso
1
Copy arailabl« to DDC doo« ret it hillf lo^itjo rr^r- ! -n
U5

NAVY MENTAL CATEGORY 3 HIGH SCHOOL GRADUATE VOLUNTEERS PER QMA
NAVY MENTAL CATEGORY 1-3 NON-HIGH SCHOOL GRADUATE VOLUNTEERS PER QMA
9 m .(inn
- I - .onsst S .C(17«S
■ • * • ejiu; s .c::s:t
- 1 .Ktllt 7 .IIIIS9 • - - .tOlitt 1 o jaut
10 .ti7t{e 11 .e:o«ts
- 11 .!C91»* 12 .1 (3iit l* ,lt77S! 1! .(Cl'fi It - ,««7«J: 1» .C«17«
-1« «;JMC 11 t isj".; 21 .093117 21 .UISIS 22 (KOll 2! (1790^ 2» . CCfOJfi II .(tjc;7 It a;56 = j 27 C22222 2« .c:%:>>t IS .Citill
ittiei 11 .31221« J2 " . .i;i«ll 2! et79»t' !<. . C(7tl« It Otli-J it lt«7ll 17 - (:i3<.2. 21 3il<i3f » .C<91I7 U e:»7tt <il 3M222 ••2 IJStti <•} --. ecu« H l CCSCS' «1 , t(J«.72<
1 .0122132 > -,CC«9t?3
3 .(CSC39Ö * .«1(1777
1 .0172739 * — — •fiCJKll
7 .ttl<.3'i9 .._ | .0072133
0 .eC79)t<> It - - .G10$kfi9
11 .IUJ2'-. 12 — -•.CCi73i.O
13 .c(4si:t Ik - .OClbOSI
1» .icesw .... x% - .c<iKii:o
17 .S!ei7<>3 It- —.CH«.e9J-
ll .CC(27!1 •— 20 - .ac$i9:b
21 .I::<OII<I 22 - - .CC:!»39
23 .::ai6e5 2W - —.C:i5ö52
25 .:029363 - 26 — — .ClJdSt/
27 .a2!«US - 1« .(112311
29 .!iiCG<>5S JJ-- —kcmm
31 .os:7e:t — 12 - - .CJ'-lt.U
33 .C97C7li — 3(, . .C07tO*2
II .CU97S$ It .oi:n<.i 17 .tl'.37t3 10 .citzm
-- 39 - - .fl2ilS7l M .C<!9>C7 «1 .Clt3ai7 «2 .CC227«!
- - hi - .ocjstrs M .C0Ult2
-- *» -■»COJ0912 3
CV py cv-rilohlr permit JuUf \-
146

■ t
I
NAVY RECRUITERS PER QMA YOUTH UNEMPLOYMENT RATE
.001009«,
.ocmia
.0010J15
.OOOS!!? ,303533. ..
- .OCl*?«.« .OOl.'iS?
- - .031326« .0917037
.0015265 .000(604 .ccoeraj .CC04377
- .OOt?^!. .OCSZeSZ
.ocei.i.a - .0015711 .00l<>07 .'CliiZt .0Q16<>1C .001343)
.0011367 .äefl722e . C02<9!Hö .S3373C1
- .J038i.$3 .flC3i.'.97
.OCSOtSe ,0011773 .OOCS^Zl .0Cl39te .00U932 •coiotat .00<.312i
- -- .3026622 .3C2<.<)7<.
.0aJ2t;03- .00i<3737
.üCl«9<i .3017iil9
- - - .0033815 .C303S56
-.0003822- 1
it'
It It Xt
I- '.* IS \r l«
"»• ?e »i »»
'*% ?» ft ?■ »a ): it' i? v 1«. 1*
"If 1»
to
-:
<.5
».rocsreo - - 13.<>«l(<!0
i«.ti::ii — *.5:c:::8
2.:::-c;: — i.ticitci
u.<e:c«i — tt>it::s:
1.;3J:::: — io.z(3:co
».$3oeeeo — 6.2J::^:O
ti.ftscca e.*:::::: ».s:::e:o 4.s:::c:; 5.9::::::
--• ♦.iir«'»3;3 >.k:;3e:s ••i<«i:ei 3.«:]::::
• «.cc::::} r.::::;:3 >.it:c::} 7.3::5;:c 3.*J:::3:
fc.<:::::c r.eacc.s:
—-r.ijci:;; ■ 6.9:::::: t.7j::;;c ?.33:;:5:
5.i.:o::3i
t2.<t:c:: i«.to:3ta
-- 7.ic;c;:: to .2::::: :2.7::k53 i5.3::::o
■ i3.ie:::c is.it:::: It >'***•*
Copy available to DPC doe« r"» p«nnit fully lefj'ble rc^: . ■ . ' n
1^7

NAVY RELATIVE PAY VARIABLE CIVILIAN PAY VARIABLE
1 ".•<<<»| ik f i.eik'tk« i I.M4MI» * l.A'l*«« « l.t^T»«*' 4 .•m«*» ? .M?mfc < t.t»fc»*4« < i.rik«9it
I« t.K^nn li •ritMt« I? t.OKJ»»« 11 i.n«4«k» Ik l (|K««*k 11 1.«J<«13« 1* 1.?>***»» I» l.t»***.*1- 1* l.Tir\t,fi M l.fc)3»«k» n 1 .ftw«»«.?» ti l.3^»^«^•• H l.t«t«M ?1 1.J»««»31 ?» i.nkst «•
' *»» - 1..*310*4» »•t 1 . ?13 'M 1 1» 1.?'*»)?(! M t.t)?fl J? I« I.Ik MM' IS I.IM'tn
"Ti- i.o»53:k« lt i.s'tkkri II l.Mi^rfi i* i.ki*^»r M l.tittlt« 1« I .»••»kl^
1/ i.n»k»fc'» M i.'iit»*' J1 .•3^*'hi *1 I.I ii«'.k» *1 .»\«»^ek k» ,•»•■. ■>•■»*
kl t .M'l«'» kk l.||^^».••• kt .•»"•n •
"l" k»jr,«f33 e SJ2k.a003 ) »03C0C"1 k SJU.OBOO l s/to.oooa • karg.oaoa T SkSk.COOO t 5006.0000 « $7o;.oaoo
10 «II0.0OJ1 11 Sklk.OGO) It IIO1.0CC0 tl 4". Jl. OCJO
Ik to;;.0309 IS t»S«.0g3C 1» JkiS.CCI'J 1/ kitr.oRco 1« 353?.0303
kMk.0C03 .2« kMl.OOII tl kiro.0000 tt ktOk.0033 23 kk>;.ocoa Ik $$?".0C03
$$C4.!033 fk jhrr.actt ?y klf^.CUOU II 39 79.03C3 11 ' Mtw.ojo; 3« 16*3.3030 Jl ktkk.OOOO » k«47.0000 11 kjir.oooo Ik k64S.e030 IS 1310.OSOO J( k?7r.oooo it kior.ooao it kkkf.OOQO Jl VSf.Orij »t kl'ik. JOftO kt SO^^.OOOO kt »411.0001 k) ij">. 0301) kk 11 1). COnl kk **i>5.0103
-•■ T- rot P.. j •• ovrilablc '"
148

Appendix D
DETERMINATION OF TRUE VOLUNTEERS AND MENTAL CATEGORY GROUPS
TRUE VOLUNTEERS
Monthly estimates of true volunteer enlistments for the months prior
to July 1973 were made from an analysis of the lottery numbers of acces-
sions for each month. Volunteer accessions were calculated from the
following formula:
k 365-240 . ... ik o i»241
where
E, - true volunteers for month k. k
a , > total accessions with lottery number i in month k.
a ■ total accessions who enlisted before the lottery draw for
their age group.
By use of this formula, it is assumed that youth with lottery numbers
greater than 240 felt no draft pressure and are true volunteers. The
formula was derived by an analysis of typical distributions of enlistees
by lottery number. Enlistees who enter a branch of service prior to
publication of their lottery numbers and enlistees still 17 years of age
are assumed to be true volunteers.
MENTAL CATEGORY GROUPS
Classifications of enlistees by mental category are made by use of
the Armed Forces Qualifications Test (AFQT) scores present on each enlistee's
USAREC accession file. The scores for the separate categories are listed
below:
Mental Gate gory Group AFQT Score Percentile
93-100
66-92
31-65
11-30
0-10
149

Appendix E
GEOGRAPHIC REGIONS
There are four census regions which are distributed Into nine geo-
gtaphlc divisions. These nine divisions and the states Included within
them are presented below.
Northeast Region
1. New England Division (NE)
Connecticut Maine Massachusetts New Hampshire Rhode Island Vermont
2. Middle Atlantic Division (MA)
New Jersey New York Pennsylvania
North Central Region
3. East North Central Division (ENC)
Illinois Indiana Michigan Ohio Wisconsin
4. West North Central Division (WNC)
Iowa Kansas Minnesota Missouri Nebraska North Dakota South Dakota
South Region
5. South Atlantic Division (SA)
Delaware District of Columbia Florida Georgia Maryland North Carolina South Carolina Virginia West Virginia
South Region (continued)
6. East South Central Division (ESC)
Alabama Kentucky Mississippi Tennessee
7. West South Central Division (WSC)
Arkansas Louisiana Oklahoma Texas
West Region
8. Mountain Division (MD)
Arizona Colorado Idaho Montana Nevada New Mexico Utah Wyoming
9. Pacific Division (PD)
Alaska California Hawaii Oregon Washington