Renewable liquid film-based electrochemical sensor for gaseous hydroperoxides
11
ELSEVIER Talanta 44 (1997) 605 615 Talanta Renewable liquid film-based electrochemical sensor for gaseous hydroperoxides Huiliang Huang, Purnendu K. Dasgupta * Department of Chemistry and Biochemistry Texas Tech UniversiO,, Lubbock, TX 79490-1061, USA Received 16 July 1996; received in revised form 16 August 1996: accepted 16 August 1996 Abstract Electrochemical sensors for hydroperoxides based on thin flowing films were investigated. The sensor is composed of two segments of Nation tubing put on a silver wire. A small portion of the silver wire is exposed and is chloridized to function as the reference electrode. One Nation segment has a Pt-wire coil wrapped on it to function as the counter electrode and the other has a similar Pt-Rh wire coil that functions as the working electrode. A collection solution flows as a thin film on the sensor surface and also functions as the collection medium. Hydrogen peroxide and cumene hydroperoxide were examined as test compounds. The former can be oxidatively determined with a Pt-Rh electrode over a large range (ppb-ppm) without any significant influence of relative humidity. By using a technique to stop the liquid flow, the sensitivity can be further improved. Cumene hydroperoxide, an industrially important hydroperoxide, can be determined easily with a relative precision of better than 5% in the vapor phase over simulated process reaction mixtures containing percentage levels of the analyte by reduction on a Pd electrode. The sensor is simple and inexpensive to fabricate and requires only a suitably equipped personal computer for operation. © 1997 Elsevier Science B.V. Keywords: Electrochemical sensor; Hydroperoxides; Renewable liquid film I. Introduction In recent years, we have been fascinated by utility of small liquid drops and thin films for sample collection in biphasic systems, such as the collection of a gaseous analyte or solvent extrac- tion, with analysis either in situ or on-line [1-7]. While much of this work has focused on the use of optical detectors, is was realized from the in- ception [1] that electrochemical detection should provide a very powerful means of in situ detection * Corresponding author. in these systems. Liquid drops and films have had a long history in electrochemistry in particular, the recognition that falling drops continuously provide a highly reproducible and renewable sur- face led to the dropping mercury electrode (DME) [8]. The invention of the DME ushered in the modern era of instrumental analytical methods and resulted in the 1959 Nobel Prize in Chem- istry, the first related to instrumental analysis [9]. The DME itself operates best in the analytical concentration range 10 3-10-5 M. Below an analyte concentration of 10-5 M, the background current becomes comparable with the diffusion 0039-9140/97/$17.00 © 1997 Elsevier Science B.V. All rights reserved. PII S0039-9t40(96)02069-3
-
Upload
independent -
Category
Documents
-
view
1 -
download
0
Transcript of Renewable liquid film-based electrochemical sensor for gaseous hydroperoxides

E L S E V I E R Talanta 44 (1997) 605 615
Talanta
Renewable liquid film-based electrochemical sensor for gaseous hydroperoxides
Huiliang Huang, Purnendu K. Dasgupta *
Department of Chemistry and Biochemistry Texas Tech UniversiO,, Lubbock, TX 79490-1061, USA
Received 16 July 1996; received in revised form 16 August 1996: accepted 16 August 1996
Abstract
Electrochemical sensors for hydroperoxides based on thin flowing films were investigated. The sensor is composed of two segments of Nation tubing put on a silver wire. A small portion of the silver wire is exposed and is chloridized to function as the reference electrode. One Nation segment has a Pt-wire coil wrapped on it to function as the counter electrode and the other has a similar Pt-Rh wire coil that functions as the working electrode. A collection solution flows as a thin film on the sensor surface and also functions as the collection medium. Hydrogen peroxide and cumene hydroperoxide were examined as test compounds. The former can be oxidatively determined with a Pt-Rh electrode over a large range (ppb-ppm) without any significant influence of relative humidity. By using a technique to stop the liquid flow, the sensitivity can be further improved. Cumene hydroperoxide, an industrially important hydroperoxide, can be determined easily with a relative precision of better than 5% in the vapor phase over simulated process reaction mixtures containing percentage levels of the analyte by reduction on a Pd electrode. The sensor is simple and inexpensive to fabricate and requires only a suitably equipped personal computer for operation. © 1997 Elsevier Science B.V.
Keywords: Electrochemical sensor; Hydroperoxides; Renewable liquid film
I. Introduction
In recent years, we have been fascinated by utility o f small liquid drops and thin films for sample collection in biphasic systems, such as the collection o f a gaseous analyte or solvent extrac- tion, with analysis either in situ or on-line [1-7]. While much of this work has focused on the use o f optical detectors, is was realized f rom the in- ception [1] that electrochemical detection should provide a very powerful means o f in situ detection
* Corresponding author.
in these systems. Liquid drops and films have had a long history in electrochemistry in particular, the recognition that falling drops cont inuously provide a highly reproducible and renewable sur- face led to the dropping mercury electrode (DME) [8]. The invention o f the D M E ushered in the modern era o f instrumental analytical methods and resulted in the 1959 Nobel Prize in Chem- istry, the first related to instrumental analysis [9].
The D M E itself operates best in the analytical concentra t ion range 10 3 - 1 0 - 5 M. Below an analyte concentra t ion o f 10-5 M, the background current becomes comparable with the diffusion
0039-9140/97/$17.00 © 1997 Elsevier Science B.V. All rights reserved. PII S0039-9t40(96)02069-3
606 H. Huang, P.K. Dasgupta /Talanta 44 (1997) 605 615
current due to the analyte, thus restricting any further improvement in the limits of detection (LODs) in classical polarography. On the other hand, if a renewable liquid film is made to cover conventional metallic electrodes, it may be possi- ble to determine much smaller analyte concentra- tions in the liquid. Mercury film electrodes, for example, have been extensively used to improve sensitivities and detection limits over those attain- able with conventional solid electrodes [10-14], although the stability of such electrodes may be a problem [15]. Looking at more conventional liq- uids for forming a film for electrochemical sens- ing, if the liquid film is of suitable composition, such a film can be used for the collection of gaseous analytes, with the film serving as a minia- ture sampler/preconcentrator. If the analytes col- lected into the film are electroactive, electrochemical sensing would be simple and at- tractive.
Hydrogen peroxide is an important atmo- spheric oxidant [16] and we have been interested in the atmospheric measurement of H20 2 for some time [17,18]. Hydrogen peroxide is also used as a sterilizing agent in bioreactors and for safety reasons it is desirable to have a means for moni- toring residual concentrations after sterilization has been completed. Hydroperoxides (of which H202 is the simplest member) are reactive oxi- dants that are electroactive. Some organic perox- ides are also industrially important as polymerization initiators and cross-linking agents, dicumenyl peroxide (DCP) being particularly im- portant [19]. DCP is typically produced from cumene hydroperoxide (CumHO2). A typical reac- tor mixture may contain an aromatic alcohol (such as phenylpropan-2-ol) or phenol, a ketone such as acetone or acetophenone and cumene. CumHO2 itself may also be used for the radical polymerization of methacrylates [20] and the acid hydrolysis of CumHO2 to yield acetone and phe- nol is a major means of production of the latter two compounds, necessitating the use of CumHO2 in quantities of many thousands of kilograms [21]. In a typical industrial application, it may be desir- able to control the concentration of CumHO2 at the levels below 10%. Rather than sampling the complex liquid mixture, monitoring the vapor
phase in the reactor is an attractive alternative for monitoring the CumHO2 content. Electrochemical sensors for H~O2 are well known [22]. In the present work, we explored the utility of a renew- able film-based electrochemical sensor for measur- ing hydroperoxides from low ppb levels of gaseous H202 to vapor phase CumHO2 present in percentage levels over the liquid.
2. Experimental
2.1. Reagents and materials
A stock solution of 1 M H~O2 was prepared from 30% H202 (Fisher) and standardized by iodimetry [23]. Lower concentrations of H202 were prepared fresh daily from this stock solution. Nation tubing (dry dimensions 1 mm o.d., 0.8 mm i.d.) was obtained from Perma-Pure Products (Toms River, N J, USA). Non-conductive epoxy adhesive was obtained from Decon (Danvers, MA, USA). Platinum, palladium, platinum/ rhodium (30%) and silver wires were obtained from Aesar (Ward Hill, MA, USA).
2.2. Instrumentation
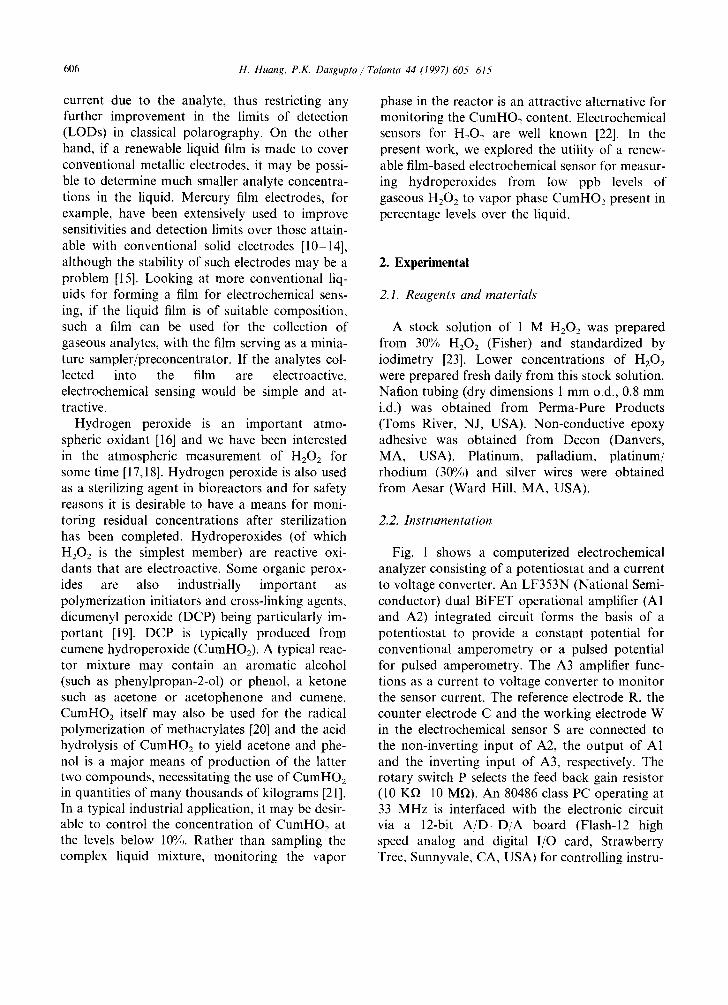
Fig. 1 shows a computerized electrochemical analyzer consisting of a potentiostat and a current to voltage converter. An LF353N (National Semi- conductor) dual BiFET operational amplifier (A1 and A2) integrated circuit forms the basis of a potentiostat to provide a constant potential for conventional amperometry or a pulsed potential for pulsed amperometry. The A3 amplifier func- tions as a current to voltage converter to monitor the sensor current. The reference electrode R, the counter electrode C and the working electrode W in the electrochemical sensor S are connected to the non-inverting input of A2, the output of A1 and the inverting input of A3, respectively. The rotary switch P selects the feed back gain resistor (10 Kf~ 10 Mf~). An 80486 class PC operating at 33 MHz is interfaced with the electronic circuit via a 12-bit A/D-D/A board (Flash-12 high speed analog and digital I/O card, Strawberry Tree, Sunnyvale, CA, USA) for controlling instru-
H. Huang, P.K. Dasgupta / Talanta 44 (1997) 605-615 607
D-O-1 i D-O-2 N D i .... ! i .
r-- I 80486 PC • . . . . . . .
Fig. 1. PC-based electrochemical detection system. AI-A3 = FET-input operational amplifier; S = sensor (C, R, W = counter, refernece and working electrodes); F I2DB = Flash-12 and daughter board housing D/A and A/D units and digital output-controlled relays (D-O-l, D-O-2) that govern valves V1 and V2.
ment operation and data acquisition. The digital to analog converter (D/A) can generate a constant voltage for amperometric measurements or any desired pulsed waveform for pulsed amperometric measurements. The analog to digital converter (A/D) acquires data from the A3 output. The digital outputs D-O-1 and the D-O-2 provide independent means for controlling valves V1 (see Fig. 2) and V2 (valve for stopping liquid flow, see below). Instrument control and operation are con- ducted by software written in-house in C and available from the authors on request. The opera- tional details are given below.
2.3. Test arrangement
The sampling manifold and test gas generation device (reactor-simulator) are shown in Fig. 2. All gas flows are metered by mass flow controllers (Model FC-280, Tylan General, Torrance, CA, USA). Compressed house air is fed through a pressure regulator and purified by column C, containing sequential beds of silica gel and acti- vated carbon. The pure air flow is then divided
into three streams. One stream, metered through M4 (maximum 500 cm 3 rain - l), flows into the gas generator. For H202, the gas generator is a length of porous hydrophobic membrane immersed in H202 solution of known concentration; the exit gas is in Henry's law equilibrium with the solu- tion. Details of such an H202 source are given elsewhere [24]. The exit H202 concentration is readily computed from published Henry's law data for H202.
To test the feasibility of monitoring CumHO2 in a reactor that may typically contain 49% phe- nol, 23% acetone, 15% cumene and 3% CumHO2 by weight, we mimicked this composition in the generating liquid except that acetontirile was sub- stituted for cumene. The amount of CumHO2 was varied by varying the CumHO2 and acetonitrile content, maintaining a constant amount of phenol and acetone. Approximately 150 ml of this liquid was put in a 500 ml capacity Erlenmeyer flask, with the air inlet tube located 1 cm above the liquid surface and the exit tube 1 cm below the silicone-rubber stopper. The gaseous CumHO2 output from this source was stable, but the exact gas phase concentration was not determined.

608 H. Huang, P.K. Dasgupta / Talanta 44 (1997) 605-615
V e n t
S~nsor : -[ M1 ~ i Pum p I Air ou t l e t r . . . . o r ~ - - i i
~ ~ Vent !
v1
I '
- - . [
. . . . . . . . ~ KA. i_ _ _ _ I I
Compressed House Ai r
Fig. 2. C = silica gel/activated carbon column for air pruification; M I-M4 = mass flow controllers (M 1 controls sampling rate, M2 controls zero (pure) air flow, M3 controls dilution air (may be partially humidified, see text) and M4 controls flow through the test gas generator (depicted as a bottle)); VI = three-way PFA Teflon solenoid valve.
The exit gas from the generator is diluted by pure dry air metered by M3. The gas concentra- tion generated in the merged stream is thus con- trolled by choosing an appropriate flow-rate ratio of M4 and M3. The humidity of the test gas was varied by dividing the stream after M3 into two parts and putting a controlled amount through a water bubbler, then recombining the wet and dry streams before addition to the gas generator out- put. The humidity of the final mixture was mea- sured by a capacitance-type relative humidity probe.
Either the test gas stream or the purified air metered by M2 is selected by three-way pe- rfluoroalkoxy (PF) Teflon valve V (Flouroware, Chaska, MN, USA) to be sampled by the sensor. The gas is aspirated by the air pump P at a flow-rate determined by M1 (1 1 min-~, unless stated otherwise). All remaining flow streams are vented.
2.4. Sensor fabrication
Fig. 3 shows the sensor construction. Two 15 mm long segments of Nation tubing are slipped over a 1 mm diameter silver wire, leaving a 1.5 mm segment of bare silver surface exposed be- tween the two tube segments. The exposed silver is anodically chloridized for 10 min in a solution
of 0.01 M HC1. This functions as the reference electrode (RE). A 0.2 mm diameter platinum wire is coiled on to one segment of the Nation tubing to function as the counter electrode (CE) and a 0.25 mm diameter Pt/Rh (30% Rh) or a Pd wire (127 lain) is coiled on to the other, downstream, segment of the Nation tubing to function as a working electrode (WE). The assembly is then put into a polypropylene T-fitting T1 (3/32 in 1.8 mm i.d.), leaving the working electrode exposed out- side the bottom end of the fitting. Epoxy adhesive is then liberally applied to cover up the top end of the fitting with the electrode connections protrud- ing. Liquid (see below) is pumped by a syringe pump (Model 341, Sage Instruments) through the tee arm and flows as a thin film on the surfaces of the CE, the RE and the WE, forming eventually a drop at the tip of the sensor that periodically falls. The sensing arm of T1 is inserted through a hole drilled into another, larger, tee T2 (6.5 mm i.d.), directly on the top of the vertical arm of the latter. The sample gas enters through both the horizontal arms of T2, connected to a common inlet. The sample is aspirated concurrent to the liquid flow, first coming directly in contact with the film covering the WE. (Because the incoming sample gas directly contracts the bottom Nation segment, it is advantageous to have the working electrode located on this segment. If the sensor
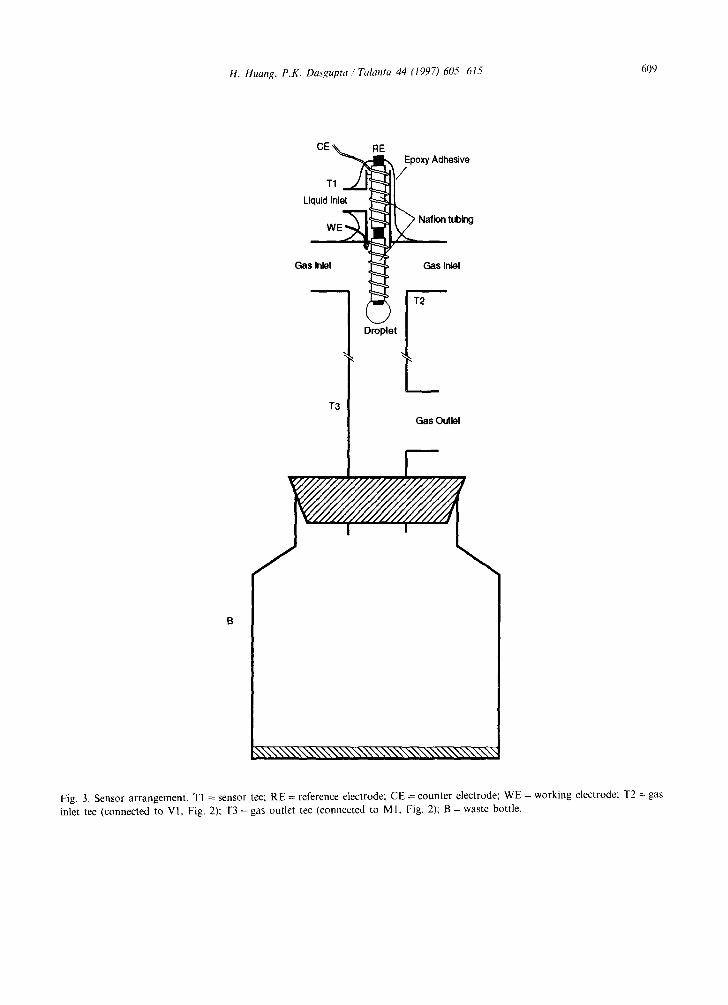
H. Huang, P.K. Dasgupta /Talanta 44 (1997) 605 615 609
CE,~ ~E - ~ N Epoxy Adhesive
Liquid Inlet
Gas Inlet ~ Gas Inlet
.... ( ~ T2
Droplet
T3 Gas Outlet
~ x , ~ ~ x , x \ \ \ \ N , ~ \ ~ \ \ \ ~ \ \ ~ \ \ ~ \ ~ \ \ ~ " ]
Fig. 3. Sensor arrangement. TI = sensor tee; RE = reference electrode; CE = counter electrode; WE = working electrode: T2 = gas inlet tee (connected to VI, Fig. 2); T3 = gas outlet tee (connected to MI, Fig. 2); B = waste bottle.
610 H. Huang, P.K. Dasgupta /Talanta 44 (1997)605 615
< °° l (°) 201 / /
. I
/ " -- -- B l a n k w V I ppmv H202
i 6 0
0,00 0.50 I ,Oq Applied
5 i
0
'i 5
(b)
- - - Blank vapor over 14~ CumH02
0 i i i J J , ~ i i I J r , i i ~ i J i
-0.80 -0.40 -0.00 Voltage, V
Fig. 4. Cyclic voltammograms of gas phase (a) H202 and (b) CumHO2. Sensor construction and film composition are indicated in the text. Liquid and gas flow-rates are 15.3 ~l min-~ and 1 1 rain-t , respectively.
assembly were to be placed further down T1 such that the entering sample gas first contacts the top Nation segment, the working electrode would be best placed on the top segment). Following a short length of connecting PFA tubing, the gas exits at the bottom through another tee T3 while waste liquid is collected in a bottle B.
3. Results and discussion
3. I. Sensor parameters
H202 can be determined either by oxidation to 02 or reduction to water, while other hydropeox- ides are determined by reduction. In atmospheric samples, to avoid interference from other concur- rently present oxidants, H202 is preferably deter- mined by oxidation. Sensor parameters that are readily selected include the choice of the electrode material, the film-forming solution and the nature of the reference electrode. In the present work, many combinations of the sensing and counter electrode materials were investigated. For the oxi-
dation of hydrogen peroxide, the best working electrode was found to be Pt/Rh (30% Rh), while Pd was found to be the best electrode material for the reductive determination of CumHO2. Regard- ing the choice of a reference electrode, a silver/sil- ver chloride electrode is convenient, inexpensive and easily miniaturized. A minimum concentra- tion of chloride is necessary for the electrode to maintain a constant reference potential; this can be accomplished by incorporating some constant concentration of chloride in the film-forming solu- tion.
As a suitable sink for H202, water itself is sufficient. To promote the formation of a smoothly flowing film, a surfactant such as Triton X-100 (TX-100), 0.3% in concentration, is effec- tive. Thus, for H202, we use a solution of 0.3% Triton X-100 and 1 mM HC1, the latter providing for a stable reference potential.
Unlike H202, CumHO2 is very poorly soluble in water. Several water-miscible organic solvents such as acetonitrile, dimethylformamide, dimethyl sulfoxide, ethylene glycol and glycerol, in mix- tures with water and salt solutions, were investi-

17
(o) 1.6
1,5
<
C 1.3 (D k._
1,2 (.3
1.1
1,0
0~9
H. Huang, P.K. Dasgupta ,' Talanta 44 (1997) 605-615 611
f l l l l l l l b l l l l , l l l l l l 1111 f l t , l l t t l J
60 110 160 210 T i m e , s
1.2
0.8
i'i . J i i i i i r i i i ~ i i r i i i i
0 500 1000
Gas Flow Rate, I rain -~
Fig. 5. (a) Sensor output during the sampling cycle, ca. 20 ppbv H202, flow-rates as in Fig. 4: (b) dependence of the signal on the gas flow-rate, liquid flow-rate 15.3 ~tl min ' . The solid line is the best fit to Eq. (3).
gated. The best results were obtained with a 30% glycerol-70% saturated CaC12 solution for moni- toring CumHO> The CaC12 serves as a humec- rant.
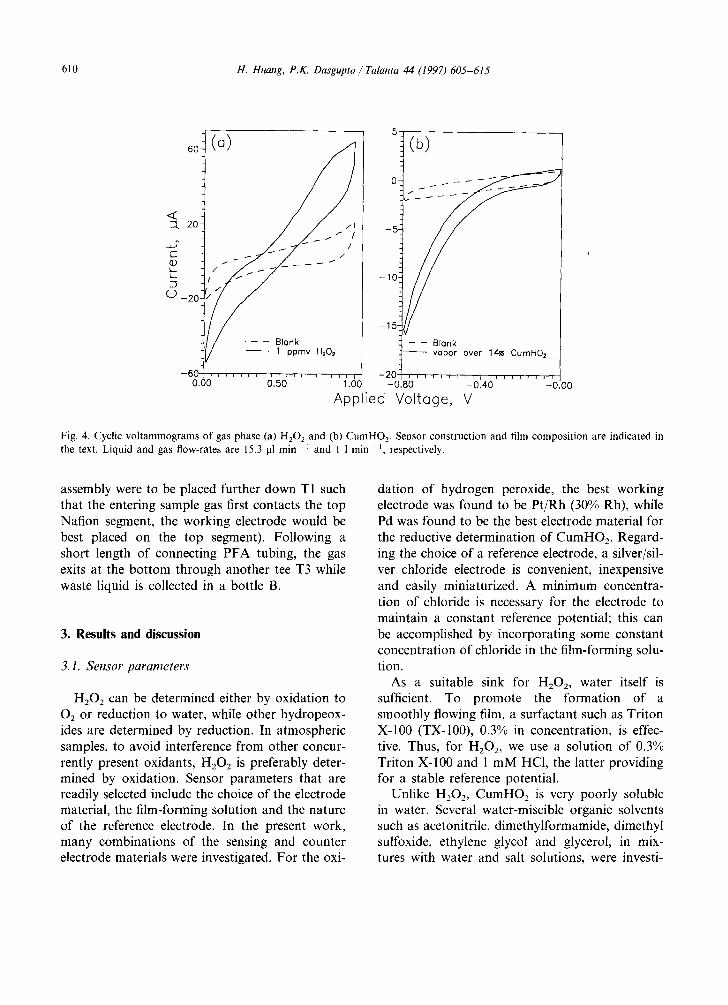
Fig. 4(a) shows the cyclic voltammogram ob- tained when 1 ppmv H 2 0 2 is sampled in a flowing film of TX-100-HC1. A current plateau is reached above 0.86 V. An applied potential of 0.95 V was therefore chosen for the oxidative determination of H202. We did not notice any significant inter- ference from common atmospheric gases under these conditions; NO2 and HCHO produce a re- sponse but only when present at very high (ppm) levels, not relevant to ambient air studies.
Fig. 4(b) shows the cyclic voltammogram ob- tained when CumHO 2 is sampled. In this case, the cathodic current continues to increase with in- creasing cathodic potential within the range tested and never reaches a plateau. Since increasing the cathodic potential much further increases the background current significantly, a potential of - 0.80 V was chosen for the reductive determina- tion of CumHO2. All potentials reported are rela- tive to the Ag/AgC1 reference electrode in the sensor. Since the two film-forming solutions have
different chloride activities, the reference potential is not the same in the two cases.
3.2. Hydrogen peroxide
3.2.1. Sampling cycle and data acqu&ition For H 2 0 2 , valve V1 (Fig. 1) was programmed
to switch continuously between zero air and the sample gas for periods of 2.5 and 1.5 rain, respec- tively, thus resulting in a sampling cycle of 4 min. No data were acquired for the first minute, allow- ing the system to attain a stable zero air response. The background current was then acquired for the next 1.5 min (Fig. 5(a)), at the end of which the valve was switched to the sample gas. The current rose to a stable plateau value over the next 30-60 s and the value for the 210-240 s period was taken to be the sample current. The valve was then switched back to zero air and the cycle repeated. During each sampling cycle, the temporal electrochemical protocol involves pre- treating the electrode for 5 s at - 0 . 1 V and then maintaining it at the sensing potential of + 0.95 V for the remaining 235 s. The results were inter- preted either in terms of current (averaged current

200
l ~ Drop Period O
--'150 D C CD
O9
100 O9
-6 o L I1)
ck 50
C3
612 H. Huang, P.K. Dasgupta / Talanta 44 (1997) 605-615
0 J J , J ~ l l r l l l l J l l l J l [ l l l l JlJI J J g l l l l l l r l l ~ l l l l l l l l l i j i i r J [ l l l l l l l r l l j l r
0.00 6.00 12.00 18.00 24.00 30.00 36.00 Flow Rate, .~i rain
Fig. 6. Decrease in drop period and analytical signal with increasing liquid flow-rate. The collected sample is diluted.
during 210-240 s, less the averaged background current over 120-150 s) or charge (integrated charge in ~tC, less the background, over the same periods as above). There was no significant differ- ence in the quality of the results using either approach.
3.2.2. Signal dependence on gas flow-rate With 200 ppbv H202, the gas flow-rate was
varied from 200 to 1000 ml m i n - i , at a constant liquid flow-rate of 15.3 lal min-1. The analytical signals increased with increasing the gas flow-rate, as shown in Fig. 5(b). When a gas is collected by diffusion to the walls of a tube, the collected fraction f is related to the flow-rate Q by an exponential relationship of the type [25]
l - f = a e h,o (1)
Although the present geometry is not exactly the same, an equation of the same general form should be applicable to the present case. Consider that the total amount of the analyte collected is the product of the flow-rate Q and the collection
efficiency f and the analytical signal S should be linearly related to this product, hence
f = kS /O (2)
where k is a proportionality constant. Eqs. (1) and (2) can be transposed to the form
S = Q(1 - a e -h/e)/k (3)
The solid line in Fig. 5(b) is the best fit of the experimental data to Eq. (3). The numerical val- ues also suggest that at the lowest sampling rate tested of 200 ml min - 1, the collection efficiency is nearly 95%. In other experiments, a gas flow-rate of 11 min 1 was used, except where stated other- wise.
3.2.3. Dependence on liquid flow-rate With 200 ppbv H202 sampled at 1 1 min - ', the
liquid flow-rate was varied from 5.3 to 33.3 ~tl min - 1. The analytical signals and the drop period decrease with increasing liquid flow-rate, as shown in Fig. 6. Both the analytical signal and the drop period are approximately linearly related to
H. Huang, P.K. Dasgupta /Talanta 44 (1997) 605 615 613
160
120
<.9 zl.
-6" 80- r -
U3
40
(0)
i =
00000 Flow Rate 23.7 ul min-1 QrnDnE) 15,3 ul re!nil AAAM 10.8 ul mm
0 20 40 60 80 1 O0 Percent Relotive Humidity
'2°° l ) 800~
i
400~
i / ~ 20~ _R H
t~ orqrqoo 80~ RH ,.y
0 50 I O0 150
H202, ppbv
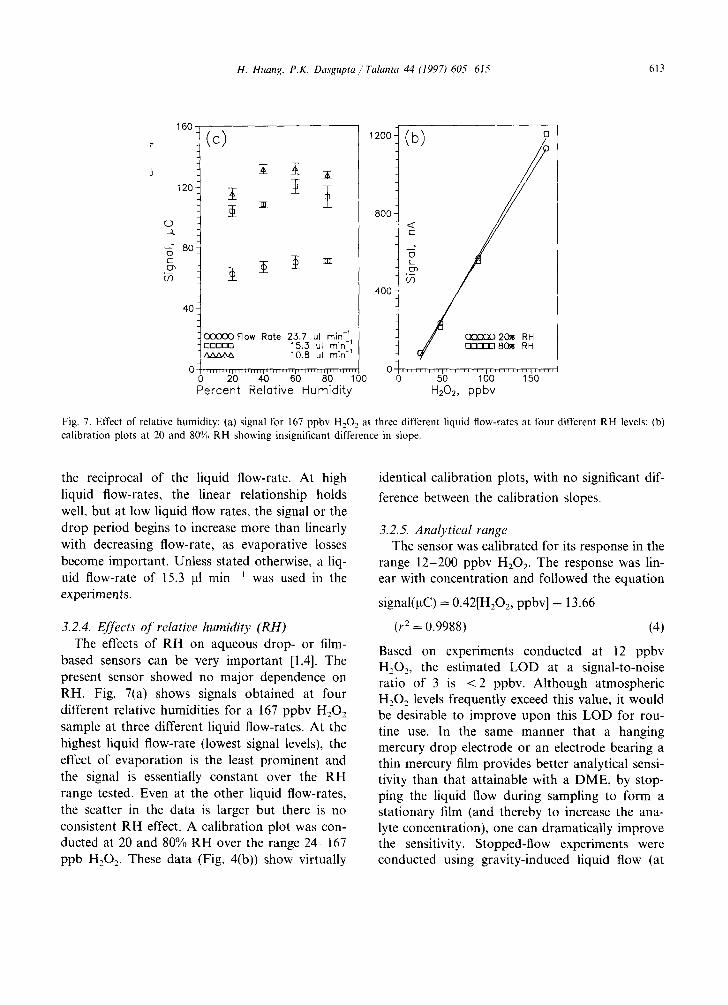
Fig. 7. Effect of relative humidity: (a) signal for 167 ppbv H202 at three different liquid flow-rates at four different RH levels; (b) calibration plots at 20 and 80% RH showing insignificant difference in slope.
the reciprocal of the liquid flow-rate. At high liquid flow-rates, the linear relationship holds well, but at low liquid flow rates, the signal or the drop period begins to increase more than linearly with decreasing flow-rate, as evaporative losses become important. Unless stated otherwise, a liq- uid flow-rate of 15.3 lal m i n - ' was used in the experiments.
3.2.4. Effects of relative humidity (RH) The effects of RH on aqueous drop- or film-
based sensors can be very important [1,4]. The present sensor showed no major dependence on RH. Fig. 7(a) shows signals obtained at four different relative humidities for a 167 ppbv H202 sample at three different liquid flow-rates. At the highest liquid flow-rate (lowest signal levels), the effect of evaporation is the least prominent and the signal is essentially constant over the RH range tested. Even at the other liquid flow-rates, the scatter in the data is larger but there is no consistent RH effect. A calibration plot was con- ducted at 20 and 80% RH over the range 24-167 ppb H202. These data (Fig. 4(b)) show virtually
identical calibration plots, with no significant dif-
ference between the calibration slopes.
3.2.5. Analytical range The sensor was calibrated for its response in the
range 12-200 ppbv H202. The response was lin- ear with concentration and followed the equation
signal(p.C) - 0.42[H202, ppbv] + 13.66
(r 2 = 0.9988) (4)
Based on experiments conducted at 12 ppbv H202, the estimated LOD at a signal-to-noise ratio of 3 is < 2 ppbv. Although atmospheric H202 levels frequently exceed this value, it would be desirable to improve upon this LOD for rou- tine use. In the same manner that a hanging mercury drop electrode or an electrode bearing a thin mercury film provides better analytical sensi- tivity than that attainable with a DME, by stop- ping the liquid flow during sampling to form a stationary film (and thereby to increase the ana- lyte concentration), one can dramatically improve the sensitivity. Stopped-flow experiments were conducted using gravity-induced liquid flow (at

614 H. Huang, P.K. Dasgupta / Talanta 44 (1997) 605-615
15000
10000
.~
5000 -
0 0
• - 1 CX30c~ No stop flow, 1 I m.lnl Stopped flow, I I m!n I
AAA6,~ Stopped flow, 2 1 rnrn
~ l l i i i i l i J J ; l ~ , i i r l , i i r J J l I J I r l I l t I I r I I
50 100 150 200 H202, ppbv
Fig. 8. Improvement in sensitivity by using stopped flow, especially at high gas sampling rates• (©) Response under conventional conditions, gas sampling rate 1 1 min-~ ; (D) response with the liquid flow stopped; (+) response under stopped-flow conditions with a gas sampling rate of 2 1 min-~.
ca. 50 lal min-~) during the zero air sampling period and stopping the liquid flow altogether by means of a solenoid valve (V2 in Fig. 1) when the test gas was sampled. Fig. 8 shows calibration plots (at 50% RH) for: (i) normal conditions, liquid flow and gas flow 15.3 ~tl rain -1 and 1 1 rain 1, respectively, sensitivity 6.9 nA (ppbv)- ~; H202; (ii) stopped liquid flow, gas flow 1 1 rain 1, sensitivity 31.2 nA (ppbv)-]; and (iii) stopped liquid flow, gas flow 2 1 min -1, sensitivity 61.8 nA (ppbv) -] . There is nearly an order of magnitude increase in sensi- tivity on going from operating mode (i) to (iii). The long-term stability of the sensor was studied with 167 ppbv H202. Over a ca. 8 h period (108 measurements), the relative standard deviation (RSD) was 2.7% under experimental mode (i) above, obviously, this includes not only the im- precision of the sensor but also that of the source output and all the other associated flow/ temperature control systems. The measurement precision was slightly worse for experimental pro-
tocol (iii): over a period of ca. 10 h (n = 137), the RSD was 4.7%.
3.3. Cumene hydroperoxide
In this case, the output of the gas generator was continuously monitored using an electro- chemical protocol in which the sensor was alter- nately cleaned at a potential of + 0.1 V for 0-5 s and then maintained at the sensing potential of - 0 . 8 V for 5 - - 9 5 s. The current was recorded for the period 65-95 s during each cycle. The response of the sensor to the CumHO 2 content of the simulated reaction mix- ture was highly linear:
signal(~tC)
-- 10.54 + 0.18[CumHO2, %] + 33.79 + 1.46
(r 2 = 0.9984) (5)
The precision of the data also indicated that such would readily provide a means for process

H. Huang, P.K. Dasgupta / Talanta 44 (1997) 605 615 615
mon i to r ing o f C u m H O 2 in a reac tor at the 2.5% level with a relat ive precis ion o f bet ter than 5%.
4. Conclusion
W e have demons t r a t ed tha t in situ e lec t rochem- ical sensing is a s imple and sensitive complemen t to the d rop - or f i lm-based col lect ion o f analyte gases and vapors . The technique is obvious ly not l imited to any given e lect rochemical sensing tech- nology, or to any pa r t i cu la r col lect ion liquid. It should be possible to extend the a p p r o a c h to any biphasic system, e.g. in a l i q u i d - l i q u i d system where the f i lm-forming l iquid is different f rom and is immiscible with the l iquid const i tu t ing the analy te matr ix . In general , we believe tha t this general concept has great po ten t ia l uti l i ty for the sensing o f gases.
Acknowledgements
This research was par t i a l ly suppor t ed by the US Env i ronmen ta l P ro tec t ion Agency th rough gran t No. R 8201117-01-1. However , this pape r has no t been subject to review by the agency and no endorsement s should be inferred.
References
[1] S. Liu and P.K. Dasgupta, Anal. Chem., 67 (1995) 2042. [2] A, Cardoso and P.K. Dasgupta, Anal. Chem., 67 (1995)
2562. [3] S. Kar and P.K. Dasgupta, Anal. Chem., 67 (1995) 3853.
[4] H. Liu and P.K. Dasgupta, Anal. Chem., 67 (1995) 4221. [5] H. Liu and P.K. Dasgupta, Anal. Chem., 68 (1996) 1817. [6] H. Liu and P.K. Dasgupta, Anal. Chim. Acta, 326 (1996)
13. [7] S. Kar and P.K, Dasgupta, J. Chromatogr., 739 (1996)
379. [8] J. Heyrovsky, Chem. Listy, 16 (1922) 256. [9] M. Heyrovska, in P. Zuman and I.M. Kolthoff (Eds.),
Progress in Polarography, Vol. 1, Wiley, New York, 1962, pp. 1 19.
[10] M.M.P.M. Neto, M.M.G.S. Rocha and C.M.A. Brett, Talanta, 41 (1994) 1957.
[11] E.P. Gill, R.M.G.-M. Carra and A. Sanchez-Misiego, Anal. Chirn. Acta, 315 (1995) 69.
[12] RM.G.-M. Carra, A. Sanchez-Misiego and A. Zirino, Anal. Chem., 67 (1995) 4484.
[13] S.B.O. Adelojou and F. Bablo, Electoranalysis, 7 (1995) 476.
[14] J.-M. Zen and M.-J. Chung, Anal. Chim. Acta, 320 (1996) 43.
[15] L. Nyholm and F. Bjolamacronlrefors, Anal. Chim. Acta, 327 (1996) 211.
[16] D.W. Gunz and M.R. Hoffmann, Atmos. Environ., 24A (1990) 1601.
[17] P.K. Dasgupta, S. Dong, H. Hwang, H.-C. Yang and Z. Genfa, Atmos. Environ., 22 (1988) 949.
[18] G. Zhang, P.K. Dasgupta and A. Sigg, Anal. Chim. Acta, 260 (1992) 57.
[19] J. Zawadiak, D. Gilner, Z. Kulicki and S. Baj, Analyst 118 (1993) 1081.
[20] P. Beunez, G. Helary and G. Sauvet, J. Polym. Sci., Part A, 32 (1984) 1471.
[21] J.I. Kroschwitz and M. Howe-Grant (Eds.), Kirk-Othmer Encyclopedia of Chemical Technology, Vol. 7, Wiley, New York, 4th edn., 1991, p. 735.
[22] J. Wang, L. Agnes, C. Liang and O. Evans. Talanta, 38 (1991) 1077.
[23] A.I. Vogel, A Textbook of Quantitative Inorganic Analy- sis, Longmans Green, London, 3rd edn., 1961, p. 363.
[24] H. Hwang and P.K. Dasgupta, Environ. Sci. Technol., 19 (1985) 255.
[25] P.K. Dasgupta, ACS Adv. Chem. Ser., 232 (1993) 41.