Remote Visualization and Cluster Analysis of 3-D Geophysical Data over the Internet Using Off-Screen...
18
1 Remote Visualization and Cluster Analysis of 3-D Geophysical Data over the Internet Using Off-Screen Rendering Zachary A. Garbow 1 , David A. Yuen 1 , Gordon Erlebacher 2 , Evan F. Bollig 1 , Benjamin J. Kadlec 1 1 Dept. of Geology and Geophysics and Minnesota Supercomputing Institute, Univ. of Minnesota, Minneapolis, MN 55455-0219, U.S.A. 2 School of Computational Science and Information Technology, Florida State University, Tallahassee, FL 32306-4120, U.S.A. Submitted to Visual Geosciences, June 2003. Abstract. We discuss a software tool we have developed for remote visualization and analysis of large-scale geophysical datasets, such as earthquakes. To overcome the limitations created by the current and future deluge of data, our system, called WEB-IS (http://boy.msi.umn.edu/WEB-IS ), utilizes a client-server paradigm to harness the power of a large visualization server to supply 3-D image rendering and data analysis capabilities to multiple clients remotely. We demonstrate the abilities of our software by clustering around 10 5 synthetic earthquake events and visualizing the results from a platform-independent Java applet acting as the client. I. Introduction The size of datasets in the geosciences is growing at an exponential rate due to improved instrumentation, larger numerical grids, and increasingly large and inexpensive storage devices. As this data becomes more detailed and multi-dimensional in space and time, its analysis by scientists becomes increasingly complicated. Researchers must sift through hundreds of gigabytes, or even terabytes, of data in an attempt to discover relationships and meaning within continuously growing collections of information. This is a task that necessitates the use of software to facilitate the process of converting raw data into useful forms, and ultimately, into knowledge. Software assists in this process through visualization, data analysis, and data mining. Large amounts of data can also limit the mobility of scientists conducting research. Researchers should not be bound to the physical location where the data and software resides. Due to the excessive size of the data sets and the limited bandwidth available, the transfer of raw data over the Internet, or even dedicated network, is rapidly becoming impractical, if not impossible. As a result, new tools must be developed to allow scientists to access, view and interrogate their data anytime from anywhere, whether from their labs, home, or from out in the field using handheld devices. This calls for a robust client-server framework that will allow remote, platform-independent visualization and analysis of data from a centralized source. We have previously developed an interrogative system that allows users to analyze their data by using web-based maps (Garbow et al., 2001, 2002, 2003). This software provided a Java applet as the front-end interface through which users could interactively select
Transcript of Remote Visualization and Cluster Analysis of 3-D Geophysical Data over the Internet Using Off-Screen...
1
Remote Visualization and Cluster Analysis of 3-D Geophysical Data over the Internet Using Off-Screen Rendering
Zachary A. Garbow1, David A. Yuen1, Gordon Erlebacher2, Evan F. Bollig1, Benjamin J. Kadlec1
1Dept. of Geology and Geophysics and Minnesota Supercomputing Institute, Univ. of Minnesota, Minneapolis, MN 55455-0219, U.S.A.
2School of Computational Science and Information Technology, Florida State University, Tallahassee, FL 32306-4120,
U.S.A.
Submitted to Visual Geosciences, June 2003.
Abstract. We discuss a software tool we have developed for remote visualization and analysis of large-scale geophysical datasets, such as earthquakes. To overcome the limitations created by the current and future deluge of data, our system, called WEB-IS (http://boy.msi.umn.edu/WEB-IS), utilizes a client-server paradigm to harness the power of a large visualization server to supply 3-D image rendering and data analysis capabilities to multiple clients remotely. We demonstrate the abilities of our software by clustering around 105 synthetic earthquake events and visualizing the results from a platform-independent Java applet acting as the client.
I. Introduction The size of datasets in the geosciences is growing at an exponential rate due to improved instrumentation, larger numerical grids, and increasingly large and inexpensive storage devices. As this data becomes more detailed and multi-dimensional in space and time, its analysis by scientists becomes increasingly complicated. Researchers must sift through hundreds of gigabytes, or even terabytes, of data in an attempt to discover relationships and meaning within continuously growing collections of information. This is a task that necessitates the use of software to facilitate the process of converting raw data into useful forms, and ultimately, into knowledge. Software assists in this process through visualization, data analysis, and data mining.
Large amounts of data can also limit the mobility of scientists conducting research. Researchers should not be bound to the physical location where the data and software resides. Due to the excessive size of the data sets and the limited bandwidth available, the transfer of raw data over the Internet, or even dedicated network, is rapidly becoming impractical, if not impossible. As a result, new tools must be developed to allow scientists to access, view and interrogate their data anytime from anywhere, whether from their labs, home, or from out in the field using handheld devices. This calls for a robust client-server framework that will allow remote, platform-independent visualization and analysis of data from a centralized source.
We have previously developed an interrogative system that allows users to analyze their data by using web-based maps (Garbow et al., 2001, 2002, 2003). This software provided a Java applet as the front-end interface through which users could interactively select
2
subsets of their data to analyze, and then view the results of the analysis. The software used a client-server setup to allow the server to perform the processor intensive data analysis, while leaving an unburdened client to provide the interactive graphical user interface (GUI), which maps the static image to the backend data.
We have expanded on our idea of web-based data interrogation with a second-generation version of our software, called WEB-IS, for Web-based Interrogative System (http://boy.msi.umn.edu/WEB-IS). WEB-IS greatly improves on our previous version by allowing remote, interactive visualization of large-scale 3-D data over the Internet, along with data analysis and data mining capabilities. This lets the user navigate through their rendered 3-D data and interactively analyze the data for statistics or apply data mining techniques, such as cluster analysis. We continue to take advantage of the client-server paradigm in order to keep the processor intensive tasks, such as visualization and data mining, on the server-side while the client provides the front-end interface. WEB-IS uses a combination of CORBA, Java, C++ and Python to seamlessly integrate the server-side processing and client-side user interaction utilities. The server renders 3-D data off-screen and sends the resulting image buffer data over the Internet to a Java applet on the client to be displayed. In turn, the client responds to user interaction through requests sent to the server for additional visualization or data analysis tasks. In this way, the user can interact with the client from a web browser located thousands of miles from the server and the data, but view the results as if they were occurring locally. Using this web tool, researchers from around the world can visualize and analyze large-scale 3-D datasets from any web browser with a current Java1.4 plug-in (http://java.sun.com). Another approach to web-based visualization utilizes Java3D to perform interactive image rendering of 3-D data. However, like other Java classes, Java3D is executed locally on the client, so while the data can still reside on the server, all visualization would actually be performed on the client. This limits the scope of data that can be visualized, and also defeats the main purpose of using a client-server setup.
II. Related Work Remote visualization is not a new idea, although our implementation of lightweight rendering and analysis of 3-D data using an applet is quite novel. There is significant other work being carried out in this area that is worth noting.
SGI’s Visual Area Networking, or VAN, (www.sgi.com) has been highly publicized and advertised. VAN is a very large-scale and powerful solution to advanced visualization and multiple site collaboration. This allows researchers remote access to datasets and visualization systems deployed around the world, harnessing the speed of the high-end server. This system is very polished and powerful; however the characteristics that make it such a potent solution can also be a disadvantage. The software is massive and also quite expensive. Additionally, VAN is designed to run on SGI Onyx brand visualization supercomputers so the choice of servers for which this can run is extremely limited.
Stegmaier et al. (2002) take a more general approach to develop a solution for remote visualization. They focus on creating the ability to perform off-screen visualization while still utilizing acceleration on the graphics hardware. To this end, they have customized several OpenGL functions and stored the associated object files into a shared library that is preloaded, overriding the corresponding functions in the default library. The
3
modifications redirect graphics output from the display screen to an off-screen buffer, either a pixmap (software buffer) or a p-buffer (hardware buffer). This allows a user to run existing OpenGL applications off-screen without any change to application source code. These applications can then be used remotely with VNC, or Visual Network Computing (www.realvnc.com), from a client machine. This is a very good generic solution for remote visualization; however it has drawbacks in regards to specific applications. For example, our software uses a client-side GUI that is implemented as a Java applet and executed on the client. Using the aforementioned generic approach in conjunction with VNC, the GUI would be located on the server-side and all GUI interactions, such as a button press, would have to be tunneled over the network. This puts unneeded strain on the network and also slows down the response time to user interaction.
Wang et al. (2003) are currently developing web-based services for Amira (WEB-SA) that will provide web-based access to Amira, a powerful visualization package (www.amiravis.com). Using a dedicated visualization server, users will be able to remotely control Amira to render images from 3-D data located on the server, using just a web browser with the Java1.4 plug-in. Their setup provides an HTML GUI that can be accessed from any web browser (http://boy.msi.umn.edu/amira). Server-side CGI scripts, written in Python, handle input to this GUI and forward the commands to be executed off-screen by Amira. The resultant images are then received from Amira by the Python scripts, and shown to the user in the web-browser. Two-dimensional slices of the 3-D data can also be directly sent to a modified version of the Web-based Data Interrogation System (http://www.csit.fsu.edu/~garbowza/WDI/) created by Garbow et al. (2001, 2002) to be statistically analyzed on the client. This setup allows users to harness the visualization power of Amira over the Internet, without having to write customized visualization programs. However, their setup does not allow for customized or home-grown visualization or data analysis programs.
Visualization utilizing a client-server paradigm is also being used in other disciplines, and in various forms. EON (http://eon.chem.washington.edu/) is software developed at the University of Washington that distributes computing load for visualization among idle computers. Users who wish to participate install a custom screensaver. When their computer has been idle long enough for the screensaver to turn on, the EON software activates and performs simulations, with the results sent back to the server. This form of Grid computing is similar to methods developed by SETI@home (http://setiathome.ssl.berkeley.edu/), software developed at the University of California at Berkeley, which uses volunteers’ idle computers to analyze radio signals for patterns which may indicate extraterrestrial life. Another approach resembling EON and SETI@home has been implemented for genome research in the biology/medical field. Genome@home (http://gah.stanford.edu), created at Stanford University, utilizes the client-server paradigm to simulate and visualize the creation of new genomes, which helps scientists understand how natural genomes have developed and how they function. The Virtual Earth (http://anquetil.colorado.edu/VE), developed at the University of Colorado--Boulder, is another web-based interface that implements a client-server scheme in a geophysical context. The Virtual Earth (VE) provides an easy way to
4
analyze a wide range of geophysical data, including mantle mixing and thermal convection in the earth’s mantle. Users complete an input form on the client side and send it to the server. The server performs all computations for the user, and returns the results to the client-page. Results include graphic plots and corresponding values. While not visually intensive, this example of a client-server system shows the versatility and practicality of the client-server paradigm. By providing geophysical data and simplifying the computations done by all users, a simple interface such as the Virtual Earth can be used as an educational supplement across the Internet.
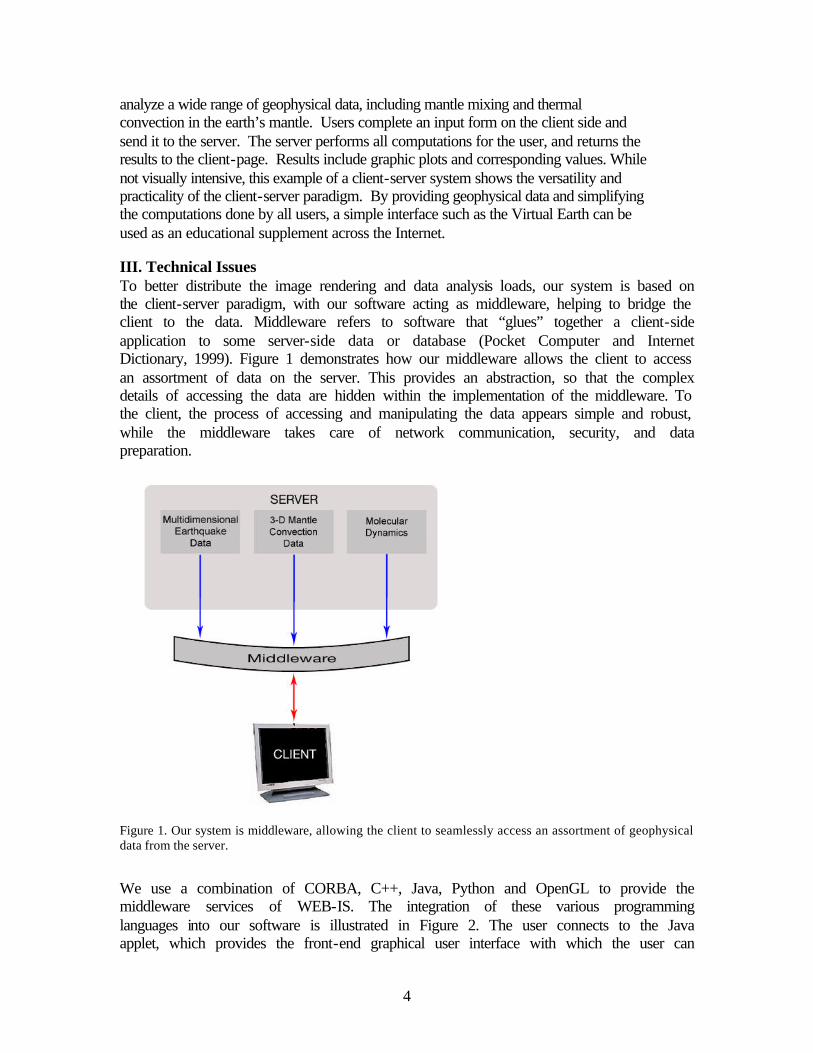
III. Technical Issues To better distribute the image rendering and data analysis loads, our system is based on the client-server paradigm, with our software acting as middleware, helping to bridge the client to the data. Middleware refers to software that “glues” together a client-side application to some server-side data or database (Pocket Computer and Internet Dictionary, 1999). Figure 1 demonstrates how our middleware allows the client to access an assortment of data on the server. This provides an abstraction, so that the complex details of accessing the data are hidden within the implementation of the middleware. To the client, the process of accessing and manipulating the data appears simple and robust, while the middleware takes care of network communication, security, and data preparation.
Figure 1. Our system is middleware, allowing the client to seamlessly access an assortment of geophysical data from the server.
We use a combination of CORBA, C++, Java, Python and OpenGL to provide the middleware services of WEB-IS. The integration of these various programming languages into our software is illustrated in Figure 2. The user connects to the Java applet, which provides the front-end graphical user interface with which the user can
5
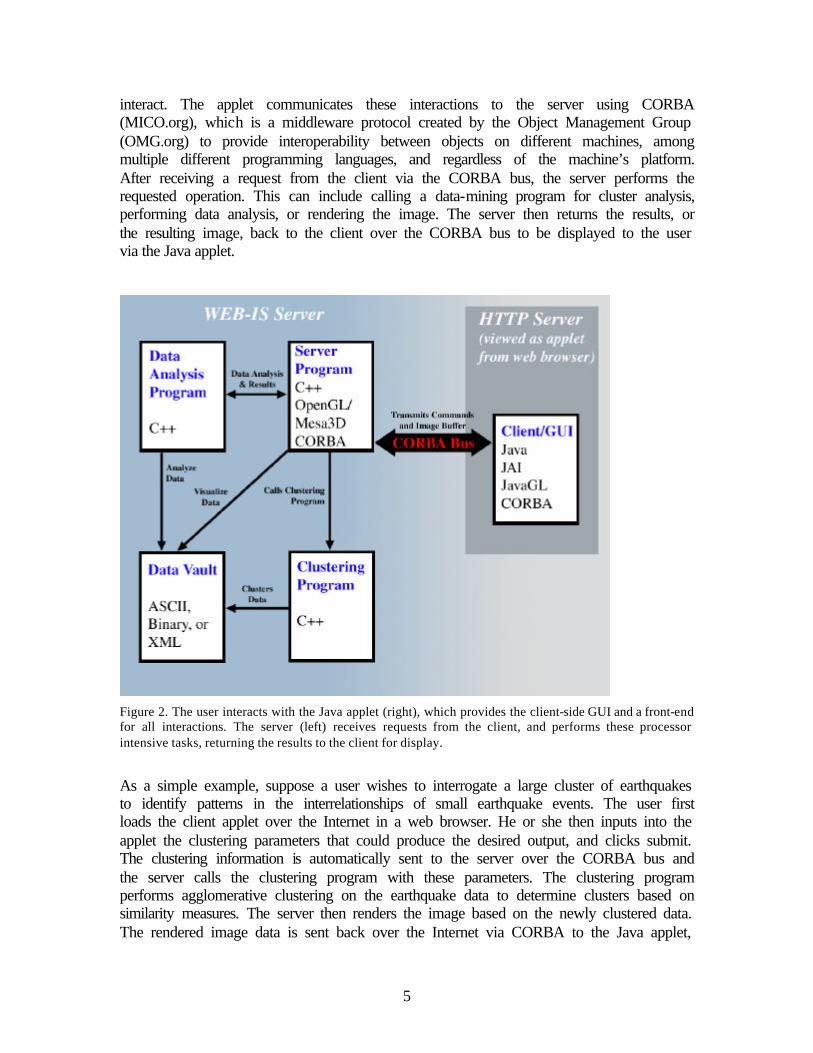
interact. The applet communicates these interactions to the server using CORBA (MICO.org), which is a middleware protocol created by the Object Management Group (OMG.org) to provide interoperability between objects on different machines, among multiple different programming languages, and regardless of the machine’s platform. After receiving a request from the client via the CORBA bus, the server performs the requested operation. This can include calling a data-mining program for cluster analysis, performing data analysis, or rendering the image. The server then returns the results, or the resulting image, back to the client over the CORBA bus to be displayed to the user via the Java applet.
Figure 2. The user interacts with the Java applet (right), which provides the client-side GUI and a front-end for all interactions. The server (left) receives requests from the client, and performs these processor intensive tasks, returning the results to the client for display.
As a simple example, suppose a user wishes to interrogate a large cluster of earthquakes to identify patterns in the interrelationships of small earthquake events. The user first loads the client applet over the Internet in a web browser. He or she then inputs into the applet the clustering parameters that could produce the desired output, and clicks submit. The clustering information is automatically sent to the server over the CORBA bus and the server calls the clustering program with these parameters. The clustering program performs agglomerative clustering on the earthquake data to determine clusters based on similarity measures. The server then renders the image based on the newly clustered data. The rendered image data is sent back over the Internet via CORBA to the Java applet,
6
which constructs an actual image out of the processed data. The user can then see how the specified cluster of 3-D data appears by navigating through the clusters by zooming, rotating, and translating the image data. The user can also select subsets of the cluster data on which to perform data analysis, and subsequently receive numerical results and 3-D histograms. Each of these processor intensive interactions is actually performed on the server. This eases some of the bottlenecks associated with visualization and analysis of large-scale, multi-dimensional data over the Internet on low-end clients.
Off-screen rendering is implemented on the server side to enable several clients to simultaneously render their data independently. Rather than display images on the display screen, the default mode in most graphics libraries, off-screen rendering draws into a memory buffer. The data contained within this portion of memory can then be used to write the image to a file, or in the case of our software, pass the image to the client over the network.
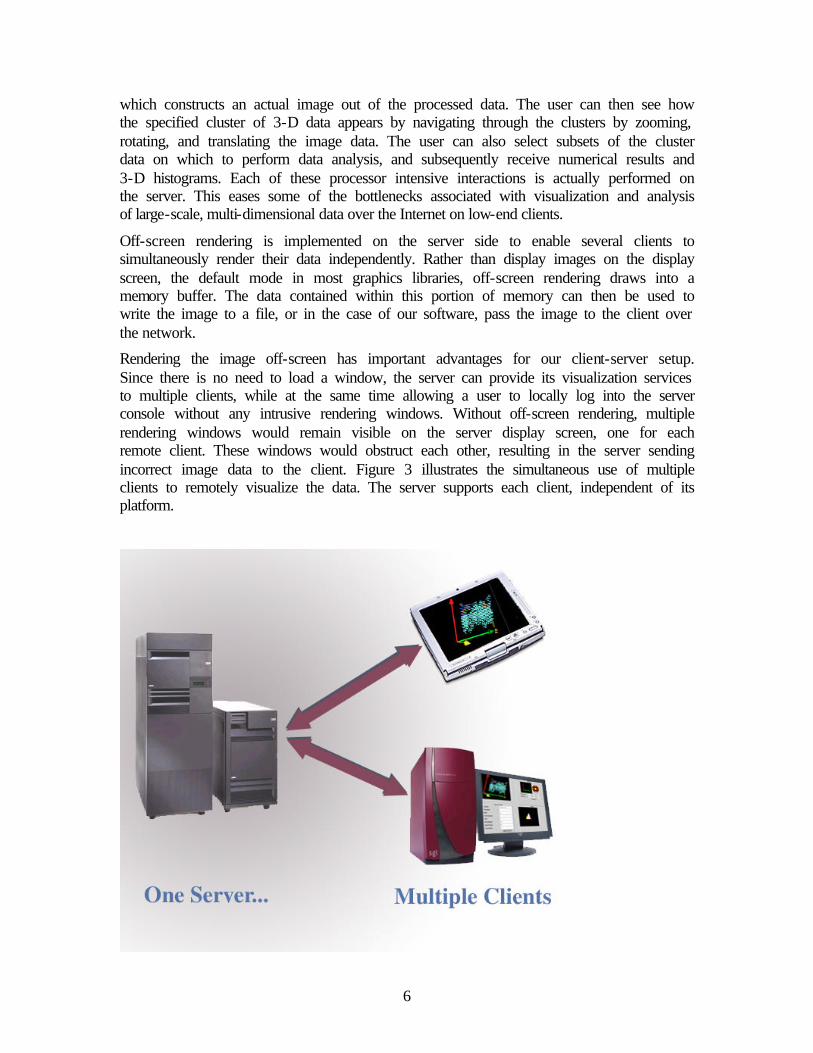
Rendering the image off-screen has important advantages for our client-server setup. Since there is no need to load a window, the server can provide its visualization services to multiple clients, while at the same time allowing a user to locally log into the server console without any intrusive rendering windows. Without off-screen rendering, multiple rendering windows would remain visible on the server display screen, one for each remote client. These windows would obstruct each other, resulting in the server sending incorrect image data to the client. Figure 3 illustrates the simultaneous use of multiple clients to remotely visualize the data. The server supports each client, independent of its platform.
7
Figure 3. One server can support the visualization and data analysis requests of several clients simultaneously through its utilization of off-screen rendering. Each client can visualize separate datasets independently, or multiple clients can connect to the same data and session in order to remotely collaborate with other researchers.
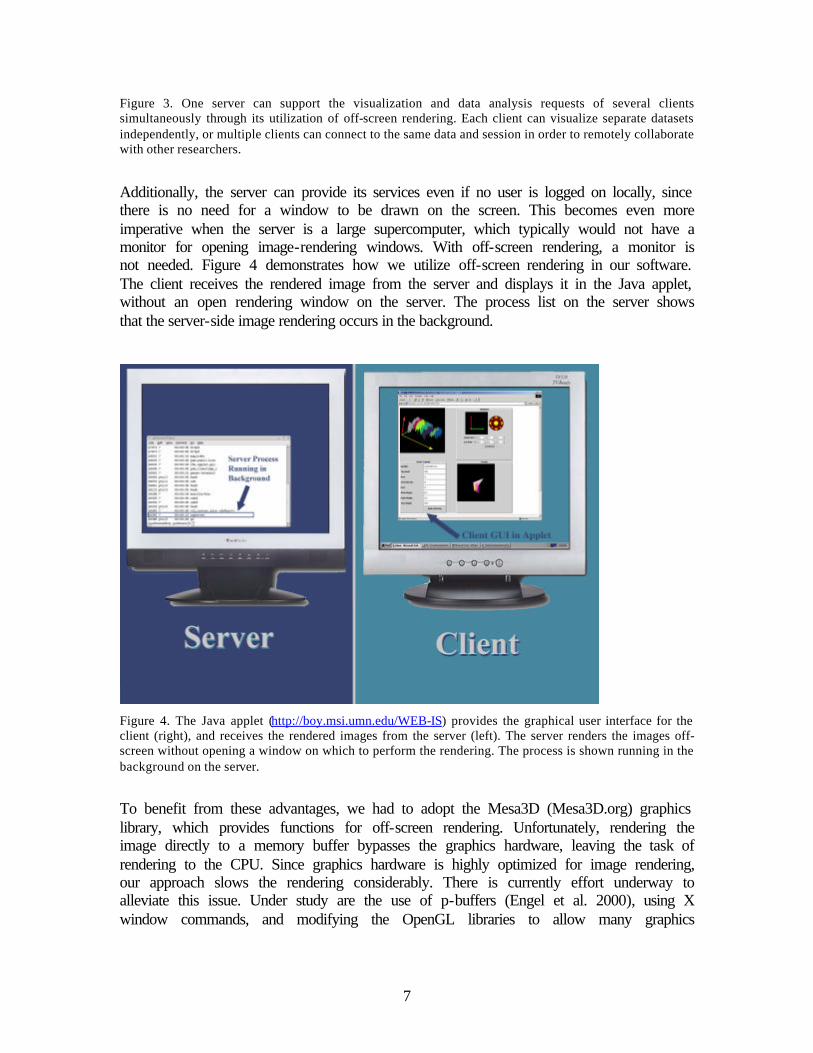
Additionally, the server can provide its services even if no user is logged on locally, since there is no need for a window to be drawn on the screen. This becomes even more imperative when the server is a large supercomputer, which typically would not have a monitor for opening image-rendering windows. With off-screen rendering, a monitor is not needed. Figure 4 demonstrates how we utilize off-screen rendering in our software. The client receives the rendered image from the server and displays it in the Java applet, without an open rendering window on the server. The process list on the server shows that the server-side image rendering occurs in the background.
Figure 4. The Java applet (http://boy.msi.umn.edu/WEB-IS) provides the graphical user interface for the client (right), and receives the rendered images from the server (left). The server renders the images off-screen without opening a window on which to perform the rendering. The process is shown running in the background on the server.
To benefit from these advantages, we had to adopt the Mesa3D (Mesa3D.org) graphics library, which provides functions for off-screen rendering. Unfortunately, rendering the image directly to a memory buffer bypasses the graphics hardware, leaving the task of rendering to the CPU. Since graphics hardware is highly optimized for image rendering, our approach slows the rendering considerably. There is currently effort underway to alleviate this issue. Under study are the use of p-buffers (Engel et al. 2000), using X window commands, and modifying the OpenGL libraries to allow many graphics
8
programs to render to hardware-enabled buffers without the need to change and recompile the application.
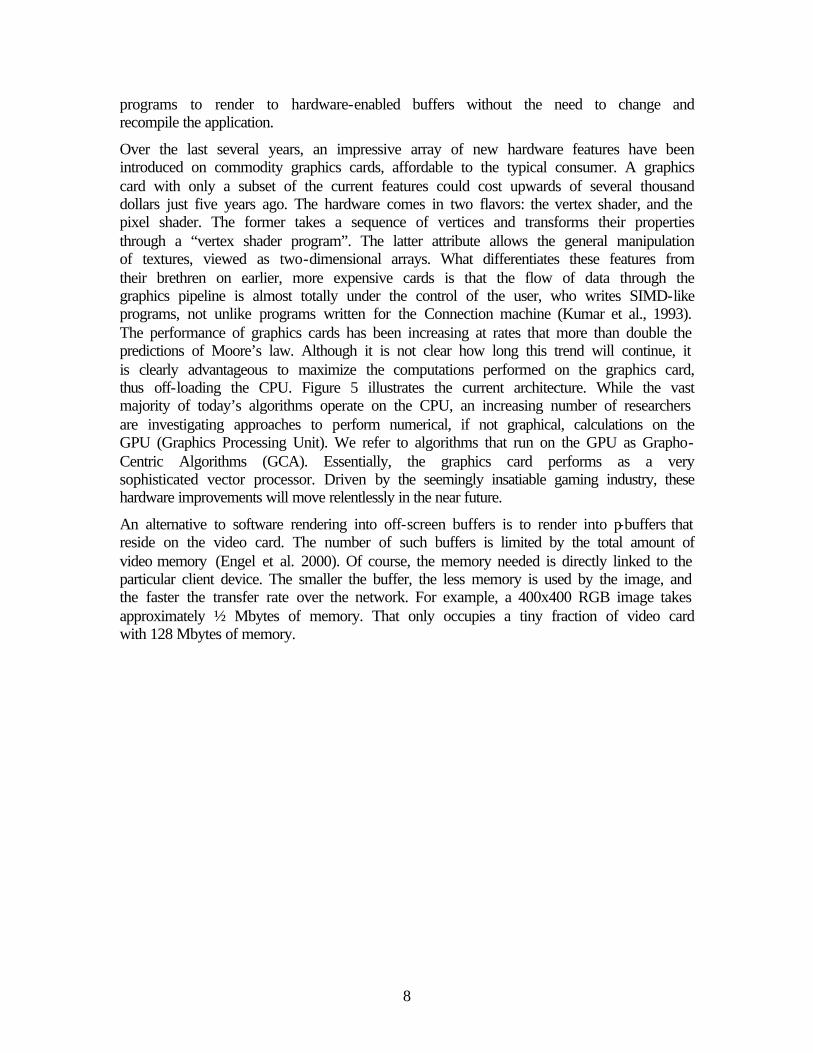
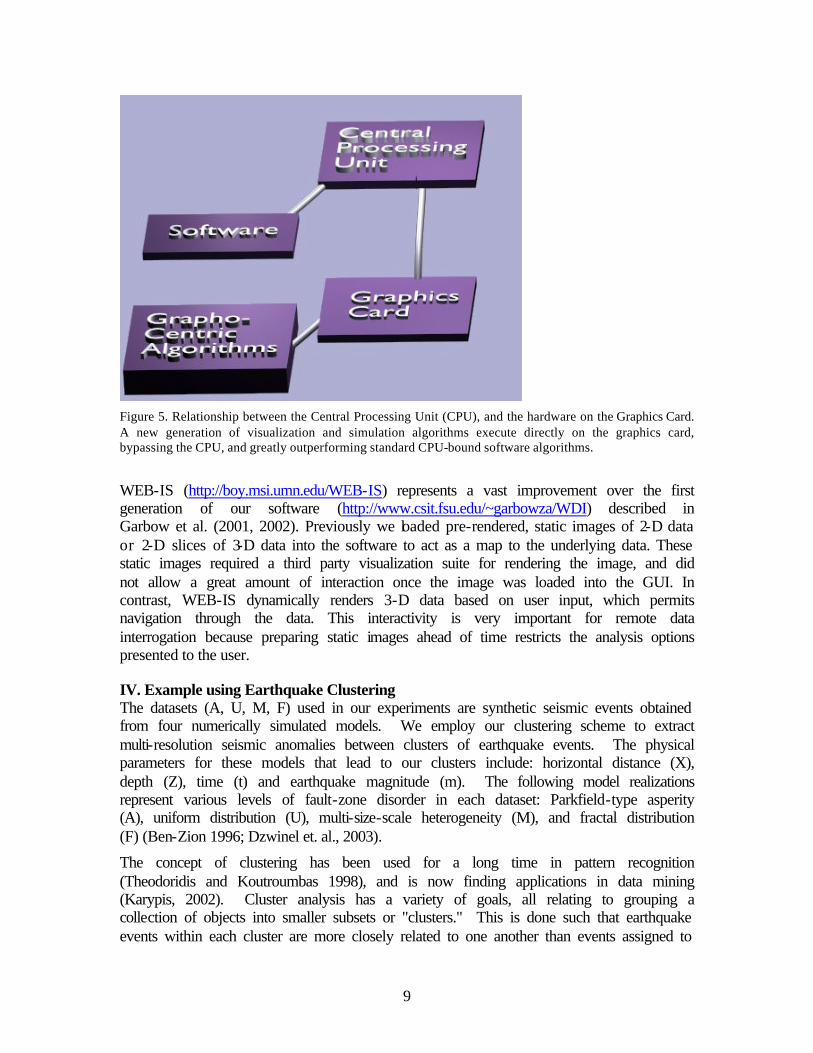
Over the last several years, an impressive array of new hardware features have been introduced on commodity graphics cards, affordable to the typical consumer. A graphics card with only a subset of the current features could cost upwards of several thousand dollars just five years ago. The hardware comes in two flavors: the vertex shader, and the pixel shader. The former takes a sequence of vertices and transforms their properties through a “vertex shader program”. The latter attribute allows the general manipulation of textures, viewed as two-dimensional arrays. What differentiates these features from their brethren on earlier, more expensive cards is that the flow of data through the graphics pipeline is almost totally under the control of the user, who writes SIMD-like programs, not unlike programs written for the Connection machine (Kumar et al., 1993). The performance of graphics cards has been increasing at rates that more than double the predictions of Moore’s law. Although it is not clear how long this trend will continue, it is clearly advantageous to maximize the computations performed on the graphics card, thus off-loading the CPU. Figure 5 illustrates the current architecture. While the vast majority of today’s algorithms operate on the CPU, an increasing number of researchers are investigating approaches to perform numerical, if not graphical, calculations on the GPU (Graphics Processing Unit). We refer to algorithms that run on the GPU as Grapho-Centric Algorithms (GCA). Essentially, the graphics card performs as a very sophisticated vector processor. Driven by the seemingly insatiable gaming industry, these hardware improvements will move relentlessly in the near future.
An alternative to software rendering into off-screen buffers is to render into p-buffers that reside on the video card. The number of such buffers is limited by the total amount of video memory (Engel et al. 2000). Of course, the memory needed is directly linked to the particular client device. The smaller the buffer, the less memory is used by the image, and the faster the transfer rate over the network. For example, a 400x400 RGB image takes approximately ½ Mbytes of memory. That only occupies a tiny fraction of video card with 128 Mbytes of memory.
9
Figure 5. Relationship between the Central Processing Unit (CPU), and the hardware on the Graphics Card. A new generation of visualization and simulation algorithms execute directly on the graphics card, bypassing the CPU, and greatly outperforming standard CPU-bound software algorithms.
WEB-IS (http://boy.msi.umn.edu/WEB-IS) represents a vast improvement over the first generation of our software (http://www.csit.fsu.edu/~garbowza/WDI) described in Garbow et al. (2001, 2002). Previously we loaded pre-rendered, static images of 2-D data or 2-D slices of 3-D data into the software to act as a map to the underlying data. These static images required a third party visualization suite for rendering the image, and did not allow a great amount of interaction once the image was loaded into the GUI. In contrast, WEB-IS dynamically renders 3-D data based on user input, which permits navigation through the data. This interactivity is very important for remote data interrogation because preparing static images ahead of time restricts the analysis options presented to the user.
IV. Example using Earthquake Clustering The datasets (A, U, M, F) used in our experiments are synthetic seismic events obtained from four numerically simulated models. We employ our clustering scheme to extract multi-resolution seismic anomalies between clusters of earthquake events. The physical parameters for these models that lead to our clusters include: horizontal distance (X), depth (Z), time (t) and earthquake magnitude (m). The following model realizations represent various levels of fault-zone disorder in each dataset: Parkfield-type asperity (A), uniform distribution (U), multi-size-scale heterogeneity (M), and fractal distribution (F) (Ben-Zion 1996; Dzwinel et. al., 2003).
The concept of clustering has been used for a long time in pattern recognition (Theodoridis and Koutroumbas 1998), and is now finding applications in data mining (Karypis, 2002). Cluster analysis has a variety of goals, all relating to grouping a collection of objects into smaller subsets or "clusters." This is done such that earthquake events within each cluster are more closely related to one another than events assigned to
10
different clusters (Hastie 2001). With the deluge of data facing today’s world, users find it necessary to explore very large datasets with limited processing power in order to extract useful information. Cluster analysis can allay these problems by partitioning the original data set into a smaller number of clusters, and processing each cluster as a single entity. Now, instead of manipulating the original data set, we are able to manipulate only relevant clusters within the original data, achieving a type of efficient data compression.
Agglomerative clustering schemes (Andenberg 1973; Theodoridis and Koutroumbas, 1998; Dzwinel et. al., 2003) produce sequential clusters of decreasing size by merging two previously smaller clusters into a larger one. The clusters are determined by minimizing a proximity or dissimilarity function, such as Euclidean distance. Hierarchical algorithms start with each data point defining an individual cluster. With each step of the algorithm, two clusters are merged, and the total number of clusters decreases by one. This process continues until a desired number of clusters are obtained or the proximity function reaches a threshold value. Partitioning techniques, such as the K-means algorithm work in a non-hierarchical fashion by breaking a data set into K clusters, such that the partition optimizes a given criterion (Karypis, 2002). These schemes are insufficient for our needs, as they require global information about the data and prior knowledge of the number of clusters to be created. Partitioning techniques fail when data in a cluster are closer to the center of another cluster than to its own, which occurs in convex, elongated, and bridged clusters (Karypis, 2002; Dzwinel et. al, 2003).
We use an agglomerative clustering algorithm based on the mutual nearest neighbor (MNN) concept (Gowda and Krishna 1978) and a scheme discussed by Dzwinel et al. (2003). The advantage to using a MNN scheme over other procedures lies in the hierarchical definition of the distance measurements between objects and in extracting localized clusters emerging in time-evolving processes (Dzwinel and Basiak, 1999). By clustering, we wish to find robust clusters that indicate strong relationships and patterns in the data.
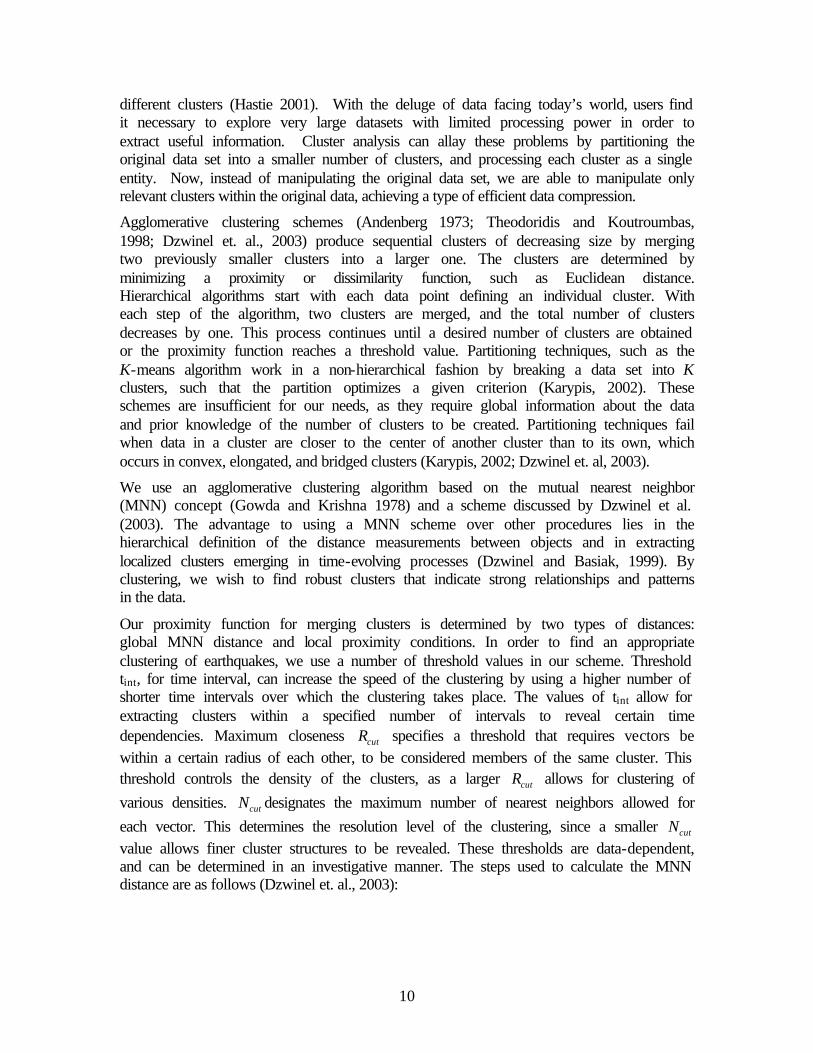
Our proximity function for merging clusters is determined by two types of distances: global MNN distance and local proximity conditions. In order to find an appropriate clustering of earthquakes, we use a number of threshold values in our scheme. Threshold tint, for time interval, can increase the speed of the clustering by using a higher number of shorter time intervals over which the clustering takes place. The values of tint allow for extracting clusters within a specified number of intervals to reveal certain time dependencies. Maximum closeness cutR specifies a threshold that requires vectors be within a certain radius of each other, to be considered members of the same cluster. This threshold controls the density of the clusters, as a larger cutR allows for clustering of various densities. cutN designates the maximum number of nearest neighbors allowed for each vector. This determines the resolution level of the clustering, since a smaller cutN value allows finer cluster structures to be revealed. These thresholds are data-dependent, and can be determined in an investigative manner. The steps used to calculate the MNN distance are as follows (Dzwinel et. al., 2003):
11
1. Consider a set 0R consisting of M N-dimensional data vectors iX for i = 1,2,3,…, m.
2. Partition the data into tint intervals in the time domain.
3. Compute the Euclidean distances d(xi, xj) between vectors ix and the rest of the vectors jx .
4. Find the lists iL of cutN nearest neighbors j of vector ix such that
d(xi, x j) < Rcut for each vector i.
5. Sort out the neighbors j in the lists in ascending order according to the d(xi, x j) values for i and j data points. Thus ( )iL k j= , where k is the position of the data point j in the i’th list and Lj(m) = i, where m is the position of the data point i in the j’th list.
6. Because ( )iL k j= and ( )jL m i= , compute MNN(i,j) distances defined
as: MNN(i, j)=m+k. The maximum MNN distance is less than 2 cutN .
7. Sort the MNN(i,j) distances in ascending order as W(t). If there are pairs (i, j) having the same MNN(i,j) distance, they are sorted according to the d(,) measure between their vectors.
For the actual clustering of the data points, each vector is initially given a cluster number, and then we begin the merging. After the final clusters have been created, we use a new parameter to throw out all clusters that have fewer than thresh events. The merging process is outlined as follows:
1. Initialize a cluster number iC for each data vector iX .
2. For t=0 to t=MN, where MN is the number of pairs sorted out in ( )W t .
a. If vectors (i, j) from ( )W t belong to different clusters iC and jC ,
respectively, merge them by i i jC CUC= .
b. t=t+1
The clustering algorithm described above can become computationally intense for large values of M. We have employed a number of efficient methods such as quick sort, insertion sort (Rosen, 2002), and the linked list concept (Hockney,1981) to minimize the complexity. A straightforward implementation of an agglomerative scheme has a number of operations proportional to ( )3O M (Theodoris and Koutroumbas, 1998); however
12
more efficient algorithms with ( )2 logO M M operation count have been developed (Jain,
et al., 1999).
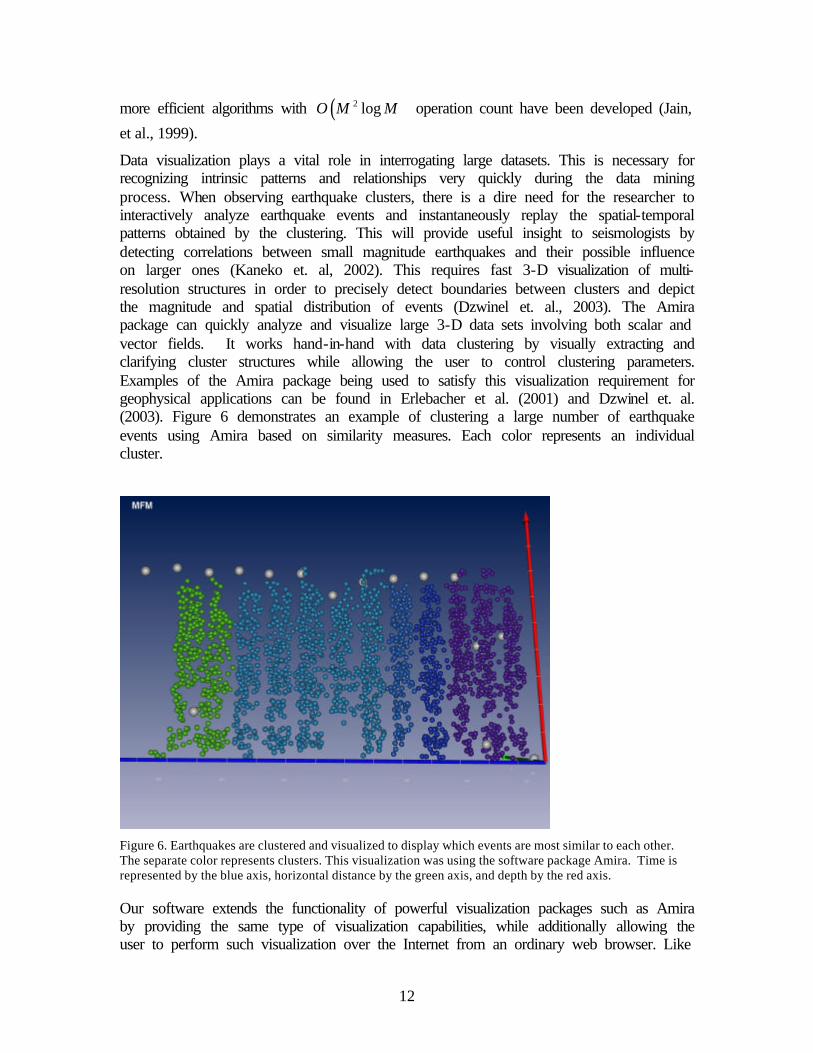
Data visualization plays a vital role in interrogating large datasets. This is necessary for recognizing intrinsic patterns and relationships very quickly during the data mining process. When observing earthquake clusters, there is a dire need for the researcher to interactively analyze earthquake events and instantaneously replay the spatial-temporal patterns obtained by the clustering. This will provide useful insight to seismologists by detecting correlations between small magnitude earthquakes and their possible influence on larger ones (Kaneko et. al, 2002). This requires fast 3-D visualization of multi-resolution structures in order to precisely detect boundaries between clusters and depict the magnitude and spatial distribution of events (Dzwinel et. al., 2003). The Amira package can quickly analyze and visualize large 3-D data sets involving both scalar and vector fields. It works hand-in-hand with data clustering by visually extracting and clarifying cluster structures while allowing the user to control clustering parameters. Examples of the Amira package being used to satisfy this visualization requirement for geophysical applications can be found in Erlebacher et al. (2001) and Dzwinel et. al. (2003). Figure 6 demonstrates an example of clustering a large number of earthquake events using Amira based on similarity measures. Each color represents an individual cluster.
Figure 6. Earthquakes are clustered and visualized to display which events are most similar to each other. The separate color represents clusters. This visualization was using the software package Amira. Time is represented by the blue axis, horizontal distance by the green axis, and depth by the red axis.
Our software extends the functionality of powerful visualization packages such as Amira by providing the same type of visualization capabilities, while additionally allowing the user to perform such visualization over the Internet from an ordinary web browser. Like
13
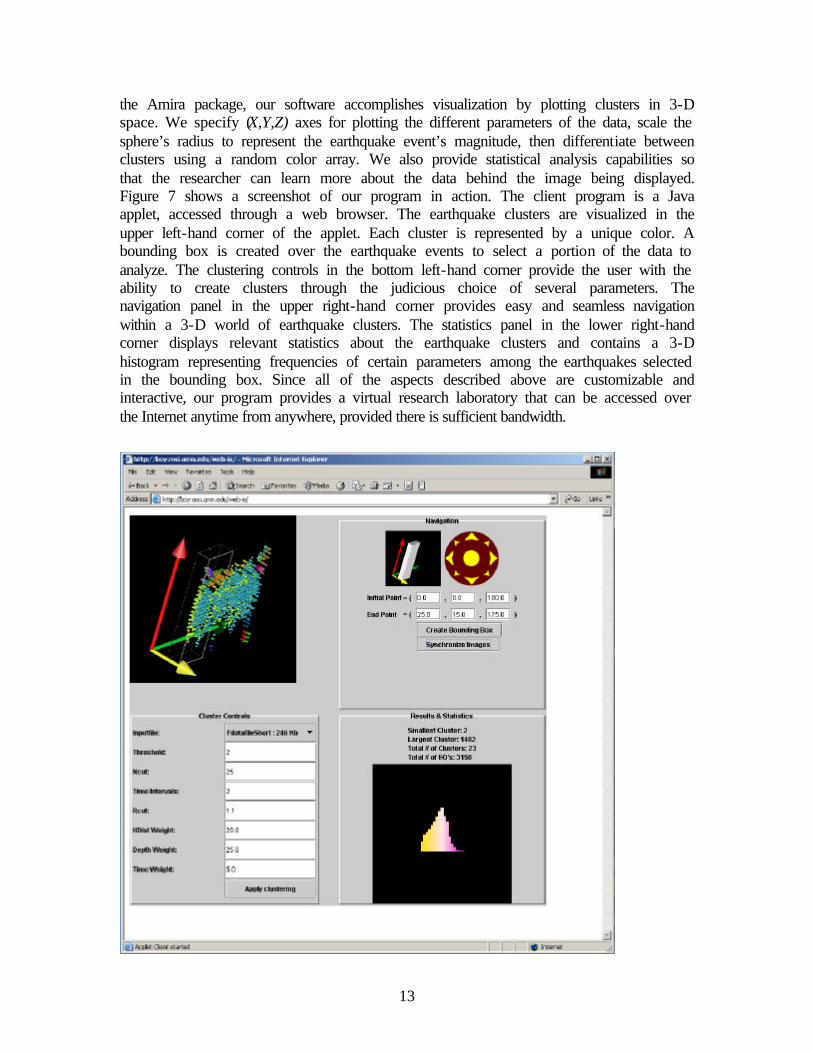
the Amira package, our software accomplishes visualization by plotting clusters in 3-D space. We specify (X,Y,Z) axes for plotting the different parameters of the data, scale the sphere’s radius to represent the earthquake event’s magnitude, then differentiate between clusters using a random color array. We also provide statistical analysis capabilities so that the researcher can learn more about the data behind the image being displayed. Figure 7 shows a screenshot of our program in action. The client program is a Java applet, accessed through a web browser. The earthquake clusters are visualized in the upper left-hand corner of the applet. Each cluster is represented by a unique color. A bounding box is created over the earthquake events to select a portion of the data to analyze. The clustering controls in the bottom left-hand corner provide the user with the ability to create clusters through the judicious choice of several parameters. The navigation panel in the upper right-hand corner provides easy and seamless navigation within a 3-D world of earthquake clusters. The statistics panel in the lower right-hand corner displays relevant statistics about the earthquake clusters and contains a 3-D histogram representing frequencies of certain parameters among the earthquakes selected in the bounding box. Since all of the aspects described above are customizable and interactive, our program provides a virtual research laboratory that can be accessed over the Internet anytime from anywhere, provided there is sufficient bandwidth.
14
Figure 7. The WEB-IS Java applet is accessed through a web browser (http://boy.msi.umn.edu/WEB-IS), and provides powerful functionality, including rendering of the 3-D data, interactive data mining and clustering, and statistical analysis of the data. Seismic data are being considered here.
V. Future Plans Our software is still in its infancy and can be enhanced in several ways to increase its performance and efficiency, and also to advance its functionality and ease of use.
For many scientists, the main concern when visualizing or analyzing data is speed. In this respect, our software has great potential for improvement. There are three primary bottlenecks to overcome. The first is encountered when the client makes a request for a new cluster. Although the clustering algorithm is very tight and efficient, its performance could be improved through parallelization of the algorithm to allow execution on multiple processors.
The second bottleneck relates to the visualization of the clusters. Using Mesa3D to render the images off-screen bypasses the graphics hardware, significantly slowing down the visualization process. As a result, the user must wait a longer time while the image is rendered before seeing the results. This can be improved by rendering the image to a p-buffer, thus harnessing off-screen hardware acceleration. Additionally, the visualization could be further improved by distributing it across a Grid, discussed below.
The final bottleneck is the speed of the network. There are two options for improving the speed at which the data is received over the network. The first is to increase the network bandwidth, by upgrading the direct connection to the server and to each client. This is obviously an unrealistic and impractical approach. The second option is to reduce the amount of data transmitted. This is the approach we wish to take, primarily by compressing the image data before sending it over the network to the client, and subsequently decompressing the data once it is received by the client. There are numerous techniques that can be used for compressing image data, including the common JPEG format, which can compress images by a factor up to 20. Wavelet compression algorithms can be even more efficient for compressing image data, with compression by a factor up to 80. By compressing the image data before sending it over the network, the speed at which the client receives the data is greatly increased. However this must be balanced with the speed at which the client can decompress the data.
Our software is an ideal candidate to become a Grid service (Berman et al., 2003). The Grid is an infrastructure for providing distributed computational power among numerous computers on interconnected networks, similar to an electric power grid (Foster and Kesselman, 1999). As a Grid service, the computation loads of our software’s server could be distributed among several computers (Foster, 2003) with the results then being collected and sent back to the client. This approach would require the clustering algorithms and visualization techniques to be parallelized in order to be carried out on distributed machines. In this scenario, a central server would manage the distribution of the clustering and visualization, then piece these results back together and send them to the client. The client would not need to know how or where the visualization and analysis is taking place. The end result would ideally be a faster and more powerful virtual server, with performance capabilities that rival that of a large supercomputer. This Grid implementation could also be approached by creating a custom “thorn” using Cactus
15
(www.cactuscode.org). Cactus is an open source problem-solving environment that allows for modular development of parallel applications over the Grid.
Another area of potential improvement, unrelated to the speed of the software, is the applet’s GUI. The GUI is an essential and often overlooked aspect of software design. All user interactions take place through the GUI, and therefore careful consideration must be taken to ensure the user understands and can easily utilize the interface. Norman (1988) describes the two gulfs that must be considered in the design of everyday things, including user interfaces: execution and evaluation.
The gulf of execution refers to the difference between what the user intends to do, and what the physical, or in our case virtual, controls allow the user to do. In order to bridge this gulf, most of the functionality must be implemented internally and occur behind the scenes. Our navigation system is an example of the gulf of execution. The user intends to navigate through a 3-D world by interacting with 2-D controls. Although difficult, this problem should be addressed by the software developers, and not suffered by the user. In this spirit, we have implemented a navigation compass on the client-side to let the user manipulate the position of the axes in 3-D. Once the navigational axes have been moved to the desired position, the main image is updated to reflect this same position. This is necessary because of the network delay that occurs when requesting a new position of the main image’s axes. By solely manipulating the main axes, the delay creates much choppiness that makes navigation of the 3-D world very difficult. Of course our software is far from perfect at bridging the gulf of execution. For example, we can improve the ease with which a user can set up our software to function with their customized visualization and analysis programs, which may be quite different from the earthquake-clustering scenario we have presented in this paper.
The gulf of evaluation refers to the amount of effort the user must put into determining the state of the system. As an example, our software uses widgets to control the clustering parameters. These widgets allow the user to track the parameters represented by the resulting image, and the extrema associated with each parameter. However, our GUI needs improvement bridging the gulf of evaluation for more complicated scenarios, such as alerting the user when the system has stalled and letting the user know the approximate time a specific clustering operation will take. Cases such as these must be addressed in the future to enhance the level of user-friendliness.
Our software has great potential to become a valuable educational tool in classrooms of high schools and colleges worldwide. Our software could allow a teacher to set up a computer as a server with particular earthquake datasets. The students could each simultaneously visualize and analyze these datasets, interactively clustering the data to search for relevant features. Additionally, the students could work in tandem while at different computers in different classrooms For example, a student in the U.S. could collaborate with a Japanese student, simultaneously exploring the same data and viewing the same image, with each operation performed by one showing up on the other’s screen, too. This is assuming, of course, that students from across the world could coordinate a time to meet online! The ability to easily setup our software on an arbitrary server and to manage the available sessions so that multiple people can collaborate on the same session will be a challenge that must be addressed. We need to make this process work smoothly for our software to see widespread use in the educational field.
16
Another improvement of our software that needs mentioning is the addition of streaming video to its capabilities. Streaming video could provide much additional functionality that could be useful to the researcher. For example, the time variable for earthquake events could be expressed by creating a video stream in which the streaming rate represents the earthquake time. Individual frames could be extracted for further analysis or to manipulate the 3-D position within that frame. In order for streaming video to become a useful function, a powerful compression algorithm must be implemented for the frames to be efficiently sent over the Internet. One candidate for compressing video is the wavelet technique (Chen, 2002). As mentioned earlier, wavelet functions can be used to achieve large compression factors, which is required when rapidly sending multiple frames over the Internet.
VI. Conclusion and Perspectives The onslaught of larger and larger data sets has forced the issue of keeping datasets at one central site, while improving the rate of data transfer to the user. Indeed datasets are becoming too massive for network bandwidth to handle; yet computers are becoming progressively more powerful and ubiquitous. We have developed easy-to-use software, which allows us to visualize and analyze the data remotely, over the Internet through the use of an appropriate Java plug-in. By placing a Java applet as the front-end from which the user interacts, our software becomes platform independent and usable from any geographic location with access to the Web. Ultimately, this implies that researchers can easily visualize and analyze their data, across the continent and even the Pacific Ocean.
Our plan is to continue the improvement of this software, WEB-IS (http://boy.msi.umn.edu/WEB-IS), by speeding up the clustering and visualization processes within the aegis of a GRID framework (Foster and Kesselman, 1998). Concurrently, we will make use of the graphic-centro paradigm wherein we will leverage the ever decreasing costs of graphics boards to render the images with more efficient algorithms (Weiskopf et al. 2002). We will endeavor to improve the graphical user interface to the point where users in the earth sciences community with little knowledge of information technology can engage seamlessly in collaborative efforts all over the world. Finally, we feel that the flexibility of this WEB-IS software will make it an invaluable tool for researchers of other disciplines and permit them to greatly improve their researching abilities by increasing their mobility and providing true anytime, anywhere access to their data.
Acknowledgements: We are grateful for discussions with J.B.D. Kaneko, Witek Dzwinel, Erik O.D. Sevre, Yunsong Wang, Lilli Yang, and Nick Olson. This research has been supported by the geophysics program of the National Science Foundation and the Complex Fluids Program of the Department of Energy. References: Andenberg, M.R., Clusters analysis for applications. Academic Press, New York, 1973.
Berman, F., Fox, G., and Hey, A.J.G. (Editors), Grid Computing: Making the Global Infrastructure a Reality, Wiley Series in Communications Networking & Distributed Systems, 1013 pp., John Wiley & Sons Ltd., 2003.

17
Ben-Zion Y (1996) Stress, slip, and earthquakes in models of complex single-fault systems incorporating brittle and creep deformations. J Geophys Res 101(B3):5677-5706. Cactus website, http://www.cactuscode.org, 2003.
Dzwinel, W., and Blasiak, J., Method of particles in visual clustering of multi-dimensional and large data sets. Future Gener Comput Syst 15:365-379, 1999.
Dzwinel, W., Yuen, D.A., Kaneko, Y., Boryczko, K., and Ben-Zion, Y., Multi-Resolution Clustering Analysis and 3-D Visualization of Multitudinous Synthetic Earthquakes, Visual Geosciences, Vol. 8, 2003.
Engel, K., Sommer, O., Ertl, T. (2000) A Framework for Interactive Hardware-Accelerated Remote 3D-Visualization, Data Visualization 2000, Springer Computer Science 291, 2000, 167-177, 291. EON website, http://eon.chem.washington.edu/, 2003.
Erlebacher, G., Yuen, D.A., and Dubuffet, F., Current trends and demands in visualization in the geosciences. Electronic Geosciences 4. http://link.springer-ny.com/link/sevice/journals/10069/technic/erlebach/index.htm, 2001.
Foster, I., The Grid: Computing Without Bounds, Scientific American, April, 2003.
Foster, I. and Kesselman, C. (Editors), The Grid: Blueprint for a New Computing Infrastructure, 677 pp., Morgan Kaufmann Publishers, San Francisco, CA, 1999.
Garbow, Z.A., Olson, N.R., Yuen, D.A., and Boggs, J.M., Interactive Web-Based Map: Applications to Large Data Sets in the Geosciences, Electronic Geosciences, Vol. 6, 2001. http://link.springer.de/link/service/journals/10069/ papers/webbased/index.htm
Garbow, Z.A., Erlebacher, G., Yuen, D.A., Boggs, J.M., and Dubuffet, F., Web-Based Interrogation of Large-Scale Geophysical Datasets from Handheld Devices, Visual Geosciences, Vol. 8, 2003.
Garbow, Z.A., Erlebacher, G., Yuen, D.A., Sevre, E.O., Nagle, A.R., and Kaneko, Y., Web-Based Interrogation of Large Scale Geophysical Datasets and Clustering Analysis of Many Earthquake Events From Desktop and Handheld Computers, American Geophysical Union, Fall Meeting Abstract, http://www.agu.org/, 2002.
Genome@home website, http://gah.stanford.edu/, 2003.
Gowda, C.K. and Krishna, G, Agglomerative clustering using the concept of nearest neighborhood, 1978.
Hand, D., Mannila, H., and Padhraic, S., Principles of Data Mining, MIT Press, 2001.
Hastie, T., Tibshirani, R., and Friedman, J., The Elements of Statistical Learning, Springer, 2001.
Hockney, R.W. and Eastwood, J.W., Computer simulation using particles. McGraw-Hill, 1981.
Jain, A.K., Murty, M.N., and Flynn, P.J., Data Clustering: A Review, ACM Computing Surveys, Vol. 31, No. 3, 264-323 http://citeseer.nj.nec.com/jain99data.html, 1999.
18
Java website, http://java.sun.com, 2003.
Kaneko, Y., Yuen, D.A., Dzwinel, W., Boryszko, K., Ben-Zion,Y., and Sevre, E.O., Multi-Resolution Clustering Analysis and Visualization of Around One million synthetic Earthquake Events, American Geophysics Union, Fall Meeting Abstract, http://www.agu.org, 2002.
Karypis, G., Han, E., and Kumar, V., Chameleon: A Hierarchical Clustering Algorithm using Dynamic Modeling, IEEE Computer, 2002.
Kumar, V., Grama, A., Gupta, A., and Karypis, G., Introduction to Parallel Computing: Design and Analysis of Algorithms, Benjamin Cummings, November, 1993.
Mesa3D Graphics Library. URL: http://www.mesa3d.org, 2003.
MICO CORBA. URL: http://www.mico.org, 2003.
Norman, D.A., Design of Everyday Things, p. 45-53, Doubleday, New York, 1988.
The Object Management Group (OMG) website, http://www.omg.org/, 2003.
OpenGL.org website, http://www.opengl.org, 2003.
Pocket Computer and Internet Dictionary, 349 pp. Random House, New York, 1999.
Real VNC website, http://www.realvnc.com, 2003.
Rosen, R H, Discrete Math and its Applications, McGraw-Hill, 2002.
SETI@home website, http://setiathome.ssl.berkeley.edu, 2003.
Silicon Graphics Inc website, http://www.sgi.com, 2003.
Stegmaier, S., Magallon, M. and T. Ertl, A Generic Solution for Hardware-Accelerated Remote Visualization, Joint Eurographics – IEEE TCVG Symposium on Visualization, 2002.
Theodoris, S, and Koutroumbas, K., Pattern recognition, Academic Press, San Diego, 1998.
Virtual Earth (VE) website, http://anquetil.colorado.edu/VE/, 2003. Wang, Y. Erlebacher, G., Garbow, Z.A., and Yuen, D.A., Web-based Service for Amira, in press, 2003.
Web-based Data Interrogation System website, http://www.csit.fsu.edu/~garbowza/WDI/, 2003. WEB-IS website, http://boy.msi.umn.edu/WEB-IS, 2003. WEB-SA website, http://boy.msi.umn.edu/amira, 2003. Weiskopf, D., Erlebacher, G., Hopf, M., and Ertl, T. “Hardware-Accelerated Lagrangian-Eulerian Texture Advection for 2D Flow Visualization,” 7th Fall Workshop Vision, Modeling, and Visualization 2002 (VMV2002).