
Perceptual rendering of participating media
22
15 Perceptual Rendering of Participating Media VERONICA SUNDSTEDT University of Bristol DIEGO GUTIERREZ and OSCAR ANSON University of Zaragoza and FRANCESCO BANTERLE, and ALAN CHALMERS University of Bristol High-fidelity image synthesis is the process of computing images that are perceptually indistinguishable from the real world they are attempting to portray. Such a level of fidelity requires that the physical processes of materials and the behavior of light are accurately simulated. Most computer graphics algorithms assume that light passes freely between surfaces within an environment. However, in many applications, we also need to take into account how the light interacts with media, such as dust, smoke, fog, etc., between the surfaces. The computational requirements for calculating the interaction of light with such participating media are substantial. This process can take many hours and rendering effort is often spent on computing parts of the scene that may not be perceived by the viewer. In this paper, we present a novel perceptual strategy for physically based rendering of participating media. By using a combination of a saliency map with our new extinction map (X map), we can significantly reduce rendering times for inhomogeneous media. The visual quality of the resulting images is validated using two objective difference metrics and a subjective psychophysical experiment. Although the average pixel errors of these metric are all less than 1%, the subjective validation indicates that the degradation in quality still is noticeable for certain scenes. We thus introduce and validate a novel light map (L map) that accounts for salient features caused by multiple light scattering around light sources. Categories and Subject Descriptors: I.3.7 [Computer Graphics]: Three-Dimensional Graphics and Realism-color, shading, shadowing, and texture General Terms: Algorithms, Performance, Experimentation, Human Factors Additional Key Words and Phrases: Participating media, selective rendering, perception, saliency map, extinction map, light map, attention ACM Reference Format: Sundstedt V., Gutierrez, D., Anson, O., Banterle, F., and Chalmers, A. 2007. Perceptual rendering of participating media. ACM Trans. Appl. Percpt. 4, 3, Article 15 (November 2007), 22 pages. DOI = 10.1145/1278387.1278389 http://doi.acm.org/10.1145/ 1278387.1278389 This research was partly sponsored by the European Union within the CROSSMOD project (EU IST-014891-2) and the Spanish Ministry of Education and Research through the project TIN2004-07672-C03-03. Authors’ addresses: Veronica Sundstedt, Francesco Banterle, and Alan Chalmers, Department of Computer Science, Merchant Venturers Building, Woodland Road, BS8 1UB, Bristol, UK; email: [email protected]. Diego Gutierrez and Oscar Anson, Grupo de Informatica Grafica Avanzada (GIGA), Departamento de Informatica e Ingenieria de Sistemas, Universidad de Zaragoza, Edificio Ada Byron, Maria de Luna 1, 50018, Zaragoza, Spain; email: [email protected]. Permission to make digital or hard copies of part or all of this work for personal or classroom use is granted without fee provided that copies are not made or distributed for profit or direct commercial advantage and that copies show this notice on the first page or initial screen of a display along with the full citation. Copyrights for components of this work owned by others than ACM must be honored. Abstracting with credit is permitted. To copy otherwise, to republish, to post on servers, to redistribute to lists, or to use any component of this work in other works requires prior specific permission and/or a fee. Permissions may be requested from Publications Dept., ACM, Inc., 2 Penn Plaza, Suite 701, New York, NY 10121-0701 USA, fax +1 (212) 869-0481, or [email protected]. c 2007 ACM 1544-3558/2007/11-ART15 $5.00 DOI 10.1145/1278387.1278389 http://doi.acm.org/10.1145/1278387.1278389 ACM Transactions on Applied Perception, Vol. 4, No. 3, Article 15, Publication date: November 2007.
-
Upload
independent -
Category
Documents
-
view
2 -
download
0
Transcript of Perceptual rendering of participating media
15
Perceptual Rendering of Participating Media
VERONICA SUNDSTEDT
University of Bristol
DIEGO GUTIERREZ and OSCAR ANSON
University of Zaragoza
and
FRANCESCO BANTERLE, and ALAN CHALMERS
University of Bristol
High-fidelity image synthesis is the process of computing images that are perceptually indistinguishable from the real worldthey are attempting to portray. Such a level of fidelity requires that the physical processes of materials and the behavior oflight are accurately simulated. Most computer graphics algorithms assume that light passes freely between surfaces withinan environment. However, in many applications, we also need to take into account how the light interacts with media, suchas dust, smoke, fog, etc., between the surfaces. The computational requirements for calculating the interaction of light withsuch participating media are substantial. This process can take many hours and rendering effort is often spent on computingparts of the scene that may not be perceived by the viewer. In this paper, we present a novel perceptual strategy for physicallybased rendering of participating media. By using a combination of a saliency map with our new extinction map (X map), we cansignificantly reduce rendering times for inhomogeneous media. The visual quality of the resulting images is validated using twoobjective difference metrics and a subjective psychophysical experiment. Although the average pixel errors of these metric areall less than 1%, the subjective validation indicates that the degradation in quality still is noticeable for certain scenes. We thusintroduce and validate a novel light map (L map) that accounts for salient features caused by multiple light scattering aroundlight sources.
Categories and Subject Descriptors: I.3.7 [Computer Graphics]: Three-Dimensional Graphics and Realism-color, shading,shadowing, and texture
General Terms: Algorithms, Performance, Experimentation, Human FactorsAdditional Key Words and Phrases: Participating media, selective rendering, perception, saliency map, extinction map, lightmap, attention
ACM Reference Format:Sundstedt V., Gutierrez, D., Anson, O., Banterle, F., and Chalmers, A. 2007. Perceptual rendering of participating media. ACMTrans. Appl. Percpt. 4, 3, Article 15 (November 2007), 22 pages. DOI = 10.1145/1278387.1278389 http://doi.acm.org/10.1145/1278387.1278389
This research was partly sponsored by the European Union within the CROSSMOD project (EU IST-014891-2) and the SpanishMinistry of Education and Research through the project TIN2004-07672-C03-03.Authors’ addresses: Veronica Sundstedt, Francesco Banterle, and Alan Chalmers, Department of Computer Science,Merchant Venturers Building, Woodland Road, BS8 1UB, Bristol, UK; email: [email protected]. Diego Gutierrez and OscarAnson, Grupo de Informatica Grafica Avanzada (GIGA), Departamento de Informatica e Ingenieria de Sistemas, Universidad deZaragoza, Edificio Ada Byron, Maria de Luna 1, 50018, Zaragoza, Spain; email: [email protected] to make digital or hard copies of part or all of this work for personal or classroom use is granted without fee providedthat copies are not made or distributed for profit or direct commercial advantage and that copies show this notice on the firstpage or initial screen of a display along with the full citation. Copyrights for components of this work owned by others thanACM must be honored. Abstracting with credit is permitted. To copy otherwise, to republish, to post on servers, to redistributeto lists, or to use any component of this work in other works requires prior specific permission and/or a fee. Permissions may berequested from Publications Dept., ACM, Inc., 2 Penn Plaza, Suite 701, New York, NY 10121-0701 USA, fax +1 (212) 869-0481,or [email protected]© 2007 ACM 1544-3558/2007/11-ART15 $5.00 DOI 10.1145/1278387.1278389 http://doi.acm.org/10.1145/1278387.1278389
ACM Transactions on Applied Perception, Vol. 4, No. 3, Article 15, Publication date: November 2007.
Article 15 / 2 • V. Sundstedt et al.
1. INTRODUCTION
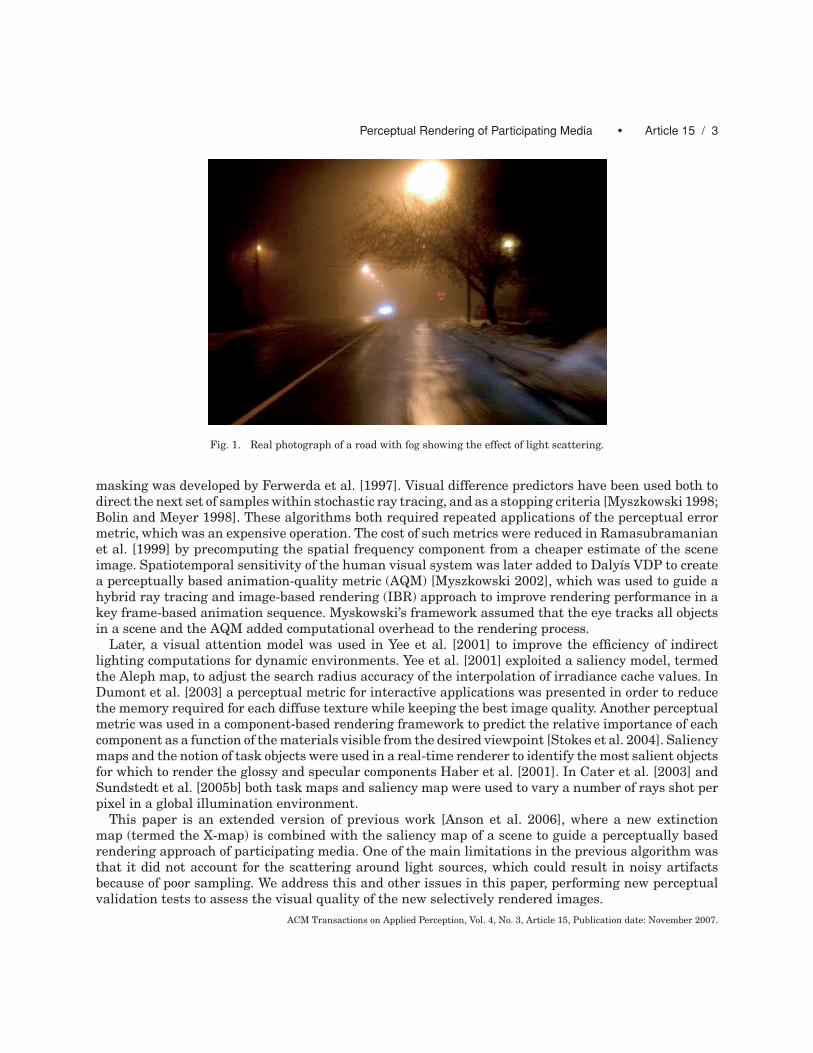
Rendering of physically based imagery using global illumination techniques is very useful and necessaryin areas, such as safety, military, or industry [Rushmeier 1994]. The applications in these areas usuallydeal with the analysis of visual perception under unfavorable environmental conditions, where thepresence of a medium have a noteworthy influence in the visibility (and, therefore, the design) ofcertain elements, such as road signs, fire exit signs, car headlamps, and road lighting. Examples ofthese participating media include smoke, fog, dust, flames, silty and abyssal waters or atmosphericphenomena, as shown in Figure 1. Simulating light interaction with this participating media impliesthe correct computation of the absorption and scattering of the light and is thus computationally veryexpensive.
In traditional global illumination rendering, not all computations performed effect how the finalimage is perceived. To improve the efficiency of rendering it is necessary to perform less renderingwork, while not affecting the perception of the resultant image. Perceptually based rendering algorithmsreduce the computational cost by exploiting limitations of the human visual system. For example, theamount of information that reaches our eyes is far greater than our brain is able to process. Selectivevisual attention is a complex action, which is used to find and focus on relevant information in a quickand efficient manner. Perceptually based metrics can be used as a stopping criterion for rendering bydetermining if continuing the computation would lead to a perceptual improvement. Selective renderingalgorithms generate images where the rendering quality is varied spatially across the image [Sundstedtet al. 2005b; Chalmers et al. 2006]. Areas of high perceptual importance will have a more accuratesolution. However, the difference in image quality will not be perceived by the viewer.
To significantly reduce physically based rendering times for participating media, we propose a novelperceptual strategy based on the combination of a saliency map [Itti et al. 1998] with our new extinctionmap (X map) and light map (L map). The X map stores in image-space the exponential decay of light inthe medium. The L map accounts for salient features caused by multiple light scattering around lightsources. This combination, that we have called the XSL map, is used to guide a selective rendering of ascene, with more accurate estimates in the perceptually important areas. The novelties of our work canbe summarized as the introduction of the X-, and L-map concept and its combination with a modulatedsaliency map (S map) to guide a perception-based renderer for inhomogeneous participating media. Inaddition, two objective metrics are used to validate our approach and the perceived quality of selectiverendering results is assessed by two forced-choice preference experiments.
The rest of the paper is organized as follows: In Section 2, we present a short summary of how visualperception has been incorporated in perceptually-based rendering algorithms. In Section 3, the physicsof participating media that underpins this work is presented. We describe our novel selective renderingsystem using the XSL map in Section 4, and present the results in Section 5. We validate the XSL mapin Section 6 using both objective metrics and subjective experiments. In Section 7, we conclude the workpresented in this paper and discuss ideas for future research.
2. RELATED WORK
Early work in perceptually assisted rendering was mainly concerned with the acceleration of ray trac-ing. Although techniques based on visual attention had been developed before, such as adaptive sam-pling [Mitchell 1987] for ray tracing, which applied perceptual considerations, have recently becomemore popular. An good overview of early perceptually driven radiosity methods is given in by Prikryl[2001]. A frequency-based ray tracer using a more complete model of the human visual system, which in-corporated the visual systemís spatial processing behavior and sensitivity change as a function of lumi-nance was developed by Bolin and Meyer [1995]. An even more sophisticated model incorporating visualACM Transactions on Applied Perception, Vol. 4, No. 3, Article 15, Publication date: November 2007.
Perceptual Rendering of Participating Media • Article 15 / 3
Fig. 1. Real photograph of a road with fog showing the effect of light scattering.
masking was developed by Ferwerda et al. [1997]. Visual difference predictors have been used both todirect the next set of samples within stochastic ray tracing, and as a stopping criteria [Myszkowski 1998;Bolin and Meyer 1998]. These algorithms both required repeated applications of the perceptual errormetric, which was an expensive operation. The cost of such metrics were reduced in Ramasubramanianet al. [1999] by precomputing the spatial frequency component from a cheaper estimate of the sceneimage. Spatiotemporal sensitivity of the human visual system was later added to Dalyís VDP to createa perceptually based animation-quality metric (AQM) [Myszkowski 2002], which was used to guide ahybrid ray tracing and image-based rendering (IBR) approach to improve rendering performance in akey frame-based animation sequence. Myskowski’s framework assumed that the eye tracks all objectsin a scene and the AQM added computational overhead to the rendering process.
Later, a visual attention model was used in Yee et al. [2001] to improve the efficiency of indirectlighting computations for dynamic environments. Yee et al. [2001] exploited a saliency model, termedthe Aleph map, to adjust the search radius accuracy of the interpolation of irradiance cache values. InDumont et al. [2003] a perceptual metric for interactive applications was presented in order to reducethe memory required for each diffuse texture while keeping the best image quality. Another perceptualmetric was used in a component-based rendering framework to predict the relative importance of eachcomponent as a function of the materials visible from the desired viewpoint [Stokes et al. 2004]. Saliencymaps and the notion of task objects were used in a real-time renderer to identify the most salient objectsfor which to render the glossy and specular components Haber et al. [2001]. In Cater et al. [2003] andSundstedt et al. [2005b] both task maps and saliency map were used to vary a number of rays shot perpixel in a global illumination environment.
This paper is an extended version of previous work [Anson et al. 2006], where a new extinctionmap (termed the X-map) is combined with the saliency map of a scene to guide a perceptually basedrendering approach of participating media. One of the main limitations in the previous algorithm wasthat it did not account for the scattering around light sources, which could result in noisy artifactsbecause of poor sampling. We address this and other issues in this paper, performing new perceptualvalidation tests to assess the visual quality of the new selectively rendered images.
ACM Transactions on Applied Perception, Vol. 4, No. 3, Article 15, Publication date: November 2007.
Article 15 / 4 • V. Sundstedt et al.
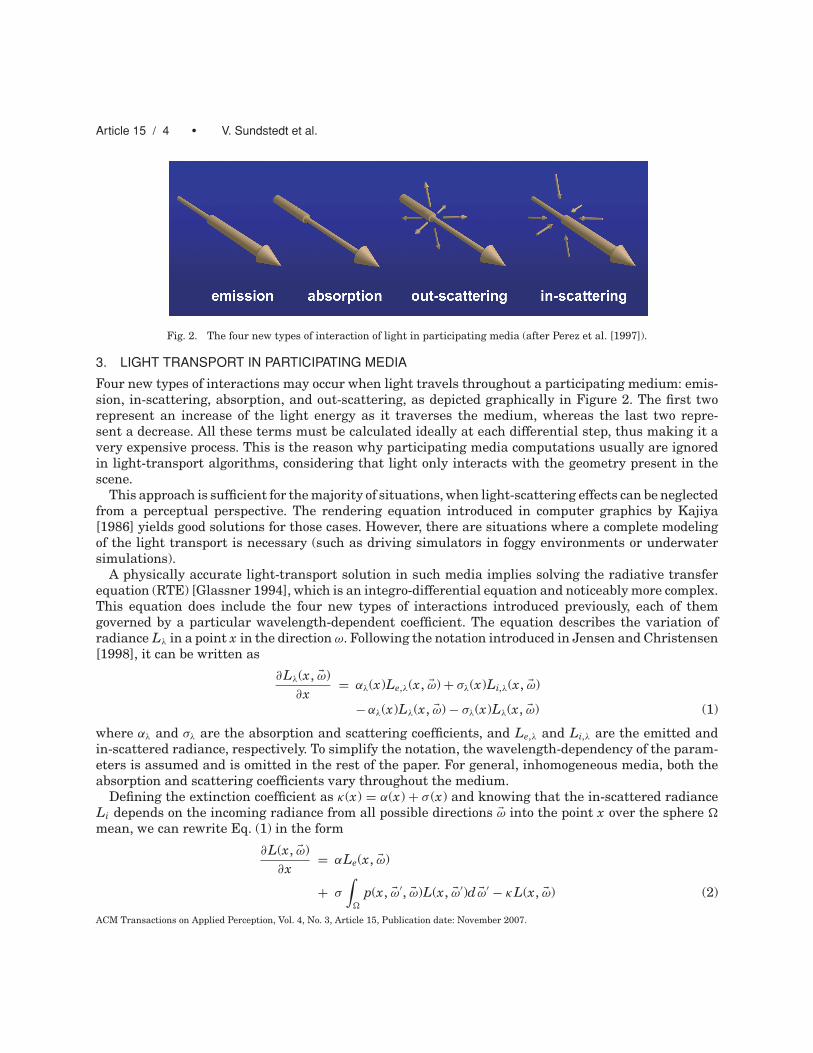
Fig. 2. The four new types of interaction of light in participating media (after Perez et al. [1997]).
3. LIGHT TRANSPORT IN PARTICIPATING MEDIA
Four new types of interactions may occur when light travels throughout a participating medium: emis-sion, in-scattering, absorption, and out-scattering, as depicted graphically in Figure 2. The first tworepresent an increase of the light energy as it traverses the medium, whereas the last two repre-sent a decrease. All these terms must be calculated ideally at each differential step, thus making it avery expensive process. This is the reason why participating media computations usually are ignoredin light-transport algorithms, considering that light only interacts with the geometry present in thescene.
This approach is sufficient for the majority of situations, when light-scattering effects can be neglectedfrom a perceptual perspective. The rendering equation introduced in computer graphics by Kajiya[1986] yields good solutions for those cases. However, there are situations where a complete modelingof the light transport is necessary (such as driving simulators in foggy environments or underwatersimulations).
A physically accurate light-transport solution in such media implies solving the radiative transferequation (RTE) [Glassner 1994], which is an integro-differential equation and noticeably more complex.This equation does include the four new types of interactions introduced previously, each of themgoverned by a particular wavelength-dependent coefficient. The equation describes the variation ofradiance Lλ in a point x in the direction ω. Following the notation introduced in Jensen and Christensen[1998], it can be written as
∂Lλ(x, �ω)∂x
= αλ(x)Le,λ(x, �ω) + σλ(x)Li,λ(x, �ω)
− αλ(x)Lλ(x, �ω) − σλ(x)Lλ(x, �ω) (1)
where αλ and σλ are the absorption and scattering coefficients, and Le,λ and Li,λ are the emitted andin-scattered radiance, respectively. To simplify the notation, the wavelength-dependency of the param-eters is assumed and is omitted in the rest of the paper. For general, inhomogeneous media, both theabsorption and scattering coefficients vary throughout the medium.
Defining the extinction coefficient as κ(x) = α(x) + σ (x) and knowing that the in-scattered radianceLi depends on the incoming radiance from all possible directions �ω into the point x over the sphere �
mean, we can rewrite Eq. (1) in the form
∂L(x, �ω)∂x
= αLe(x, �ω)
+ σ
∫�
p(x, �ω′, �ω)L(x, �ω′)d �ω′ − κL(x, �ω) (2)
ACM Transactions on Applied Perception, Vol. 4, No. 3, Article 15, Publication date: November 2007.
Perceptual Rendering of Participating Media • Article 15 / 5
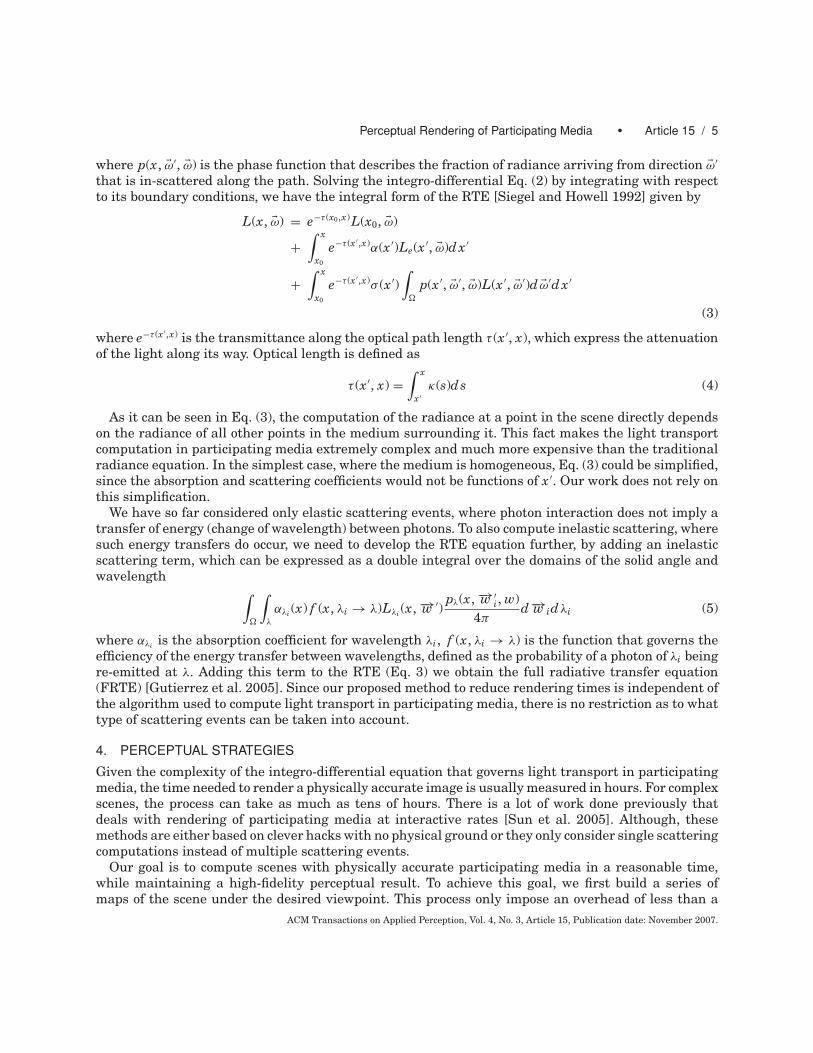
where p(x, �ω′, �ω) is the phase function that describes the fraction of radiance arriving from direction �ω′
that is in-scattered along the path. Solving the integro-differential Eq. (2) by integrating with respectto its boundary conditions, we have the integral form of the RTE [Siegel and Howell 1992] given by
L(x, �ω) = e−τ (x0,x)L(x0, �ω)
+∫ x
x0
e−τ (x ′,x)α(x ′)Le(x ′, �ω)d x ′
+∫ x
x0
e−τ (x ′,x)σ (x ′)∫
�
p(x ′, �ω′, �ω)L(x ′, �ω′)d �ω′d x ′
(3)
where e−τ (x ′,x) is the transmittance along the optical path length τ (x ′, x), which express the attenuationof the light along its way. Optical length is defined as
τ (x ′, x) =∫ x
x ′κ(s)ds (4)
As it can be seen in Eq. (3), the computation of the radiance at a point in the scene directly dependson the radiance of all other points in the medium surrounding it. This fact makes the light transportcomputation in participating media extremely complex and much more expensive than the traditionalradiance equation. In the simplest case, where the medium is homogeneous, Eq. (3) could be simplified,since the absorption and scattering coefficients would not be functions of x ′. Our work does not rely onthis simplification.
We have so far considered only elastic scattering events, where photon interaction does not imply atransfer of energy (change of wavelength) between photons. To also compute inelastic scattering, wheresuch energy transfers do occur, we need to develop the RTE equation further, by adding an inelasticscattering term, which can be expressed as a double integral over the domains of the solid angle andwavelength ∫
�
∫λ
αλi (x) f (x, λi → λ)Lλi (x, −→w ′)pλ(x, −→w ′
i, w)4π
d−→w idλi (5)
where αλi is the absorption coefficient for wavelength λi, f (x, λi → λ) is the function that governs theefficiency of the energy transfer between wavelengths, defined as the probability of a photon of λi beingre-emitted at λ. Adding this term to the RTE (Eq. 3) we obtain the full radiative transfer equation(FRTE) [Gutierrez et al. 2005]. Since our proposed method to reduce rendering times is independent ofthe algorithm used to compute light transport in participating media, there is no restriction as to whattype of scattering events can be taken into account.
4. PERCEPTUAL STRATEGIES
Given the complexity of the integro-differential equation that governs light transport in participatingmedia, the time needed to render a physically accurate image is usually measured in hours. For complexscenes, the process can take as much as tens of hours. There is a lot of work done previously thatdeals with rendering of participating media at interactive rates [Sun et al. 2005]. Although, thesemethods are either based on clever hacks with no physical ground or they only consider single scatteringcomputations instead of multiple scattering events.
Our goal is to compute scenes with physically accurate participating media in a reasonable time,while maintaining a high-fidelity perceptual result. To achieve this goal, we first build a series ofmaps of the scene under the desired viewpoint. This process only impose an overhead of less than a
ACM Transactions on Applied Perception, Vol. 4, No. 3, Article 15, Publication date: November 2007.
Article 15 / 6 • V. Sundstedt et al.
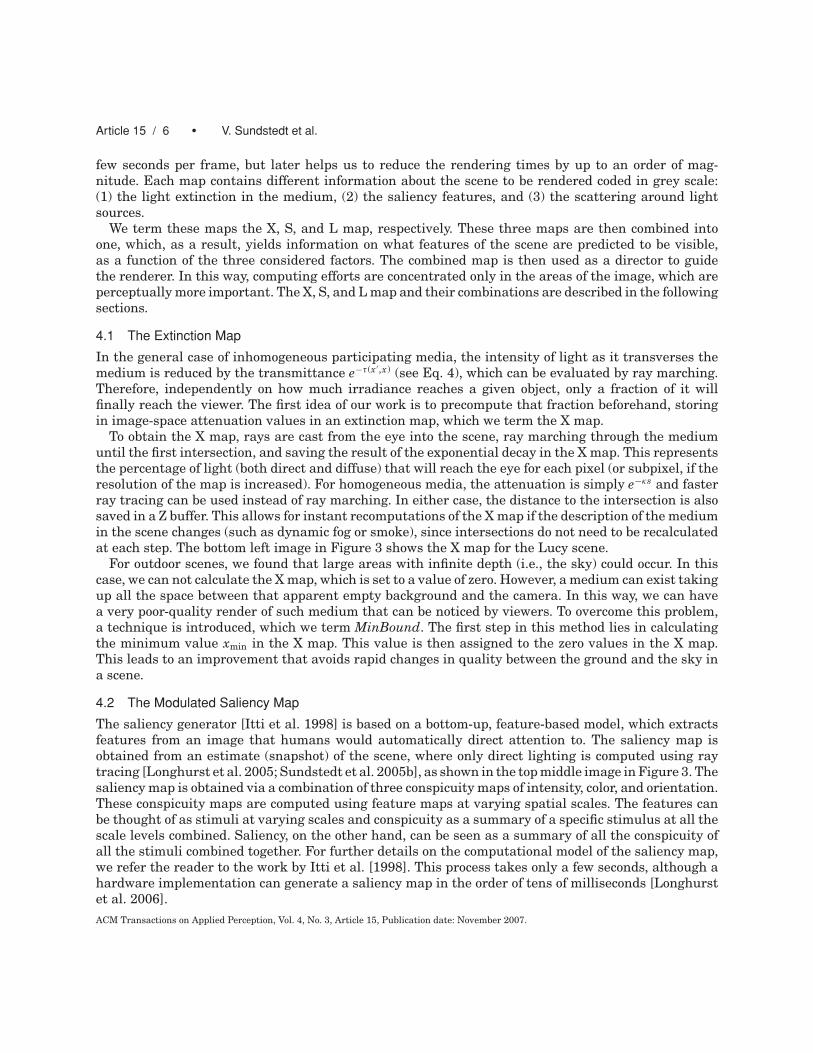
few seconds per frame, but later helps us to reduce the rendering times by up to an order of mag-nitude. Each map contains different information about the scene to be rendered coded in grey scale:(1) the light extinction in the medium, (2) the saliency features, and (3) the scattering around lightsources.
We term these maps the X, S, and L map, respectively. These three maps are then combined intoone, which, as a result, yields information on what features of the scene are predicted to be visible,as a function of the three considered factors. The combined map is then used as a director to guidethe renderer. In this way, computing efforts are concentrated only in the areas of the image, which areperceptually more important. The X, S, and L map and their combinations are described in the followingsections.
4.1 The Extinction Map
In the general case of inhomogeneous participating media, the intensity of light as it transverses themedium is reduced by the transmittance e−τ (x ′,x) (see Eq. 4), which can be evaluated by ray marching.Therefore, independently on how much irradiance reaches a given object, only a fraction of it willfinally reach the viewer. The first idea of our work is to precompute that fraction beforehand, storingin image-space attenuation values in an extinction map, which we term the X map.
To obtain the X map, rays are cast from the eye into the scene, ray marching through the mediumuntil the first intersection, and saving the result of the exponential decay in the X map. This representsthe percentage of light (both direct and diffuse) that will reach the eye for each pixel (or subpixel, if theresolution of the map is increased). For homogeneous media, the attenuation is simply e−κs and fasterray tracing can be used instead of ray marching. In either case, the distance to the intersection is alsosaved in a Z buffer. This allows for instant recomputations of the X map if the description of the mediumin the scene changes (such as dynamic fog or smoke), since intersections do not need to be recalculatedat each step. The bottom left image in Figure 3 shows the X map for the Lucy scene.
For outdoor scenes, we found that large areas with infinite depth (i.e., the sky) could occur. In thiscase, we can not calculate the X map, which is set to a value of zero. However, a medium can exist takingup all the space between that apparent empty background and the camera. In this way, we can havea very poor-quality render of such medium that can be noticed by viewers. To overcome this problem,a technique is introduced, which we term MinBound. The first step in this method lies in calculatingthe minimum value xmin in the X map. This value is then assigned to the zero values in the X map.This leads to an improvement that avoids rapid changes in quality between the ground and the sky ina scene.
4.2 The Modulated Saliency Map
The saliency generator [Itti et al. 1998] is based on a bottom-up, feature-based model, which extractsfeatures from an image that humans would automatically direct attention to. The saliency map isobtained from an estimate (snapshot) of the scene, where only direct lighting is computed using raytracing [Longhurst et al. 2005; Sundstedt et al. 2005b], as shown in the top middle image in Figure 3. Thesaliency map is obtained via a combination of three conspicuity maps of intensity, color, and orientation.These conspicuity maps are computed using feature maps at varying spatial scales. The features canbe thought of as stimuli at varying scales and conspicuity as a summary of a specific stimulus at all thescale levels combined. Saliency, on the other hand, can be seen as a summary of all the conspicuity ofall the stimuli combined together. For further details on the computational model of the saliency map,we refer the reader to the work by Itti et al. [1998]. This process takes only a few seconds, although ahardware implementation can generate a saliency map in the order of tens of milliseconds [Longhurstet al. 2006].ACM Transactions on Applied Perception, Vol. 4, No. 3, Article 15, Publication date: November 2007.
Perceptual Rendering of Participating Media • Article 15 / 7
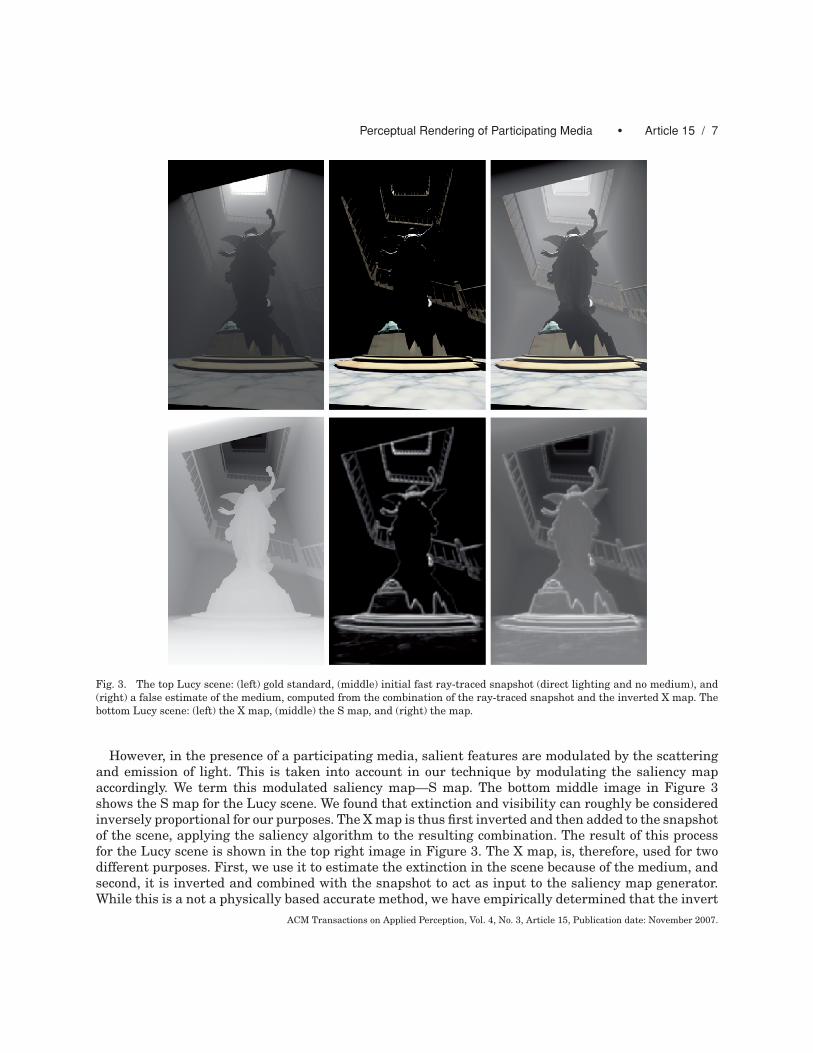
Fig. 3. The top Lucy scene: (left) gold standard, (middle) initial fast ray-traced snapshot (direct lighting and no medium), and(right) a false estimate of the medium, computed from the combination of the ray-traced snapshot and the inverted X map. Thebottom Lucy scene: (left) the X map, (middle) the S map, and (right) the map.
However, in the presence of a participating media, salient features are modulated by the scatteringand emission of light. This is taken into account in our technique by modulating the saliency mapaccordingly. We term this modulated saliency map—S map. The bottom middle image in Figure 3shows the S map for the Lucy scene. We found that extinction and visibility can roughly be consideredinversely proportional for our purposes. The X map is thus first inverted and then added to the snapshotof the scene, applying the saliency algorithm to the resulting combination. The result of this processfor the Lucy scene is shown in the top right image in Figure 3. The X map, is, therefore, used for twodifferent purposes. First, we use it to estimate the extinction in the scene because of the medium, andsecond, it is inverted and combined with the snapshot to act as input to the saliency map generator.While this is a not a physically based accurate method, we have empirically determined that the invert
ACM Transactions on Applied Perception, Vol. 4, No. 3, Article 15, Publication date: November 2007.
Article 15 / 8 • V. Sundstedt et al.
X map operation suits our needs in the perceptually-based selective rendering system. The validationtests described in Section 6 confirm this.
4.3 The XS Map
Once the X and the S maps are obtained, they are combined into what we term the XS map. The XSmap intuitively yields information on the salient features of the scene modulated by the extinction inthe participating medium. For the combination, we follow a similar approach as presented in Sundstedtet al. [2005b]. Our combination is given by XS(wx , ws, op), where XS represents the combined S andX maps, and wx and ws are coefficients applied to the values in the respective maps, allowing fordifferent weighting to define relative importance of the maps. The coefficients are combined throughthe operator op. Selection of appropriate operator op controls the combination of the two maps in theselective renderer. We used an add operator to combine the information from both maps such that allweighted features are preserved. An equal weighting of both maps would, therefore, be XS(0.5, 0.5, +),which correspond to our XS map, rendered images, XS(1, 0, +) to the images rendered only with theX map, and XS(0, 1, +) to the images rendered only with the saliency map. A multiplicative operatorcould also be used in order to represent saliency modulated by the decay of light in the media. In anycase, the XS map will guide the selective rendering process by spending computational resources inareas of higher perceptual importance and low extinction. The bottom-right image in Figure 3 showsthe XS map for the Lucy scene.
4.4 The Light Map
The XS map seems to be sufficient if there are not visible light sources against an empty background.In the presence of a participating medium, multiple light scattering around light sources becomes animportant salient feature and this will slip by undetected in the case described. This can be seen inFigure 1, where areas of strong scattering around light sources become a salient feature of the wholescene. In the first experiment presented in Section 6, we also show, using a visualization of eye-gazedata, that the participants did attend to areas with light scattering.
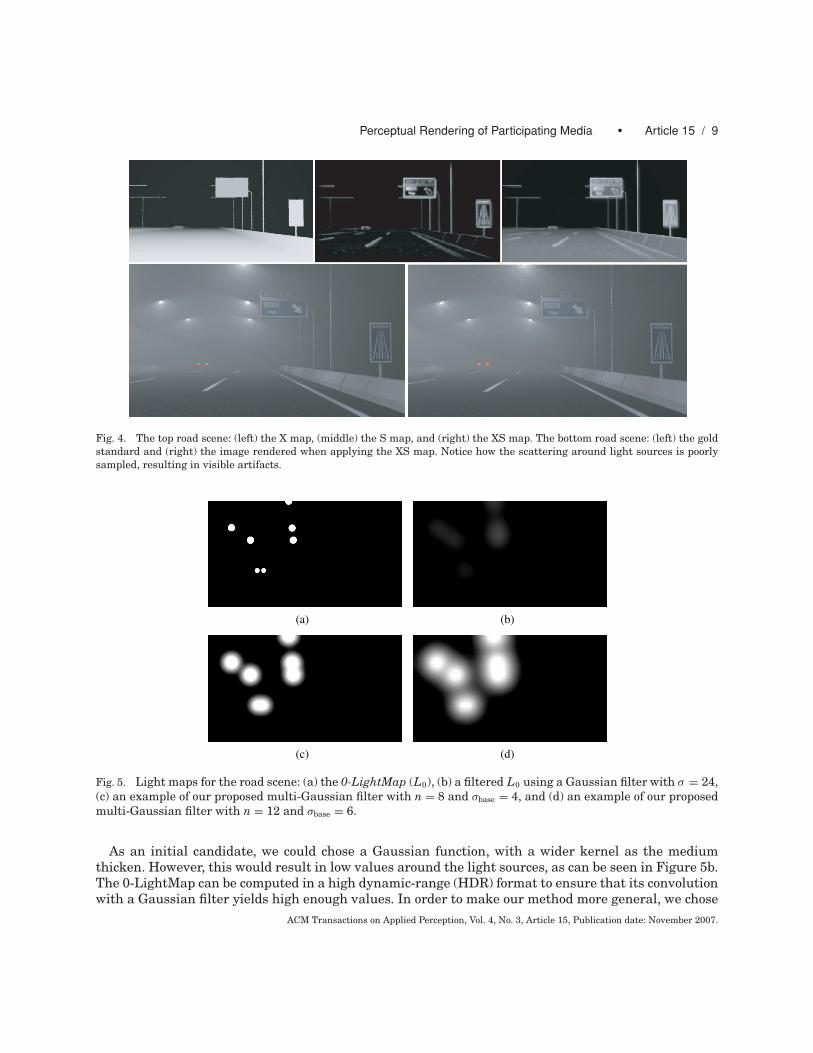
However, neither the X map nor the S map (and, therefore, neither its combination into the XS map)will identify these areas as visually important. This will lead to poor sampling during the renderingstage, resulting in clearly visible artifacts in the image. The artifacts can be seen in the bottom rightimage in Figure 4 rendered using the XS map. The X, S, and XS map are shown on the top and neitherof these maps predict the scattering around the light sources, which become a key feature of the scene.The bottom left image shows the gold standard for the road scene. Even though the image on the righttook an order of magnitude less to render than the gold standard, artifacts around light sources causedby poor sampling are clearly visible. This is because of the maps wrongly indicating the renderingalgorithm to undersample these areas.
To overcome this problem we propose a novel solution by introducing a new map, which we term thelight map (L map). This map is obtained by first identifying the light sources in the scene and thenproducing a scan-line image in which light sources appear constant white, while the rest of the scenerenders black. This render is termed the 0-LightMap (L0) and an example for the road scene is shown inFigure 5a. We then want to define an area around those light sources where the scattering of light willbecome an important feature of the scene. This problem is similar to applying a point spread function tothe white pixels rendered in the 0-LightMap. Since, at this stage, we only want to identify future salientareas (not render the actual multiple scattering), we can assume that the shape of this point spreadfunction depends only on the optical thickness of the media. More accurate shapes could be consideredby following the work of Narasimhan and Nayar [2003], for example. Although, our interest is to keepthe method as computationally simple as possible, while still producing good results.ACM Transactions on Applied Perception, Vol. 4, No. 3, Article 15, Publication date: November 2007.
Perceptual Rendering of Participating Media • Article 15 / 9
Fig. 4. The top road scene: (left) the X map, (middle) the S map, and (right) the XS map. The bottom road scene: (left) the goldstandard and (right) the image rendered when applying the XS map. Notice how the scattering around light sources is poorlysampled, resulting in visible artifacts.
(a) (b)
(c) (d)
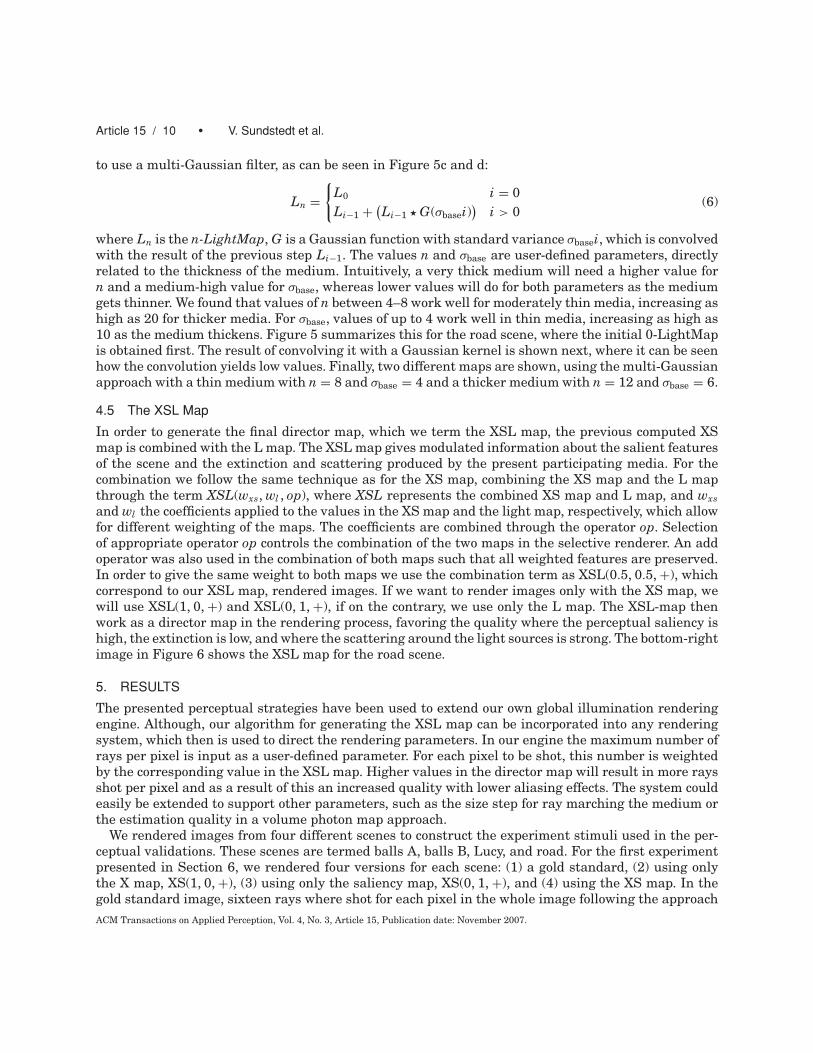
Fig. 5. Light maps for the road scene: (a) the 0-LightMap (L0), (b) a filtered L0 using a Gaussian filter with σ = 24,(c) an example of our proposed multi-Gaussian filter with n = 8 and σbase = 4, and (d) an example of our proposedmulti-Gaussian filter with n = 12 and σbase = 6.
As an initial candidate, we could chose a Gaussian function, with a wider kernel as the mediumthicken. However, this would result in low values around the light sources, as can be seen in Figure 5b.The 0-LightMap can be computed in a high dynamic-range (HDR) format to ensure that its convolutionwith a Gaussian filter yields high enough values. In order to make our method more general, we chose
ACM Transactions on Applied Perception, Vol. 4, No. 3, Article 15, Publication date: November 2007.
Article 15 / 10 • V. Sundstedt et al.
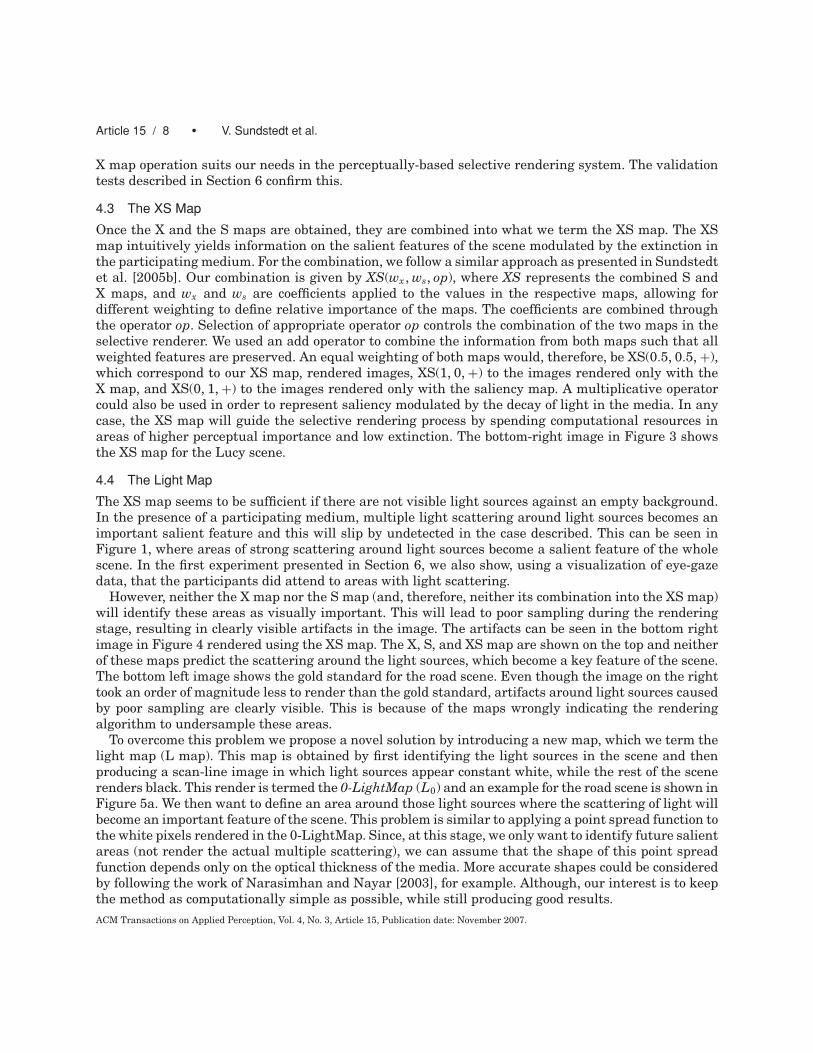
to use a multi-Gaussian filter, as can be seen in Figure 5c and d:
Ln ={
L0 i = 0Li−1 + (
Li−1 � G(σbasei))
i > 0(6)
where Ln is the n-LightMap, G is a Gaussian function with standard variance σbasei, which is convolvedwith the result of the previous step Li−1. The values n and σbase are user-defined parameters, directlyrelated to the thickness of the medium. Intuitively, a very thick medium will need a higher value forn and a medium-high value for σbase, whereas lower values will do for both parameters as the mediumgets thinner. We found that values of n between 4–8 work well for moderately thin media, increasing ashigh as 20 for thicker media. For σbase, values of up to 4 work well in thin media, increasing as high as10 as the medium thickens. Figure 5 summarizes this for the road scene, where the initial 0-LightMapis obtained first. The result of convolving it with a Gaussian kernel is shown next, where it can be seenhow the convolution yields low values. Finally, two different maps are shown, using the multi-Gaussianapproach with a thin medium with n = 8 and σbase = 4 and a thicker medium with n = 12 and σbase = 6.
4.5 The XSL Map
In order to generate the final director map, which we term the XSL map, the previous computed XSmap is combined with the L map. The XSL map gives modulated information about the salient featuresof the scene and the extinction and scattering produced by the present participating media. For thecombination we follow the same technique as for the XS map, combining the XS map and the L mapthrough the term XSL(wxs, wl , op), where XSL represents the combined XS map and L map, and wxs
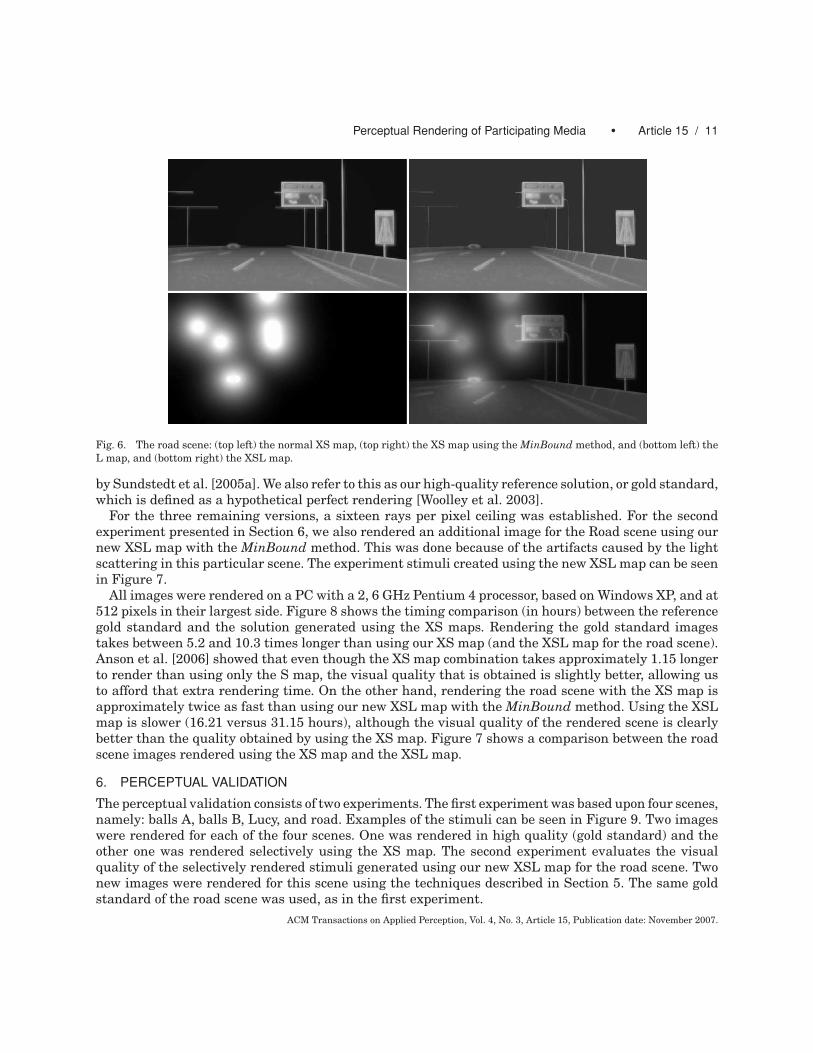
and wl the coefficients applied to the values in the XS map and the light map, respectively, which allowfor different weighting of the maps. The coefficients are combined through the operator op. Selectionof appropriate operator op controls the combination of the two maps in the selective renderer. An addoperator was also used in the combination of both maps such that all weighted features are preserved.In order to give the same weight to both maps we use the combination term as XSL(0.5, 0.5, +), whichcorrespond to our XSL map, rendered images. If we want to render images only with the XS map, wewill use XSL(1, 0, +) and XSL(0, 1, +), if on the contrary, we use only the L map. The XSL-map thenwork as a director map in the rendering process, favoring the quality where the perceptual saliency ishigh, the extinction is low, and where the scattering around the light sources is strong. The bottom-rightimage in Figure 6 shows the XSL map for the road scene.
5. RESULTS
The presented perceptual strategies have been used to extend our own global illumination renderingengine. Although, our algorithm for generating the XSL map can be incorporated into any renderingsystem, which then is used to direct the rendering parameters. In our engine the maximum number ofrays per pixel is input as a user-defined parameter. For each pixel to be shot, this number is weightedby the corresponding value in the XSL map. Higher values in the director map will result in more raysshot per pixel and as a result of this an increased quality with lower aliasing effects. The system couldeasily be extended to support other parameters, such as the size step for ray marching the medium orthe estimation quality in a volume photon map approach.
We rendered images from four different scenes to construct the experiment stimuli used in the per-ceptual validations. These scenes are termed balls A, balls B, Lucy, and road. For the first experimentpresented in Section 6, we rendered four versions for each scene: (1) a gold standard, (2) using onlythe X map, XS(1, 0, +), (3) using only the saliency map, XS(0, 1, +), and (4) using the XS map. In thegold standard image, sixteen rays where shot for each pixel in the whole image following the approachACM Transactions on Applied Perception, Vol. 4, No. 3, Article 15, Publication date: November 2007.
Perceptual Rendering of Participating Media • Article 15 / 11
Fig. 6. The road scene: (top left) the normal XS map, (top right) the XS map using the MinBound method, and (bottom left) theL map, and (bottom right) the XSL map.
by Sundstedt et al. [2005a]. We also refer to this as our high-quality reference solution, or gold standard,which is defined as a hypothetical perfect rendering [Woolley et al. 2003].
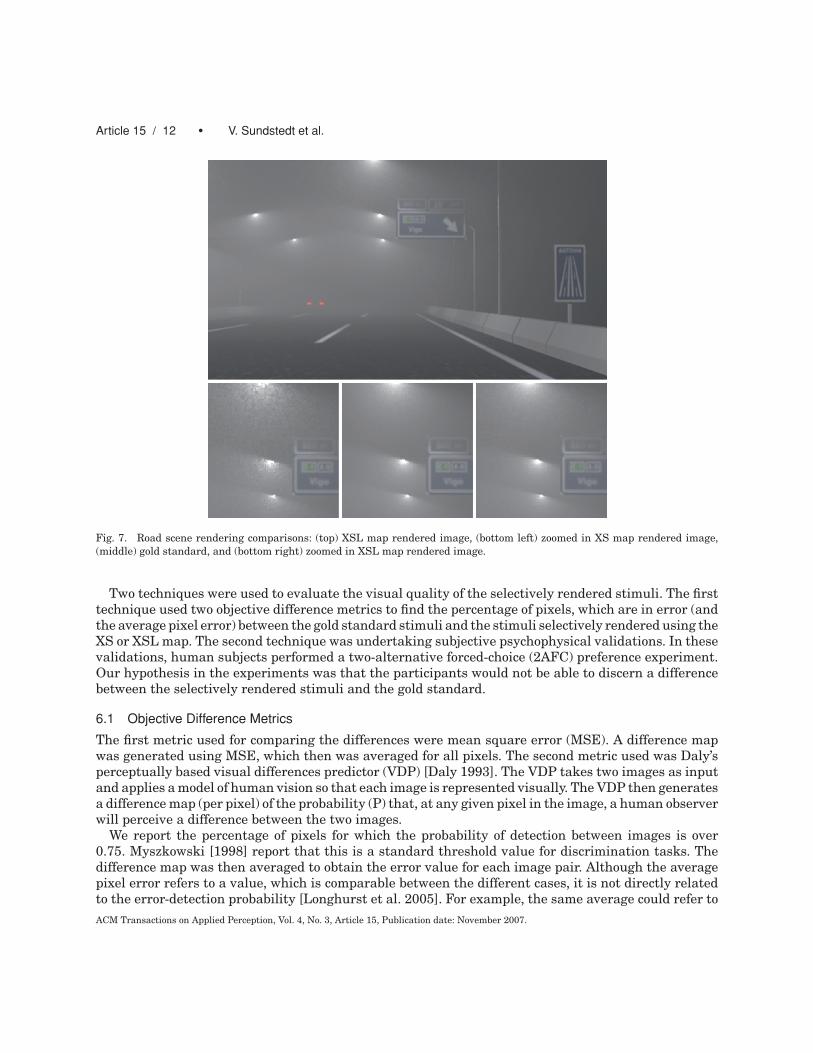
For the three remaining versions, a sixteen rays per pixel ceiling was established. For the secondexperiment presented in Section 6, we also rendered an additional image for the Road scene using ournew XSL map with the MinBound method. This was done because of the artifacts caused by the lightscattering in this particular scene. The experiment stimuli created using the new XSL map can be seenin Figure 7.
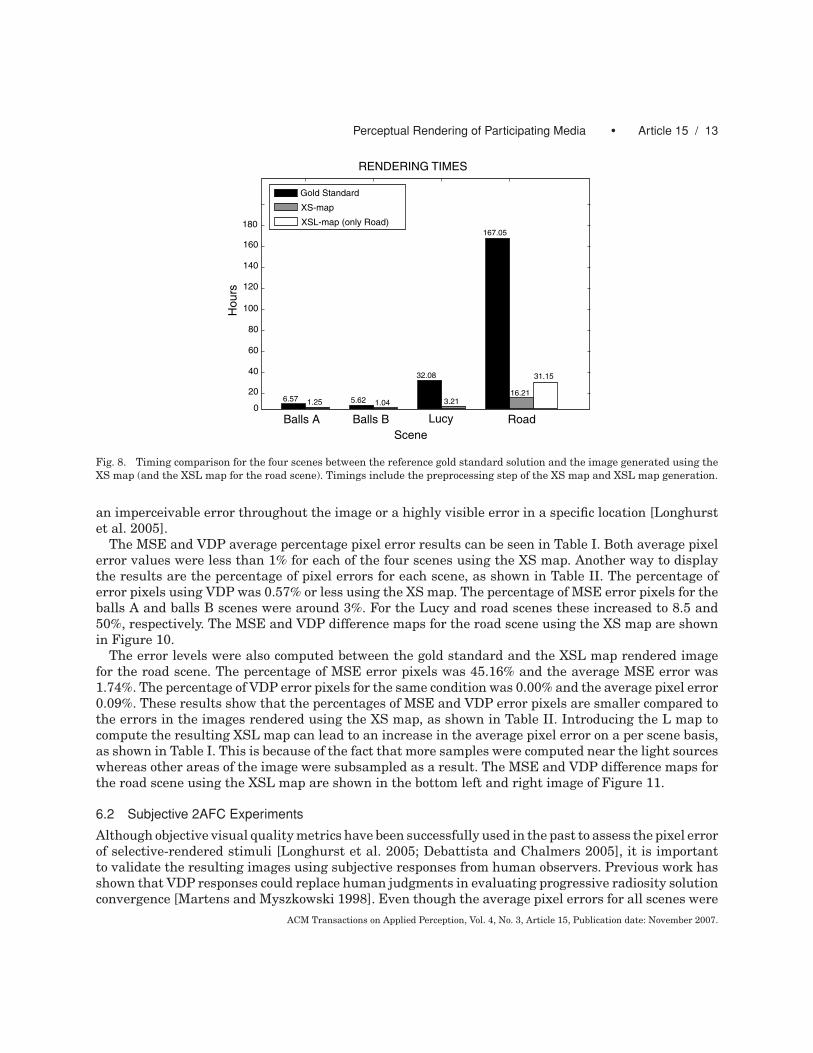
All images were rendered on a PC with a 2, 6 GHz Pentium 4 processor, based on Windows XP, and at512 pixels in their largest side. Figure 8 shows the timing comparison (in hours) between the referencegold standard and the solution generated using the XS maps. Rendering the gold standard imagestakes between 5.2 and 10.3 times longer than using our XS map (and the XSL map for the road scene).Anson et al. [2006] showed that even though the XS map combination takes approximately 1.15 longerto render than using only the S map, the visual quality that is obtained is slightly better, allowing usto afford that extra rendering time. On the other hand, rendering the road scene with the XS map isapproximately twice as fast than using our new XSL map with the MinBound method. Using the XSLmap is slower (16.21 versus 31.15 hours), although the visual quality of the rendered scene is clearlybetter than the quality obtained by using the XS map. Figure 7 shows a comparison between the roadscene images rendered using the XS map and the XSL map.
6. PERCEPTUAL VALIDATION
The perceptual validation consists of two experiments. The first experiment was based upon four scenes,namely: balls A, balls B, Lucy, and road. Examples of the stimuli can be seen in Figure 9. Two imageswere rendered for each of the four scenes. One was rendered in high quality (gold standard) and theother one was rendered selectively using the XS map. The second experiment evaluates the visualquality of the selectively rendered stimuli generated using our new XSL map for the road scene. Twonew images were rendered for this scene using the techniques described in Section 5. The same goldstandard of the road scene was used, as in the first experiment.
ACM Transactions on Applied Perception, Vol. 4, No. 3, Article 15, Publication date: November 2007.
Article 15 / 12 • V. Sundstedt et al.
Fig. 7. Road scene rendering comparisons: (top) XSL map rendered image, (bottom left) zoomed in XS map rendered image,(middle) gold standard, and (bottom right) zoomed in XSL map rendered image.
Two techniques were used to evaluate the visual quality of the selectively rendered stimuli. The firsttechnique used two objective difference metrics to find the percentage of pixels, which are in error (andthe average pixel error) between the gold standard stimuli and the stimuli selectively rendered using theXS or XSL map. The second technique was undertaking subjective psychophysical validations. In thesevalidations, human subjects performed a two-alternative forced-choice (2AFC) preference experiment.Our hypothesis in the experiments was that the participants would not be able to discern a differencebetween the selectively rendered stimuli and the gold standard.
6.1 Objective Difference Metrics
The first metric used for comparing the differences were mean square error (MSE). A difference mapwas generated using MSE, which then was averaged for all pixels. The second metric used was Daly’sperceptually based visual differences predictor (VDP) [Daly 1993]. The VDP takes two images as inputand applies a model of human vision so that each image is represented visually. The VDP then generatesa difference map (per pixel) of the probability (P) that, at any given pixel in the image, a human observerwill perceive a difference between the two images.
We report the percentage of pixels for which the probability of detection between images is over0.75. Myszkowski [1998] report that this is a standard threshold value for discrimination tasks. Thedifference map was then averaged to obtain the error value for each image pair. Although the averagepixel error refers to a value, which is comparable between the different cases, it is not directly relatedto the error-detection probability [Longhurst et al. 2005]. For example, the same average could refer toACM Transactions on Applied Perception, Vol. 4, No. 3, Article 15, Publication date: November 2007.
Perceptual Rendering of Participating Media • Article 15 / 13
Balls A Balls B Lucy Road
Scene
0
20
40
60
80
100
120
140
160
180H
ours
RENDERING TIMES
Gold Standard
XS-map
6.57 1.25 5.62 1.04
32.08
3.21
167.05
16.21
XSL-map (only Road)
31.15
Fig. 8. Timing comparison for the four scenes between the reference gold standard solution and the image generated using theXS map (and the XSL map for the road scene). Timings include the preprocessing step of the XS map and XSL map generation.
an imperceivable error throughout the image or a highly visible error in a specific location [Longhurstet al. 2005].
The MSE and VDP average percentage pixel error results can be seen in Table I. Both average pixelerror values were less than 1% for each of the four scenes using the XS map. Another way to displaythe results are the percentage of pixel errors for each scene, as shown in Table II. The percentage oferror pixels using VDP was 0.57% or less using the XS map. The percentage of MSE error pixels for theballs A and balls B scenes were around 3%. For the Lucy and road scenes these increased to 8.5 and50%, respectively. The MSE and VDP difference maps for the road scene using the XS map are shownin Figure 10.
The error levels were also computed between the gold standard and the XSL map rendered imagefor the road scene. The percentage of MSE error pixels was 45.16% and the average MSE error was1.74%. The percentage of VDP error pixels for the same condition was 0.00% and the average pixel error0.09%. These results show that the percentages of MSE and VDP error pixels are smaller compared tothe errors in the images rendered using the XS map, as shown in Table II. Introducing the L map tocompute the resulting XSL map can lead to an increase in the average pixel error on a per scene basis,as shown in Table I. This is because of the fact that more samples were computed near the light sourceswhereas other areas of the image were subsampled as a result. The MSE and VDP difference maps forthe road scene using the XSL map are shown in the bottom left and right image of Figure 11.
6.2 Subjective 2AFC Experiments
Although objective visual quality metrics have been successfully used in the past to assess the pixel errorof selective-rendered stimuli [Longhurst et al. 2005; Debattista and Chalmers 2005], it is importantto validate the resulting images using subjective responses from human observers. Previous work hasshown that VDP responses could replace human judgments in evaluating progressive radiosity solutionconvergence [Martens and Myszkowski 1998]. Even though the average pixel errors for all scenes were
ACM Transactions on Applied Perception, Vol. 4, No. 3, Article 15, Publication date: November 2007.
Article 15 / 14 • V. Sundstedt et al.
BALLS A BALLS B
LUCY ROAD
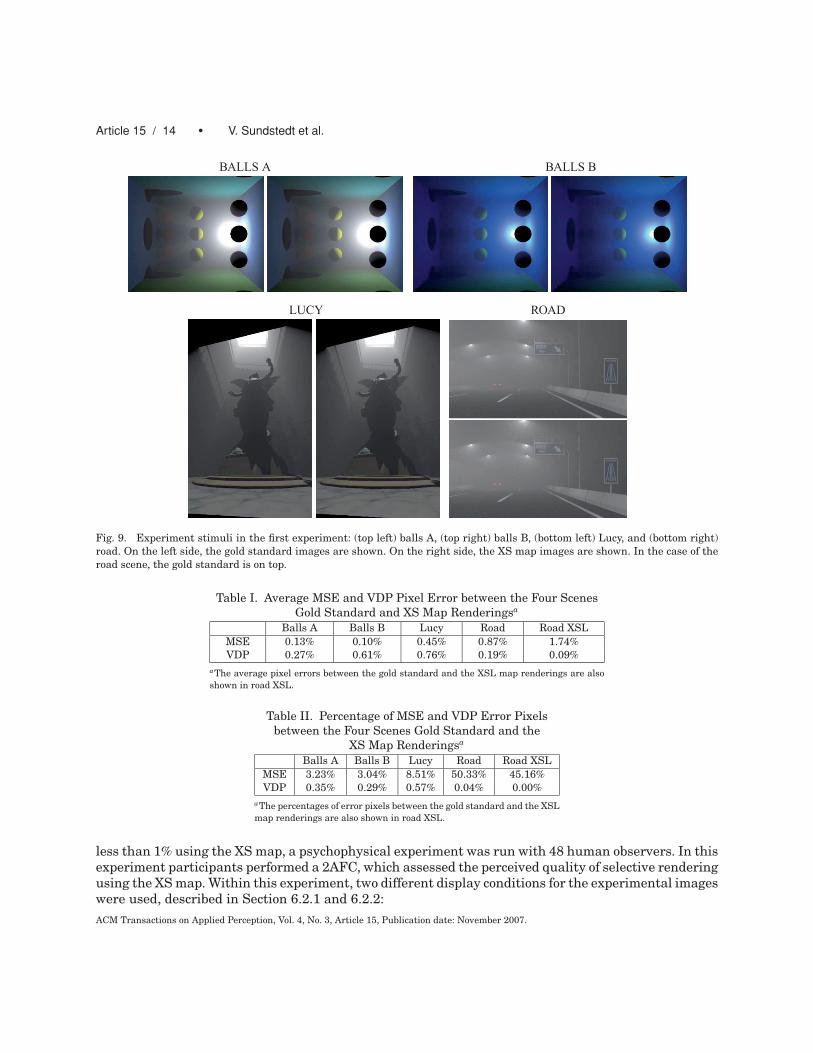
Fig. 9. Experiment stimuli in the first experiment: (top left) balls A, (top right) balls B, (bottom left) Lucy, and (bottom right)road. On the left side, the gold standard images are shown. On the right side, the XS map images are shown. In the case of theroad scene, the gold standard is on top.
Table I. Average MSE and VDP Pixel Error between the Four ScenesGold Standard and XS Map Renderingsa
Balls A Balls B Lucy Road Road XSLMSE 0.13% 0.10% 0.45% 0.87% 1.74%VDP 0.27% 0.61% 0.76% 0.19% 0.09%
aThe average pixel errors between the gold standard and the XSL map renderings are alsoshown in road XSL.
Table II. Percentage of MSE and VDP Error Pixelsbetween the Four Scenes Gold Standard and the
XS Map Renderingsa
Balls A Balls B Lucy Road Road XSLMSE 3.23% 3.04% 8.51% 50.33% 45.16%VDP 0.35% 0.29% 0.57% 0.04% 0.00%
aThe percentages of error pixels between the gold standard and the XSLmap renderings are also shown in road XSL.
less than 1% using the XS map, a psychophysical experiment was run with 48 human observers. In thisexperiment participants performed a 2AFC, which assessed the perceived quality of selective renderingusing the XS map. Within this experiment, two different display conditions for the experimental imageswere used, described in Section 6.2.1 and 6.2.2:ACM Transactions on Applied Perception, Vol. 4, No. 3, Article 15, Publication date: November 2007.
Perceptual Rendering of Participating Media • Article 15 / 15
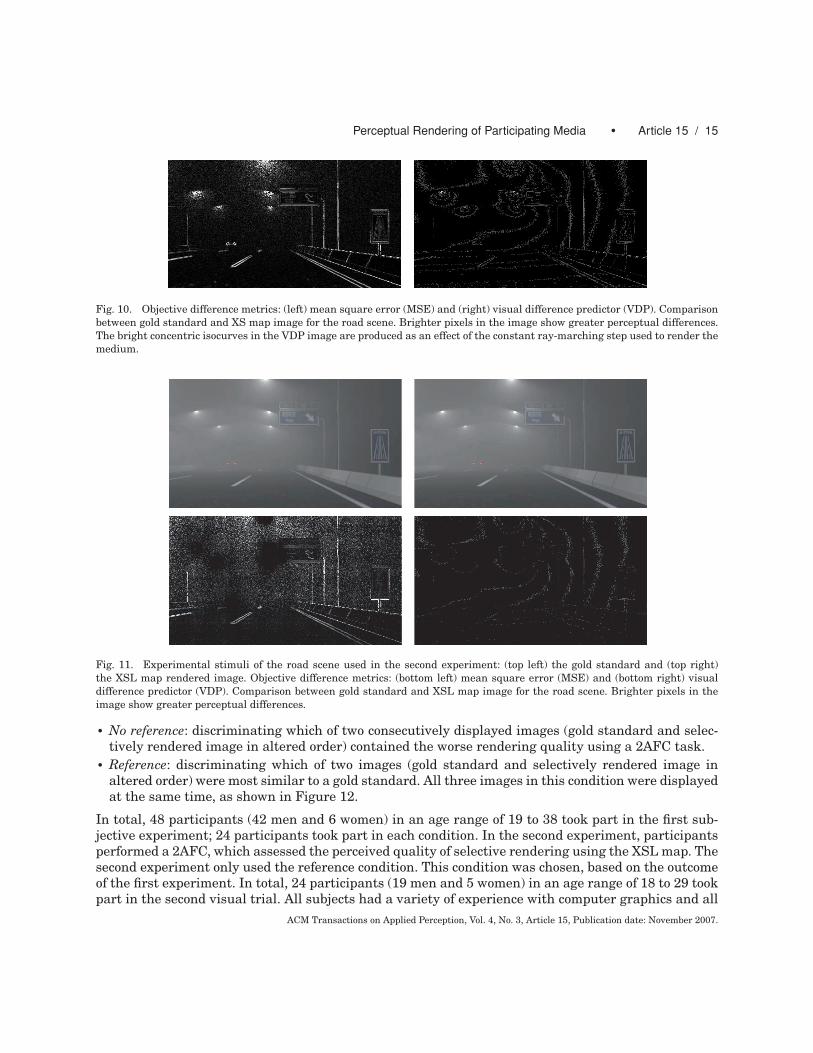
Fig. 10. Objective difference metrics: (left) mean square error (MSE) and (right) visual difference predictor (VDP). Comparisonbetween gold standard and XS map image for the road scene. Brighter pixels in the image show greater perceptual differences.The bright concentric isocurves in the VDP image are produced as an effect of the constant ray-marching step used to render themedium.
Fig. 11. Experimental stimuli of the road scene used in the second experiment: (top left) the gold standard and (top right)the XSL map rendered image. Objective difference metrics: (bottom left) mean square error (MSE) and (bottom right) visualdifference predictor (VDP). Comparison between gold standard and XSL map image for the road scene. Brighter pixels in theimage show greater perceptual differences.
• No reference: discriminating which of two consecutively displayed images (gold standard and selec-tively rendered image in altered order) contained the worse rendering quality using a 2AFC task.
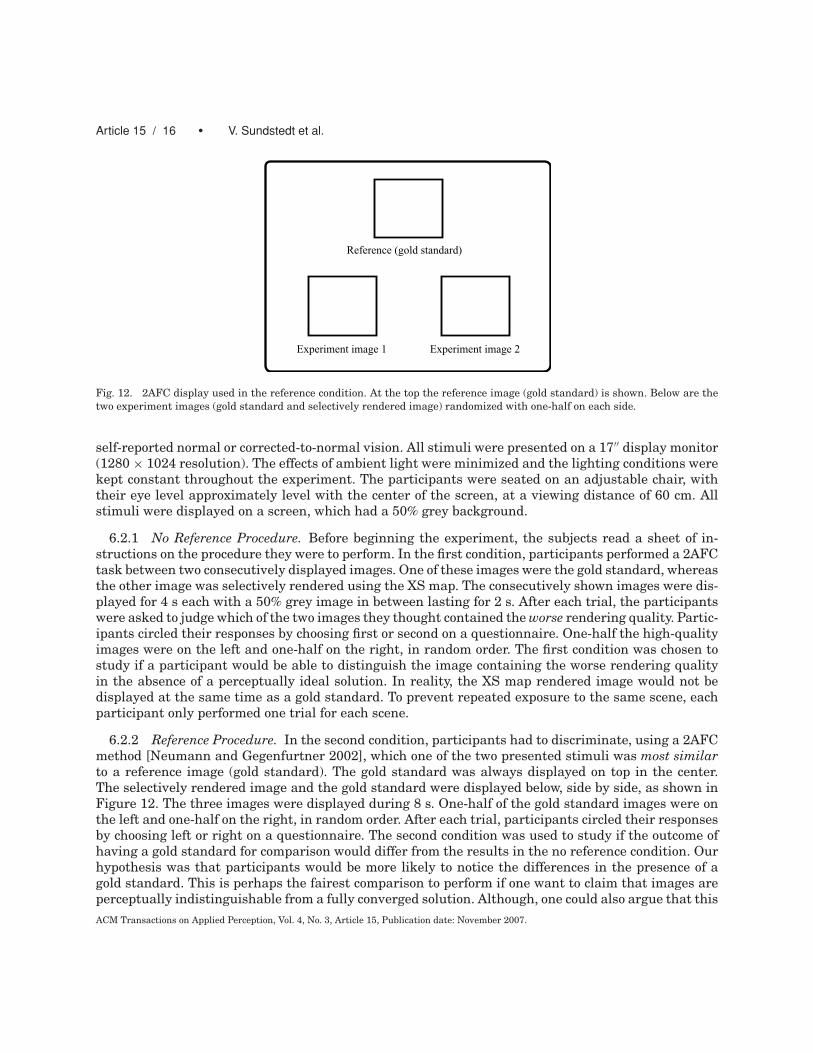
• Reference: discriminating which of two images (gold standard and selectively rendered image inaltered order) were most similar to a gold standard. All three images in this condition were displayedat the same time, as shown in Figure 12.
In total, 48 participants (42 men and 6 women) in an age range of 19 to 38 took part in the first sub-jective experiment; 24 participants took part in each condition. In the second experiment, participantsperformed a 2AFC, which assessed the perceived quality of selective rendering using the XSL map. Thesecond experiment only used the reference condition. This condition was chosen, based on the outcomeof the first experiment. In total, 24 participants (19 men and 5 women) in an age range of 18 to 29 tookpart in the second visual trial. All subjects had a variety of experience with computer graphics and all
ACM Transactions on Applied Perception, Vol. 4, No. 3, Article 15, Publication date: November 2007.
Article 15 / 16 • V. Sundstedt et al.
Reference (gold standard)
Experiment image 1 Experiment image 2
Fig. 12. 2AFC display used in the reference condition. At the top the reference image (gold standard) is shown. Below are thetwo experiment images (gold standard and selectively rendered image) randomized with one-half on each side.
self-reported normal or corrected-to-normal vision. All stimuli were presented on a 17′′ display monitor(1280 × 1024 resolution). The effects of ambient light were minimized and the lighting conditions werekept constant throughout the experiment. The participants were seated on an adjustable chair, withtheir eye level approximately level with the center of the screen, at a viewing distance of 60 cm. Allstimuli were displayed on a screen, which had a 50% grey background.
6.2.1 No Reference Procedure. Before beginning the experiment, the subjects read a sheet of in-structions on the procedure they were to perform. In the first condition, participants performed a 2AFCtask between two consecutively displayed images. One of these images were the gold standard, whereasthe other image was selectively rendered using the XS map. The consecutively shown images were dis-played for 4 s each with a 50% grey image in between lasting for 2 s. After each trial, the participantswere asked to judge which of the two images they thought contained the worse rendering quality. Partic-ipants circled their responses by choosing first or second on a questionnaire. One-half the high-qualityimages were on the left and one-half on the right, in random order. The first condition was chosen tostudy if a participant would be able to distinguish the image containing the worse rendering qualityin the absence of a perceptually ideal solution. In reality, the XS map rendered image would not bedisplayed at the same time as a gold standard. To prevent repeated exposure to the same scene, eachparticipant only performed one trial for each scene.
6.2.2 Reference Procedure. In the second condition, participants had to discriminate, using a 2AFCmethod [Neumann and Gegenfurtner 2002], which one of the two presented stimuli was most similarto a reference image (gold standard). The gold standard was always displayed on top in the center.The selectively rendered image and the gold standard were displayed below, side by side, as shown inFigure 12. The three images were displayed during 8 s. One-half of the gold standard images were onthe left and one-half on the right, in random order. After each trial, participants circled their responsesby choosing left or right on a questionnaire. The second condition was used to study if the outcome ofhaving a gold standard for comparison would differ from the results in the no reference condition. Ourhypothesis was that participants would be more likely to notice the differences in the presence of agold standard. This is perhaps the fairest comparison to perform if one want to claim that images areperceptually indistinguishable from a fully converged solution. Although, one could also argue that thisACM Transactions on Applied Perception, Vol. 4, No. 3, Article 15, Publication date: November 2007.
Perceptual Rendering of Participating Media • Article 15 / 17
Balls A Balls B Lucy Road
Scene
0
10
20
30
40
50
60
70
80
90
100
Perc
enta
ge
NO REFERENCE
CorrectIncorrect
Balls A Balls B Lucy RoadScene
0
10
20
30
40
50
60
70
80
90
100
Perc
enta
ge
REFERENCE
CorrectIncorrect
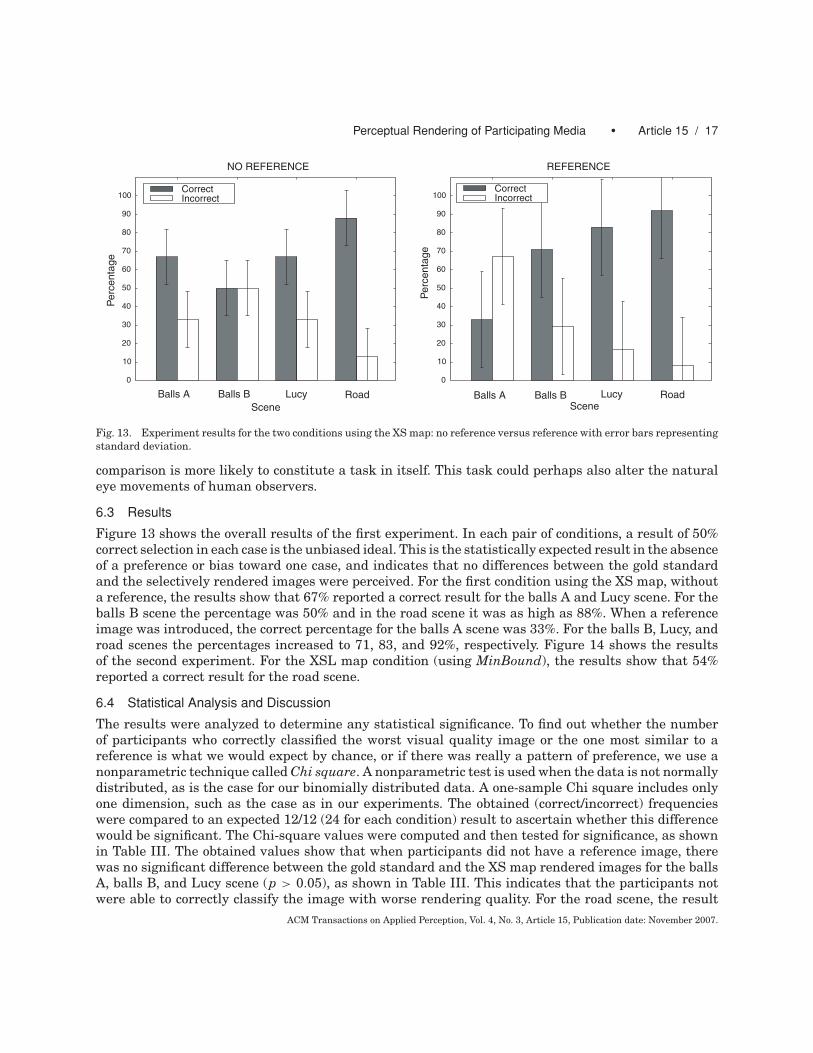
Fig. 13. Experiment results for the two conditions using the XS map: no reference versus reference with error bars representingstandard deviation.
comparison is more likely to constitute a task in itself. This task could perhaps also alter the naturaleye movements of human observers.
6.3 Results
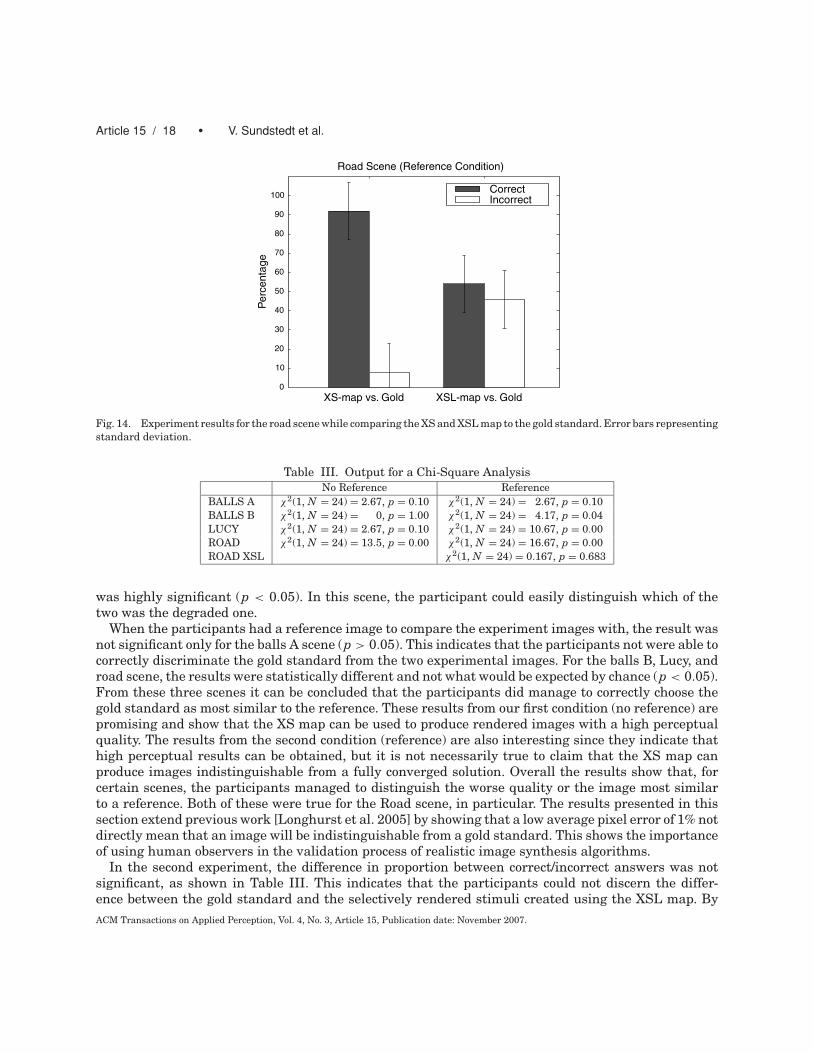
Figure 13 shows the overall results of the first experiment. In each pair of conditions, a result of 50%correct selection in each case is the unbiased ideal. This is the statistically expected result in the absenceof a preference or bias toward one case, and indicates that no differences between the gold standardand the selectively rendered images were perceived. For the first condition using the XS map, withouta reference, the results show that 67% reported a correct result for the balls A and Lucy scene. For theballs B scene the percentage was 50% and in the road scene it was as high as 88%. When a referenceimage was introduced, the correct percentage for the balls A scene was 33%. For the balls B, Lucy, androad scenes the percentages increased to 71, 83, and 92%, respectively. Figure 14 shows the resultsof the second experiment. For the XSL map condition (using MinBound), the results show that 54%reported a correct result for the road scene.
6.4 Statistical Analysis and Discussion
The results were analyzed to determine any statistical significance. To find out whether the numberof participants who correctly classified the worst visual quality image or the one most similar to areference is what we would expect by chance, or if there was really a pattern of preference, we use anonparametric technique called Chi square. A nonparametric test is used when the data is not normallydistributed, as is the case for our binomially distributed data. A one-sample Chi square includes onlyone dimension, such as the case as in our experiments. The obtained (correct/incorrect) frequencieswere compared to an expected 12/12 (24 for each condition) result to ascertain whether this differencewould be significant. The Chi-square values were computed and then tested for significance, as shownin Table III. The obtained values show that when participants did not have a reference image, therewas no significant difference between the gold standard and the XS map rendered images for the ballsA, balls B, and Lucy scene (p > 0.05), as shown in Table III. This indicates that the participants notwere able to correctly classify the image with worse rendering quality. For the road scene, the result
ACM Transactions on Applied Perception, Vol. 4, No. 3, Article 15, Publication date: November 2007.
Article 15 / 18 • V. Sundstedt et al.
XS-map vs. Gold XSL-map vs. Gold0
10
20
30
40
50
60
70
80
90
100
Pe
rce
nta
ge
Road Scene (Reference Condition)
CorrectIncorrect
Fig. 14. Experiment results for the road scene while comparing the XS and XSL map to the gold standard. Error bars representingstandard deviation.
Table III. Output for a Chi-Square AnalysisNo Reference Reference
BALLS A χ2(1, N = 24) = 2.67, p = 0.10 χ2(1, N = 24) = 2.67, p = 0.10BALLS B χ2(1, N = 24) = 0, p = 1.00 χ2(1, N = 24) = 4.17, p = 0.04LUCY χ2(1, N = 24) = 2.67, p = 0.10 χ2(1, N = 24) = 10.67, p = 0.00ROAD χ2(1, N = 24) = 13.5, p = 0.00 χ2(1, N = 24) = 16.67, p = 0.00ROAD XSL χ2(1, N = 24) = 0.167, p = 0.683
was highly significant (p < 0.05). In this scene, the participant could easily distinguish which of thetwo was the degraded one.
When the participants had a reference image to compare the experiment images with, the result wasnot significant only for the balls A scene (p > 0.05). This indicates that the participants not were able tocorrectly discriminate the gold standard from the two experimental images. For the balls B, Lucy, androad scene, the results were statistically different and not what would be expected by chance (p < 0.05).From these three scenes it can be concluded that the participants did manage to correctly choose thegold standard as most similar to the reference. These results from our first condition (no reference) arepromising and show that the XS map can be used to produce rendered images with a high perceptualquality. The results from the second condition (reference) are also interesting since they indicate thathigh perceptual results can be obtained, but it is not necessarily true to claim that the XS map canproduce images indistinguishable from a fully converged solution. Overall the results show that, forcertain scenes, the participants managed to distinguish the worse quality or the image most similarto a reference. Both of these were true for the Road scene, in particular. The results presented in thissection extend previous work [Longhurst et al. 2005] by showing that a low average pixel error of 1% notdirectly mean that an image will be indistinguishable from a gold standard. This shows the importanceof using human observers in the validation process of realistic image synthesis algorithms.
In the second experiment, the difference in proportion between correct/incorrect answers was notsignificant, as shown in Table III. This indicates that the participants could not discern the differ-ence between the gold standard and the selectively rendered stimuli created using the XSL map. ByACM Transactions on Applied Perception, Vol. 4, No. 3, Article 15, Publication date: November 2007.
Perceptual Rendering of Participating Media • Article 15 / 19
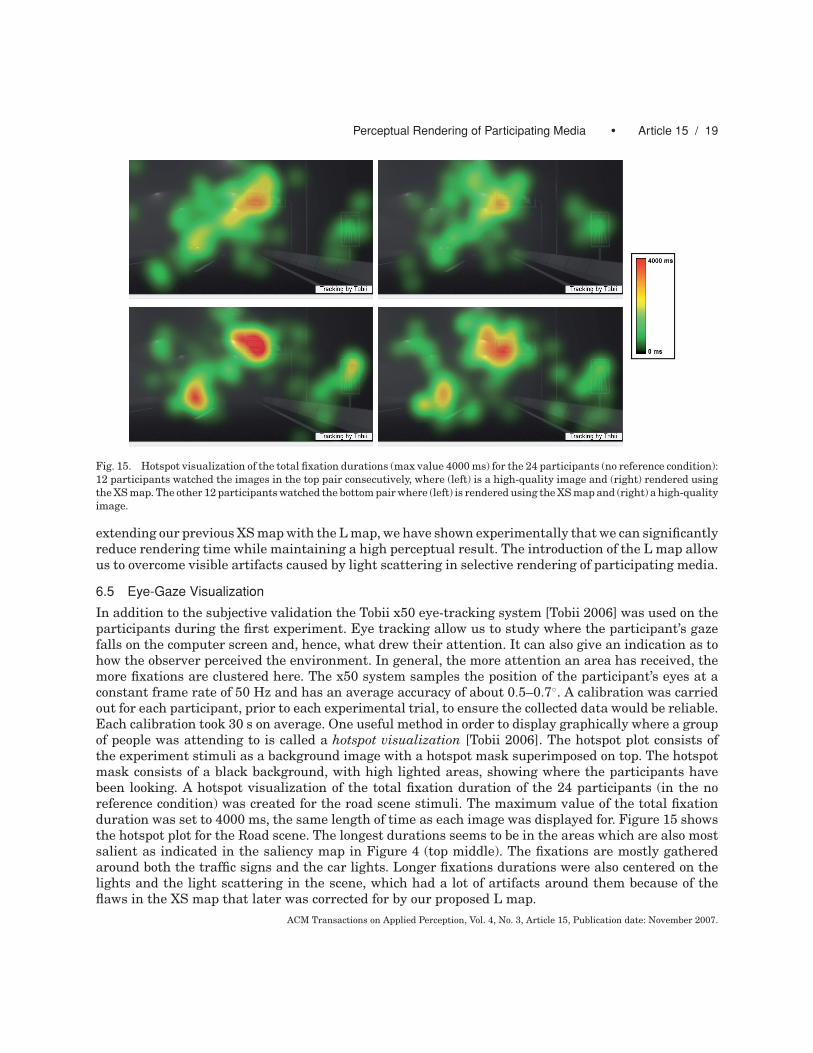
Fig. 15. Hotspot visualization of the total fixation durations (max value 4000 ms) for the 24 participants (no reference condition):12 participants watched the images in the top pair consecutively, where (left) is a high-quality image and (right) rendered usingthe XS map. The other 12 participants watched the bottom pair where (left) is rendered using the XS map and (right) a high-qualityimage.
extending our previous XS map with the L map, we have shown experimentally that we can significantlyreduce rendering time while maintaining a high perceptual result. The introduction of the L map allowus to overcome visible artifacts caused by light scattering in selective rendering of participating media.
6.5 Eye-Gaze Visualization
In addition to the subjective validation the Tobii x50 eye-tracking system [Tobii 2006] was used on theparticipants during the first experiment. Eye tracking allow us to study where the participant’s gazefalls on the computer screen and, hence, what drew their attention. It can also give an indication as tohow the observer perceived the environment. In general, the more attention an area has received, themore fixations are clustered here. The x50 system samples the position of the participant’s eyes at aconstant frame rate of 50 Hz and has an average accuracy of about 0.5–0.7◦. A calibration was carriedout for each participant, prior to each experimental trial, to ensure the collected data would be reliable.Each calibration took 30 s on average. One useful method in order to display graphically where a groupof people was attending to is called a hotspot visualization [Tobii 2006]. The hotspot plot consists ofthe experiment stimuli as a background image with a hotspot mask superimposed on top. The hotspotmask consists of a black background, with high lighted areas, showing where the participants havebeen looking. A hotspot visualization of the total fixation duration of the 24 participants (in the noreference condition) was created for the road scene stimuli. The maximum value of the total fixationduration was set to 4000 ms, the same length of time as each image was displayed for. Figure 15 showsthe hotspot plot for the Road scene. The longest durations seems to be in the areas which are also mostsalient as indicated in the saliency map in Figure 4 (top middle). The fixations are mostly gatheredaround both the traffic signs and the car lights. Longer fixations durations were also centered on thelights and the light scattering in the scene, which had a lot of artifacts around them because of theflaws in the XS map that later was corrected for by our proposed L map.
ACM Transactions on Applied Perception, Vol. 4, No. 3, Article 15, Publication date: November 2007.
Article 15 / 20 • V. Sundstedt et al.
7. CONCLUSIONS AND FUTURE WORK
We have presented an original perceptual selective method for efficient physically based renderingof participating media. Within this technique, we have introduced the X map, which precomputeslight attenuation in inhomogeneous participating media (with a straightforward simplification for thehomogeneous case). Combined with a modified saliency map into the XS map, this map can be usedto guide selective rendering of scenes including participating media, with high-quality antialiasingsettings for salient features foreseen to be less attenuated by the medium. Using the XS map, we havebeen able to achieve a substantial speedup of 5–10 times depending on scene. For animated sequencessuch computational savings can, therefore, be highly significant.
Furthermore, we performed a perceptual validation of the selectively rendered stimuli generated us-ing the XS map to assess the visual quality of the resulting images. The perceptual validation consistedof two parts: using two objective difference metrics (MSE and VDP) and a subjective psychophysicalexperiment. The average pixel errors were less than 1% for all scenes between a gold standard andour selectively rendered images. Although the average pixel error was low, the subjective experimentsshowed that participants still could detect a reduction in visual quality of selectively rendered imagesfor certain scenes. Our experiment also extends previous work by showing that a low average pixelerror does not necessarily mean that we can obtain a result that is perceptually indistinguishable froma full solution. In the absence of an ideal solution, it is still possible, however, to achieve a substantialreduction in rendering time while maintaining a high-quality perceptual result.
One limitation of our the X map and XS map was that they could not foresee strong scattering aroundlight sources, which would become an important salient feature of the scene. The XS map was, therefore,extended with a novel light map (L map) to overcome problem areas that were sampled poorly, resultingin visible artifacts. The combination of the XS map with our new L map was termed the XSL map, whichgives a modulated information about the salient features of the scene and the extinction and scatteringproduced by the present participating media. We also performed an additional perceptual validationusing the new XSL map to assess the visual quality of the resulting images. Although we did not reducethe computational cost as much as by using the XS map, the experimental results showed that theXSL map can be used to maintain a high-fidelity perceptual result for scenes with visible light sourcesagainst an empty background.
For future research it would also be interesting to study perceptually based rendering of dynamicenvironments, including a participating media. Our current approach does not take into account colorof participating media and thus potential salient areas could be missed. Other important issues thatshould be addressed are partially occluded light sources, currently overlooked by our Gaussian-basedtechnique, and highlights, which can attract an observer’s attention.
ACKNOWLEDGMENT
This research was sponsored by the Spanish Ministry of Education and Research through the projectTIN2004-07672-C03-03 and the European Union within the CROSSMOD project (EU IST-014891-2).We would also like to thank Adrian Gomez and Kurt Debattista for their collaboration in the researchand everyone that participated in the experiments. The model of Lucy was obtained from the StanfordUniversity Computer Graphics Laboratory.
REFERENCES
ANSON, O., SUNDSTEDT, V., GUTIERREZ, D., AND CHALMERS, A. 2006. Efficient selective rendering of participating media. In APGV06: Symposium on Applied Perception in Graphics and Visualization. ACM Press, New York. 135–142.
BOLIN, M. R. AND MEYER, G. W. 1995. A frequency based ray tracer. In SIGGRAPH. 409–418.
ACM Transactions on Applied Perception, Vol. 4, No. 3, Article 15, Publication date: November 2007.
Perceptual Rendering of Participating Media • Article 15 / 21
BOLIN, M. R. AND MEYER, G. W. 1998. A perceptually based adaptive sampling algorithm. Computer Graphics 32, AnnualConference Series, 299–309.
CATER, K., CHALMERS, A., AND WARD, G. 2003. Detail to attention: exploiting visual tasks for selective rendering. In EGRW’03: Proc. of the 14th Eurographics Workshop on Rendering. Eurographics Association, Aire-la-Ville, Switzerland, Switzerland.270–280.
CHALMERS, A., DEBATTISTA, K., AND SANTOS, L. P. 2006. Selective rendering: Computing only what you see. In Proceedings ofGRAPHITE 2006, ACM SIGGRAPH.
DALY, S. 1993. The visible differences predictor: An algorithm for the assessment of image fidelity. In Digital Images andHuman Vision. A.B. Watson, Ed. MIT Press, Cambridge, MA. 179–206.
DEBATTISTA, K. AND CHALMERS, A. 2005. Component-based adaptive sampling. In SIBGRAPI 2005. IEEE Computer SocietyPress, Los Alamitos, CA. 375–382.
DUMONT, R., PELLACINI, F., AND FERWERDA, J. A. 2003. Perceptually-driven decision theory for interactive realistic rendering.ACM Trans. Graph. 22, 2, 152–181.
FERWERDA, J. A., PATTANAIK, S. N., SHIRLEY, P., AND GREENBERG, D. P. 1997. A model of visual masking for computer graphics.Computer Graphics 31, Annual Conference Series, 143–152.
GLASSNER, A. S. 1994. Principles of Digital Image Synthesis. Morgan Kaufmann, San Francisco, CA.GUTIERREZ, D., MUNOZ, A., ANSON, O., AND SERON, F. J. 2005. Non-linear volume photon mapping. In Proc. of the Eurographics
Symposium on Rendering Techniques, Konstanz, Germany, June 29–July 1, 2005. 291–300.HABER, J., MYSZKOWSKI, K., YAMAUCHI, H., AND SEIDEL, H.-P. 2001. Perceptually guided corrective splatting. In Computer Graphics
Forum, Proc. of Eurographics 2001, A. Chalmers and T.-M. Rhyne, Eds. Computer Graphics Forum, vol. 20. Eurographics,Blackwell, Manchester, UK. C142–C152.
ITTI, L., KOCH, C., AND NIEBUR, E. 1998. A model of saliency-based visual attention for rapid scene analysis. IEEE Trans.Pattern Anal. Mach. Intell. 20, 11, 1254–1259.
JENSEN, H. W. AND CHRISTENSEN, P. H. 1998. Efficient simulation of light transport in scenes with participating media usingphoton maps. In SIGGRAPH 98 Conference Proceedings, M. Cohen, Ed. Annual Conference Series. ACM SIGGRAPH, AddisonWesley, Reading, MA. 311–320.
KAJIYA, J. T. 1986. The rendering equation. In SIGGRAPH ’86: Proc. of the 13th Annual Conference on Computer Graphicsand Interactive Techniques. ACM Press, New York. 143–150.
LONGHURST, P., DEBATTISTA, K., GILLIBRAND, R., AND CHALMERS, A. 2005. Analytic antialiasing for selective high fidelity rendering.In SIBGRAPI 2005. IEEE Computer Society Press, Los Alamitos. 359–366.
LONGHURST, P., DEBATTISTA, K., AND CHALMERS, A. 2006. A gpu based saliency map for high-fidelity selective rendering. In AFRI-GRAPH 2006 4th Int. Conf. on Computer Graphics, Virtual Reality, Visualisation and Interaction in Africa. ACM SIGGRAPH,21–29.
MARTENS, W. AND MYSZKOWSKI, K. 1998. Psychophysical validation of the visible differences predictor for global illuminationapplications. In Proceedings of IEEE Visualization ’98. 18–23.
MITCHELL, D. P. 1987. Generating antialiased images at low sampling densities. In SIGGRAPH ’87: Proc. of the 14th AnnualConference on Computer Graphics and Interactive Techniques. ACM Press, New York. 65–72.
MYSZKOWSKI, K. 1998s . The visible differences predictor: Applications to global illumination problems. In Proc. of the Euro-graphics Workshop. 223–236.
MYSZKOWSKI, K. 2002. Perception-based global illumination, rendering, and animation techniques. In SCCG ’02: Proc. of the18th Spring Conference on Computer Graphics. ACM Press, New York. 13–24.
NARASIMHAN, S. G. AND NAYAR, S. K. 2003. Shedding light on the weather. In IEEE Conference on Computer Vision and PatternRecognition (CVPR). Vol. I. 665–672.
NEUMANN, D. AND GEGENFURTNER, K. R. 2002. Perception based image retrieval.PRIKRYL, J. 2001. Radiosity methods driven by human perception. Ph.D. thesis, Institute of Computer Graphics and Algorithms,
Vienna University of Technology.RAMASUBRAMANIAN, M., PATTANAIK, S. N., AND GREENBERG, D. P. 1999. A perceptually based physical error metric for realistic
image synthesis. In SIGGRAPH ’99: Proc. of the 26th Annual Conference on Computer Graphics and Interactive Techniques.ACM Press/Addison-Wesley, New York. 73–82.
RUSHMEIER, H. 1994. Rendering participating media: Problems and solutions from application areas. In Proc. of the 5thEurographics Workshop on Rendering. 117–126.
SIEGEL, R. AND HOWELL, J. R. 1992. Thermal Radiation Heat Transfer. Hemisphere Publ., New York.STOKES, W. A., FERWERDA, J. A., WALTER, B., AND GREENBERG, D. P. 2004. Perceptual illumination components: A new approach
to efficient, high quality global illumination rendering. ACM Trans. Graph. 23, 3, 742–749.
ACM Transactions on Applied Perception, Vol. 4, No. 3, Article 15, Publication date: November 2007.

Article 15 / 22 • V. Sundstedt et al.
SUN, B., RAMAMOORTHI, R., NARASIMHAN, S. G., AND NAYAR, S. K. 2005. A practical analytic single scattering model for real timerendering. ACM Trans. Graph. 24, 3, 1040–1049.
SUNDSTEDT, V., DEBATTISTA, K., AND CHALMERS, A. 2005a. Perceived aliasing thresholds in high-fidelity rendering. In APGV ’05:Proceedings of the 2nd Symposium on Applied Perception in Graphics and Visualization. ACM Press, New York. 166–166.
SUNDSTEDT, V., DEBATTISTA, K., LONGHURST, P., CHALMERS, A., AND TROSCIANKO, T. 2005b. Visual attention for efficient high-fidelitygraphics. In Spring Conference on Computer Graphics (SCCG 2005). 162–168.
Tobii 2006. User Manual: Tobii Eye Tracker, ClearView Analysis Software. Tobii.WOOLLEY, C., LUEBKE, D., WATSON, B., AND DAYAL, A. 2003. Interruptible rendering. In SI3D ’03: Proceedings of the 2003
Symposium on Interactive 3D Graphics. ACM Press, New York. 143–151.YEE, H., PATTANAIK, S., AND GREENBERG, D. P. 2001. Spatiotemporal sensitivity and visual attention for efficient rendering of
dynamic environments. ACM Trans. Graph. 20, 1, 39–65.
Received December 2006; revised April 2007; accepted May 2007
ACM Transactions on Applied Perception, Vol. 4, No. 3, Article 15, Publication date: November 2007.