BOPSS 2019, Nottingham Wednesday 19th - Friday 21st June ...
Upload
independentCategory
view
6download
0
Sot. Sci. Med. Vol. 38, No. 1, pp. 153-158, 1994 0277-9536194 $6.00 + 0.00 Printed in Great Britain. All rights reserved Copyright 0 1993 Pergamon Press Ltd
RELIABILITY OF THE SPANISH VERSION OF THE NOTTINGHAM HEALTH PROFILE IN PATIENTS WITH
STABLE END-STAGE RENAL DISEASE
XAVIER BADIA,’ JORDI ALONSO,’ MAX BROSA* and PENNY LOCKE
‘Department d’Epidemiologia i Salut Wblica, Institut Municipal d’btvestigacio Mtdica (IMIM) and Department de San&at, Generalitat de Catalunya (DGOPS), Barcelona, Spain
Abstract--Objecrive: Since reproductibility of results is a basic prerequisite of health status measures for its use in prospective and evaluative studies, the reliability of the Spanish version of the Nottingham Health Profile (NHP), a multidimensional perceived health status measure, was assessed in a sample of stable end-stage renal disease (ESRD) patients.
Merhodr: The NHP was administered on two occasions four weeks apart to a group of hospital hemodialysis program patients who were clinically stable according to their physicians. Correlations of scores and agreement of first and second administrations were assessed together with internal consistency. Afterwards, analyses were repeated taking into account the time (before, during or after the dialysis) and the method of administration (self vs interviewer), and the interviewer.
Results: Spearman correlation coefficients (r3 between responses to the first and to the second administration were r0.6 for all of the six dimensions of the NHP (range = 0.69-0.85) and in every sub-group analyzed (P < 0.01). Agreement percent (AP) between items was >0.4 (0.48-0.65). Internal consistency was 0.91 for the whole profile and > 0.5 (0.58-0.86) when analyzed by individual dimensions. Reliability did not vary significantly with the time nor the method of administration (self or interviewer).
Conclusions: Overall, results suggest that the Spanish version of NHP is sufficiently reliable to be used in ESRD patients. While a higher reliability would have been achieved by a shorter retest period, the study provides a realistic approximation to the reliability of the questionnaire in actual research and clinical applications.
Key words-reliability, health status, quality of life, evaluation, questionnaires, Nottingham Health Profile, cross-cultural research, follow-up studies
INTRODUCTION
Health status is an essential indicator for a correct evaluation of the outcome of health services. Several studies have indicated a close relationship between perceived health status and the health outcome [ 1,2]. The development of generic instruments such as the Nottingham Health Profile (NHP) [3] or the Sickness Impact Profile (SIP) [4], based on the individual’s subjective perceptions, has made it possible to measure in a standardized way distress and disfunc- tion as an approximation to ill health. This may now be done both in different communities and cultural sub-groups [S] and when dealing with different ill- nesses and levels of imfirmity [6].
Whether planned to be used in clinical or commu- nity settings, reliability is a vital characteristic of a health status instrument. Reliability, that is, the degree to which results obtained by a measurement instrument can be reproduced, [7] constitutes, to- gether with validity and sensitivity to changes, the necessary conditions that a health status measure must fulfil [8].
The NHP was developed in England [9] as an instrument to measure patients’ feelings as they go through different stages of health and illness. The NHP is short and simple and it has been proposed to
be used in community surveys and studies with specific groups of patients. Recently, the NHP has been adapted into Spanish [lo] and its preliminary validity and reliability were established in a random sample from the general population of Barcelona
VII. Although the reliability of the NHP has been tested
both in its original English version and in its Spanish form, it is still advisable to evaluate it under differing conditions and in clinical situations. As an example, the correlation coefficients obtained with the overall scoring of the SIP are greater than those obtained in individual categories. And rehabilitation patients ob- tained lower reliability coefficients than those suffer- ing a speech pathology or outpatients with chronic problems [ 121.
In general, assessment of reliability is of special importance for prospective studies, where the main aim is to measure changes in the health status, as the outcome could express variability in measurement rather than any real change in the condition under survey [ 131.
In 1988, a study was planned to assess the quality of life of patients suffering end-stage renal disease (ESRD) carried out in Barcelona (141. The Spanish version of the NHP was used, once its suitability for this group of patients had been established in a pilot
SSM 31,1--K 153
154 XAVIER BADIA et al.
study [15]. Since the original idea was to carry out a prospective study, it was decided to assess the re- liability of the Spanish version of the NHP with patients suffering from ESRD. Since there was no information on how different issues related to the administration of the questionnaire could influence the responses to the NHP, we also attempted to assess whether the interviewer, the timing and method of administration had any effect on the reliability of the questionnaire.
PATIENTS AND METHODS
The Spanish version of the NHP
The NHP is a perceived health questionnaire devel- oped in England in the late 1970s [9, 161. The first part of the questionnaire is made up of 38 items that contain expressions describing the patient’s experi- ence of health and illness, and belonging to six dimensions of health (Energy, Pain, Emotional Reac- tions, Sleep, Social Isolation and Physical Mobility). The respondent answers “Yes” if the item reflects his or her current status or feelings, and “No” otherwise. The second part contains seven independent domains of life (Paid Employment, Jobs around the house, Social Life, Relationships, Sex Life, Hobbies and Interests, and Holidays) that should be similiarly answered negatively or affirmatively. This second part will not be the subject of analysis in the present study, since questions are analyzed independently.
In the original version of the NHP, the items were assigned weights, which described the relative import- ance of the item in each dimension. Weights were obtained using the Thurlstone’s paired comparisons method [ 171. However, work to obtain weights for the Spanish version is currently underway and they could not be used for current purposes. As in previous work [lo], in this study the NHP score was calculated as follows: the total number of affirmative responses to the items in one dimension was divided by the total number of items in that dimension and the result was then multiplied by 100. Thus, possible scores range from 0 (no problems in that health dimension) to 100 (maximum problems). Also, analyses of scores ob- tained using the English weights were carried out, yielding very similar results, but are not presented in this paper (the results are available from the authors upon request). Scores of dimensions with a missing item response were considered missing values.
Patients
Two dialysis centers of Barcelona were selected, on the grounds that the population served had different socioeconomic levels. Center A (Fundacio Puigvert) covered 70 patients and center B (Centro de Nefrol- ogia “Baix Llobregat”), 165. In general, center B patients were older, from a lower social class and presented a larger number of comorbidities than those from center A.
In order to minimize the possibility that the evol- ution of the illness affected the results of the study, only patients suffering ESRD and undergoing as- sisted hemodialysis treatment, whose clinical situ- ation was considered stable by their physician, were included in the study. One week before the patients interview, clinicians assessed stability of the patients based on biochemical and clinical information. Patients with higher risk of non-stable health status (those with less than six months in dialysis program, or with planned changes in treatment schedule, or with important comorbidities associated with renal disease) were excluded.
Taking into consideration the above-mentioned criteria, the sample was made up of 170 patients (72.3% of the total number), with 43 (61.4% of the center’s patients) from center A and 127 (77% of the center’s patients) from center B.
Methodr
The questionnaire was administered twice to each patient, with a four-week interval in between. In order to assess the effect that the timing of the questionnaire’s filling-in might have on the answer, an alphabetical list of the eligible patients of both centers was prepared. The patients were then allo- cated correlatively to four groups (the first name to group 1, the second to group 2, . . the fifth to group 1, etc.). Group 1 was given the questionnaire just before starting dialysis. Groups 2 and 3 were given the questionnaire during the dialysis session: group 2 during the first hour, and group 3 from the start of the third hour for those who underwent dialysis for 3.5 or 4 hr, and in the fourth hour for those who had 5 hr of dialysis. Group 4 was handed the question- naire and asked to fill it in at home the following day and bring it back to the Center on their next dialysis day. Four weeks after the first administration, the questionnaire was administered again under the same conditions described above.
Out of the initial sample of 170 people, 149 (87.6%) answered the first questionnaire; 121 of these (8 1.2%) answered the second questionnaire four weeks later. Of the 21 patients who did not answer the first questionnaire, 18 refused and the remaining 3 were on holiday and could not be contacted. Of the 28 patients who failed to answer the second NHP ques- tionnaire administration, 21 cited various reasons for refusal, and 7 could not be contacted for objective reasons such as hospital admission or holiday.
The initial aim was that the questionnaire should be self-administered in all cases (as recommended by the authors of the orginal version of the NHP [3]), but many of the patients who should have filled it in during their dialysis session needed someone to read it to them. In 36 cases this was because of hindrances to writing, caused by their position during dialysis. In 30 cases it was because the patients could not read or had not brought their glasses. In all these instances,
Reliability of the Spanish version of the NHP 155
the questionnaire was administered by two of the authors (M.B. and P.L.).
Analysis
The reliability analysis used three methods. The first one was Spearman’s correlation coefficient (r,) which correlates the range of scores for each dimen- sion in the two administrations.
Secondly, the agreement percent (AP) among items for the answers “yes” was calculated. The AP is a measurement of the consistency of items answered affirmatively and evaluates the extent to which the subjects check the same items on the two adminis- trations. The formula to calculate the AP is as follows:
AP= number of agreements
number of agreements ;
+ number of disagreements
where agreement existed if the item was answered “yes” in the two administrations; and disagreement if the item was answered “yes” in only one of the two adminstrations [ 131.
Thirdly, internal consistency was analyzed by means of Cronbach’s alpha coefficients, for the whole NHP and for specific dimensions.
RESULTS
In Table 1 the clinical and demographic character- istics of the patients included in the study, both initially and in the final sample, are shown. An analysis of variance was carried out of the variables of age, time in dialysis and the number of comorbid- ities between patients who did and did not answer the second questionnaire. No statistically significant differences were found, although these who did not answer were older, had spent more time in dialysis and had more secondary illnesses. The final response rate was 71.2% and varied little on account of different times of administration.
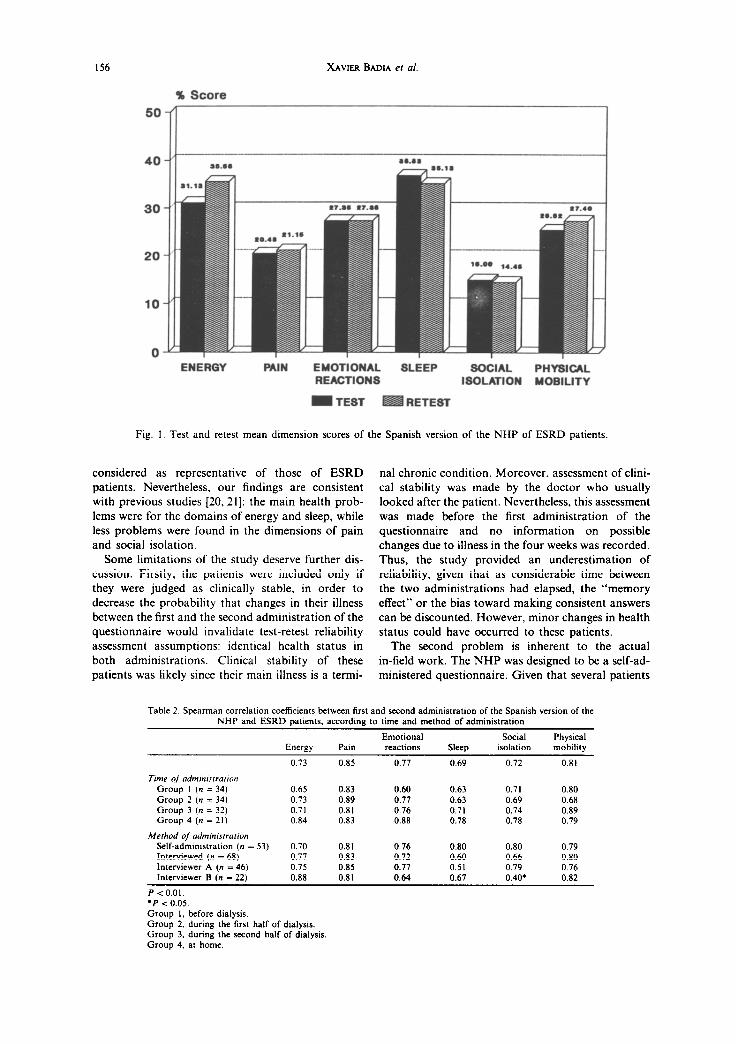
In Fig. 1 average scores for each dimension of the NHP are shown. In both administrations, highest scores were obtained for the sleep and energy dimen- sions and the lowest, for social isolation.
Table 2 shows the correlation coefficients for all the dimensions (0.69-0.85) according to the time of ad- ministration (0.60-0.89), the method of adminis- tration (0.60-0.83), and depending on which interviewer it was (0.40-0.88). All the coefficients were significantly different from zero (P < 0.01).
The overall AP of all the items for the whole sample was 0.56, providing AP values for the dimen- sions between 0.48 and 0.65 (Table 3). Likewise internal consistency for the whole of the profile (0.91-0.92) and by dimensions (0.58-0.86) was high.
With the aim of examining whether any particular item could be providing less reliability, an analysis of the AP of each one of the items of the NHP was carried out. The items “I feel that life is not worth
living” from the dimension of Emotional Reactions and “I feel there is nobody I am close to” from the Social Isolation dimension, correspond to the lowest AP (0.23 and 0.33, respectively) out of all the Profile’s items.
DISCUSSION
In the present study, correlations obtained between the two administrations of the Spanish version of the NHP were high and significantly different from zero. Results suggest that the NHP is reliable when used with stable ESRD patients, and that it may be suitable for evaluation or follow-up studies in these patients. On the other hand, these results are similiar to those obtained using the orginal version of the questionnaire with patients suffering Osteoarthritis and Peripheric Vascular Disease [ 18,191.
We did not find an effect of time and method of administration on the reliablity of the NHP in these patients. A more detailed analysis of the effect of different time and methods of administration was not attempted because of the small number of obser- vations. It seems that these factors do not affect reliability, but extrapolations to different procedures or settings must be done cautiously.
Since the study was carried out on a convenience sample, the health problems found should not be
Table 1. Characteristics of ESRD patients: initially s&&d sample (n = 170) and actual participating sample (n = 121) in the reliability
assessment
sex Men Women
Level of emtcarion Read and write Primary school Secondary school Prc-graduate Post-graduate No information
Secondary illnesses
None One More than one
Primary renal diagnosdc
Interstitial Glomerulonephritis Polichistosis Unknown Vascular Diabetes Other
Sample initially Participating s&&d’ sample2
n (%) n (%)
93 (56.0) 68 (57.6) 73 (44.0) 50 (42.4)
II (6.6) (3.4) 97 (58.4) 6; (58.5) 17 (10.2) I4 (11.8) 6 (3.6) (3.4) 4 (2.5) ” -
31 (18.7) 27 (22.9)
92 (55.4) 62 (52.5) 39 (23.5) 31 (26.3) 35 (21.1) 25 (21.2)
32 (19.3) 21 ( 17.8) 31 (18.7) 23 (19.5) 28 (16.9) 20 (16.9) 26 (15.7) 20 (16.9) 20 (12.0) I6 (13.6) 9 (5.4) (2.6)
20 (12.0) 1: (12.7)
Mean (SD)’ Mean (SD)’
Age (yea@ 55 I4 53 I3 Time (months) in hcmodialysis 48 34 48 35 Secondary illnessa (numb@ 0.7 I.1 0.8 I.1
‘No data available in four of the patients. ‘No data available in three of the patients. ‘SD, standard deviation.
156 XAVIER BADIA er al.
% Score
50’
20
10
0 EMOTIONAL SLEEP SOClAL PHYSICAL REACTIONS ISOLATION MOBILITY
ENERGY PAIN
- TEST RETEST
Fig. 1. Test and retest mean dimension scores of the Spanish version of the NHP of ESRD patients.
considered as representative of those of ESRD patients. Nevertheless. our findings are consistent with previous studies 120,211: the main health prob- lems were for the domains of energy and sleep, while less problems were found in the dimensions of pain and social isolation.
Some limitations of the study deserve further dis- cussion. Firstly, the patients were included only if they were judged as clinically stable, in order to decrease the probability that changes in their illness between the first and the second administration of the questionnaire would invalidate test-retest reliability assessment assumptions: identical health status in both administrations. Clinical stability of these patients was likely since their main illness is a termi-
nal chronic condition. Moreover, assessment of chni- cal stability was made by the doctor who usually looked after the patient. Nevertheless, this assessment was made before the first administration of the questionnaire and no information on possible changes due to illness in the four weeks was recorded. Thus, the study provided an underestimation of reliability, given that as considerable time between the two administrations had elapsed, the “memory effect” or the bias toward making consistent answers can be discounted. However, minor changes in health status could have occurred to these patients.
The second problem is inherent to the actual in-field work. The NHP was designed to be a self-ad- ministered questionnaire. Given that several patients
Table 2. Spearman correlation coefficients between first and second administration of the Spanish version of the
NHP and ESRD patients, according to time and method of administration
Energy Pain
Emotional
reactions Sleep
Social
isolation
Physical
mobility
0.73 0.85 0.77 0.69 0.72 0.81
Time of admtntstration Group I (n = 34)
Group 2 (n = 34)
Group 3 (n = 32) Group 4 (n = 21)
Method of aaininisrration
Self-admmistration (n =
Interviewed (n = 68)
Interviewer A (n = 46)
Interviewer B (n = 22)
0.65 0.83 0.60 0.63 0.71 0.80
0.73 0.89 0.77 0.63 0.69 0.68 0.71 0.81 0.76 0.71 0.74 0.89 0.84 0.83 0.88 0.78 0.78 0.79
53) 0.70 0.81 0.76 0.80 0.80 0.79
0.77 0.83 0.72 0.60 0.66 0.80
0.75 0.85 0.77 0.51 0.79 0.76
0.88 0.81 0.64 0.67 0.40. 0.82
P < 0.01.
l P < 0.05.
Group I, before dialysis.
Group 2, during the first half of dialysis.
Group 3, during the second half of dialysis
Group 4. at home.
Reliability of the Spanish version of the NHP 157
Table 3. Agreement penrnt (AP) between response to the items of the Spanish version of the NHP in ESRD patients
Chronbach’s alpha
AP* Test Retest
Total 0.56 0.91 0.92 Dimension
ElWgy 0.56 0.68 0.75 Pain 0.57 0.85 0.86 Emotional reactions 0.50 0.78 0.80 Sleep 0.59 0.77 0.79 Social isolation 0.48 0.58 0.68 Physical mobility 0.65 0.66 0.73
Time of administration Group 1 0.51 Group 2 0.57 Group 3 0.55 Group 4 0.63
Method of odministrarion .Wf-administercd 0.59 Interviewed 0.61 Interviewer A 0.55 Interviewer B 0.56
l P < 0.01 in all AP coefficients using a one-tailed normal curve test of significance for a proportion.
had secondary illnesses which affect sight or were unable to write because of mechanical hindrances during the dialysis sessions, the NHP had to be administered in some cases by an interviewer. How- ever, this did not affect reliability, except for the dimensions of sleep and social isolation.
Thirdly, and inherent to the analysis of data, was the lack of item weighting in the Spanish version of the NHP, at the time when the study was carried out. In some cases, we may have overestimated reliability, since an identical score (percentage of positive re- sponses) could be obtained by affirmatively answer- ing different items. However, the fact that high coefficients, similiar to those obtained in other studies carried out with another very similar instrument-the Sickness Impact Profile [12l_have been obtained with the AP calculation, allows us to assume that results with weighted values should not greatly alter the correlation coefficients obtained in the present study. Moreover, analysis of the present study using the original English weights, provided similar results: the highest difference between the correlation co- efficients with weighting (not presented in the paper) and without them (presented coefficients) was 0.02 in two NHP dimensions.
Two of the items which obtained a lower AP share the characteristic of being the only two items in the Spanish version of the NHP that have a negative construction, which made them harder to under- stand-a fact that the interviewers had suspected during their field-work. Whenever possible, items with negative construction should be avoided in instruments of health status measuring. Alternative explanation may be given by the fact that these items touch on the emotional domain which may have little to do with the stability of the illness and thus may have changed more easily in the study period.
It is important to assess an instrument’s reliability when using it among specific population groups. This
is particularly the case of a generic health status instrument like the NHP, that has been used among the general population in community studies [22] and among patients in clinical studies [23]. Reliability depends on the attribute or condition measured as well as on the ways of application of the measuring : instrument. The facts that the samples needed for a clinical test are normally lower than for a community study, and that the attributes to be measured are more specific, imply that the instrument needs to provide a higher reliability level. Thus, reliability coefficients obtained from homogenous populations can be. applied to more heterogeneous populations, but not the reverse (241. This leads us to demand greater reliability in the specific instruments for measuring health status than in generic ones.
Also, it is advisable to assess test-retest reliability of health status measurements on different patient populations for which the aims are to measure clinical status that can last for weeks or months. We must have an idea of the size of the measurement error due to the instrument, when condition does not change. This is especially important for prospective studies, where a stable instrument unaffected by a treatment like hemodialysis is essential. In such a case, demon- stration of retest reliability must be carried out in accordance with the time-span of the study and of the condition measured: in weeks or months. A demon- stration in hours or days could be useless.
Even though lower reliability coefficients may be seen as satisfactory in some cases, we think that when designing longitudinal studies and clinical trials, that focus on group estimates, a reliability not less than 0.75 is acceptable. If decisions are to be made on an individual basis, a higher level of reliability is needed [25].
t
Acknowledgements-To the patients and the physicians and the health staff of the dialysis centers of the Fundaci6 Puigvert and of the Centre de Nefrologia del Baix Llobre- gat, both in Barcelona. To the staff at Programa d’Assistdncia a la Insuficiencia Renal (PAIR): and to Montse RuC for her help in the data analysis.
I.
2.
3.
4.
5.
REFERENCES
Kaplan G. A. and Camacho T. Perceived health and mortality: A nine year follow-up of the human popu- lation laboratory cohort. Am. J. Epidemiol. 117, 292-298, 1983. Evans R. W., Manninen D. L., Garrison L. P. el a/. The quality of life of patients with end-stage renal disease. N. Engl. J. Med. 312, 553-559, 1985. Hunt S. M., McEwen J. D. and McKenna S. Measuring Healrh Statur, pp. 76-i 19. Croom Helm, London, 1986. Bergner M., Bobbitt R. A., Carter W. B. and Gilson B. S. The sickness impact profile: development and final revision of a health status measure. Med. Care 19, 787-805, 1981. European Group for Health Measurement and Quality of Life Assessment: Hunt S. M., Alonso J., Buquet D., Niero M., Wiklund I. and McKenna S. Cross-cultural
158 XAVIER BADIA er al.
6.
I.
8.
9.
IO.
11.
adaptation of health measures. Hlrh Policy 19, 3344, Seguretat Social de la Generalitat de Catalunya, 1991. Barcelona, 1987. Jenkinson C., Fitzpatrick R. and Argyle M. The Not- 16. Hunt S. M., McKenna S. P., McEwen J., Backett E. M., tingham Health Profile: an analysis of its sensitivity in Williams J. and Papp E. A quantitative approach to differentiating illness groups. Sot. Sci. Med. 27, perceived health status: A validation study. J. Epi- 141 I-1414, 1988. demiol. Community Hhh 34, 28 l-286, 1980. McDowell I. and Newell C. Meusuring Health: A Guide 17. to Raring Scales and Questionnaires, pp. 31-35. Oxford University Press, New York, 1987. Guyatt G. H., Veldhuyen Van Zanten S. J. O., Feeny D. H. and Patrick D. L. Measuring quality of life in 18. clinical trials: a taxonomy and review. Can. Med. J. 140, 1441-1448, 1989. Hunt S. M. and McEwen I. The development of a 19. subjective indicator. Sot. HIrh Illness 2, 231-246, 1980. Al&so J., Ant6 J. M. and Moreno C. Spanish version of the Nottingham Health Profile: translation and nre- liminary validity. Am. J. Public Hith 80, 704708, 1990. 20. Alonso J. Adaptacib d’una mesura de la salut perce- buda: la versio espanyola de1 PerIil de Salut de Notting- ham. Barcelona: University of Barcelona, 1990 21.
McKenna S. P., Hunt S. M. and McEwen J. Weighting the seriousness of perceived health problems using Thurstone’s method of paired comparisons. Inr. J. Epiakmiol. 10, 93-97, 198 1. Hunt S. M.. McEwen J. and McKenna S. P. Measuring health status: a new tool for clinicians and epidemiolo- gists. J. R. Coil. Gen. Pracf. 35, 185-188, 1985. Hunt S. M., McKenna S. and Williams I. Reliability of a population survey tool for measuring health problems: a-study of patients with osteoarthrosis. J. kpidemioi. Communitv Hlth 35. 297-300. 1981. Evans R.. W., Rader B., Mannien D. L. and the Cooperative Multicenter EPO Clinical Trial Group. JAMA 263, 825-830, 1990. The Canadian Erythropoietin Group. Association be- tween recombinant human erythropoietin and quality of life and exercise capacity of patients receiving haemodi- alysis. RMJ 300, 573-578, 1990. Hunt S. M., McEwen J. and McKenna S. P. Social Inequalities and Perceived Health. Eficriue Hlrh Care 2, 151-160, 1985. O’Brien B. J., Buxton M. J. and Ferguson B. A. Measuring the effectiveness of heart transplant pro- grammes: quality of life data and their relationship to survival analysis. J. Chron. Dis. 40. (Sl). 137-153. 1987. Streiner D. L. and Norman G. R. Healrh Measuremenr Scales: A Practical Guide IO their Development and Use, pp. 79-105. Oxford University Press, New York, 1989. Nunally J. C. Psychomewic Theory, 2nd edn. McGraw- Hill, New York, 1978.
(Doctoral drssertatron). 12. Pollard W. E., Bobbitt R. A., Bregner M., Martin D. P.
and Gilson B. S. The sickness impact profile: reliability of a health status measure. Med. Care 24, 146-155, 22. 1976.
13. Pollard W. E., Bobbitt R. A. and Bergner M. Examin- ations of variable errors of measurement in a survey- 23. based social indicator. Sot. Indic. Res. 5,279-301, 1978.
14. Lock P. M. La salut percebuda del malalr renal: un estudi transversal. Department de Sanitat i Seguretat Social de la Generalitat de Catalunya, Barcelona, 1988. 24.
15. Lock P. M. Lo evaluation de la calidad en vidn en enfermos renales: estudio pilot0 utilizando el Perfl de Saiud de Nottingham en 10s enfermos con insujiciencia 25. renal terminal en Cataiwia. Department de Sanitat i
Copyright © 2022 FDOKUMEN