Sequential Generation of Two Distinct Synapse-Driven Network Patterns in Developing Neocortex
Upload
khangminh22Category
view
0download
0
RELATIVE NEOCORTEX SIZE AND ITS CORRELATESIN DOLPHINS: COMPARISONS WITH HUMANS AND
IMPLICATIONS FOR MENTAL EVOLUTION.
by
Alain Jean-Paul Charles Tschudin
Submitted in fulfilment of the requirements forthe degree of
Doctor of Philosophyin the School of Psychology,
University of Natal,1998

ii
Preface
The research described in this thesis was undertaken at the University
of Natal, South Africa, between January 1996 and October 1998, under the
supervision of Or Michael Budek and the co-supervision of Or Vic Peddemors
of the Natal Sharks Board.
The design and execution of the studies on which this thesis is based
represent my original and unassisted work, unless otherwise indicated and
acknowledged in the text. No part of this thesis has been submitted for any
other degree at any university.
Alain J-P.C. Tschudin

Hi
Dedication
Mothers play a crucial role in the successful development of their
young, although their efforts often appear to pass as unnoticed or
unacknowledged. This thesis is dedicated to two of the greatest mothers one
could ever wish for, my mother Marcelle, and my grandmother, Isabel.
Without your constant love, faith, hope (and prayers!), this work and I would
not have been possible.

iv
Acknowledgements
An extensive network of people, organisations and institutions have
made my research aspirations possible. I express my warmest gratitude for
this and for their incalculable value to me.
My God, family and friends who have inspired me with endless love,
support, care and understanding. I owe a tremendous deal to my parents,
Marcelle and Alain, who have provided me with encouragement and
sustained interest, not only in academics, but throughout my personal
development. In addition, I thank them for the sacrifices made to provide me
with a comprehensive and moral education.
My supervisor, Mike Budek, for his kindness, dedication of time and
effort, and interest in my work. My co-supervisor, Vic Peddemors, who has
been with the project since its inception, for his friendship, guidance,
constructive commentary and continued involvement. Many thanks for
believing in me, allowing me to embark on my career and persevering with
me.
In Pietermaritzburg, where the study has been completed: To Clive
Basson, for personal mentoring and for "affording" my development; Debbie,
the Rijkenbergs and the Gilberts, for continued love, support and hospitality;
Mike, Cecilia, Tom and all my other friends in the School of Psychology, for
kindness and tolerance.
Professionally; my research psychology internship mentor, Lance
Lachenicht and my internship supervisors, Clive Basson, Nhlanhla Mkhize
and Rory Plunketl, who extended their interest to my thesis and provided
advice, support and friendship: The head of the School, Linda Richter and its
other members, including Bev Killian, Graham Lindegger and Lynne Zank, for

v
academic and administrative support. My uncle, Frits Rijkenberg, a local
faculty dean and professor of microbiology, for his insight and involvement.
In Durban, where the study originated. My entire Akal "clan", Angi and
the Loudons, Paul Nadal, M.G., Nic, Jules, Irena, James and all of my other
friends, for your unfailing love, support, concern and companionship.
Professionally, the Director of-the Natal Sharks Board, for allowing me
to work with the staff, especially Pat Mthembu and Grant Thompson, use its
facilities and for providing me with access to my dolphin specimens.
Prof. Bruce Gillmer, formerly HOD of Psychology at Durban, for his
direction. Professor Peter Corr, Head of Radiology at the University of Natal
Medical School, for permitting continued eT and MRI scanning at Wentworth
Hospital and for initially suggesting the use of MRI at Jackpersad,
Rooknoodeen lnc; and also to Marianne Singh for her assistance.
At Jackpersad Incorporated (St Aidan's Hospital), Drs Kamlesh Oaji,
Thami Mngoma, Ravi Hurribunce and partners for their extreme generosity in
providing me with free access to their expensive MRI facilities over several
years and invaluable information. Kantha, Rash and Bev, the radiographers,
for their immense involvement, often after hours, their patience, dedication
and considerable knowledge.
At Wentworth Hospital, initially the radiologist, Or Ouncan Royston,
and subsequently the radiographers, Jean, Romona, Heather and June, for
their practical expertise, assistance and tolerance of unexpected visits.
Or Vic Cockroft, Mike Mthathi and colleagues at the Port Elizabeth
Museum, for assisting me in obtaining access to an extensive collection of
odontocete skulls.

vi
The contributors of personal communications, e-mail advice at
different stages of the research, and suggestions regarding the research:
Profs Dick Byrne, Robin Dunbar, Martin Davies, Maciej Henneberg, Drs John
Lycett, Dave Perret, Ken Findlay and finally, Tim Harkness. Barbara von
Etzdorf, for the delivery of essential reading material and correspondence.
Patsy Esposito and The Southern Sun Group, for sponsoring my
accommodation costs on research trips to Port Elizabeth and Cape Town.
The Foundation for Research Development sponsored the first year of the
study and their funding is appreciated. Currently, the research is funded by a
University of Natal Doctoral Research Scholarship, a Centre for Science
Development and a Commonwealth Scholarship. I extend my sincere
gratitude for this support, which has enabled the execution and completion of
this research.
Finally, I am thankful for the efforts of all the people with whom I have
interacted and discussed this project, in addition to those who have assisted
in any way. If, due to spatial constraints or an oversight, I have omitted to
mention such persons on the above list, this in no way lessens my deep
sense of appreciation for their contributions.

vii
Abstract
The superior neocortex ratios in primates and their distinctive
relationship with sociality among terrestrial mammals are well documented.
However, there has been an absence of research into relative neocortex size,
its evolution and correlates in marine mammals, such as cetaceans (dolphins,
porpoises and whales). This study uses the advanced radiological techniques
of computed tomography and magnetic resonance imaging to establish
neocortex ratios in dolphins and to re-assess these values for humans. It was
found that freezing and defrosting did not significantly alter the neocortex
raitos of dolphins and thus extra material as included in the analysis.
Furthermore, equations for the estimation of neocortex ratios from eT and
MRI have been applied to the cranial volumes calculated for 19 toothed
whale species, in order to extend the range of analysis.
Using these techniques, it appears that dolphin neocortex ratios are
higher than those of other mammals, except for primates. A notable finding is
that dolphin values lie between human and other primates and are closer to
human ratios at 4.1, than to non-human ratios reaching 3.2~ (Dunbar, 1992).
The highest delphinid neocortex ratio from MRI was 3.94 for common
dolphins, while the highest estimated neocortex ratio was at 3.95 for killer
whales. To establish the correlates of such high neocortex ratios in dolphins,
their scores were related to variables representing foraging ecology, sound
and sociality.
Although delphinid neocortex ratios do not appear to be related to
foraging variables, they are significantly related with sound and sociality
variables. Of these relationships, the most substantial finding exists with
respect to the relationship of delphinid neocortex ratios and their mean group
size. The capacity to predict group size from relative neocortex size has not
been noted in non-primate species, and has formed the basis for current

viii
theories of social intelligence and mental evolution. The findings of this study
are therefore of considerable interest and may have substantial implications.
These may impact on current theories of primate-human mental evolution
and therefore it is strongly recommended that the mental capacities of other
mammals, such as dolphins, be examined in greater detail to support or
refute these claims.

3.4. Human neuroanatomical data using MRI3.5. CT-MRI relationships4. Discussion
676970
ix
3. The use of cranial volume analysis and neuroimaging to estimateneuroanatomical data and relative neocortex size in odontocetes.
1. Introduction2. Method2.1. Study animals2.2. Procedure3. Results4. Discussion
788181848592
4. Foraging ecology and relative neocortical volume in dolphins.
1. Introduction 981.1. General delphinid foraging ecology 991.2. Foraging ecology of species in South African waters 1032. Method 1082.1. Study animals 1082.2. Materials 1132.3. Procedure 1133. Results 1143.1. Correlational analysis 1143.2. Weighted linear regression 1164. Discussion 119
5. Sound and relative neocortical volume in dolphins.
1. Introduction2. Method2.1. Study animals2.2. Materials2.3. Procedure3. Results3.1. Correlational analysis3.2. Weighted linear regression4. Discussion
125127127128128129129131135

6. Sociality and relative neocortical volume in dolphins.
1. Introduction 1391.1. Dolphin schools and the functions of sociality 1411.2. The social structure of delphinid species off KwaZulu-
Natal 1442. Method 1472.1. Study animals 1472.2. Materials 1492.3. Procedure 1493. Results 1503.1. Correlational analysis 1503.2. Weighted linear regression 1513.3. Correlations of significant variables with other study
variables 1574. Discussion 159
7. Comparisons of delphinid and primate neocortex and itscorrelates: Implications for mental evolution
1. Summary 1712. Implications 1773. Constraints in theory and practice and
Recommendations 1813.1. Brain size, neocortex size and the neocortex ratio 1813.2. Study variables 1833.3. Study animals and study methods 1843.4. Weltanschauung- Worldview 1854. Future directions 1865. Concluding remarks 1936. References 194
Appendix: Table of selected abbreviations
x

Chapter 1. Brain size and the correlates of mental evolution in mammals
1. Introduction
The quest for knowledge concerning the evolution of mind and intelligence
is of long standing and continues with increasing interest. Scholars of this topic
are drawn from diverse backgrounds and often promote complementary or
contrasting perspectives. The mainstream of evolutionary research widely
accepts the notion of the continuous physical evolution of humans from earlier
communal primate-ape clade ancestors (Darwin, 1871). However, a contrasting
scenario prevails with respect to the evolution of human cognitive capacities. The
present consensus is that this process is discontinuous and thus dissimilar to
that in other animals (Corballis, 1991; Povinelli, 1993).
The theory of discontinuous mental evolution implies that the nature of the
human mind and intellect is not merely quantitatively different to other mammals
and primates, but also qualitatively different. The premise of distinctly unique
human intelligence has been supported by a large base of literature, although
the concept of intelligence is problematic in its own right (Byrne, 1995).
Within this context of qualitative difference, researchers have attempted to
discern what distinguishes human mental and intellectual evolution from that of
other species. Originally it was proposed that the large brains of humans and
primates, in absolute terms, might be the significant difference when these were
compared to other animals (Passingham, 1982). However, when certain
megaherbivore and cetacean species such as elephants and whales were
considered, this approach rapidly lost favour, as it became apparent that
absolute brain size (ABS) favoured larger animals (Passingham, 1982).
During the 1970s, it was suggested that the degree of relative brain size
(RBS) might be the hallmark of primate brain evolution (Jerison, 1973). The
encephalisation quotient (EQ) was built on the cephalisation co-efficient of von

2
Bonin (1937) and provided the ratio of observed to expected brain weight over
body mass of the animal (Jerison, 1973). According to this measure, humans
were significantly more encephalised than other primates (Passingham, 1982).
Megaherbivores were eliminated from contention using the EQ. However, the
superior scores of dolphins among the cetaceans (Ridgway, 1990) and of
cetaceans in relation to primates (Jerison, 1982b; Marino, 1997, 1998; Worthy
and. Hickie, 1986) are problematic and continue to confound the theory of
discontinuous human cognitive evolution.
Although the EQ (Jerison, 1973) and its derivatives (Clutton-Brock and
Harvey, 1980; Eisenberg, 1981; Marino, 1996, 1997; Passingham; 1982; Worthy
and Hickie, 1986) have been in use since the 1970s, criticism has been drawn
from several different perspectives. For example, evolutionary changes in body
size may not necessarily have accompanying alterations in brain size (Deacon,
1990b). It has been suggested that body size is thus a confounding variable and
should be excluded from analysis (Barton and Dunbar, 1996). Furthermore,
relative changes in regional brain areas such as the neocortex may occur fairly
independently of body size (Dunbar and Sever, 1997). However, in spite of the
drawbacks of the EQ, the cautionary comment directed at it and the development
of more appropriate brain size measures, it continues to be utilised in current
research (see Marino, 1995, 1996, 1997, 1998).
More apparently appropriate indices of RSS are thought to include
processing capacity relative to cortical surface area (Jerison, 1982a), the relative
size of the neocortex (Sawaguchi and Kudo, 1990) and the neocortex ratio
(Dunbar, 1992). These measures are used to study the brain in relation to itself,
insofar as neuroanatomical regions are examined in relation to each other. Such
ratios are believed to provide a more adequate reflection of relative brain size
than ratios such as the EQ, which express brain size in relation to non-brain
variables.

3
However, the above investigations share common ground, in that they
have not merely sought to establish the size of the brain, its degree of
encephalisation or even the relative size of areas such as the neocortex. They
have also attempted to establish what factors are related to an expanded brain
or enlarged neocortex, in order to ascertain what might be related to intellectual
evolution.
One of the more recently notable measures has been the neocortex ratio
(CR), which is a measure of the neocortex volume relative to the volume of the
rest of the brain (Aiello and Dunbar, 1993; Dunbar, 1992, 1995; Dunbar and
Sever, 1997). This is an apparently better measure, as the neocortex is accepted
as being responsible for complex cognitive functioning, although this assumes
that intellectual functions are localised in the cortex (Byrne, 1995). Hence the
neocortex ratio is considered to be an important indicator of intellectual capacity.
According to this reasoning, an animal with a high volumetric ratio of neocortex
relative to the rest of the brain has more potential for intellect than an animal with
a low CR. As humans are conventionally conceived of as being the most
intelligent species, it is not surprising to find that they obtain the highest CR at
4.1, followed by chimpanzees at 3.22 and other primates from 2.67 downwards
(Dunbar, 1992).
To interpret the significance of high CR values in humans, Dunbar (1992)
initially studied the CR of primates in relation to different behavioural ecology
variables. These included social complexity, crudely represented by mean
cohesive group size, and the complexity of foraging ecology, in the form of home
range and dietary composition. He found that in the older strepsirhine primates,
CR was related with foraging ecology, but not with sociality (Dunbar, 1992). The
CR only appeared to be related to sociality in the more recently evolved
haplorhine primates, a finding that has subsequently been confirmed (Dunbar,
1995). When applied to other orders of terrestrial mammals, the CR did not
appear to relate to sociality. For example, in insectivores, the CR was related to

4
foraging ecology, but was unrelated to sociality (Dunbar and Sever, 1997).
Recently, however, a significant relationship between CR and sociality has been
presented for carnivores (Dunbar 1992; Dunbar and Sever, 1997).
The observation of the relatedness of CR and sociality apparently
exclusively in the more recently evolved primates until the study by Dunbar and
Sever (1997) has had several substantial implications. Dunbar (1992) argued
that the availability of neocortex constrained the capacity to sustain social
relationships. An evolutionary solution enabling animals to live in larger cohesive
social groups would entail expanding the relative size of the neocortex relative to
the rest of the brain. Thus, although the total cranial volume of modern humans
may be smaller than that of their ancestral hominids and australopithecines, their
neocortex ratio, or relative neocortical volume, is higher (Aiello and Dunbar,
1993).
In short, the neocortex is believed to be intricately related with the
capacity for intelligent behaviour. In most of the literature, large neocortices
appear to be exclusively restricted to primates, reaching a zenith in humans
(Dunbar, 1992). Relative neocortex size in other orders of mammals is primarily
related to foraging ecology, in contrast to the relationship with sociality in
primates and carnivores. It has previously been argued that the difference in
primate and human intelligence is that it is more geared towards social
complexity than to feeding or ecological complexity (Dunbar, 1992, 1995),
although Syrne (1995) considers such distinctions to be artificial.
Additional supporting evidence for the exclusivity of primate social
intelligence has been drawn from the fields of social anthropology, evolutionary
psychology and primatology. For example, Cosmides and Tooby (1993) have
indicated that the human brain is better geared towards solving social problems
in comparison with logico-mathematical problems. Cheney and Seyfarth (1990)
considered that intentionality, an important attribute of social intelligence, was

5
not .present in other primates, with the possible exception of certain great apes.
Whiten and Byrne (1988) coined the term "Machiavellian Intelligence" to describe
the intelligence employed by primates, noting that the origins of human strategic
intelligence are evident in our primate relatives.
Within this paradigm, the implication is that as social intelligence is a
recent evolutionary phenomenon, it is logically solely represented in the primate
domain. Even more "sensible" is the assertion that humans, as the most recently
evolved primates, should possess the largest relative neocortices, in addition to
demonstrating the greatest degree of social intelligence. This can be summed up
in a recent statement by Povinelli (1993) who does not consider it possible that
another species could have a mind "as replete with social intelligence as our
own".
Although the concepts of discontinuous mental evolution or distinctive
primate-human social intelligence might be enticing, there is a problem. The
reasoning from which these conclusions are drawn is based on a potentially
faulted premise. A certain highly adapted order of mammals has been omitted
from comparative studies of the brain and its correlates. This omission might not
seem immediately obvious nor pertinent. The reader will note that other orders of
terrestrial mammals such as carnivores and insectivores have been examined,
without any evidence of a relationship between neocortex and sociality. Yet, the
significance of the omission may become apparent when one considers the
excluded order of interest.
The order in question is that of Cetacea, whose members include species
of dolphins, whales and porpoises. Although theories describing the evolution of
cetaceans have been largely speculative (see Rothausen, 1985), recent
paleaontological findings indicate that the terrestrial order Condylarthra were the
forebears of the archaeocetes at the end of the Palaeocene (Barnes, 1984;
Evans, 1987; Gingerich, Wells, Rusell and Shah, 1983; West, 1980). Test results

6
of cetacean DNA divergence correspond closely with the documented data on
their phylogenetic relationships (Arnason, 1974; Gretarsdottir and Arnason,
1992), except for the sperm whales, who are thought to have diverged long
before their extant relatives (Douzery, 1993).
Within this classification, the study is primarily concerned with members of
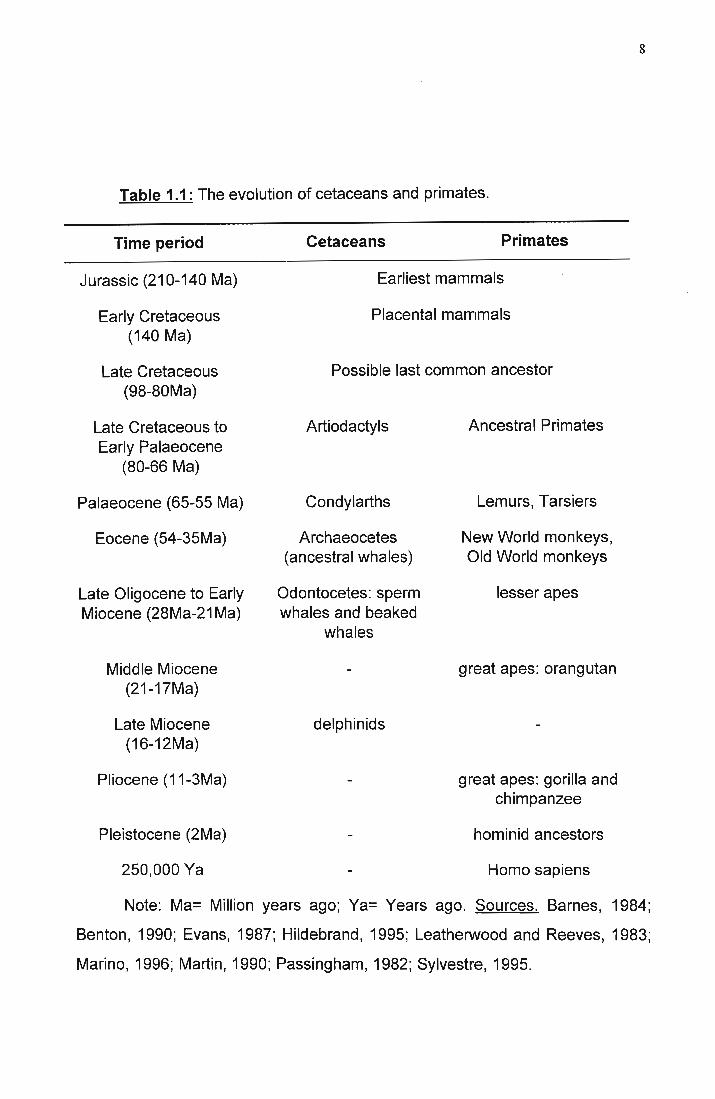
the family Delphinidae (delphinids). The delphinids are of relative recency (Table
1.1), as is evidenced by fossils from the Late Miocene (Evans, 1987; Sylvestre,
1995).
Although speculation remains as to the origin of placental mammals, the
proposals range from the beginning of the Cretaceous (140Ma) onwards into the
Cenozoic era, also referred to as the 'Age of Mammals' (Hildebrand, 1995;
Martin, 1990). The ancestral primate stock is said to have diverged from the
general stock of placental mammals 90-100Ma (Martin, 1990). This possibly
represents the last plausible time that a common ancestor was shared between
the modern primates and cetaceans (see Table 1.1).
While the cetaceans were evolving in the water, largely isolated from
terrestrial life, highly significant evolutionary adaptations were occurring on land,
as is evident in Table 1.1. Whereas dolphins represent the most recent product
of the significant evolutionary changes in water, the terrestrial equivalent is the
current sub-species of humans, Homo sapiens sapiens, who have only been in
existence for 250,000 years (Martin, 1990; Passingham, 1982). Accelerated
hominid evolution is said to have been made possible by cultural innovation
(Donald, 1993).
It appears as if dolphins have interacted significantly enough with humans
to be well documented in culture and language (Lockyer, 1990). This is evident
from cultural artefacts dating from approximately 1600 BC to 2000 BC (Lockley,
1979; Lockyer, 1990). Literary accounts support the proposal that dolphins and

7
humans have interacted through antiquity (Guerber, 1944; Lockley, 1979;
Stenuit, 1971; Sylvestre, 1995).
However, although a substantial amount of popular interest has been
invested in dolphins and whales, a paucity of scientific knowledge exists with
respect to these mammals in relation to other mammals, such as primates.
Although the scientific study of cetaceans began with Aristotle, little progress
was made until 1551, when Pierre Belon du Mans comprehensively described
dolphins. The next notable scientific investigation of cetaceans was conducted
by Linnaeus (1735), who included them as mammals in his classification of the
animal kingdom. Although cetology is currently in its infancy, contemporary
research aims to broaden our understanding of these animals.
A study pertaining to the neocortical evolution of dolphins and humans is
considered to be important, as it may provide more insight into general
mammalian mental evolution and possible convergent evolution between
different orders.
8
Table 1.1: The evolution of cetaceans and primates.
Time period Cetaceans Primates
Jurassic (210-140 Ma)
Early Cretaceous(140 Ma)
Late Cretaceous(98-80Ma)
Earliest mammals
Placental mammals
Possible last common ancestor
Late Cretaceous toEarly Palaeocene
(80-66 Ma)
Palaeocene (65-55 Ma)
Eocene (54-35Ma)
Late Oligocene to EarlyMiocene (28Ma-21 Ma)
Middle Miocene(21-17Ma)
Late Miocene(16-12Ma)
Pliocene (11-3Ma)
Pleistocene (2Ma)
250,000 Ya
Artiodactyls
Condylarths
Archaeocetes(ancestral whales)
Odontocetes: spermwhales and beaked
whales
delphinids
Ancestral Primates
Lemurs, Tarsiers
New World monkeys,Old World monkeys
lesser apes
great apes: orangutan
great apes: gorilla andchimpanzee
hominid ancestors
Homo sapiens
Note: Ma= Million years ago; Ya= Years ago. Sources. Barnes, 1984;
Benton, 1990; Evans, 1987; Hildebrand, 1995; Leatherwood and Reeves, 1983;
Marino, 1996; Martin, 1990; Passingham, 1982; Sylvestre, 1995.

9
Dolphins and whales are genetically related to humans and other
terrestrial mammals, albeit distantly (Deacon, 1990). The order Cetacea is also
considered to be consequential for comparative analysis, as it is the only
mammalian order that has engaged in a complete secondary return to
permanent existence in water (Kesarev, 1971). This, in its own right, makes
dolphins interesting for research. However, the degree to which dolphins have
successfully adapted to life in a complex, three-dimensional aquatic medium,
radically different to land, is perhaps equally significant (Deacon, 1990; Finlay
and Darlington, 1995). This is possibly evidenced by several features of
cetacean brains, which require discussion in relation to other mammals.
It was mentioned above that certain cetacean species have the largest
absolute brain size (along with elephants) and the greatest EQ of all species. In
addition, members of this order also possess the most convoluted brains and
greatest cortical surface area of all animals (Elias and Schwartz, 1969; Ridgway
and Brownson, 1984). Several brain size findings have been reported where
dolphins score above humans (Elias and Schwartz, 1971; Jerison, 1982a;
Ridgway, 1986a) or below humans, but above other primates (Haug, 1970;
Hofman, 1982a; Jerison, 1973; Martin, 1990, 1982, 1981; Ridgway 1986a;
Ridgway, Flanigan and McCormick, 1966).
The cortex and cytoarchitectonics of the dolphin brain have been
investigated; however, the relative size of the neocortex, specifically the
neocortex ratio, has not been previously documented in dolphins. This is
addressed in the current study.
If one considers that the CR has not been examined in dolphins, it follows
that the correlates of relative neocortex size have also not been studied in these
animals. Although a positive relationship between the large encephalisation of
dolphins and their sociality has been described by Marino (1996, 1997), it is

10
suggested that neocortical evolution may follow a radically different route from
that of encephalisation. The CR could plausibly have some entirely different or
unanticipated correlates to those of delphinid EQ. However, although Marino's
efforts are based on the EQ, they may provide preliminary support for the
relationship of neocortex and sociality in dolphins.
A positive association between neocortex and sociality or communication
in dolphins would have several implications. These may potentially affect
theories of social intelligence, primatology and cognitive evolution, as discussed
in subsequent chapters.
2. Study Aims and Hypotheses
In the light of the published data on dolphin brains and following the above
overview, the following hypotheses are investigated in this study:-
-that dolphins have high neocortex ratios;
-that dolphin neocortex ratios fall at least within the primate range of
neocortex;
-that dolphin neocortical ratios are more closely linked to social and
communicative complexity than to the demands of foraging ecology.
Previous studies have remarked at the encephalisation and extraordinary
brain development of dolphins and the documented literature indicates that
dolphins lie between humans and other primates in terms of EQ (Marino, 1997).
However, as brains are energetically expensive, it is unlikely that a relatively
large delphinid neocortex would have evolved without serving some notable
functional purpose. To investigate the correlates of CR in dolphins, it is necessary
to pay attention to their life history parameters. Dolphins reside in a complicated
visuo-spatial environment, described as the "sensory periphery" (Finlay and
Darlington, 1995). Although dolphins display a complex variety of foraging

11
ecology, perhaps more impressive is their range of fluid and advanced social
organisation, as well as their elaborate sound production. The above hypotheses
are therefore tested for various groups of Cetacea, from a category including
three dolphin species exhibiting varied life histories and social structure, to a
sample representing the wider family delphinidae through to the order
Odontoceti.
Sociality variables incorporate gestation, lactation, intercalf interval, mean
group size and maximum aggregate size. Acoustic variables include the
minimum, maximum and range values of sound frequency, sound energy and
signal duration, as well as the number of sound types produced. Foraging
ecology variables comprise foraging depth, number of total, fish and cephalopod
prey species, the ratio of total prey items to fish items or cephalopod items, the
ratio of fish to cephalopod species and the Shannon-Wiener Index of dietary
diversity (Sekiguchi, Klages and Best, 1992).
3. Overview of study animals and methods
Several difficulties have possibly precluded detailed work with cetaceans.
While some populations are heavily depleted by commercial fishing, a scarcity of
specimens is available for scientific research. If one considers that the dolphins
used for research are rare finds, then the value of their cortical matter becomes
appreciable. With the co-operation of the Natal Sharks Board (NSB), access to
dolphin specimens was made possible. The NSB is the local scientific body
responsible for installing and maintaining anti-shark netting along the KwaZulu
Natal coast, South Africa. The majority of dolphin specimens were incidental
catches who had asphyxiated in the nets deployed to protect bathers from shark
attacks. Other dolphin specimens were provided by Durban Seaworld and the
KwaZulu-Natal Stranding Network. All of the dolphin subjects were deceased on
examination and therefore no vivisection was performed. The human subjects

12
were all volunteers, who provided their informed consent. The cetacean crania
were provided by the Port Elizabeth Museum.
As delphinid crania are valuable for taxonomic and morphometric
investigation, they may not be damaged by physically extracting brains for
analysis. Although the use of sophisticated imaging technology to study such
brains has been possible for some time, the prohibitive costs involved are
probably responsible for the use of such techniques in very few studies.
The current study utilises the latest neuroradiological techniques of
computed tomography (CT) and magnetic resonance imaging (MRI) to provide a
non-invasive and harmless method of investigating dolphin and human brains,
with a focus on the neocortex. In addition to scanning freshly obtained dolphin
subjects, the brains of several subjects were frozen, defrosted and re-scanned to
ascertain whether or not defrosted material could be reliably scanned to increase
the sample size.
The specimen data have been studied in relation to broader population
parameters established using cranial volume analysis (CVA). This has been
done in order to address any concerns about the representativeness of the
neuroimaging sample. CVA has also been used to extend the application of the
neuroimaging findings to a wider spectrum of species and also serves as a
comparison with the MRI findings.
If the data in the present study are supportive of the hypothesis that large
dolphin neocortex ratios are related to sociality to a greater extent than to
foraging ecology, several implications arise. The notion that primate and human
neocortical evolution share a unique relationship with sociality can be refuted.
This in turn leads one to question the premise that social intelligence is the sole
domain of humans, with its beginnings in primate relatives.

13
4. Structure of thesis
This thesis assesses the relative neocortex size of dolphins and the
correlates thereof in comparison with the findings for humans and other
primates. The implications of the study for the theory of social intelligence and
mental evolution are also discussed.
CHAPTER 2 provides an assessment of brain size and relative neocortex
size in dolphins and humans using the neuroimaging techniques of CT and MRI.
The brain volume relationships in dolphins from CT and MRI are documented.
The effect of specimen condition on the MRI process is described. The
relationship between CT and MRI is also documented. Finally, human MRI
neuroanatomical data are provided.
CHAPTER 3 discusses the use of cranial volume analysis (CVA) to verify
the suitability of the sample used for neuroimaging in terms of representing the
wider population. The relationship between cranial volume and neuroanatomical
data from neuroimaging is also used to estimate the neuroanatomical values for
CVA subjects. This provides an extension of the study to other delphinid and
odontocete species.
CHAPTER 4 considers the relationship of foraging ecology and relative
neocortex size in dolphins. The ecological theory and variables relevant to
dolphins are reviewed, prior to the presentation and discussion of the results and
the implications thereof.
CHAPTER 5 describes the relationship of relative neocortex size and
acoustics in dolphins. Dolphin sound production and sonar are reviewed prior to
providing the results and their illustration.
CHAPTER 6 investigates the relationship of sociality and relative
neocortex size in dolphins. The social organisation of the study species and the

14
selected variables are described, following which, the findings of neocortex in
relation to sociality are presented and discussed.
CHAPTER 7 serves as a general discussion of the findings and a
summary of the thesis. Concluding comments are made regarding the
implications of the study, its limitations and future directions for research.
The format of the thesis follows the publication manual of the American
Psychological Association (4th Ed.), in accordance with the guidelines specified
by the School of Psychology, at the University of Natal, Pietermaritzburg. For
ease of reference, a table of abbreviations has been included as an appendix to
the study.

15
Chapter 2: An assessment of brain size and relative neocortex volume
in dolphins and humans using neuroimaging
1. Introduction
Since classical times, a wealth of investigations have been conducted into
the anatomy of the brain and its evolution, often in relation to its increasing size
or organisational complexity (Klinowska, 1994). The initial drive behind studies of
brain size, such as that of Dubois (1897), pertained to the comparative
assessment of animal "intelligence", which was inferred from the greater
interactions associated with larger brains (Armstrong, 1985; Radinsky, 1982).
Potential selective mechanisms related to the evolution of large or complex
brains have formed the focal point of many such enquiries. Some of the key
issues in this research are largely addressed by comparative analysis. From this
perspective, an overview of evolutionary neuroanatomy and brain size in
mammals is provided, prior to reviewing the use of neuroimaging technology to
engage in such studies.
1.1. Evolutionary neuroanatomy and brain size in mammals
Comparative analysis allows for the distinction of and appreciation of the
adaptive benefits of similar and different cognitive capacities (Povinelli, 1993;
Tschudin, 1998). From an evolutionary perspective, comparative analysis is
enabled through phylogenetic reconstruction, which in turn relies on evolutionary
neuroanatomy. This specifically involves the study of comparative anatomy,
embryology, ontogenesis and palaeontology. Within evolutionary neuroanatomy,
correlative neuroanatomy is of interest, as it relates the structural organisation of
the brain to its functioning. Researchers have either developed absolute or
relative measures of brain size from this frame of reference (Dunbar, 1992;
Jerison, 1973; Passingham, 1982; Sawaguchi and Kudo, 1990; von Bonin,
1937). The current section discusses neuroanatomy and measures of relative
brain size (RBS) in primates, other terrestrial mammals and cetaceans. The

16
advantages and limitations of these studies are subsequently assessed in
chapter 7 (section 7.2).
Increasing interest has been shown in evolutionary analysis, from which
evolutionary neuroanatomy has arisen (Kesarev, 1971). Within the paradigm of
evolution, Haeckel's triad is considered important for any attempts at
phylogenetically reconstructing brain development (Kesarev, 1971), as it
proposes that the findings of comparative anatomy, embryology, ontogeny and
palaeontology be synthesised. The final element of the triad (ontogeny and
palaeontology) is not evident with respect to the brain. For this reason, it is
essential to compare the human cortex to the cortices of other related and
unrelated species to understand brain evolution (Kesarev, 1971; Tschudin,
1998).
It is in the light of the above literature on comparative neuroanatomy and
theories of brain evolution that attempts have been made at measuring
dimensions of the brain and its regions. A brief overview of investigations into
brain size for primates and dolphins is provided.
The absolute size of the brain (ASS) is not adequate for comparative
analysis, as it favours larger animals, who require bigger organs to permit
efficient functioning (Passingham, 1982). Given this, it is not surprising that large
megaherbivores and cetaceans possess the largest absolute brain size. As a
result of this shortcoming, it was suggested that interspecific comparison could
be achieved by employing a simply derived ratio, relating brain size to body size
(brain weight over body weight), although this ratio has been argued to favour
smaller animals (Stephan, Bauchot and Andy, 1970). Passingham (1982) noted
that the larger animals have smaller brain/body ratios, as an increase in brain
size is relatively smaller than an increase in body size. Such a relative increase
only allows valid comparisons between similar sized species.

17
To overcome the difficulties inherent in absolute brain size, it has been
suggested that the brain size and body weight of a species group be studied in
relation to each other (Jerison, 1973). From logarithmic transformations of these
variables, the best line of fit between brain and body size for the group can be
derived. This permits interspecific analysis of brain size based solely on body
weight (Passingham, 1982).
Von Bonin (1937) formulated the cephalisation coefficient, an equation
correlating body weight and brain weight. He concluded that brain weight
increased as the 0.655th power of body weight, with interspecific variation in the
coefficient. Based on this measure, Jerison (1973) derived the EQ, which
consists of scaling the observed brain size of each species to the expected brain
size of an average mammal, similar in body weight. As the original slope of the
EQ has been held to overestimate brain size in large mammals and
underestimate it in small mammals, the equation has been refined several times
(Clutton-Brock and Harvey, 1980; Eisenberg, 1981; Martin, 1990).
Using the EQ, human brain size may be compared to a "hypothetical
relative", by reading the brain size predicted for a hypothetical primate of similar
body weight from the regression line. According to this measure, human brain
size is three times larger than expected for a primate of similar size
(Passingham, 1982).
Several mammalian groups can be differentiated into three classes of Ea.
These include insectivores and rodents, who have small brains relative to weight;
ungulates, carnivores and prosimians with moderately sized brains; and finally
simians and humans, who have large brains. Thus although the absolute brain
size of the elephant is greater than that of primates, its Ea is within the range of
ungulates and carnivores (Passingham, 1982). The data of Jerison (1973)
indicate that only 3 out of 25 ungulates and 2 out of 15 carnivores hold an Ea
within the range of 48 simian primates.

18
While a fair amount of encephalisation research has been undertaken with
primates (Clutton-Brock and Harvey, 1980; Gould, 1975; Jerison, 1973, 1979;
Jungers and Olson, 1985; Martin, 1990), less work has been conducted with
insectivores and bats (Stephan, 1985), carnivores and ungulates (Gittleman,
1986; Martin, 1981; Pirlot, Jiao and Xie, 1985). Similarly, a relative shortage of
research exists concerning the encephalisation of non-terrestrial mammals,
especially with respect to sirenians (Kamiya, Pirlot and Hasegawa, 1985) and
cetaceans (Marino, 1996, 1997, 1998; Worthy and Hickie,1986).
The comparative lack of dolphin studies is surprising if one considers that
their neuroanatomical features have intrigued researchers from the time of
Belon, in 1551, to the present (Kruger, 1966). Cetaceans, along with certain
megaherbivores such as the elephant, possess the largest absolute brain size
(Passingham, 1982). The Delphinidae family includes species such as the
bottlenose dolphin, which hold the greatest brain to body size ratios amongst
cetaceans (Ridgway, 1990). According to Jerison (1982b), certain cetaceans, in
common with humans, possess the highest relative brain size to body weight
ratio.
In opposition to Count (1947), the findings of Elias and Schwartz (1969)
suggested that cetaceans have the most convoluted brains of all species.
Certain dolphins have the largest cortical surface area. For example, the average
bottlenose surface area was calculated as 3745cm2 (Ridgway and Brownson,
1984), as opposed to the human average at 2275cm2 (Elias and Schwartz,
1969). Several cetaceans also have longer gyri as a function of brain size than
humans (Elias and Schwartz, 1971; Jerison, 1982a; Ridgway, 1986b).
In spite of the interesting proposals that have been made by researchers
within the above frame of reference, there are complications with brain size per
se. For example, Stephan, Frahm and Baron (1981) proposed that
considerations of size might lead to the determination of the functional

19
significance of cerebral areas in different species. Although their suggestion has
drawn support, their method of relating brain size to body weight for interspecific
comparison via allometric scaling has been criticised. Although allometry, as "the
study of the relationship between size and adaptation", appears to be the
method of choice for such investigations (Fleagle, 1985:1), it is subject to several
considerable limitations.
Allometric scaling that relates brain size to body size depends on a power
relationship between the two variables, which requires that the species points fall
on a straight line (Byrne, 1995). Although logarithmic plots provide straight lines
for species groups, Deacon (1990) suggests that the relationship may be a
curvilinear function. In addition, Martin (1990) notes that allometry is based on
the premise that some standard allometric value applies to all species under
comparison and that an appropriate baseline is chosen to compare species.
From the description of EO above, it was reported that the residuals
(deviations from the line of best fit) were important. An animal placed above the
line was more encephalised than expected and, conversely, one below the line
was less encephalised than expected. However, Byrne (1995) argues that there
is no theoretical basis for the above reasoning, suggesting that this type of
scaling makes a strong assumption about the functioning of neural tissue,
namely that more is better. Although the brain does cope with sensorimotor
inputs and outputs, it also has additional processing capacity for computational
intelligence, something that has been marginalised in allometric studies (Byrne,
1995).
Although the general method used in the above gross brain size studies
appears not to be as satisfactory as once believed, the criticism of these studies
can be extended to their specific measures, such as the EO. Several limiting
factors exist with respect to the interpretation of EO values. The EO relies on
body weight, which is considered to be a confounding variable (Barton and

20
Dunbar, 1996), as changes in body size need not be accompanied by changes in
brain size (Deacon, 1990b). It follows that specific changes within the brain, for
example, in neocortex, occur fairly independently of body size, which diminishes
the usefulness of the EO (Dunbar and Bever, 1997).
Without establishing a certain degree of maturation, it is very difficult to
determine an accurate EO. The inability to determine the exact age of cetacean
specimens is therefore problematic. A related issue is that immature animals
have larger relative brain sizes than mature individuals (Count, 1947) and it has
been suggested that EO decreases as body length increases (Ridgway, 1986a;
Ridgway and Brownson, 1984). Nevertheless, in ~pite of these reservations,
contemporary studies of dolphin brain size have continued to use the EO
(Marino, 1996, 1997).
Measures that focus either solely on the absolute size of the brain, or
even on the size of the brain relative to the body are considered simplistic, as
they do not take the differentiation within the brain into account. Bearing these
limitations in mind, the discussion focuses on the brain in its own right and
considers more appropriate measures of relative brain size and the importance
of the neocortex.
The first precursor of modern variables to take account of this variation in
relative brain size may have been the measurement of brain size relative to
spinal cord by Warden (1951). He proposed that a relative ratio, such as brain
weight to spinal cord, might allow for a standard of comparative intelligence
across mammals. Following this method, Ridgway et al. (1966) found that
whereas fish have a brain weight less than the cord, horses score approximately
2.5:1, cats 4 or 5: 1, apes 8: 1 and humans 50: 1; the average brain-spine weight
ratio for bottlenose dolphins is 40: 1. The importance of this study appears to lie
in the ranking of the odontocetes between humans and the apes, as subsequent

21
studies have verified this as being a common pattern for cetacean and primate
comparisons (Marino, 1996, 1997).
The brain is divided into three basic areas, namely the hindbrain or
rhombencephalon, midbrain or mesencephalon and forebrain or telencephalon
(Nauta and Feirtag, 1986). In general terms, the hindbrain houses the
cerebellum, which is covered with cerebellar cortex. The base of the forebrain
houses the thalamus, with thalamic nuclei relaying sensory information to the
neocortex.
Brain size could therefore be more directly related to a measure of brain
input and output, such as medulla size, which would provide an indication of the
additional brain tissue not required for sensory analysis or directed movement
(Passingham, 1982). However, the problem with this technique has been the
absence of such area measurements for different species (Passingham, 1982).
To be more specific in terms of interspecific brain differences, an
interesting pattern is evident from comparative indices of different brain parts.
While the human pons and medulla are of an expected size for a primate of our
size, there is a fair enlargement of the midbrain (mesencephalon), interbrain
(diencephalon) and the striatum (in the telencephalon) compared to other
primates (Passingham, 1982). The greatest difference occurs in cortical areas
that diminish, such as the piriform cortex (palaeocortex), hippocampal cortex
(archicortex) and cerebellar cortex and those that expand, such as the neocortex
(Nauta and Feirtag, 1986).
Jerison (1982a) realised the significance of the cortex and related its
surface area to possible processing capacity. Each square centimetre of cortex
is said to contain, on average, 2000 processing units or modules. According to
this study, a mouse with a 4cm2 cortex possesses 8000 modules, a chimpanzee
with 800cm2 has 1.6 million modules and a human with 2000cm2 cortex has the
highest capacity at 4 million modules (Jerison, 1982a).

22
Following the method of Jerison (1982a), the dolphin, with a 3000cm2
cortex, would obtain the highest result of all mammals, at 6 million processing
units. However, in spite of this large cortical area, dolphins display half the
cortical thickness of humans (Kesarev, 1971; Ridgway and Brownson, 1982).
Whereas the dolphin has a larger cortical surface area than the human brain, it
has only 80% of the average human cortical volume, according to an estimate
from Ridgway (1986a). This led him to verify the finding of Haug (1970), that
Tursiops scores below humans and above terrestrial mammals with high
encephalisation. However, data cited in this regard must be treated with caution,
as Ridgway's estimate was drawn from an immature specimen.
Remaining with the cerebral cortex, the neocortex (often vaguely referred
to as cortex) covers the cerebral hemispheres (Passingham, 1982). The cerebral
hemispheres range from being small in lower vertebrates to large in higher
mammals (Nauta and Feirtag, 1986). The main cerebral areas of the human
brain may be defined as follows: neocortex (new cortex), archicortex (old cortex),
intermediate cortex, palaeocortex (primitive cortex) and peripalaeocortex
(Kesarev, 1971; Nauta and Feirtag, 1986). Contrasting features are traced
between the oldest cortex (palaeocortex) and youngest differentiated formations
(neocortex). While the palaeocortex regresses during evolution, the neocortex is
the most recent to appear and the last to conclude its development in humans
(Kesarev, 1971; Nauta and Feirtag, 1986).
Joseph (1996) notes that the brainstem, which has retained its
specialisation for receiving information from the immediate environment, can be
contrasted with the forebrain, which is associated with cognition, emotion,
memory and the evolution of the neocortex. The evolution of primary, association
and tertiary neocortex therefore conferred a considerable advantage to
mammals, who could "engage in multimodal sensory analysis and information
storage" and outwit the competition (Joseph, 1996:30).

23
Different neocortical areas perform specialised functions (Martin, J.H.,
1981). Sensory cortex receives sensory information via the thalamus, from motor
areas controlling movement and from association areas which appear essential
to learning (Johnson, 1997). Crude divisions exist between three types of areas;
koniocortex in the sensory areas, agranular cortex in the motor and premotor
areas and eulaminate cortex in the association areas. Although the human brain
has the expected amount of sensory cortex, it is distinguished by the extent of
the agranular cortex and the association areas. For example, the premotor
cortex is especially large in humans (Johnson, 1997; Passingham, 1982). The
importance of the neocortex is apparent. As it can be distinguished from other
types of cerebral cortex and as its importance in higher functions has been
recognised, the neocortex forms the centre for interspecific comparison
(Passingham, 1982).
Two recent measures have taken cognisance of the relevance of the
neocortex and have been specifically aimed at its structure. These are the
relative size of neocortex (Sawaguchi and Kudo, 1990) and the neocortex ratio
(Dunbar, 1992, 1995).
The relative size of the neocortex (RSN) was initially measured by
Sawaguchi and Kudo (1990), to assess the degree of neocortical development in
each superfamily of primates. RSN is based on the allometric relationship
between neocortex volume and brain weight for each superfamily. Using
regression analysis to obtain the equation for each superfamily, Sawaguchi and
Kudo reported that RSN, for a congeneric group, appears independent of the
effects of brain and body size. However, this research used a very broad level of
analysis, namely the superfamily, rather than the more particular genus or
species.
The final measure of RBS and the most important one for the purposes of
this study is the neocortex ratio (Dunbar, 1992). This ratio relates neocortex

24
volume to the rest of the brain at the genus level and serves to separate the
rather loosely defined volume of neocortex from the rest of the brain, or hindbrain
(Dunbar, 1992). In terms of the importance of the neocortex (Passingham, 1982),
this method was considered to be the most appropriate for a true indication of
relative neocortical importance at the more distinctive genus level.
Although this measure is not subject to the same allometric critique as
other brain size indices, it may have potentially problematic definitional issues.
Aside from the inconsistent usage of the term neocortex, the definition of specific
brain regions is problematic. For example Dunbar (1992) includes the
mesencephalon and diencephalon as parts of the hindbrain, whereas these
regions are thought to lie in the midbrain and forebrain respectively (Kolb and
Whishaw, 1990). Although the neocortex ratio is considered to be more accurate
as a measure of the brain than its brain size-body size counterparts, such as the
EO, it still relies on the assumption that intelligence is localised in the neocortex
(Syrne, 1995).
The neocortex ratio has been documented for many mammalian genera
representing several orders (primates: Dunbar 1992, 1995; hominids: Aiello and
Dunbar, 1993; insectivores and carnivores: Dunbar and Sever, 1997). From this
comparative research, primates appear to be distinguishable from other orders of
mammals on the basis of their large neocortex ratios. As the relative importance
of the neocortex has been noted above, the consequences of possessing large
neocortices become highly consequential in relation to ecological,
communicative, social and intellectual functioning (refer to Chapters 4-7).
It is therefore surprising that there· is an absence of dolphin neocortex
data comparable to primates. This is particularly the case if one considers that
Kruger (1966) observed the most striking feature of the cetacean brain as being
the size of the cerebral cortex and the large extent of its fissurization. This was of
comparative importance, as the cerebral cortex is thought to be related to

25
intelligence (Kruger, 1966). Yet, although absolute brain size values have been
obtained and dolphin encephalisation studied, no examination of relative
neocortical importance has been conducted with these animals.
One reason for this omission may be the scarcity of cetacean subjects in
scientific studies, something that is especially apparent with respect to brain
research. For example, in a recent article, Ridgway (1986a) had to rely on
secondary sources for data (Kojima,1951; Pilleri and Gihr, 1971; Ridgway and
Brownson, 1984). Furthermore, large interspecific variation in delphinid brain size
was reported by Ridgway and Brownson (1984).
This chapter therefore aims to provide the first study of relative neocortex
size in dolphins, with a special emphasis on establishing neocortex ratios for
members of the delphinid family.
1.2. The use of neuroimaging in behavioural, psychological andneuroanatomical research.
The above section has addressed the content of what this chapter aims to
study, while the current section reviews the method to be used in the
investigation of the brain. A brief review of the use of neuroimaging in
behavioural, psychological and neuroanatomical research is provided in order to
provide the methodological context of the current study.
Neuroimaging techniques, specifically computerised tomography (CT)
scanning and magnetic resonance imaging (MRI), have developed into powerful
sources of investigation in several disciplines. Aside from the utility and value of
the standard application of CT and MRI to medical studies of pathology and
surgery, several alternate applications are possible. These alternatives hold
much potential for inter-disciplinary investigations. The use of neuroimagery in
behavioural, psychological and neuroanatomical research encompasses diverse
disciplines such as psychiatry, psychology, anatomy and histology, physiology,

26
pharmacology, biology, veterinary science and biomedical research. From the
literature, it is apparent that these techniques are under-utilised for research, in
spite of their great scientific potential.
Computed tomography and nuclear magnetic resonance (the forerunner
of MRI) were pioneered during the 1970s by AlIan Cormack and Godfrey
Hounsfield (see Cormack, 1980; Hounsfield, 1980). As an enhanced form of x
ray tomography, CT has been an important innovation in the medical field for
over the past two decades and has served to assist in increasing the efficiency of
radiology (McCort, 1987). Although surgical and pathological applications are not
the focus of this topic, it is important to note that CT permits the most accurate
diagnosis of all imaging methods in head, spinal and pelvic injuries and allows
for faster surgical intervention and reduced fatalities (McCort, 1987). For these
reasons, the popularity of CT scanning increased throughout the 1980s, (Evens
and Mettler, 1985; Steinberg, Anderson and Steinwachs, 1987). As the more
recent and enhanced technique of MRI has similar clinical applications to CT, it
may be reasonable to expect a related increase in MRI units by the year 2000.
In a similar vein to the popularity of CT, the demand for MRI is steadily
increasing (Evens and Evens, 1991). For example, MRI referrals in the U.S.A are
twice as high as in an economically comparable country such as Japan, even
though Japanese fees are substantially lower (Hisashige, 1994). From this, it
appears as if neuroimaging techniques are potentially overutilised for medical
referrals in some countries, when they could be more appropriately shared and
invested in research applications.
From an examination of the literature, it was found that CT and MRI were
almost exclusively used for the detection and diagnosis of pathology, injuries or
in the assistance of surgical treatment. Only a handful of articles pertained to
behaviour or psychology and these dealt with psychological reactions when
confronted with MRI. Almost all of the behavioural articles related to organic

27
disorders, pre-, intra- and post-operative findings. No topics related to behaviour
per se, in terms of motor responses, and no cognitive or perceptual applications
were found.
Investigations of human social behaviour using CT and MRI, from their
inception to current times, all appear to relate to psychiatric disorders and
psychopathology. Searches of the mainstream neuroimaging literature therefore
indicate that CT and MRI have not been used extensively in behavioural and
psychological research. However the literature examined excluded fMRI, or
functional MRI, which is gaining popularity for a wide spectrum of research.
All the documented cases of animal behaviour research using CT relate
either to pharmacological, neurophysiological or neuropsychological effects on
animals. For the past decade, MRI investigations in this area have all related to
lesions, surgical observations and chemical experimentation. Only one
documented case exists relating to actual animal behaviour. Repeated open-field
and passive avoidance tests were administered to rats by Ossenkopp, Innis,
Prato and Sestini (1986), who concluded that there was no evidence for short or
long term behavioural alteration in animals exposed to MRI.
Whereas the above section has focused on behavioural applications of
neuroimaging, the following discussion studies the use of such techniques in
comparative neuroanatomical research.
Although research in this area is scarce, it may hold potential for future
comparative studies. Ruff (1989) suggests that comparative image analysis,
including computerised tomography, provides important information on structural
evolution. An example stems from the use of high-resolution CT scanning for the
examination of the vestibular system of certain extant and extinct primates
(Spoor and Zonneveld, 1995; Spoor, Wood and Zonneveld, 1994). From this
research, the earliest species reflecting modern human morphology appears to

28
be Homo erectus, in contrast with southern African crania, attributed to
Australopithecus and Paranthropus, that relate more closely to the contemporary
great apes (Spoor, Wood and Zonneveld, 1994). This illustrates the value of
neuroimaging techniques such as CT and supports the introduction, albeit
cautiously, of imaging workstations into the field of computer-aided primatology
(Vannier and Conroy, 1989).
Documented primate MRI research has related predominantly to the
visual cortex (Engel et al., 1994; Rizzo, Nawrot, Slake and Damasio, 1992). As
with CT in this field, MRI studies relating to behaviour or anatomy are extremely
rare.
A large amount of research related to the current field of interest is
documented in the discipline of veterinary science. Although the majority of the
articles pertain to surgical treatment and the diagnosis of pathology, some
articles relate directly to neuroanatomy. Examples from CT include the in vivo
cephalic scanning of the chimpanzee (Saban et al., 1985) and the neurology of
small animals (Lang, Huber and Vandevelde, 1988). Principles of CT and MRI
usage in such areas have been proposed by Wortman (1986) and the
interpretation of relevant images is discussed by Stickle and Hathcock (1993).
Neuroimaging applications are far more scarce for marine mammals than
for terrestrial mammals. With the exception of Sebes, Langston, Gavant and
Rothschild (1991), all studies have been anatomical. The first use of CT with
delphinids was to observe acoustic structural anatomy in the forehead of spinner
dolphins (Cranford, 1988). CT was also used in the determination of airsacs in
the dolphin species Lagenorhynchus albirostris (Brouwers, Kaminga, Klooswijk
and Terry, 1990) and the acoustics of Delphinus delphis (Aroyan, Cranford, Kent
and Norris, 1992). Cranford, Amundin and Norris (1996) used CT and MRI to
study the odontocete nasal complex in relation to biosonar signal production.

29
In spite of a lack of general information about comparative
neuroanatomical studies using CT or MRI, a search was made for the more
specific study of the cerebral cortex and neocortex using these techniques. None
of the investigations relating to mammalian cerebral cortex in general, nor
particularly to primates and dolphins had been conducted using CT or MRI. It
therefore appears reasonable to conclude that a minority of studies into
comparative neuroanatomy have been carried out using neuroimaging
techniques. However, an example of such a study is the volumetric
measurement of the amygdala and hippocampus using MRI (Watson,
Andermann, Gloor and Jones-Gotman, 1992). Using the MRI technique, it was
found that the volume of the amygdala and 90-950/0 of the hippocampal volume
could be reliably measured. Guidelines obtained from studies such as the above
are not only useful for understanding pathogenesis, but also indicate the
accuracy of MRI in vOlumetric analyses.
An important potential of neuroimaging techniques lies in their ability to
broaden our understanding of structural evolution. In terms of animal research,
MRI is a more favourable application than CT, as it does not expose the animal
to radiological effects. As MRI is non-invasive and non-lethal, it should be
considered ahead of other potentially inhumane research methods.
MRI has increased rapidly in its popularity and applicability during the last
decade and along with CT holds much potential for future research. A shortage
exists in the behavioural, psychological and neuroanatomical applications of
structural CT and MRI, although functional MRI (fMRI) is a highly efficient
research tool. Very few studies have been conducted into social and animal
behaviour using structural neuroimaging methods.
The current study aims to harness the techniques of CT and MRI to
provide the first documented data, using neuroimaging, on cranial capacity, brain
volume, neocortical volume, brainstem volume and cerebellar volume in

30
dolphins. In addition, the suitability of frozen and defrosted brain material for
neuroimaging analysis was assessed. Neocortex ratios were also calculated for
humans using neuroimaging to permit comparison with the existing literature
(Dunbar, 1992; Dunbar, 1995).

31
2. Method
2.1. Study location
This study was conducted along the coastline of the province of KwaZulu
Natal, South Africa. The coast measures approximately 560 kilometres, running
from the boundary of Mozambique (26°52'S/32°54'E) to the border of the
Eastern Cape Province (31 °05'S/30°11 'E) (Figure 2.1).
Martin and Fleming (1988) describe the coastal belt of southern Africa as
having formed during the splitting off of the continents, beginning during the
Jurassic and Early Cretaceous Periods. The narrow continental shelf off the
KwaZulu-Natal coast is the result of shearing off from the Falkland plateau. The
warm, southward flowing Agulhas current runs off this shelf, influencing the
composition of the coastal waters, physically and biologically (Fleming and Hay,
1988; Schumann, 1988a). The water temperature ranges from approximately
22°C in winter to 26°C in summer (Heydorn et al., 1978; Schumann, 1988a). The
KwaZulu-Natal coastline has a semi-diurnal tidal cycle, ranging from 1m at neap
to 2m at spring tide, while experiencing vastly changeable surf conditions and
large swells (South African Navy Hydrographer).
The climate of KwaZulu-Natal's coastal belt is humid and subtropical
(Schumann, 1988b), with most of the province's rain falling during the summer
months, from November to March (Hunter, 1988). The surface salinity of the
Agulhas current ranges from 35,2 to 35,4 °100 , and averages 35,3°100 , although
inshore salinity is affected by river run-off, with this decreasing after the summer
rains (Pearce, 1973; Van Der Elst and Fennessy, 1990). Inshore turbidity is also
heightened during the summer, as the rains transport silt from the rivers into
estuaries and the inshore zone (Martin, 1987). Heydorn et al. (1978) propose
that coastal low pressure systems cause a current reversal, during which the
Agulhas current switches to a northerly flow and then reverts to its usual course.

32
However, Schumann (1988b) suggests that wind force and potential shelf waves
may cause this phenomenon. Such changes in shelf water movements are
believed to be a major factor in determining faunal movements in local waters
(Heydorn et al., 1978).
The ichthyofauna of KwaZulu-Natal mainly comprises tropical Indo-Pacific
species, occurring seasonally, with tropical species more evident in summer,
while winter species are both endemic and migratory (Van Der Elst, 1988).
Winter migrants from the Cape head north to spawn in sub 21 °C waters, bringing
with them predatory sharks, dolphins and game fish (Van Der Elst, 1988). This
initiates the most popular event on the local fishing calendar, colloquially termed
the annual "sardine run".
During the 1950s, a series of shark attacks along the KwaZulu-Natal
coastline resulted in the installation of anti-shark netting at Durban and at
selected beaches along the coast (Davies, 1964; Davis, Cliff and Dudley, 1989).
The gillnets used in the fishery of sharks protect bathers by decreasing the
number of human-shark interactions (Dudley and Cliff, 1993), which stems from
the diminished prevalence of larger sharks off popular bathing areas (Van Der
Elst, 1979). The 1960s and 1970s witnessed a sharp escalation in the number of
netted areas (Cliff, Dudley and Davis, 1988) and a dramatic decline in the
number of large sharks off the coast. Nets are currently installed at 40 selected
beaches along the 326km coastline between Richards Bay and Mzamba (Figure
2.1).

NATAL
(1,-
O,)~
;~\
~
~~
too~oo
_0'
Figure 2.1: The KwaZulu-Natal coastline, indicating netted beaches and in
parentheses, the length of nets in km. Beaches are numbered
from north to south.

34
Dudley and Cliff (1993) note that the current number of large sharks
captured annually ranges from 1200-1400 animals. However, in addition to the
capture of sharks, other species of marine life are also caught in the gillnets,
including batoids, sea turtles, teleosts and dolphins (Cockcroft, 1990a; Dudley
and Cliff, 1993). Cockcroft (1990a) notes that the following species form the
majority of dolphin catches in the shark nets, namely the common dolphin
De/phinus de/phis, at 460/0 of all annual cetacean captures, the bottlenose
dolphin Tursiops truncatus, at 42% and finally, the humpback dolphin Sousa
chinensis, at 10%. While the effect of the net captures on pelagic, migrant
common dolphins is not considered to be significant (Cockcroft, 1990a) , this is
not true concerning the bottlenose and humpback species. Populations of these
two species inhabit the inshore waters of KwaZulu-Natal all year round and are
relatively low (Cockcroft, Ross and Peddemors, 1990). This, in addition to their
significant isolation may cause population depletion and subsequent
unsustainable losses (Cockcroft, 1990b; Dudley and Cliff, 1993; Durham, 1990;
Peddemors, 1993). The ecological ramifications of netting are a source of
concern and controversy (Peddemors, 1995).
Additionally, several specimens were obtained from animals that stranded
along the beaches of KwaZulu-Natal during the course of this study (Table 2.1).
These inevitably represented offshore cetacean species not normally accessible
for sampling.
2.2. Study animals
2.2.1. Odontocetes
Several species of the order Cetacea, more specifically from the suborder
Odontoceti (toothed whales), were used in this study. The odontocete
information is presented in Table 2.1. The three major species on which the
study (especially the CT and MRI component) is based are the bottlenose

35
dolphin Tursiops truncatus, the common dolphin Delphinus delphis and the Indo
pacific humpback dolphin Sousa chinensis (Table 2.1). While it has been
mentioned that these three species comprise the greatest number of dolphin
catches in the shark nets along the KwaZulu-Natal coast, they also have a
significantly divergent range of social structure and dietary composition, which
makes them suitable for testing the hypotheses in question (Tschudin, 1995;
Tschudin, Daji, Henzi, Peddemors and Royston, 1996).
Other cetacean indicator species for which actual brain volume data were
obtained include the dwarf sperm whale Kogia simus, Fraser's dolphin
Lagenodelphis hosei, Risso's dolphin Grampus griseus, the spotted dolphin
Stenella attenuata and the striped dolphin Stenella coeruleoalba (Table 2.1).
2.2.2. Humans
To enable a comparison of this study's findings to previously documented
data for primates and humans (Stephan, Frahm and Baron, 1981) used in
Dunbar's initial primate neocortex volume analysis (1992), live human subjects
were scanned using MRI. The subjects were all volunteers with knowledge of the
MRI procedure, who gave their informed consent to participate in the study. All of
the subjects were sexually mature, with no known brain pathology and both
sexes were scanned in equal numbers. There are no known documented or
foreseeable harmful consequences of human subjects' participation, as MRI is a
popular non-invasive, diagnostic technique commonly used throughout the world.
The use of MRI with both dolphins and humans enables a standard method of
comparison, as opposed to reliance on the secondary data from manual
dissections as used previously (Stephan, Frahm and Baron, 1981). The human
species data are thus also included in Table 2.1.

Table 2.1: Specimen information
Subject tag #1 length weight sex2 age sexual methodS venue6
(cm) (kg) (yr.)3 maturittbot 1 ban 28 205 90 m i MRI JRIbot 2 bri 59 250 186 f s MRI JRIbot 3 bri 60 220 140 f s MRI JRIbot 4 gle 9 239 160 m s MRI WHbot 5 mg60 206 105 f i C/M WHbot 6 mg 61 190 80 m i C/M WHbot 7 mg69 235 152 m s FOM JIWbot 8 rb 69 235 160 f s FOM JIWbot 9 san 9 226 153 f s C/M JIW
bot 10 to 15 234 208 m s FOB WHbot 11 to 16 243 190 m s FOB WHbot 12 umd46 220 118 f s MRI JRIbot 13 ban 22 226 170 m s CT WHbot 14 uvo 29 200 94 m i CT WHbot 15 dur244 214 114 f s MRI JRIbot 16 umh 140 240 186 m s MRI JRIcam 1 ama 119 241 156 m s FOM JRIcam 2 ans 67 240 164 m s FOM JRIcam 3 ans 68 219 99 f s MRI JRIcam 4 bal25 180 74 f i MRI JRIcam 5 bal28 210 82 m s MRI WHcam 6 bri 58 235 120 f s FOM JRIcam 7 bri 62 213 90 f s MRI JRIcam 8 dur232 221 120 f s MRI WHcam 9 dur233 223 120 f s MRI WH
cam 10 dur250 236 118 f s MRI JRIcam 11 mbg 19 236 140 m s MRI JRIcam 12 sun 19 190 58 f i MRI JRIcam 13 umh 125 243 147 m s MRI JRIcam 14 umh 128 245 142 m s MRI JRIcam 15 umh 129 242 162 m s MRI JRIcam 16 zin 18 239 140 m s FOM JRIcam 17 win 11 239 140 m s CT WHhum 1 rb 56 206 100 m i MRI JRIhum2 rb 70 208 110 m s MRI JRIhum 3 rb 71 227 140 m s MRI JRIhum4 rb 72 225 132 m s MRI JRIhum 5 seo 37 202 118 f MRI JRIhum6 zin 15 220 120 m s FOM JRIhum 7 zin 16 254 210 m s FOM JRIhum 8 rb 47 220 140 f s C/M JIWspa 1 kzn9605 221 80 m s MRI JRIspa 2 swd 157 37 m i MRI JRIstr 1 Isc s 146 32 f i MRI JRIfra 1 mg 72 219 110 f i MRI JRIris 1 Isc s 330 m s MRI JRI
dwa 1 durs 198 106 m i MRI JRI
36

37
Table 2.1/ ctd
subject tag #1 length weight sex2 age sexual methodS venue6
(cm) (kg) (yr.)3 maturity4hss 1 zb 85 m 46 s MRI JRIhss 2 z5 66 m 24 s MRI JRIhss 3 z4 50 f 23 s MRI JRIhss4 z 50 f 42 s MRI JRIhss 5 zm 56 f 52 s MRI JRIhss 6 zr 52 f 44 s MRI JRIhss 7 z8 60 m 25 s MRI JRIhss 8 z270 75 m 37 s MRI JRIhss 9 zp 75 m 38 s MRI JRI
hss 10 zk 85 f 40 s MRI JRI
Note: 1source of dolphin specimen; 2f-female, m-male; 3humans only; 4S_ sexually
mature, i- immature; 5CT- computed tomography, MRI- magnetic resonance
imaging, FDM- frozen and defrosted scans using MRI, FDB- frozen and
defrosted scans using both CT and MRI; 6JRI- Jackpersad, Rooknoodeen Inc.,
WH- Wentworth Hospital, JIW- Jackpersad and Wentworth.
2.3. Apparatus and image processing
2.3.1. Computed tomography (CT)
In November 1885, Wilhelm Roentgen detected a new form of radiation
and by 1896 x-rays were documented (Schenck and Leue, 1991). Just past its
centenary, the discipline of radiology has progressed rapidly. Conventional
radiography involves emitting a beam of x-rays that pass through the body.
Differential attenuation occurs with different tissues. The ray then interacts with
the screen and the image is captured, exposed and developed (Chynn and
Finby, 1982). Where attenuation is high, for areas with a higher density and
atomic number (bone), few photons pass through the object and the image is
clear or white. Where attenuation is low (fluid), for areas with a lower density and
atomic number, many photons pass through the object and the resultant image is

38
dark or black (Chynn and Finby, 1982). A limitation of conventional radiography
is that it is a two-dimensional projection of a three-dimensional object (Barnes
and Lakshminarayanan, 1989). Another problem with conventional radiography
is that one structural shadow can be imposed on another. Conventional
tomography aims to resolve this problem, by mechanically manipulating images
to allow visualisation of a slice or plane of interest. This is achieved by blurring
out irrelevant areas. In contrast to conventional tomography, CT radiates only the
slice or plane of interest, by special collimation, and not the entire body (Chynn
and Finby, 1982). This allows for better demonstration of slice anatomy (Barnes
and Lakshminarayanan, 1989).
CT scanning projects a narrow beam of x-rays onto the head, allowing the
transmission of x-ray photons in the layers of interest. A series of slices is taken
at successive intervals, whereafter the photon data is computed and the density
information converted to a visual image of the internal structure of the brain. CT
thus represents 'a marriage of conventional x-ray equipment with modern
computers' (Chynn and Finby, 1982:3). CT scans in the current study were
performed using the Picker PO 2000 unit at Wentworth Hospital, Durban (Figure
2.2).

39
Figure 2.2: Picker PO 2000 eT Unit.

40
2.3.2. Magnetic resonance imaging (MRI)
MRI is very different from CT scanning and other conventional
radiographic procedures, as it does not use x-rays. Although the images
produced by MRI resemble CT and ultrasound images, the process of MRI is
completely different from CT. Whereas a radiographic image is based on the
attenuation of x-rays by a body and requires ionising radiation, MRI is based on
the interaction of atomic nuclei, located in a magnetic field, with electro-magnetic
energy at a radiofrequency (Lee, Koehler and Heiken, 1989; Philips, 1984).
Wehrli (1991) has proposed that the most substantial difference between MRI
and CT is the extraordinarily large contrast inherent in MRI when compared to
CT. Nuclear magnetisation depends on the ability of an object to produce a
magnetic field at a distance. This magnetic moment of single nuclei has
magnitude and direction (Dixon, 1989). Each stable element has a stable isotope
with a magnetic nucleus (except for argon and cerium). Hydrogen has a proton
as its nucleus and this proton has spin and is charged, which is essential for the
process of MRI (Dixon, 1989).
The use of a high magnetic field permits the alignment of certain atomic
nuclei, usually hydrogen protons, with the axis of spin in the direction of the field.
A radiofrequency applied perpendicular to the fields alters the angle of spin
(Heiken and Brown, 1991). This applied energy results in excitation of the
protons, which produces a set of signals (Sigal, 1988). In other words, the return
to equilibrium upon termination of the radiofrequency pulse is associated with the
emission of a radiofrequency characteristic of the element and its physico
chemical environment.
The signal is dependent on three parameters, namely proton density (the
number of protons in volume unit) and the T1 (spin-lattice) and T2 (spin-spin)
relaxation times, or the time for protons to return to equilibrium after excitation
(Sigal, 1988). In MRI, gradient magnetic fields in three directions allow for spatial

41
detection of data and a two-dimensional image to be formed (Heiken and Brown,
1991). The high degree of correlation between magnetic resonance images and
their corresponding anatomical sections has been recognised through
comparative research (Flannigan, et al., 1985)
MRI procedures were performed using two different units. These were the
Siemens Magnetom Impact Scanner (1 Tesla Unit) at Advanced Imaging
Services, St Aidan's Hospital, Durban (Figure 2.3) and the General Electric Sun
Signa Scanner (1.5 Tesla Unit) at Wentworth Hospital, Durban (Figure 2.4). MRI
on dolphins was conducted using both units, while human imaging was only
conducted at Advanced Imaging Services.

42
Figure 2.3: Siemens Magnetom Impact MRI Scanner.

43
Figure 2.4:" General Electric Sun Signa MRI Scanner.

44
2.4. Procedure
Comparative and correlative neuroanatomy provides an appropriate
background for contextualised brain research. A limitation within this approach
has been that the majority of tools of analysis have been provided by histology
or cytoarchitectonics. The application of these techniques to comparative studies
and the potential thereof have been discussed in section 1.2 of the current
chapter and have been reviewed elsewhere (Tschudin, Hurribunce and
Peddemors, 1998).
2.4.1. Dolphins
A standard procedure was used with respect to the investigation of all
dolphin subjects in the neuroimaging component of the study. Dolphin
specimens were collected from the shark nets, using the following procedure:
The nets are checked for catches on an average of 17 days per month (Figure
2.5), with catches identified by trained field staff from the Natal Sharks Board
(NSB) and subsequently delivered to NSB headquarters in Umhlanga Rocks,
KZN, for research and dissection (Peddemors, 1995). Deceased stranded
animals and subjects from Seaworld, Durban, were also delivered to NSB
headquarters for dissection. Carcasses were weighed and measured prior to
dissection. The head of each specimen was then removed from the top of the
spinal cord (Figure 2.6). Several of the specimens available for research could
not be scanned immediately. These had to be cold stored in a freezer at
approximately minus 20 degrees Celsius, thawed out and subsequently
scanned.

45
Figure 2.5: NSB crew inspecting the nets off Durban Bay. '

46
Figure 2.6: Removal of specimen head following dissection.

47
As dolphin specimens are rarely acquired, it was considered necessary to
establish whether such specimens could be reliably used in the analysis, or
whether freezing and defrosting might have altered the volumes and ratios to a
significant extent. To this end, four bottlenose, two common and two humpback
dolphins were scanned fresh, then frozen, defrosted and re-scanned for
examination. The effects of the use of specimens post mortem, in terms of tissue
degeneration, freezing and defrosting are discussed below in section 2.3.3 and
have also been documented by Tschudin, Hurribunce and Peddemors (1998).
From the inception of the study, all specimens were sealed in plastic bags,
to prevent any possible contamination of the scanning units (Tschudin et al.,
1996). All specimens were identifiable by means of two plastic tag numbers, one
attached through the mouth and the other to the outside seal of the bag. At the
scanning units, the heads were either placed on a specially constructed foam
mould or propped up with supports to stabilise them for scanning.
For CT scanning, the heads were positioned in a prone, 'tail-first' position.
Fresh and defrosted specimens were subjected to the scanning procedure and
photographed in the coronal plane. On completion of the sequence, the areas
above and below the tentorium, supra- tentorium (SV) and infra- tentorium (IV)
respectively, were calculated by tracing each slice with a digitiser. These areas
house the cerebral cortex and the posterior fossa respectively. A 3-D statistical
measurement was applied using the Picker Voxel Q applications package to
calculate the volumes of respective regions. The tentorial areas were combined
to calculate overall total brain volume (TBV). Cranial volume (CV) was also
calculated from these slices through the inclusion of fluid and ventricular
volumes.
At AIS, the same procedure was used for MRI as for CT scanning, while at
Wentworth, the specimens were positioned 'head-first' when scanned. The
images were viewed in all three planes, namely axial, coronal and sagittal. In

48
addition to viewing total brain volume (TBV), it was possible to image the
neocortex volume (NV), and the posterior fossa volume (PV), which comprised
cerebellar volume (CBV) and brainstem volume (BV).
2.4.2. Humans
The human subjects used in the MRI component of the study were all
aware of the nature of the investigation and gave their informed consent to
participate. To assist in image analysis, their age, sex and weight details were
recorded (Table 2.1). After the removal of any magnetisable metallic accessories
which could potentially interfere with the scanner's magnetic field (such as
watches and jewellery), subjects were placed in the 'scanning unit and prepared
for the scanning procedure.
2.4.3. Image analysis
For comparative purposes, only the coronal images were analysed. The
cerebral cortex, mid-brain and cerebellum were traced on both MRI machines,
using a digitiser. Image reconstruction is based on the Fourier transform.
According to this, the data from the received signal is the input, which leads to
the output of a graph or digital representation of the frequency components of
the signal (Joseph, 1991).
At Wentworth, the General Electric software package, "Advanced
Windows", was used to calculate the volume of the different brain areas and the
total brain volume. At AIS, the volumes were calculated according to the
modified Cavalieri Principle (Solomon and Henneberg, 1992) whereby the
separate slices were added before multiplying slice areas by slice thickness
added to interslice gap:
Tv =(T-L)Ax (St + Ig) + LA x St

49
where Tv = total volume, TA = total area, LA = area from last slice, 8t =
slice thickness and Ig = interstice gap. In calculating the volume of the last slice,
the interslice gap was excluded to improve the accuracy of the estimation.
The neocortex ratio (CR) was calculated from the following equation
(Ounbar 1992):
CR =NVI (TBV - NV)
where NV =neocortex volume (cerebral cortex volume, cf Passingham, 1982);
TBV = total brain volume;
2.4.4. Comparison of CT and MRI
CT and MRI display different types of images of the brain. CT scans
display air as black in colour, tissues as various shades of grey and bone as
white. Although MRI images also depict air as black in colour and tissues as
degrees of grey, this technique does not detect bone.
CT provides imaging of gross brain morphology and lacks the finer
differentiation possible with MRI. Whereas the coronal plane of CT only allows
discrimination between the supratentorial and infratentorial cortical volumes
(Figure 2.7, marked as A and B respectively), the MRI coronal permits distinction
between cerebral cortex (C) and the posterior fossa, comprised of the brainstem
(0) and the cerebellum (E) (Figure 2.8). In addition to coronal imaging (the only
plane possible using CT), MRI viewing in sagittal and axial planes allows for the
detection of finer structures, for example the medulla (F) and corpus callosum
(G) from the sagittal plane (Figure 2.9) and the differences between left and right
hemispheres from the axial plane (Figure 2.10, marked as Land R respectively).

50
note: A- supra-tentorial volume, B- infra-tentorialyolume.
Figure 2.7: Coronal image from CT.

51
note: C- cerebral cortex/neocortex, D- brainstem, E- cerebellum
Figure 2.8: Coronal image from MRI.

52
Figure 2.9: Sagittal image from MRI.

53
Figure 2.10: Axial image from MRI.

54
2.4.5. Reliability
An alpha reliability of 0.969 was obtained from the repeated trackballing of
15 MRI coronal images, which indicates that this method was sufficiently
accurate for the purposes of this study.
2.4.6. Data presentation and analysis
All of the data were entered, sorted and analysed using SPSS for
Windows (SPSS, Version 6.1, 1995). Results were accepted as significant at an
alpha of .05.

55
3. Results
The results from CT, the initial method of investigation, are discussed prior
to the findings from the more advanced technique of MRI. After discussing the
general findings from each method for relative brain volumes and ratios, the
distinctive results from each technique are presented. Following this, cross
technique relationships between CT and MRI are explored.
3.1. Neuroanatomical volumes and ratios using CT
CT was the first technique employed in the study. Neuroanatomical
volumes and ratio values were obtained for individu~1 dolphins using this method
(Table 2.2). In addition to the calculation of brain and regional volumes for all CT
specimens, cranial volume was also obtained for four specimens (Table 2.2).
This was done to permit further analysis with inclusion of odontocete crania from
the PE Museum (Chapters 3-6).
Table 2.2: Dolphin neuroanatomical volumes and ratios from CT
subject cranial brain volume1 supratentorial infratentorial neocortexvolume1 volume1 volume1 ratio
BOT 5 1166.55 1162.69 900.34 262.35 3.43
BOT 6 1298.41 1294.78 1052.51 242.27 4.34
BOT 9 2280.32 1838.02 442.31 4.16
BOT 10 1392.37 1374.31 1053.44 320.87 3.28
BOT 11 1514.24 1489.81 1190.23 299.58 3.97
BOT 13 2286.60 1766.94 319.32 3.40
BOT 14 2398.20 1941.10 457.10 4.25
COM17 1748.00 1369.88 378.12 3.62
HUM18 2122.67 1567.84 554.89 2.83
note: 1 cm3

56
Although there was not a large range of difference between the maximum
and minimum values for cranial volume, a different situation existed with respect
to the total brain volume data, where large range, standard deviation and co
efficient of variation values were evident (Table 2.3). While the supratentorial
volumes were slightly less diverse than the total brain volumes, the infratentorial
volumes were much more uniform (Table 2.3). The neocortex ratio presented the
smallest variance (Table 2.3).
Table 2.3: Summary statistics of dolphin neuroanatomical volumes and ratios
from eT
variable min. max. range mean Std Std variance NDev. Error (c.O.V.)2
cranial 1166.55 1514.24 347.69 1342.89 147.06 73.53 21627.79 4volume1 (16.105)
total brain 1162.69 2398.20 1235.51 1781.65 469.74 156.58 220659.32 9volume1 (123.851)
supra- 900.34 1941.10 1040.76 1408.92 384.41 128.14 147771.68 9tentorial (104.883)volume
infra- 242.27 554.89 312.62 386.31 113.05 37.68 12780.41 9tentorial (33.083)volume
neocortex 2.83 4.34 1.52 3.70 .51 .17 .26 9ratio (0.070)
note: 1cm3; 2co-efficient of variation;
As the eT analysis was almost exclusively based on bottlenose dolphins,
species level data were calculated for bottlenose dolphins (Table 2.4). While
there were fairly large standard deviations in brain size and regional brain
volumes, the neocortex ratio appeared to be the most homogenous value (Table
2.4).
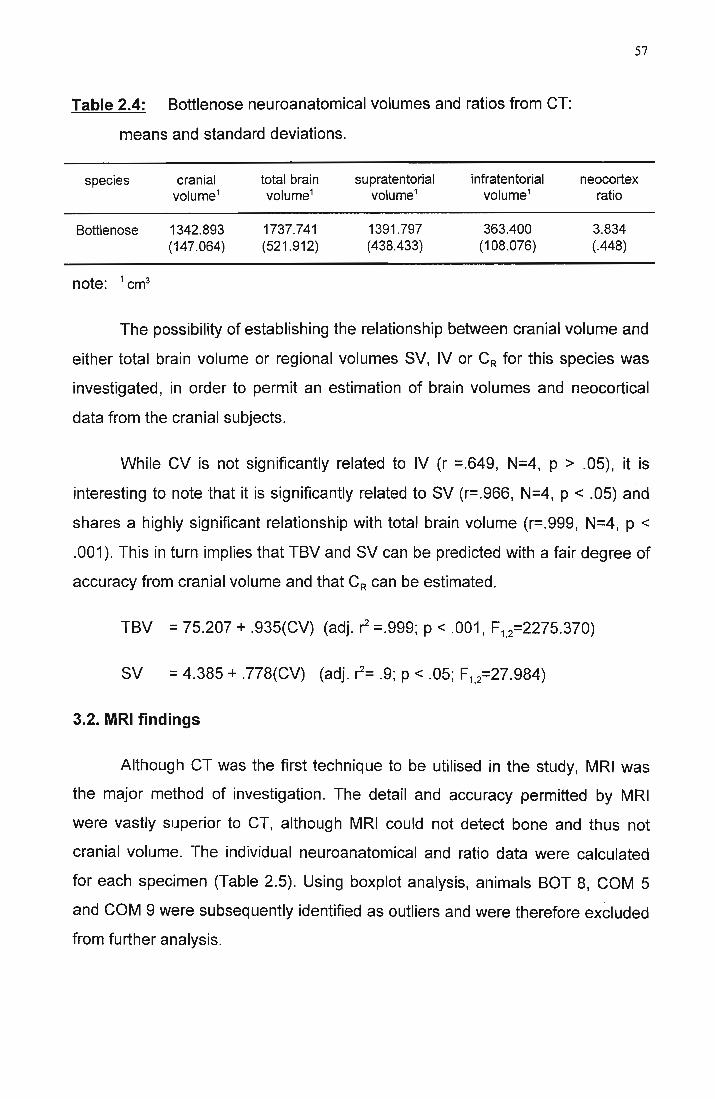
57
Table 2.4: Bottlenose neuroanatomical volumes and ratios from CT:
means and standard deviations.
species cranial total brain supratentorial infratentorial neocortexvolume1 volume1 volume1 volume1 ratio
Bottlenose 1342.893 1737.741 1391.797 363.400 3.834(147.064) (521.912) (438.433) (108.076) (.448)
note: 1 cm3
The possibility of establishing the relationship between cranial volume and
either total brain volume or regional volumes SV, IV or CR for this species was
investigated, in order to permit an estimation of brain volumes and neocortical
data from the cranial subjects.
While CV is not significantly related to IV (r =.649, N=4, P > .05), it is
interesting to note that it is significantly related to SV (r=.966, N=4, p < .05) and
shares a highly significant relationship with total brain volume (r=.999, N=4, p <
.001). This in turn implies that TBV and SV can be predicted with a fair degree of
accuracy from cranial volume and that CR can be estimated.
TBV = 75.207 + .935(CV) (adj. r =.999; p < .001, F1•2=2275.370)
SV = 4.385 + .778(CV) (adj. r= .9; p < .05; F1,2=27.984)
3.2. MRI findings
Although CT was the first technique to be utilised in the study, MRI was
the major method of investigation. The detail and accuracy permitted by MRI
were vastly superior to CT, although MRI could not detect bone and thus not
cranial volume. The individual neuroanatomical and ratio data were calculated
for each specimen (Table 2.5). Using boxplot analysis, animals BOT 8, CaM 5
and CaM 9 were subsequently identified as outliers and were therefore excluded
from further analysis.

58
Table 2.5: Odontocete neuroanatomical volumes and ratios from MRI.
Subject total brain neocortex posterior fossa brainstem cerebellum neocortexvolume1 volume1 volume1 volume1 volume1 ratio
BOT 1 1419.42 1120.68 298.74 35.16 263.58 3.75
BOT 2 1553.76 1241.22 312.54 41.94 270.60 3.97
BOT 3 1492.62 1176.90 315.72 38.94 276.78 3.73
BOT 4 1340.20 1077.80 262.40 27.10 235.30 4.11
BOT 5 1075.30 868.40 206.90 33.50 173.40 4.20
BOT 6 1202.10 993.00 209.10 14.30 194.80 4.75
BOT 7 1356.66 1029.56 327.11 77.31 249.80 3.15
BOT 8 1428.97 1021.99 406.98 74.61 332.37 2.51
BOT 9 1387.60 1091.30 296.34 40.24 246.10 3.68
BOT 10 1269.40 1009.20 260.20 15.30 244.90 3.88
BOT 11 1457.10 1195.30 261.80 41.70 220.10 4.57
BOT 12 1210.66 948.96 261.65 32.85 228.80 3.60
BOT 15 1544.76 1240.80 303.96 38.28 265.68 4.08
BOT 16 1539.12 1225.50 313.62 36.30 277.32 3.91
COM 1 968.76 746.76 222.00 30.60 191.40 3.36
COM2 1037.46 805.26 232.20 48.18 184.02 3.47
COM3 830.22 651.90 178.32 25.02 153.30 3.67
COM4 858.70 680.10 178.60 23.30 155.30 3.81
COM5 916.70 784.00 132.70 16.10 116.60 5.91
COM6 1035.30 799.80 235.50 32.40 203.10 3.40
COM7 1005.72 805.86 199.86 29.88 169.98 4.03
COM8 904.60 749.40 155.20 15.20 140.00 4.83
COM9 906.70 758.10 148.60 17.40 131.20 5.10

59
subject total brain neocortex posterior fossa brainstem cerebellum neocortexvolume1 volume1 volume1 volume1 volume1 ratio
COM10 988.86 772.44 216.42 32.28 184.14 3.57
COM 11 1004.64 794.46 210.18 32.34 177.84 3.78
COM12 904.20 714.80 189.40 21.10 168.30 3.77
COM13 885.36 678.60 206.76 26.16 180.60 3.28
COM14 913.02 712.98 200.04 28.20 171.84 3.56
COM15 1162.08 894.30 267.78 34.50 233.28 3.34
COM16 1003.62 808.08 195.54 23.70 171.84 4.13
HUM 1 1296.40 987.80 308.60 40.30 268.30 3.20
HUM2 1355.64 1078.56 277.08 3.89
HUM3 1326.24 1037.40 288.84 34.26 254.58 3.59
HUM4 1386.36 1111.62 274.74 35.70 239.04 4.05
HUM5 1230.40 949.00 281.00 38.40 243.00 3.38
HUM6 1326.60 1027.44 299.16 45.60 253.56 3.43
HUM7 1468.32 1142.76 325.56 42.96 282.6 3.51
HUM7 1318.03 1035.71 282.32 32.83 249.5 3.67
SPO 1 1005.20 784.20 221.00 42.10 178.90 3.55
SP02 562.40 439.30 123.10 25.60 97.50 3.57
STR 1 665.80 525.40 140.40 43.80 96.60 3.74
FRA 1 1112.28 877.02 235.26 40.68 194.58 3.73
RIS 1 1572.54 1245.66 326.88 36.78 290.10 3.81
DWA1 463.80 381.30 82.50 24.10 58.40 4.62
note: 1cm3

60
As expected, the largest degree of variance was evident with respect to
brain volume, followed by neocortical volume, cerebellar volume and finally
brainstem volume (Table 2.6). Once again, the minimal degree of variance using
the neocortex ratio is noteworthy, considering that the sample size is almost five
times larger than the eT sample (refer to Table 2.2, section 3.1).
Table 2.6: Summary statistics of odontocete neuroanatomical volumes and
ratios from MRI.
variable min. max. range mean std S.E.dev.
brainstem 14.30 77.31 63.01 34.12 12.85 1.96volume1
cerebellum 58.40 332.37 273.97 207.65 59.68 9.10volume1
posterior fossa 82.50 406.98 324.48 242.56 66.93 10.09volume1
neocortex 381.30 1245.66 864.36 909.56 215.50 32.49volume1
total brain 463.8 1572.54 1108.74 1152.13 275.30 41.50volume1
neocortex ratio 2.51 5.91 3.40 3.83 .57 .09
note: 1cm3; 2co-efficient of variation
variance N(c.o.v.2)
165.06 4(4.838) 3
3561.93 4(17.154) 3
4479.33 4(18.467) 4
46440.4 4(51.058) 4
75787.49 4(65.780) 4
.33 4(.086) 4
The three major species of interest in the study were also those for which
the greatest number of specimens were sampled. The bottlenose dolphins
appear to have the greatest variation in terms of brain volume, neocortex volume
and posterior fossa volume, or the combination of brainstem and cerebellar
volumes (Table 2.7). Regarding variation in total brain volume and posterior
fossa volume, they are followed by common dolphins and finally humpback
dolphins. Where neocortical variation is concerned, humpback dolphins display
greater diversity than common dolphins. It is intriguing that common dolphins

61
appear to have a substantially higher variance in the neocortex ratio than other
species, although bottlenose dolphins display the most variance for
neuroanatomical data. Furthermore, although bottlenose dolphins have the
highest volume of neocortex, common dolphins have the highest neocortex
ratios, followed by bottlenose and humpback dolphins respectively.
Table 2.7: Species neuroanatomical volumes and ratios from MRI: means
and standard deviations.
species total brain neocortex posterior brainstem cerebellum neocortexvolume1 volume1 fossa volume1 volume1 ratio
volume1
Bottlenose 1376.976 1088.615 288.361 39.109 249.252 3.834(144.833) (116.648) (50.962) (17.881 ) (38.861) (.448)
Common 957.871 759.803 198.069 27.272 170.796 3.938(83.710) (61.775) (34.615) (8.271 ) (28.142) (.736)
Humpback 1338.499 1046.286 292.163 38.578 255.796 3.590(69.289) (63.300) (17.720) (4.682) (15.086) (.277)
note: 1cm3
Only the three species of interest were sampled in large enough numbers
to permit generalisation to the species level (for further details, refer to section
3.4 below). A series of independent samples t-tests did not reveal any significant
departures from normality or homogeneity of variance between different
subgroups, whether analysing male versus female (Table 2.8) or sexually mature
versus immature animals (Table 2.9). Consequentially, the total number of
animals from each species has been included in further analysis.

62
Table 2.8: Summary of t-test statistics for MRI male and female samples.
variable species t- value (d.f.) 2-Tailed Sig. variance
brainstem bottlenose .42 (9) n.s equal
volume common -.99 (12) n.s equal
humpback -1.11 (3) n.s
cerebellum bottlenose 1.49 (9) n.s equal
volume common -.91 (12) n.s equal
humpback -.39 (3) n.s
posterior fossa bottlenose 1.22 (9) n.s equal
volume common -.98 (12) n.s equal
humpback -.48 (4) n.s
neocortex bottlenose -.14 (12) n.s equal
volume common -.65 (12) n.s equal
humpback -.82 (4) n.s
total brain bottlenose .61 (9) n.s equal
volume common -.91 (12) n.s equal
humpback -.09 (4) n.s
neocortex ratio bottlenose -1.14 (12) n.s equal
common .56 (12) n.s equal
humpback -.85 (4) n.s
note: n.s- not significant

63
Table 2.9: Summary t-test statistics of MRI data for sexually
mature/immature subjects.
variable species t- value (d.t.) 2-Tailed Sig. variance
brainstem bottlenose -1.28 (12) n.s equal
common -.92 (14) n.s equal
humpback .40 (4.82) n.s unequal
cerebellum bottlenose -2.22 (12) <.05 equal
common -.47 (14) n.s equal
humpback -.01 (5) n.s equal
posterior fossa bottlenose -2.18 (12) n.s equal
common -.60 (14) n.s equal
humpback .23 (6) n.s equal
neocortex volume bottlenose -1.69 (12) n.s equal
common -1.60 (14) n.s equal
humpback -2.86 (6) <.05 equal
total brain volume bottlenose -0.91 (12) n.s equal
common -1.43 (14) n.s equal
humpback -2.20( 6) n.s equal
neocortex ratio bottlenose 1.41 (12) n.s equal
common -.29 (14) n.s equal
humpback -2.21 (6) n.s equal

64
As the other particular delphinid and more general odontocete specimens
in the study do not exceed two animals per species, they are merely included in
the analysis as indicator points, potentially representative of these other species.
Due to the importance of estimating neocortex ratios from brain volumes
for different species, it is was essential to test for significant differences between
species. Although no such differences were found to exist in terms of neocortex
ratios, there are notable differences in brain volumes (Table 2.10).
Table 2.10: Kruskal-Wallis test for significant differences between the
neuroanatomical volumes of the major study species.
variable chi-squared value dJ. significance
Neocortex volume 26.95 2 <.001
posterior fossa volume 22.501 2 <.001
total brain volume 27.159 2 <.001
Many researchers may have access to specimens, but not to scanning
facilities, hence suitable formulae were derived to assist in calculating NV from
TBV. Because of the interspecific neuroanatomical differences (Table 2.10),
correlations and regression equations for the relationship between TBV and NV
have been calculated for each species. As might be expected, TBV is strongly
correlated with NV in bottlenose dolphins (r=.947, N=14, p<.001), common
dolphins (r=.931, n=16, p<.001) and humpback dolphins (r=.968, n=8, p<.001).
Regression statistics for the estimation of MRI neocortex volume from
total brain volume in the major study species are provided below:
a) bottlenose
NV=38.757 +.762(TBV) (adj.r2= .888, F1,12= 103.567, P < .001)

65
b) common
NV= 101.937 + .687(TBV) (adj.r2=.857, F1,14=90.59, p < .001)
c) humpback
NV= -137.931 + .885(TBV) (adj. r2=.928, F1,6=90.564, P < .001)
3.3. Effect of dolphin specimen condition using MRI
Following the scanning of fresh, frozen and defrosted dolphin brains,
pictures of varying image quality were obtained according to the condition under
which the specimen was scanned (Figure 2.11 ).There were no significant
differences between the paired fresh and defrosted variables (Table 2.11). This
suggests that defrosted material can be accurately used in the analysis.
Table 2.11: Effects of freezing and defrosting on neuroanatomical data and
correlation coefficients of fresh and defrosted neuroanatomical data.
Variable pair Paired t-test Pearson'sco-efficient
(fresh and defrosted) t- value p (2- Tailed) r (N=10) p (2- Tailed)(dJ. =9)
brainstem -.39 n.s -.005 n.s
cerebellum -.87 n.s .892 <.01
posterior fossa .82 n.s .812 <.01
neocortex volume -.43 n.s .925 <.001
total brain volume -.01 n.s .964 <.001
neocortex ratio .59 n.s .400 n.s

67
3.4. Human neuroanatomical data using MRI
The main focus of this chapter of the study has been on establishing brain
volumes and neocortex ratio values in dolphins. However, for comparison, a
human MRI convenience sample was obtained (Table 2.12).
Table 2.12: Human neuroanatomical volumes and neocortex ratio from
MRI.
subject total brain neocortex volume1 posterior fossa volume1 neocortex ratiovolume1
HaM 1 1596.18 1418.40 177.78 7.98
HOM2 1491.90 1300.20 191.70 6.78
HOM3 1327.32 1139.58 187.74 6.07
HOM4 1261.62 1083.18 178.44 6.07
HOM5 998.34 843.24 155.10 5.44
HOM6 1234.02 1046.64 187.38 5.59
HOM7 1536.42 1334.82 201.60 6.62
HaM 8 1262.28 1131.18 131.10 8.63
HOM9 1413.66 1222.50 191.16 6.40
HaM 10 1160.30 1006.20 154.14 6.53
Following the calculation of summary statistics for human brain volume
data, it was evident that there is not much difference in variation between total
brain volume and neocortex volume (Table 2.13). The most significant finding is
the mean neocortex ratio of 6.609. Additionally, the wide range of neocortex
ratio values extends from 5.44 to 8.63. It is apparent that humans have a larger
standard deviation than that calculated for dolphins.

67
3.4. Human neuroanatomical data using MRI
The main focus of this chapter of the study has been on establishing brain
volumes and neocortex ratio values in dolphins. However, for comparison, a
human MRI convenience sample was obtained (Table 2.12).
Table 2.12: Human neuroanatomical volumes and neocortex ratio from
MRI.
subject total brain neocortex volume1 posterior fossa volume1 neocortex ratiovolume1
HOM 1 1596.18 1418.40 177.78 7.98
HOM2 1491.90 1300.20 191.70 6.78
HOM3 1327.32 1139.58 187.74 6.07
HOM4 1261.62 1083.18 178.44 6.07
HOM5 998.34 843.24 155.10 5.44
HOM6 1234.02 1046.64 187.38 5.59
HOM7 1536.42 1334.82 201.60 6.62
HOM8 1262.28 1131.18 131.10 8.63
HOM9 1413.66 1222.50 191.16 6.40
HOM 10 1160.30 1006.20 154.14 6.53
Following the calculation of summary statistics for human brain volume
data, it was evident that there is not much difference in variation between total
brain volume and neocortex volume (Table 2.13). The most significant finding is
the mean neocortex ratio of 6.609. Additionally, the wide range of neocortex
ratio values extends from 5.44 to 8.63. It is apparent that humans have a larger
standard deviation than that calculated for dolphins.

68
Table 2.13: Summary statistics of human neuroanatomical data and
neocortex ratios from MRI.
variable min. max. range mean Std Std Error variance NDev. (C.O.V)2
total brain 998.34 1596.18 597.84 1328.204 183.762 58.111 33768.552 10volume1
neocortex 843.24 1418.40 575.16 1152.594 171.379 54.195 29370.789 10volume1
posterior 131.10 201.60 70.50 175.614 21.953 6.942 481.924 10fossa
volume1
neocortex 5.44 8.63 3.191 6.609 1.002 .317 1.004 10ratio
note: 1cm3; 2co-efficient of variation;
A series of t-tests was conducted in order to determine whether or not
there were significant differences between male and female human subjects, in
terms of brain volumes or the neocortex ratio. Male displayed substantially larger
total brain volumes, neocortex volumes and neocortex ratios than females (Table
2.14). The only variable for which the values were similar was the posterior
fossa, while the only significant difference, taking type 1 error rate into account,
was evident in the neocortex volume (Table 2.14).
Table 2.14: Summary of t-test statistics of male/female human
neuroanatomical data and neocortex ratios from MRI.
variable t- value (d.f.) 2-Tailed Sig. variance
total brain volume -3.27 (8) <.05 equal
neocortex volume -3.67 (8) <.01 equal
posterior fossa volume -.42 (8) n.s equal
neocortex ratio -2.82 (5.55) <.05 unequal

69
3.5. CT-MRI relationships
As CT and MRI are both neuroimaging techniques and as CT is more
accessible than MRI, the study sought to establish the relationship between the
two techniques. To enable a comparison of techniques and estimation of MRI
values from CT, the correlation between cranial volume, the unit of analysis
exclusively available from CT, and MRI values was studied. This was believed to
be important, as cranial data from CT, fossil records or skull collections can be .
used to estimate MRI values with reasonable accuracy. Although not significantly
related to posterior fossa volume and neocortex ratio (p > .05), CV is significantly
related to the MRI values of TBV (adj. r2 =.963, F12=78.876, p <.05) and NV (adj.
r2=.899, F12=27.765, P <.05). This is important for the purposes of this study, as
TBV and NV are required for CR estimation (Le. CR = NVfTBV). From the
regression data of the linear relationships between the above variables, MRI
estimates from CT have been calculated:-
TBV = -185.061 + 1.069(CV)
NV = -172.309 + .885(CV)
As cranial volume is also available from other techniques (refer to Chapter
3), the capacity to estimate brain and neocortical volumes with accuracy is
essential to increasing sample size and statistical power.

70
4. Discussion
A review of the use of CT and MRI neuroimaging techniques indicated
that this is the first attempted application of neuroimaging to the present topic of
study. The neuroimaging techniques of CT and MRI were both successfully used
to examine dolphin and human neuroanatomical regions. This has resulted in the
first established set of data on delphinid neocortex ratios and data on revised
human neocortex ratios.
The current findings support the proposal that CT can be applied to large
samples and to rare or precious anthropological specimens, as it is non
destructive, efficient and easily performed (Spoor and Zonneveld, 1995). As a
consequence of this non-invasiveness and efficacy, CT has become the
preferred initial imaging procedure (Anderson and Berland, 1989).
MRI has been the major technique used in this chapter. The many
advantages of MRI include the provision of detailed information and the
possibility of longitudinal studies without any harmful consequences (Wolf et al.,
1992). Although MRI is an expensive technique, it is the least invasive and most
humane method for animal experimentation, in addition to being the most precise
technique presently available for analysis. The CT and MRI analysis of a number
of subjects representing several dolphin species resulted in several original
discoveries. Although notable differences exist between dolphin species for the
different neuroanatomical regions, as indicated by Kruskal-Wallis tests (section
3.2), bottlenose, humpback and Risso's dolphins possess large brain volumes
that fall within the human range. MRI calculations also showed that these three
species exhibited large neocortex volumes.
The above findings of relatively large brains and neocortices in dolphins
might provide a new standard of comparison with simian primates. The brain
appears to be the only organ better developed in simian primates than in other
land mammals, as other simian organs are not significantly different in their

71
relative size compared to other terrestrial mammals (Passingham, 1982; Stahl,
1965).
However, it is evident that absolute brain size (whether total brain size or
total neocortex size) is biased towards certain animals. Therefore possession of
large or small brains might not be of such great importance. Even measures that
relate brain size to body size or that adopt allometric scaling for their analysis are
fraught with difficulties. For example, the Ea cannot detect subtle or specific
changes, such as the relative expansion of the neocortex. When this is taken into
account, it is clear that the significance of general brain expansion has been
exaggerated. For reasons such as these and following the fact that gross brain
size reveals nothing about the finer differentiation of brain regions, this study
elected to use an alternative measure of relative importance, the neocortex ratio.
Bearing in mind the prominence of the neocortex and its evolution, the
neocortex ratio was chosen as the best relative index to use for comparison, as it
has been documented for different mammals. Several original findings for
dolphin neocortex from this study must be related to other mammalian data.
Comparison of the neuroanatomical findings and ratio values of the major
study species, namely bottlenose, common and humpback dolphins highlighted
several factors: Whereas the bottlenose possessed the largest brain volume,
followed by the humpback and finally the common dolphin, the pattern differed
for neocortex volume, where the bottlenose dolphin was followed by the common
dolphin and finally the humpback dolphin. However, perhaps the most
substantially different pattern was evident with respect to the neocortex ratio,
where common dolphins superseded bottlenose dolphins and humpback
dolphins respectively. This provides support for the suggestion that absolute
volumes are not always indicative of relative importance and may distort findings.
A comprehensive series of t-tests (section 3.2) demonstrated that no
significant differences in neuroanatomical regions or brain size were apparent

72
based on sex or sexual maturity within each dolphin species. In addition, a
striking result relates to the condition of the specimen being scanned. A series of
paired t-tests revealed that defrosted brain material did not differ materially using
MRI and as a consequence of this, such material could be included in the
analysis (section 3.3). The findings addressed in this paragraph were crucial, as
they permitted the use of a larger sample size through the inclusion and
combination of fresh and defrosted material from male and female, mature and
immature animals.
The greatest progression in the mammalian eNS is evident in the cortical
formations of the telencephalon. Where sensory and functional systems have
changed anatomically, they have transformed cortical formations with specialised
functions (Kesarev, 1971).
Passingham (1982) has described the "extraordinary development" of the
neocortex and cerebellum as best characterising their specialisation. Eccles
(1973) recognises that the neocortex and cerebellum are closely related, with the
neocortex receiving fibres from the cerebellum via the thalamus and returning
fibres to the cerebellum via the pons. However, the neocortex, as the most
phylogenetically recent cortex, is associated with complex cerebral activity, such
as integrative and analytical functions. These higher mental functions are
historically believed to be present only in humans (Kesarev, 1971).
The proportion of neocortex to total brain size in primates increases as
brain size increases. The size of the human neocortex is as expected for a
primate of our size, while the size of the association cortex in humans is as
expected given the amount of neocortex. It follows that the design of the human
brain is in keeping with the pattern of simian primates and, more specifically, the
great apes.
From the mean values obtained at the species level, it is apparent that
dolphins have large neocortex ratios when compared with other mammalian

73
orders. The dolphin ranges were from 2.83 to 4.34 with CT and from 2.51 to 5.91
using MRI. Although there may be a fair degree of variance in brain size and
neocortical size, the scores for the neocortex ratio are homogenous across
species.
Out of the total MRI sample, only three specimens scored neocortex ratios
lower than the average for the human's closest relative, the chimpanzee (mean =3.22). Bearing in mind that one of these animals was an outlier and considered
as an extreme value, the comparative significance of dolphin neocortex ratios
should not be underestimated.
Previous research on the CR (Dunbar, 1992, 1995) has supported the
notion that human neocortical variance is predictable in terms of the pattern
expected for higher primates, but not for mammals in general, who differ in brain
size-neocortical relationships (Passingham, 1982). The predictability of human
brain structure, given its size, is apparent in terms of the number and density of
nerve cells present in the neocortex (Jerison, 1973). The findings of the current
study support the assertion that the sizes of dolphin brain structures are more
predictable than for those of humans, as dolphins display lower variance than
humans.
It has been suggested that mammalian brains may share the same basic
building blocks, as they display a comparable number of cells in similar cortical
bands (Passingham, 1982). This makes the comparison of the neocortex ratio
between dolphins and primates more relevant, as they share a common
mammalian heritage (Chapter 1).
That the dolphin possesses the greatest area of neocortex for species
tested to date (including humans), might lead one to argue that it is "the summit
of creation, the highest achievement of nature in the sense of progressive
development of the central nervous system" (Kesarev, 1971 :53). However, this

74
would be a misconception, as solely quantitative considerations do not suffice for
assessments of the level of brain organisation or complexity.
The brain organisation of the dolphin has been defined as paradoxical
(Deacon, 1990), on account of its superiority to humans in neocortex, yet inferior
finer structural organisation to humans (Glezer, Jacobs and Morgane, 1988;
Morgane, Jacobs and Galaburda, 1986a, 1986b). The low amount of paleocortex
in dolphins may be due to more than mere telencephalic organisation, as in
dolphins the olfactory analyser, located in the paleocortex, may be totally absent.
As the cortical structures become more differentiated, the neocortical structures
become more complex and specialised, while increasing in thickness. Although
dolphins have the most convoluted brains and the largest relative brain size, they
display the same cortical thickness as found in dogs, whereas humans have
significantly larger thickness in both motor and limbic areas (Kesarev, 1971).
For evolutionary neuroanatomical analysis, a reciprocal relationship has to
be demonstrated between the structural principles of cerebral organisation and
the variation in the functional systems of the organism. Briefly, as described
above (in Chapter 1, section 1.1), the development and formation of the standard
mammalian neocortex occurred in a terrestrial environment, significantly different
from water. The complete secondary return of cetaceans to water is a feature
unique amongst mammals. This, coupled with their genetic relatedness to all
terrestrial mammals, supports the suggestion that they are highly significant in
evolutionary terms.
The comparative positioning of the dolphins between humans and other
primates in this study may be notable. However, this pattern is not unique and
was described earlier (section 1.1). Other examples follow: the odontocetes were
placed between higher primates and humans in the study of Hofman (1982a),
who considered them as unique in terms of encephalisation. Data on cetacean
EO (Jerison, 1973; Wood and Evans, 1980; Ridgway and Brownson, 1984)

75
concur that the EO of small odontocetes rank higher than other mammals,
including all primates, with the exception of humans, who outrank all other
species (Ridgway, 1986a). Although odontocetes have less body surface area
than land mammals (Ridgway, 1972), they still rank higher when brain size is
scaled to body surface area (Ridgway, 1986a). In addition, Worthy and Hickie
(1986) found that odontocetes have similar relative brain sizes to primates, while
the mysticetes and sperm whale had EOs significantly less than any other group.
Most recently, from her comparative EO study, Marino (1997) reported that four
out of the five most encephalised species were dolphins. The results of this
study, using the most accurate MRI technology, therefore highlight the position of
dolphin eRs in comparison with those of primates.
In returning to the findings of large dolphin neocortex ratios relative to
primates, it is necessary to mention the MRI findings for the human neocortex
ratio. Dunbar (1992) documented the average human ratio as 4.1. This is
substantially lower than the values obtained in this study, which ranged from
5.44 to 8.63, although several human values were regarded as outliers (section
3.4). Nevertheless, the mean neocortex ratio for humans, using MRI, appears to
be 6.609. Although the values recorded for humans in this study have been
recorded using highly precise imaging, which is almost perfectly correlated with
the anatomical m~terial (section 3.4), the reader should be aware of several
cautionary notes. The sample for humans was a convenience sample and
therefore not randomly selected. Within the human sample, all of the subjects
were uniformly selected as sexually mature. However, there were significant
differences between males and females in relation to total brain volume,
neocortical volume and the neocortex ratio (section 3.4). This may be of potential
interest, as it presents a contrast with dolphins, where no significant sex
differences in the neocortex ratio.
It is possible that the data used by Dunbar (1992) from Stephan et al.
(1981) for humans underestimated neuroanatomical volumes as a result of

76
shrinkage endured during the preservation process. Perhaps findings such as
these indicate the need for more accurate measurement or greater sample sizes.
As the human sample in the current study only consisted of 10 subjects, further
investigation will be required before either accepting the human neocortex ratio
as averaging at 4.1 or 6.6, or somewhere in-betwixt or between. Until this can be
achieved, the subsequent analysis in this study adheres to the documented
literature (Dunbar, 1992, 1995), while remaining aware of the potential limitations
of established values.
If the human neocortex ratio is accepted at 4.1, then the common dolphin,
at 3.938, averages out as a tantalisingly close neighbour. Considering that this
component of the study has only examined a handful of species, with substantial
data for only three of these species, a legitimate call can be made for an
extension of this work to other delphinid species, such as the killer whale. With
verification of the findings for a larger number of species, it may be possible to
speak of a special adaptation and fundamental reorganisation, or grade shift
(Martin, 1980; Martin and Harvey, 1985) in the neocortex of dolphins. An
extension of the work thus becomes vital and is possible following further
analysis from CT, MRI and CT-MRI procedures used in this study.
Using CT (section 3.1), it was found that the total volume of the brain
could be established with highly significant accuracy using the volume of the
cranium (p < .001). The volume of the cerebral cortex could also be accurately
estimated using cranial volume (p < .05). Of greater importance is the capacity to
estimate the equivalent MRI total brain volume and neocortex volume using
cranial volume, from eT, p < .05 (section 3.5). This is supported by the finding
that neocortex volume for each species can be precisely derived from total brain
volume (p < .001).
By definition, the calculation of the neocortex ratio requires the volume of
the brain and of the neocortex (Dunbar, 1992). If one has access to the total

77
brain volume and the neocortex volume, then it is possible to calculate or
estimate the neocortex ratio. As mentioned previously, dolphins are rarely
acquired for science. Consequentially, their physical brain material is hard to
access, although it is relatively easy to gain access to their crania. Especially
after regarding the high eR in dolphins, the ability to estimate neuroanatomical
data from skull collections thus becomes essential to any extension of the work
to a wider range of dolphin species. This topic forms the basis for the following
chapter.

78
Chapter 3. The use of cranial volume analysis and neuroimaging toestimate neuroanatomical data and relative neocortex sizein odontocetes.
1. Introduction
Previous chapters have outlined the scarcity of toothed whales for
research purposes. The need for the preservation of specimens acquired for
scientific research assumes priority. Tschudin, Hurribunce and Peddemors
(1998) note that dolphin skeletal material is sought after for taxonomic and
morphometric research, which precludes damaging skulls to obtain access to the
brain. In the past, this situation has minimised the possibility for actual brain
research. Prior to the investigation documented in chapter 2, which accessed a
relatively large dolphin sample through the use of non-invasive technology, it is
understandable why other investigators experienced difficulties accessing study
animals.
However, in the light of the scarcity of cetacean subjects, it would be
convenient to be able to access regression data, allowing researchers to
calculate neuroanatomical features and relative neocortical volume. Such
abilities would be especially useful when dealing with rare species. Reflecting on
the prominence of dolphins neocortex ratios established in Chapter 2, any study
wishing to extend its scope would have to rely on cranial material. In applying the
CR equations calculated previously (Chapter 2) to cranial material, this chapter
aims to estimate data on relative neocortical size in representatives of the family
of delphinids and the wider suborder of odontocetes. Although measures of
absolute brain size have been critiqued above, such indices may be useful when
used to complement data provided for relative brain size. This especially applies
to the measurement of cranial weight and volume.
The measure referred to as cranial capacity (CC) has been discussed by
Martin (1990). CC is advantageous for investigations of skulls for which no
information on weight is documented. CC can be measured using several

79
different methods. These include filling the skull with sintered glass beads or
alternatively establishing an artificial endocast volume via a latex mould of
internal braincase contours (Martin, 1990). Alternatively, double graphic
integration with the aid of x-rays may be used (Jerison, 1973). This final method
relies on the superimposition of average height, width and length of cranial cavity
on the braincasing's internal contours to obtain estimated cranial capacity
(Martin, 1990).
Cockcroft (1989) successfully used the method of filling the cranium with
sand to estimate brain volume in mature bottlenose dolphins, while Marino
(1997) also successfully applied the bead filling method of cranial analysis to
several odontocete species.
Cranial capacity is highly correlated with brain weight, according to Martin
(1990). As the relationship between CC and brain weight is virtually isometric,
CC has been used to provide an accurate indication of brain weight in primates.
It has been suggested that comparisons can be made between actual (CA)
and expected (Ce) cranial size across species, according to an index of cranial
capacity (ICC), where ICC= CA/Ce, (Martin, 1990). From an interspecific analysis
of mammals, it should be noted that cetaceans, not simian primates, share the
closest cranial capacity to humans- the only primates with an exceptional brain
size (Martin, 1981, 1982, 1990).
This chapter aims to assess cranial capacity in odontocetes for several
reasons. The first of these is to provide a means of assessing the
representativeness of the neuroimaging subsample used in Chapter 2. This is
necessary before engaging in any further analysis using the MRI data. Secondly,
the regression relationships derived to predict the equivalent MRI total brain
volume and neocortex volume from CT have been shown to be significantly
accurate (Chapter 2). This suggests that estimates applied to cranial data, either
from cranial analysis or neuroimaging, can be used to estimate the neocortex

80
ratio. Skull volumes have been used to obtain primate neocortex data by Aiello
and Dunbar (1993), who observed that as the neocortex ratio shares an
allometric relationship with cranial capacity in primates, cranial capacity can be
used to esimate the CR'
The need for the establishment of such values for a wider range of
species from the dolphin family and odontocete suborder has been described
above. With estimated neocortex ratios for a broader range of species not
scanned using MRI, the study can be extended to other delphinids and
odontocetes. This may provide more insight into the general cortical evolution of
toothed whales and allow for an appreciation of any distinctive variations
particular to delphinid species.

81
2. Method
To verify that subjects from the sample used for neuroimaging were
representative of the wider population, subjects from the wider population
previously caught in the shark nets were randomly selected and their cranial
volumes calculated. Equations estimating neocortex and brain volumes from the
neuroimaging component of the study (Chapter 2) were also used to extend the
scope of the study species. Individual values are presented in Table 3.2.
2.1. Study animals
The odontocete crania under examination were all obtained from the
collection of the PE Museum. Skulls from the following species of toothed whales
were subjected to cranial analysis. These include the bottlenose dolphin
Tursiops truneatus, Burmeister's porpoise Phoeoena spinipinnis, the common
dolphin Delphinus delphis, the dwarf sperm whale Kogia simus, the dusky
dolphin Lagenorhynehus obseurus, the false killer whale Pseudorea erassidens,
Fraser's dolphin Lagenodelphis hosei, Gray's whale Mesoplodon grayi, the
harbour porpoise Phoeoena phoeoena, the Indopacific humpback dolphin Sousa
chinensis, the Indus river dolphin Platanista minor, the killer whale Oreinus orea,
the pygmy killer whale Feresa attenuata, the pygmy sperm whale Kogia
breviceps, Risso's dolphin Grampus griseus , the short-finned pilot whale
Globieephala maerorhynehus, the spinner dolphin Stenella longirostris, the
spotted dolphin Stenella attenuata and the striped dolphin Stenella eoeruleoalba
(Table 3.1).

82
Table 3.1: Study subjects
Subject PEM# length1 weight2 sex3 sexual maturtty4bot 17 332 233 167 m sbot 18 949 247 200 m sbot 19 1009 239 196 m sbot 20 1243 227 162 m sbot 21 1514 250 172 m sbot 22 1594 248 200 m sbot 23 1236 245 180 m sbot 24 168 217 150 m sbot 25 1573 237 177 m sbot 26 1007 245 186 m sbot 27 913 229 155 f sbot 28 1254 238 160 f sbot 29 1965 251 164 f sbot 30 1515 248 168 f sbot 31 1682 240 152 f sbot 32 1500 236 145 f sbot 33 1556 240 154 f sbot 34 1240 238 156 f sbot 35 2225 247 186 f sbot 36 1405 226 140 f scom 18 1060 228 124 m scom 19 1050 227 127 m scom20 1391 232 127 m scom 21 1296 255 142 m scom22 1541 241 145 m scom23 1721 238 140 m scom24 1917 242 148 m scom25 2102 246 148 m scom26 2301 241 154 m scom27 1730 236 178 m scom28 734 231 130 f scom29 1406 226 120 f scom 30 1550 227 122 f scom 31 1617 230 133 f scorn 32 1744 233 130 f scom 33 1434 239 141 f scom 34 1924 222 126 f scom 35 2093 236 122 f scom 36 2100 223 122 f scom37 1912 231 120 f shum9 739 225 128 m shum 10 742 254 221 m shum 11 826 248 205 m shum 12 1600 209 127 m shum 13 1123 232 150 m shum 14 1951 252 222 m shum 15 1179 269 245 m shum 16 1364 233 134 m shum 17 1582 246 200 m shum 18 181 279 289 m shum 19 805 242 164 f shum 20 1086 232 142 f shum 21 1576 240 157 f shum 22 1630 242 162 f shum 23 1950 248 176 f shum 24 1978 240 178 f shum 25 2059 226 132 f s

83
Table 3.1/ ctd
isssisi
sssisisi
prprpr
sexual maturitysssssssssssssssssisiissss
m
mfmmmf
fmmf
mfmmmm
mffmmmm
mmf
mfff
mmmf
mf
seX"fff
80
210
209136240128
84204226
140104113152158161
106130157113110129127108808358
weight3
180159148
192
450589235204239203234229
212283285294241
length2
23323324019622821823524422222022422823521522019586
240226226252255259270
PEM#1544
12661314229264300935
11191585165013782136936167335
14751686959831827740
1773395675405
1215325697772782878
1118485
12831828100301191276145239
15642041
8841377
subjecthum 26hum 27hum 28spo 3spo4spo 5spo 6spo 7spo 8spo 9spo 10spo 11spo 12str 2str 3spi1spi2fra 2fra 3fra 4fra 5fra 6fra 7fra 8dus 1dus 2ris 2ris 3ris 4ris 5ris 6ris 7fal1fal2pyg 1pyg 2kil1
sho 1sho 2dwa2dwa3dwa4dwa5dwa6pys 1pia 1har 1bur1 395377gra 1 1024 472 f
note: 1PE identification tag, 2cm, 3kg, 4m-male, f-female; 5s-sexually mature, i- immature, pr
presumed mature. Species abbreviations: BOT- bottlenose dolphin, COM- common dolphin,
HUM- humpback dolphin, SPO- spotted dolphin, STR- striped dolphin, SPI- spinner dolphin, FRA
Fraser's dolphin, DUS- dusky dolphin, RIS- Risso's dolphin, FAL- false killer whale, PYG- pygmy
killer whale, KIL- killer whale, SHO- short-finned pilot whale, DWA- dwarf sperm whale, PYS
pygmy sperm whale, PLA- Indus River dolphin, HAR- harbour porpoise, BUR- Burmeister's
porpoise, GRA- Gray's beaked whale.

84
2.2. Procedure
The skulls were randomly selected from mature populations of the species
described above. However, in certain instances where no weight or length data
were available for specimens representing rare species, the fusion of the frontal
supraoccipital suture was taken as the most accurate indicator of sexual maturity
(Vanwaerebeek, 1993).
Sand was collected from King's Beach and five density readings were
taken prior to establishing an average density of the sand, where 100ml were
equivalent to 158,7g (rounded off to 159g). For cranial analysis, each braincase
was filled with the sand to obtain volumetric data, following the procedure
documented by Cockcroft (1989). After all of the cranial apertures were moulded
closed with plasticine, sealed with adhesive tape and the skull prepared for the
analysis, a funnel was used to pour sand into the skull, through the base of the
foramen magnum. The cranium was completely filled to capacity with sand.
Following this, the sand was poured out into a measuring beaker, which was
then weighed and the weight reading converted to a volume reading. Repeated
measurements for obtained for 15 crania, with an alpha reliability of 98.6%,
which indicates that this method is sufficient for dependable analysis.
Equations for estimating neocortex volume and brain volume, established
using neuroimaging techniques of CT and MRI in relation to cranial volume
(Chapter 2), were applied to the cranial data. This was considered useful in
extending the scope of the study species. The data were entered into SPSS and
an alpha of .05 was accepted as significant.

85
3. Results
The cranial analysis component of the study included 106 subjects (Table
3.2). Calculated data include cranial weights and volumes and estimated brain
volumes, neocortex volumes and neocortex ratios (Table 3.2). The cranial
volumes are diverse, as is evident with respect to the smallest value from the
Indus River dolphin when compared to the largest value of the killer whale. It
should be noted, however, that the regression equation failed in the case of the
Indus River dolphin, as it was an outlier. Although there is a large variation in
cranial weight and volume, the estimated neocortex ratios do not vary markedly
from individual to individual. This is with the exception of the harbour porpoise
and the river dolphin, who fall below a score of 3 for the CR'

86
Table 3.2: Odontocete cranial data and estimated neuroanatomical data
subject cranial weight1 cranial Yol.2 est. brain yol.2 est. neocortex est. eRYol.2
bot 17 2184 1376.18 1286.08 1014.37 3.73bot 18 2382 1500.95 1419.45 1121.07 3.76bot 19 2017 1270.95 1173.58 924.38 3.71bot 20 2137 1346.57 1254.42 989.04 3.73bot 21 2016 1270.32 1172.91 923.84 3.71bot 22 2408 1517.33 1436.96 1135.08 3.76bot 23 2292 1444.23 1358.83 1072.57 3.75bot 24 2326 1465.66 1381.73 1090.89 3.75bot 25 2319 1461.25 1377.01 1087.12 3.75bot 26 2190 1379.96 1290.12 1017.60 3.73bot 27 2276 1434.15 1348.05 1063.95 3.74bot 28 2338 1473.22 1389.81 1097.36 3.75bot 29 2036 1282.92 1186.38 934.62 3.71bot 30 1894 1193.45 1090.73 858.10 3.69bot 31 2125 1339.00 1246.33 982.58 3.73bot 32 2198 1385.00 1295.51 1021.92 3.74bot 33 2049 1291.12 1195.14 941.62 3.71bot 34 1932 1217.39 1116.33 878.57 3.70bot 35 2334 1470.70 1387.12 1095.20 3.75bot 36 1528 962.82 844.20 660.87 3.60com 18 1712 1078.77 968.14 760.02 3.65com 19 1533 965.97 847.57 663.56 3.61com20 1629 1026.46 912.23 715.29 3.63com 21 1684 1061.12 949.28 744.93 3.65com22 1625 1023.95 909.54 713.14 3.63com23 1700 1071.20 960.06 753.55 3.65com24 1400 882.17 757.98 591.89 3.56com25 1490 938.88 818.60 640.39 3.59com26 1682 1059.86 947.93 743.85 3.64com27 1724 1086.33 976.22 766.49 3.65com28 1273 802.14 672.43 523.45 3.51com29 1297 817.27 688.60 536.39 3.52com30 1580 995.59 879.22 688.89 3.62com 31 1391 876.50 751.91 587.04 3.56com 32 1370 863.26 737.77 575.72 3.55com 33 1659 1045.37 932.44 731.46 3.64com 34 1441 908.00 785.59 613.99 3.58com35 1559 982.36 865.08 677.57 3.61com 36 1286 810.33 681.19 530.46 3.52com 37 1572 990.55 873.83 684.58 3.62hum9 2055 1294.90 1199.18 944.86 3.72
hum 10 2042 1286.70 1190.43 937.85 3.71hum 11 2185 1376.81 1286.75 1014.91 3.73hum 12 2091 1317.58 1223.43 964.26 3.72hum 13 2237 1409.58 1321.78 1042.93 3.74hum 14 2067 1302.46 1207.27 951.32 3.72hum 15 1834 1155.64 1050.32 825.76 3.68hum 16 1862 1173.28 1069.18 840.85 3.68hum 17 2274 1432.89 1346.70 1062.87 3.74hum 18 2297 1447.39 1362.19 1075.26 3.75hum 19 1960 1235.04 1135.19 893.66 3.70hum20 1628 1025.84 911.56 714.76 3.63hum 21 1927 1214.24 1112.96 875.88 3.69hum 22 1933 1218.02 1117.00 879.11 3.70hum 23 1882 1185.89 1082.65 851.63 3.69hum 24 2107 1327.66 1234.21 972.88 3.72hum 25 1799 1133.59 1026.74 806.90 3.67

87
Table 3.2/ ctd
Subject cranial weight1 cranial vol.2 est. brain vol.2 est. neocortex est. eRvol.2
hum 26 1839 1158.79 1053.69 828.46 3.68
hum 27 1936 1219.91 1119.02 880.73 3.70
hum 28 1886 1188.41 1085.35 853.79 3.69
spo 3 1438 906.11 783.57 612.37 3.58spo4 1725 1086.96 976.90 767.03 3.65spo 5 1483 934.47 813.89 636.62 3.59spo6 1524 960.30 841.50 658.71 3.60spo 7 1567 987.40 870.47 681.88 3.62spo 8 1430 901.07 778.18 608.06 3.57
spo9 1436 904.85 782.23 611.29 3.58
spo 10 1423 896.66 773.47 604.28 3.57
spo 11 1631 1027.72 913.58 716.37 3.63spo 12 1269 799.62 669.73 521.30 3.51str 2 1246 785.13 654.24 508.90 3.50str 3 1355 853.81 727.66 567.64 3.55spi 1 738 465.03 312.05 235.15 3.06
spi2 973 613.11 470.35 361.79 3.33fra 2 1806 1138.00 1031.46 810.68 3.67fra 3 1612 1015.75 900.78 706.13 3.63fra 4 1474 928.80 807.82 631.77 3.59fra 5 1889 1190.30 1087.37 855.40 3.69fra 6 1795 1131.07 1024.05 804.75 3.67fra 7 1909 1202.90 1100.84 866.18 3.69fra 8 1647 1037.81 924.35 724.99 3.64dus 1 1297 817.27 688.60 536.39 3.52dus 2 1162 732.20 597.66 463.64 3.46ris 2 2571 1620.04 1546.76 1222.92 3.78ris 3 3698 2330.18 2295.21 1821.68 3.85ris 4 3504 2207.94 2175.23 1725.69 3.84ris 5 3850 2425.96 2408.29 1912.14 3.85ris 6 3370 2123.50 2084.96 1653.48 3.83ris 7 4490 2829.24 2839.39 2257.03 3.88fal1 3124 1968.49 1919.26 1520.92 3.82fal2 5406 3406.43 3456.41 2750.64 3.90pyg 1 1390 875.87 751.24 586.50 3.56pyg 2 1871 1178.95 1075.24 845.70 3.68kil1 10408 6558.29 6825.75 5446.11 3.95
sho 1 5981 3768.75 3843.73 3060.49 3.91sho2 4387 2764.34 2770.01 2201.52 3.87dwa2 1146 722.12 586.88 455.02 3.45dwa3 946 596.09 452.16 347.24 3.31dwa4 959 604.29 460.92 354.25 3.32dwa5 1174 739.76 605.74 470.10 3.47dwa6 940 592.31 448.12 344.01 3.30pys 1 1658 1044.74 931.76 730.92 3.64pia 1 298 187.78 15.67 -1.95 -.11har 1 662 417.14 260.86 194.20 2.91bur1 867 546.31 398.95 304.67 3.23gra 1 2666 1679.90 1610.75 1274.11 3.78
note: 19rams, 2cm3. Species abbreviations follow from Table 3.1.
The summary statistics for the species of odontocetes are provided in
Table 3.3. As some species are only represented by a solitary case or a pair of
animals, the data should be treated with caution. The bottlenose cranial data
exhibit the largest variance of the major study species, followed by the common

88
dolphin and finally the humpback dolphin. In terms of the neocortex ratio across
species, it is interesting that while the Indus River dolphin has a negligible CR,
the short-finned pilot whale and the killer whale display large values.
Table 3.3. Summary statistics of interspecific odontocete cranial volumes.
Species Mean1 std dev1 Variance N Est. Brain Est. Est. CR(C.O.V)2 Vol.1 Neocortex
Vol.1
bottlenose d. 1354.159 133.260 17758.329 20 1286.08 1014.37 3.73(13.114)
common d. 964.304 95.702 9158.812 20 968.14 760.02 3.65(9.498)
humpback d. 1255.23 109.633 12019.412 20 1199.18 944.86 3.72(9.575)
spotted d. 940.517 79.904 6384.699 10 783.57 612.37 3.58(6.788)
striped d. 819.471 48.566 2358.677 2 654.24 508.90 3.50(2.878)
spinner d. 539.067 104.707 10963.547 2 312.05 235.15 3.06(20.338)
Fraser's d. 1092.087 100.82 10164.729 7 1031.46 810.68 3.67(9.308)
dusky d. 774.732 60.151 3618.112 (4.67) 2 688.60 536.39 3.52
Risso's d. 2254.477 396.461 157181.395 6 1546.76 1222.92 3.78(69.72)
false killer w. 2687.461 1016.772 1033825.66 2 1919.26 1520.92 3.82(384.684)
pygmy killer w. 1027.410 214.316 45931.168 2 751.24 586.50 3.56(44.706)
short-finned w. 3266.541 710.226 504420.728 2 3843.73 3060.49 3.91(154.42)
killer whale 6558.286 6825.75 5446.11 3.95

89
Table 3.3/ctd.
pygmy sperm w. 1044.739
Indus River d. 187.776
Harbour p. 417.139
Burmeister's p. 546.314
Gray's beaked w. 1679.899
Species
dwarf sperm w.
Mean1
650.914
std dev1 Variance N Est. Brain Est.(C.O.V)2 Vol.1 Neocortex
Vol.1
73.446 5394.335 5 586.88 455.02
(8.287)
931.76 730.92
15.67 -1.95
260.86 194.20
398.95 304.67
1610.75 1274.11
3.45
3.64
2.91
3.23
3.78
note: 1cm3, 2co-efficient of variation, d-dolphin, p-porpoise, w-whale.
The summary statistics for the species of odontocetes that were also
under neuroimaging investigation were established to permit comparison with the
neuroimaging sample from Chapter 2 to assess their representativeness (Table
3.4). The dwarf sperm whale data and the striped dolphin data from MRI were
excluded from further analysis, as they were not considered to be representative
of the species due to the brains of these individuals not fitting the population
parameters established for their respective species from cranial volume analysis.

90
Table 3.4: Cranial volume parameters for odontocete species also under
neuroimaging investigation.
species minimum1 maximum1 range 95% 95% n
Confidence Confidence
Interval- lower Interval-
higher
bottlenose 962.823 1517.328 554.505 1291.791 1416.526 20
common 802.142 1086.326 284.184 919.514 1009.094 20
humpback 1025.835 1447.385 421.55 1203.92 1306.54 20
spotted 799.622 1086.957 287.335 883.357 997.677 10
striped 785.129 853.812 68.683 383.12 1255.821 2
Fraser's 928.796 1202.899 274.103 998.844 1185.331 7
Risso's 1620.038 2829.238 1209.2 1838.417 2670.538 6
Dwarf Sperm 592.313 739.761 147.448 559.718 742.109 5
note: 1cm3.
Following the establishment of final MRI and estimated neocortex ratio values for
different odontocete species that could be included with confidence in the
analysis, these values were compared to documented primate neocortex data
(Dunbar, 1992). The comparatively high delphinid neocortex ratios scores in
relation to those of their primate counterparts are noteworthy (Figure 3.1).

4.5
4o
:;::;as 3.5et:~ 3to(.) 2.5oQ)
Z 2
1.5
1
0.5
o
P'"
~~ 111= ,. ~ ~ ~
~
,.,
• ~
ill
~ (If:.
•
• I !...L ... !...L ... W... W ... • • • • I I • •Kil Sho Com Bot Hum Spa Fra Hum Chi Bab Gor Ver Lor Lem Tew. w. d. d. d. d. d. n
SPECIES
Note: KiI W.- killer whale, sho W.- short-finned pilot whale, cam d.- common dolphin,bot d.- bottlenose dolphin, hum d.- humpback dolphin, spo d.- spotted dolphin,fra d.- Fraser's dolphin, humn- human, chi- chimpanzee, bab- baboon, gor- gorilla,ver- vervet monkey, Jor-Ioris, lem-Iemur, tar- tarsier.
Figure 3.1: Barchart comparing MRI and estimated delphinid CR values with
documented primate data (Dunbar, 1992)

92
4. Discussion
The individual animals used in MRI as potential representatives of other
species were compared to the population parameters established for these
species' brains, using the randomly selected cranial analysis sample. The
findings of this chapter were of substantial utility, insofar as the majority of MRI
subjects were found to be representative of the broader population parameters
using CVA, while a wider range of delphinid species and other species from the
suborder Odontoceti became available for inclusion in the analysis (section 3).
However, certain species scanned using MRI, namely the striped dolphin and the
dwarf sperm whale subjects, were excluded from further analysis, as they did not
fit the required parameters.
In spite of the large interspecific variation for obtained cranial weights and
volumes, and estimated brain and neocortical volumes, it is interesting to
observe that the neocortex ratios obtained were not of a diverse nature (section
3). In keeping with the trend discussed previously in chapter 2, it is consequential
to recognise that the majority of species examined, although representing
different species, obtained a neocortex ratio of 3.00 or above. The only
exceptions to this were the Indus River dolphin and the harbour porpoise.
When studied in terms of families, it appears that the river dolphins are the
least advanced in terms of the neocortex ratio, followed by the porpoises and
then the sperm whales, the dwarf sperm whale and the pygmy sperm whale
averaging 3.45 and 3.64 respectively. The family of beaked whales, represented
by Gray's beaked whale at 3.78, may lie above the sperm whales. Finally, the
family of delphinids appear to possess the largest neocortex ratios. Although
there appears to be a large range from the spinner dolphin at 3.06 to the killer
whale at 3.95, all of the other delphinids lie above a ratio of 3.5. Such findings
are supported by the proposal that the river dolphins are thought to be more
"primitive" than their fellow odontocetes, followed by the porpoises, white whales

93
and narwhals, sperm whales, beaked whales and delphinids respectively (Dudok
van Heel, 1981). The current ranking of CRfindings within the delphinids are
explicable within such a classification where, amongst the delphinids, the
bottlenose dolphin is regarded as being derived earlier than the common dolphin,
the pilot whales or the killer whale (Dudok van Heel, 1981).
Martin (1990), in confirming the research of Bauchot and Stephan (1969),
suggested that different grades of brain size exist for "basal" insectivores,
"advanced" insectivores, strepsirhine and haplorhine primates. More specifically,
Dunbar (1992) has found differences between strepsirhine primates and
haplorhine primates in relation to the neocortex ratio, where the latter group
display higher ratios than the former group. Applying the possibility that higher
neocortex ratios are evident in more recently evolved species, the above findings
within the odontocetes might be expected, as the delphinids are the most
recently evolved cetaceans (Chapter 1). The evolution of the delphinids at some
stage after the apes and before ancestral humans, might also contribute to an
explanation of their neighbouring status to humans. However, it should be
acknowledged that the human lineage is a much more recent evolutionary
phenomenon than either the branch-ofts of delphinids and apes.
If the delphinid and wider odontocete values are compared to the
documented primate values, aside from the Indus river dolphin and the harbour
porpoise, the only odontocete falling below the average chimpanzee value (3.22)
is the spinner dolphin, at 3.06, while Burmeister's porpoise falls at 3.23. The
proximity of the MRI scores for dolphin neocortex ratios to humans appeared
convincing enough for further study (Figure 3.1). More compelling is the even
closer proximity of the killer whale's estimated neocortex ratio (3.95) to the
human value of 4.1 (Dunbar, 1992). The killer whale is regarded as the most
adaptable of the delphinids and is the only odontocete to exist from the North to
the South Pole. High killer whale CRs are interpretable in the light of their

94
complex and varied foraging strategies and their diverse social organisation in
different habitats (Leatherwood and Reeves, 1983).
This study empirically supports the hypothesis that dolphins have a high
neocortex ratio. The corollary of the this hypothesis, namely that delphinid
neocortex ratios would fall into the primate range, has also held up. The position
of the delphinids between humans and other primates, where dolphins lie
substantially closer to humans than to non-human primates, has been an
unanticipated and positively encouraging finding. Perhaps this is one of the most
substantial findings of the entire study.
However, it should be noted that these findings are open to several
interpretations, as the human neocortex ratios in the current study are
substantially larger than those previously documented by Dunbar (1992), who
used the Stephan et al. (1981) database. Aside from the possibility that there is a
large variation between the neocortex ratios of humans across different
geographical locations, it is most plausible that the discrepancy arises out of
methodological differences. Stephan et al. (1981) preserved his specimens in
parafin, microtomed the sample and measured the area of each brain part,
whereas the current study scanned freshly deceased dolphin brains and live
human brains. It is possible that the preservation process used by Stephan et al.
(1981) resulted in differential shrinkage of the neocortex and thus neocortex
ratios that are not accurate. One would then have to scale the neocortex ratios of
primates and dolphins, with the result that delphinid neocortex ratios fall into the
range of the larger monkeys. However, until further investigation is undertaken
into human neocortex ratios, this study presumes that the comparison holds, with
the consequence that dolphins have neocortices that are slightly smaller than
those of humans.
Although it is interesting that dolphins fall so near to humans in terms of
relative neocortex size (Figure 3.1), this finding alone is not of much use, as it

95
merely gives an idea of the extent of the neocortex in comparison with the rest of
the brain. If the analysis were to stop here, the study would most certainly fall
into the same trap as other studies, such as those based on the EQ or absolute
brain size. However, it is as a result of the significance of the neocortex to
cognitive functioning that the analysis does not end here. It is highly improbable
that the neocortex would have evolved to its current relative size in dolphins
without fulfilling some function. For if the brain is considered as a functional
system, it follows that more cortex will be dedicated to vital functions (Luria,
1973,1982).
In general, as brains are energetically expensive, the importance of
different structures might be studied by considering the dimensions they occupy
in the brain and the functions they serve. For example, Martin (1981) suggested
that rather than relating brain size to body surface area, it is more appropriate to
relate the former to metabolic turnover. This relationship between structure and
function or anatomy and physiology is important. Kesarev (1971 :52) regarded
the schism between anatomical and physiological brain research as
inappropriate, since the relationship between structure and function should be
conceived of as "a complete if not ideal unity".
The meaning of structural adaptations in brain and neocortical evolution
only becomes more appreciable once the functional significance of such
adaptations is identified. Bearing this in mind, one can consider different
hypotheses of brain evolution. Finlay and Darlington (1995) propose two
alternatives for brain evolution, developmental constraint or adaptation. The
developmental constraint hypothesis holds that one can predict the size of any
neural structure in any species by using a specific formula, while the adaptation
hypothesis proposes that changes are not predictable. Using allometric
information collected on volumes of different brain divisions, Finlay and
Darlington (1995) found the developmental constraint hypothesis to be more

96
acceptable, concluding that neocortex is highly predictable for almost all brain
subdivisions.
The most powerful test of developmental limits on the evolution of the
brain is evident with respect to species living in specialised niches, or through
examining specific structures close to the sensory periphery (Finlay and
Darlington, 1995). Such an analysis is readily applicable to sirenians and
cetaceans, as the perceptual world of dolphins is significantly different from that
of standard mammals (Jerison, 1986) and will form the basis for further
investigations in this study (Chapter 5).
Cetaceans have been referred to as an exceptional case in brain
evolution (Deacon, 1990). From an evolutionary perspective, it is interesting to
realise that marginal brain size changes can result in a relatively large
neocortical size change (Finlay and Darlington, 1995). This implies that only a
slight initial divergence in brain size can result in markedly different neocortical
evolution. The evolution of dolphins in such a radically altered environment
displays the plasticity of the structural and functional organisation of the brain (for
example the absence of an olfactory bulb and expanded auditory cortex),
especially when considering the adaptability of the cerebral cortex (Kesarev,
1971). Therefore, rather than considering the dolphin brain as adaptive or
conservative, it should be held as a highly "derived" brain, one geared towards
adaptation in its specialised environmental niche (Deacon, 1990).
Several suggestions have been made to account for the large
development of the dolphin neocortex. Some argue that it occurred as a result of
the greater regulation required by their visceral and somatic functioning
(Kesarev, 1971). However, although all cetaceans share common visceral and
somatic functioning, they do not all share a high EO, prompting the suggestion
that the above explanation is not likely to be the case (Ridgway, 1986). Rather,

97
Ridgway (1986:62) proposes that there must be "other reasons for the large size
of the dolphin brain".
The aim of the following chapters 4-6 is therefore to assess what
functional significance the large dolphin neocortex serves. This approach fits the
mould of previous research documenting the neocortex ratio, where neocortical
size has not been studied in isolation. Rather, it has been related to the
behavioural ecology of different mammals. This has been achieved by relating
the neocortex ratio to several variables representing foraging ecology and social
structure in primates, insectivores and carnivores (Dunbar 1992, 1995; Dunbar
and Sever, 1997). Different aspects of foraging or sociality are related to the
neocortex of the various orders of mammals. For cetaceans, these are discussed
in the relevant chapters relating to foraging ecology (Chapter 4), sound (Chapter
5) and sociality (Chapter 6).

98
Chapter 4. Foraging ecology and relative neocortical volume in
dolphins.
1. Introduction
Since the 1960s, the term ecology has generally been taken to refer to the
study of organisms in relation to the physical and biological environments in
which they live (Ehrlich and Roughgarden, 1987; McNaughton and Wolfe, 1979;
Smith, 1990). The study of animal behaviour in relation to ecology has thus come
to be termed "behavioural ecology". In essence, the function of individual
behaviour serves to maximise an individual's survival and reproductive success.
However this behaviour is constrained by the ecological conditions within which
the organism lives (Krebs and Davies, 1987). An understanding of these
ecological constraints thus becomes essential to interpreting the evolutionary
significance of certain adaptations.
Chapters 2 and 3 established that the relative size of the odontocete
neocortex is extremely large when compared to that of all of the other
mammalian groups. It was also acknowledged that such a structural adaptation
would not occur without some notable functional correlate. Many researchers
have sought to establish the nature of the relationship between aspects of brain
size and the ecology of the animals. Authors such as Milton (1988) have
suggested that the ecological complexity of foraging may result in larger brains.
Using bats as a general .example, it has been found that frugivorous species
have significantly higher indices of relative brain size than insectivorous species
(Armstrong, 1983; Eisenberg and Wilson, 1978; Pirlot and Stephan, 1978).
Following this tradition, the neocortex ratio has been correlated with
measures of foraging ecology in several orders of terrestrial mammals, including
insectivores and carnivores (Dunbar, 1992; Dunbar and Sever, 1997), although
no correlation has been found for haplorhine primates (Dunbar, 1992). This study

99
uses data from the previous chapters to relate the neocortex ratio to several
aspects of dolphin foraging ecology.
Social ecology appears to be relevant to considerations of brain size in
other mammals, such as carnivores (see Gittleman, 1986). It has been proposed
that the formation of cetacean schools is either due to predation or to foraging
demands (Norris and Dohl, 1980; Wuersig, 1986). Gaskin (1982) observes that
most cetaceans either form schools when they cannot be concealed in the
environment or when food sources are concentrated, as opposed to dispersed.
The current chapter focuses on the selective mechanisms that influence schools
and social systems, including predator protectiC?n, foraging, feeding and
reproduction.
1.1. General delphinid foraging ecology
It is evident that dolphin group size varies in relation to habitat, from
solitary riverine species, through coastal species in small to moderate sized
groups to pelagic species in large aggregates (Wells, Irvine and Scott, 1980).
Food sources also vary with habitat, resulting in riverine dolphins mainly eating
crustaceans and demersal fish, while coastal feeders feed opportunistically
(individually and with co-ordinated group foraging) on bottom fish, schooling fish
and cephalopods, amongst others. Pelagic species feed on food clumps
distributed in patches, such as schooling fish and squid, relying on co-ordinated
foraging and feeding.
A diverse range of selective mechanisms influencing social systems is
apparent from the wide range of adaptation across delphinid species. Pelagic
species are adapted to life at sea, being relatively small and streamlined for
enduring high speed search and pursuit of fish schools, these being captured
with elongated jaws housing many small teeth. Coastal species mainly have
shortened beaks with less teeth, allowing for the capture of more diverse food
sources. These may be compared to riverine species who are highly

100
manoeuvrable to avoid obstructions in the water and whose long, narrow jaws
have a large number of teeth, specialised to catch a smaller variety of prey on
the bottom (Wells, Irvine and Scott, 1980).
Cetacean schools feed primarily on schools of fish and squid species,
many of which also exhibit aggregation tendencies. Norris and Dohl (1980) note
that, as with findings related to schools of predatory fish and large terrestrial
mammalian predators, foraging efficiency increases with increasing school size
in dolphins.
Certain dolphin species such as the common dolphin and spotted dolphin,
travelling in schools of hundreds or thousands, assemble in broader as opposed
to longer formations relative to school movement (Norris and Dohl, 1980). These
formations permit the scanning of larger areas with an incremental increase in
efficiency, as opposed to single animal scouting (Wuersig, 1986). As most of the
food of pelagic dolphin species is constituted from large schools of fish unevenly
distributed in the open ocean, it is evident that a single location of prey can
provide food for a large dolphin group. This is in contrast to the more even
distribution of inshore prey, which may result in smaller groups of coastal and
estuarine dolphins (Peddemors, pers. comm.).
Following successful foraging, feeding is enhanced by school formation,
which may optimise energy supplies. Through random movements in the feeding
area, and by altering the density of feeding animals relative to seasonal variation
in food, the group can constantly feed on unexploited resources and allow the
food supply time to reconstitute itself. Most dolphins (notably common, spotted
and spinner schools) appear to use "pulse fishing", which involves an initial,
heavy exploitation of a resource area, which is then left to reconstitute itself while
another area is fished (Norris and Dohl, 1980).
Methods of food capture are notably different to search methods, with
patterns of capture described as either spread school formations or co-operative

101
capture methods (Norris and Dohl, 1980). Once clumps of food are located by
ocean-going genera such as Delphinus and Stenella, the formation of the school
changes. The school spreads out and loses its shape, with reduced school
cohesion and greater numbers of smaller subgroups forming. According to Norris
and Dohl (1980), some species alter their diving patterns when feeding instead
of foraging, for example, schools of Stenella may continue to dive in synchrony,
which may form part of a capture strategy. The same authors note that spread
formation occurs at night in spinner schools, as opposed to daytime spreading in
common dolphin schools, which may indicate a different sensory basis for school
formation. "Mixed schools" comprising different species have also been observed
feeding on similar types of food.
Species forming smaller moderate-sized schools appear to use more
specialised kinds of food capture. Both bottlenose and humpback dolphins utilise
a wide array of feeding tactics to herd and sometimes trap their prey (Dix, 1998;
Leatherwood, 1975; Peddemors and Thompson, 1994; Silber and Fertl, 1995).
Norris and Dohl (1980) propose that food capture appears more successful when
the cetacean forces the prey against a barrier, either the shoreline, the surface,
or underwater formations, as this results in the prey engaging in more
predictable behaviour, thereby simplifying capture for the dolphins.
The final aspect of animal ecology relates to diet and energetics. Milton
(1988) found that the composition of the diet was related to brain size in
primates. Those primates who forage for high quality, less easily obtainable
resources such as fruit, rather than leaves, appear to have larger brains than
their non-specialist, catholic feeding counterparts. Although the equivalent
detailed study is obviously not possible in free-ranging dolphins, an analogy is
possible. Squid are easier to catch than fish, are of lower quality and hold less of
an energy content than their piscine equivalent (Clarke, 1986; Sink, 1995). If fruit
is comparable to fish and squid is comparable to leaves in dietary terms, then an
analysis for dolphins becomes possible.

102
In terms of the importance of diet to odontocete ecology, it may be of
interest to note that the abundance of pilot whales off the coast of Newfoundland
was severely constrained by the depletion of the squid on which they prey
(Mercer, 1975). Locally, Crawford and Shelton (1981) suggested that the
declining availability of fish prey items resulted in the depletion the population of
several species of southern African seabirds. By extrapolation, the same process
could apply to local dolphin species. Partridge and Green (1985) support this
notion, by observing that spatial and temporal variation in food supplies, the
variation of individuals within a phenotype and frequency dependent pay-offs all
have a profound influence on the feeding strategies of animals.
Dolphins, although being apex predators, are also preyed upon and the
consequences of being prey may influence their foraging ecology and social
systems considerably. For example, the water depth inhabited by the animal
appears to be a consequential factor in influencing the social system. The further
away from the protection offered by land and the coastline, the greater the threat
of predation and the larger the school. Water depth therefore appears to be
correlated with school size (Johnson and Norris, 1986). Peddemors
(pers.comm.) observes that water depth controls the abundance and distribution
of many fish species and hence indirectly influences dolphin abundance and
distribution. According to Wells, Irvine and Scott (1980), one cannot reduce the
determinance of group composition, stability or size to one environmental factor.
They propose that the interaction of environmental forces of differing importance
combine in determining group features.
Predation pressure also varies with habitat. Riverine species are almost
free from predation and appear to group on a predominantly territorial basis,
while coastal and pelagic species are preyed upon by humans, sharks and killer
whales and form tight social bonds, evidenced by mass strandings and
permanent family units (Wells, Irvine and Scott, 1980).

103
It appears that the ecological determinants of group size in larger
delphinids are different than those of the smaller delphinids, thus the larger the
animal, the smaller the group (Johnson and Norris, 1986). The threat of
predation is less pressing for larger animals, where prey density and size, in
addition to predator mobility may be more important (Wells, Irvine and Scott,
1980).
Parrish (1992) suggested that, with respect to fish schools, predators
influence the physical and behavioural composition of the school, proposing that
gregariousness may have evolved to reduce predation, to permit foraging
efficiency or hydrodynamic advantage. Dolphins, who are preyed upon by sharks
and killer whales, typically react to environmental stress by avoidance and
tightening of the group, with the peripheral animals engaging in most of the
aggressive activity, while young and vulnerable school members are protected
by a "moving cup" of adults (Norris and Dohl, 1980). In dimorphic odontocete
schools, adult males are often positioned at the wings of the school, while the
mothers and calves are more centrally placed. As animals at the periphery of the
school are more open to predation, larger males usually hold these positions, as
they are better able to fend off predators (Norris and Dohl, 1980).
If the entire range of cetacean group size is considered, it is evident that
variation in school size is as expected if predation were the propelling force
behind schooling (Norris and Dohl, 1980; Norris and Schilt, 1988). Thus large
whales are usually either solitary or form small reproductive units. Similarly,
while river dolphins form small groups or remain solitary and coastal dolphins
form small to moderate schools, pelagic dolphins form huge schools of up to
several thousand members.
1.2. Foraging ecology of species in South African waters
Bottlenose dolphins have a diverse habitat, ranging from riverine and
coastal to pelagic schools (Leatherwood and Reeves, 1983). There are distinct

104
offshore and inshore populations, with inshore populations regularly displaying
residency. Although generally considered to be opportunistic feeders, inshore
bottlenose dolphins have been found to target specific prey species in South
African waters (Cockcroft and Ross, 1990a). They mainly eat fish and feed co
operatively or individually. Bottlenose dolphins are occasionally preyed upon by
sharks or killer whales (Cockcroft, Cliff and Ross, 1989; Wells, Irvine and Scott
1980). Individual feeding occurs on benthic and reef dwelling fish, while co
operative feeding occurs on schools of fish.
Off South African waters, the offshore bottlenose dolphin is unresearched,
but probably ranges from the south-eastern Atlantic Ocean to the south-western
Indian Ocean (Findlay, 1989). The inshore form occurs as far south as False Bay
on the east coast and is restricted to Namibia and northwards on the west coast
(Findlay, 1989). Two possible stocks are found on the east coast, migrants and
residents (Peddemors, 1995). The inshore form is found in water less than 50
metres deep and avoids turbid water (Peddemors, 1995). Not only are co
operative and individual feeding techniques used, but a system of age and sex
based resource partitioning has been shown off KwaZulu-Natal (Cockcroft and
Ross, 1990b). Local species forage mainly on fish species, but also on
cephalopods (Sekiguchi, Klages and Best, 1992). This can be contrasted with
the results of stomach content analysis of bottlenose dolphins off Florida, which
reveal that they prey exclusively on fish species and hunt in much shallower
water than their local counterparts (Barros and Wells, 1998).
Common dolphins are resident throughout the year from Lambert's Bay on
the west coast to East London on the east coast, only occurring seasonally in
KwaZulu-Natal, during the sardine-run (Cockcroft and Peddemors, 1990).
Approximately 20 000 common dolphins are estimated to occur on the south
east coast (Cockcroft and Peddemors, 1990). These dolphins are pelagic,
generally inhabiting waters over the continental shelf, but also being found
inshore on the east coast during winter, when feeding on sardines. Generally,

105
these dolphins are opportunistic feeders (Young and Cockroft, 1994), eating
shoaling fish and cephalopods. On the west coast, this species predomin~ntly
eats schooling fish in water less than 200m deep, but may feed on the deep
scattering layer nocturnally (Sekiguchi, Klages and Best, 1992). On the east
coast, the prey are usually small, easily captured, pelagic shoaling species
(Young and Cockcroft, 1994). Although these dolphins are supposedly
opportunistic feeders, five prey species constituted 86.9% of the dietary weight.
There is also strong evidence for resource partitioning or the differential intake of
prey between groups of males and females, as well as for juveniles and adults
(Young and Cockcroft, 1994).
Humpback dolphins are found in coastal or estuarine waters, with year
round residents following habitual inshore routes (Durham, 1994). As
opportunistic feeders, humpback dolphins prey on fish (mainly reef fish), hunting
both co-operatively and individually (Saayman and Tayler, 1979). They are
regularly preyed upon by sharks (Cockcroft, 1990). In KwaZulu-Natal, the
humpback dolphin population is estimated at 200 individuals, mostly occurring on
the Tugela Bank (Durham, 1994). However, they are found throughout the east
coast, as far south as False Bay (Findlay, 1989). Although usually found in turbid
nearshore waters, river deltas and estuaries, they have been observed in large
harbours such as Durban and Richard's Bay (Peddemors and Thompson, 1994).
They primarily feed on estuarine-associated and littoral fish species and
cephalopods, although it has been acknowledged that not much is known about
their feeding habits (Barros and Cockroft, 1991). In local waters, the humpback
has been observed to prefer shallow waters, not greater than 25 metres deep
(Barros, 1997). It has been suggested that although humpback and bottlenose
dolphins share the same prey species, the closer inshore foraging of humpbacks
allows them to co-exist with their bottlenose counterparts (Barros, 1997; Barros
and Cockroft, 1991). Off the eastern Cape feeding increases during the rising
tide (Saayman and Tayler, 1979). Elsewhere, the humpback dolphin moves

106
onshore with the rising tide to feed in mangrove channels, sometimes
incorporating purposeful beaching in pursuit of prey (Peddemors and Thompson,
1994).
Spotted dolphins have been sighted in the Mozambique channel and as
far south as the Eastern Cape (Port St John's) (Peddemors, 1997). Two
strandings on the west coast probably represent strays from the east coast
(Findlay, 1989). Although usually sighted in water deeper than 200m, this
species has been observed in water less than 30m deep, in association with
spinner dolphins in Cape Vidal, Maputoland, and with common dolphins off the
Wild Coast (Peddemors, 1997). Feeding is on squid ,and fish in the early morning
near the surface, where advantage is taken of the vertical migration of their
mesopelagic prey (Sekiguchi, Klages and Best, 1992).
The distribution of striped dolphins ranges from Mozambique to False
Bay, but may round the Cape Peninsula in association with the Agulhas Current
(Findlay, 1989). All sightings have been in water deeper than 500m, which
suggests an oceanic lifestyle. The diet for east coast striped dolphins consists
mainly of fish (80%) with squid (20%
), while on the south coast squid appears to
be the dominant food source (860/0), which may reflect the greater abundance of
squid on the Agulhas Bank (Sekiguchi, Klages and Best, 1992). Striped dolphins
may target squid with luminous organs. The dietary presence of pelagic and
oceanic squid species suggests offshore and inshore feeding, or regular feeding
at the intersection represented by the continental shelf break (Sekiguchi, Klages
and Best, 1992).
Not much is known about Fraser's dolphin, Risso's dolphin and the kogiid
genera off the local coastline. However, in terms of local feeding knowledge, it
has been suggested that Fraser's dolphins live in deep water, off the edge of the
continental shelf (Sekiguchi, Klages and Best, 1992). Locally, Risso's dolphin
feeds almost exclusively on cephalopods (Cockroft, Haschick and Klages, 1993)

107
at a great depth in excess of 1000 metres (Ross, 1984). As regards dwarf sperm
whales, juveniles live closer inshore than adults, over the outer part of the
continental shelf and upper part of the slope, whereas adults inhabit deeper
water (Ross, 1984).
Using data from the above species, dolphin neocortex ratios from
Chapters 2 and 3 are related to foraging depth, dietary diversity, total number of
prey species, fish species and cephalopod species and dietary complexity,
evidenced by relative prey importance ratios for fish and cephalopods.

108
2. Method
An issue of methodological importance was raised by Deacon (1990) and
elaborated upon by Dunbar (1992). This concerns the variation between
ontogenetic and evolutionary terms. Whereas brain size may restrict group size
ontogenetically, in evolutionary terms, selection pressures favouring an
increased group size may drive the evolution of a larger neocortex. Although a
behavioural requirement may cause a change in the brain, hypotheses are
tested by regressing behaviour onto brain size. This is done as the behaviour of
existing populations is restricted by current brain size (Dunbar, 1992). In the
following analysis, the foraging variables are therefore considered as dependent
variables and are regressed onto the neocortex ratio, the independent variable.
Independent contrast analysis is not considered necessary, as the study species
emerged during a similar period of time (Milinkovitch, Meyer and Powell, 1994).
However, speculation exists with respect to the concept of star speciation in
dolphin evolution. This study can, however, claim to overcome phylogenetic
inertia, as the analysis proceeds as the genus level (each species represents
one genus), where it has been suggested that genera are considered to be
evolutionarily independent (cf. Dunbar, 1992).
2.1. Study animals
Only the MRI data for those species falling within the population
parameters established using the CVA techniques, described in Chapter 3, were
used. The qualifying species from MRI included the bottlenose dolphin Tursiops
truncatus, the common dolphin De/phinus de/phis, Fraser's dolphin
Lagenode/phis hosei, the Indopacific humpback dolphin Sousa chinensis,
Risso's dolphin Grampus griseus and the spotted dolphin Stenella attenuata. A
summary of the relevant actual neocortex data is provided in Table 4.1.

109
Table 4.1: Neocortex ratios from MRI for selected delphinids
Species CR L0910 CR n
Bottlenose 3.85 .59 14
Common 3.94 .60 16
Humpback 3.59 .56 8
Spotted 3.55 .55
Fraser's 3.73 .57 1
Risso's 3.81 .58 1
From the neuroimaging findings described in section 2.3.5, it was evident
that cranial volume, measured using CT, could be accurately used to estimate
the equivalent MRI brain and neocortex volumes. These equations were applied
to the cranial volume data obtained in section 3.3 (Chapter 3) to provide
estimates of brain volume, neocortex volume and the neocortex ratio in the
species concerned. Data were estimated from crania representing the MRI
species (above) and also for the following species: Burmeister's porpoise
Phocoena spinipinnis, the dwarf sperm whale Kogia simus, the dusky dolphin
Lagenorhynchus obscurus, the false killer whale Pseudorca crassidens, Gray's
whale Mesoplodon grayi, the harbour porpoise Phocoena phocoena, the Indus
river dolphin Platanista minor, the killer whale Oreinus orea, the pygmy killer
whale Feresa attenuata, the pygmy sperm whale Kogia brevieeps, the short
finned pilot whale G/obicephala maerorhynchus, the spinner dolphin Stenella
longirostris and the striped dolphin Stenella coeruleoalba. The relevant summary
data are provided in Table 4.2.

Table 4.2: Estimated brain volumes and CRs for PE odontocetes species
Species n Family1 Est. brain vol.2 Est. neocortex vol.2 Est. CR LOG10 Est. CR
bottlenose d. 20 1286.08 1014.37 3.73 .57
common d. 20 968.14 760.02 3.65 .56
humpback d. 20 1199.18 944.86 3.72 .57
spotted d. 10 783.57 612.37 3.58 .55
striped d. 2 654.24 508.90 3.50 .54
spinner d. 2 312.05 235.15 3.06 .49
Fraser's d. 7 1031.46 810.68 3.67 .56
dusky d. 2 688.60 536.39 3.52 .55
Risso's d. 6 1546.76 1222.92 3.78 .58
false killer w. 2 1919.26 1520.92 3.82 .58
pygmy killer w. 2 751.24 586.50 3.56 .55
killerw. 6825.75 5446.11 3.95 .60
short-finned 2 3843.73 3060.49 3.91 .59pilotw.
dwarf sperm w 5 2 586.88 455.02 3.45 .54
pygmy sperm w 2 931.76 730.92 3.64 .56
Indus River d. 3 15.67
110

111
Table 4.2/ctd.
Species n Family1 Est. brain vol.2 Est. neocortex vol.2 Est. CR LOG10 Est. CR
harbour p. 4 260.86 194.20 2.91 .46
Burmeister's p 4 398.95 304.67 3.23 .51
Gray's beaked 5 1610.75 1274.11 3.78 .58w.
note: 1Family= 1-delphinids, 2-sperm whales, 3-river dolphins, 4-porpoises,5-beaked whales; 2cm3;
A series of documented variables on foraging depth, total number of prey
species, numbers of fish and cephalopod species and the Shannon-Wiener
Index of dietary diversity, or SWI (Sekiguchi, Klages and Best, 1992), were used
in the analysis. From these measures ratios of total prey species to fish or
cephalopod species and of fish to cephalopod species were also calculated. The
values for different species are presented in Table 4.3.

112
Table 4.3: Foraging ecology variables in Odontocetes.
species foraging fish squid total SWI total: total: fish:depth1 species2 species2 species2 fish squid squid
ratio ratio ratiobottlenose 50 16 3 19 2 1.19 6.33 5.33
common 200 14 7 21 1.79 1.50 3 2
humpback 25 93
spotted 200 6 10 16 1.80 2.67 1.60 .60
striped 500 6 11 17 1.05 2.83 1.55 .55
spinner 250
Fraser's 500 6 3 9 .93 1.50 3 2
dusky 85 16 7 23 2.17 1.44 3.29 2.29
Risso's 1000 2 14 16 1.79 8 1.14 .14
False K. 1000 .00 8 8 .94 1 .00
Pygmy K. 2 .00 2 .67 1
Short-fin p. 1000
Dwarf Sp. 500 4 31 37 1.82 9.25 1.19 .13
Pygmy Sp. 500 12 31 49 2.30 4.08 1.58 .39
Indus River 15
Gray's b.w. 1800 1 .00 1 .00 1
Note: 1m, 2number. Data on prey species (total species, fish species, cephalopodspecies and SWI): Sekiguchi, Klages and Best, 1992. Humpback data fromBarros, 1997. Data on foraging depth: Indus River dolphin: Wailer, 1983; Duskydolphins: Wuersig and Wuersig, 1980; bottlenose dolphins: Ross et al. 1987;common dolphins, dwarf sperm whale: Sekiguchi et al. 1992; false killer whale,spotted, striped dolphins, short-finned pilot whales: Findlay et al., 1992;Humpback dolphin: Durham, 1990; Risso's dolphin: Cockcroft et al., 1990;spinner dolphin, Fraser's dolphin: Sylvestre, 1995.

113
2.2. Materials
MRI data were obtained using MRI scanning units at St Aidan's and
Wentworth Hospitals. These machines and their related imaging software are
more comprehensively described in sections 2.2.3 and 2.2.4 (Chapter 2).
Cranial volume analysis utilised fine sand, with a known density and
several measuring beakers to contain the sand. An electronic scale was used to
weigh the sand. A more detailed description of these materials and methods has
been provided in section 3.2.2 (Chapter 3).
2.3. Procedure
The MRI neocortex data for the major study species of dolphins, and MRI
data for delphinids at large were analysed, in addition to using the estimated
neocortex data for delphinids and, more generally, odontocetes. These values
were related to a set of documented variables pertaining to foraging ecology, to
assess the nature of the relationship between neocortex and foraging. The
statistical analysis was conducted using SPSS version 6.1 and the results were
accepted as significant at the .05 alpha level.

114
3. Results
3.1. Correlational analysis
The current study established the nature of the correlations of various
foraging ecology variables with the neocortex ratio (Table 4.4). It is of interest to
note that foraging depth and the neocortex ratio are not correlated in the major
study species, nor in the other delphinid species data from MRI. When compared
to the estimated values for CVA subjects, foraging depth is also not related to the
CR of the major species, although there is a possible trend towards a relationship
for delphinids and for odontocetes at large.
The total number of prey species eaten appears to be negatively
correlated with the CR in the major study species from MRI. This does not appear
to be the case for the more general MRI delphinid subjects, nor for the neocortex
estimates of the major species, delphinids or odontocetes, where these variables
are unrelated.
The number of bony fish or cephalopod species does not appear to be
related to the CR in any of the groups of analysis, neither from actual neocortex
data, nor from estimated data.
The ratios of prey, for example, the proportion of fish or cephalopods to
the total number of species, did not appear to be related to the CR in the majority
of the data, with the exception of the major subjects from MRI. Here, the
proportion of cephalopods to total number of prey species was negatively related
to the CR.
Dietary diversity, as measured by the SWI, was unrelated to the actual
and estimated data for the major species, delphinids and odontocetes.

115
Table 4.4: List of correlations for foraging ecology variables with eR
DependentVariable
foraging depth
total species
fish species
cephalopodspecies
total:fish prey ratio
total: cephalopodprey ratio
SWI
Majorspecies1
n.s
-.963(3)
.0873
n.s
n.s
n.s
-.999(3)
.007*
n.s
Major Delphinids1
species2
n.s. n.s
n.s n.s
n.s n.s
n.s n.s
n.s n.s
n.s n.s
n.s n.s
Delphinids2
.467(11 )
.0743
n.s
n.s
n.s
n.s
n.s
n.s
Odontocetes2
.454(14)
.0523
n.s
n.s
n.s
n.s
n.s
n.s
Note: 1 refers to MRI neocortex data for major delphinid species of interest and
delphinid species in general; 2 refers to estimated neocortex data for major
delphinid species, delphinid species in general and the wider suborder of
odontocetes; n.s.- not significant at p < .05; 3potential trend, ·significant
relationship. Results presented Lt.o. r value, n, p value.

116
3.2. Weighted linear regression
The technique of linear regression was used in the analysis and
weighting by least squares was applied to the regression. Weighting was
included to provide a more accurate analysis, as it takes account of the individual
numbers of animals used within each species. Variables were logarithmically
transformed (base 10) in order to linearise the data (Dunbar, pers.comm.). The
CR was the predictor or independent variable, while the study variables were the
predicted or dependent variables.
For the actual neocortex data from the MRI study species, the CR is not
significantly related to any foraging ecology variables, including foraging depth,
dietary diversity, the total number of prey species, the specific numbers of fish
nor cephalopod prey species, nor to the ratios of specific prey species to the total
number of species nor to each other. The regression statistics are provided in
Table 4.5. The only variable to show a trend toward approaching significance in
relation to the CR is the number of cephalopod species preyed upon.

117
Table 4.5: Foraging ecology variables in relation to CR for MRI delphinids
Dependent Variable adjusted r2 value F value (d.f.) p value
foraging depth 0.218 2.393 (4) n.s
total species 0.250 2.663 (4) n.s
fish species 0.245 0.017 (4) n.s
cephalopod species 0.511 6.225 (4) .067·
total:fish prey ratio 0.197 0.177 (4) n.s
total:cephalopod prey ratio 0.371 3.949 (4) n.s
SWI 0.303 0.069 (3) n.s
fish:cephalopod prey ratio 0.371 3.949 (4) n.s
note: * although n.s- not significant (P < .05), this finding indicates a potential
trend.
A similar pattern that in the MRI neocortex data is evident with respect to the
relationship of estimated neocortex ratios for delphinids and odontocetes and the
foraging ecology variables. From the regression statistics (Table 4.6), it is evident
that none of the variables are significantly related to the CR' The only exception
is once again the number of cephalopod species, which shows a trend towards
being related to the CR for the suborder of odontocetes. However, this trend is
not evident with respect to the more particular family of delphinids.

118
Table 4.6: Foraging ecology variables in relation to estimated eR for species
representing the delphinids and the wider suborder of odontocetes.
Delphinids Odontocetes
Dependent variable adjusted r2 F value p value adjusted F value p valuevalue (d.f.) r2 value (d.f.)
foraging depth .096 .120(9) n.s .050 .385 (12) n.s
total species .037 .676 (8) n.s .084 .069(11) n.s
fish species .158 .047 (6) n.s .076 .293 (9) n.s
cephalopod species .010 .928 (6) n.s .276 4.434 (8) .068"
total:fish prey ratio .163 .017 (6) n.s .035 1.368 (9) n.s
total:cephalopod .084 .457 (6) n.s .079 1.774 (8) n.sprey ratio
SWI .106 .231 (7) n.s .103 .063 (9) n.s
fish:cephalopod prey .144 .243 (5) n.s .079 1.774 (8) n.sratio
note: " although n.s- not significant (P < 0.05), this finding indicates a potential
trend.

119
4. Discussion
To eat and not to be eaten? While this appears to be the issue related to
the neocortical evolution of some mammals, it does not appear to be the case for
dolphins. On the whole', the findings of this chapter are not supportive of a
relationship between foraging ecology and the neocortex ratio in dolphins.
The interrelationship of social structure and ecology has been noted
previously (Crook and Gartlan, 1966; Jarman, 1974; Struhsaker, 1969), where it
has been observed that ecological variability may encourage or constrain
behaviour and sociality (Clutton-Brock and Harvey, 1976; Foley and Lee, 1989).
It is therefore important to consider the function and context of behaviour in
relation to the life strategy of the animal or its ecology (Dunbar, 1988). Some
even suggest an individual population of animals be considered as a "separate
trophic or ecological species", as a consequence of the geographical variation in
niches occupied by a species and the potential significance of ontogenetic
effects on trophic relations (Williams, 1992:120).
Several theories have been proposed to explain the grouping behaviour of
animals, ranging from the reduction in predation risk, or the anti-predation
hypothesis (Van Schaik, 1983), to the foraging ecology hypotheses, such as
resource dispersion (Macdonald, 1983) and resource defence (Carr and
Macdonald, 1989; Wrangham, 1980).
If one conceives of dolphins as both apex predators and prey, then the
findings of neocortical volume being unrelated to foraging ecology variables
become of increasing interest.
It has been argued that in other orders of mammals, such as the primates,
a major factor in determining the group size of animals, and one which may
regard intellectual action, relates to the acquisition of food (Clutton-Brock and

120
Harvey, 1980; Gibson, 1986) or the s~ructuring of ecological resources (Dunbar,
1988; Wrangham, 1979, 1980).
The main issue is perceived to be the complexity of cognitive mapping
(mentally representing spatial and temporal food distribution) required to obtain
patchily distributed but predictable sources of food (Byrne, 1995). Although
range area or day range length have been used to measure such mapping,
Byrne (1995) suggests that these variables underestimate environmental
complexity. In spite of the correlation between brain size and range size (Clutton
Brock and Harvey, 1980), Byrne (1994) suggests that this may be an artefact of
gut specialisation, as a large gut permits a wide~, less specialised diet and
smaller range area. In addition, he notes that a larger gut requires a bigger body
frame, which decreases the relative size of the brain. However, Milton (1988)
contends that differences in gut size do not account for differences in brain size.
Although the size of the gut does not appear to relate to brain size, other
dietary concerns have presented a different picture in the comparative literature.
It was therefore surprising that this study found that dietary diversity and dietary
complexity were not related to the neocortex ratio in representatives of the
delphinid family or the suborder of odontocetes. Particularly as research
conducted on brain size in marine mammals by Worthy and Hickie (1986) shows
that species belonging to Sirenia, which forage on poor quality food, have
relatively small brains, while odontocetes have large RBS, akin to primates.
Findings such as these tend to support the proposal of Milton (1988) that across
different mammalian species, brain size (as well as sociality and breeding
systems) correlates with diet.
Milton (1988) suggested that based on the measure of comparative brain
size (Clutton-Brock and Harvey, 1980), strongly frugivorous primates show
greater cerebral expansion than folivorous groups. Further, when considering
Jerison's (1973) data in relation to dietary focus, Milton (1988) recognised that

121
primates requiring more complex foraging matrices also had greater cerebral
complexity. Research into cranial volumes (Eisenberg and Wilson, 1978)
supported the notion that frugivores and nectarivores have larger cranial
volumes than carnivores, insectivores or sanguivores. This appears to indicate
that an aspect of hyperdispersed, patchy and high-quality food resources
stimulate increased brain size (Milton, 1988).
A concern is that brain and gut tissue compete metabolically, as both are
energetically expensive (Milton, 1988). All organs, with the exception of the
brain, have sizes that are linear functions of body weight, where the metabolic
rates of such organs correlate with body size. However, Aiello (in Byrne, 1995)
suggests that this correlation may be artefactual, for without converting from a
herbivorous diet, the brain and gut tissue could not both be enlarged.
In physiological terms, the mammalian basal metabolic rate (BMR) holds
the relative oxygen consumption or heat production proportional to the 3/4 power
of body weight (Hofman 1983a,b). Related research suggests that brain size
may also scale to body size to the 3/4 power (0.73) rather than 2/3 power
(Hofman, 1983a,b; Martin, 1981). As diet can influence metabolic rate and
metabolic weight is isometric with brain mass, Milton (1988) observes that an
effect of diet on achievable brain mass may be predicted (see Worthy and
Hickie, 1986). Mammalian brain size and metabolism present large interspecific
variation and correspondingly complex energetics (Hofman 1983a,b). Hofman
(1983a,b) also notes that cortex-brain metabolic rate is independent of body size,
increasing with the evolutionary level of brain development.
To recognise the importance of the non-relationship between foraging and
dietary complexity, and the neocortex in dolphins, it is necessary to consider the
metabolism of cetaceans in relation to their brains.
The initial concern that brain studies did not incorporate physiological
considerations (Martin, 1981) has been addressed in subsequent studies of the

122
brain, its size and evolution. For example, Armstrong (1983) examined
mammalian relative brain size in terms of metabolism. From this, it was noted
that brain-body scaling may be determined in the following manner: the brain
controls body functions but is dependent upon the body for energy. As the brain
is continuously metabolically active, it requires vast amounts of oxygen and
glucose, both during sleep and while engaged in mental activity. By the same
token, the brain's development may also be determined by the metabolic system.
Armstrong concludes that "An analysis of the brain's energetics is necessary for
a better understanding of the relation of brain to body" (1983:1304). What is
interesting in this study is that odontocetes are placed higher than primates in
the relationship of metabolism to brain size.
In a variation of these conclusions, Hofman (1983a) found that the ratio of
cerebral cortex-brain metabolism depends solely on the degree of
encephalisation, being independent of body size. In addition, Hofman notes that
brain size is not only a function of metabolism, but also a function of the level of
evolutionary development of the brain. He proposes that species with high
encephalisation will have high brain-body metabolic ratios, mentioning
odontocetes and simians as examples.
On the contrary, Kesarev (1971) notes that simpler cetacean brain
structure may result from the fact that an aquatic environment is considered less
complex than a terrestrial environment, in terms of homeostasis. In addition, he
observes that cetaceans have no competitors at a similar eNS developmental
level in the water.
Yet, although cetaceans may appear to be less homeostatically complex,
they face a barrage of pressures not encountered by terrestrial mammals, such
as the physiological pressures of depth and diving. To illustrate, a coping
strategy for the energy demands of the brain under conditions of oxygen
depletion may lie in the capacity of some vertebrates to engage in anaerobic

123
respiration (Hofman, 1983a). Here, one cannot discard the aquatic environment
of marine mammals and the fact that anaerobic respiration has been observed in
cetaceans. Turning to aerobic respiration, cortical respiration is almost
exclusively neuronal and the number of cortical neurons is a linear function of
cortical surface area (Hofman, 1982b). Cetaceans, with the greatest cortical
surface area (Elias and Schwartz, 1969), possess the largest number of neurons
and thus appear to engage in the greatest amount of cerebral oxygen intake.
Although some of the correlations that approached significance may prove
a slight degree of support for a relationship of neocortex with ecology and
energetics, these were not supported by regression analysis. For example,
foraging depth showed a trend towards a positive relationship with the neocortex
ratio, while the total number of species preyed upon approached a negative
relationship with the ratio. The only significant result of this chapter was the
correlation between the ratio of total to cephalopod prey species and the
neocortex ratio, where these variables were negatively related. However, the
small sample might represent a distorted finding, as no trend existed for this in
other study populations. Nevertheless, such a finding can be explained in terms
of the above findings for primates, where a non-specialised diet or a folivorous
diet is associated with the possession of a smaller brain, (Milton, 1988).
Upon shifting the focus to dolphins as prey, it was unexpected to find a
lack of association between water depth and the neocortex ratio, especially in
the light of the foregoing review on the positive relationship between water depth
and predation (Johnson and Norris, 1986). It may be pertinent to reconsider the
notion that an increased group size supposedly results in the increased fitness of
individuals tending to group under threat of predation (Byrne, 1995). However, as
a result of the open space environment inhabited by most cetaceans, Norris and
Schilt (1988) support the proposals of Alexander (1974), who suggests that
predation may be the primary reason for group living.

124
It has been suggested that several factors are influential in determining
social organisation. For example, various sociality in carnivores, ranges from the
solitary panda (Morris and Morris, 1966; Schaller et al., 1985) to seasonally
social wolves (Fox, 1971; Klinghammer, 1975) and the more gregarious hyaenas
(Kruuk, 1966).
Different reasons are often furnished to explain the social system of the
same species. To illustrate: although the resource dispersion hypothesis has
been thought to explain the sociality of spotted hyaenas (Henschel and Skinner,
1991; Lamprecht, 1978; Mills, 1990), this has been questioned by Hofer and
East (1993) who propose rather that the commuting system of these animals
influences their social structure. Within a single species, different factors may
apply to the social structure of various classes. For example, grouping in cheetah
sibgroups is against predators, while for mature cheetahs it is for access to
mates; in lionesses grouping occurs to enable territory defence, while it is for
easier access to mates in lions (Caro, 1994).
The large neocortex ratios displayed in dolphins do not appear to be
predictive of several variables representing foraging complexity, foraging depth
or dietary diversity. This is of consequence, as dolphins are more closely related
to ungulates and carnivores, for whom neocortex and ecology are related, than
to primates. In the light of this, the investigation moves to study a related are in
dolphins- sound. Sound is not only used for sonar and hunting purposes in
dolphins, but also for communication. As it falls between ecological and social
domains and is involved in each domain, sound is considered to form a bridge
between these parameters and, as such, is discussed in the following chapter.

125
Chapter 5. Sound and relative neocortical volume in dolphins.
1. Introduction
Earlier, it was found that the neocortex ratio was not significantly
correlated with variables representing foraging ecology in dolphins (Chapter 4).
Sound serves two major functions for dolphins, echolocation and communication.
While echolocation is used to forage, the wider spectrum of sound production is
used for social and communicative purposes. Based on this perspective, sound
might be viewed as the intermediary between foraging ecology and sociality. It is
therefore reasonable to consider the acoustics of dolphins in relation to their
brain evolution, before moving to consider the variables representing sociality.
Sonar or echolocation refers to the process used by animals emitting
acoustic energy and receiving returning echoes to detect, locate, differentiate
and recognise objects, as well as for orientation or navigation (Au, 1993; Purves
and Pilleri, 1983). Sonar was first discovered in bats at the beginning of this
century (Maxim, 1912) and it was less than 50 years ago that a similar discovery
was made in dolphins (McBride, 1956).
The dolphin's capacity for the production of sounds and sonar pulses is
evident when one considers that peak frequencies range from 30 to 135 kHz,
although the source of production is not specifically known (Au, 1993). Dolphin
signals are used adaptively and dynamically, depending on the characteristics of
the environment and the target, as well as the specific use of the sonar
(Nachtigall, 1980; Penner, 1988). For example, the amplitude of a signal will
increase if a target is of smaller size, if discrimination is more difficult, or if there
is an increase in target range or masking noise (Au, 1993). In addition to being
used for foraging, sonar is used for food capture or as a weapon through "pulse
bursts" to stun the target (Morris, 1986).

126
Sound, aside from hunting or navigation purposes, also serves as a vital
tool of communication in cetaceans (Tyack, 1981). For example, while on their
breeding grounds, humpback whales sing long and complicated songs that vary
progressively from year to year (Payne, Tyack and Payne, 1983). Killer whales
appear to generate at least three distinct sound types, namely whistles, clicks
and pulsed calls. While whistles are used during periods of rest, clicks and
pulsed calls are used during activity. The pulsed calls appear to be most unique
to a specific pod. (Ford and Fisher, 1983).
Ridgway (1986a) proposed that the large size of the dolphin brain may be
the consequence of hypertrophy of their auditory system. While the medial
geniculate and the inferior colliculus are substantially larger than in humans, the
nucleus of the lateral lemniscus is enormously increased. Bullock and Gurevich
(1979) support this, proposing that other brainstem nuclei are also substantially
enlarged in dolphins. The cerebral cortex of dolphins may have expanded as a
consequence of the acoustic and auditory demands placed on it (Langworthy,
1932; Wood and Evans, 1980). To Moore (1991 :380), "the special part of the
dolphin sonar system is the brain behind the signal receiver, the signal processor
itself. Determining how this processor works will eventually lead to greater
understanding of dolphin sonar."
This chapter aims to study the relatively large neocortex ratios found for
dolphins in relation to acoustic production and perception. Variables representing
sound diversity, energy, frequency and the duration of signals have been
appropriated from the available literature. These are related to actual neocortex
data for the MRI delphinid study species (chapter 2), as well as to the estimated
data for other delphinids and odontocetes (chapter 3). Bearing in mind that the
auditory cortex appears highly adapted in the delphinids, it is quite possible that
the relative size of the neocortex will be related to certain sound parameters.

127
2. Method
The method section of the current chapter follows the same format as that
of the previous chapter. Briefly, the acoustic variables were considered as the
dependent variables and these were regressed onto the independent variable,
the neocortex ratio. For more comprehensive information refer to Chapter 4,
section 2.
2.1. Study animals
The study animals comprised subjects from Chapters 2 and 3, with actual
and estimated neocortex ratios. The same species w~re examined as in Chapter
4, with several exclusions, as there was no acoustic information for them. They
include Burmeister's porpoise, the dusky dolphin, the dwarf sperm whale,
Fraser's dolphin, Gray's beaked whale, the pygmy killer whale, the pygmy sperm
whale and the striped dolphin.
A set of documented sound variables was used in relation to the
neocortex ratio. These included the number of sound types, minima, maxima and
range values for energy, frequency, peak frequency and signal duration (Table
5.1).

128
Table 5.1: Sound variables in Odontocetes.
Species no.sounds
min. max.freq freq.
freq. min. max. ener min. max.range ener ener1 range peak peak
freq.2 freq.
peak min.freq. signalrange dur.3
max. signalsignal dur.dur. range
Bot 5
Corn 3
.1
.2
300 299.9 15 130 115 110 130 20
150 149.8 4 60 56 23 67 44
50
50
80
150
30
100
Hum 3 3 30 27
Spo 2 6.5 150 143.5
Spi 8.7 14.3 5.6
ris 65 65 40 100 60
fal 100 130 30 100 120 20
kil
sho
6 .1 80 79.9 .25 40 39.75 14
30
20
60
6
30
210 210
pia 2 25 200 175 100
har 2 41 160 119 2 150 148 120 140 20 130 260 130
Note: 1ener- energy, Hz; 2freq- frequency, Hz; 3dur- duration, seconds. Data on
peak frequency and signal duration from Au (1993, p.134). Data on number of
sound types, energy and frequency from Evans (1987, pp.12-17).
2.2. Materials
Data on the neocortex ratio in dolphins were obtained from MRI (Chapter
2), as well as from estimates applied to cranial volume data (Chapter 3). For
more comprehensive details, refer to Chapter 4, section 2.2.
2.3. Procedure
In accordance with chapter 4 (section 2.3), CR values from MRI and
estimations using skull volumes were related to the dependent variables, in this
instance, the sound variables. The data analysis was conducted using SPSS
version 6.1 and an alpha level of .05 was considered to be significant.

129
3. Results
3.1. Correlational analysis
The sound variables were explored in terms of their correlation with the
neocortex ratio (Table 5.2). Although the number of sound types does not
significantly correlate with the MRI data, it does reach significance with the
estimated neocortex ratios for representatives of the family of delphinids and the
suborder of odontocetes. Minimum and maximum energy values were not
significant, while energy range only showed a trend towards a negative
relationship with the neocortex ratio in odontocetes.
Although the minimum frequency did not correlate with either the MRI or
estimated neocortex ratios for the major species, there was a trend towards a
negative relationship for the two variables for MRI delphinid data. In addition,
minimum frequency was negatively related to estimated neocortex ratios for
delphinids and odontocetes.
Maximum frequency and frequency range did not correlate with the
neocortex ratio across the spectrum of study species. Minimum and maximum
peak frequency were also not related to any categories, although there were
trends towards a negative relationship with the estimated neocortex ratio in
odontocetes.
Minimum signal duration was not significantly related with the neocortex
ratio of any category, except for estimated delphinid data where a positive
correlation was evident. Although maximum signal duration approached a
negative relationship with the neocortex ratio, it was not otherwise significant.
The range of signal duration did not relate to the MRI or estimated CR with the
exception of the estimated delphinid data, where a negative trend was apparent.
However, signal range did share a significant, negative relationship with the
estimated CR for odontocetes.

136
appears to be a good predictor of sound frequency range in delphinids (p < .05).
It appears that animals with a larger neocortex ratio are capable of perceiving or
processing a wider frequency range of sound.
Although dolphins display a similar response to tone signals as that of
terrestrial mammals, they differ significantly in terms of their wide frequency
range. For example, whereas the dolphin audiogram follows the same pattern as
that of the human, it is capable of detecting frequencies 10 factors higher than
humans (Au, 1993). Distinguishing marks of dolphin audition are therefore the
upper frequency ceiling as well as high hearing sensitivity (Johnson, 1986). This
contributes to explaining the positive trend towards a relationship between
maximum frequency and the neocortex ratio in delphinids.
Au (1993) recognises that the functional similarities of the dolphin auditory
system to humans and other terrestrial mammals bear testimony to its sensitivity
and sophistication. It is interesting to observe that a negative correlation exists
with respect to minimum frequency and the neocortex ratio in dolphin and
odontocete estimates (p < 0.05). This draws support for the literature on
neocortical complexity (Nauta and Feirtag, 1986), as it implies that animals with
relatively larger neocortices have an increased capacity to perceive and process
lower frequencies.
Neither minimum, maximum nor signal duration range values were related
to the relative size of the neocortex using regression analysis. This was
unanticipated, considering the nature of dolphin signals, which are of a duration
that is short enough to permit the distinction and recognition of differences
pertaining to the sonar target. It follows that the capacity of greater target
discrimination is restricted by the time or range resolution capability of the sonar
signal (Au, 1993). This applies to interpreting the findings that minimum signal
duration is positively related to the neocortex ratio in delphinids (p < .05), while

138
Unlike the song dialects of birds which constantly relate to geographical
location (Krebs and Kroodsma, 1980), killer whale dialects exist in pods capable
of interbreeding and not geographically isolated from each other. This led Ford
and Fisher (1983) to suggest that killer whales possess true dialects, which
remain consistent in spite of regular associations between pods. As killer whales
live in highly stable kin groups, the utility of a dialect may be to maintain kin
relations over time. Family traditions are considered vital to the survival and
success of the group.
In view of this, the adaptive benefit of pod dialects to preserving pod
identity and cohesion becomes apparent (Ford and Fisher, 1983). The social
value of sound to dolphin groups is apparent when one considers that new
sound types are often recorded during periods of dolphin socialising (Schultz,
Cato, Corkeron and Bryden, 1995). The relationship between sound and sociality
therefore should not be underestimated.
It is worth recognising that delphinid neocortex ratios appear more
substantially related to the variables of sound than to those of foraging ecology.
The significance of sound needs to be considered as not only for hunting
purposes, but perhaps more importantly for its enabling and maintenance of
social cohesion in dolphins. The possession of a relatively large neocortex may
permit enhanced auditory perception and production, which may be in the
interests of the evolution of sociality. It is appropriate that social complexity forms
the subject of the next chapter, which explores the relationship of the neocortex
ratio and sociality in dolphins.

139
Chapter 6. Sociality and relative neocortical volume in dolphins.
1. Introduction
Earlier chapters examined the relatedness of the neocortex ratio to
foraging ecology and sound. The findings did not provide conclusive evidence
that these variables are closely related with, or predictable from, the neocortex
ratio, although aspects of sound production were correlated with the ratio. The
major remaining category of analysis in relation to delphinid neocortex is
sociality. Several studies have been· conducted with primates and other
terrestrial mammals where the neocortex has been studied in relation to sociality
(Dunbar, 1992, 1995; Dunbar and Bever, 1997; Sawaguchi and Kudo, 1990).
Within Cetacea, a wide range of social structure is apparent, synonymous with
social organisation (Whitehead, 1997). Being social or being a part of a school or
pod does serve several important functions. These not only include the
ecological functions of hunting and protection from predators, but also enable
functions such as reproduction and the consequences thereof, including
gestation, lactation, maternal investment and individual learning.
Research has promoted the notion that social considerations, more
significantly than ecological concerns, have selected for increased brain size in
primates (Byrne, 1995; Byrne and Whiten, 1988; Humphrey, 1976). Although
these studies have proposed that the developing social structures in primates
are linked to the evolution of the brain, a study by Sawaguchi and Kudo (1990)
represents the first attempt to provide evidence that neocortical development
relates to social structure. The divisions of primate social structure investigated
included solitary, monogynous and polygynous species, these being classified in
congeneric groups, where congeneric species shared social and ecological
commonalties (Clutton-Brock and Harvey, 1980).
Sawaguchi and Kudo (1990) found several interesting relationships. The
relative size of the neocortex was independent of brain size or body size.

142
individual or group movement (Norris and Dohl, 1980; Pryor and Schallenberg,
1991).
Cetacean schools function to allow social integration, with the school
being viewed as an equilibrium system, composed of centrifugal forces which
promote school cohesion and centripetal forces which spread the school apart
(Norris and Dohl, 1980). Different conditions result in drastic alterations to
dolphin school size and the spacing of animals and subgroups. Cohesive
influences include protection, fright, sleep or rest and familial or habitual
associations, whereas dispersive patterns include alertness, aggression, feeding
and a lack of association.
Sensory integration is perceived as being a crucial function of the dolphin
school, as the school facilitates the integration of individual sensory information
for more efficient environmental surveillance, faster reaction time to predators
and also enhances the confusion effect (Norris and Johnson, 1994; Norris and
Schilt, 1988). Sensory integration is multi-faceted, relying on visual, auditory
(active echolocation or passive listening) or taste, temperature variation or tactile
sensation. This provides animals with more environmental information, freeing
them to engage in various forms of activity (Bel'kovich et al., 1991; Norris and
Dohl, 1980).
As dolphins are highly socially advanced 0!Vood,' 1986), their intraschool
relationships are expected to be complex. An additional point to consider is that
schools are not fixed, invariant groups, but that they constantly vary through
individuals or small groups changing fr0f!l small to large groups (Norris and Dohl,
1980). This is highlighted by Smolker, Richards, Connor and Peter (1992), who
suggest that bottlenose dolphins live in fission-fusion societies. Wells, Irvine and
Scott (1980) propose that cetacean groups, especially in odontocetes, display
great interspecific variation in typical group size, age and sex composition,
frequency and duration of interactions and associations. While freshwater

143
dolphins are often solitary or live in small groups, pelagic species reach
aggregates of up to several thousand. However, most cetaceans are social
(Wuersig, 1986), which confers an advantage to individual members of the
group.
The school serves several functions related to more efficient reproduction
and the consequences of this for mothers (gestation, lactation and maternal
investment), in addition to facilitating individual learning.
The proximity of individuals in a school allows reproductive synchrony to
occur at reduced energetic expenditure than if the animals were separated by
large distances (Wells, Irvine and Scott, 1980). However, the cost of living in a
group is incurred through sexual rivalry (Norris and Dohl, 1980). Reproductive
synchrony occurs primarily in migrant species, whereas tropical and sub-tropical
cetaceans tend to have broad, unseasonal reproductive modes (Wells, Irvine
and Scott, 1980).
Lycett (1995) observes, with specific reference to primates, that females
sustain significant reproductive costs. These incorporate prolonged gestation,
lactation and weaning, and maternal investment. Life in a social group appears
to ease the burden of these costs for dolphin mothers, as allomothering has
often been observed (Wells, Scott and Irvine, 1987). In dolphins, the stage of an
individual's development appears to determine its location within a school and
individual learning is afforded by this (Norris and Dohl, 1980). Mother-young
pairs are very common within schools and this dyadic relationship remains
important through development of the calf into full maturity. It is often the case
that juveniles are located throughout a school and that they may lead the school.
Where dominance is concerned, the placing and spacing of subgroups and
sexual segregation within the school are important (Norris and Dohl, 1980).
Odontocetes display a highly developed capacity for learning (Herman,
1986). Norris and Dohl (1980) argue that, as with other higher mammals, this

144
capacity appears to suggest the importance of learning in the social systems of
odontocetes. They propose that the school is the social unit within which learning
becomes meaningful and that the school thus becomes vital as the setting within
which the young animal learns and develops. Schools learn to avoid vessels that
harass them and approach vessels that provide food. Play appears to be linked
to learning, as has been noted with respect to the "practising" of aerial patterns,
surf riding and tossing food (Norris and Dohl, 1980). The complexity of dolphin
schools is thought to relate to their capacity for complex learning (Herman, 1980)
and their comprehension of the contingency patterns necessary for learning to
occur (Norris and Dohl, 1980).
1.2. The social structure of delphinid species off KwaZulu-Natal
The difficulties associated with observing dolphins in their natural habitat
have precluded our current knowledge of many species (Johnson and Norris,
1986). However, the social structure of the local delphinid species, for which MRI
and cranial data were obtained, is summarised using available data. It is
important to note that all of the data described for local populations are based on
estimates from different sightings. Some estimates are obtained using aerial
photography, which has been documented as providing an accurate index of
school size (Gilpatrick, 1993). Other estimates are taken from the water and
although this method has limitations, it represents the only consistent way of
studying grouping in cetaceans (Findlay, pers.comm).
Gaskin (1982) notes that riverine/estuarine bottlenose dolphins have a
group size of 5-10 animals, consisting of family units with few adult males in
attendance. However, Indian Ocean bottlenose dolphins have a mean group size
of 67 animals (Findlay, 1992) with groups displaying dominance hierarchies
(Wells, Irvine and Scott, 1980). These bottlenose dolphin group characteristics
include adult males, females and offspring; subadult males; subadult females;
mixed groups of males and offspring and fluid associations within a school .

145
(Wells, Irvine and Scott, 1980). Inshore forms of bottlenose have maternity
groups of 30-40 individuals, sometimes including larger groups of non-lactating
females, mature males and adolescent groups for up to several days
(Peddemors, 1995). There are also extended mother-calf relations for up to 3
years (Cockroft and Ross, 1990b). Saayman and Tayler (1973:994) suggest that
grouping primarily occurs in local bottlenose dolphins to enable co-operative
hunting and remark that large schools suggest a "successful adaptation to the
exploitation of both the inshore and more prolific pelagic food supply".
In terms of sociality, common dolphins have been referred to as one of the
most gregarious cetacean species, occurring in large schools of up to several
hundred and aggregates into the thousands (Cockroft and Peddemors, 1990;
Leatherwood and Reeves, 1983). Findlay (1992) observes that the mean group
size for common dolphins off the South African coast is 267 animals, although
Cockcroft and Peddemors (1990) suggest that larger school sizes occur during
the winter months, in association with increased fish abundance.
The small humpback dolphin group size can be contrasted with the large
group sizes of other inshore species, such as bottlenose dolphins (Saayman and
Tayler, 1973). Humpback dolphin group size is taken to vary from 2 to 5
members, consisting of small family groups and single animals (Gaskin, 1982).
Wells, Irvine and Scott (1980) note that humpback dolphins are often alone or in
pairs, with groups usually numbering less than 10 individuals and being very
labile in character, while groups larger than 10 are of mixed composition.
Saayman and Tayler (1979) propose that humpback dolphins display a highly
flexible social organisation, with larger groups (above 10) having various
subgroups. Most of the pairs or solitary animals are adults, while immatures
usually associate in groups with more than one adult. Females appear more
resident in an area than males (Durham, 1994). Saayman and Tayler (1973)
propose that the restriction of the primary food sources of humpbacks to reefs

146
and rocky feeding grounds may explain their smaller group size and social
system.
World-wide, spotted dolphin groups range from 100-500+ members in
size, with family units moving within larger, more flexible feeding aggregates
(Gaskin, 1982). Findlay (1992) notes that average group size for spotted
dolphins in Southern Africa is 94 members, with a range from 200-300
individuals.
Striped dolphin school size in southern Africa varies from four to several
hundred members, with the average school size at 75 dolphins (Findlay, 1989).
This can be compared with schools captured off the Izu Peninsula, Japan, where
no seasonal variation was observed and where the range was from 25 to 2327
animals, with the mean school size at 415 animals. These large schools are
often composed of numerous small schools, ranging from 20-200 dolphins.
Groups were either composed of immature or mature members while some had
mixed membership (Miyazaki, undated manuscript).
Not much information is available for the remaining species off local
waters. Fraser's dolphin appears to be gregarious (Peddemors, 1997) and in
South African waters groups range from 7 to 1000 individuals, with a mean of
183.1 animals (Findlay et al., 1992). Risso's dolphin is comparatively less
sociable than many other species locally encountered, with group sizes ranging
from 1 to 80 individuals with a mean of 11.09 (Findlay, 1992). Dwarf sperm
whales have a school size of not more than 10 animals and the schools may
comprise females and calves, immature groups or sexually mature males and
females in the same group.
With reference to these data on group size and resultant sociality of
odontocetes off KwaZulu-Natal, this study aims to test the hypothesis that
neocortical evolution is correlated with sociality and social complexity in toothed
whales and dolphins.

147
2. Method
It should be noted that the same method has been used as that of
section 2 of Chapters 4 and 5 respectively. For the purposes of this thesis, the
method sections are not repeated. Instead, for each subsection, the reader is
referred to the relevant preceding sections of the thesis for comprehensive
details.
2.1. Study animals
The study animals were drawn from the MRI sample and the cranial
volume sample in the same manner as previously described in section 4.2.1
(Chapter 4).
The specific sociality variables of mean group size, maximum aggregate
size, gestation, lactation and calving interval were obtained from the literature.
These variables are noted in Table 6.1. However, it should be noted that data for
certain species of different odontocete families are still unavailable, namely for
certain platanistids (Brownell, 1984) and some porpoises (Gaskin, 1984).

148
Table 6.1. Sociality Variables in Odontocetes
Species
Bottlenose d.
Common d.
Humpback d.
Spotted d.
Striped d.
Spinner d.
Fraser's d.
Dusky d.
Risso's d.
False Killerw.
Pygmy Killerw.
Killerw.
Short-finned pilot w.
Dwarf Sperm w.
Pygmy Sperm w.
Indus River d.
Harbour p.
Burmeister's p.
Gray's Beaked w.
Groupsize (n)
67
267
7
94
75
128
183
35
11
16
11
10
14
8
4
5
5
5
5
Max.aggregate
size (n)
1000
1000
20
1000
3000
1000
800
500
300
300
300
100
500
10
10
10
250
8
10
Gestation(months)
12
10.5
12
11.5
12
10.6
11
12
16
17.2
15.5
11
10.5
10
13.9
Lactation(months)
19
19
19.5
14
18
18
18
12
24
8
7
Interbirthinterval
(months)
36
24
36
32
40
37
68
78
24
24
18
24
Note: Data sources. Group size: bottlenose: Peddemors et al. (sub); common, dusky, false killer
whale, Fraser's, Risso's, spotted, striped: Findlay et al. 1992; humpback: Durham, 1994; Indus
River dolphin, spinner and Gray's beaked whale: Evans, 1987; porpoises: Evans, 1987;
Leatherwood and Reeves, 1983; pygmy killer whale: Best, 1970; pygmy sperm whale:
Leatherwood & Reeves, 1983; short-finned pilot whale: Ross, 1984; Killer whale: Findlay et al.,

149
1992 and Sylvestre, 1995. Maximum aggregate size: all species: Evans, 1987. Gestation:
bottlenose: Cockcroft and Ross, 1990a, common: Mendolia, 1990; Gray's beaked whale, Indus
River dolphin, pygmy sperm whale, short-finned pilot whale: Evans, 1987; harbour porpoise:
Perrin and Reilly, 1984; humpback: Cockcroft, 1989; false killer whale: Evans, 1987, Perrin and
Reilly, 1984; spinner, killer whale: Evans, 1987 and Sylvestre, 1995; striped and spotted- Perrin
and Reilly, 1984 and Evans, 1987; Risso's: Sylvestre, 1995. Lactation: dusky dolphin, harbour
porpoise, Gray's beaked whale, killer whale, short-finned pilot whale: Evans, 1987; bottlenose,
common, spinner, striped and spotted- Perrin and Reilly, 1984, and Evans, 1987. Interbirth
interval- bottlenose, Cockcroft and Ross, 1990a; dwarf sperm whale, harbour porpoise, Gray's
beaked whale, Indus River dolphin, spinner: Evans, 1987, humpback, Cockcroft, 1989; common
Mendolia, 1990; short-finned pilot whale, striped: Perrin and Reilly, 1984 & Evans, 1987; spotted
Perrin and Reilly, 1984;
2.2. Materials
The materials used, both from the neuroimaging component and the
cranial analysis component are described previously. For a brief description,
refer to section 2.2 (Chapter 4).
2.3. Procedure
The actual MRI neocortex data for the major study species and the
delphinids and the estimated neocortex data for the delphinids and the
odontocetes from cranial analysis were related to the set of sociality variables.
The data were analysed using SPSS and results were accepted as significant at
an alpha level of .05.

150
3. Results
3.1. Correlational analysis
The nature of the correlations between the sociality variables and the
neocortex ratio were established (Table 6.2). Mean group size does not
generally appear to be related to the CR, although there is a trend towards a
negative relationship for these variables from the MRI delphinid data. Maximum
aggregate size approaches significance with respect to the CR, where a positive
trend is evident.
Lactation is not at all related to the CR. While gestation and the intercalf
interval are not related to the CR for the MRI sample of major species or other
delphinids, several relationships are present with respect to the estimated
neocortex data. Gestation is positively related to estimated CR in delphinids and
other odontocetes and shows a trend towards this in estimated data for the major
species. The same situation is apparent for the intercalf interval (Table 6.2).

151
Table 6.2: List of correlations for sociality variables with the neocortex ratio
major major delphinids1 delphinids2 odontocetes2
species1 species2
mean group size n.s n.s n.s n.s n.s
maximum .969 n.s n.s -.407 n.saggregate size (3) (13)
.083 .0843
gestation n.s .977 n.s .709 .708(3) (11 ) (14)
.0683 .007* .002*
lactation -.975 n.s -.975 n.s n.s(3) (3)
.073 .071 3
interbirth interval n.s .977 n.s .554 .572(3) (8) (11 )
.0683 .0773 .033*
Note: 1 refers to MRI neocortex data for major delphinid species of interest and
delphinid species in general; 2 refers to estimated neocortex data for major
delphinid species, delphinid species in general and the wider suborder of
odontocetes; n.s.- not significant at p < .05; 3potential trend, ·significant
relationship. Results presented Lt.o. r value, n, p value.
3.2. Weighted Linear Regression
The dependent (study) variables of sociality and the independent variable,
CR, were logarithmically transformed to linearise the data. From this, linear
regression analysis was performed. The regressions were weighted by the
frequency of individuals represented within each species and the results are
evident in Table 6.3.

152
Mean group size for delphinid species shares a significant relationship
with the CR' The resultant equation to predict group size from neocortex is
provided below and the relationship is illustrated in Figure 6.1:-
log (mean group size) = -17.58 + 33.411 log (CR)
Maximum aggregate size in delphinids is also positively related with CR'
although not as significantly as mean group size. The predictive equation for
aggregate size from CR is presented below and displayed in Figure 6.2 :-
log (maximum aggregate size) = -18.955 + 37.128 log (CR)
The reader is cautioned to observe the outlier (humpback dolphin) in
Figure 6.2. As a result of the small sample size, it was decided not to remove
species data points from the analysis. However, it is possible that if the
humpback dolphin were removed, the relationship might not hold. Finally, none
of the other sociality variables are related to the CR of the MRI study species.
Table 6.3: sociality variables in relation to eR data from MRI
Dependent Variable adjusted r2 value F value (d.f.) p value
mean group size .72 13.828 (4) .021*
maximum aggregate size .674 11.332 (4) .028*
gestation .235 2.228 (3) n.s
lactation .355 2.101 (1 ) n.s
interbirth interval .187 1.92 (3) n.s
note: *significant, n.s- not significant at p < .05.

153
2.5~----------------O---'
o
Total Population
species
o Risso·s dolphin
o Frasers dOlphi~
X spotted dolphin
6. humpback dolphin
o common dolphin
C> bottlenose dolphin
.60.59
o
.58.57.56.55
2.0
1.5
Q)
.~en0. 1.0:JeClccaQ)
EClo..J .5 +,-----r------,-----.------r----~--___i
.54
Log neocortex ratio
Figure 6.1. Mean group size and the neocortex ratio for MRI dolphin data.

154
3.5.,..---------------------,
Total Population
species
6 Risso's dolphin
* Fraser's dolphin
<l spotted dolphin
V humpback dolphin
o common dolphin
o bottlenosedolphin
.60.59.58.57.56.55
2.5
2.0
3.0
Q)
.!::!(JJ
"C~
Q).J:
§ 1.5E·xcaEClo..J 1.0~---,-----r___--__r---___r---__,_---___i
.54
Log neocortex ratio
Figure 6.2. Maximum aggregate size and the neocortex ratio for MRI. .
dolphin data.

155
The set of sociality variables were also tested for predictability in relation
to estimated CR values for delphinids and odontocetes. Once again, the variables
were logarithmically transformed and the regressions were weighted by the
frequency of individuals within each species (Table 6.4). The results of the
correlations and regression tests are different as a consequence of the methods
used in the regression tests (weighting by least squares).
For the delphinids, all of the sociality variables do not appear to be
predictable from the CR' The only variable that shows a slight trend towards
relatedness with the CR is the gestation period. A similar situation is evident with
respect to the data for the order Odontoceti, where most of the variables are
unrelated to CR' The exception is gestation period, which is significantly related
to the CR for odontocetes. The predictive equation is as follows and is presented
in Figure 6.3:-
log (gestation period) = .377 + 1.226 log (CR)
Table 6.4: Sociality variables in relation to estimated CR data.
Delphinids Odontocetes
Dependent adjusted r2 F value (d.f.) P value adjusted r2 F value (d.f.) p valueVariable value value
mean group .044 1.557 (11) n.s .059 .047 (16) n.ssize
maximum .012 .875(11) n.s .062 .001 (16) n.saggregate
size
gestation .213 3.71 (9) .0861 .232 4.933 (12) .046*
lactation .117 .160 (7) n.s .005 1.054 (9) n.s
intercalf .071 .537 (6) n.s .087 1.958 (9) n.sinterval
note: 1potential trend, "significant relationship, n.s- not significant at p < .05.

156
0 Gray's whale1.3
8 harbour porpoise
0 pygmy sperm whale
0@ short finned pilot w
*hale
1.2 @0 killer whale
* false killer whale0
0 risso's dolphin
1.1 0 dusky dolphin
cxo L. spinner dolphin<l
0 0 \l striped dolphin
"C + <l spotted dolphin0.i::
6-(1) 1.0l> humpback dolphinc-
c0
+ common dolphin:;::ca...tJ)(1)
X bottJenose dolphinClCl --0
.9 Total Population..J
.46 .48 .50 .52 .54 .56 .58 .60
Log estimated neocortex ratio
Figure 6.3. Gestation period and estimated eR vafues f-or odontocete data.

157
3.3. Correlations of significant variables with other study variables
Mean group size and maximum aggregate size are related to CR in the
MRI study species, while gestation appears related with the estimated CR in
odontocetes. All of the study variables were subjected to a correlational analysis
with group size, aggregate size and gestation period, to establish what other
variables may be of potential significance.
This analysis operated at different taxonomic levels. In odontocetes,
gestation appears to be significantly correlated with interbirth interval, foraging
depth, number of sound types and dietary diversity. Gestation also shows a trend
towards a relationship with mean group size and minimum signal duration in
odontocetes (Table 6.5).
Table 6.5: Study variables significantly correlated with odontocete gestation
correlate r n p
foraging depth .698 13 .004"
interbirth interval .828 11 .001"
mean group size -.354 15 .0981
minimum signal duration .624 6 .0931
sound types .819 8 .006"
SWI dietary diversity -.712 9 .016"
note: "significant relationship (p < .05), 1potential trend (p < .1)
Maximum aggregate size in the MRI species appears to be perfectly
correlated with minimum signal duration, although the small sample dictates
caution. The next most significant relationship concerns the ratio of total prey
species to fish prey species. It appears that this ratio is negatively correlated with
herd size, implying that animals with less individual fish species in their diets live
in larger aggregates. There is also a negative correlation with total number of

158
prey species, implying that more diverse feeders are encountered in smaller
aggregates. Mean group size approaches a positive association with herd size
(Table 6.6).
Table 6.6: Study variables significantly correlated with aggregate size in
species subjected to MRI
correlate r n p
mean group size .672 6 .0721
minimum signal duration 1 3 .000*
total prey species -.739 6 .047*
total:fish prey species ratio -.927 5 .012*
note: *significant relationship (p < .05), 1potential trend (p < .1)
In the MRI study species, mean group size shares a significantly negative
relationship with gestation period and the interbirth interval. A trend towards a
positive association with maximum aggregate size is also evident (Table 6.7).
Table 6.7: Study variables significantly correlated with group size in MRI
species
correlate
gestation period
interbirth interval
maximum aggregate size
r
-.973
-.972
.672
n p
5 .003*
4 .014*
6 .0721
note: ·significant relationship (p < .05), 1potential trend (p < .1)

159
4. Discussion
Several features of sociality appear to be related to the neocortex ratio in
delphinids and odontocetes. This is not surprising when one considers the social
complexity of toothed whales from an aquatic perspective, in relation to other
mammals.
The social structure or social organisation of an animal is perceived to be
the consequence of a consistent network of social relationships, which are
sustained through the social interactions of individuals (Hinde, 1976, 1983; Lott,
1991 ).
In the current study, an intricate regression analysis revealed that
maximum aggregate size and mean group size were significantly predictable for
the actual delphinid MRI neocortex data, although not predictable from the
estimated data for delphinids (section 3.2).
When considering the sociality of marine animals, the most obvious
causal difference between dolphin and fish schools stems from the complex
sociality of delphinids and the phylogenetic difference to fish schools. In addition,
the neural organisation of mammals is more advanced than that of piscenes
(Norris and Dohl, 1980). Therefore, fish schools do not exhibit the social features
of families or play groups, neither do they have well developed parental care
and/or familial bonds. As opposed to the short duration of fish mating, dolphin
reproductive patterns occur in different social contexts. In addition, Connor and
Norris (1982) have indicated that dolphin schools possess a higher level of
complexity than fish schools as a consequence of their cultural tradition, where
culture is considered to be the transmission of behaviour between individuals
through learning or teaching (Bonner, 1980). For such a society to confer an
advantage on its members, there must be co-operation between individuals,
predictable behaviour and certain compromises in the expression of individuality
(Bonner, 1980; Norris and Schilt, 1988).

160
The complexity of dolphin societies is recognisable. Certain cetacean
species have segregated age and sex subgroups, while most have mixed age
sex groupings (Wells, lrvine and Scott, 1980; Wells, Scott and Irvine, 1987). In
bottlenose dolphins, the most common groupings include mother-calf pairs,
mixed sex and single sex groups of subadults, bands of females and recent
offspring and small units of adult males (Wells, 1991). The major subgroups
observed in spotted dolphins include female-calf pairs, female-young subgroups,
juvenile subgroups, adult male subgroups and young adults (Pryor and
Schallenberger, 1991). The intensity of. interaction and association may vary
from swimming together in migration, for example common dolphins, to being
part of a permanent family unit, for example, killer whales (Ford and Fisher,
1983). For bottlenose dolphins, the composition of the group may vary
dynamically within a stable herd, although subgroup associations display a
greater duration (Wells, lrvine and Scott, 1980).
Yet, it is interesting that the predictive relationship of group or aggregate
size from the neocortex ratio does not extend to the suborder of odontocetes in
general (section 3.2). As the delphinidsare the youngest derived family within
the odontocetes, this may indicate that social complexity is a recent evolutionary
phenomenon. This assertion can be supported by considering the sociality of the
relatives of the toothed whales, the baleen whales and terrestrial mammals.
It should be noted that baleen whale school structure does not generally
resemble the tightly cohesive schools of toothed whales, as the schools of the
former species are more widely dispersed or individuals live solitarily (Norris and
Dohl, 1980). This may be as a result of their capacity for long distance
communication. However, although being recognised as less socially complex,
these cetaceans do form large aggregates at breeding, calving or feeding
grounds (Norris and Dohl, 1980).

161
Comparisons between inshore odontocete and terrestrial mammal social
behaviour and structure indicate that dolphins and ungulates both display
allomothering, care-giving behaviour, dominance hierarchies and group defence.
For example, African buffalos and bottlenose dolphins have herds and schools of
fixed home ranges, with slight overlaps, while the groups display mixed and fluid
constitutions, and group defence (Wells, Irvine and Scott, 1980). In addition, the
convergence of the social structure of dolphins and carnivores, such as lions,
has drawn comment and is believed to hold considerable evolutionary
significance (Wells, Scott and Irvine, 1987). Even more relevant to this
discussion are the similarities in sociality between certain cetaceans and
primates.
The social organisation of bottlenose dolphins has been described as
being very similar to that of certain primate species (Tayler and Saayman, 1972).
For example, it has been found that bottlenose dolphins and baboons both form
dominance hierarchies, mate via rotating consort relationships without
permanent sexual pair bonds and both have group defence. Chimpanzees and
bottlenose dolphins both have well defined, stable home ranges, with fluid
composition of subgroups within the group, dominance hierarchies and co
operative hunting and defence also occurring (Wells, Irvine and Scott, 1980).
Although Smolker, Richards, Connor and Pepper (1992) observe that the social
structure of certain dolphins and primates is similar, they suggest that the biggest
differences between the two are the less closed social units of dolphins and the
greater rate of consistency in adult associations in dolphins.
Yet one may justifiably ask why there is such a fuss about sociality.
Sociality serves the cause of adaptation in two main ways, through the prolonged
dependence that allows infants to explore and through the possibility of allowing
these younger animals to interact with and learn from older, experienced animals
(Humphrey, 1976). It follows that there will be selection for a longer dependency
and a larger number of learned animals and thus an enlargement of the group.

162
Joffe (1997) has partially confirmed this for primates, by verifying that social
pressure has selected for a period of extended learning. However, the bigger
and more complex the group becomes, the more difficult resources are to locate,
obtain and share (Carr and Macdonald, 1984; Humphrey, 1976).
It takes considerable cognitive effort to maintain group cohesion under
such conditions and Humphrey (1976) therefore suggested that such societies
would become more complex. In the light of this, it was proposed that to promote
social living, the animal would have to have evolved greater cognitive capacities
(Sawaguchi and Kudo, 1990).
In primates, neocortex is closely related to' social structure, where the
association is not the result of the relationship between neocortex and diet or
activity timing (Sawaguchi and Kudo, 1990). It was observed that polygynous
monkey species had more fully developed neocortical areas than monogynous
monkeys. This is relevant as neocortical areas are located in the prefrontal and
temporal cortices, used in social behaviours such as facial recognition,
allogrooming, vocalisations and maternal behaviour (Sawaguchi and Kudo,
1990).
According to Kling (1986), these cortices are vital for maintaining social
cohesion and affiliative behaviour in polygynous anthropoids. Polygynous
monkeys, prosimians and apes have larger prefrontal cortices than their
monogynous counterparts (Sawaguchi and Kudo, 1990). As it is believed that
social animals engage in more complex social interactions, they require greater
social skills to survive. Social skills are necessary for what has been termed
primate "Machiavellian" intelligence (Byrne, 1995; Whiten and Byrne, 1988) and
it thus becomes apparent why more socially complex animals should possess
larger relative neocortices. It is suggested that the prefrontal cortex, (deemed
responsible for social interaction) is the greatest in humans over all other
primates. As social bonds and communication are associated with polygyny, this

163
is regarded as being linked to the development of neocortex and the prefrontal
cortex in human evolution (Sawaguchi and Kudo, 1990).
Dunbar (1992) has argued that in primates, group size is a function of
relative neocortex size, whereas ecological variables are not. He proposes that
the number of neocortical neurons limits the capacity of information-processing in
the individual, which in turn determines how many relationships the individual
can sustain. Once the group limit is reached, it begins to splinter, providing
evidence that there is a maximum limit to any species group size in which
cohesive social bonds can be maintained (Dunbar, 1992).
The current findings for the relationship between neocortex and sociality
for dolphins concur with those for primates (Dunbar, 1992), insofar as relative
neocortical volume can constrain or extend group size (section 3.2). This is
noteworthy as, to date, only carnivores have displayed such a relationship
(Dunbar and Sever, 1997) and it appears that such a relationship in
evolutionarily divergent dolphins has not been previously anticipated.
In the current study, the maximum aggregate size and mean group size of
dolphins can in turn be shown to correlate with other study variables
representing foraging ecology, sound and sociality (section 3.3).
Dolphins in smaller aggregates produce signals of shorter duration than
animals in larger aggregates (p < .001). One might speculate that this may have
something to do with the need of more solitary animals for more constant
updates of information regarding prey or predators. Alternatively, it may have
something to suggest about the communicative content of the signal, with
animals in larger groups conveying more content to each other. It is apparent
that further research is required to interpret such findings.
Animals that live in larger aggregates eat a smaller number of prey
species and are less diverse foragers than those in smaller aggregates (p<
164
.05).. In addition, members of larger aggregates eat a larger number of fish in
proportion to their total diet than their counterparts, who prey more on squid (p <
.05). Dolphins in groups can afford to be more selective in terms of their dietary
intake, as co-operative hunting allows for the detection of optimal prey. Fish are
more nutritious than squid (Clarke, 1986) and as such, are considered to be a
more lucrative prey source for dolphins. It follows that animals in larger groups
can hunt co-operatively and strategise to capture fish, whereas more solitary
animals cannot (Johson and Norris, 1986).
Such relationships serve to illustrate that although it may be necessary to
separate aspects of sociality from other aspects of ecology, such as foraging or
sound, it is ultimately an artificial distinction. Although a larger neocortex may
permit life in a bigger social group, the size of this group also has an impact on
current and future communicative and foraging strategies.
This assertion can be justified in terms of the socioecological reasons
proposed for dolphin group size. For example, the positive correlation of water
depth and group size and the negative correlation of body size and group size
are believed to be both a function of foraging strategies and predation pressure
(Johnson and Norris, 1986). This basis of grouping may function in subtle ways.
For example, it is apparent that dolphins with smaller mean group sizes exhibit
longer gestation than their counterparts in larger groups (p < .01). A shorter
gestation period could merely be a consequence of being a smaller animal.
When one considers that smaller animals live in bigger groups (Johnson and
Norris, 1986), the above finding becomes explicable. Variables of socioecology
therefore only appear to be divisible to a degree, in the pursuit of theoretical
clarity.
Early works on socioecology comlllented on the role of males in the
categorisation of social structure (see Eisenberg, Muckenhirn and Rudran,
1972). However, in the light of the current theory on the importance of females, it

165
seems more appropriate that later investigations considered the significance of
females to social organisation (Andelman, 1986; Wrangham, 1980). It follows
that maternal investment and infant relationships need to be conceptualised
within the broader context of social structure.
Gestation period was positively associated with the estimated neocortex
data for delphinids and odontocetes ( p < .01), while the interbirth interval was
positively correlated with the odontocete estimates (p < .05). Lactation was the
only variable for the delphinid values from MRI that showed a trend towards a
relationship with the neocortex ratio (section 3.1). However, when subjected to
regression analysis (section 3.2), of all of the maternal variables, only gestation
in odontocetes was predictable from the neocortex ratio (p < .05). This supports
the suggestion of Ridgway (1986a), in relation to the postnatal environment, that
the longer gestation period evident in cetaceans might allow the neonate to be
involved in complex activities that require a more developed brain.
The reproductive success of the mother is essentially dependent on her
capacity to provide sufficient resources for herself and her offspring through
gestation and lactation (Pereira and Altmann, 1985). The determination of
gestation limits appears to be crucial to mammalian brain development (Hofman,
1983b). It was found that two mammalian clusters exist in relation to neonatal
indices, one for primates and certain cetaceans (with prolonged gestation) and
the other for placental, non-primate mammals (Hofman, 1983). Hofman has
suggested that this provides enhanced protection from environmental hazards,
allowing optimal brain development to occur. .
Lactation has been recognised as a highly beneficial way of transferring
energy from the mother to her young (Pond, 1977), as well as being a means of
delivering a constant supply of resources whereby the infant is not directly
dependent on the surrounding environment (see Lycett, 1995). However, the
cost of lactation is the energy that mothers have to expend to maintain their

166
infants (Dunbar and Dunbar, 1988). Be this as it may, as young primates display
prolonged dependency on their mother, her ultimate reproductive success lies in
facilitating the development of her infant into an adult (Dunbar, 1988).
The best impression of maternal investment can be derived from the
definition of parental investment. This encompasses any action taken by the
parent in the survival interest of the infant, while forfeiting investment in other
offspring (Trivers, 1974). Maternal investment therefore transcends the period of
lactation and that of weaning, which in addition to a decline in milk transfer from
mother to offspring also entails a vast period of behavioural transition to adult life
(Lycett, 1995). Thus animals that display a longer interval between calves or
offspring may be said to endure greater maternal investment. A consequence of
this greater investment is the capacity for the offspring to learn and develop
within a safe environment and social context.
Gestation relates to other odontocete study variables (section 3.3). The
findings imply that deeper and less diverse foragers experience longer gestation
(p < .01 and p < .05 respectively). These findings draw some support for Milton
(1988), who proposed that sociality in itself is not sufficient in explaining human
brain size and suggested that diet should not be excluded from consideration, as
it is related to both RBS and sociality. In relation to other variables of sound and
sociality, animals with longer gestation experience greater intervals between
calves (p < .01) and are also more diverse sound producers (p < .01). From the
current findings, it appears that mother-offspring variables, such as gestation and
maternal investment, deserve greater attention in future studies of social
complexity.
It appears as if the "symmetrical relations" between group members may
serve a variety of functions aside from co-operation during hunting. Following the
discussion on dolphin mothers, it may be pertinent to recognise that an important
function relates to supervision of the young (Johnson and Norris, 1986).

167
Supervision of the young has been observed in the form of nursery groups
of adults and young dolphins in dusky dolphins (Wuersig, 1986) and in "baby
sitting" by relatives, other mothers and adult males in spinner dolphins (Norris et
aI., 1992). It is interesting to note that animals in larger groups display longer
intervals between births than those in smaller groups (p< .05), as the presence of
helpers should imply shorter birth intervals. However, it may be that greater
maternal investment is afforded within an extended social group, where relatives
and care-givers can provide assistance and calves can enjoy prolonged learning
and group membership (Wells, Irvine and. Scott, 1980).
The suggestions of Hamilton (1964, 1972) on the evolution of social
behaviour and the resultant increased fitness of interacting individuals draw
support with respect to dolphins, for whom the co-ordination of roles and co
operation between school members allow for shared resources and
responsibilities (Johnson and Norris, 1986).
Co-operative behaviour in cetaceans includes shared guardianship and
care of the young, alloparental care, resource advertisement, co-ordinated
foraging and hunting, defense of mature conspecifics, possible shared suckling,
turn taking in forms of aerial behaviour, echolocation and social interaction and
finally, stranding (see Bradbury, 1986; Norris and Schilt, 1988 for reviews).
Dolphins are said to display "the co-operative disposition" (Norris and Schilt,
1988:169), in that they abide by the rules of the group. Such co-operation may
transcend species and ordinal boundaries. For example, wild killer whales have
been known to interact co-operatively with human whalers by detecting and
assisting in the capture of prey (Jefferson, Stacey and Baird, 1991).
As membership of a group is thought entail much greater complexity than
the more simple concept of aggregating (Norris and Schilt, 1988), it comes as
little surprise that of the two variables maximum aggregate size and mean group
size, the latter shared the strongest predictive relationship with the neocortex

168
ratio. When compared to the findings of the other chapters, mean group size
continues to be the strongest variable related to the neocortex ratio. For
example, to extrapolate from the primate theory of neocortical evolution, one
would expect the finding that humpback dolphins have lower neocortex ratios
than bottlenose or common dolphins, as they evidence less diverse behaviour
than these other species (Karczmarski, Thornton and Cockroft, 1997). Dolphin
sociality is diverse, complex and comparable to that of other mammals and the
current findings support the call for further investigation.
Consistent co-operative relationships have been referred to as alliances
(de Waal & Harcourt, 1992) and these are considered to be rarely formed by
non-primate species (Harcourt, 1988). Several documented cases of alliance
formation have been reported in spotted dolphins (Pryor and Schallenberger,
1991) and in bottlenose dolphins (Wells, Scott and Irvine, 1987), with specific
reference to the herding and theft of females (Connor, Smolker and Richards,
1992a). Multi-level alliances have been exclusively observed in dolphins and
humans, with the suggestion that these may have contributed to the selection for
and evolution of the large dolphin brain (Connor, Smolker and Richards, 1992a,
1992b).
It has been suggested that dolphins display reciprocal altruism (Connor
and Norris, 1982). This concept can be considered as being the performance of
an act at a cost to the actor, in the interests of a non-relative, the benefit of which
accrues through the reciprocity of action by the recipient at a subsequent stage
(Alcock, 1993; Axelrod and Hamilton, 1981; Trivers, 1971). Johnson and Norris
(1986) propose that certain dolphin species satisfy the criteria for this model.
These include: frequent and recurring contact between animals to either
demonstrate reciprocity or to identify cheaters; fair life expectancy; learning of
socially appropriate responses within a substantial period of development and
finally, sufficient memory to monitor other individuals and the nature of their
relationships. Norris and Schilt (1988) suggest that true reciprocal altruism may

169
only exist in the fluid societies of pelagic species, where echolocatory capacities
reduce the risk of predation and allow for the expression of mammalian social
patterns (see Norris, Wuersig, Wells and Wuersig, 1990 with reference to spinner
dolphins).
Smolker et al. (1992:66) consider that the social relationships of each
individual dolphin are sustained within a dynamic social environment, "perhaps
placing a premium on the evolution of cognitive abilities". Connor, Smolker and
Richards (1992a) claim that the intricate nature of alliance formation supports the
hypothesis that social complexity has been responsible for the selection of larger
brains (Cheney, Seyfarth and Smuts, 1986; Whiten and Byrne, 1988; 1997). This
appears to be the case (above) with respect to the neocortical evolution of
dolphins, as the neocortex ratio is predictive of group size for several of delphinid
species.
Before concluding the chapter, it may be of interest to consider the
findings of Roehrs (1985), who suggested that domesticated animals displayed
significantly reduced neocorticalisation when compared to their untamed
relatives, the reduction being primarily correlated with their altered behaviour.
Suffice it to say that the social complexity of behaviour is currently being afforded
the greater attention that it deserves, in relation to neocortical and intellectual
evolution.
If one takes a behavioural account of dolphins, their considerable
maternal investment and the complex and fluid nature of their societies, the
relationship between mean group size and neocortex becomes more
appreciable. However, it does not suffice to stop the discussion at this point.
Aside from certain primates sharing an association between relative neocortical
volume and sociality, the only other order of mammals to show this relationship
are the carnivores. Thus the significance of the current study is not only that
dolphins have neocortex ratios higher than all other species, except for humans,

170
but also that this appears to be more strongly related to sociality than is apparent
in any other order of mammals. The sociality of dolphins is complex and this is
reflected by evidence of reciprocal altruism in dolphins. The potential implications
of these findings for a wide spectrum of research, ranging from comparative
studies to cognitive evolution, are discussed in the following and final chapter.

171
Chapter 7. Comparisons of delphinid and primate neocortex and itscorrelates: Implications for mental evolution
1. Summary
This study has successfully established the relative neocortex size and
neocortex ratios (CR) of dolphins and related these to several variables of
delphinid behavioural ecology. The findings are briefly highlighted and related
to the wider literature.
The absence of data on relative neocortex size and its correlates in
dolphins and other marine mammals was discussed and the importance .of
such data for comparative purposes was recognised in Chapter 1.
The novel application of the radiological techniques of CT and MRI for
the establishment of data for the volumes of the cranium, the brain, the
neocortex and other brain regions are described in Chapter 2. From these CT
and MRI volumes, CRs were calculated for several species of dolphins
resident off the ~waZulu-Natal coast. The discovery that dolphin cortical
material could be frozen, defrosted and used with accuracy in MRI
calculations was consequential, as it permitted the use of a larger sample. In
addition, the lack of variance in the CRs between different delphinid sex and
sexual maturity categories allowed for the combination of individual
specimens in the analysis. Human CRs were also established and these
appear to be substantially higher than those documented by Dunbar (1992).
However, as these were obtained from a convenience sample and present a
large degree of variance between sexes, it is apparent that more revision is
required before drawing definitive conclusions. The most important finding,
for the purposes of this study, was the high CRdisplayed in all of the dolphin
study species. These values lie above the range of those of non-human
primates and are in close proximity to documented human scores at 4.1

172
(Dunbar, 1992, 1995), with the common dolphin at 3.938 displaying the
highest value.
As a consequence of such high delphinid neocortex ratios, it became
apparent that further investigation was required. Chapter 3 applied the
equations developed from CT and MRI to cranial volume data obtained for 19
different species of toothed whales at the PE Museum. From the resultant
estimated brain and neocortex volumes, neocortex ratios were estimated for
animals randomly selected as representatives of species from the wider catch
population. Data for MRI subjects not matching the species parameters were
excluded from further analysis. In addition, access was gained to a much
wider range of species than possible using MRI. The estimated neocortex
ratios confirmed that the equivalent scores from MRI were accurate and
verified that dolphins do have extremely large neocortices, in relative terms.
The MRI and estimated delphinid and odontocete neocortex ratios
were related to variables representing foraging ecology in Chapter 4, as
these variables appear to relate to the neocortical evolution of other, non
primate, mammals (Dunbar and Sever, 1997). It was therefore surprising to
learn that dolphin neocortices do not appear to be related to foraging, nor
predictive of aspects of foraging ecology.
However, before assessing whether or not delphinid neocortex ratios
might be related to sociality, it was proposed that sound could be conceived
of as a mediator between its use for foraging and social purposes in dolphins.
Chapter 5 examined several aspects of sound production and perception in
relation to the neocortex ratio. It was consequential that relationships were
apparent between the neocortex ratio and sound frequency range, minimum
frequency, minimum signal duration and the range of signal duration. More
importantly, it appears as if the sound frequency range is predictable from the
estimated delphinid neocortex ratios. This is of interest, as it is primarily their

173
auditory capacity that sets dolphins apart in the mammalian world. Purves
and Pilleri (1983:252) hint at the significance of sound in relation to the brains
of dolphins:
The really spectacular and mysterious feature of the dolphin is the
immensely large size and complexity of the brain which is comparable
with that of human beings. What proportion of the cerebral cortex is
involved in the storage and processing of acoustic information is not
known, but it must be quite considerable judging by the large size of
the acoustic nerve.
The current findings are also supported by a wealth of literature
describing delphinid auditory capacities. (Au, 1993; Herman, 1980, 1986,
1991; Herman, Pack and Wood, 1994; Richards, 1986; Richards, Wolz and
Herman, 1984). In addition, sound shares an important relationship with other
delphinid sensory capacities and this makes its relationship with neocortex
even more interesting (Pack and Herman, 1995). Using experimentation with
cross-modal transfer, it has been suggested that dolphins use echolocatory
information as the basis of their object-based representational system
(Harley, Roitblat and Nachtigall, 1996; Helweg, .Roitblat, Nachtigall and
Hautus, 1996).
It has been suggested that the auditory capacity of dolphins is best
illustrated through their performance at sentence comprehension, where they
display correct semantic and syntactic interpretation (see Herman, 1991 for
review) and evidence of learning different syntactic rules, understanding
novel sentences, labelling objects and reporting (Herman, 1986).
It is notable to recognise that the sound related findings of this study
reinforce the notion that dolphins use sound for social purposes (Bauer and
174
Johnson, 1994; Herman, 1980; Janik, Dehnhardt and Todt, 1994; Reiss and
Mccowan, 1993; Tyack, 1986; Wilson, 1975).
It has, been proposed that killer whale dialects are passed to
successive generations through cultural transmission (Ford and Fisher,
1983). Whereas initial efforts failed to establish a relationship between
acoustics and social behaviour in mysticetes (Best, 1970), Clark (1983) found
support for this relationship in Southern Right Whales, where sound
complexity was directly related to the complexity of the social context . The
large variation in annual humpback song is supposedly transmitted by
learning and viewed as cultural evolution, as the songs are learned traits
which evolved over time (Payne et al., 1983). Such social tradition may also
serve to transmit knowledge concerning prey, predators and the environment
in social mammals and this may contribute to the phylogenetic difference in
behavioural capacity and flexibility between mammals and fish (Wuersig,
1986).
The findings of predictive relationships of delphinid sound production,
group size, aggregate size and gestation period from their neocortex ratios
suggest that these features may have co-evolved in dolphins. This is
.interesting, considering that Dunbar (1993) has suggested the co-evolution of
language, group size and neocortex size in humans. With the increasing
social complexity of humans, language is considered to be a more effective
means of social cohesion than the standard primate method of grooming
(Dunbar, 1993). Aiello and Dunbar (1993) have noted that language is a
recent evolutionary development in humans. However, Lilly (1978) proposed
that unlike non-human primates, humans and dolphins share in possessing
sophisticated capacities for elaborate communicative sound use. Perhaps
future research will provide more insight into the combination of social and
communicative evolution through comparisons between dolphins and

175
humans. Nonetheless, this study suggests that delphinid sound and sociality
are linked through their predictable relationship with the neocortex.
In the light of this, chapter 6 examined the delphinid neocortical data in
relation to variables representing their sociality. This chapter yielded the most
substantial findings of the correlational section of the study. Mean group size
and maximum aggregate size were predictable from the delphinid MRI
neocortex ratios, while gestation period was predictable from the estimated
ratios for odontocetes. It was also interesting that these sociality variables
were correlated with other variables representing sound and foraging
ecology. However, the significance of the finding lies in that, to date, the
relationship between neocortical evolution and sociality has apparently been
exclusively displayed in primates (Dunbar, 1992, 1995; Dunbar and Sever,
1997). This distinction is not supported by the findings of this study, which
reveal a strong association between delphinid neocortex and their intricate
social organisation.
Once again these findings are supported by the documented literature
regarding the complex nature of dolphin societies and social groups. Wells
(1991 :223) suggests that insight can be gained into the evolution of delphinid
sociality by comparing their "social solutions" to various different
environmental issues. Sel'kovich et al. (1991), although surprised by the
diversity of dolphin hunting methods, were mainly impressed by the
behavioural plasticity of these animals enabling them to adapt to changing'
environmental conditions. Additionally, reciprocal altruism has been reported
in dolphins (Connor and Norris, 1982). Johnson and Norris (1986) note that
animals who engage in reciprocal altruism have the ability to consider their
actions and the consequences of these in relation to others and propose that
substantial empathy fosters reciprocity in dolphins. The documentation of

176
epimeletic behaviour in dolphins supports this proposal (see Caldwell and
Caldwell, 1966 for review; Cockroft and Sauer, 1990; Pilleri, 1984).
It is necessary to elaborate on the significant relationships established
between the neocortex ratio and several "maternal" variables such as
gestation, lactation and maternal investment in delphinids and other
odontocetes. In terms of delphinid matrilineage, Norris and Pryor (1991)
propose that postreproductive females who are actively involved in the social
group must serve some important social function. It has been suggested that
these animals may nurse the offspring of others and provide allomothering.
However, it has also been suggested that these old females serve the more
important function of being .the guardians of cultural information (Norris and
Pryor, 1991), which fits the primate theory of social intellect (Humphrey,
1976). Furthermore, in certain primate species, the maintenance of social
cohesion is dependent on the matriline and areas of relative expansion in the
primate brain, such as the neocortex, are thought to be the developmental
consequence of the maternal genome (Keverne, Martel and Nevison, 1996).
Returning to dolphins, Norris (1994) supposes that the best indicator of
culture in a species is the presence of a juvenile period extending from the
time of early maternal nurturance through to adulthood, during which learning
and imitation occupy behavioural primacy. Dolphin societies, with extended
maternal-offspring relations and intricate behaviours, are regarded as
complex and are. thought to possess culture (Norris, Wuersig, Wells and
Wuersig, 1994; Pryor and Norris, 1991).
The significance of the relationships summarised in the findings of this
study become apparent, if their implications are considered in relation to
theories of social intelligence and the nature of mental evolution.

177
2. Implications
The evolution of a social system capable of supporting advanced
technology should only happen under conditions where improvements
in technique can substantially increase the return on labour. This may
not always be the case...the open sea is probably an environment
where technical knowledge can bri.~g little benefit and thus complex
societies- and high intelligence- are contra-indicated (dolphins and
whales provide, maybe, a remarkable and unexplained exception)
(Humphrey, 1976:311).
Why would the evolution of sociality necessarily have to be related to
technology as we, humans, conceive of it? What if the "advanced technology"
of a very different species was represented by the use of something
substantially different from, or perhaps even unanticipated by, humans. For
example, the highly advanced sonar and auditory capacity of dolphins has
only recently been acknowledged. We are only beginning to comprehend
delphinid acoustic complexity, many aspects of which remain inexplicable
and transcend the reproductive capacity of human technology (see Au,
1994).
Survival and successful life in the open sea, by its nature, would
benefit from technical knowledge such as echolocation and communication.
From this perspective, complex societies and high intelligence in dolphins
should be expected and explained and not passed off as "contra-indicated,
remarkable or exceptional". This' suggestion is supported by the findings of
the current study, which have upheld the hypotheses that dolphins have high
neocortex ratios and that these are related to social complexity and auditory
communication.

178
Within this context, the commonalties between dolphin and human
relative neocortex volume are striking. The neocortex ratios in these
cetaceans and primates are extraordinarily high in comparison with other
species. Further comparative studies are required, as the relative neocortical
volume appears ,to be exclusively related to social and communicative
complexity in dolphins and humans.
However, in many ways, the position of uniquely human mental
evolution, supported by evidence of the beginnings of mentality in our
undisputed physical primate relatives, still reflects the mainstream of thought
about comparative and social intelligence (Povinelli, 1993; Tomasello and
Call, 1997).
Primate social intelligence is believed to have unfolded in the following
manner. As social life is complex and often problematic, an individual needs
to co-operate with others to maintain solidarity and enjoy the benefits of
grouping, while being able to exploit and manipulate others (Humphrey,
1976). Animals with greater "intellectual prowess" were said to enjoy more
substantial "social success", which increases biological fitness and resulted in
greater pressure for the evolution of strategic intelligence (Humphrey,
1976:311). An individual in a social group would benefit by occasionally
obtaining resources at the expense of its group members, but would sustain
great cost in leaving the group. This potential cost may be responsible for the
evolution of social intellect (Whiten and Byrne, 1988). Within Machiavellian
intelligence, this has been referr.ed to as "tactical deception", whereby an
individual outwits its conspecifics for resources (Cheney and Seyfarth, 1985;
Whiten and Byrne, 1988).
If strategic intelligence is related to neocortical evolution, then a larger
neocortex ratio could be indicative of this capacity (Dunbar, 1992). Not
surprisingly, when an index of tactical deception is plotted against the

179
neocortex ratio for primates, the ratio predicts the frequency of deception
(Byrne, 1993, 1995). It would be interesting to investigate whether or not
such a relationship also holds true for delphinids.
Nonetheless, one may suggest that the approach to the evolution of
the brain and intelligence has been predominantly primatocentric, if not
homocentric in nature. Recently, Jacobs and Raleigh (1993) accused Dunbar
(1993) of being primatocentric in his study of the neocortex, suggesting that
other complex orders, such as cetaceans, should be considered in
subsequent analysis. In his reply, Dunbar noted,
the primatocentrism is deliberate (and unavoidable). The Machiavellian
Intelligence hypothesis that underpins my argument is specifically
concerned to explain why primates have significantly larger brains than
other animals; it hinges on the unique nature of primate groups (tightly
bonded groups made possible by deep social knowledge)...
(1993:722) (emphasis added)
From the current study, it is apparent that primates are not the only
animals with large neocortices. In addition, if Machiavellian Intelligence
hinges on the uniqueness of primate groups, what does one make of the
finding that dolphin neocortex is also related to group size and social
complexity? Perhaps primate social intelligence and human brain evolution
are not that unique after all, as has been suggested previously (Tschudin,
1998).
A major implication of this work is that hypotheses seeking to explain
brain and intellectual evolution, such as Machiavellian Intelligence, may
require substantial modification. However, the primatocentric approach does
not seem to be an intentional movement to preserve the theory of
discontinuous human cognitive evolution. Rather, it appears to be related to

180
the lack of available data for species representing other orders (Dunbar,
1993). This may be remedied, in part, by adopting advanced technology, in
accordance with the method of the current study, .for the procurement of rare
or intricate data. This is possibly what Jerison (1993) was hinting at to obtain
data for other species of animals. Nevertheless, after taking cognisance of
the dolphin neocortex findings presented through the course of this thesis, it
appears that a primatocentric view of cognitive evolution will be inadequate
for future investigations.
In terms of evolutionary theory, homoplasy or morphological similarity
is frequently observed with respect to the physical characteristics of different
species. It is conceivable that similar relative neocortical evolution in primates
and dolphins may possibly present a case of convergence, with respect to
mental evolution. Such an association yields support for further research into
comparative cognition, with special reference to dolphins. This implies that
future studies be conducted into intentionality, theory of mind and
consciousness in other animals. Research of this nature may support or
refute the hypothesis that the evolution of the human mind and social
intelligence may be less discontinuous than, or qualitatively different from,
that of other mammals.

181
3. Constraints in theory and practice and Recommendations
3.1. Brain size, neocortex size and the neocortex ratio
The assumption still exists that the larger the brain, or its components,
the greater the intellectual potential, although empirical proof of this
relationship is not easily achieved (Byrne, 1993). If the brain is viewed as a
super computer, then larger neural brains make better computers (Byrne,
1995). However, this ignores an intelligent system of brain functioning, which
includes both sensorimotor activity and computational intelligence (Byme,
1995, Jerison, 1973; Passingham, 1982).
Although Byme (1995) argues that increased intelligence is the major
advantage which compensates for the costs associated with larger brains,
research by Barton, Purvis and Harvey (1995) has questioned the notion that
larger brains are indicative of greater intelligence. Rather, from their
comparative studies of visual and olfactory systems, they suggest that the
evolutionary growth of the brain is initiated towards the sensory systems
required for the animal's survival.
In spite of the criticism levelled at the size of the brain or its
components, there must be some significance attached to the enlargement of
brain size or relative neocortical volume. This is apparent, as humans endure
the costs of enlarged brains. Being born with relatively large brains through
an undersized birth canal has risks for the mother and/or infant. Additionally,
lengthened postnatal brain growth means an extended period of vulnerability
for the infant (Byrne, 1995). More speci1ically, Dunbar (1993) notes that the
neocortex is energetically expensive and thus the possession of a large
volume of relative neocortex must confer some benefit.

182
Although the neocortex ratio appears to provide a good indicator of
processing capacity and intellectual potential, it is based on the assumption
that intelligence is localised in the cortex and possibly underestimates the
role of the hindbrain and subcortical structures in intellectual performance
(Byrne, 1995).
Furthermore, the eR has been criticised as a crude measure of the
neocortex, due to the lack of separation of the functional layers of cortex
(Glezer and Kinzey, 1993) and it is indeed a fairly gross measure of brain
organisation. However, in spite of the criticism levelled at the neocortex ratio,
it is still believed to be a better indicator of relative cortical evolution than
other measures such as the EQ, which are more simplistic and less
meaningful.
Nothwithstanding the fact that the neocortex ratio may be a gross
measure of undifferentiated cortex, it -is an improvement on more primitive
indices and will have to suffice until more intricate data on the neocortex
become available for analysis (Dunbar, 1993; Holloway, 1993; Jerison, 1993).
Recent research indicates that brain evolution enquiries are becoming more
specialised. For an example concerning primate neocortex, group size
appears to be specifically correlated with non-visual neocortex, which has
been argued to be a processor for social information (Joffe and Dunbar,
1997).
It is hoped that future research will be able to provide more detailed
information about the brain and its complex organisation. A review of the
literature indicates that there has long -been a desire for more specific
knowledge of the brain and its functional organisation (Kesarev, 1971;
Passingham, 1982). However, researchers have been hamstrung by the lack
of technology. For example, Kesarev (1971) suggested that there may be

183
more accurate measures of neocortical evolution, but was unable to study
these, as he could not determine the volumes of certain cortical areas.
With the current technology available for research, these limitations
are being gradually addressed and overcome. Sergent (1994) notes that
methods such as eT and MRI, in addition to other brain imaging methods,
have increased the capacity to visualise the brain at work. In essence,
neuroimaging techniques might hold the key to a more detailed and precise
understanding of relationship between brain function and structure, as has
been suggested by Stuermer (1985) for interdisciplinary analysis and
Velmans (1999a) with respect to studies of consciousness.
3.2. Study variables
It has been argued that a variable such as mean group size is a crude
indicator of sociality and is therefore inadequate as a yardstick of social
complexity (Deacon, 1993; Jacobs and Raleigh, 1993; Whiten, 1993).
Although animals who appear to lead solitary lives, such as pandas, often
demonstrate complex social organisation (Schaller et al., 1985), it is believed
that social intelligence is generally a consequence of life in a social group
(Dunbar, 1992; Humphrey, 1976; Sawaguchi and Kudo, 1990). It has been
conceded that limitations do exist with respect to variables representing the
complexity of behavioural ecology (Dunbar, 1993). However, in a similar
fashion to the constraints encountered with brain variables, it is only through
the passage of time that more appropriate and intricate study parameters will
develop.
With respect to the study variables selected for analysis in the current
study, the limited scientific knowledge of species such as dolphins is
humbling. The current study represents the first investigation of delphinid
neocortical evolution and its correlates, and is exploratory in nature. As a

184
consequence of "flying blind", so to speak, an attempt was made to obtain a
comprehensive range of different variables representing delphinid foraging
ecology, audition and sociality.
However, as dolphins live in a radically different environment to
primates, certain variables in one order are not evident in the other and one
has to improvise. For example, frugivorous versus folivorous diets have been
considered in primates for an indication of dietary complexity. Cetaceans
have totally different dietary resources to primates and thus fish and squid
had to be substituted for their terrestrial equivalents, in terms of their differing
nutritional value and scarcity of availability. Although limited by the scarcity of
dolphin information, where possible, variables held in common with terrestrial
mammals were used for analysis (e.g. gestation, mean group size, total
number of prey species). These are open to direct comparison. However,
some variables remain difficult to compare, such dolphin foraging depth.
Finally, the separation of foraging ecology, sound and sociality into
discrete categories is widely regarded as artificial. The differentiation of these
aspects of behavioural ecology in relation to neocortical evolution has been
undertaken in -the current study for conceptual anq theoretical clarity.
However, one should remain aware that research has supported the notion of
extensive interrelatedness between the social and ecological correlates of
primate neocortex (Barton, 1996; Sawaguchi, 1992). With specific reference
to dolphins, Bearzi et al. (1997) have recognised that the highly flexible social
organisation of bottlenose dolph.ins in the Adriatic is an adaptive coping
mechanism to deal with environmental conditions and limited resources.
3.3. Study animals and study methods
As dolphin specimens are rarely acquired, a concern was the relatively
small sample size in comparison with terrestrial mammal data. However, if

185
one considers the number of animals from which actual and estimated
neocortex data was obtained, this compares favourably with other studies
(Dunbar, 1992; Stephan et al., 1981). In addition, any fears relating to the
representativeness of the dolphin data were addressed by obtaining
population parameters for the study species. The human data, although
obtained from a small convenience sample, did reveal some interesting..•
neocortical features and present several avenues for future research.
Another limitation relating to the scarcity of dolphins for research was
that the dolphin material was obtained from deceased specimens. However,
to prevent the distortions associated with the degeneration of material post
mortem, the specimens were scanned as soon as possible after death had
occurred. Where scans could not be conducted immediately, the material was
frozen, defrosted and subsequently used, with acceptable reliability.
The costs associated with the radiological scanning technology of CT
and MRI used in this study are exorbitant. For this reason, although the
imaging costs were sponsored by a private practice of radiologists,
Jackpersad, Rooknoodeen Inc. and our Medical School's Department of
Radiology, a conservative approach was taken in subjecting only the
essential specimens to imaging analysis.
3.4. Weltanschauung- Worldview
The current study has actively avoided the assumption of a specialist position
or a reductionist approach to what can be perceived as complex phenomena,
namely the brain, evolution ,and intelligence. This may be viewed as a
limitation by specialists or reductionists. However, although this approach
may differ from a conventional perspective, it has proved to be beneficial in
many respects, as has been noted in the implications.

186
4. Future Directions
Following the findings of high neocortex ratios in dolphins, and after
establishing that these values are related to delphinid sociality and
communication, this thesis suggests that dolphins and humans may share
similar neocortical evolution. In the light of this, the implication is that dolphins
and humans may display convergent mental evolution, that is of a social
nature. "In many ways the groups are cognitive cousins, though at opposite
poles in sensory specialisations and ecology" (Herman 1980:420).
It is reasonable to ask why substantial importance has been attached
to the theory of social intelligence. Briefly, the Piagetian approach to the
evolution of human intelligence (Parker, 1985) has drawn mixed commentary
(see Gibson, 1985). Alternatively, the theory that social complexity is
interrelated with intellectual evolution gains more support if one adopts the
theoretical position of the mind as developing first interpersonally, to serve a
social function, whereafter it is internalised (Vygotsky, 1978).
The acquisition of information via social or cultural transmission that
stems from social interactions is believed. to be optimal (Galef, 1988;
Mainardi, 1980, Nishida, 1987), as its minimises the risks involved for the
learner (Galef, 1976; Nishida, 1987; Rozin, 1977). As most of the social
interaction of an infant occurs with its mother, it allows for the observation of
her activities, relationships and community traditions (Attili, 1985; McGrew,
1977). This supports the theory of social cognition, where the developing
individual only reaches the "proximal development" through the mediated
efforts of a cultural guide, as primary caregiver and learning referent
(Vygotsky, 1978). The social context which surrounds an individual exercises
considerable influence on ontogenesis (Moshman, Glover and Bruning, 1987)
and thus cognition should be studied in relation to the evolution of sociality or
culture (Cole, 1985; Hinde, Perrot-Clermont and Stevenson-Hinde, 1985).

187
In practical. terms, the question of how to test hypotheses relating
sociality to intelligence has been asked previously (Humphrey, 1976; Jolly,
1966). During the 1970s and 1980s, although study parameters of sociality
and intelligence were being developed, conflicts were still apparent in relation
to theories of brain evolution and social complexity (see Gittleman, 1986 and
Hemmer, 1979). More recently, the relationship of neocortical processing
capacity to elements of social complexity (Dunbar, 1992, 1995; Sawaguchi,
1990; Sawaguchi and Kudo, 1990) and tactical deception (Byrne, 1995)
provide empirical support for a relationship between sociality and intelligence
in primates. As neocortical size does not appear to be clearly related to
sociality in other terrestrial mammals, with the possible exception of certain
carnivores and bats (Barton, 1993; Dunbar and Bever, 1997), social
intelligence has appeared to remain the sole domain of primates.
According to the scala naturae, humans represent the zenith of
primate intellectual and cortical evolution. Previous research has suggested
that human brains are geared towards social relationships and social
cognition (Hinde and Stevenson-Hinde, 1973; Humphrey, 1976). Barkow,
Cosmides and Tooby (1990) suggest that our substantial cognitive
adaptations have arisen to enable us to cope with social relationships. That
humans are far better applied to solving social problems, than to logico
mathematical complexities, has subsequently been verified (Cosmides and
Tooby, 1993). Yet there appears to be a considerable overlap between the
performance of human and non-human primates on tasks of social
intelligence (Essock-Vitale and SeYfarth, 1987). In view of this. tests of social
intelligence need to be considered and developed in other non-primate
species, especially in highly adapted species such as dolphins.
In the absence of both cross-species research into the links between
brain morphology and behaviour (Henneberg, 1987) and an interspecific

188
definition of intelligence (Byrne, 1995), there is still hope for comparative
cognitive research. This lies in the discipline of comparative cognition, which
pursues the significance of similar and different mental capacities between
species by incorporating knowledge from comparative psychology, ethology
and behavioural ecology, neuroscience, and cognition (Roitblat, 1987).
Tschudin, Basson and Peddemors (1999) have proposed that
comparative analysis has much to offer studies of the evolution of what
Searle (1992) synonymously terms "mind or consciousness", although
specific distinctions and connections' between consciousness, thought and
other mental processes are discussed elsewhere (see Davies, 1999a; Ryle,
1990; Velmans 1991, 1999b). It is believed that a mind, and ultimately
consciousness, is revealed, in part, through the displays of its content
(Tschudin, Basson and Peddemors, 1999). This is only partially applicable as
only a certain part of consciousness, access consciousness, is available for
study (Block, 1995; Davies, 1999b, Davies and Humphreys, 1993). Elements
of subjective experience, or phenomenological consciousness, "What is it like
to be a dolphin?" (adapted from Nagel, 1974), appear to remain beyond the
parameters of analysis or human comprehension (Davies, 1999b; McGinn,
1989, 1991; Nagel, 1986).
The current study has emphasised that social relationships and social
complexity are crucial in promoting mental evolution and therefore deserve
more attention in studies of mind. In the words of Searle (1992:248) vis-a-vis
the rediscovery of the mind I " a fi8al guideline is that we need to rediscover
the social character of the mind".
The concept of socially strategic intelligence necessitates that an
individual displays intentionality and the beginnings of a theory of mind
(Tomasello and Call, 1997; Whiten and Byrne, 1988). Moreover, within the
philosophy of mind, intentionality is considered to be an integral part of the

189
content of mind or consciousness (Davies and Humphreys, 1993; Dennett,
1996; Tomasello and Call, 1997). While certain intentional behaviours have
been noted in non-human primates (Byrne and Whiten, 1992), most authors
remain dismissive about the presence of higher order intentionality in non
human primates (Cheney and Seyfarth, 1990; Tomasello and Call, 1997).
Davies and Humphreys (1993:9) suggest that "conscious intentional
thought. ..may constitute a crucial component in our problem-solving ability,
marking a qualitative advance on non-human animals". More conservative
sceptics insist that so-called "intentional behaviours" in other animals may
simply be behavioural repertoires (Smith, 1996). However, anecdotal
evidence has been provided in support of potential intentionality in dolphins:
Gambit was taught by his trainer at the aquarium to retrieve packets
that might fall into his pool. On retrieval and presentation of the packet
to his trainer, he would receive a fish. When finding a packet, Gambit
proceeded to chew it up into a few smaller pieces, deposit these in
cracks in the pool and "selectively" hand these in to his trainers to
receive multiple fish rewards (Tschudin, Basson and Peddemors,
1999:4).
If one supposes that Gambit's behaviour is not the result of a
repertoire, but the consequence of higher cognitive functioning, as evidenced
by intentionality, then the concept of a theory of mind might not be solely
applicable to humans and certain primates. Another major implication of this
study is therefore that the possibility of a theory of mind needs to be
investigated in dolphins.
Premack and Woodruff (1978) suggest that a theory of mind implies
that an individual attributes mental states to oneself and to others, making
inferences about the knowledge of others. Davies and Stone (1995:2)

190
suggest that, armed with a theory of mind, or the folk psychology constituted
by "a rich conceptual repertoire", the individual is capable of reasoning about
the knowledge, intentions or actions of others.
A notable amount of research has been successfully conducted into
false beliefs and the underlying theory of mind with non-human primates and
children (Baron-Cohen, Leslie and Frith, 1985; Call and Tomasello, 1998a,
1998b; Gopnik and Wellman, 1995; Povinelli, 1993; Tomasello and Call,
1997; Tomasello, Call and Gluckman, 1997; Wimmer and Perner, 1983).
Such experiments have indicated that non-human primates and even human
children of certain ages do not display any evidence of a theory of mind
(Tomasello and qall, 1997). Studies have also' demonstrated that autistic
children, who experience difficulty with social interaction and relationships, do
not display a theory of mind (Baron-Cohen, Leslie and Frith, 1985). This
appears to provide corroborating evidence for the assertion that mental
evolution and intellectual development are essentially social in nature.
In theory, equivalent research into false beliefs and theory of mind
should be possible to execute with dolphins, whose intellectual capacities and
accomplishments are briefly discussed below. These examples indicate that
dolphins may possess representational thought, which is. not believed to be
dependent on speech or language (McComb and Semple, 1998).
Complex experiments have already been conducted with dolphins in
several cognitive domains. For example, dolphins have displayed the
capacity to use "eaves-dropping'"', through passive echolocation, for object
recognition (Xitco and Roitblat, 1996). Recently, self-view television was used
to confirm that dolphins engage in the primate equivalent of self-examination
and self-recognition (Gallup, 1970, 1975) and not social behaviour toward a
conspecific (Marten and Psarakos, 1995). Finally, Smith et al. (1995)
demonstrated interesting cognitive parallels between humans and bottlenose

191
dolphins in terms of uncertainty responses, suggesting that the capacity for
continual cognitive monitoring and the beneficial use of uncertainty
represents mental·adaptation in both species.
Theory of mind research with dolphins will require substantial
modifications to the experimental framework and method used for recent
false belief tests conducted by Call, Tomasello and co-workers with primates
(reviewed above). However, it is believed that such modifications are possible
and that, through the use of captured dolphins, this is the logical progression
of the study. This may be of substantial irnportance to comparative cognition.
In a recent summary of primate cognition, Tomasello and Call (1997)
propose that it is distinguished by the capacity to understand and categorise
third party social relationships and tertiary relational categories among
physical objects. Within primates, apes and monkeys do not differ notably in
how they "cognize" their physical and social worlds (Tomasello and Call,
1997). Although foraging may have selected for the evolution of cognition
early in simian evolution, the subsequent complex social organisation of
some species encouraged the comprehension' of conspecifics' social
relationships via strategic intelligence (Byrne and Whiten, 1997; Tomasello
and Call, 1997). Ultimately, the difference between human and non-human
primates is postulated as the inability of non-human primates to understand
the behaviour of conspecifics intentionally or to interpret the behaviour of
objects causally in human-like ways (Tomasello and Call, 1997).
Theory of mind studies with dolphins mayor may not result in a
refutation of the perceived "difference" between human mentality and the
mentality of other species. Research into the minds of an extended range of
species is critical. in assessing whether human mental capacities, such as
deception, are "evolutionarily ancient" in nature, or rather a recent hominid
phenomenon (Hauser, 1997:139).

192
In addition to this, the notion of primate Machiavellian intelligence has
recently been questioned (Strum, Forster and Hutchins, 1997), while Goody
(1997) recognises that the study of co-operation requires more attention.
Humphrey suggested that the "chief role of creative intellect is to hold society
together" (1976:307) and in line with this, de Waal (1991) has indicated that a
greater focus should be dedicated to aspects of reconciliation. It appears as if
more comprehensive data on social complexity is needed before definitive
conclusions can be drawn (Cords, 1997). These aspects of intelligence
diverge from popular Machiavellian logic. Yet, if one considers the primary
role of co-operation in maintaining the complex societies of animals such as
dolphins, it is apparent that such topics hold vast potential for future studies.
In the final analysis, this study has suggested that comparable
features of relative neocortex size and its correlates with sociality and
communication exist almost exclusively between dolphins and humans. This
may have substantial implications for the theory of social intelligence and the
discipline of comparative cognition. Forthcoming research into the possibility
of a theory of mind in dolphins is therefore imperative. If widely divergent
species such as dolphins do turn out to have similar mental capacities to
humans, by way ·of a theory of mind or its beginnings, there seems little
choice but to reconceptualise and revise our current theories of mental
evolution.

193
5. Concluding remarks
This study has combined science, technology and philosophy in
aspiring to tackle the topic of comparative cognitive evolution. Of original
importance is perhaps that the hypotheses of high neocortex in dolphins
relative to primates and the relatedness of delphinid neocortex with sociality
and sound have drawn empirical support. This calls for further studies of
comparative mental capacities in non-human species.
Current researchers are "not yet convinced" that other species
possess "minds as replete with social intelligence as our own" (Povinelli,
1993:507) and this is problematic. Darwin was a proponent of continuous
physical evolution and in all likelihood, held a similar view of mental evolution:
In the distant future I see open fields for far more important
researches. Psychology will be based on a new foundation, that of the
necessary acquirement of each mental power and capacity by
gradation. Light will be thrown on the origin of man and his history.
(Darwin, 1859:458).
It is encouraging to note that this is certainly not the first, and hopefully
not the last, proposal that humans may share continuous mental evolution
with other animals. However, substantial enquiry still awaits us before any
conclusions can be reached regarding mental evolution. Improvements and
additions to the study, such as theory of mind research and the use of fMRI,
may assist in broadening our understanding. One certainty remains: If the
evolution of the mind does appear to be continuous across species, then
humans differ only in degree and not in substance. This may have potential
implications for medicine, philosophy, science and theology. Perhaps, of
equal importance, might be the impact on the ways in which humans
conceive of the world and of our own hurnan nature.

194
References
Aiello, L.C. & Dunbar, R.I.M. (1993). Neocortex size, gr<>up size and the
evolution of language. Current Anthropology. 34. 184-193.
Alcock, J. (1993). Animal behavior: An evolutionary approach. (5th Ed.).
Sunderland, MA: Sinauer.
Alexander, R.D. (1974). The evolution of social behavior. Annual Review of
Ecology and Systematics. 5. 325-383.
Andelman, S. (1986). Ecological and social determinants of cercopithecine
mating patterns. In 0.1. Rubenstein & R.W. Wrangham (Eds.), Ecological
aspects of social evolution (pp. 201-216). Princeton: Princeton University
Press.
Anderson, D.J. & Berland, L. (1989). In J.K.T. Lee, S.S. Sagel &R.J. Stanley
(Eds.) Computed body tomography with MRI correlation (pp. 31-60). New
York: Raven Press.
Armstrong, E. (1983). Relative brain size and metabolism in mammals.
Science. 220. 1302-4.
Armstrong, E. (1985). Allometric considerations of the adult mammalian
brain, with special emphasis on primates. In W.L. Jungers (Ed.), Size and
scaling in primate biology (pp. 115-146). New York: Plenum Press.
Arnason, U. (1974). Comparative chromosome studies in Cetacea. Hereditas.
lL 1-36.
Aroyan, J.L., Cranford, T.W., Kent, J. & Norris, K.S. (1992). Journal of the
Acoustical Society of America. 92(5), 2539-2545.

195
Attili, G. (1985). The extent to which children's early relationships are adapted
to promote their social and cognitive development. In R.A. Hinde, A-N.
Perret-Clermont & J. Stevenson-Hinde (Eds.), Social relations and
cognitive development. Oxford: Oxford University Press.
Au, W.W.L. (1993). The sonar of dolphins. New York: Springer-Verlag.
Au, W.W.L. (1994). Comparison of sonar discrimination- dolphin and an
artificial neural network. Journal of the Acoustical Society of America.
95(5), 2728-2735.
Au, W.W.L. & Nachtigall, P.E. (1997). Acoustics of echolocating dolphins and
small whales. Marine and Freshwater Behaviour and Physiology. 29. 127
162.
Axelrod, R. &Hamilton, W.D. (1981). The evolution of co-operation. Science.
211.1390-1396.
Barnes, L.G. (1984). Search for the first whale: retracing the ancestry of
cetaceans. Oceans. 17(2), 20-3.
Barnes, G.T. & Lakshminarayanan, A.V. (1989). Computed tomography:
Physical principles and image quality considerations. In J.K.T. Lee, S.S.
Sagel & R.J. Stanley (Eds.) Computed body tomography with MRI
correlation (pp. 1-21). New York: Raven Press.
Baron-Cohen, S., Leslie, A.M. &Frith, U. (1985). Does the autistic child have
a theory of mind? Cognition. 21. 37-46.
Barros, N.B. (1997). Unpublished data.
Barros, N.B. & Cockroft, V.G. (1991). Prey of humpback dolphins (Sousa
plumbea) stranded in eastern Cape Province, South Africa. Aquatic
Mammals. 17(3),134-136.

196
Barros, N.B. & Wells, R.S. (1998). Prey and feeding patterns of resident
bottlenose dolphins (Tursiops truncatus) in Sarasota Bay, Florida. Journal
of Mammalogy, 79(3), 1045-1059.
Barton, R.A. (1993). Independent contrasts analysis of neocortical size and
socioecology in primates. Behavioural and Brain Sciences. 16(4),694-695.
Barton, R.A. (1996). Neocortex size and behavioural ecology in primates.
Proceedings of the Royal Society of London Series B. 263(1367),173-177.
Barton, R.A. & Dunbar, R.I.M. (1997). In A. Whiten and R.W. Byrne (Eds.),
Machiavellian Intelligence 11: Extensions and evaluations (pp. 240-263).
Cambridge: Cambridge University Press.
Barton, R.A., Purvis, A. & Harvey, P.H. (1995). Evolutionary radiation of
visual and olfactory brain systems in primates, bats and insectivores.
Philosophical Transactions of the Royal Society of London. Series B, 348.
381-392.
Bauchot, R. & Stephan, H. (1969). Encephalisation et niveau evolutif chez les
simiens. Mammalia, 33, 225-275.
Bauer, G.8. & Johnson, C.M. (1994). Trained motor imitation by bottle-nosed
dolphins (Tursiops truncatus). Perceptual and Motor Skills. 79(3), 1307
1315.
Bearzi, G., Notarbartolodisciara, _G. & Politi, E. (1997). Social ecology of
bottle-nosed dolphins in the Kvarneric (Northern Adriatic Sea). Marine
Mammal Science, 13(4), 650-668.
Bel'kovich, V.M. (Ed.). (1991). Herd structure, hunting and play: bottlenose
dolphins in the Black Sea. In K. Pryor & K. Norris (Eds.), Dolphin societies:

197
Discoveries and puzzles (pp. 17-77). Berkeley, CA: University of California
Press.
Benton, M.J. (1990). Vertebrate Palaeontology: Biology and evolution.
London: Unwin Hyman.
Best, P.B. (1970). Records of the pygmy killer whale, Feresa attenuata, from
Southern Africa, with notes on behaviour in captivity. Annals of the South
African Museum, 57, 1-14.
Block, N. (1995). On a confusion about a function of consciousness.
Behavioural and Brain Sciences, 18,227-287.
Bonner, J.T. (1980). The evolution of culture in animals. Princeton: Princeton
University Press.
Bradbury, J.W. (1986). Social complexity and co-operative behavior in
delphinids. In R.J. Schusterman, J.A. Thomas and F.G. Wood, (Eds.),
Dolphin cognition and behaviour: a comparative approach (pp. 361-372).
Hillsdale, NJ: Lawrence Erlbaum and Associates.
Brownell, R.L. Jr. (1984). Review of platanistid dolphins. Report. International
Whaling Commission (Special I'ssue 6), 149-158.
Brouwers, M.E.L., Kaminga, C., Klooswijk, A.I.J. & Terry, R.P. (1990). The
use of computed tomography in cetacean research. Airsac determination
of Lagenorhynchus albirostris ~art 1. Aquatic Mammals, 16(3), 145-55.
Bullock, T.H. & G~revich, V. (1979). Soviet literature on the nervous system
and psychobiology of Cetacea. International Review of Neurobiology, 21,
48-127.
Byrne, R.W. (1993). Do larger brains mean greater intelligence? Behavioural
and Brain Sciences, 16(4),696-697.

198
Byrne, R.W. (1994). The evolution of intelligence. In P.J.B. Slater and T.R.
Halliday (Eds.), Behaviour and evolution (pp. 223-65). Cambridge:
Cambridge University Press.
Byrne, R.W. (1995). The Thinking Ape. New York: Oxford University Press.
Byrne, R.W. & Whiten, A. (Eds.). (1988). Machiavellian Intelligence: Social
Expertise and the Evolution of Intellect in Monkeys. Apes and Humans.
Oxford: Oxford University Press.
Byrne, R.W. & Whiten, A. (1992). Cognitive evolution in primates: Evidence
from tactical deception? Man. 27. 609-627.
Byrne, R.W. & Whiten, A. (1997). Machiavellian intelligence. In A. Whiten &
R.W. Byrne (Eds.), Machiavellian intelligence 11: extensions and
evaluations (pp. 1-23). Cambridge: Cambridge University Press.
Caldwell, M.C. & Caldwell, D.K. (1966). Epimeletic behavior in Cetacea. In
K.S. Norris (Ed.), Whales. dolphins and porpoises (pp. 755-789). Berkeley:
University of California Press.
Call, J. & Tomasello, M. (1998). Distinguishing intentional from accidental
actions in orangutans (Pongo pygmaeus) , chimpanzees (Pan troglodytes)
and human children (Homo sapiens). Journal of Comparative Psychology.
112(2), 192-206.
Call, J. & Tomasello, M. (1998). A nonverbal false belief task: the
performance of children and great apes. Child Development (in press).
Caro, T.M. (1994). Cheetahs of the Serengeti plains.. Chicago: University of
Chicago Press.
Carr, G.M. & Macdonald, D.W. (1984). The sociality of solitary foragers: a
model based on resource dispersion. Animal Behaviour. 34. 1540-1549.

199
Cheney, D.L. & Seyfarth, R.M. (1985). Vervet monkey alarm calls:
manipulation through shared information? Behaviour. 94. 150-166.
Cheney, D.L. & Seyfarth, R.M. (1990). How monkeys see the world: inside
the mind of another species. Chicago: University of Chicago Press.
Cheney, D., Seyfarth, R. & Smuts, B. (1986). Social relationships and social
cognition in nonhuman primates. Science, 234. 1361-1366.
Chynn, K.Y. & Finby, N. (1982). Manual of cranial computerized tomography.
Basel: S. Karger.
Clark, C.W. (1983). Acoustic Communication of the Southern Right Whale
(Eubalaena australis). In R. Payne (Ed.), Communication and Behavior of
Whales (pp.163-198), Boulder, CO: Westview Press.
Clarke, M.R. (1986). Cephalopods in the diet of odontocetes. In M.M. Bryden
& R. Harrison (Eds.), Research on Dolphins (pp. 281-321). New York:
Oxford University Press.
Cliff, G., Dudley, S.F.J. & Davis, B. (1988). An overview of shark catches in
Natal's shark nets: 1966-1986. In I.A.W. Macdonald &R.J.M. Crawford
(Eds.), Long term data series relating to southern Africa's renewable
natural resources. Proceedings of the National Conference on Long Term
Data Series, 12-14 oet. 1987, Pretoria, S.A. South African National
Scientific Progress Reports, 157,84-90.
Clutton-Brock, T.H. & Harvey, P.H. (1976). Evolutionary rules and primate
societies. In P. Bateson & R. Hinde (Eds.), Growing points in ethology.
Cambridge: Cambridge University Press.
Clutton-Brock, T.H. & Harvey, P.H. (1980). Primates, brains and ecology.
Journal of Zoology. London. 190. 309-23.

200
Cockcroft, V.G. (1989), Biological studies of bottlenose dolphins from Natal
coastal waters. Unpublished PhD thesis. University of Natal,
Pietermaritzburg, South Africa.
Cockcroft, V.G. (1990a). Dolphin catches in the Natal shark nets, 1980 to
1988. South African Journal of Wildlife Research. 20(2), 44-51.
Cockcroft, V.G. (1990b). Incidence of shark bites on Indian Ocean hump
backed dolphins (Sousa plumbea) off Natal, South Africa. In S.
Leatherwood & G.P. Donovan (Eds.), Cetaceans and Cetacean Research
in the Indian Ocean Sanctuary. Nairobi, Kenya. UNEP Marine Mammal
Technical Report No. 3, 277-282.
Cockroft, V.G., Cliff, G. & Ross, G.J.B. (1989). Shark predation on Indian
Ocean bottlenose dolphins Tursiops truncatus off Natal, South Africa.
South African Journal of Zoology. 24(4), 305-310.
Cockcroft, V.G., Haschick, S.L. & Klages, N.T.W. (1993). The diet of Risso's
dolphin, Grampus griseus from the east coast of South· Africa. Zeitschrift
fuer Saeugetierkunde. 58. 286-293.
Cockroft, V.G. & Peddemors, V.M. (1990). Seasonal distribution and density
of common dolphins off the south east coast of southern Africa. South
African Journal of Marine Science. 9. 371-377.
Cockroft, V.G. & Ross, G.J.B. (1990a). Food and feeding of the Indian Ocean
bottlenose dolphin off southern Natal, South Africa. In S. Leatherwood &
R.R. Reeves (Eds.), The Bottlenose Dolphin (pp.295-308), San Diego:
Academic Press.
Cockroft, V.G. & Ross, G.J.B. (1990b). Age, growth and reproduction of
bottlenose dolphins Tursiops truncatus from the east coast of South Africa.
Fishery Bulletin. 88(2), 289-302.

2{)1
Cockcroft, V.G., Ross, .J.B. & Peddemors, V.M. (1990). Bottlenose dolphin
Tursiops truncatus distribution in Natal's coastal waters. South African
Journal of Marine Science, 9, 1-10.
Cockroft, V.G. & Sauer, W. (1990). Observed and inferred epimeletic
(nurturant) behaviour in bottlenose dolphins. Aquatic Mammals, 16(1), 31
32.
Cole, M.. (1985). The zone of proximal development: where culture and
cognition create each other. In J.V. Wertsch (Ed.), Culture, communication
and cognition: Vygotskian perspectives (pp, 146-161). Cambridge, MA:
Cambridge University Press.
Connor, R.C. & Norris, K.S. (1982). Are dolphins reciprocal altruists? The
American Naturalist 119(3), 358-374.
Connor, R.C., Smolker, R.A. & Richards, A.F. (1992a). Two levels of alliance
formation among male bottlenose dolphins (Tursiops sp.). Proceedings.
National Academy of Sciences. USA. 89,987-990.
Connor, R.C., Smolker, R.A. & Richards, A.F. (1992b). Dolphin alliances and
coalitions. In A. Harcourt & F.B.M. de Waal (Eds.) Coalitions and alliances:
in humans and other animals (pp. 415-443). Oxford: Oxford University
Press.
Corballis, M.C. (1991). The lopsided ape. New York: Oxford University Press.
Cords, M. (1997). Friendships, alliances, reciprocity and repair. In A. Whiten
& R.W. Byrne (Eds.), Machiavellian intelliaence 11: extensions and
evaluations (pp. 24-49). Cambridge: Cambridge University Press.

202
Cormack, A.M. Early two-dimensional (CT scanning) and recent topics
stemming from it. Journal of Computer Assisted Tomography, 4(5), 658
664.
Cosmides, L. &Tooby, J. (1993). The lords of many domains. Times Higher
Education Supplement. June 25.
Count, E.W. (1947). Brain and body weight in man: Their antecedents in
growth and evolution. Annals, New York Academy of Sciences, 46, 993
1122.
Cranford, T.W. (1988). The anatomy of acoustic structures in the spinner
dolphin forehead as shown by x-ray computed tomography and computer
graphics. In P.E.N. Nachtigall & P.W.B. Moore (Eds.), Animal Sonar
Processes and Performance (pp. 67-77), New York: Plenum Press.
Cranford, T.W., Amundin, M. & Norris, K.S. (1996). Functional morphology
and homology in the odontocete nasal complex- implications for sound
generation. Journal of Morphology, 228(3), 223-285.
Crawford, R.J.M. & Shelton, P.A. (1981). Population trends for some
southern African seabirds related to fish availability. In J. Cooper (Ed.),
Proceedings of the Symposium on birds of the sea and shore (pp15-41).
Cape Town: African Seabird Group.
Crook, J.H. & Gartlan, J.S. (1966). Evolution of primate societies. Nature.
210, 1200-1203.
D'Amato, M.R. & Colombo, M. (1986). Auditory delayed matching-to-sample
in monkeys (Cebus apella). Animal Learning and Behavior, 13,375-382.
Darwin, C.R. (1859). The origin of species by means of natural selection.
London: J. Murray.

203
Darwin, C.R. (1871). The descent of man and selection in relation to sex.
London: J. Murray.
Davies, D.H. (1964). About sharks and shark attack. Pietermaritzburg, South
Africa: Shuter and Shooter.
Davies, M. (1999a). Consciousness and thought. In C. Taddei-Ferretti & C.
Musio (Eds.), Neuronal bases and psychological aspects of consciousness
(in press). Singapore: World Scientific.
Davies, M. (1999b). Phenomenal consciousness, access consciousness and
information processing psychology. In C. Taddei-Ferretti & C. Musio
(Eds.), Neuronal bases and psychological aspects of consciousness (in
press). Singapore: World Scientific.
Davies, M. & Humphreys, G.W. (Eds.). (1993). Consciousness: psychological
and philosophical essays. Oxford: Blackwell.
Davies, M. & Stone, T. (Eds.). (1995). Folk psychology: the theory of mind
debate. Oxford: Blackwell.
Davis, B., Cliff, G. & Dudley, S.F.J. (1989). The Natal Sharks Board. In A.I.L.
Payne & R.J.M. Crawford (Eds.), Oceans of life off southern Africa
(pp.209-213). Cape Town: Vlaeberg.
de Waal, F.B.M. (1991). Peacemaking among primates. London. Penguin.
Deacon, T.W. (1990). Rethinking Mammalian Brain Evolution. American
Zoologist. 30,629-705.
Deacon, T.W. (1990b). Fallacies of progression indices in theories of brain
size evolution. International Journal of Primatology, 11, 193-236.

204
Deacon, T.W. (1993). Confounded correlations, again. Behavioural and Brain
Sciences. 16(4),698-699.
Dennet, D. C. (1996). The intentional stance. Cambridge, MA: MIT Press.
Dix, J. (1998). Preliminary observations on the bottlenose dolphin (Tursiops
truncatus) and humpback dolphin (Sousa chinensis) in Durban harbour,
South Africa. Unpublished MSc thesis. University of Utrecht, Netherlands.
Dixon, W.T. (1989). MRI physics and instrumentation. In J.K.T. Lee, S.S.
Sagel & R.J. Stanley (Eds.) Computed body tomography with MRI
correlation (pp. 23-30). New York: Raven Press.
Donald, M. (1991). Origins of the modern mind: Three stages in the evolution
of culture and cognition. Cambridge, Ma: Harvard University Press.
Donald, M. (1993). Do grooming and speech really serve homologous
functions? Behavioural and Brain Sciences. 16(4),700-701.
Douzery, E. (1993). Evolutionary relationships among Cetacea based on the
sequence of the mitochondrial 12S RNA gene: Possible paraphyly of
toothed whales (Odontocetes) and long separate evolution of sperm
whales (Physeteridae). Comptes Rendus De L'Academie Des Sciences.
Serie Ill. Sciences De La Vie. 316(12),1511-1518.
Dubois, E. (1897). Sur le rapport du poids de I'encephale avec la grandeur du
crops chez le mammifer'eSt Bulletins et Memoires. Societe
d'Anthropologie de Paris. 8. 337-376.
Dudley, S.F.J. &Cliff, G. (1993). Some effects of shark nets in the Natal
nearshore environment. Environmental Biology of Fishes. 36. 243-255.

205
Dudok van Heel, W.H. (1981). Investigations on cetacean sonar Ill. A
proposal for an ecological classification of odontocetes in relation with
sonar. Aquatic Mammals, 8(2),201-204.
Dunbar, R.I.M. (1988). Primate social systems. London: Croom Helm.
Dunbar, R.I.M. (1992). Neocortex size as a constraint on group size in
primates. Journal of Human Evolution. 20, 469-493.
Dunbar, R.I.M. (1993). Coevolution of neocortical size, group size and
language in humans. Behavioural and Brain Sciences, 16,681-735.
Dunbar, R.I.M. (1995). Neocortex size and group size in primates: a test of
the hypothesis. Journal of Human Evolution, 28, 287-296.
Dunbar, R.I.M. & Bever, J. (1998). Neocortex size determines group size in
insectivores and carnivores. Ethology, 104, 695-708.
Dunbar R.I.M. & Dunbar, P. (1988). Maternal time budgets of gelada '
baboons. Animal Behaviour, 36, 970-980.
Durham, B. (1990). Genetic variation in the bottlenose dolphin Tursiops
truncatus along the Natal coast. South Africa. Unpublished B.Sc. (Hons.)
thesis, Univers·ity of Natal, Durban, South Africa.
Durham, B. (1994). The distribution and abundance of the humpback dolphin
(Sousa chinensis) along the Natal coast. South Africa. l)npublished MSc
thesis, University of Natal, Durban, South Africa.
Eccles, J.C. (1973). The Understanding of the Brain. New York: McGraw-Hill.
Ehrlich, P.R. & Roughgarden, J. (1987). The science of ecology. New York:
Macmillan.

206
Eisenberg, J.F. (1966). The social organisation .of mammals. Handbuch der
Zoologie, 10, 1-92.
Eisenberg, J.F. (1981). The Mammalian Radiations: An Analysis of Trends in
Evolution, Adaptation and 8ehavior. Chicago: University of Chicago Press.
Eisenberg, J.F. (1986). Dolphin behaviour and cognition: evolutionary and
ecological aspects. In R.J. Schusterman, J.A. Thomas & F.G. Woods
(Eds.), Dolphin cognition and behaviour: a comparative approach (pp.261
270). Hillsdale, .NJ: Lawrence Erlbaum ,Associates.
Eisenberg, J.F., Muckenhirn, N.A. & Rudran, R. (1972). The relationship
between ecology and social structure in primates. Science, 176, 863-874.
Eisenberg, J.F. & Wilson, D.E. (1978). Relative brain size and feeding
strategies in the Chiroptera. Evolution. 32. 740-751.
Elias, H. & Schwartz, D. (1969). Surface areas of the cerebral cortex of
mammals determined by stereological rnethods. Science. 166. 111-113.
Elias, H. & Schwartz, D. (1971). Cerebro-cortical surface areas, volumes,
lengths of gyri and their interdependence in mammals, including man.
Zeitschrift fuer Saeugetierkunde, 36, 147-63.
Engel, S.A., Rumelhart, D.E., Wandell, 8.A., Lee, A.T., Glover, .H.,
Chichilnisky, E.J. & Shadlen, M.N. (1994). fMRI of human visual cortex.
Nature, 369(6481), 525.
Essock-Vitale, S. & Seyfarth. R.M. (1987). Intelligence and social cognition.
In 8.8. Smuts, D.L. Cheney, R.M. Seyfarth, R.W. Wrangham & T.T.
Struhsaker (Eds.) Primate societies (pp. 452-461). Chicago: University of
Chicago Press.

207
Evans, P.G.H. (1987). The Natural History of Whales and Dolphins. London:
Christopher Helm.
Evens, R.G. & Evens, R.G. Jr. (1991). Analysis of economics and use of MR
imaging in the United States in 1990. American Journal of Roentgenology.
157(3), 603-607.
Evens, R.G. & Mettler, F.A. (1985). National CT use and radiation exposure:
United States 1983. American Journal of Roentgenology. 144(5), 1077
1081.
Findlay, K.P. 1989. The distribution of cetaceans off the coast of South Africa
and South West Africa/Namibia. Unpublished MSc thesis, University of
Pretoria, South Africa.
Findlay, K.P., Best, P.B., Ross, G.J.B. &Cockcroft, V. (1992). The distribution
of small odontocete cetaceans off the coasts of South Africa and Namibia.
South African Journal of Marine Science. 12. 237-270.
Finlay, B.L. & Oarlington, R.B. (1995). linked regularities in the development
and evolution of mammalian brains. Science. 268,1578-82.
Flanigan, B.O., Bradley, W.G., Mazziotta, J.C., Rauschning, W., Bentson,
J.R., lufkin, R.B. &Hieshima, G.B. (1985). Magnetic resonance imaging of
the brainstem: normal structure and functional anatomy. Radiology. 154.
375-385.
Fleagle, J.G. Size and adaptation in primates. In W.l. Jungers (Ed.), Size
and scaling in primate biology (pp. 1-19). New York: Plenum Press.
Flemming, B.W. & Hay, E.R. (1988). Sediment distribution and dynamics on
the Natal continental shelf. In E.H. Schumann (Ed.), lecture notes on
coastal and estuarine studies (pp. 47-80). Germany: Springer Verlag.

208
Foley, R.A. & Lee, P.C. (1989). Finite social space, evolutionary pathways
and reconstructing hominid behaviour. Science. 243, 901-906.
Ford, J.K.B. & Fisher, H.D. (1983). Group-Specific Dialects of Killer Whales.
In R. Payne (Ed.), Communication and Behavior of Whales (pp. 129-162).
Boulder, Col: Westview Press.
Fox, M.W. (1971). Behaviour of wolves. dogs and related canids. London:
Jonathan Cape.
Galef, B.G. (1976). Social transmission of acquired behaviour: A discussion
of tradition and social learning in vertebrates. In J.S. Rosenblatt, R.A.
Hinde, E. Shaw &C. Beer (Eds.), Advances in the study of behaviour. Vol.
~ New York: Academic Press.
Galef, B.G. (1988). Imitation in animals: history, definition and interpretation
of data from the psychological laboratory. In T.R. Zentall & B.G. Galef
(Eds.), Social learning: psychological and biological perspectives (pp. 3
28). Hillsdale, NJ: Lawrence Erlbaum.
Gallup, G.G. Jr. (1970). Chimpanzees: self-recognition. Science. 167.86-87.
Gallup, G.G. Jr. (1975). Towards an operational definition. of self-awareness.
In R.H. Tuttle (Ed.), Socioecology and psychology of primates (pp.309
341). Paris: Mouton.
Gaskin, D.E. (1982). The ecology of whales and dolphins. London:
Heinemann Press.
Gaskin, D.E., Smith, G.J.D., Watson, A.P., Yasui, W.Y. & Yurick, 0.8. (1984).
Reproduction in the porpoises (Phocoenidae): Implications for
.,. management. Report. International Whaling Commission (Special Issue 6),
135-148.

209
Gibson, K.R. (1985). Has the evolution of intelligence stagnated since
Neanderthal Man? In G. Butterworth, J. Rutkowska & M. Scaife (Eds.),
Evolution and developmental psychology (pp. 102-114). Brighton:
Harvester Press.
Gibson, K.R. (1986). Cognition, brain size and the extraction of embedded
food resources. In J. Else & P.C. lee (Eds.), Primate Ontogeny. Cognition
and Social Behaviour. Cambridge: Cambridge University Press.
Gilpatrick, J.W. (1993). Method and precision in estimation of dolphin school
size with vertical aerial photography. Fishery Bulletin. 91 (4),641-648.
Gingerich, P.D., Wells, N.A., Rusell, D.E., & Shah, S.M.1. (1983). Origin of
whales in epicontinental remnant seas: new evidence from the Early
Eocene of Pakistan. Science. 220. 403-406.
Gittleman, J.l. (1986). Carnivore brain size, behavioural ecology and
phylogeny. Journal of Mammalogy, 67. 23-36.
Glezer, 1.1. & Kinzey, W.G. (1993). Do gossip and lack of grooming make us
human? Behavioural and Brain Sciences, 16(4),704-705.
Glezer, 1.1., Jacobs, M.S. & Morgane, P.J. (1988). Implications of the 'initial
brain' concept for brain evolution in Cetacea. Science, 268, 1578-1582.
Goody, E.N. (1997). Social intelligence and language: Another Rubicon. In A.
Whiten & R.W. Byrne (Eds.), Machiavellian intelligence 11: extensions and
evaluations (pp. 365-396). Cambridge: Cambridge University Press.
Gopnik, A. &Wellman, H.M. (1995) The child's theory of mind. In M. Davies &
T. Stone (Eds.), Folk psychology: The theory of mind debate (pp. 232
258). Oxford: Blackwell.

210
Gould, S.J. (1975). Allometry in primates, with emphasis on scaling and the
evolution of the brain. Contributions to Primatology, 5, 244-292.
Gretarsdottir, S. & Arnason, U. (1992). Evolution of the common cetacean
highly repetitive DNA component and the systematic position of Orcaella
brevirostris. Journal of Molecular Evolution, 34(3), 201-208.
Guerber, H.A. (1944). The Myths of Greece and Rome. London: George C.
Harrap & Co. Ltd.
Hamilton, W.D, (1964). The genetical evolution of social behavior. 11. Journal
of Th.eoretical Biology, 7, 17-52.
Hamilton, W.D. (1972). Altruism and related phenomena, mainly in social
insects. Annual Review of Ecology and Systematics. 3. 193-232.
Harcourt, A.H. (1988). Alliances in social contests and social intelligence. In
R.W. Byrne and A. Whiten (Eds.), Machiavellian Intelligence: Social
Expertise and the Evolution of Intellect in Monkeys, Apes and Humans.
(pp. 132-152). Oxford: Oxford University Press.
Harcourt, A.H. (1992). Coalitions and alliances: are primates more complex
than non-primates? In A.H. Harcourt & F.B.M. de Waal (Eds.) (1992).
Coalitions and alliances in humans and other animals (pp. 445-471).
Oxford: Oxford University Press.
Harcourt, A.H. & de Waal, F.B.M. (Eds.) (1992). Coalitions and alliances in
humans and other animals. Oxford: Oxford University Press.
Harley, H.E., Roitblat, H.L. & Nachtigall, P.E. (1996). Object representation in
the bottle-nosed dolphin (Tursiops truncatus)- integration of visual and
echoic information. Journal of Experimental Psychology: Animal Behavior
Processes, 22(2), 164-174.

211
Haug, H. (1970). Qualitative und quantitative untersuchungen an den
gehirnen des menschen, der delphinoideae und des elefanten.
Ergebenisse der Anatomie und Entwicklungseschichte. 43. 1-70.
Hauser, M.D. (1997). Minding the behaviour of deception. In A. Whiten &
R.W. Byrne (Eds.), Machiavellian intelligence 11: extensions and
evaluations (pp.112-143). Cambridge: Cambridge University Press.
Heiken, J.P. & Brown, J.J. (1991). Manual of clinical magnetic resonance
imaging. (2nd Ed.). New York: Raven Press.
Helweg, D.A., Roitblat, H.L., Nachtigall, P.E. & Hautus, M.J. (1996).
Recognition of aspect dependent 3-dimensional objects by an
echolocating Atlantic bottle-nosed dolphin. Journal of Experimental
Psychology: Animal Behavior Processes. 22(1),19-31.
Hemmer, H. (1979). Socialisation by intelligence: social behaviour in
carnivores as a function of relative brain size and environment. Carnivore.
£. 102-105.
Henneberg, M. (1987). Brain size, body size and intelligence: convictions and
facts. South African Journal of Science. 83. 380.
Henschel, J.R. & Skinner, J.D. (1991). Territorial behaviour by a clan of
spotted hyaenas (Crocuta crocuta). Ethology. 88.223-235.
Herman, L.M. (1980). Cognitive .Characteristics of Dolphins. In L. Herman
(Ed.), Cetacean behaviour: Mechanisms and functions (pp. 363-429). New
York: John WHey & Sons.
Herman, L.M. (1986). Cognition and language competencies of bottlenosed
dolphins. In R.J. Schusterman, J.A. Thomas & F.G. Woods (Eds.),

212
Dolphin cognition and behaviour: a comparative approach (pp.221-252).
Hillsdale, NJ: Lawrence Erlbaum Associates.
Herman, L.M. (1991). What the dolphin knows, or might know, in its natural
world. In K. Pryor & K. Norris (Eds.), Dolphin societies: Discoveries and
puzzles (pp. 349-363). Berkeley, CA: University of California Press.
Herman, L.M., Pack, A.A. & Wood, A.M. (1994). Bottle-nosed dolphins can
generalize rules and develop abstract concepts. Marine Mammal Science,
1Q(1), 70-80.
Heydorn, A.E.F., Bang, N.D., Pearce, A.F., Flemming, B.W., Carter, R.A.,
Schleyer, M.H., Berry, P.F., Hughes, G.R., Bass, A.J., Wallace, J.H., Van
Der Elst, R.J.M., Crawford, R.J.M. &Shelton, P.A. (1978). Ecology of the
Agulhas Current region: An assessment of biological responses to
environmental parameters in the south-west Indian Ocean. Transactions of
the Royal Society of South Africa, 43(2), 151-190.
Hildebrand, M. (1995). Analysis of vertebrate structure. New York: John WHey
& Sons, Inc.
Hinde, R.A. (1976). Interactions, relationships and social structure. Man, 11"
1-17.
Hinde, R.A. (Ed.) (1983). Primate social relationships. Oxford: Blackwell.
Hinde, R.A., Perret-Clermont, A~N. & Stevenson-Hinde, J. (Eds.). (1985).
Social relations and cognitive development. Oxford: Oxford University
Press.
Hinde, R.A & Stevenson-Hinde, J. (1973). Constraints on learning:
Limitations and predispositions. London: Academic Press.

213
Hisashige, A. (1994). MR imaging in Japan and the United States: analysis of
utilisation and economics. American Journal of Roentgenology, 162(3),
507-510.
Hol!oway, R.L. (1993). Another primate brain fiction: Brain (cortex) weight and
homogeneity. Behavioural and Brain Sciences, 16(4),707-708,
Hof, P.R., Glezer, 1.1., Archin, N., Janssen, W.G., Morgane, P,J., Morrison,
J.H. (1992). The primary auditory cortex in cetacean and human brain: a
comparative analysis of neurofilament protein- containing pyramidal
neurons. Neuroscience Letters, 146(1),91-95.
Hofer, H. & East, M.L. (1993). The comrnuting system of Serengeti spotted
hyaenas: I, 11 and Ill, Animal Behaviour, 46, 547-589.
Hofman, M.A. (1982a). Encephalisation in mammals in relation to the size of
the cerebral cortex. Brain, Behavior and Evolution, 20, 84-96.
Hofman, M.A. (1982b). A two-component theory of encephalisation in
mammals. Journal of Theoretical Biology, 99, 571-584.
Hofman, M.A. (1983a). Energy metabolism, brain size and longevity in
mammals. Quarterly Review of Biology, 58,495-512.
Hofman, M.A. (1983b). Evolution of the brain in neonatal and adult placental
mammals: a theoretical approach. Journal of Theoretical Biology, 105,
317-322.
Hounsfield, G.N. (1980). Computed medical imaging. Journal of Computer
Assisted Tomography, 4(5),665-674.
Humphrey, N.K. (1976). The social function of intellect. In P.P.G. Bateson &
R. A. Hinde (Eds.), Growing Points in Ethology. Cambridge: Cambridge
University Press.

214
Hunter, LT. (1988). Climate and weather off Natal. In E.H. Schumann (Ed.),
Lecture notes on coastal and estuarine studies (pp.81-100). Germany:
Springer Verlag.
Jacobs, B. & Raleigh, M.J. (1993). Sizing up social groups. Behavioural and
Brain Sciences. 16(4), 710-711.
Janik, V.M., Dehnhardt, . & Todt, D. (1994). Signature whistle variations in a
bottlenosed dolphin, Tursiops truncatus. Behavioral Ecology and
Sociobiology, 35, 243-248.
Jarman, P. (1974). The social organisation of antelope in relation to their
ecology. Behaviour, 48, 215-267.
Jefferson, T.A., Stacey, P.J. & Baird, R.W. (1991). A review of killer whale
interactions with other marine mammals: predation to co-existence.
Mammal Review, 21(4),151-180.
Jerison, H.J. (1973). Evolution of the brain and intelligence. New York:
Academic Press.
Jerison, H.J. (1979). Brain, body and encephalisation in early primates.
Journal of Human Evolution, 8, 615-635.
Jerison, H.J. (1982a). Allometry, brain size, cortical surface and
convolutedness. In E. Armstrong & D. Falk (Eds.), Primate brain evolution:
methods and concepts (pp. 77-.84). New York: Plenum Press.
Jerison, H.J. (1982b). The Fossil History of Mind. In V.J.A. Novak & J.
Mlikovsky (Eds.), Evolution and Environment. Prague: CSAV.
Jerison, H.J. (1986). The Perceptual Worlds of Dolphins In R.J. Schusterman,
J.A. Thomas & F.G. Woods (Eds.), Dolphin cognition and behaviour: A

215
comparative approach (pp. 141-166). Hillsdale, NJ: Lawrence Erlbaum
Associates.
Jerison, H.J. (1993). Number our days: Quantifying social evolution.
Behavioural and Brain Sciences, 16(4),696-697.
Joffe, T.H. (1997)~ Social pressures have selected for an extended juvenile
period in primates. Journal of Human Evolution, 32(6), 593-605.
Joffe, T.H. & Dunbar, R.I.M. (1997). Visual and sociocognitive information
processing in primate brain evolution. Proceedings of the Royal Society of
London Series B, 264(1386), 1303-1307.
Johnson, C.M. & Norris, K.S. (1986). Delphinid social organisation and social
behaviour. In R.J. Schusterman, J.A. Thomas, & F.G. Wood (Eds.),
Dolphin cognition and behaviour: A comparative approach (pp. 335-346).
Hillsdale, NJ: Lawrence Erlbaum Associates.
Johnson, M.H. (1997). Developmental cognitive neuroscience. Oxford:
Blackwell.
Johnson, S.C. (1986). Dolphin audition and echolocation capacities. In R.J.
Schusterman, J.A. Thomas and F.G. Wood, (Eds.), Dolphin- cognition and
behaviour: a comparative approach (pp. 115-136). Hillsdale, NJ: Lawrence
Erlbaum and Associates.
Jolly, A. (1966). Lemur social b~haviour and primate intelligence. Science,
153, 501-506.
Joseph, P.M. (1991). Principles of image formation. In S.W. Atlas (Ed.), MRI
of the brain and spine (pp. 39-47). New York: Raven Press.
Joseph, R. (1996). Neuropsychiatry, neuropsychology and clinical
neuroscience. (2nd Ed.). Baltimore: Williams and Wilkins.

216
Jungers, W.L. & Olson, T.R. (1985). Relative brain size in galagos and
lorises. In H.R. Duncker & G. Fleischer (Eds.), Functional morphology in
vertebrates (pp. 537-540). Stuttgart: Gustav Fischer Verlag...
Kamiya, T., Pirlot, P. & Hasegawa, Y. (1985). Comparative brain morphology
of miocene and recent sirenians. In H.R. Duncker & G. Fleischer (Eds.),
Functional morphology in vertebrates (pp. 541-544). Stuttgart: Gustav
Fischer Verlag.
Karczmarski, L., Thornton, M. & Cockroft, V.G. (1997). Description of
selected beha~iours of humpback dolphins Sousa chinensis. Aquatic
Mammals. 23(3),127-133.
Kesarev, V. (1971). The inferior brain of the dolphin. Soviet Science Review.
£. 52-58.
Keverne, E.M., Martel, F.L. & Nevison, C.M. (1996). Primate brain evolution
genetic and functional considerations._Proceedings of the Royal Society of
London Series B. 263(1371), 689-696.
Kling, A.S. (1986). Neurological correlates of social behaviour. Ethology and
Sociobiology. 7.175-186.
Klinghammer, E. (1975). The behaviour and ecology of wolves. Wilmington:
Garland.
Klinowska, M. (1994). Brains, be~aviour and intelligence in cetaceans. In 11Essays on whales and man (2nd Ed.). Norway: the High North Publication.
Kojima, T. (1951). On the brain of the sperm whale (Physter catadon L.).
Scientific Reports. Whales Research Institute (Tokyo). 6.49-72.
Kolb, B. & Whishaw, I.Q. (1990). Fundamentals of Human Neuropsychology.
New York: W.H. Freeman & Co.

217
Krebs, J.R. & Davies, N.B. (1987). An Introduction to behavioural ecology.
Oxford: Blackwell.
Krebs, J.R. &Kroodsma, D.E. (1980). Repertoires and geographical variation
in bird song. Advances in the Study of Behavior. 11. 143-177.
Kruger, L. (1966). Specialized features of the cetacean brain. In K.S. Norris
(Ed.), Whales. dolphins and porpoises (pp. 232-254). Berkeley: University
of California Press.
Kruuk, H. (1966). Clan- system and feeding habits of spotted hyaenas
(Crocuta erocuta erxleben). Nature. 209. 1257-1258.
Lamprecht, J. (1978). The relationship between food competition and
foraging group size in some larger carnivores: a hypothesis. Zeitschrift fuer
Tierpsychologie. 46. 337-343.
Lang, J. Huber, P. & Vandevelde, M. (1988). Erfahrungen mit der
Computertomographie in der Kleintie neurologie. Schweizer Archiv fuer
Tierheilkunde. 130(4), 167-183.
Langworthy, G.R. (1932). A description of the central nervous system of the
porpoise (Tursiops truncatus). Journal of Comparative Neurology. 54. 437
499.
Le Boeuf, B.J. & Peterson, R.S. (1969). Dialects in elephant seals. Science.
166.1654-1656.
Leatherwood, S. (1975). Some observations of feeding behavior of
bottlenose dolphins (Tursiops truneatus) in the northern Gulf of Mexico and
(Tursiops ef. T. ·gilll) off southern California, Baja California, and Nayarit,
Mexico. Marine Fishery Review. 37(9), 10-16.

218
Leatherwood, S. & Reeves, R.R. (1983). The Sierra Club Handbook of
Whales and Dolphins. San Francisco: Sierra Club Books.
Lee, J.K.T., Koehler, R.E. & Heiken, J.P. (1989). MR imaging techniques. In
J.K.T. Lee, S.S. Sagel & R.J. Stanley (Eds.) Computed body tomography
with MRI correlation (pp. 61-88). New York: Raven Press.
Lilly, J. (1978). Communication between man and dolphin: The possibilities of
talking with other species. New York: Crown.
Linnaeus, (1758). Systema Naturae. (10th ed.) Stockholm.
Lockley, R.M. (1979). Whales. dolphins & porpoises. London: David &
Charles.
Lockyer, C. (1990). Review of incidents involving wild, sociable dolphins,
worldwide. In S. Leatherwood & R.R. Reeves (Eds.). The bottlenose
dolphin (pp. 337-353). San Diego: Academic Press.
Lott, D.F. (1991). Intraspecific variation in the social systems of wild
vertebrates. Cambridge: Cambridge University Press.
Luria, A.S. (1.973). The Working Brain. New York: Basic Books
Luria, A.R. (1982). Language and Cognition. Washington: Winston & Sons
Lycett, J.E.L. (1995). The developmental behavioural ecology of infant
baboons (Papio cynocephalus ursinusl. Unpublished PhD thesis,
University of Natal, Durban, South Africa.
Macdonald, D.W. (1983). The ecology of carnivore social behaviour. Nature.
301. 379-384.

219
Mainardi, D. (1980). Tradition and social transmission of behaviour in
animals. In G.W. Barlow & J. Silverberg (Eds.), Sociobiology: beyond
nature/nurture. Colorado: Westview Press.
Marino, L. (1995). Brain- behaviour relationships in cetaceans and primates:
Implications for the evolution of complex intelligence. PhD. thesis, State
University of New York, University at Albany, Albany, NY.
Marino, L. (1996). What Can Dolphins Tell Us About Primate Evolution?
Evolutionary Anthropology. 5(3), 81-85.
Marino, L. (1997). The relationship between gestation length,
encephalization, and body weight in odontocetes. Marine Mammal
Science. 13(1), 133-138.
Marino, L.M. (1998). A comparison of encephalization between odontocete
cetaceans and anthropoid primates. Brain. Behavior and Evolution. 51 (4),
230-238.
Marler, P. (1970). Vocalizations of East African monkeys I: Red Colobus.
Folia Primatologica. 13.81-91.
Marten, K. & Psarakos, S. (1995). Using self-view television to distinguish
between self-examination and social behaviour in the bottle-nosed dolphin
(Tursiops truncatus). Consciousness and Cognition. 4(2), 205-224.
Martin, A.K. (1987). Comparison ~f sedimentation rates in the Natal valley,
south-west Indian Ocean, with modern sediment yields in east coast rivers
of southern Africa. South African Journal of Science. 83(11),716-724.
Martin, A.K. & Flemming, B.W. (1988). Physiography, structure and
geological evolution of the Natal continental shelf. In E.H. Schumann (Ed.),

220
Lecture notes on coastal and estuarine studies (pp. 11-46). Germany:
Springer Verlag,.
Martin, J.H. (1981). Somatic sensory system 11: Anatomical substrates for
somatic sensation. In E.R. Kandel & J.H. Schwartz, (Eds.), Principles of
neural science (pp. 170-183). New York: Elsevier Science Publishing Co.
Martin, 'R.D. (1980). Adaptation and body size in primates. Zeitschrift fuer
Morphologie und Anthropologie. 71. 115-124.
Martin, R.D. (1981). Relative brain size and basal metabolic rate in terrestrial
vertebrates. Nature. London. 293. 57-60.
Martin, R.D. (1982). Allometric approaches to the Evolution of the Primate
Nervous System. In E. Armstrong & D. Falk, (Eds.), Primate brain
evolution: methods &concepts. New York: Plenum Press.
Martin, R.D. (1990). Primate Origins and Evolution: A phylogenetic
reconstruction. London: Chapman & Hall.
Martin, R.D. & Harvey, P.H. (1985). Brain size allometry: Ontogeny and
phylogeny. In W.L. Jungers (Ed.), Size and scaling in primate biology (pp.
147-173). New York: Plenum Press.
Maxim, H. (1912). The sixth sense of the bat. Sir Hiram's contention. The
possible prevention of sea collisions. Scientific American. 7. 148-150.
McBride, A.F. (1956). Evidence "for echolocation by cetaceans. Deep-Sea
Research. 3.153-154.
McComb, K. & Semple, S. (1998). Are talkers the only thinkers? Nature. 395.
656-657.

221
McCort, J.J. (1987). Caring for the major trauma victim: the role for radiology.
Radiology. 163(1), 1-9.
McGinn, C. (1989). Can we solve the mind-body problem? Mind. 98. 349
366.
McGinn, C. (1991). The problem of consciousness. Oxford: Blackwell.
McGrew, W.C. (1977). Socialization and object manipulation of wild
chimpanzees. In S. Chevalier-Skolnikoff & F.E. Poirier (Eds.), Primate bio
social development: Social and ecological determinants. New York:
Garland.
McNaughton, S.J. & Wolf, L.l. (1979). ~eneral ecology. New York: Holt,
Rinehart and Winston.
Mendolia, C. (1990). Reproductive biology of common dolphins (De/phinus
de/phis) off the south east coast of southern Africa. Unpublished MSc
thesis, University of Port Elizabeth, South Africa.
Mercer, M.C. (1975). Modified leslie-DeLury population models of the long
finned pilot whale (Globicepha/a melaena) and annual production of the
short-finned squid (llIex iIIecebrosus) based upon their interaction at
Newfoundland. Journal of the Fisheries Research Board of Canada. 32(7),
1145-1154.
Milinkovitch, M.C., Meyer, A. & Powe11, J.R. (1994). Phylogeny of all major
groups of cetaceans based on DNA sequences from 3 mitochondrial
genes. Molecular Biology and Evolution. 11 (6), 939-948.
Mills, M.G.l. (1990). Kalahari hyaenas: The comparative behavioural ecology
of two species. London: Unwin Hyman.

222
Milton, K. (1988). Foraging behaviour and the evolution of primate
intelligence. In R.W. Byrne and A. Whiten (Eds.), Machiavellian
Intelligence: Social Expertise and the Evolution of Intellect in Monkeys.
Apes and Humans. (pp. 285-305). Oxford: Oxford University Press.
Miyazaki, N. (undated manuscript). School Structure of Stenella
Coeruleoalba. Dept of Marine Sciences, University of the Ryukyus, Japan.
Morgane, P.J., Jacobs, M.S. & Galaburda, A. (1986a). Evolutionary
Morphology of the Dolphin Brain. In R.J. Schusterman, J.A. Thomas &
F.G. Wood, (Eds.), Dolphin cognition and behaviour: A comparative
approach (pp. 5-29). Hillsdale, NJ: Lawrence Erlbaum Associates.
Morgane, P.J., Jacobs, M.S. & Galaburda, A. (1986b). Evolutionary Aspects
of cortical organisation in the dolphin brain. In R.J. Harrison & M. Bryden
(Eds.), Research on Dolphins (pp. 71-98). Oxford: Oxford University Press.
Morris, R. & Morris, D. (1966). Men and pandas. London: Hutchinson.
Morris, R.J. (1986). The acoustic faculty of dolphins. In M.M. Bryden & R.
Harrison (Eds.), Research on dolphins. (pp. 369-399). Oxford: Clarendon
Press.
Moshman, D., Glover, J.A. & Bruning, R.H. (1987). .Developmental
psychology. Boston, MA: Little, Brown & Co.
Nachtigall, P.E. (1980). Odontocete echolocation performance on object size,
shape and material. In R.G. Bushnel & J.F. Fish (Eds.), Animal sonar
systems (pp. 71-95). New York: Plenum Press.
Nagel, T. (1974). What is it like to be a bat? Philosophical Review. 83.435
450.
Nagel, T. (1986). The view from nowhere. New York: Oxford University Press.

223
Nauta, W.J.H. & Feirtag, M. (1986). Fundamental neuroanatomy. New York:
W.H. Freeman and Company.
Neuweiler, G. (1990). Auditory adaptations for prey capture in echolocating
bats. Physiological Reviews. 70. 615-641.
Nishida, T. (1987). Local traditions and cultural transmission. In B.B. Smuts,
D.L. Cheney, R.M. Seyfarth, R.W. Wrangham & T.T. Struhsaker (Eds.),
Primate Societies (pp 462-474). Chicago: University of Chicago Press.
Norris, K.S. (1968). The evolution of acoustic mechanisms in odontocete
cetaceans. In E.T. Drake (Ed.), Evolution and environment (pp. 317-336).
New Haven: Yale University Press.
Norris, K.S. (1994). Comparative view of cetacean social ecology, culture and
evolution. In K.S. Norris, B. Wuersig, R.S. Wells & M. Wuersig (Eds.), The
Hawaiian spinner dolphin (pp. 301-344). Berkeley, CA: University of
California Press.
Norris, K.S. & Dohl, T.P. (1980). The Structure and Function of Cetacean
Schools. In L. Herman, (Ed.) Cetacean behaviour: mechanisms and
functions. New York: John WHey & Sons
Norris, K.S. & Johnson, C.M. (1994). Schools and schooling. In K.S. Norris,
B. Wuersig, R.S. Wells & M. Wuersig (Eds.), The Hawaiian spinner dolphin
(pp. 232-242). Berkeley, CA: University of California Press.
Norris, K.S. & Pryor, K. (1991). Some thoughts on grandmothers. In K. Pryor
& K. Norris (Eds.), Dolphin societies: Discoveries and puzzles (pp. 287
289). Berkeley, CA: University of California Press.

224
Norris, K.S. & Schilt, C.R. (1988). Co-operative societies in three-dimensional
space: On the origins of aggregations, flocks and schools, with special
reference to dolphins and fish. Ethology and Sociobiology, 9, 149-179.
. Norris, K.S., Wuersig, B., Wells, R.S. & Wuersig, M. (1994). The Hawaiian
spinner dolphin~ Berkeley, University of California Press.
Novacek, M.J. (1985). Comparative morphology of the bat auditory region. In
H.R. Duncker & G. Fleischer (Eds.), Functional morphology in vertebrates
(pp. 149-151). Stuttgart: Gustav Fischer Verlag.
Ossenkopp, K.P., Innis, N.K., Prato, F.S. & Sestini, E. (1986). Behavioural
effects of exposure to nuclear magnetic resonance imaging: I. Open-field
behaviour and passive avoidance learning in rats. Magnetic Resonance
Imaging , 4(4), 275-280.
Pack, A.A. & Herman, L.M. (1995). Sensory integration in the bottle-nosed
dolphin- immediate recognition of complex shapes across the senses of
echolocation and vision. Journal of the Acoustical Society of America,
98(2),722-733.
Parker, S.T. (1985). Higher intelligence as adaptation for social and
technological strategies in early Homo sapiens. In G. Butterworth, J.
Rutkowska & M. Scaife (Eds.), Evolution and developmental psychology
(pp. 83-101). Brighton: Harvester Press.
Parrish, J.K. (1992). Do predators "shape" fish schools: Interactions between
predators and their schooling prey. Netherlands Journal of Zoology, 42,
358-370.
Partridge, L. & Green, P. (1985). Intraspecific feeding specializations and
population dynamics. In R.M. Sibly & R.H. Smith (Eds.), Behavioural
ecology (pp. 207-226). Oxford: Blackwell.

225
Passingham, R. (1982). The Human Primate. San Francisco: Freeman.
Payne, K., Tyack, P. & Payne, R. (1983). Progressive changes in the songs
of Humpback whales (Megaptera novaec3ngliae): A detailed analysis of two
seasons in Hawaii. In R. Payne (Ed.), Communication and Behavior of
Whales (pp.9-57), Boulder, CO: Westview Press.
Pearce, A.F. (1973). Water properties and currents off Richard's Bay. South
African National Oceanographic Symposium. Cape Town, August 1973.
Peddemors, V.M. (1993). Bottlenose dolphin Tursiops truncatus research in
Natal, South Africa: A review. Lammergeyer. 42. 24-34.
Peddemors, V.M. (1995). The aetiology of bottlenose dolphin capture in shark'
nets off Natal. South Africa. Unpublished PhD thesis, University of Port
Elizabeth, South Africa.
Peddemors, V.M. (1997). Family Delphinidae. In G. Mills & L. Hes (Eds.),
The Complete Book of Southern African Mammals (pp. 304-315). Cape
Town: Struik.
Peddemors, V.M. & Thompson, G. (1994) Beaching'behaviour during shallow
water feeding by humpback dolphins, Sousa plumbea. Aquatic Mammals.
20(2), 65-67.
Peddemors, V.M., Cockroft, V.G., Haestier, R.H. & Von Blerk, P. (submitted).
Seasonal distribution and abundance of bottlenose dolphins off Natal,
South Africa: Evidence for both migratory and resident stocks. Marine
Mammal Science.
Penner, R.H. (1988). Attention and detection in dolphin echolocation. In P.E.
Nachtigall & P.W.B. Maore (Eds.), Animal sonar: Processes and
performance (pp. 707-713). New York: Plenum Press.

226
Pereira, M.E. & Altmann, J. (1985). Development of social behaviour in free
living nonhuman primates. In E.S. Watts (Ed.), Non-human primate models
for human growth and development. New York: Alan Liss.
Perrin, W.F. & Reilly, S.B. (1984). Reproductive parameters of dolphins and
small whales of the family Delphinidae. Report. International Whaling
Commission. (Special Issue 6),97-133.
Philips Medical Systems. (1984). Principles of MR Imaging. the Netherlands:
Philips.
Pilleri, G. (1984). Epimeletic behaviour in Cetacea: Intelligent or instinctive?
Investigations on Cetacea. Berne, 16. 30-48. _
Pilleri, G. & Gihr, M. (1971). The central nervous system of the mysticete and
odontocete whales. Investigations on Cetacea, Berne, 2, 89-128.
Pinker, S. (1994). The language instinct: The new science of language and
mind. London: Penguin.
Pirlot, P., Jiao, S.S. & Xie, J.Q. (1985). The brain of the giant panda
(Ailuropoda). In H.R. Duncker & G. Fleischer (Eds.), Functional
morphology in vertebrates (pp. 571-574). Stuttgart: Gustav Fischer Verlag.
Pirlot, P. & Stephan, H. (1970). Encephalization in Chiroptera. Canadian
Journal of Zoology. 48. 433-444.
Pond, C.M. (1977). The significarice of lactation in the evolution of mammals.
Evolution. 3t 177-199.
Poole, T.B. (1985). Social behaviour in mammals. Glasgow: Blackie and Son.

227
Popper, A.N. (1980). Sound emission and detection by delphinids. In L.M.
Herman (Ed.), Cetacean behavior: Mechanisms and functions (pp.1-52).
New York: WHey and Sons.
. Povinelli, D.J. (1993). Reconstructing the evolution of mind. American
Psychologist 48, 493-509.
Premack, D. & Woodruff, G. (1978). Does the chimpanzee have a theory of
mind' Behavioural and Brain Sciences. ~ 515-526.
Pryor, K. & Norris, K.S. (Eds.). (1991). Dolphin societies: Discoveries and
puzzles. Berkeley, CA: University of California Press.
Pryor, K. & Schallenberger, I.K. (1991). Social structure in spotted dolphins
(Stenella attenuata) in the tuna purse seine fishery in the eastern tropical
pacific. In K. Pryor & K. Norris (Eds.), Dolphin societies: Discoveries and
puzzles (pp. 161-196). Berkeley, CA: University of California Press.
Purves, P.E. & PiHeri, G.E. (1983). Echolocation in whales and dolphins. New
York: Academic Press.
Radinsky, L. (1982). Some cautionary notes on making. inferences about
relative brain size. In E. Armstrong & D. Falk, (Eds.), Primate brain
evolution: methods and concepts. New York: Plenum Press.
Rakic, P., Bourgeois, J-P., Eckenhoff, M.F., Zecevic, N. & Goldman-Rakic,
P.S. (1986). Concurrent overproduction of synapses in diverse regions of
primate cerebral cortex. Science. 232. 153-7.
Ralston, J.V. & Herman, L.M. (1989). Dolphin auditory perception. In R.J.
Dooling & S.H. Hulse (Eds.), The comparative psychology of audition:
Perceiving complex sounds (pp. 295-328). Hillsdale, NJ: Lawrence
Erlbaum.

228
Reiss', D. & Mccowan, B. (1993). Spontaneous vocal mimicry and production
by bottle-nosed dolphins (Tursiops truncatus)- evidence for vocal learning.
Journal of Comparative Psychology. 10"(3),301-312.
. Richards, D.G. (1986). Dolphin vocal mimicry and vocal object labeling. In
R.J. Schusterman, J.A. Thomas & F.G. Wood, (Eds.), Dolphin cognition
and behaviour: A comparative approach (pp. 273-288). Hillsdale, NJ:
Lawrence Erlbaum Associates.
Richards, D.G., Wolz, J.P. & Herman, L.M. (1984). Vocal mimicry of
computer-generated sounds and vocallabeling of objects by a bottlenosed
dolphin, Tursiops truncatus. Journal of Comparative Psychology. 98. 10
28.
Ridgway, S.H. (1972). Homeostasis in the aquatic environment. In S.H.
Ridgway (Ed.), Mammals of the sea (pp. 590-747). Springfield, IL:
Thomas.
Ridgway, S.H. (1986a). Dolphin brain size. In M.M. Bryden & R. Harrison
(Eds.), Research on Dolphins (pp. 59-70). New York: Oxford University
Press.
Ridgway, S.H. (1986b). Physiological observations on dolphin brains. In R.J.
Schusterman, J.A. Thomas & F.G. Wood (Eds.), Dolphin Cognition and
Behaviour: A comparative approach (pp. 31-59). Hillsdale, NJ: Lawrence
Erlbaum Associates.
Ridgway, S.H. (1990). The central nervous system of the bottlenose dolphin.
In S. Leatherwood & R.R. Reeves (Eds.), The Bottlenose Dolphin (pp. 69
97). San Diego: Academic Press.
Ridgway, S.H. & Brownson, R.H. (1979). Brain size and symmetry in three
dolphin genera. Anatomical Record. 193. 664.

229
Ridgway, S.H. & Brownson, R.H. (1982). Relative brain sizes and cortical
surface areas of odontocetes. In A. Myllymaki & E. Pulliainen (Eds.)
Abstracts of Papers: Third International Theriological Congress (p 207).
Helsinki.
Ridgway, S.H. & Brownson, R.H. (1984). Relative brain sizes and cortical
surface areas of odontocetes. Acta Zoologica Fennica. 172. 149-152.
Ridgway, S.H., Flanigan, N.J. & McCormick, J,G. (1966). Brain-spinal cord
ratios in porpoises: Possible correlations with intelligence and ecology.
Psychonomic Science. 6. 491-492.
Rizzo, M., Nawrot, M., Blake, R. & Damasio, A. (1992). A human visual
disorder resembling area V4 dysfunction in the monkey. Neurology. 42(6),
1175-1180.
Roehrs, M. Cephalization, neocorticalization and the effects of domestication
on brains of mammals. In H.R. Duncker & G. Fleischer (Eds.), Functional
morphology in vertebrates (pp. 545-547). Stuttgart: Gustav Fischer Verlag.
Roitblat, H.L. (1987). Introduction to comparative cognition. New York:
Freeman.
Ross, G.J.B. (1984). The smaller cetaceans of the south east coast of
southern Africa. Annals. Cape Provincial Museums. Natural History. 15(2),
173-410.
Ross, G.J.B., Cockcroft, V.G. & Butterworth, D.S. (1987). Offshore
distribution of bottlenosed dolphins in Natal coastal waters and Algoa Bay,
eastern Cape. South African Journal of Zoology. 22(1), 50-56.

230
Rothausen, K. The early evolution of Cetacea. In H.R. Duncker & G.
Fleischer (Eds.), Functional morphology in vertebrates (pp. 143-147).
Stuttgart: Gustav Fischer Verlag.
. Rozin, P. (1977). The significance of learning mechanisms in food selection:
Some biology, psychology and sociology of science. In L.M. Barker, M.R.
Best &M. Domjan (Eds.), Learning mechanisms in food selection (pp. 557
581). Baylor University Press.
Ruff, C.B. (1989). New approaches to structural evolution of limb bones in
primates. Folia Primatologica. 53. 142-59.
Ryle, G. (1990). The concept of mind. London: Penguin.
Saayman, G.S. & Tayler, C.K. (1973). Social organisation of inshore dolphins
(Tursiops aduncus and Sousa) in the Indian Ocean. Journal of
Mammalogy. 54(4), 993-996).
Saayman, G.S. & Tayler, C.K. (1979). The socioecology of humpback
dolphins (Sousa sp.) In H.E. Winn & B.L. Olla (Eds.) Behaviour of Marine
Animals. 3, 165-226.
Saban, R., Cabanis, E.A., Iba- Zizen, M.T., Rinjard, J. Villiers, P.A. Meuge,
C., Strazielle, L. & Dupuis, R. (1985). Tomodensitometrie cephalique in
vivo du Chimpanzee (Pan trogolodytes, Catarhinii, Anthropomorpha) , dans
le plan neuro-oculaire (P.N.D). Comptes Rendus de I Academie des
Sciences- Serie Ill, Sciences de la Vie, 300(8), 341-346.
Sawaguchi, T. (1990). Relative brain size, stratification and social structure in
anthropoids. Primates. 31.257-272.
Sawaguchi, T. (1992). The size of the eocortex in relation to ecology and
social structure in monkeys and apes. .Folia Primatologica, 58(3), 131-145.

231
Sawaguchi, T. & Kudo, H. (1990). Neocortical development and social
structure in primates. Primates. 31. 283-290.
Schaller, G.B., Jinchu, H., Wenshi, P. & Jin, Z. (1985). The giant pandas of
Wolong. Chicago: University of Chicago Press.
Schenck, J.F. & Leue, W.M. (1991). Instrumentation: Magnets, coils and
hardware. In S~W. Atlas (Ed.), Magnetic resonance imaging of the brain
and spine (pp. 1-22). New York: Raven Press.
Schulz, K.W., Cato, D.H., Corkeron, P.J. & Bryden, M.M. (1995). Low
frequency narrow-band sounds produced by bottle-nosed dolphins. Marine
Mammal Science. 11 (4), 503-509.
Schumann, E.H. (1988a). Physical oceanography off Natal. In E.H.
Schumann (Ed.), Lecture notes on coastal and estuarine studies (pp.101
130). Germany: Springer Verlag.
Schumann, E.H. (1988b). Coastal ocean studies off Natal, 'South Africa. In
E.H. Schumann (Ed.), Lecture notes on coastal and estuarine studies
(pp.1-10). Germany: Springer Verlag.
Sebes, J.I., Langston, J.W., Avant, M.L. 8~ Rothschild, B. (1991). MR imaging
of growth recovery lines in fossil vertebrae. American Journal of
Roentgenology. 157(2), 415-416.
Sekiguchi, K, Klages, N.T.W. & Best, P.B. (1992). Comparative analysis of
the diets of smaller odontocete cetaceans along the coast of southern
Africa. In A.I.L. Payne, K.H. Brink, K.H., Mann & R. Hilborn, (Eds.),
Benguela Trophic Functioning. South African Journal of Marine Science.
.1£. 843-861.

232
Sergent, J. (1994). Brain-imaging studies of cognitive functions. Trends in
Neurosciences, 17(6),221-227.
Sigal, R. (1988). Magnetic resonance imaging: basis for interpretation. Berlin:
Springer.
Silber, G.K. & Fertl, D. (1995). Intentional beaching by bottlenose dolphins
(Tursiops truncatus) in the Colorado River Delta, Mexico. Aquatic
Mammals, 21(3),183-186.
Shane, S.H., Wells, R.S. & Wuersig, B. (1986). Ecology, behavior and social
organisation of the bottlenose dolphin: ;3 review. Marine Mammal Science,
~(1), 34-63.
Sink, K. (1995). Towards an understanding of foraging behaviour of
bottlenose dolphins (Tursiops truncatus) and humpback dolphins (Sousa
chinensis) in KwaZulu-Natal. South Africa. Unpublished BSc. (Hons.)
dissertation. University of Natal, Durban, South Africa.
Smith, J.D., Schull, J., Strote, J., Mcgee, K., Egnor, R. & Erb, L. (1995). The
uncertain response in the bottle-nosed dolphin (Tursiops truncatus).
Journal of Experimental Psychology: General. 124(4), 391-408.
Smith, P.K. (1996). Language and the evolution of mind-reading. In P.
Caruthers and P.K. Smith, (Eds.), Theories of theories of mind.
Cambridge: Cambridge University Press.
Smith, R.L. (1990). Ecology and field biology. (4th ed.). New York: Harper
Collins.
Smolker, R.A., Richards, A.F., Connor, R.C. & Pepper, J.W. (1992). Sex
differences in patterns of association among Indian Ocean bottlenose
dolphins. Behaviour, 123, 38-69.

233
Solomon, A. & Henneberg, M. (1992). Volumes of human brain cortex and of
subcortical structures and their variability. Proceedings of the Anatomical
Society of Southern Africa. 5.
Spoor, F., Wood, B. & Zonneveld, F. (1994). Implications of early hominid
labyrinthine morphology for evolution of bipedal locomotion. Nature.
369(6482), 645-648.
Spoor, F. & Zonneveld, F. (1995). Morphometry of the primate bony labyrinth:
a new method based on high resolution computed tomography. Journal of
Anatomy. 186(2), 271-286.
Stahl, W.R.G. (1965). Organ weights in primates and other mammals.
Science. 150, 1039-1041.
Steinberg, E.P., Anderson, F. & Steinwachs, D.M. (1987). Changes in CT
utilisation between 1981 and 1984: implications for Medicare payment for
MR imaging under the prospective payment system. Radiology, 165(1),
279-281.
Stenuit, R. (1971). The dolphin: Cousin to man. Harmondsworth: Penguin.
Stephan, H. (1985). Relative brain size in Soricidae and Vespertilionidae. In
H.R. Duncker & G. Fleischer (Eds.), Functional morphology in vertebrates
(pp. 533-536). Stuttgart: Gustav Fischer Verlag.
Stephan, H., Bauchot, R. &Andy, O.J. (1970). Data on the size of the brain
and of various brain parts in insectivor'es and primates. In C.R. Noback &
W. Montagna (Eds.), The Primate Brain. New York: Appleton-Century
Crofts.

234
Stephan, H., Frahm, H. & Baron, G. (1981). New and revised data on
volumes of brain structures in insectivores and primates. Folia
Primatologica. 35. 1-29.
Stickle, R.L. &Hathcock, J.T. (1993). Interpretation of computed tomographic
images. Veterinary Clinics of North America- Small Animal Practice. 23(2),
417-435.
Struhsaker, T.T. (1967). Auditory communication among vervet monkeys
(Cercopithecus aethiops). In S.A. Altmann, (Ed.), Social communication
among primates (pp. 281-324). Chicago: University of Chicago Press.
Struhsaker, T.T. (1969). Correlates of ecology and social organisation among
African cercopithecines. Folia Primatologica. 11, 80-118.
Stuermer, W. (1985). Radiography- a successful branch of interdisciplinary
paleontology and zoology. In H.R. Duncker & G. Fleischer (Eds.),
Functional morphology in vertebrate~ (pp. 173-176). Stuttgart: Gustav
Fischer Verlag.
Strum, S.C., Forst~r, D. & Hutchins, E. (1997). Why Machiavellian intelligence
may not be Machiavellian. In A. Whiten & R.W. Byrne (Eds.), Machiavellian
intelligence 11: extensions and evaluations (pp. 50-85). Cambridge:
Cambridge University Press.
Supin, A.Y., Mukhametov, L.M., Ladygina, T.F., Popov, V.V., Mass, A.M. &
Poliakova, E.G. (1978). Electrophysiological study of the dolphin brain.
Moscow: Nauka.
Sylvestre, J-P. (1995). Dolphins and porpoises: a worldwide guide. New York:
Stirling Publishing Co. Inc.

235
Tayler, C.K. & Saayman, G.S. (1972). The social organisation and behaviour
of dolphins (Tursiops aduncus) and baboons (Papio ursinus): some
comparisons and assessments. Annals. Cape Provincial Museums.
Natural History, 9, 11-49.
Tomasello, M. & Call, J. (1997). Primate cognition. New York: Oxford
University Press.
Tomasello, M., Call, J. &Gluckman, A. (1997). Comprehension of novel
communicative signs by apes and human children. Child Development. 68,
1067-1080.
Trivers, R.L. (1971). The evolution of reciprocal altruism. Quarterly Review of
Biology, 46,35-57.
Trivers, R.L. (1974). Parent-offspring conflict. American Zoologist. 14, 249
264.
Tschudin, A. J-P.C. (1995). An assessment of the non-invasive techniques
available for cetacean brain research. Unpublished BSocSc. (Hons)
dissertation. University of Natal, Durban, South Africa.
Tschudin, A.J-P.C. (1998). Is human brain evolution really that distinct? A
comparative analysis of relative brain size and sociality in dolphins and
primates. In L. Schlebusch (Ed.). South Africa beyond transition:
Proceedings of the 3rd Annual Congress of the Psychological Society of
South Africa (pp.336-340). Pretoria: The Psychological Society of South
Africa.
Tschudin, A.J-P.C., Basson, C.J. & Peddemors, V.M. (1999). Can
comparative analysis and ecological psychology tell us anything about the
evolution of mind and consciousness? In C. Taddei-Ferretti & C. Musio

236
(Eds.), Neuronal bases and psychological aspects of consciousness (in
~ press). Singapore: World Scientific.
Tschudin, A.J-P.C., Oaji, K., Henzi, S.P., Peddemors, V.M. & Royston, O.
(1996). Relative brain size and social structure in dolphins. Symposium of
the Zoological Society of Southern Africa, Pretoria, South Africa.
Tschudin, A.J-P.C., Hurribunce, R. & Peddemors, V.M. (1998). An
investigation of dolphin neocortex usingl computed tomography and
magnetic resonance imaging. South African Journal of Radiology (in press)
Tyack, P.L. (1981). Interactions between singing Hawaiian humpback hales
and conspecifics nearby. Behavioral Ecology and Sociobiology. 8. 105
116.
Tyack, P.L. (1986). Whistle repertoires of two bottlenose dolphins, Tursiops
truncatus: Mimicry of signature whistles? Behavioral Ecology and
Sociobiology. 18.251-257.
Van Oer Elst, R.P. (1979). A proliferation of small sharks in the shore-based
Natal sport fishery. Environmental Biology of Fishes. 4. 349-362.
Van Oer Elst, R.P. (1988). Shelf ichthyofauna of Natal. In E.H. Schumann
(Ed.), Lecture notes on coastal and estuarine studies. Germany: Springer .-
Verlag.
Van Oer Elst, R.P. &Fennessy, S:T. (1990). An investigation into the discard
catch of the Tugela Bank prawn trawlers. Unpublished Research Report,
66, Oceanographic Research Institute, Durban.
Van Schaik, C.P. (1983). Why are diurnal primates living in groups?
Behaviour, 87, 120-144.

237
Vannier, M.W. & Conroy, .C. (1989). Imaging workstations for computer
aided primatology: promises and pitfalls. Folia Primatologica. 53.7-21.
Vanwaerebeek, K. (1993). Geographic variation and sexual dimorphism in
the skull of the dusky dolphin, Lagenorhynchus obscurus. Fishery Bulletin.
~(4), 754-774.
Velmans, M. (1991). Is human information processing conscious?
Behavioural and Brain Sciences. 14(4),651-669.
Velmans, M. (1999a). Understanding consciousness: Beyond dualism and
reductionism. In C. Taddei-Ferretti & C. Musio (Eds.), Neuronal bases and
psychological aspects of consciousness (in· press). Singapore: World
Scientific.
Velmans, M. (1999b). Perception, attention and consciousness. In C. Taddei
Ferretti & C. Musio (Eds.), Neuronal bases and psychological aspects of
consciousness (in press). Singapore: World Scientific.
von Bonin, G. (1937). Brain-weight and body-weight of mammals. Journal of
General Psychology. 16. 379-389.
Vygotsky, L.S. (1978): Mind in society: The development of higher mental
processes. Cambridge, MA: Harvard University Press.
Wailer, G.N.H. (1983). Is the blind river dolphin signtless? Aquatic Mammals.
1Q(3),106-109.
Warden, C.J. (1951). Animal Intelligence. Scientific American. 185.64.
Watson, C., Andermann, F., Gloor, P. &Jones- Gotman, M. (1992). Anatomic
basis of amygdaloid and hippocampal volume measurement by magnetic
resonance imaging. Neurology. (1545) 42(9), 1743-1750.

238
Watson, L. (1988). Whales of the world. London: Hutchinson.
Wehrli, F.W. (1991). The basis of MR contrast. In S.W. Atlas (Ed.), Magnetic
resonance imaging of the brain and spine (pp. 23-38). New York: Raven
Press.
Wells, R.S. (1991). The role of long-term study in understanding the social
structure of a bottlenose dolphin community. In K. Pryor & K. Norris (Eds.),
Dolphin societies: Discoveries and puzzles (pp. 199-225). Berkeley, CA:
University of California Press.
Wells, R.S., Irvine, A.B. & Scott, M.D. (1980). The Social Ecology of Inshore
Odontocetes. In L.M. Herman (Ed.), Cetacean behaviour: Mechanisms
and functions. New York: John WHey & Sons.
Wells, R.S., Scott, M.D. & Irvine, A.B. (1987). The social structure of free
ranging bottlenose dolphins. In H.H. Genoways (Ed.), Current
Mammalogy, Volume 1 (pp. 247-305). New York: Plenum Press.
West, R.M. (1980). Middle Eocene large mammal assemblage with Tethyan
affinities, Gan~a Kas region, Pakistan. Journal of Palaeontology. 54(3),
508-533.
Whitehead, H. (1997). Analysing animal social structure. Animal Behaviour.
~ 1053-1067..
Whiten, A. (1993). Social complexity: The roles of primates' grooming and
people's talking. Behavioural and Brain Sciences. 16(4),719.
Whiten, A. & Byrne, R.W. (1988). Taking Machiavellian Intelligence Apart:
editorial. In R. Byrne & A. Whiten (Eds.) Machiavellian Intelligence: Social
Expertise and the Evolution of Inte"lIect in Monkeys. Apes and Humans.
Oxford: Oxford University Press.

239
Williams, .C. (1992). Natural selection: Domains. levels and challenges. New
York: Oxford University Press.
Wilson, E.O. (1975). Sociobiology: The new synthesis. Cambridge, MA:
Belknap Press.
Wimmer, H. & Perner, J. (1983). Beliefs about beliefs: Representation and
constraining function of wrong beliefs in young children's understanding of
deception. Cognition. 13, 103-128.
Wolf, R.F., lam, K.H., Mooyaart, E.l., Bleichrodt, R.P., Nieuwenhuis, P. &
Schakenraad, J.M. (1992). Magnetic resonance imaging using a clinical
whole body system: an introduction to a useful technique in small animal
experiments. Laboratory Animals, 26(3), 222-227.
Wood, F.G. (1986). Social behavior and foraging strategies of dolphins. In
R.J. Schusterman, J.A. Thomas & F.G. Wood, (Eds.), Dolphin cognition
and behaviour: A comparative approach (pp. 331-333). Hillsdale, NJ:
Lawrence Erlbaum Associates.
Wood, F.G. & Evans, W.E. (1980). Adaptiveness and ecology of echolocation
in toothed whales. In R.G. Busnel &J.F. Fish (Eds.), Animal sonar systems
(pp. 381-426). New York: Plenum Press.
Worthy, G.A.J. & Hickie, J.P. (1986). Relative Brain Size in Marine Mammals.
The American Naturalist 128, 445-459.,
Wortman, J.A. (1986). Principles of x-ray computed tomography and
magnetic resonance imaging. Seminars in Veterinary Medicine & Surgery
(Small Animal). 1(2), 176-184.
Wrangham, R.W. (1979). On the evolution of ape social systems. Social
Science Information, 18, 335-368.

240
Wrangham, R.W. (1980). An ecological 1110del of female kin-bonded groups.
Behaviour, 75, 262-300.
Wuersig, B. (1986). Delphinid Foraging Strategies. In R.J. Schusterman, J.A.
Thomas & F.G. Wood, (Eds.), Dolphin cognition and behaviour: A
comparative approach (pp. 347-359). Hillsdale, NJ: Lawrence Erlbaum
Associates.
Wuersig, B. &Wuersig, M. (1980). Behavior and ecology of dusky porpoises,
Lagenorhynchus obscurus, in the south Atlantic. Fishery Bulletin, 77, 871
890.
Wynn, T. (1988). Tools and the evolution of human intelligence. In R.W.
Byrne and A. Whiten (Eds.), Machiavellian Intelligence: Social Expertise
and the Evolution of Intellect in Monkeys, Apes and Humans. (pp. 271
284). Oxford: Oxford University Press.
Xitco, M.J. & Roitblat, H.L. (1996). Object recognition through eavesdropping:
passive echolocation in bottle-nosed dolphins. Animal Learning and
Behavior, 24(4), 355-365.
Young, 0.0. & Cockroft, V.G. (1994). Diet of common dolphins (De/phinus
de/phis) off the south-east coast of southern Africa: Opportunism or
specialisation? Journal of Zoology, London, 234, 41-53.

APPENDIX
Table of selected abbreviations
AbbreviationASSBVCBVC.O.v.CRCTCVCVAC/MdJ.EOfFOB
FDMiIVJRIKZNmMaMRIn.s.NSBNVPPEprPVRBSsSVSWITBVWHYa
Meaningabsolute brain sizebrainstem volumecerebellar volumeco-efficient of variationneocortex ratiocomputed tomographycranial volume .cranial volume analysisCTand MRIdegn~es of freedomencephalisation quotientfemalefrozen, defrosted, scanned using CTand MRIfrozen~ defrosted, scanned using MRIsexually immatureinfra-tentorial volumeJackpersad, Rooknooden, Inc.Kwazulu- Natalmalemillion years agomagnetic resonance imagingnot significant (at p < .05)Natal Sharks Boardneocortex volumesignificancePort Elizabethpresumed sexually maturepostE~rior fossa volumerelative brain size
- sexually maturesupra-tentorial volumeShannon-~enerlndex
total brain volumeWentworth Hospitalyears ago

Bottlenose dolphins socialising off the Moray Firth, Scotland.
Copyright © 2022 FDOKUMEN