REGIONAL INTERESTS DEVELOPMENT APPROVAL ... - NET
345
SLR Ref: 620.30686.00600-R01 Version No: -v4.0 L\343884466.1 REGIONAL INTERESTS DEVELOPMENT APPROVAL SUPPORTING DOCUMENT Ensham Life of Mine Extension Zone 2 and Zone 3 Prepared for: Bligh Coal Limited, Idemitsu Australia and Bowen Investment (Australia) Pty Ltd Level 9/175 Eagle Street Brisbane QLD 4000
-
Upload
khangminh22 -
Category
Documents
-
view
1 -
download
0
Transcript of REGIONAL INTERESTS DEVELOPMENT APPROVAL ... - NET
SLR Ref: 620.30686.00600-R01Version No: -v4.0L\343884466.1
REGIONAL INTERESTS DEVELOPMENTAPPROVAL SUPPORTING DOCUMENT
Ensham Life of Mine ExtensionZone 2 and Zone 3
Prepared for:
Bligh Coal Limited, Idemitsu Australia and Bowen Investment (Australia) Pty LtdLevel 9/175 Eagle Street
BrisbaneQLD 4000
Bligh Coal Limited, Idemitsu Australia and Bowen Investment (Australia)Pty LtdREGIONAL INTERESTS DEVELOPMENT APPROVAL SUPPORTINGDOCUMENTEnsham Life of Mine ExtensionZone 2 and Zone 3
SLR Ref No: RIDA Application 620.30686.00600-RevI.docxMarch 2022
Page 2L\343884466.1
PREPARED BY
SLR Consulting Australia Pty LtdABN 29 001 584 612Level 16, 175 Eagle StreetBrisbane QLD 4000 Australia (PO Box 26 Spring Hill QLD 4004)T: +61 7 3858 4800E: [email protected] www.slrconsulting.com
BASIS OF REPORT
This report has been prepared by SLR Consulting Australia Pty Ltd (SLR) with all reasonableskill, care and diligence, and taking account of the timescale and resources allocated to itby agreement with Bligh Coal Limited, Idemitsu Australia and Bowen Investment(Australia) Pty Ltd (the Client). Information reported herein is based on the interpretationof data collected, which has been accepted in good faith as being accurate and valid.
This report is for the exclusive use of the Client. No warranties or guarantees are expressedor should be inferred by any third parties. This report may not be relied upon by otherparties without written consent from SLR.
SLR disclaims any responsibility to the Client and others in respect of any matters outsidethe agreed scope of the work.
DOCUMENT CONTROL
Reference Date Prepared Checked Authorised
620.30686.00600-R01-RevI 15 March 2022 D Clarke K Robertson A Koeman
Bligh Coal Limited, Idemitsu Australia and Bowen Investment (Australia)Pty LtdREGIONAL INTERESTS DEVELOPMENT APPROVAL SUPPORTINGDOCUMENTEnsham Life of Mine ExtensionZone 2 and Zone 3
SLR Ref No: RIDA Application 620.30686.00600-RevI.docxMarch 2022
CONTENTS
Page 3L\343884466.1
1 INTRODUCTION ........................................................................................................... 6
1.1 Project Description....................................................................................................... 8
1.1.1 Mining Techniques................................................................................................................................... 9
1.1.2 Flare Construction ................................................................................................................................. 10
1.1.3 Flare Exclusion Areas ............................................................................................................................. 10
1.2 Purpose ..................................................................................................................... 13
2 REGULATORY CONSIDERATIONS ............................................................................... 16
2.1 Regional Planning Interests Act 2014.......................................................................... 16
2.2 Regional Planning Interests Regulation 2014 .............................................................. 16
2.2.1 Priority Agricultural Area (RPI Regulation, Schedule 2, Part 2) ................................................................. 16
2.2.2 Strategic Cropping Area (RPI Regulation, Schedule 2, Part 4) ................................................................... 17
2.3 Central Queensland Regional Plan .............................................................................. 18
2.3.1 Regional Outcomes and policies ............................................................................................................. 18
2.4 Public Notification ...................................................................................................... 19
2.4.1 Avoiding duplication of notification ........................................................................................................ 19
2.4.2 Previous public notification .................................................................................................................... 20
3 ASSESSMENT AGAINST RPI GUIDELINES .................................................................... 24
4 ASSESSMENT AGAINST RPI REGULATION REQUIRED OUTCOMES ............................. 40
4.1 Priority Agricultural Area (RPI Regulation, Schedule 2, Part 2) .................................... 40
4.2 Strategic Cropping Area (RPI Regulation, Schedule 2, Part 4) ...................................... 47
5 EXISTING ENVIRONMENT .......................................................................................... 49
5.1 Land Use within the Project ....................................................................................... 49
5.2 Property ..................................................................................................................... 49
5.3 Land Resources Assessment ....................................................................................... 495.3.1 Dispersive Soils ...................................................................................................................................... 49
5.3.2 Land Suitability and Agricultural Land Classes ......................................................................................... 49
6 POTENTIAL IMPACTS ................................................................................................. 52
6.1 Flare Exclusion Zones ................................................................................................. 52
6.1.1 Rehabilitation ........................................................................................................................................ 52
6.2 Subsidence ................................................................................................................. 52
6.2.1 Impacts ................................................................................................................................................. 52
6.2.2 Natural Variation ................................................................................................................................... 54
6.3 Surface Impacts to Areas of Regional Interest ............................................................ 54

Bligh Coal Limited, Idemitsu Australia and Bowen Investment (Australia)Pty LtdREGIONAL INTERESTS DEVELOPMENT APPROVAL SUPPORTINGDOCUMENTEnsham Life of Mine ExtensionZone 2 and Zone 3
SLR Ref No: RIDA Application 620.30686.00600-RevI.docxMarch 2022
CONTENTS
Page 4L\343884466.1
7 CONCLUSIONS ........................................................................................................... 55
8 REFERENCES .............................................................................................................. 56
Bligh Coal Limited, Idemitsu Australia and Bowen Investment (Australia)Pty LtdREGIONAL INTERESTS DEVELOPMENT APPROVAL SUPPORTINGDOCUMENTEnsham Life of Mine ExtensionZone 2 and Zone 3
SLR Ref No: RIDA Application 620.30686.00600-RevI.docxMarch 2022
CONTENTS
Page 5L\343884466.1
DOCUMENT REFERENCES
TABLES
Table 1 Tenure Ownership ..................................................................................................... 8Table 2 Avoiding Duplication of Public Notification .............................................................. 20Table 3 RIDA RPI Guideline Checklist .................................................................................... 25Table 4 Prescribed Solutions for RO1 – PAA ......................................................................... 41Table 5 Prescribed Solutions for RO2 – SCA .......................................................................... 47Table 6 Areas of ARI for the Project...................................................................................... 54
FIGURES
Figure 1 Project Location ......................................................................................................... 7Figure 2 Bord and Pillar Mining Conceptual Overview ............................................................. 9Figure 3 Flares and flare exclusion areas ............................................................................... 11Figure 4 Mine plan of underground workings ....................................................................... 12Figure 5 Priority Agricultural Area ......................................................................................... 14Figure 6 Strategic Cropping Area via Strategic Cropping Land Trigger Map ............................ 15Figure 7 Mapped PALU Area – 2003 Satellite Imagery ........................................................... 43Figure 8 Mapped PALU Area – 2011 Satellite Imagery ........................................................... 44Figure 9 Mapped PALU Area – 2017 Satellite Imagery .......................................................... 45Figure 10 Mapped PALU Area – 2019 Satellite Imagery .......................................................... 46Figure 11 Land Use ................................................................................................................. 50Figure 12 Underlying Property Ownership .............................................................................. 51Figure 13 Pre-Mining Panel (Station 502_3) Vertical Surface Movement ................................. 53Figure 14 Underground Mining Panel (Station 502_1): Measured Subsidence Levels ............... 53
APPENDICES
Appendix A Project DescriptionAppendix B EIS Submissions RegisterAppendix C Soil and Land Resource AssessmentAppendix D Subsidence ReportAppendix E Subsidence Management Plan
Bligh Coal Limited, Idemitsu Australia and Bowen Investment (Australia)Pty LtdREGIONAL INTERESTS DEVELOPMENT APPROVAL SUPPORTINGDOCUMENTEnsham Life of Mine ExtensionZone 2 and Zone 3
SLR Ref No: RIDA Application 620.30686.00600-RevI.docxMarch 2022
Page 6L\343884466.1
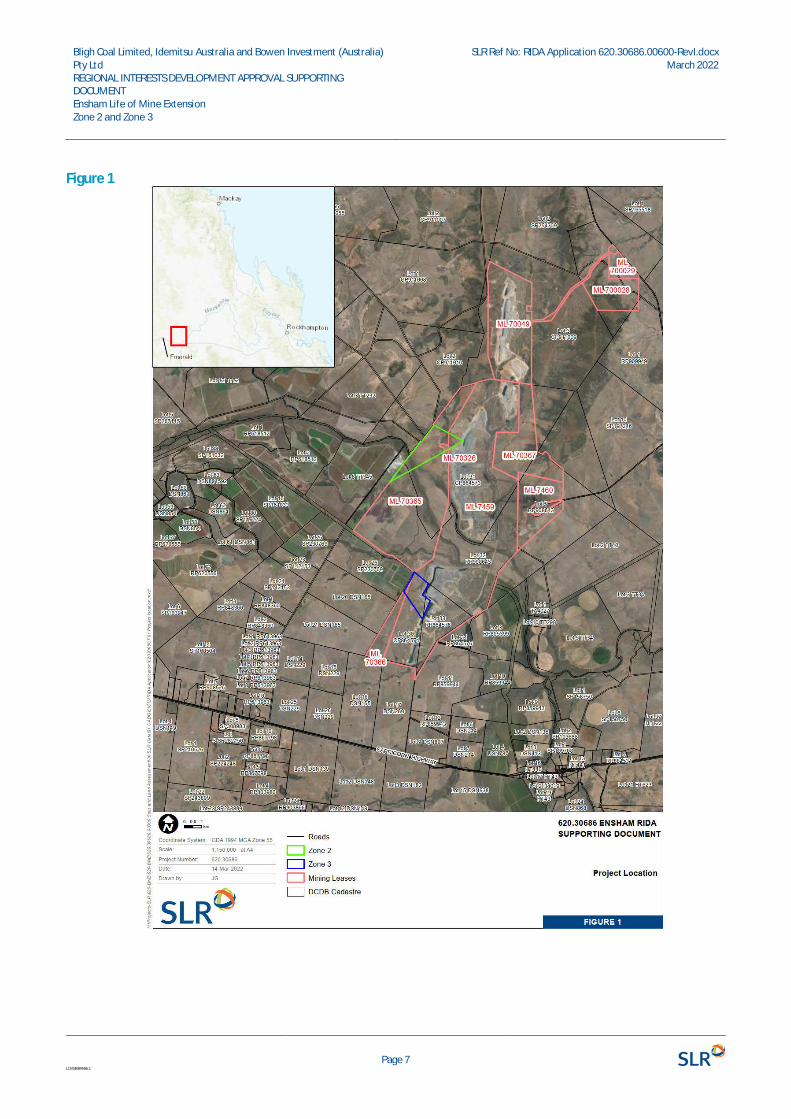
1 IntroductionThe Ensham Joint Venture (Ensham JV) is proposing to develop the Ensham Life of Mine Extension Project toextend the life of the existing underground operations into an area identified as Zones 2 and 3 (the Project) asshown on Figure 1. The existing Ensham Mine is operated by Ensham Resources Pty Ltd (Ensham), a whollyowned subsidiary of Idemitsu Australia Resources Pty Ltd (ACN 010236272) (Idemitsu), on behalf of the EnshamJV partners. The Ensham JV partners, and holders of the Environmental Authority (EA), are Bligh Coal Limited(ACN 010186393) (47.5 per cent), Idemitsu Australia Pty Ltd (37.5 per cent) and Bowen Investment (Australia)Pty Ltd (ACN 002806831) (15 per cent). The Ensham JV partners are the Proponents for the Project. Enshamcurrently operates the existing mine under EA EPML00732813.
This document has been prepared to support an application for a Regional Interests Development Approval(RIDA) under section 29 of the Regional Planning Interests Act 2014 (RPI Act). The application seeks approval toallow the construction (4 flares only) and the extension of the existing underground resource activity which ismapped within a priority agricultural area (PAA) and strategic cropping area (SCA) in reference to the RPI Act.
Ensham is an existing open-cut and underground bord and pillar coal mine located 35 kilometres (km) east ofEmerald in Central Queensland. Existing bord and pillar operations are located on mining lease (ML) 7459, ML70326 and ML 70365, targeting the Aries/Castor coal seam plies.
The Project entails the following major components, both described in more detail in the Project Description(Section 1.1):
· Extension of the existing underground mine activities
· Construction of four (4) gas drainage flares to prevent the build-up of methane gas within the undergroundmine.
Approval of the Project will allow Ensham to:
· Continue to produce at current coal production rate of approximately 4.5 million tonnes per annum (Mtpa)of product coal. Without the additional Project area, the current underground operations will becomephysically constrained resulting in lower production levels that will impact the overall economic viability ofthe mine and consequently the workforce
· Extend the life of mine (LOM) by two years with sufficient coal reserves to approximately 2029
· Progress the underground operation within existing mining leases. The Project would continue to utiliseexisting operational mine equipment, existing mining methodologies, and existing infrastructure located onthe existing mining leases
· Continue to provide ongoing direct and indirect employment opportunities within the Central Highlandsregion.
The Project is proposed to commence in late H1 2022 in Zone 2. This supporting document represents theassessment of the Project against the RPI Act, Schedule 2, Part 2 of the RPI Regulation, the RPI StatutoryGuidelines and Chapter 4 of the Central Queensland Regional Plan.
Bligh Coal Limited, Idemitsu Australia and Bowen Investment (Australia)Pty LtdREGIONAL INTERESTS DEVELOPMENT APPROVAL SUPPORTINGDOCUMENTEnsham Life of Mine ExtensionZone 2 and Zone 3
SLR Ref No: RIDA Application 620.30686.00600-RevI.docxMarch 2022
Page 7L\343884466.1
Figure 1 Project Location
Bligh Coal Limited, Idemitsu Australia and Bowen Investment (Australia)Pty LtdREGIONAL INTERESTS DEVELOPMENT APPROVAL SUPPORTINGDOCUMENTEnsham Life of Mine ExtensionZone 2 and Zone 3
SLR Ref No: RIDA Application 620.30686.00600-RevI.docxMarch 2022
Page 8L\343884466.1
1.1 Project DescriptionThis section summarises the Project Description, which is presented in further detail in Appendix A.
Ensham proposes to increase the life of the existing underground operations by extending the undergroundbord and pillar mine into the area identified as the Project. The Project covers approximately 603 hectares (ha)and includes two zones as seen in Figure 1:
· Zone 2: partially includes existing leases ML 70326, ML 70365, and ML 7459 (total area is approximately394 ha of which 346 ha would represent the mining footprint)
· The northern portion of Zone 2 is largely disturbed with large areas of cleared land and includesseismic lines and tracks. It contains areas of certified and uncertified rehabilitated spoil as well asunrehabilitated spoil and pre-strip areas from open-cut mining.
· Zone 3: partially includes existing leases ML 7459 and ML 70366 (total area is approximately 209 ha of which175 ha would represent the mining footprint).
· Zone 3 is disturbed land with borrow pits, dragline spoil, levees, topsoil stockpiles, pre-strip areas,tracks, and seismic lines associated with the existing open-cut operations at Ensham Mine. It islargely cleared with sparse stands of vegetation across the area.
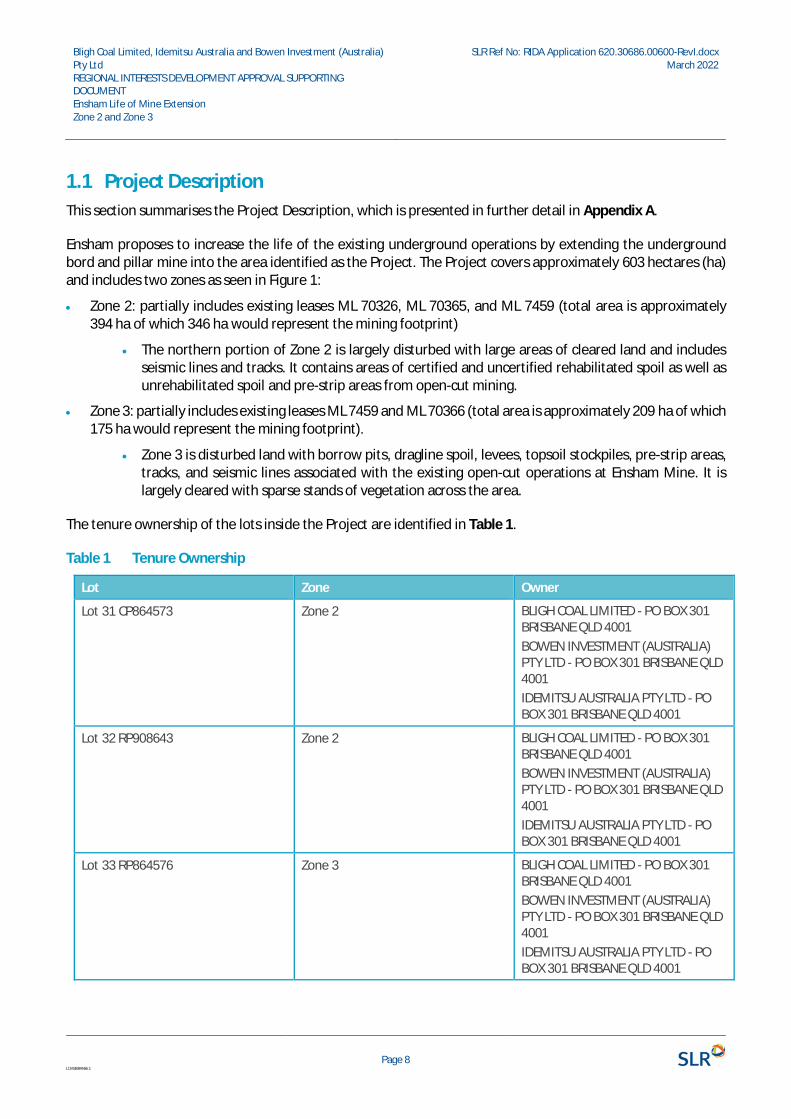
The tenure ownership of the lots inside the Project are identified in Table 1.
Table 1 Tenure Ownership
Lot Zone Owner
Lot 31 CP864573 Zone 2 BLIGH COAL LIMITED - PO BOX 301BRISBANE QLD 4001BOWEN INVESTMENT (AUSTRALIA)PTY LTD - PO BOX 301 BRISBANE QLD4001IDEMITSU AUSTRALIA PTY LTD - POBOX 301 BRISBANE QLD 4001
Lot 32 RP908643 Zone 2 BLIGH COAL LIMITED - PO BOX 301BRISBANE QLD 4001BOWEN INVESTMENT (AUSTRALIA)PTY LTD - PO BOX 301 BRISBANE QLD4001IDEMITSU AUSTRALIA PTY LTD - POBOX 301 BRISBANE QLD 4001
Lot 33 RP864576 Zone 3 BLIGH COAL LIMITED - PO BOX 301BRISBANE QLD 4001BOWEN INVESTMENT (AUSTRALIA)PTY LTD - PO BOX 301 BRISBANE QLD4001IDEMITSU AUSTRALIA PTY LTD - POBOX 301 BRISBANE QLD 4001
Bligh Coal Limited, Idemitsu Australia and Bowen Investment (Australia)Pty LtdREGIONAL INTERESTS DEVELOPMENT APPROVAL SUPPORTINGDOCUMENTEnsham Life of Mine ExtensionZone 2 and Zone 3
SLR Ref No: RIDA Application 620.30686.00600-RevI.docxMarch 2022
Page 9L\343884466.1
Lot Zone Owner
Lot 30 CP864574 Zone 3 BLIGH COAL LIMITED - PO BOX 301BRISBANE QLD 4001BOWEN INVESTMENT (AUSTRALIA)PTY LTD - PO BOX 301 BRISBANE QLD4001IDEMITSU AUSTRALIA PTY LTD - POBOX 301 BRISBANE QLD 4001
1.1.1 Mining Techniques
The Project has been subject to surface activities associated with the open-cut mine since the grant of the miningleases in 1994. For this Project, Ensham proposes to continue to mine Zone 2 and 3 using the current miningtechnique of the bord and pillar mining method.
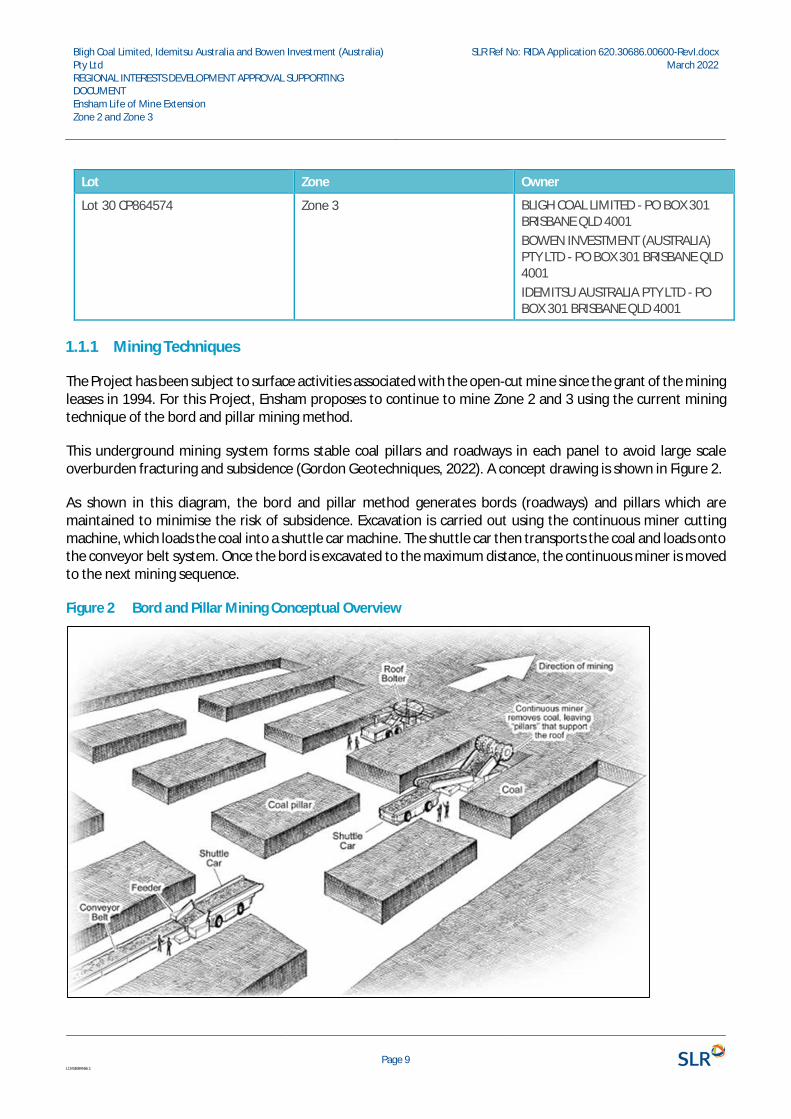
This underground mining system forms stable coal pillars and roadways in each panel to avoid large scaleoverburden fracturing and subsidence (Gordon Geotechniques, 2022). A concept drawing is shown in Figure 2.
As shown in this diagram, the bord and pillar method generates bords (roadways) and pillars which aremaintained to minimise the risk of subsidence. Excavation is carried out using the continuous miner cuttingmachine, which loads the coal into a shuttle car machine. The shuttle car then transports the coal and loads ontothe conveyor belt system. Once the bord is excavated to the maximum distance, the continuous miner is movedto the next mining sequence.
Figure 2 Bord and Pillar Mining Conceptual Overview
Bligh Coal Limited, Idemitsu Australia and Bowen Investment (Australia)Pty LtdREGIONAL INTERESTS DEVELOPMENT APPROVAL SUPPORTINGDOCUMENTEnsham Life of Mine ExtensionZone 2 and Zone 3
SLR Ref No: RIDA Application 620.30686.00600-RevI.docxMarch 2022
Page 10L\343884466.1
The proposed bord and pillar mining method results in a better environmental outcome compared to longwallmining with respect to subsidence, which will in turn reduce future land degradation.
In order for proposed mine operations to be conducted safely, the construction, installation and use of gasdrainage flares will be required for the Project. The flares will be used for safety mitigation and are required todrain methane gas from underground mining operations to create a safe working environment. Flares generatea lower environmental impact than free venting as required under Mineral Resources Act 1989, due to themethane in the gas being combusted by the flare to form CO2 which has a GHG footprint that is approximately28 times lower compared to free venting as methane.
1.1.2 Flare Construction
Standard flare installation procedures will be employed in line with risk assessments to reduce the hazards ofcombustible material within an exclusion zone around the flare. This typically involves slashing the adjacentgrass, and laying a base of gravel around the flare. Drilling to the coal seam must occur before the hole iscemented, which will allow gas to drain towards the surface. Minor quantities of drilling muds will be disposedof in accordance with appropriate rehabilitation methods. Gas is then ignited at a safe distance above thesurface. Each flare would be approximately 8 m tall with the flare height (i.e. height of the ignited gas flame)being up to 3 m above the flare.
Each flare will be established in already cleared locations which are already approved for disturbance under thecurrent EA. Flares will be constructed and operated at a time consistent with the mining schedule.
1.1.3 Flare Exclusion Areas
No additional material infrastructure other than installation of four flares will be required. For safety, theinstallation of the flares includes an exclusion zone. The flare exclusion area will be fenced to prohibit wildlifeand people from unauthorised entry. This exclusion area would be established on previously disturbed land andwould not require any vegetation clearing (other than maintenance of grass levels to minimise fire risk). Theselocations would utilise existing tracks on existing mining leases for non-material construction purposes as wellas ongoing general access and maintenance matters.
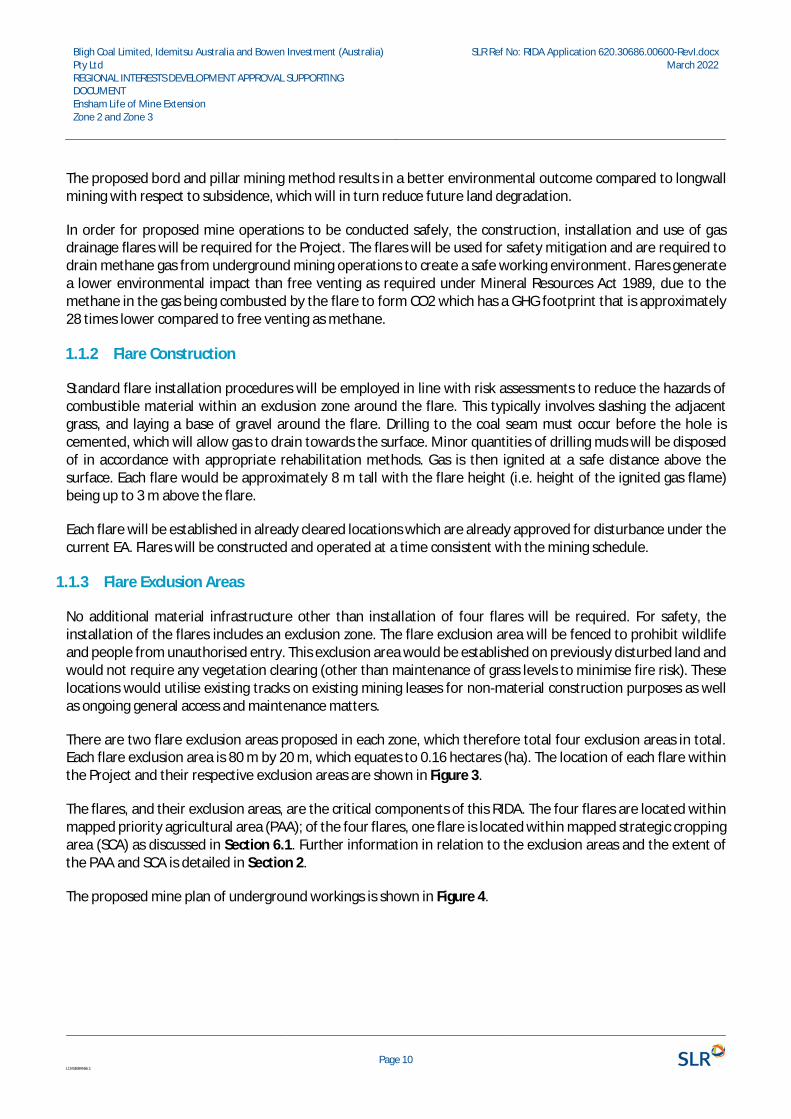
There are two flare exclusion areas proposed in each zone, which therefore total four exclusion areas in total.Each flare exclusion area is 80 m by 20 m, which equates to 0.16 hectares (ha). The location of each flare withinthe Project and their respective exclusion areas are shown in Figure 3.
The flares, and their exclusion areas, are the critical components of this RIDA. The four flares are located withinmapped priority agricultural area (PAA); of the four flares, one flare is located within mapped strategic croppingarea (SCA) as discussed in Section 6.1. Further information in relation to the exclusion areas and the extent ofthe PAA and SCA is detailed in Section 2.
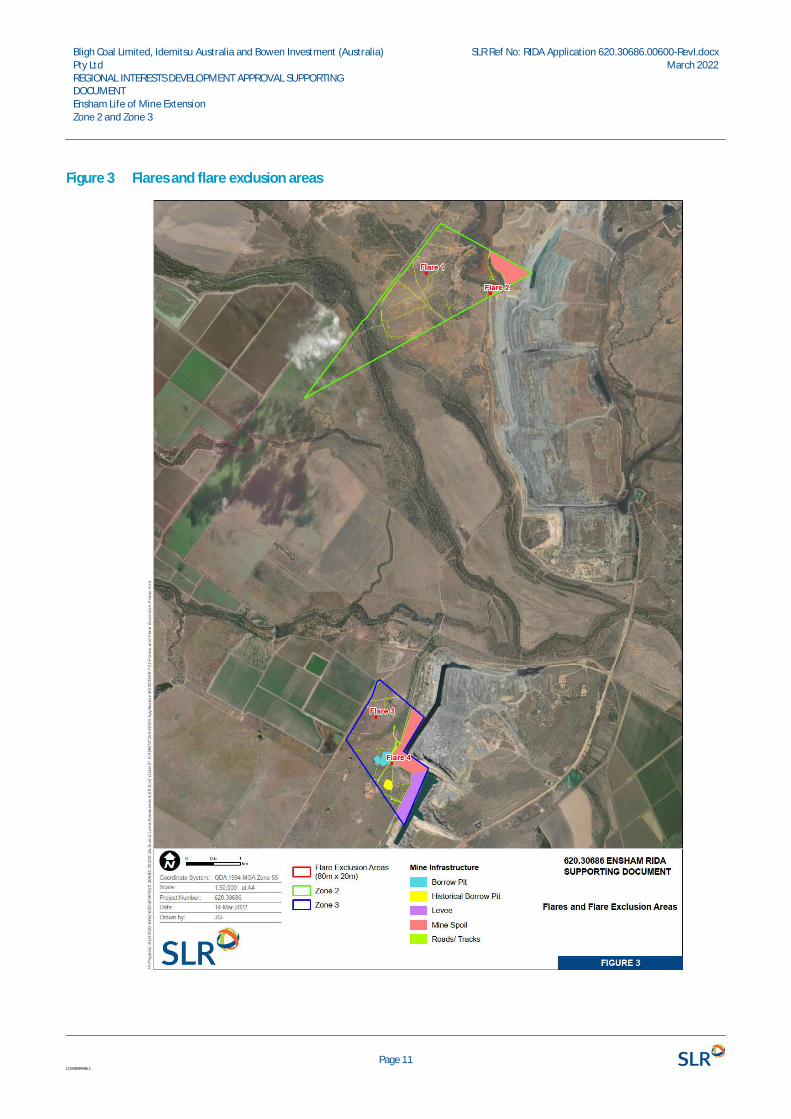
The proposed mine plan of underground workings is shown in Figure 4.
Bligh Coal Limited, Idemitsu Australia and Bowen Investment (Australia)Pty LtdREGIONAL INTERESTS DEVELOPMENT APPROVAL SUPPORTINGDOCUMENTEnsham Life of Mine ExtensionZone 2 and Zone 3
SLR Ref No: RIDA Application 620.30686.00600-RevI.docxMarch 2022
Page 11L\343884466.1
Figure 3 Flares and flare exclusion areas
Bligh Coal Limited, Idemitsu Australia and Bowen Investment (Australia)Pty LtdREGIONAL INTERESTS DEVELOPMENT APPROVAL SUPPORTINGDOCUMENTEnsham Life of Mine ExtensionZone 2 and Zone 3
SLR Ref No: RIDA Application 620.30686.00600-RevI.docxMarch 2022
Page 12L\343884466.1
Figure 4 Mine plan of underground workings
Bligh Coal Limited, Idemitsu Australia and Bowen Investment (Australia)Pty LtdREGIONAL INTERESTS DEVELOPMENT APPROVAL SUPPORTINGDOCUMENTEnsham Life of Mine ExtensionZone 2 and Zone 3
SLR Ref No: RIDA Application 620.30686.00600-RevI.docxMarch 2022
Page 13L\343884466.1
1.2 Purpose
The purpose of this document is to support the Assessment Application for a RIDA under the RPI Act. TheAssessment Application for a RIDA is being submitted by Ensham JV partners for the following reasons:
1. A RIDA is being sought to obtain approval under the RPI Act to carry out a resource activity in an area ofregional interest
2. To assess the Project's impact on areas of regional interest, as required by Section 29 (b) of the RPI Act
This application demonstrates that there will be no material impact to mapped PAA or SCA, and that RequiredOutcome 1 (RO1) under Schedule 2 of the Regional Planning Interests Regulation 2014 (RPI Regulation) for PAA(Part 2) and RO2 for SCA (Part 4) is achieved by the Project. Refer to Section 4 for further details.
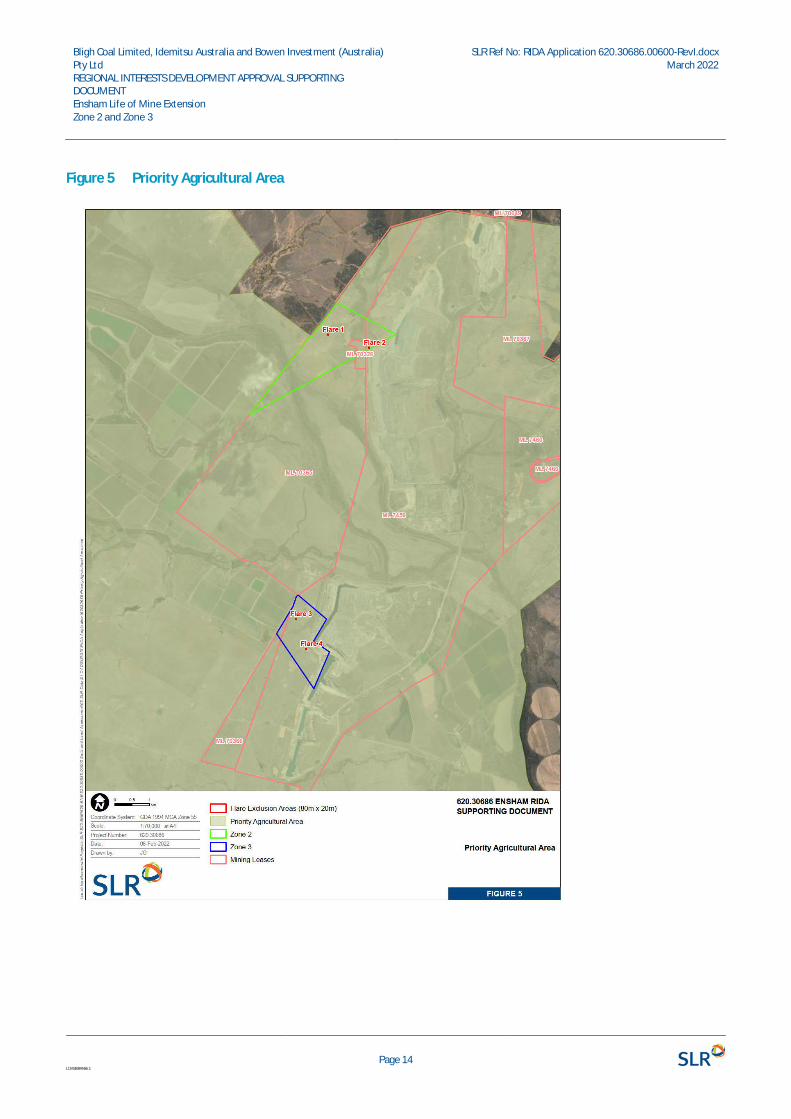
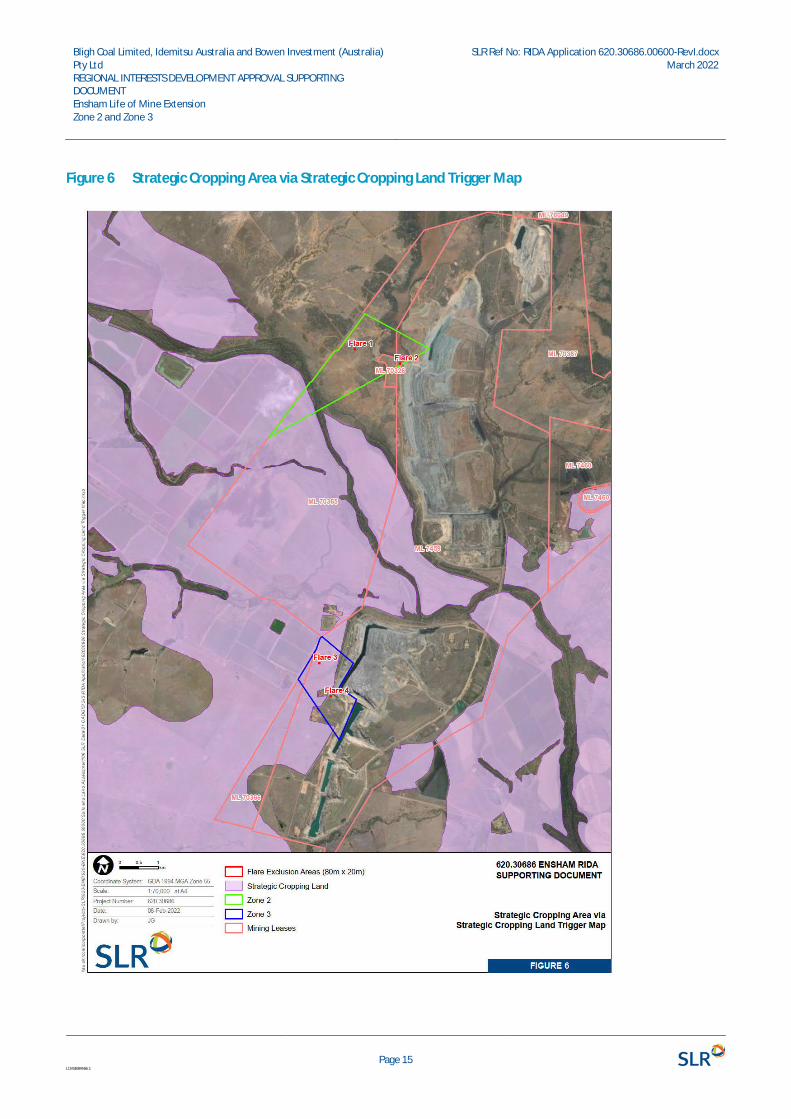
For the purpose of this application, the status of the PAA and SCA (‘as mapped’) within the Project is not beingchallenged. The Project, comprising the continuation of underground mining into Zones 2 and 3, is entirely withinthe mapped PAA and partially within SCA. The Project area in relation to mapped PAA and mapped SCA isoutlined on Figure 5 and Figure 6 respectively.
An assessment of the Project against the ROs under the RPI Regulation is provided under Section 4. A summaryof the existing environment at the Project area is provided under Section 5 and potential impacts of the Projectto PAA and SCA is discussed under Section 6.
Bligh Coal Limited, Idemitsu Australia and Bowen Investment (Australia)Pty LtdREGIONAL INTERESTS DEVELOPMENT APPROVAL SUPPORTINGDOCUMENTEnsham Life of Mine ExtensionZone 2 and Zone 3
SLR Ref No: RIDA Application 620.30686.00600-RevI.docxMarch 2022
Page 14L\343884466.1
Figure 5 Priority Agricultural Area
Bligh Coal Limited, Idemitsu Australia and Bowen Investment (Australia)Pty LtdREGIONAL INTERESTS DEVELOPMENT APPROVAL SUPPORTINGDOCUMENTEnsham Life of Mine ExtensionZone 2 and Zone 3
SLR Ref No: RIDA Application 620.30686.00600-RevI.docxMarch 2022
Page 15L\343884466.1
Figure 6 Strategic Cropping Area via Strategic Cropping Land Trigger Map
Bligh Coal Limited, Idemitsu Australia and Bowen Investment (Australia)Pty LtdREGIONAL INTERESTS DEVELOPMENT APPROVAL SUPPORTINGDOCUMENTEnsham Life of Mine ExtensionZone 2 and Zone 3
SLR Ref No: RIDA Application 620.30686.00600-RevI.docxMarch 2022
Page 16L\343884466.1
2 Regulatory Considerations
2.1 Regional Planning Interests Act 2014
The RPI Act identifies and protects areas in Queensland that are of ‘regional interest’. The RPI Act outlines therequirement for a RIDA for resource activities carried out in ARIs, other than exempt resource activities. FourARIs are identified by the RPI Act as follows:
· A PAA – an area which includes one or more areas used for a priority agricultural land use (PALU). A PALU ishighly productive agriculture of a type identified in a Regional Plan for an ARI or of a type prescribed undera regulation for an ARI
· A priority living area (PLA) – an area mapped as a PLA and exists as a settled area of a city, town or othercommunity and other areas deemed necessary or desirable
· The SCA – an area shown on the Strategic Cropping Land (SCL) trigger map as SCL. SCL is defined as land thatis , or which is likely to be highly suitable for cropping, because of a combination of the land's soil, climateand landscape features
· A strategic environmental area (SEA) – an area with strategic environmental value which is either shown ona map in a Regional Plan or prescribed by regulation, where there is a quality or characteristic of theenvironment that is conducive to ecological health or public amenity.
Of the ARIs protected by the RPI Act, PAA and SCA are mapped within the Project.
2.2 Regional Planning Interests Regulation 2014
The RPI Regulation underpins the RPI Act and defines criteria for assessment of impacts to ARIs. Schedule 2 ofthe RPI Regulation details important definitions of ARIs, ‘Required Outcomes’ (ROs) and ‘Prescribed Solutions’for impacts to ARIs. The ROs relevant to the Project are outlined below.
2.2.1 Priority Agricultural Area (RPI Regulation, Schedule 2, Part 2)
The RPI Regulation (Schedule 2, Part 1) states the definition of land use which is considered as a PALU. For landto be consider ‘used’ for a PALU, the land must have been used for a PALU for ‘at least three years during theten years immediately preceding the assessment application’.
The RPI Regulation also outlines the following ROs:
· Required outcome 1—managing impacts on use of property for priority agricultural land use in priorityagricultural area
· Required outcome 2—managing impacts on a region in relation to use of an area in the region for a priorityagricultural land use.
An assessment of potential PALUs and the assessment against ROs has been outlined under Section 4.1.
Bligh Coal Limited, Idemitsu Australia and Bowen Investment (Australia)Pty LtdREGIONAL INTERESTS DEVELOPMENT APPROVAL SUPPORTINGDOCUMENTEnsham Life of Mine ExtensionZone 2 and Zone 3
SLR Ref No: RIDA Application 620.30686.00600-RevI.docxMarch 2022
Page 17L\343884466.1
2.2.2 Strategic Cropping Area (RPI Regulation, Schedule 2, Part 4)
The RPI Regulation (Schedule 2, Part 4) outlines the following ROs for the SCA:
· Required outcome 1— no impact on strategic cropping land
· Required outcome 2— managing impacts on strategic cropping land on property (SCL) in the strategiccropping area
· Required outcome 3— managing impacts on strategic cropping land for a region.
An assessment against ROs has been outlined under Section 4.2.
Bligh Coal Limited, Idemitsu Australia and Bowen Investment (Australia)Pty LtdREGIONAL INTERESTS DEVELOPMENT APPROVAL SUPPORTINGDOCUMENTEnsham Life of Mine ExtensionZone 2 and Zone 3
SLR Ref No: RIDA Application 620.30686.00600-RevI.docxMarch 2022
Page 18L\343884466.1
2.3 Central Queensland Regional Plan
The Central Queensland Regional Plan (CQ Regional Plan) provides strategic direction and policies to deliverregional outcomes which align with the state’s interests in planning and development.
The plan provides policy responses to resolve the most important issues affecting Central Highlands economyand the liveability of its towns. The plan specifically provides direction to resolve competing state interestsrelating to the agricultural and resources sectors, and to enable the growth potential of the region’s towns. Theregional policies aim to:
· Protect Priority Agricultural Land Uses while supporting co-existence opportunities for the resources sector,
· Provide certainty for the future growth of towns.
The purpose of the plan is to identify the state’s interests in land use planning for the region. Specifically, theplan identifies:
· regional outcomes for the region
· regional policies for achieving the regional outcomes
· the state’s intent for the future spatial structure of the region, including PAA, PLA and priority outcomes forinfrastructure.
The plan’s regional policies address the emerging regional issues of land use competition between theagricultural and resources sectors, and the need to protect areas required for the growth of towns.
The plan also discusses other state interests relevant to land use planning in the region, including housing andliveable communities, economic growth, environment and heritage, and hazards and safety.
2.3.1 Regional Outcomes and policies
The Central Queensland region’s greatest competitive industry strengths are in supporting coal mining, CoalSeam Gas (CSG)/Liquid Natural Gas (LNG) and agricultural sectors.
Resolving the conflict between agriculture and the resources sector is crucial to the long-term sustainability ofboth industries and ultimately the region’s economy. Impacts on the productivity of agricultural land fromresource activities can include direct land take, changes to land access, loss or degradation of soil, subsidenceand overland flow modifications. Within Zones 2 and 3, the possible effect on the PAA and SCA results fromsubsidence as a result of mining activities. Subsidence impacts are discussed further in Section 6.2.
Surface effects that may be associated with the construction of each flare represent a very small amount of thePAA/SCA inside the Project and are unlikely to incur material changes to the landscape (refer to Error! Referencesource not found. for the extent of disturbance on ARI for the Project).
The regional outcomes and policies contained in the CQ Regional Plan align with and advance the achievementof the state’s interest in relation to:
· supporting the long-term viability and growth of the agricultural sector
· maximising the productive use of key mining resources
· providing for liveable communities.
Bligh Coal Limited, Idemitsu Australia and Bowen Investment (Australia)Pty LtdREGIONAL INTERESTS DEVELOPMENT APPROVAL SUPPORTINGDOCUMENTEnsham Life of Mine ExtensionZone 2 and Zone 3
SLR Ref No: RIDA Application 620.30686.00600-RevI.docxMarch 2022
Page 19L\343884466.1
In relation to agriculture, the first Regional Outcome states that “Agriculture and resources industries within theCentral Queensland region continue to grow with certainty and investor confidence” (CQ Regional Plan, 2013).
The regional outcome is supported by the regional policies (CQ Regional Plan, 2013), whereby the policies aimto protect PALU while supporting co-existence opportunities for the resources sector. These are stated asfollows from the CQ Regional Plan:
· Regional policy 1: Protect Priority Agricultural Land Uses within Priority Agricultural Areas
· Regional policy 2: Maximise opportunities for co-existence of resource and agricultural land uses withinPriority Agricultural Areas.
PAAs are identified and mapped in the CQ Regional Plan and comprise of the region’s strategic areas containinghighly productive agricultural land uses. PALUs within the PAA are recognised as the primary land use and aregiven priority over any other proposed land use.
The Project site and land surrounding is predominantly used for a mix of cropping and grazing purposes,alongside existing mining operations. The Project will disturb a total of 0.64 ha for the 4 flares and their exclusionareas. Underground mining using the bord and pilar mining method coupled with utilizing existing infrastructurefurther supports the Project’s approach to minimising surface disturbance.
Each area will be rehabilitated post-mining as the flare stack will be safely deconstructed and the exclusion arearehabilitated to its previous land use. The effects of each exclusion area are discussed more in Section 6. TheProject satisfies the Regional Policy 1 and Regional Policy 2 outcomes, as no PALU is impacted by the Project andagricultural lands uses will continue for the duration of the Project.
2.4 Public Notification
2.4.1 Avoiding duplication of notification
Under Section 34 (3) of the RPI Act ‘the chief executive may, on the written request of the applicant, grant anexemption from notification for an assessment application if satisfied there has been sufficient notificationunder another Act or law of the resource activity or regulated activity to the public’.
The RPI Act Statutory Guideline 06/14 Public notification of assessment applications outlines that it is not theintention of the Government to repeat notification of a proposed activity where notification has beenundertaken as part of another process (i.e. an EIS process under the State Development and Public WorksOrganisation Act 1971 or the Environmental Protection Act 1994) and where that notification included detailedinformation of the proposed activity and its relationship to the areas of regional interest impacted.
While the Assessment Application is not a notifiable assessment application, Ensham considers that norequirement to notify the application should be made, on the basis that sufficient public notification hasoccurred under legislation other than the RPI Act.

Bligh Coal Limited, Idemitsu Australia and Bowen Investment (Australia)Pty LtdREGIONAL INTERESTS DEVELOPMENT APPROVAL SUPPORTINGDOCUMENTEnsham Life of Mine ExtensionZone 2 and Zone 3
SLR Ref No: RIDA Application 620.30686.00600-RevI.docxMarch 2022
Page 20L\343884466.1
2.4.2 Previous public notification
The Ensham Life of Mine Extension Project was issued final Terms of Reference (ToR) in November 2020, whichrequired the assessment of the potential impacts of the Project land uses on SCA and PAA (refer to Section 9.2of the final ToR). The Environmental Impact Statement (EIS) was submitted on 12 March 2021, then publiclynotified under Section 51 and 52 of the Environmental Protection Act 1994 for a 6-week public submission periodcommencing 27 April 2021 and concluded on 8 June 2021. DES received a total of 29 submissions in respect ofthe EIS. All submissions were responded to, and the submissions register was provided to DES on 13 August 2021along with the Amended EIS addressing the matters raised in the submissions.
An EIS Assessment Report was subsequently issued by DES on 9 November 2021, outlining that the EIS is largelycomplaint with the final ToR and that a RIDA is required under the RPI Act.
The Ensham Life of Mine Extension Project’s referral under the Environment Protection and Biodiversity Act 1999(Cth) (EPBC Act) was also published on the Department of Agriculture, Water and the Environment website on29 May 2020.
The RPI Act Statutory Guideline 06/14 Public notification of assessment applications outline requirements for anassessment application to avoid duplication of notification, an assessment against the guideline criteria isprovided in Table 2.
Table 2 Avoiding Duplication of Public Notification
RPI Act Section 34(3) RPI Act Statutory Guideline06/15 Public notification ofassessment application
CriteriaMet(Yes/No)
Evidence of Addressed Criteria
The chief executive may,on the written request ofthe applicant, grant anexemption fromnotification for anassessment application ifsatisfied there has beensufficient notificationunder another Act or lawof the resource activity orregulated activity to thepublic.
The period between theprevious public notificationand the receipt of theapplication under the RPIAct does not exceed 12months.
Yes The EIS was publicly notified for a submissionperiod commencing 27 April 2021 andconcluded on 8 June 2021. This applicationhas been made within the 12 months of thisdate.
The publicly notified activityor project included the landthe subject of theapplication made under theRPI Act.
Yes The EIS included the land the subject of thisapplication being the areas identified as Zone2 and 3 within approved mining leases ML70326, ML 70365, ML 70366 and ML 7459.The scope of mining for Zones 2 and 3 in thisapplication covers the same Zones 2 and 3scope that was assessed in the EIS. The land isdescribed in Chapter 4 – Project Descriptionand Chapter 7 – Land Use and Tenure of theEIS.
The EPBC Act referral also included the landcomprising Zones 2 and 3 as described insection 1.6 of the referral form.
Bligh Coal Limited, Idemitsu Australia and Bowen Investment (Australia)Pty LtdREGIONAL INTERESTS DEVELOPMENT APPROVAL SUPPORTINGDOCUMENTEnsham Life of Mine ExtensionZone 2 and Zone 3
SLR Ref No: RIDA Application 620.30686.00600-RevI.docxMarch 2022
Page 21L\343884466.1
The publicly notified activityor project detailed thesurface area impacts of theactivity the subject of theapplication made under theRPI Act.
Yes The EIS addressed the potential surface areaimpacts to PAA and SCA in Zones 2 and 3.These are the same areas and activitiesoutlined in this application. Surface areaimpacts are outlined in the following chaptersof the EIS:
· Chapter 7 Land Use and Tenure – Section7.3.3 identifies that the potential impactsto the PAA and SCA are considered to beminor on the following basis:
(a) land use impacts associated withthe Project will be minor assurface disturbance is limitedto flaring infrastructure inZones 2 and 3;
(b) predicted subsidence of up to40mm as a result of the Projectis less than the estimatedseasonal variation in surfacelevels as a result of changes inmoisture content; and
(c) there is no potential loss and/orfragmentation of ruralagricultural land.
· Chapter 8 – Land Resources. Section 8.5.3addresses the impacts on the soil notingthat:
(a) the proposed activities are tooccur on land that is highlydisturbed and will not involvevegetation clearing; and
(b) subsidence is predicted to bewithin the expected levels ofnatural ground swell variationand is unlikely to result in theformation of significantdepressions in the surfacetopography.
The EPBC Act referral also outlined the surfacearea impacts in relation to the activitiesproposed in Zones 2 and 3 as described in thesupporting technical report for matters ofnational environmental significance - section2.0. Particularly, it is noted that surfacecracking is not predicted above the Project
Bligh Coal Limited, Idemitsu Australia and Bowen Investment (Australia)Pty LtdREGIONAL INTERESTS DEVELOPMENT APPROVAL SUPPORTINGDOCUMENTEnsham Life of Mine ExtensionZone 2 and Zone 3
SLR Ref No: RIDA Application 620.30686.00600-RevI.docxMarch 2022
Page 22L\343884466.1
RPI Act Section 34(3) RPI Act Statutory Guideline06/15 Public notification ofassessment application
CriteriaMet(Yes/No)
Evidence of Addressed Criteria
area due to the predicted low levels ofmaximum surface disturbance.
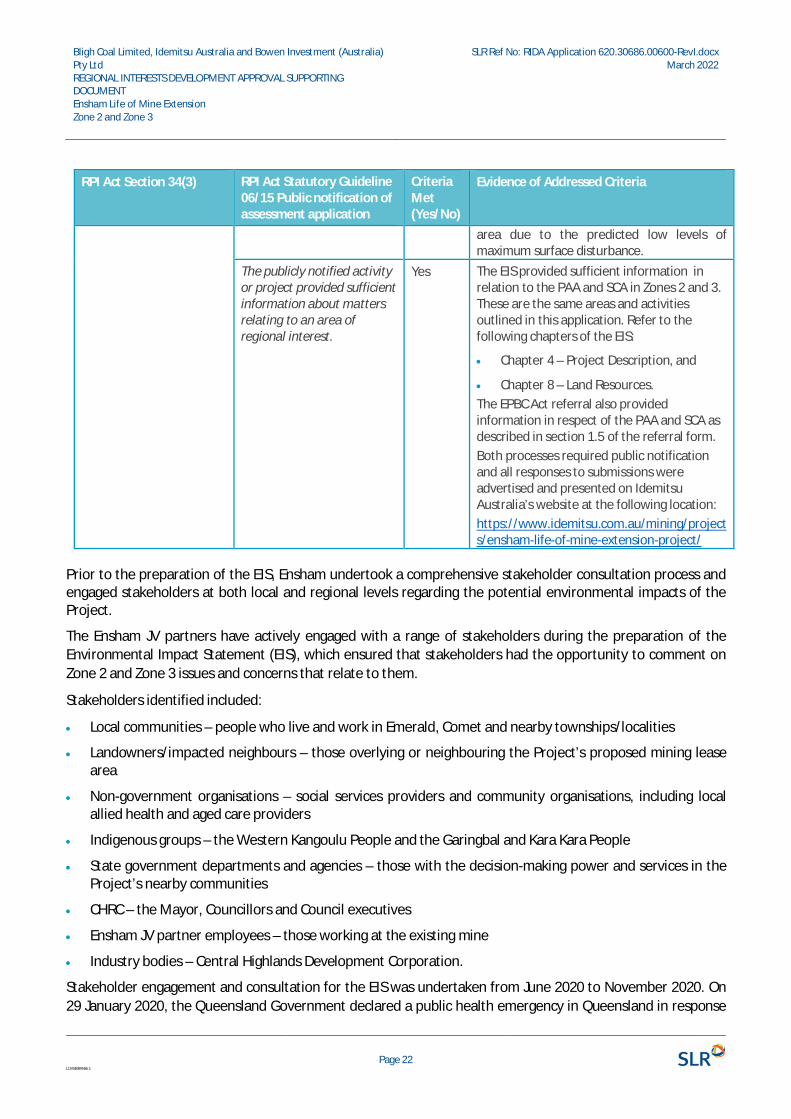
The publicly notified activityor project provided sufficientinformation about mattersrelating to an area ofregional interest.
Yes The EIS provided sufficient information inrelation to the PAA and SCA in Zones 2 and 3.These are the same areas and activitiesoutlined in this application. Refer to thefollowing chapters of the EIS:
· Chapter 4 – Project Description, and
· Chapter 8 – Land Resources.The EPBC Act referral also providedinformation in respect of the PAA and SCA asdescribed in section 1.5 of the referral form.Both processes required public notificationand all responses to submissions wereadvertised and presented on IdemitsuAustralia’s website at the following location:https://www.idemitsu.com.au/mining/projects/ensham-life-of-mine-extension-project/
Prior to the preparation of the EIS, Ensham undertook a comprehensive stakeholder consultation process andengaged stakeholders at both local and regional levels regarding the potential environmental impacts of theProject.
The Ensham JV partners have actively engaged with a range of stakeholders during the preparation of theEnvironmental Impact Statement (EIS), which ensured that stakeholders had the opportunity to comment onZone 2 and Zone 3 issues and concerns that relate to them.
Stakeholders identified included:
· Local communities – people who live and work in Emerald, Comet and nearby townships/localities
· Landowners/impacted neighbours – those overlying or neighbouring the Project’s proposed mining leasearea
· Non-government organisations – social services providers and community organisations, including localallied health and aged care providers
· Indigenous groups – the Western Kangoulu People and the Garingbal and Kara Kara People
· State government departments and agencies – those with the decision-making power and services in theProject’s nearby communities
· CHRC – the Mayor, Councillors and Council executives
· Ensham JV partner employees – those working at the existing mine
· Industry bodies – Central Highlands Development Corporation.
Stakeholder engagement and consultation for the EIS was undertaken from June 2020 to November 2020. On29 January 2020, the Queensland Government declared a public health emergency in Queensland in response
Bligh Coal Limited, Idemitsu Australia and Bowen Investment (Australia)Pty LtdREGIONAL INTERESTS DEVELOPMENT APPROVAL SUPPORTINGDOCUMENTEnsham Life of Mine ExtensionZone 2 and Zone 3
SLR Ref No: RIDA Application 620.30686.00600-RevI.docxMarch 2022
Page 23L\343884466.1
to the COVID-19 pandemic. Given the restrictions in place during the public health emergency declaration, aninitial round of engagement via online means was undertaken in early-mid 2020, followed by face-to-facemeetings and community workshops in October 2020 when some restrictions were eased.
A number of submissions were made following a 6 week advertising period during the public notice period.Responses to all submissions were subsequently made by Ensham and were submitted to the Department ofEnvironment and Science (DES). DES then issued an EIS Assessment Report (the Report) in November 2021incorporating a number of recommendations. Recommendations from this Report have subsequently beenincorporated into the Zone 2 and 3 Environmental Authority amendment documents as submitted.
Consultation aimed to provide information on the Project, identifying any issues or concerns, seeking feedbackand providing responses.
The proponents will continue stakeholder engagement activities as documented in the Community andStakeholder Engagement Plan to inform Project development and management, build on establishedrelationships throughout the community, and build on an existing reputation as an operator that is genuinelycommitted to the well-being and sustainability of the community.
For the reasons outlined above and Table 2, Ensham considers that there has been sufficient public notificationcompleted under the EP Act and EPBC Act in relation to the activities that will be undertaken as part of theProject.

Bligh Coal Limited, Idemitsu Australia and Bowen Investment (Australia)Pty LtdREGIONAL INTERESTS DEVELOPMENT APPROVAL SUPPORTINGDOCUMENTEnsham Life of Mine ExtensionZone 2 and Zone 3
SLR Ref No: RIDA Application 620.30686.00600-RevI.docxMarch 2022
Page 24L\343884466.1
3 Assessment Against RPI GuidelinesThe RIDA application are informed by the RPI Act and RPI Regulation. The RPI Guidelines are used to aid thecompliance with the RPI Act and RPI Regulation. The RPI Guidelines cover all elements of the RIDA process,however not all guidelines are relevant to each individual application. As the proposed construction and miningfootprints are being conducted within PAA and SCA mapped land, this RIDA Application has been assessedagainst the following RPI Guidelines:
· RPI Act guideline 01/14 - How to make an assessment application under the RPI Act
· RPI Act guideline 02/14 - Carrying out activities in priority agricultural area
· RPI Act guideline 03/14 - Carrying out activities in the strategic cropping area
· RPI Act guideline 06/14 - Notification requirements under the RPI Act
· RPI Act guideline 07/14 - How to identify a priority agricultural land use
· RPI Act guideline 09/14 - How to determine if an activity has a permanent impact on strategic cropping land
There are several other RPI Act guidelines available, however these are not relevant to the Project and this RIDAsupporting document. Table 3 provides a list all relevant RPI Guideline items to be addressed, how they havebeen addressed and where further detail can be found within the RIDA application.
Bligh Coal Limited, Idemitsu Australia and Bowen Investment (Australia) Pty LtdREGIONAL INTERESTS DEVELOPMENT APPROVAL SUPPORTING DOCUMENTEnsham Life of Mine ExtensionZone 2 and Zone 3
SLR Ref No: RIDA Application 620.30686.00600-RevI.docxMarch 2022
Page 25L\343884466.1
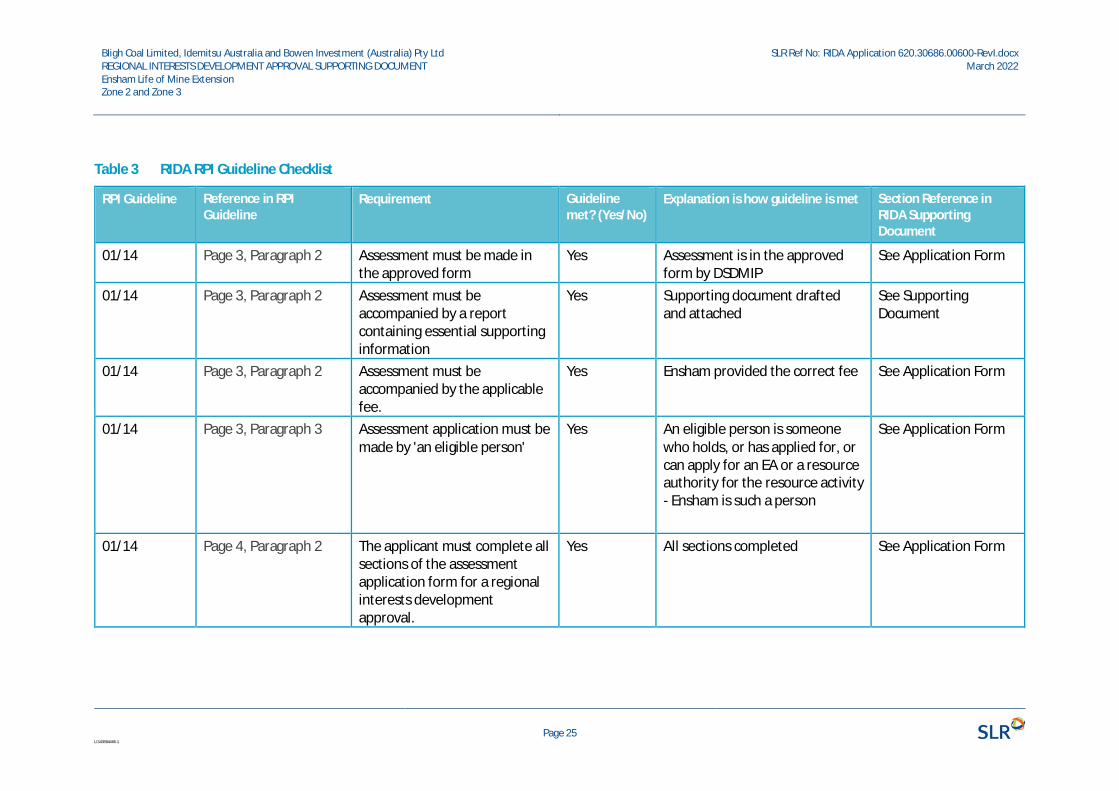
Table 3 RIDA RPI Guideline Checklist
RPI Guideline Reference in RPIGuideline
Requirement Guidelinemet? (Yes/No)
Explanation is how guideline is met Section Reference inRIDA SupportingDocument
01/14 Page 3, Paragraph 2 Assessment must be made inthe approved form
Yes Assessment is in the approvedform by DSDMIP
See Application Form
01/14 Page 3, Paragraph 2 Assessment must beaccompanied by a reportcontaining essential supportinginformation
Yes Supporting document draftedand attached
See SupportingDocument
01/14 Page 3, Paragraph 2 Assessment must beaccompanied by the applicablefee.
Yes Ensham provided the correct fee See Application Form
01/14 Page 3, Paragraph 3 Assessment application must bemade by 'an eligible person'
Yes An eligible person is someonewho holds, or has applied for, orcan apply for an EA or a resourceauthority for the resource activity- Ensham is such a person
See Application Form
01/14 Page 4, Paragraph 2 The applicant must complete allsections of the assessmentapplication form for a regionalinterests developmentapproval.
Yes All sections completed See Application Form
Bligh Coal Limited, Idemitsu Australia and Bowen Investment (Australia) Pty LtdREGIONAL INTERESTS DEVELOPMENT APPROVAL SUPPORTING DOCUMENTEnsham Life of Mine ExtensionZone 2 and Zone 3
SLR Ref No: RIDA Application 620.30686.00600-RevI.docxMarch 2022
Page 26L\343884466.1
RPI Guideline Reference in RPIGuideline
Requirement Guidelinemet? (Yes/No)
Explanation is how guideline is met Section Reference inRIDA SupportingDocument
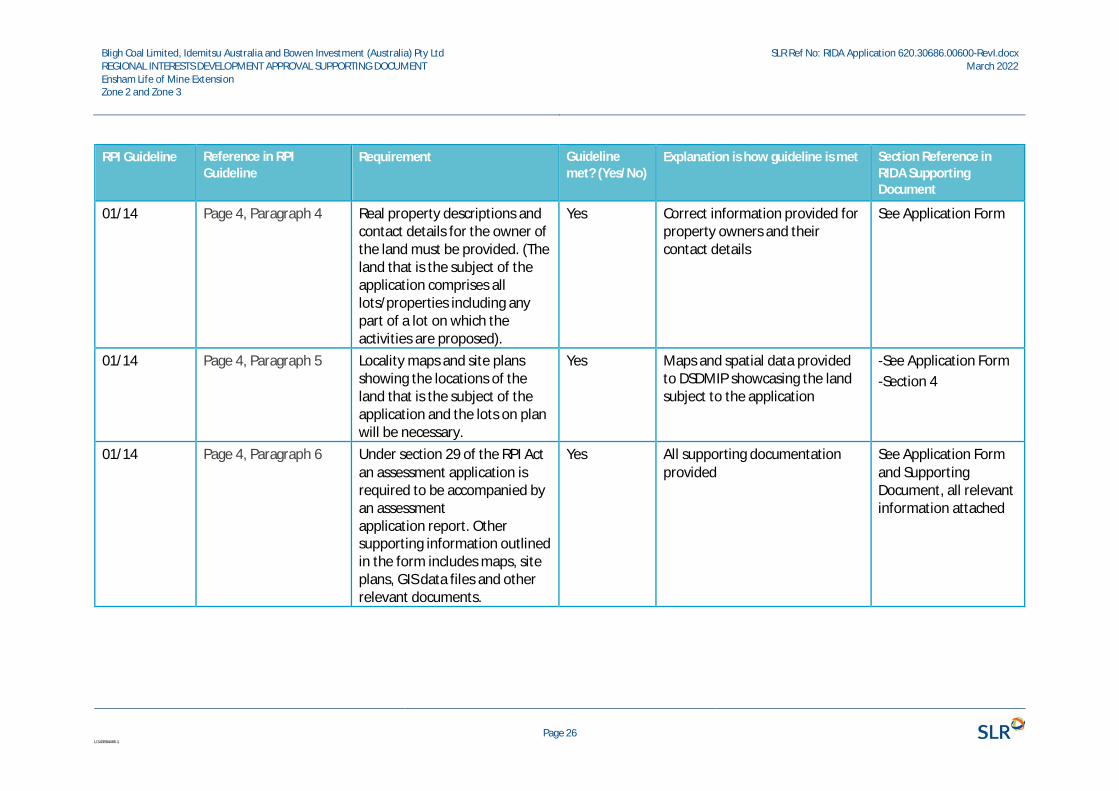
01/14 Page 4, Paragraph 4 Real property descriptions andcontact details for the owner ofthe land must be provided. (Theland that is the subject of theapplication comprises alllots/properties including anypart of a lot on which theactivities are proposed).
Yes Correct information provided forproperty owners and theircontact details
See Application Form
01/14 Page 4, Paragraph 5 Locality maps and site plansshowing the locations of theland that is the subject of theapplication and the lots on planwill be necessary.
Yes Maps and spatial data providedto DSDMIP showcasing the landsubject to the application
-See Application Form-Section 4
01/14 Page 4, Paragraph 6 Under section 29 of the RPI Actan assessment application isrequired to be accompanied byan assessmentapplication report. Othersupporting information outlinedin the form includes maps, siteplans, GIS data files and otherrelevant documents.
Yes All supporting documentationprovided
See Application Formand SupportingDocument, all relevantinformation attached
Bligh Coal Limited, Idemitsu Australia and Bowen Investment (Australia) Pty LtdREGIONAL INTERESTS DEVELOPMENT APPROVAL SUPPORTING DOCUMENTEnsham Life of Mine ExtensionZone 2 and Zone 3
SLR Ref No: RIDA Application 620.30686.00600-RevI.docxMarch 2022
Page 27L\343884466.1
RPI Guideline Reference in RPIGuideline
Requirement Guidelinemet? (Yes/No)
Explanation is how guideline is met Section Reference inRIDA SupportingDocument
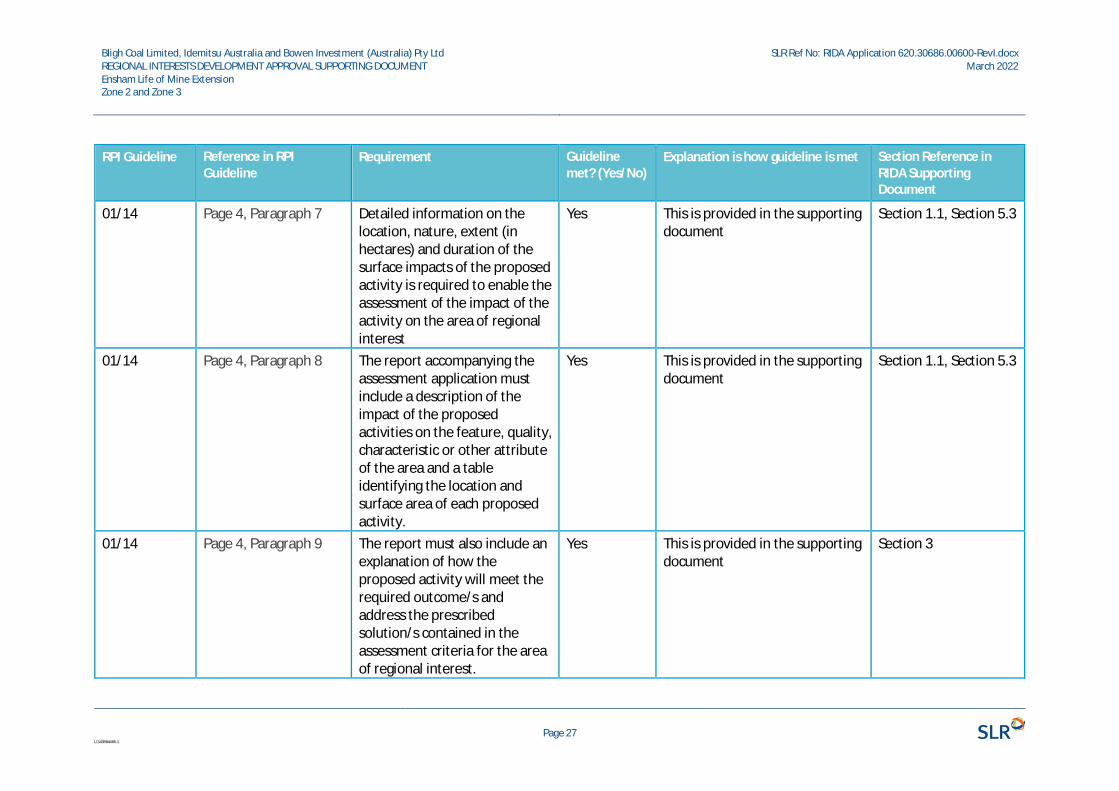
01/14 Page 4, Paragraph 7 Detailed information on thelocation, nature, extent (inhectares) and duration of thesurface impacts of the proposedactivity is required to enable theassessment of the impact of theactivity on the area of regionalinterest
Yes This is provided in the supportingdocument
Section 1.1, Section 5.3
01/14 Page 4, Paragraph 8 The report accompanying theassessment application mustinclude a description of theimpact of the proposedactivities on the feature, quality,characteristic or other attributeof the area and a tableidentifying the location andsurface area of each proposedactivity.
Yes This is provided in the supportingdocument
Section 1.1, Section 5.3
01/14 Page 4, Paragraph 9 The report must also include anexplanation of how theproposed activity will meet therequired outcome/s andaddress the prescribedsolution/s contained in theassessment criteria for the areaof regional interest.
Yes This is provided in the supportingdocument
Section 3
Bligh Coal Limited, Idemitsu Australia and Bowen Investment (Australia) Pty LtdREGIONAL INTERESTS DEVELOPMENT APPROVAL SUPPORTING DOCUMENTEnsham Life of Mine ExtensionZone 2 and Zone 3
SLR Ref No: RIDA Application 620.30686.00600-RevI.docxMarch 2022
Page 28L\343884466.1
RPI Guideline Reference in RPIGuideline
Requirement Guidelinemet? (Yes/No)
Explanation is how guideline is met Section Reference inRIDA SupportingDocument
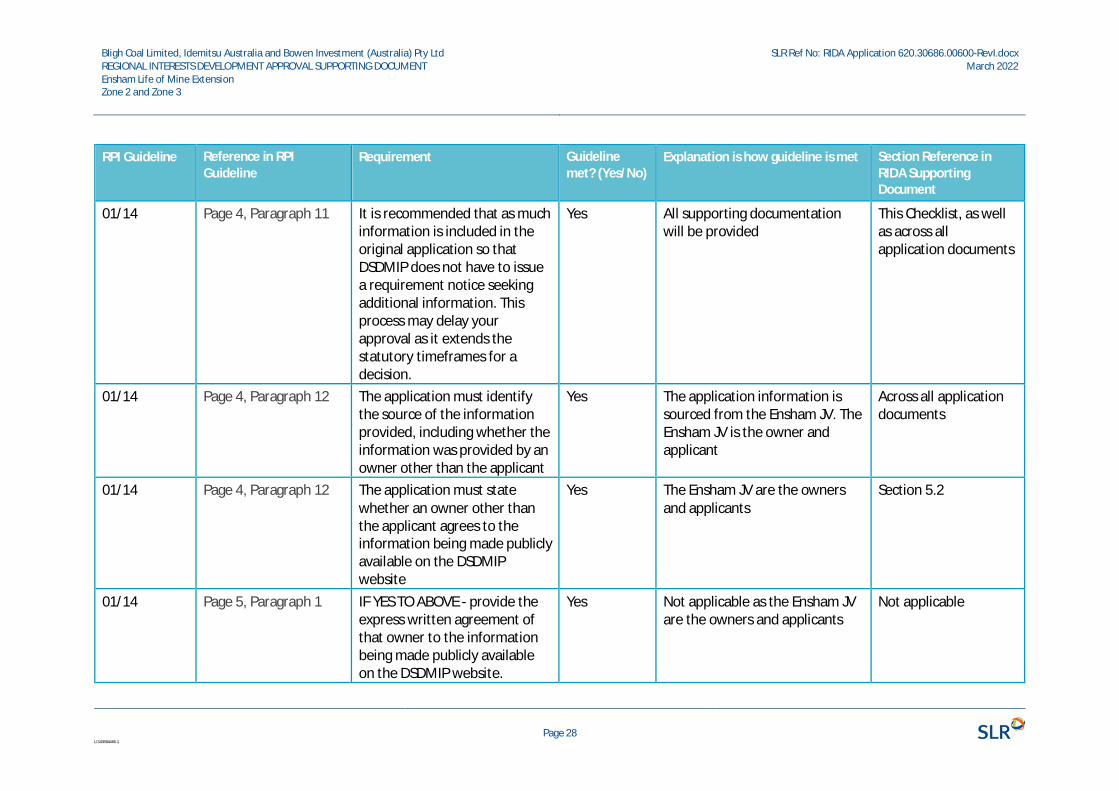
01/14 Page 4, Paragraph 11 It is recommended that as muchinformation is included in theoriginal application so thatDSDMIP does not have to issuea requirement notice seekingadditional information. Thisprocess may delay yourapproval as it extends thestatutory timeframes for adecision.
Yes All supporting documentationwill be provided
This Checklist, as wellas across allapplication documents
01/14 Page 4, Paragraph 12 The application must identifythe source of the informationprovided, including whether theinformation was provided by anowner other than the applicant
Yes The application information issourced from the Ensham JV. TheEnsham JV is the owner andapplicant
Across all applicationdocuments
01/14 Page 4, Paragraph 12 The application must statewhether an owner other thanthe applicant agrees to theinformation being made publiclyavailable on the DSDMIPwebsite
Yes The Ensham JV are the ownersand applicants
Section 5.2
01/14 Page 5, Paragraph 1 IF YES TO ABOVE - provide theexpress written agreement ofthat owner to the informationbeing made publicly availableon the DSDMIP website.
Yes Not applicable as the Ensham JVare the owners and applicants
Not applicable
Bligh Coal Limited, Idemitsu Australia and Bowen Investment (Australia) Pty LtdREGIONAL INTERESTS DEVELOPMENT APPROVAL SUPPORTING DOCUMENTEnsham Life of Mine ExtensionZone 2 and Zone 3
SLR Ref No: RIDA Application 620.30686.00600-RevI.docxMarch 2022
Page 29L\343884466.1
RPI Guideline Reference in RPIGuideline
Requirement Guidelinemet? (Yes/No)
Explanation is how guideline is met Section Reference inRIDA SupportingDocument
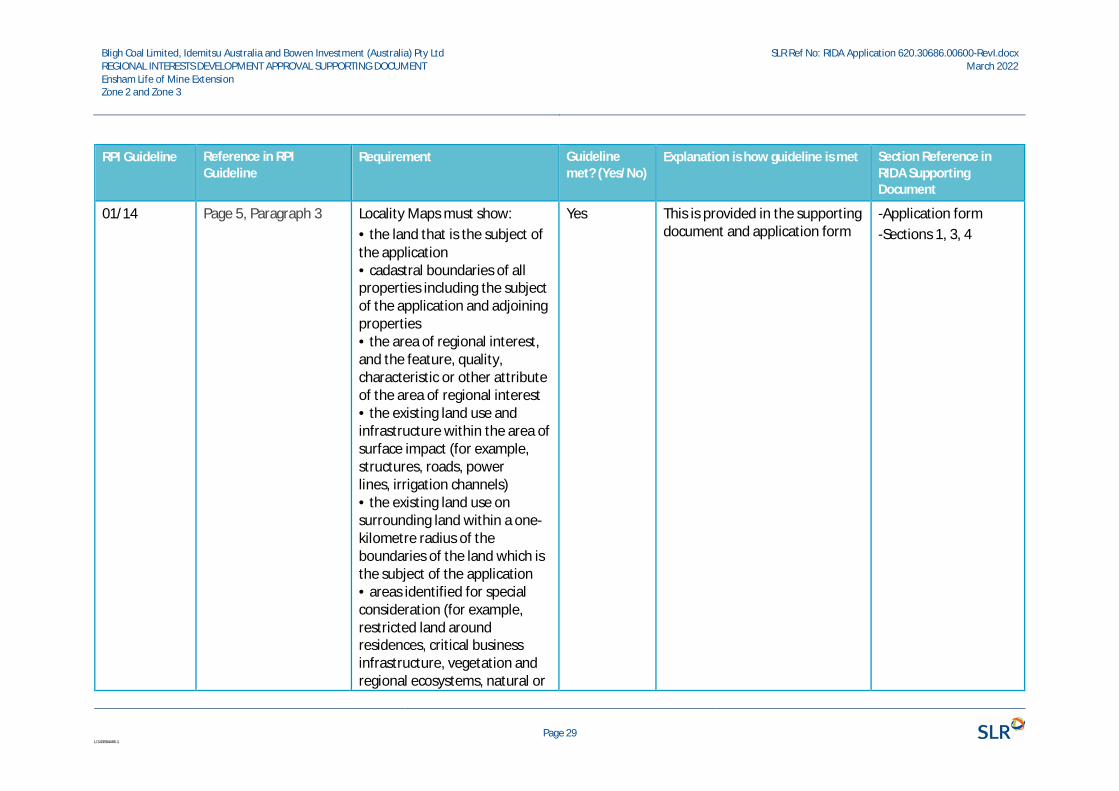
01/14 Page 5, Paragraph 3 Locality Maps must show:• the land that is the subject ofthe application• cadastral boundaries of allproperties including the subjectof the application and adjoiningproperties• the area of regional interest,and the feature, quality,characteristic or other attributeof the area of regional interest• the existing land use andinfrastructure within the area ofsurface impact (for example,structures, roads, powerlines, irrigation channels)• the existing land use onsurrounding land within a one-kilometre radius of theboundaries of the land which isthe subject of the application• areas identified for specialconsideration (for example,restricted land aroundresidences, critical businessinfrastructure, vegetation andregional ecosystems, natural or
Yes This is provided in the supportingdocument and application form
-Application form-Sections 1, 3, 4
Bligh Coal Limited, Idemitsu Australia and Bowen Investment (Australia) Pty LtdREGIONAL INTERESTS DEVELOPMENT APPROVAL SUPPORTING DOCUMENTEnsham Life of Mine ExtensionZone 2 and Zone 3
SLR Ref No: RIDA Application 620.30686.00600-RevI.docxMarch 2022
Page 30L\343884466.1
RPI Guideline Reference in RPIGuideline
Requirement Guidelinemet? (Yes/No)
Explanation is how guideline is met Section Reference inRIDA SupportingDocument
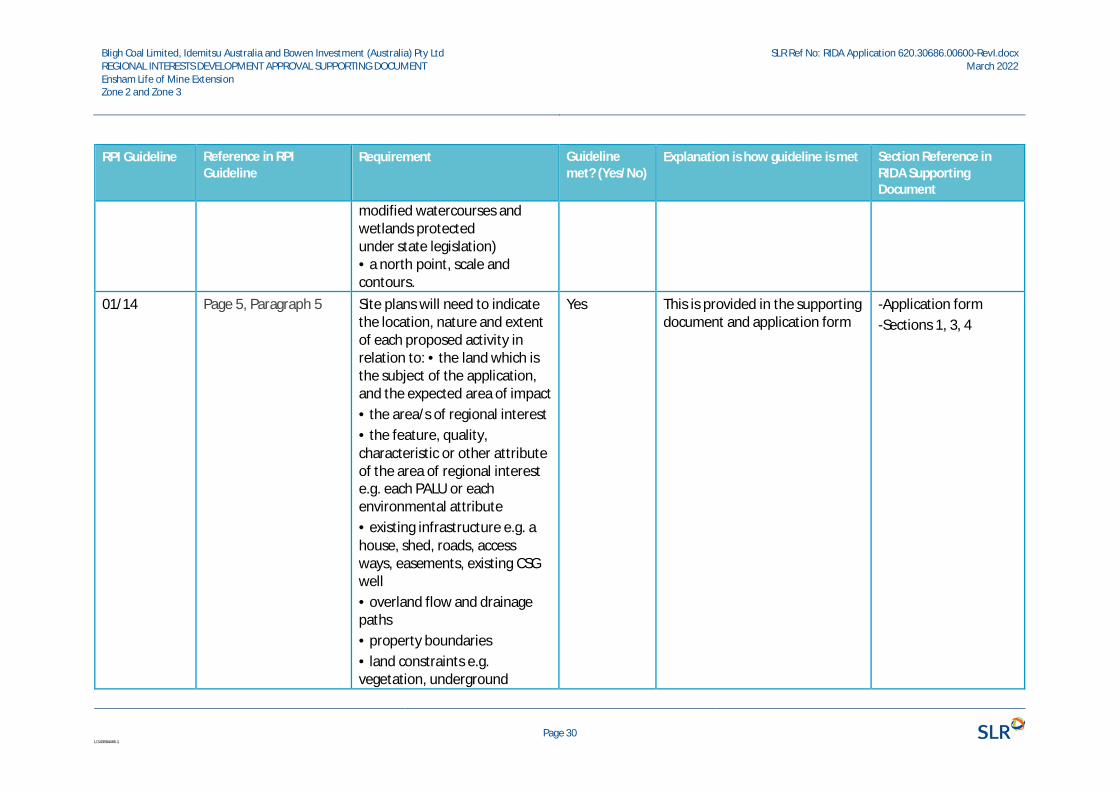
modified watercourses andwetlands protectedunder state legislation)• a north point, scale andcontours.
01/14 Page 5, Paragraph 5 Site plans will need to indicatethe location, nature and extentof each proposed activity inrelation to: • the land which isthe subject of the application,and the expected area of impact• the area/s of regional interest• the feature, quality,characteristic or other attributeof the area of regional intereste.g. each PALU or eachenvironmental attribute• existing infrastructure e.g. ahouse, shed, roads, accessways, easements, existing CSGwell• overland flow and drainagepaths• property boundaries• land constraints e.g.vegetation, underground
Yes This is provided in the supportingdocument and application form
-Application form-Sections 1, 3, 4
Bligh Coal Limited, Idemitsu Australia and Bowen Investment (Australia) Pty LtdREGIONAL INTERESTS DEVELOPMENT APPROVAL SUPPORTING DOCUMENTEnsham Life of Mine ExtensionZone 2 and Zone 3
SLR Ref No: RIDA Application 620.30686.00600-RevI.docxMarch 2022
Page 31L\343884466.1
RPI Guideline Reference in RPIGuideline
Requirement Guidelinemet? (Yes/No)
Explanation is how guideline is met Section Reference inRIDA SupportingDocument
infrastructure, electricitytransmission lines• a north point, scale andcontours.
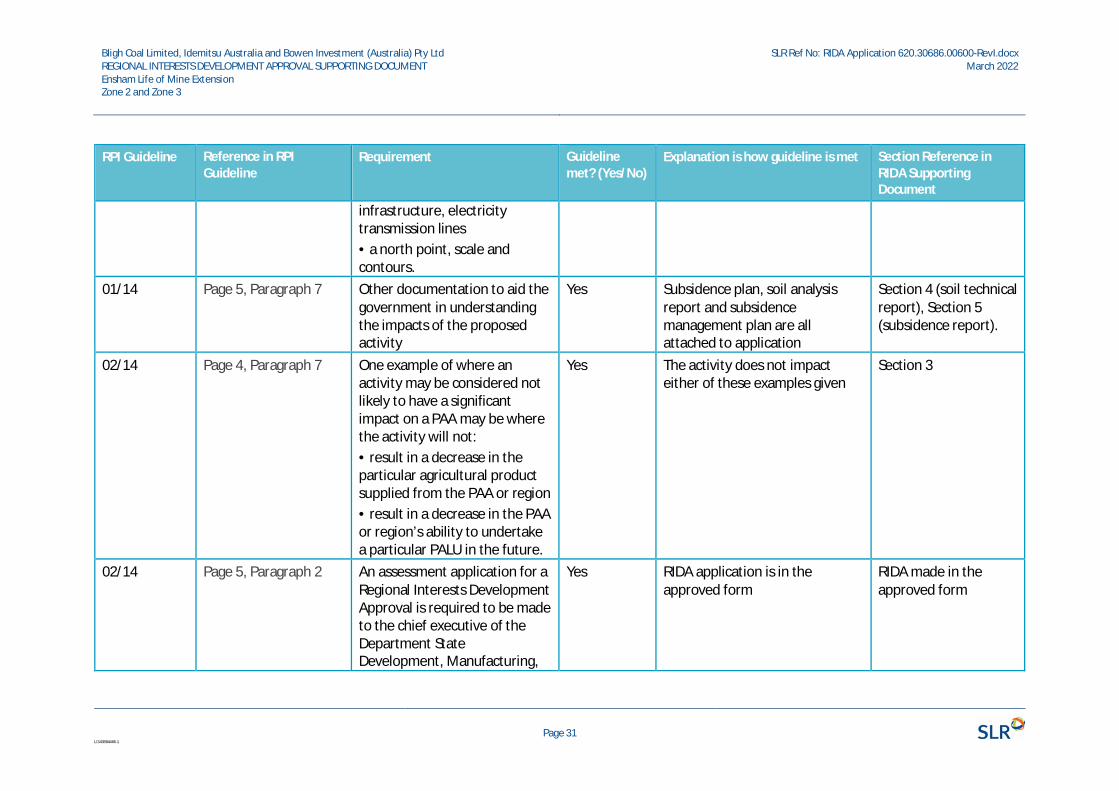
01/14 Page 5, Paragraph 7 Other documentation to aid thegovernment in understandingthe impacts of the proposedactivity
Yes Subsidence plan, soil analysisreport and subsidencemanagement plan are allattached to application
Section 4 (soil technicalreport), Section 5(subsidence report).
02/14 Page 4, Paragraph 7 One example of where anactivity may be considered notlikely to have a significantimpact on a PAA may be wherethe activity will not:• result in a decrease in theparticular agricultural productsupplied from the PAA or region• result in a decrease in the PAAor region’s ability to undertakea particular PALU in the future.
Yes The activity does not impacteither of these examples given
Section 3
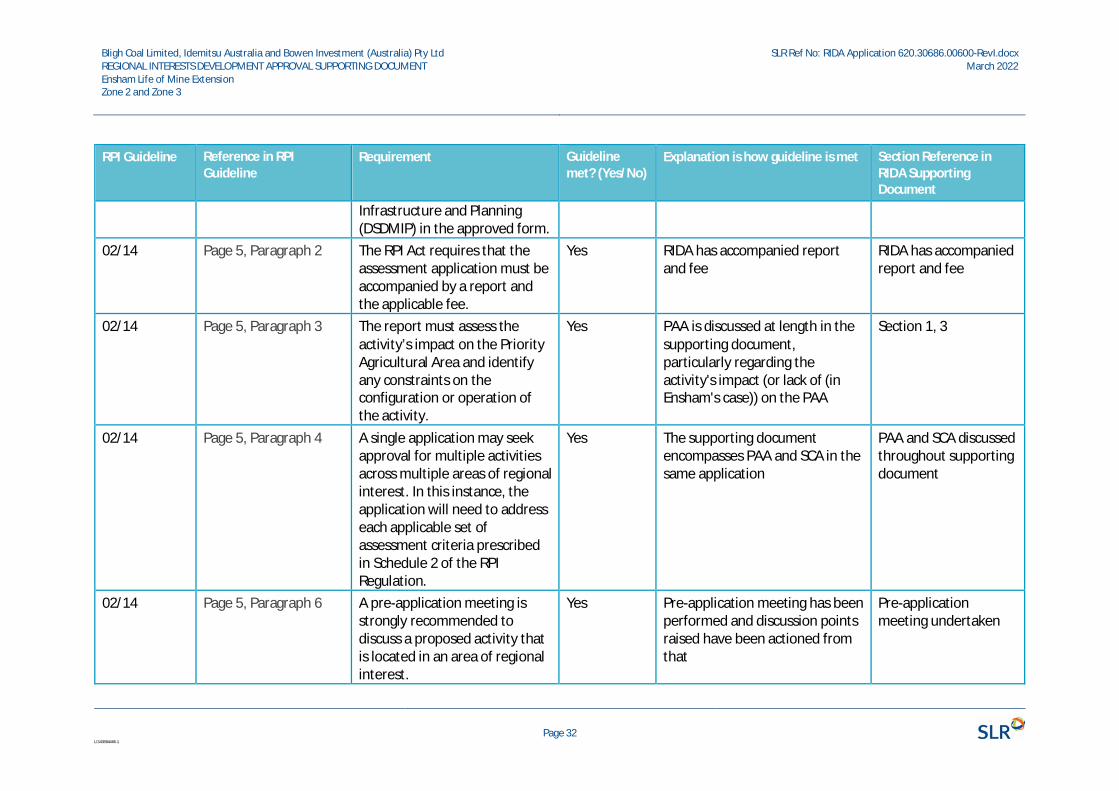
02/14 Page 5, Paragraph 2 An assessment application for aRegional Interests DevelopmentApproval is required to be madeto the chief executive of theDepartment StateDevelopment, Manufacturing,
Yes RIDA application is in theapproved form
RIDA made in theapproved form
Bligh Coal Limited, Idemitsu Australia and Bowen Investment (Australia) Pty LtdREGIONAL INTERESTS DEVELOPMENT APPROVAL SUPPORTING DOCUMENTEnsham Life of Mine ExtensionZone 2 and Zone 3
SLR Ref No: RIDA Application 620.30686.00600-RevI.docxMarch 2022
Page 32L\343884466.1
RPI Guideline Reference in RPIGuideline
Requirement Guidelinemet? (Yes/No)
Explanation is how guideline is met Section Reference inRIDA SupportingDocument
Infrastructure and Planning(DSDMIP) in the approved form.
02/14 Page 5, Paragraph 2 The RPI Act requires that theassessment application must beaccompanied by a report andthe applicable fee.
Yes RIDA has accompanied reportand fee
RIDA has accompaniedreport and fee
02/14 Page 5, Paragraph 3 The report must assess theactivity’s impact on the PriorityAgricultural Area and identifyany constraints on theconfiguration or operation ofthe activity.
Yes PAA is discussed at length in thesupporting document,particularly regarding theactivity's impact (or lack of (inEnsham's case)) on the PAA
Section 1, 3
02/14 Page 5, Paragraph 4 A single application may seekapproval for multiple activitiesacross multiple areas of regionalinterest. In this instance, theapplication will need to addresseach applicable set ofassessment criteria prescribedin Schedule 2 of the RPIRegulation.
Yes The supporting documentencompasses PAA and SCA in thesame application
PAA and SCA discussedthroughout supportingdocument
02/14 Page 5, Paragraph 6 A pre-application meeting isstrongly recommended todiscuss a proposed activity thatis located in an area of regionalinterest.
Yes Pre-application meeting has beenperformed and discussion pointsraised have been actioned fromthat
Pre-applicationmeeting undertaken
Bligh Coal Limited, Idemitsu Australia and Bowen Investment (Australia) Pty LtdREGIONAL INTERESTS DEVELOPMENT APPROVAL SUPPORTING DOCUMENTEnsham Life of Mine ExtensionZone 2 and Zone 3
SLR Ref No: RIDA Application 620.30686.00600-RevI.docxMarch 2022
Page 33L\343884466.1
RPI Guideline Reference in RPIGuideline
Requirement Guidelinemet? (Yes/No)
Explanation is how guideline is met Section Reference inRIDA SupportingDocument
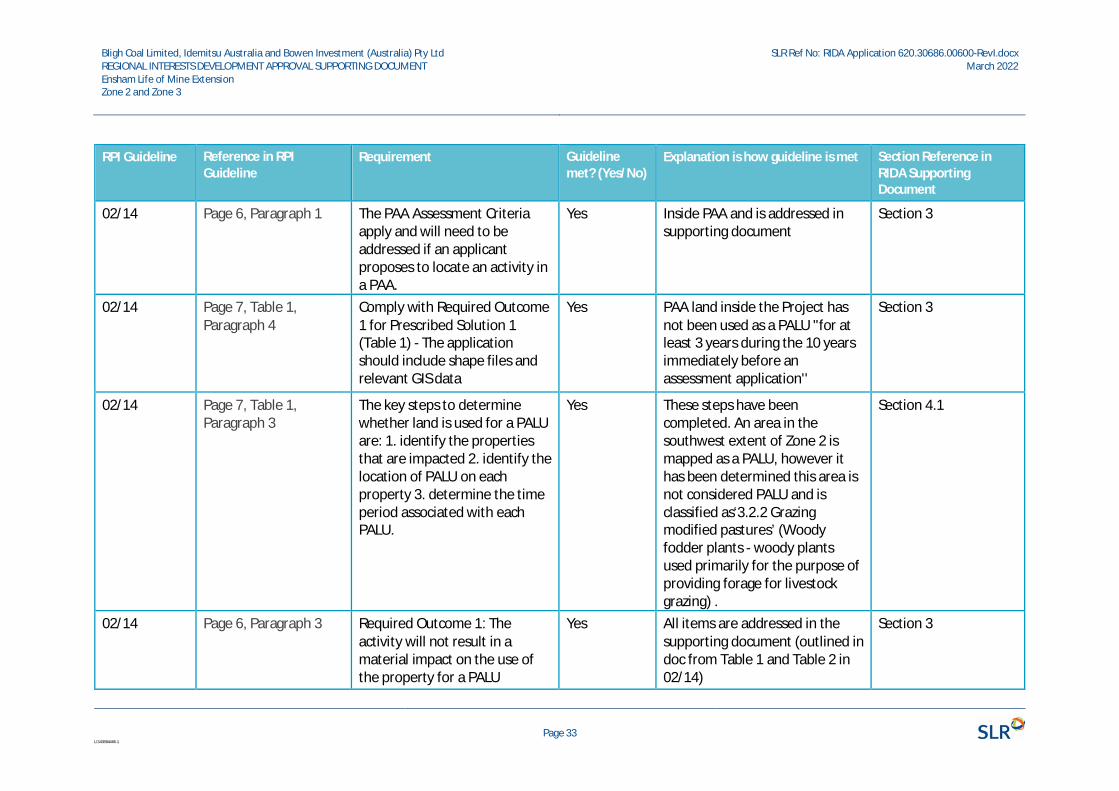
02/14 Page 6, Paragraph 1 The PAA Assessment Criteriaapply and will need to beaddressed if an applicantproposes to locate an activity ina PAA.
Yes Inside PAA and is addressed insupporting document
Section 3
02/14 Page 7, Table 1,Paragraph 4
Comply with Required Outcome1 for Prescribed Solution 1(Table 1) - The applicationshould include shape files andrelevant GIS data
Yes PAA land inside the Project hasnot been used as a PALU "for atleast 3 years during the 10 yearsimmediately before anassessment application''
Section 3
02/14 Page 7, Table 1,Paragraph 3
The key steps to determinewhether land is used for a PALUare: 1. identify the propertiesthat are impacted 2. identify thelocation of PALU on eachproperty 3. determine the timeperiod associated with eachPALU.
Yes These steps have beencompleted. An area in thesouthwest extent of Zone 2 ismapped as a PALU, however ithas been determined this area isnot considered PALU and isclassified as‘3.2.2 Grazingmodified pastures’ (Woodyfodder plants - woody plantsused primarily for the purpose ofproviding forage for livestockgrazing) .
Section 4.1
02/14 Page 6, Paragraph 3 Required Outcome 1: Theactivity will not result in amaterial impact on the use ofthe property for a PALU
Yes All items are addressed in thesupporting document (outlined indoc from Table 1 and Table 2 in02/14)
Section 3
Bligh Coal Limited, Idemitsu Australia and Bowen Investment (Australia) Pty LtdREGIONAL INTERESTS DEVELOPMENT APPROVAL SUPPORTING DOCUMENTEnsham Life of Mine ExtensionZone 2 and Zone 3
SLR Ref No: RIDA Application 620.30686.00600-RevI.docxMarch 2022
Page 34L\343884466.1
RPI Guideline Reference in RPIGuideline
Requirement Guidelinemet? (Yes/No)
Explanation is how guideline is met Section Reference inRIDA SupportingDocument
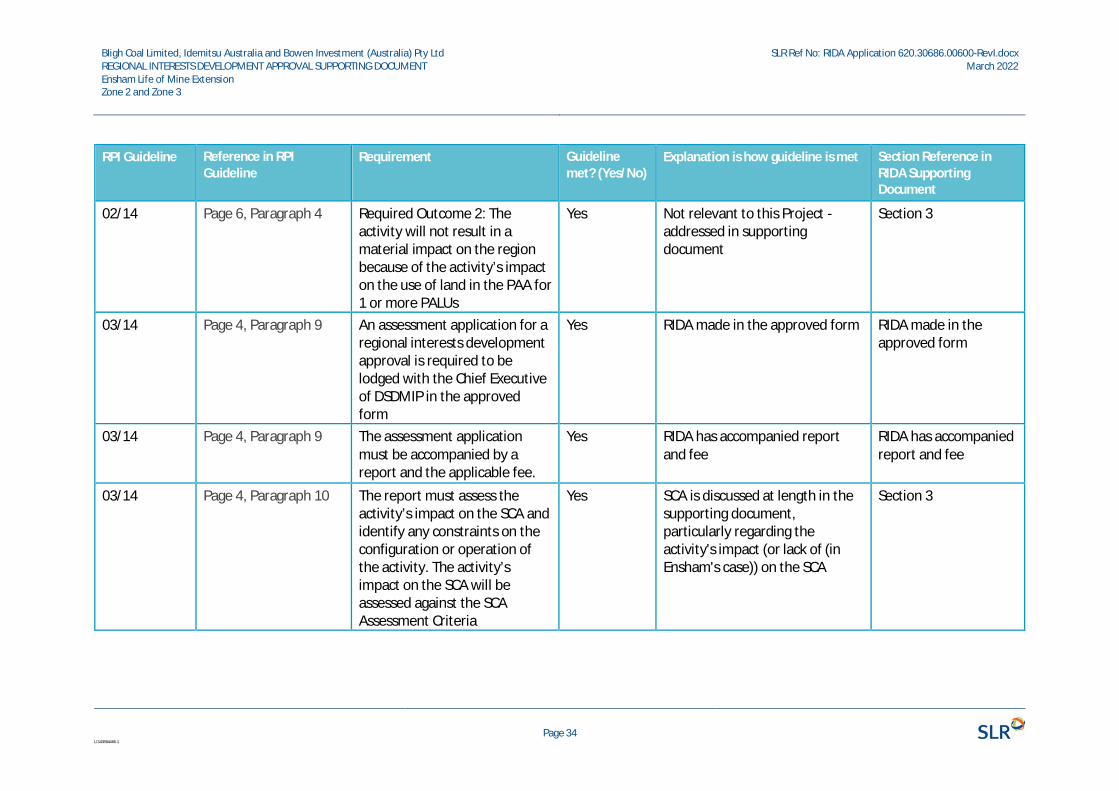
02/14 Page 6, Paragraph 4 Required Outcome 2: Theactivity will not result in amaterial impact on the regionbecause of the activity’s impacton the use of land in the PAA for1 or more PALUs
Yes Not relevant to this Project -addressed in supportingdocument
Section 3
03/14 Page 4, Paragraph 9 An assessment application for aregional interests developmentapproval is required to belodged with the Chief Executiveof DSDMIP in the approvedform
Yes RIDA made in the approved form RIDA made in theapproved form
03/14 Page 4, Paragraph 9 The assessment applicationmust be accompanied by areport and the applicable fee.
Yes RIDA has accompanied reportand fee
RIDA has accompaniedreport and fee
03/14 Page 4, Paragraph 10 The report must assess theactivity’s impact on the SCA andidentify any constraints on theconfiguration or operation ofthe activity. The activity’simpact on the SCA will beassessed against the SCAAssessment Criteria
Yes SCA is discussed at length in thesupporting document,particularly regarding theactivity's impact (or lack of (inEnsham's case)) on the SCA
Section 3
Bligh Coal Limited, Idemitsu Australia and Bowen Investment (Australia) Pty LtdREGIONAL INTERESTS DEVELOPMENT APPROVAL SUPPORTING DOCUMENTEnsham Life of Mine ExtensionZone 2 and Zone 3
SLR Ref No: RIDA Application 620.30686.00600-RevI.docxMarch 2022
Page 35L\343884466.1
RPI Guideline Reference in RPIGuideline
Requirement Guidelinemet? (Yes/No)
Explanation is how guideline is met Section Reference inRIDA SupportingDocument
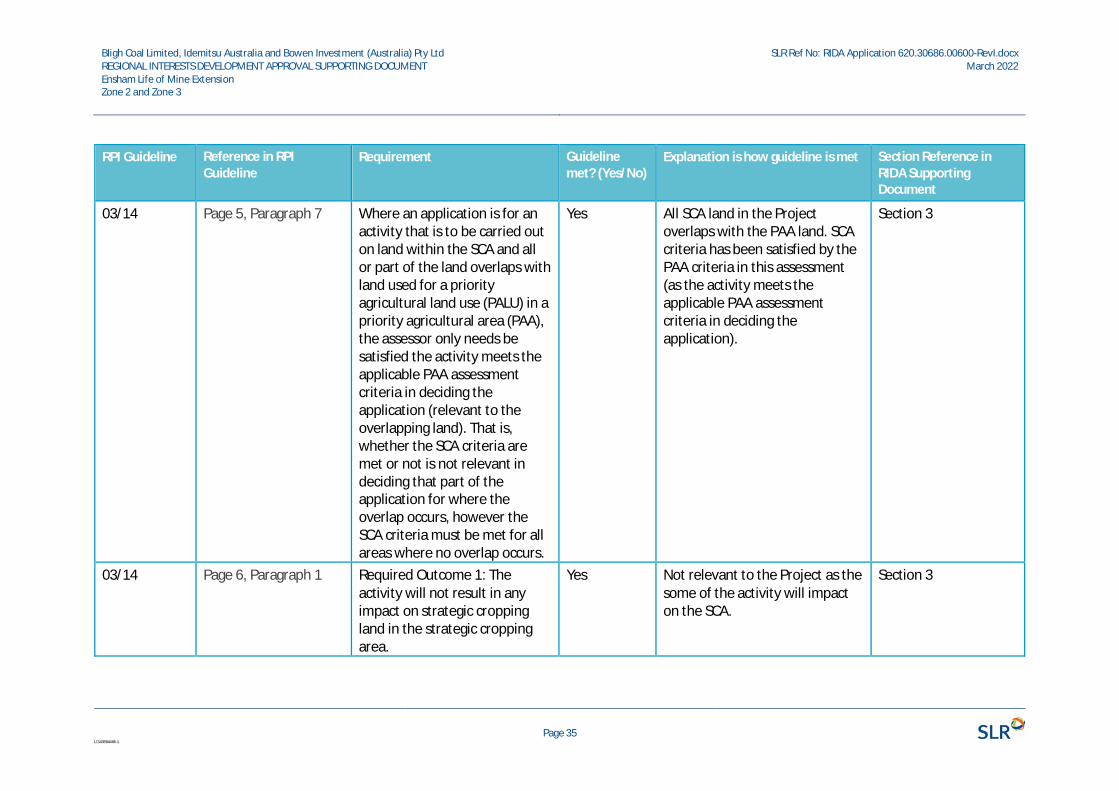
03/14 Page 5, Paragraph 7 Where an application is for anactivity that is to be carried outon land within the SCA and allor part of the land overlaps withland used for a priorityagricultural land use (PALU) in apriority agricultural area (PAA),the assessor only needs besatisfied the activity meets theapplicable PAA assessmentcriteria in deciding theapplication (relevant to theoverlapping land). That is,whether the SCA criteria aremet or not is not relevant indeciding that part of theapplication for where theoverlap occurs, however theSCA criteria must be met for allareas where no overlap occurs.
Yes All SCA land in the Projectoverlaps with the PAA land. SCAcriteria has been satisfied by thePAA criteria in this assessment(as the activity meets theapplicable PAA assessmentcriteria in deciding theapplication).
Section 3
03/14 Page 6, Paragraph 1 Required Outcome 1: Theactivity will not result in anyimpact on strategic croppingland in the strategic croppingarea.
Yes Not relevant to the Project as thesome of the activity will impacton the SCA.
Section 3
Bligh Coal Limited, Idemitsu Australia and Bowen Investment (Australia) Pty LtdREGIONAL INTERESTS DEVELOPMENT APPROVAL SUPPORTING DOCUMENTEnsham Life of Mine ExtensionZone 2 and Zone 3
SLR Ref No: RIDA Application 620.30686.00600-RevI.docxMarch 2022
Page 36L\343884466.1
RPI Guideline Reference in RPIGuideline
Requirement Guidelinemet? (Yes/No)
Explanation is how guideline is met Section Reference inRIDA SupportingDocument
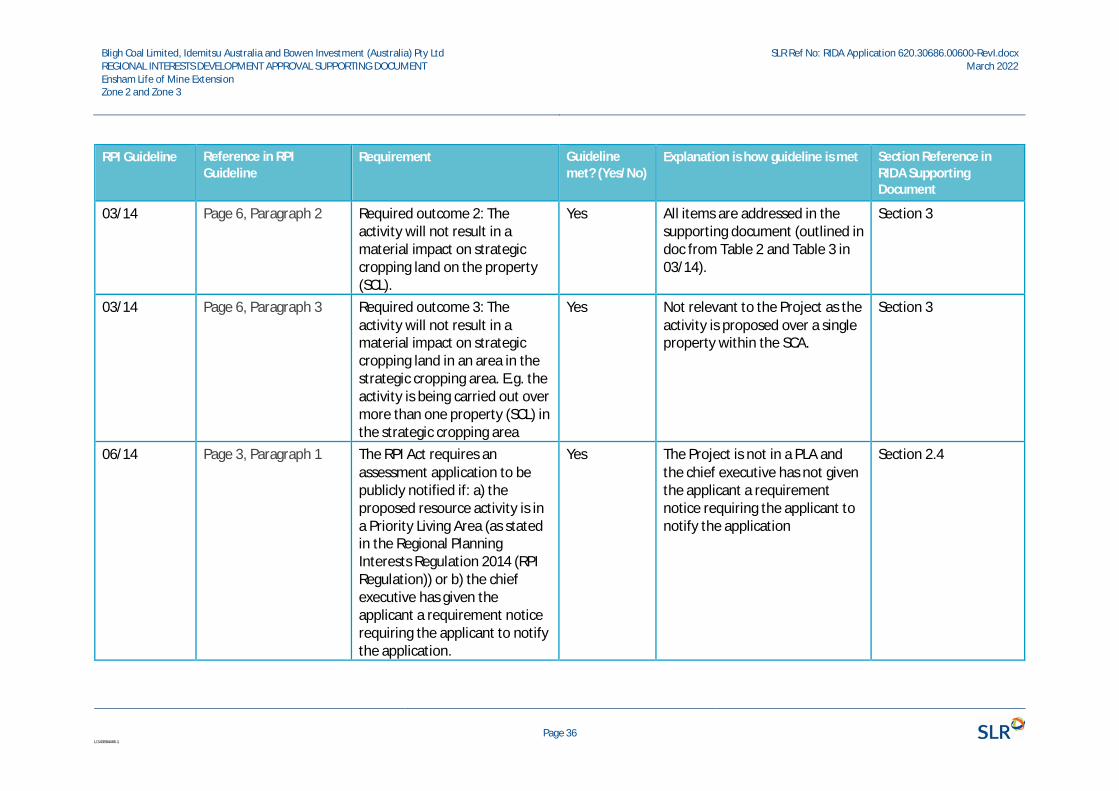
03/14 Page 6, Paragraph 2 Required outcome 2: Theactivity will not result in amaterial impact on strategiccropping land on the property(SCL).
Yes All items are addressed in thesupporting document (outlined indoc from Table 2 and Table 3 in03/14).
Section 3
03/14 Page 6, Paragraph 3 Required outcome 3: Theactivity will not result in amaterial impact on strategiccropping land in an area in thestrategic cropping area. E.g. theactivity is being carried out overmore than one property (SCL) inthe strategic cropping area
Yes Not relevant to the Project as theactivity is proposed over a singleproperty within the SCA.
Section 3
06/14 Page 3, Paragraph 1 The RPI Act requires anassessment application to bepublicly notified if: a) theproposed resource activity is ina Priority Living Area (as statedin the Regional PlanningInterests Regulation 2014 (RPIRegulation)) or b) the chiefexecutive has given theapplicant a requirement noticerequiring the applicant to notifythe application.
Yes The Project is not in a PLA andthe chief executive has not giventhe applicant a requirementnotice requiring the applicant tonotify the application
Section 2.4
Bligh Coal Limited, Idemitsu Australia and Bowen Investment (Australia) Pty LtdREGIONAL INTERESTS DEVELOPMENT APPROVAL SUPPORTING DOCUMENTEnsham Life of Mine ExtensionZone 2 and Zone 3
SLR Ref No: RIDA Application 620.30686.00600-RevI.docxMarch 2022
Page 37L\343884466.1
RPI Guideline Reference in RPIGuideline
Requirement Guidelinemet? (Yes/No)
Explanation is how guideline is met Section Reference inRIDA SupportingDocument
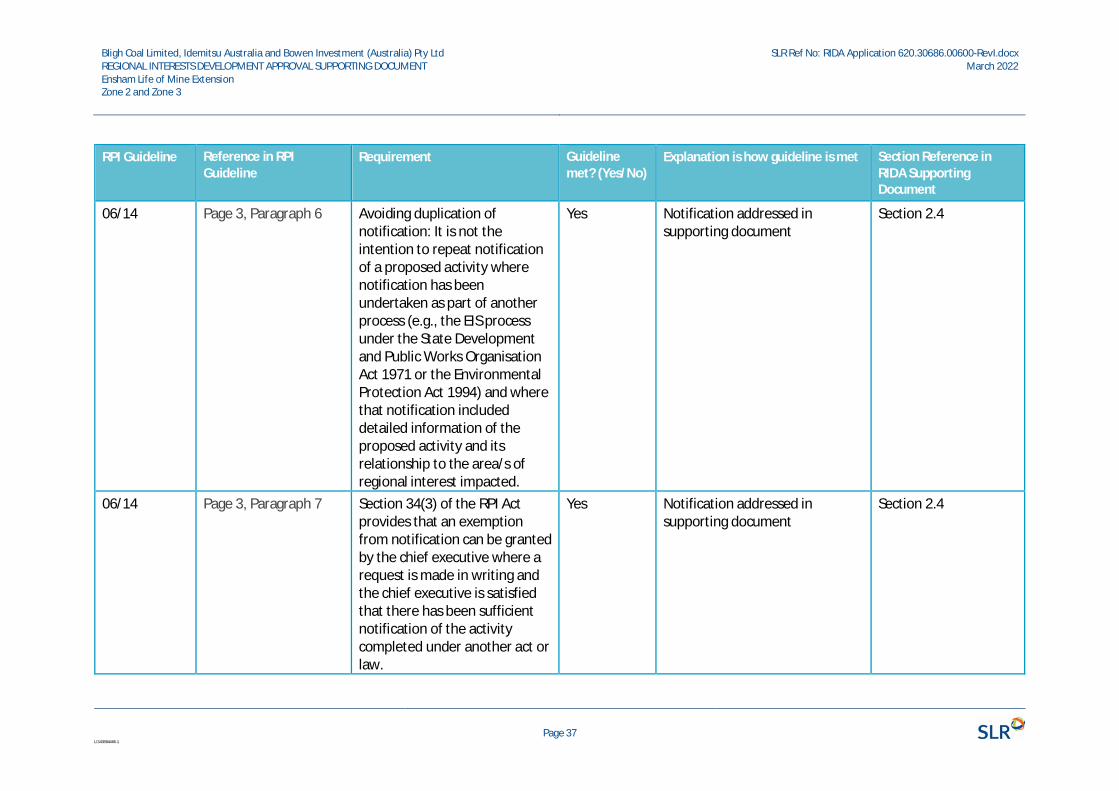
06/14 Page 3, Paragraph 6 Avoiding duplication ofnotification: It is not theintention to repeat notificationof a proposed activity wherenotification has beenundertaken as part of anotherprocess (e.g., the EIS processunder the State Developmentand Public Works OrganisationAct 1971 or the EnvironmentalProtection Act 1994) and wherethat notification includeddetailed information of theproposed activity and itsrelationship to the area/s ofregional interest impacted.
Yes Notification addressed insupporting document
Section 2.4
06/14 Page 3, Paragraph 7 Section 34(3) of the RPI Actprovides that an exemptionfrom notification can be grantedby the chief executive where arequest is made in writing andthe chief executive is satisfiedthat there has been sufficientnotification of the activitycompleted under another act orlaw.
Yes Notification addressed insupporting document
Section 2.4
Bligh Coal Limited, Idemitsu Australia and Bowen Investment (Australia) Pty LtdREGIONAL INTERESTS DEVELOPMENT APPROVAL SUPPORTING DOCUMENTEnsham Life of Mine ExtensionZone 2 and Zone 3
SLR Ref No: RIDA Application 620.30686.00600-RevI.docxMarch 2022
Page 38L\343884466.1
RPI Guideline Reference in RPIGuideline
Requirement Guidelinemet? (Yes/No)
Explanation is how guideline is met Section Reference inRIDA SupportingDocument
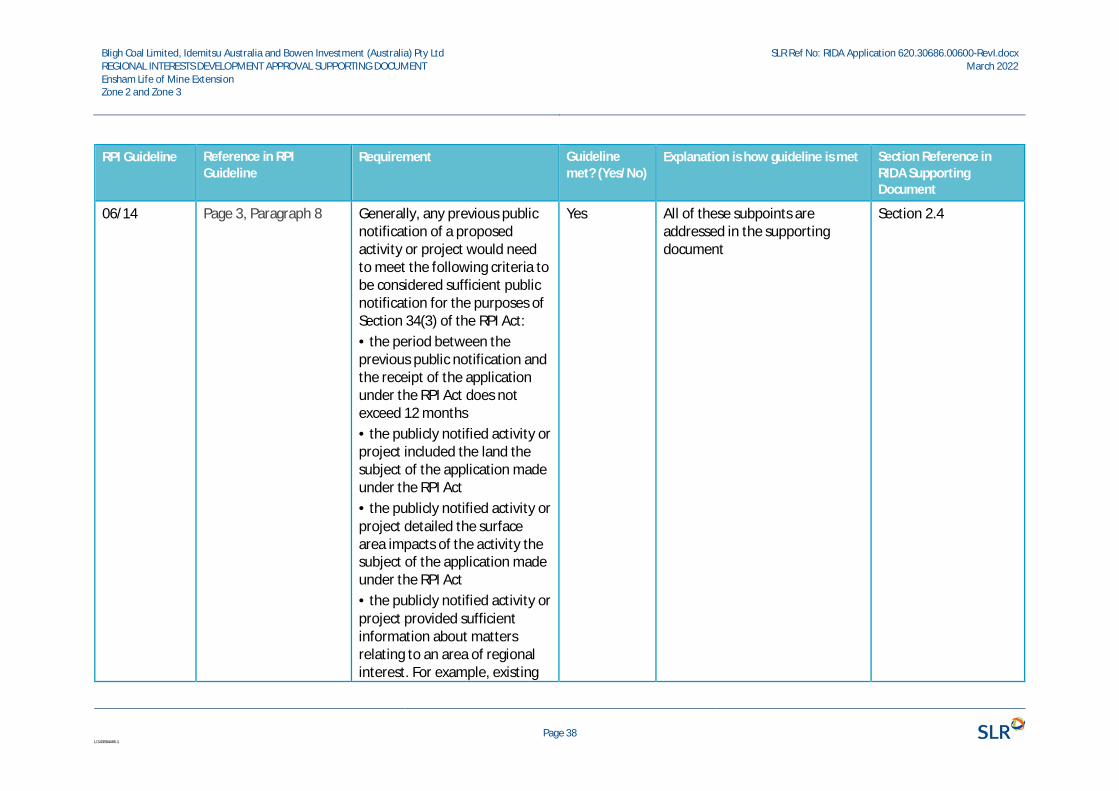
06/14 Page 3, Paragraph 8 Generally, any previous publicnotification of a proposedactivity or project would needto meet the following criteria tobe considered sufficient publicnotification for the purposes ofSection 34(3) of the RPI Act:• the period between theprevious public notification andthe receipt of the applicationunder the RPI Act does notexceed 12 months• the publicly notified activity orproject included the land thesubject of the application madeunder the RPI Act• the publicly notified activity orproject detailed the surfacearea impacts of the activity thesubject of the application madeunder the RPI Act• the publicly notified activity orproject provided sufficientinformation about mattersrelating to an area of regionalinterest. For example, existing
Yes All of these subpoints areaddressed in the supportingdocument
Section 2.4
Bligh Coal Limited, Idemitsu Australia and Bowen Investment (Australia) Pty LtdREGIONAL INTERESTS DEVELOPMENT APPROVAL SUPPORTING DOCUMENTEnsham Life of Mine ExtensionZone 2 and Zone 3
SLR Ref No: RIDA Application 620.30686.00600-RevI.docxMarch 2022
Page 39L\343884466.1
RPI Guideline Reference in RPIGuideline
Requirement Guidelinemet? (Yes/No)
Explanation is how guideline is met Section Reference inRIDA SupportingDocument
land uses on the site and theimpact of the proposedresource activity on the town.
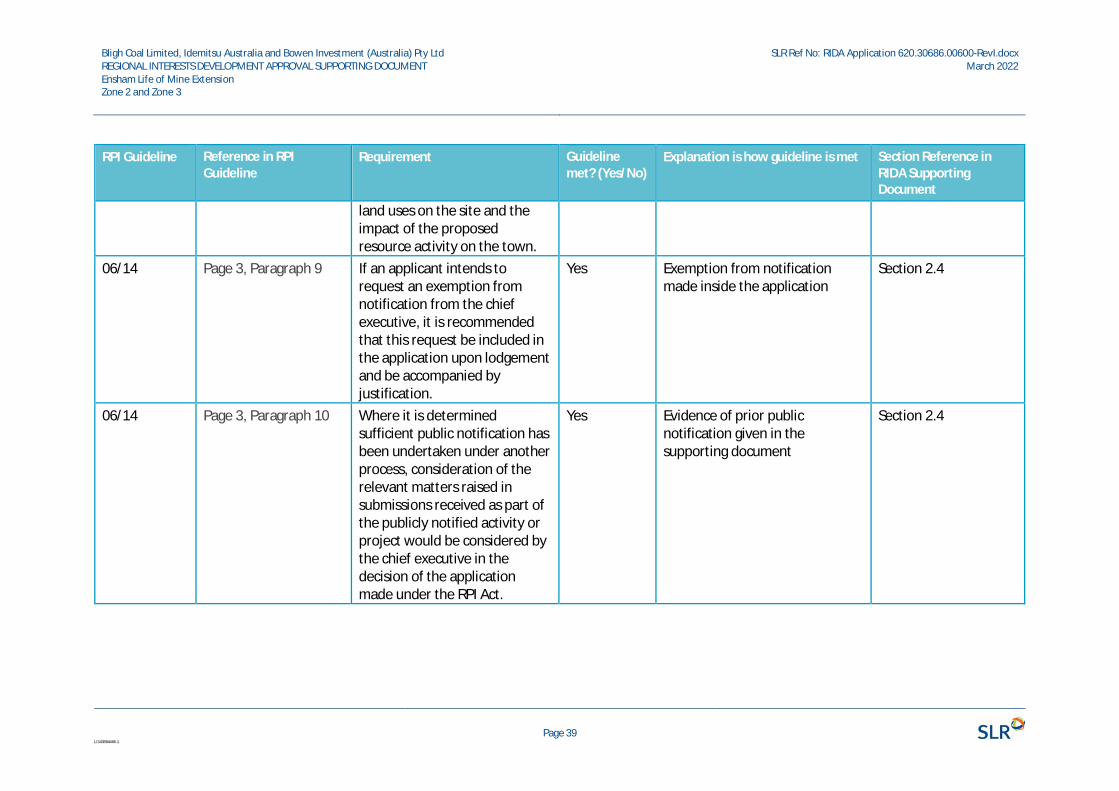
06/14 Page 3, Paragraph 9 If an applicant intends torequest an exemption fromnotification from the chiefexecutive, it is recommendedthat this request be included inthe application upon lodgementand be accompanied byjustification.
Yes Exemption from notificationmade inside the application
Section 2.4
06/14 Page 3, Paragraph 10 Where it is determinedsufficient public notification hasbeen undertaken under anotherprocess, consideration of therelevant matters raised insubmissions received as part ofthe publicly notified activity orproject would be considered bythe chief executive in thedecision of the applicationmade under the RPI Act.
Yes Evidence of prior publicnotification given in thesupporting document
Section 2.4
Bligh Coal Limited, Idemitsu Australia and Bowen Investment (Australia)Pty LtdREGIONAL INTERESTS DEVELOPMENT APPROVAL SUPPORTINGDOCUMENTEnsham Life of Mine ExtensionZone 2 and Zone 3
SLR Ref No: RIDA Application 620.30686.00600-RevI.docxMarch 2022
Page 40L\343884466.1
4 Assessment Against RPI Regulation Required Outcomes
4.1 Priority Agricultural Area (RPI Regulation, Schedule 2, Part 2)
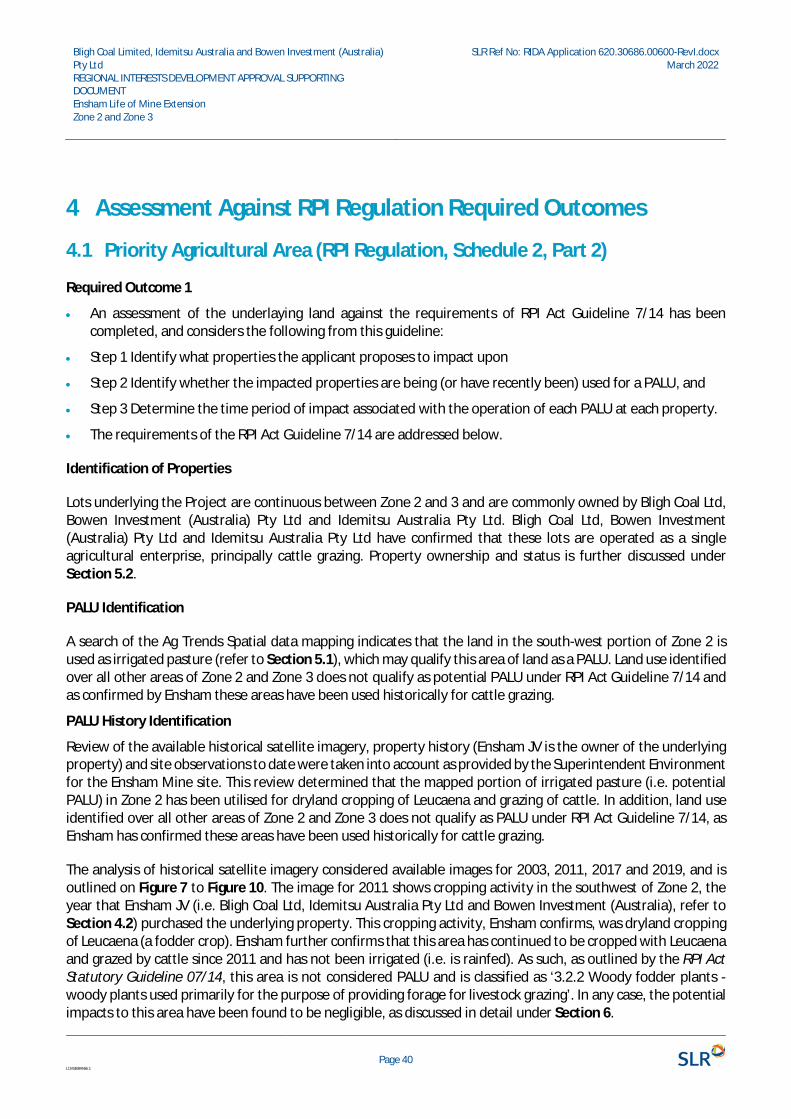
Required Outcome 1
· An assessment of the underlaying land against the requirements of RPI Act Guideline 7/14 has beencompleted, and considers the following from this guideline:
· Step 1 Identify what properties the applicant proposes to impact upon
· Step 2 Identify whether the impacted properties are being (or have recently been) used for a PALU, and
· Step 3 Determine the time period of impact associated with the operation of each PALU at each property.
· The requirements of the RPI Act Guideline 7/14 are addressed below.
Identification of Properties
Lots underlying the Project are continuous between Zone 2 and 3 and are commonly owned by Bligh Coal Ltd,Bowen Investment (Australia) Pty Ltd and Idemitsu Australia Pty Ltd. Bligh Coal Ltd, Bowen Investment(Australia) Pty Ltd and Idemitsu Australia Pty Ltd have confirmed that these lots are operated as a singleagricultural enterprise, principally cattle grazing. Property ownership and status is further discussed underSection 5.2.
PALU Identification
A search of the Ag Trends Spatial data mapping indicates that the land in the south-west portion of Zone 2 isused as irrigated pasture (refer to Section 5.1), which may qualify this area of land as a PALU. Land use identifiedover all other areas of Zone 2 and Zone 3 does not qualify as potential PALU under RPI Act Guideline 7/14 andas confirmed by Ensham these areas have been used historically for cattle grazing.
PALU History Identification
Review of the available historical satellite imagery, property history (Ensham JV is the owner of the underlyingproperty) and site observations to date were taken into account as provided by the Superintendent Environmentfor the Ensham Mine site. This review determined that the mapped portion of irrigated pasture (i.e. potentialPALU) in Zone 2 has been utilised for dryland cropping of Leucaena and grazing of cattle. In addition, land useidentified over all other areas of Zone 2 and Zone 3 does not qualify as PALU under RPI Act Guideline 7/14, asEnsham has confirmed these areas have been used historically for cattle grazing.
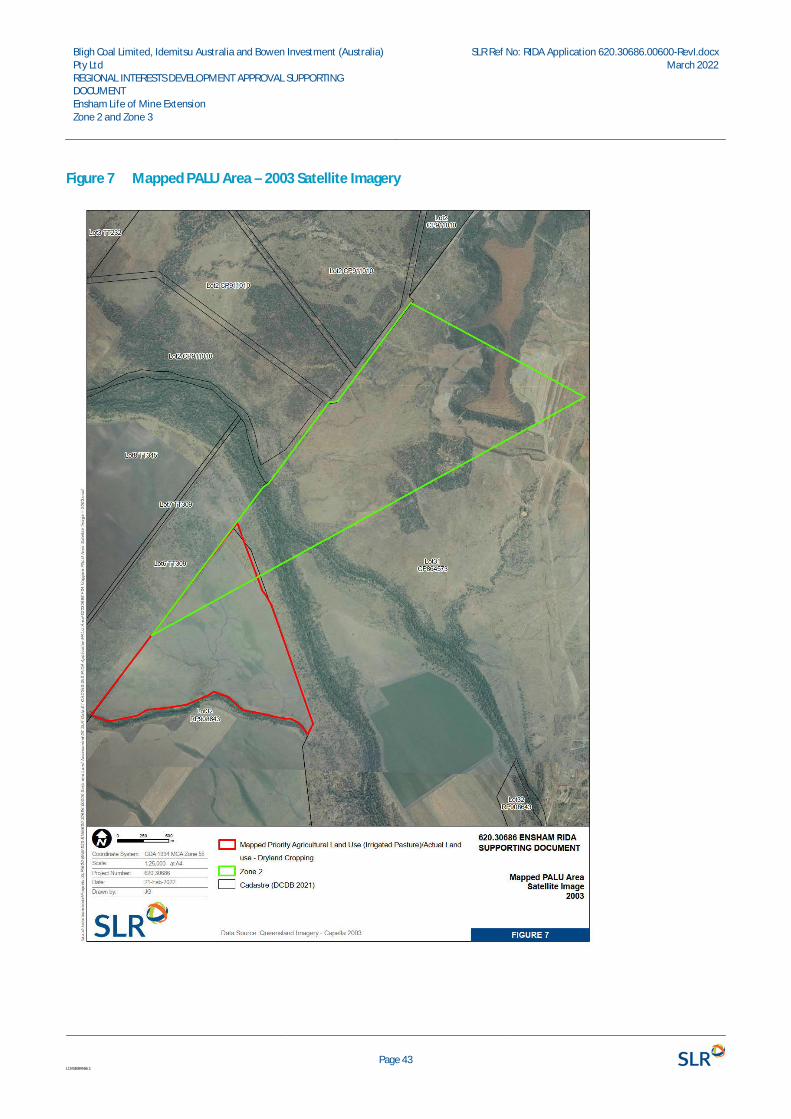
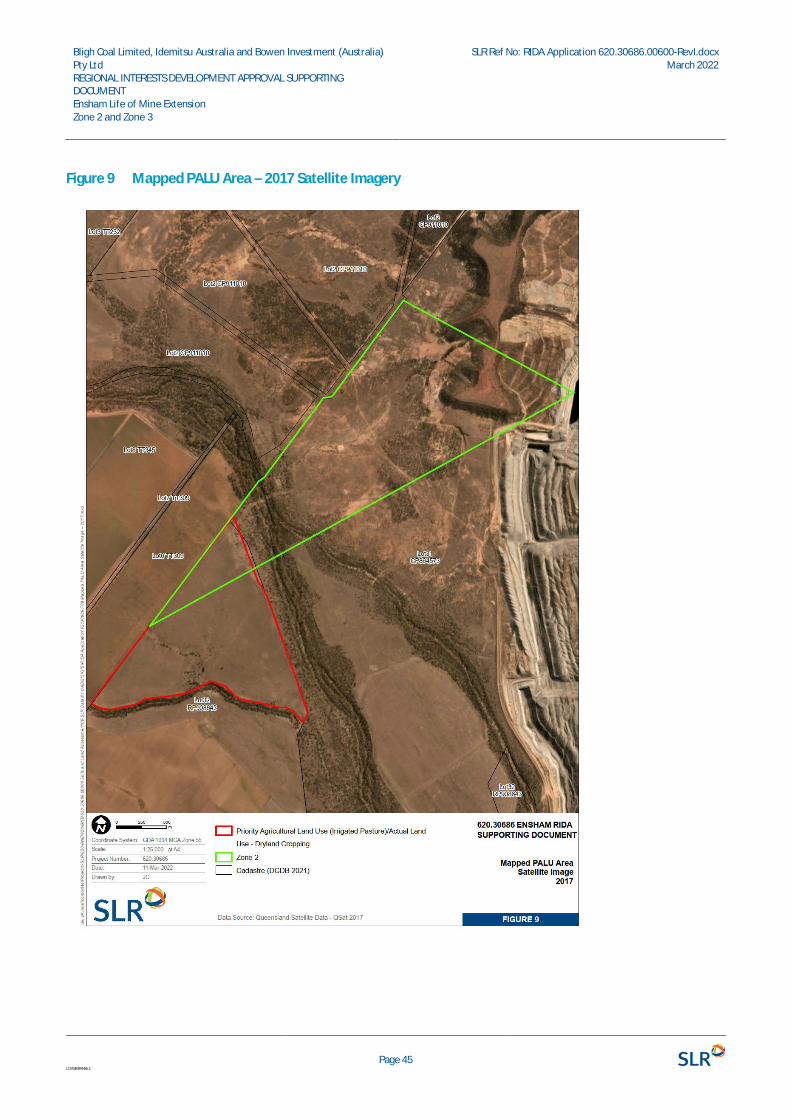
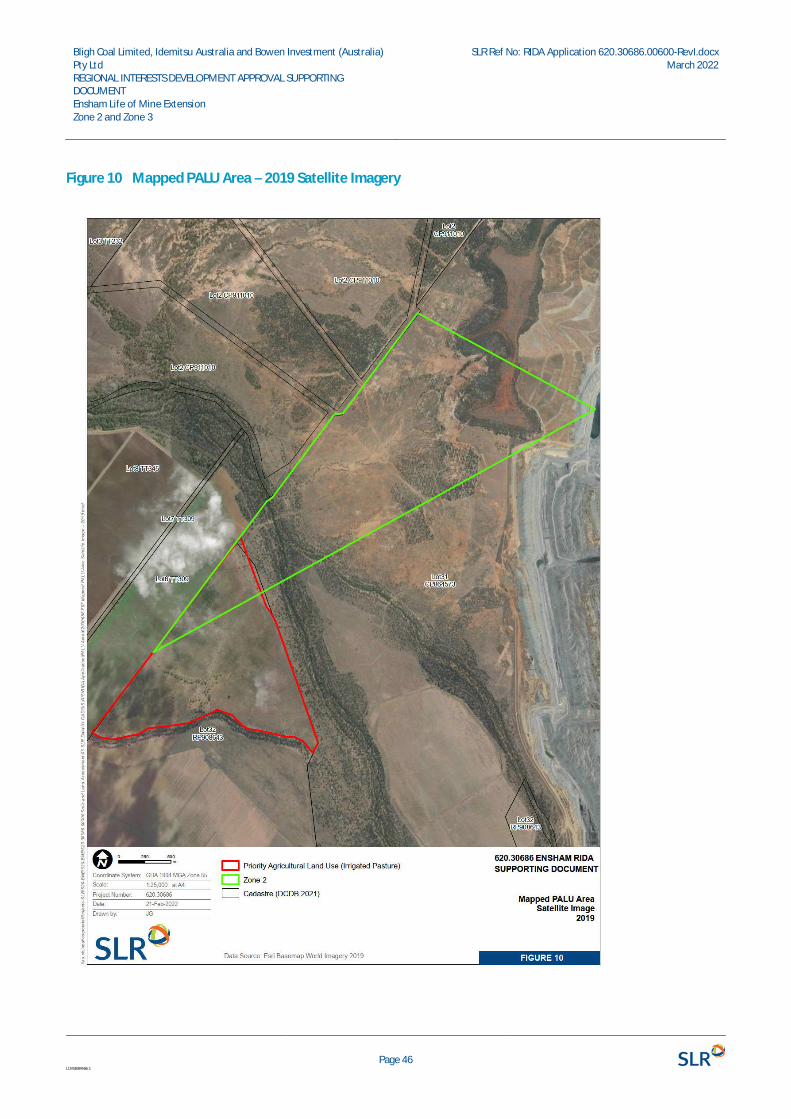
The analysis of historical satellite imagery considered available images for 2003, 2011, 2017 and 2019, and isoutlined on Figure 7 to Figure 10. The image for 2011 shows cropping activity in the southwest of Zone 2, theyear that Ensham JV (i.e. Bligh Coal Ltd, Idemitsu Australia Pty Ltd and Bowen Investment (Australia), refer toSection 4.2) purchased the underlying property. This cropping activity, Ensham confirms, was dryland croppingof Leucaena (a fodder crop). Ensham further confirms that this area has continued to be cropped with Leucaenaand grazed by cattle since 2011 and has not been irrigated (i.e. is rainfed). As such, as outlined by the RPI ActStatutory Guideline 07/14, this area is not considered PALU and is classified as ‘3.2.2 Woody fodder plants -woody plants used primarily for the purpose of providing forage for livestock grazing’. In any case, the potentialimpacts to this area have been found to be negligible, as discussed in detail under Section 6.
Bligh Coal Limited, Idemitsu Australia and Bowen Investment (Australia)Pty LtdREGIONAL INTERESTS DEVELOPMENT APPROVAL SUPPORTINGDOCUMENTEnsham Life of Mine ExtensionZone 2 and Zone 3
SLR Ref No: RIDA Application 620.30686.00600-RevI.docxMarch 2022
Page 41L\343884466.1
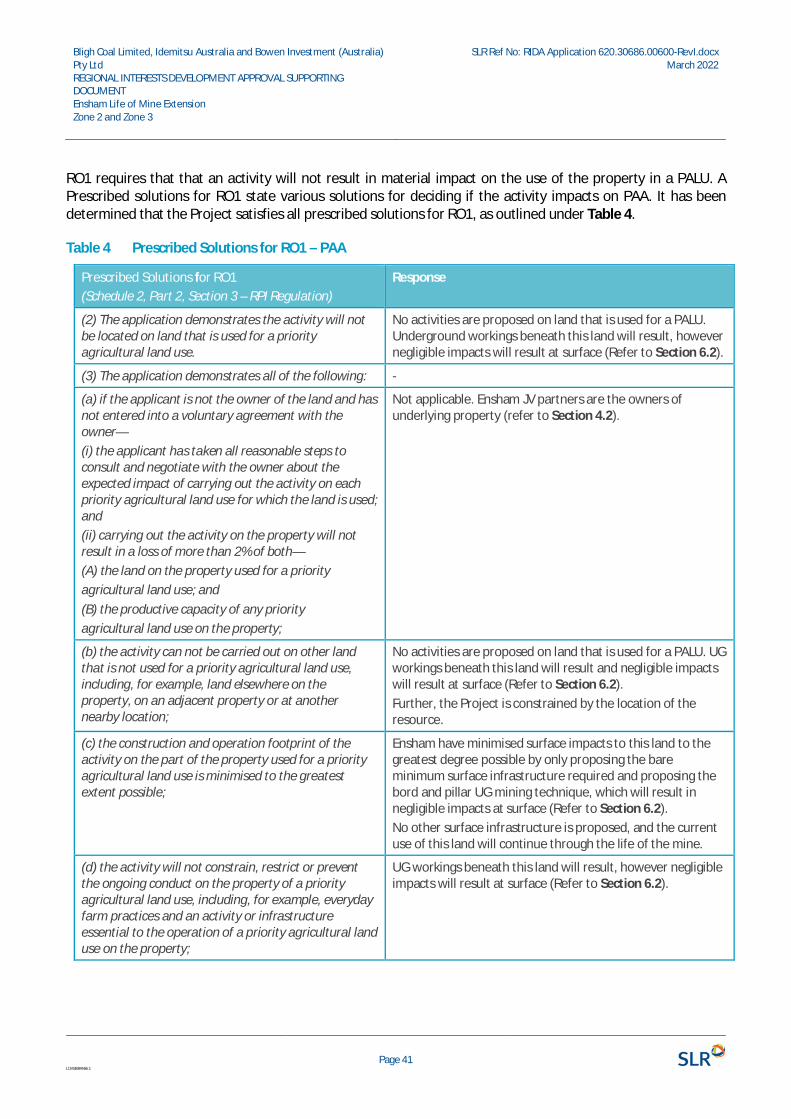
RO1 requires that that an activity will not result in material impact on the use of the property in a PALU. APrescribed solutions for RO1 state various solutions for deciding if the activity impacts on PAA. It has beendetermined that the Project satisfies all prescribed solutions for RO1, as outlined under Table 4.
Table 4 Prescribed Solutions for RO1 – PAA
Prescribed Solutions for RO1(Schedule 2, Part 2, Section 3 – RPI Regulation)
Response
(2) The application demonstrates the activity will notbe located on land that is used for a priorityagricultural land use.
No activities are proposed on land that is used for a PALU.Underground workings beneath this land will result, howevernegligible impacts will result at surface (Refer to Section 6.2).
(3) The application demonstrates all of the following: -
(a) if the applicant is not the owner of the land and hasnot entered into a voluntary agreement with theowner—(i) the applicant has taken all reasonable steps toconsult and negotiate with the owner about theexpected impact of carrying out the activity on eachpriority agricultural land use for which the land is used;and(ii) carrying out the activity on the property will notresult in a loss of more than 2% of both—(A) the land on the property used for a priorityagricultural land use; and(B) the productive capacity of any priorityagricultural land use on the property;
Not applicable. Ensham JV partners are the owners ofunderlying property (refer to Section 4.2).
(b) the activity can not be carried out on other landthat is not used for a priority agricultural land use,including, for example, land elsewhere on theproperty, on an adjacent property or at anothernearby location;
No activities are proposed on land that is used for a PALU. UGworkings beneath this land will result and negligible impactswill result at surface (Refer to Section 6.2).Further, the Project is constrained by the location of theresource.
(c) the construction and operation footprint of theactivity on the part of the property used for a priorityagricultural land use is minimised to the greatestextent possible;
Ensham have minimised surface impacts to this land to thegreatest degree possible by only proposing the bareminimum surface infrastructure required and proposing thebord and pillar UG mining technique, which will result innegligible impacts at surface (Refer to Section 6.2).No other surface infrastructure is proposed, and the currentuse of this land will continue through the life of the mine.
(d) the activity will not constrain, restrict or preventthe ongoing conduct on the property of a priorityagricultural land use, including, for example, everydayfarm practices and an activity or infrastructureessential to the operation of a priority agricultural landuse on the property;
UG workings beneath this land will result, however negligibleimpacts will result at surface (Refer to Section 6.2).
Bligh Coal Limited, Idemitsu Australia and Bowen Investment (Australia)Pty LtdREGIONAL INTERESTS DEVELOPMENT APPROVAL SUPPORTINGDOCUMENTEnsham Life of Mine ExtensionZone 2 and Zone 3
SLR Ref No: RIDA Application 620.30686.00600-RevI.docxMarch 2022
Page 42L\343884466.1
Prescribed Solutions for RO1(Schedule 2, Part 2, Section 3 – RPI Regulation)
Response
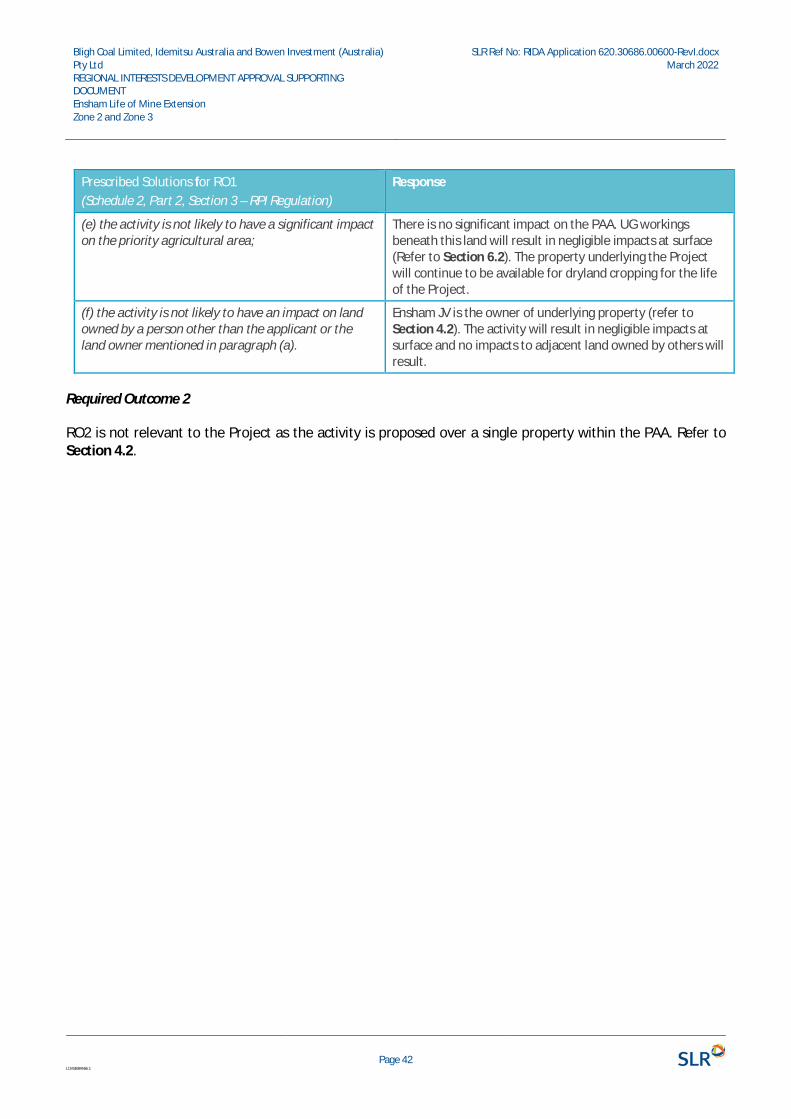
(e) the activity is not likely to have a significant impacton the priority agricultural area;
There is no significant impact on the PAA. UG workingsbeneath this land will result in negligible impacts at surface(Refer to Section 6.2). The property underlying the Projectwill continue to be available for dryland cropping for the lifeof the Project.
(f) the activity is not likely to have an impact on landowned by a person other than the applicant or theland owner mentioned in paragraph (a).
Ensham JV is the owner of underlying property (refer toSection 4.2). The activity will result in negligible impacts atsurface and no impacts to adjacent land owned by others willresult.
Required Outcome 2
RO2 is not relevant to the Project as the activity is proposed over a single property within the PAA. Refer toSection 4.2.
Bligh Coal Limited, Idemitsu Australia and Bowen Investment (Australia)Pty LtdREGIONAL INTERESTS DEVELOPMENT APPROVAL SUPPORTINGDOCUMENTEnsham Life of Mine ExtensionZone 2 and Zone 3
SLR Ref No: RIDA Application 620.30686.00600-RevI.docxMarch 2022
Page 43L\343884466.1
Figure 7 Mapped PALU Area – 2003 Satellite Imagery

Bligh Coal Limited, Idemitsu Australia and Bowen Investment (Australia)Pty LtdREGIONAL INTERESTS DEVELOPMENT APPROVAL SUPPORTINGDOCUMENTEnsham Life of Mine ExtensionZone 2 and Zone 3
SLR Ref No: RIDA Application 620.30686.00600-RevI.docxMarch 2022
Page 44L\343884466.1
Figure 8 Mapped PALU Area – 2011 Satellite Imagery
Bligh Coal Limited, Idemitsu Australia and Bowen Investment (Australia)Pty LtdREGIONAL INTERESTS DEVELOPMENT APPROVAL SUPPORTINGDOCUMENTEnsham Life of Mine ExtensionZone 2 and Zone 3
SLR Ref No: RIDA Application 620.30686.00600-RevI.docxMarch 2022
Page 45L\343884466.1
Figure 9 Mapped PALU Area – 2017 Satellite Imagery
Bligh Coal Limited, Idemitsu Australia and Bowen Investment (Australia)Pty LtdREGIONAL INTERESTS DEVELOPMENT APPROVAL SUPPORTINGDOCUMENTEnsham Life of Mine ExtensionZone 2 and Zone 3
SLR Ref No: RIDA Application 620.30686.00600-RevI.docxMarch 2022
Page 46L\343884466.1
Figure 10 Mapped PALU Area – 2019 Satellite Imagery
Bligh Coal Limited, Idemitsu Australia and Bowen Investment (Australia)Pty LtdREGIONAL INTERESTS DEVELOPMENT APPROVAL SUPPORTINGDOCUMENTEnsham Life of Mine ExtensionZone 2 and Zone 3
SLR Ref No: RIDA Application 620.30686.00600-RevI.docxMarch 2022
Page 47L\343884466.1
4.2 Strategic Cropping Area (RPI Regulation, Schedule 2, Part 4)
Required Outcome 1
RO1 is not relevant to the Project.
Required Outcome 2
RO2 requires that the activity not result in a material impact on SCL on the property. Prescribed solutions forRO2 state solutions for deciding if the activity impacts on SCL in the SCA. It has been determined that the Projectsatisfies all of the prescribed solutions for RO2 and will not result in a material impact to SCL on the property, asoutlined under Table 5.
Importantly, lots underlying the Project are continuous between Zone 2 and 3 and are commonly owned byBligh Coal Ltd, Bowen Investment (Australia) Pty Ltd and Idemitsu Australia Pty Ltd. Bligh Coal Ltd, BowenInvestment (Australia) Pty Ltd and Idemitsu Australia Pty Ltd have confirmed that these lots are operated as asingle agricultural enterprise, principally cattle grazing. Property ownership and status is further discussed underSection 5.2.
Table 5 Prescribed Solutions for RO2 – SCA
Prescribed Solutions for RO2(Schedule 2, Part 4, Section 11 – RPI Regulation)
Response
The application demonstrates all of the following— -
(a) if the applicant is not the owner of the land and hasnot entered into a voluntary agreement with theowner—the applicant has taken all reasonable steps toconsult and negotiate with the owner of the landabout the expected impact of carrying out the activityon strategic cropping land;
Not applicable. Ensham is the owner of underlying property(refer to Section 4.2).
(b) the activity cannot be carried out on land that isnot strategic cropping land, including, for example,land elsewhere on the property (SCL), on adjacent landor at another nearby location;
Underground workings beneath this land will result innegligible impacts to mapped SCA areas (Refer to Section6.2). The Project is constrained by the location of theresource.
(c) the construction and operation footprint of theactivity on strategic cropping land on the property(SCL) is minimised to the greatest extent possible;
Ensham have minimised surface impacts to this land to thegreatest degree possible by only proposing the bareminimum surface infrastructure required (i.e. one flare inZone 3 is located on SCA. Refer to Section 6.1) and proposingthe bord and pillar UG mining technique, which will result innegligible impacts at surface (Refer to Section 6.2).No other surface infrastructure is proposed, and the currentuse of this land will continue through the life of the mine.
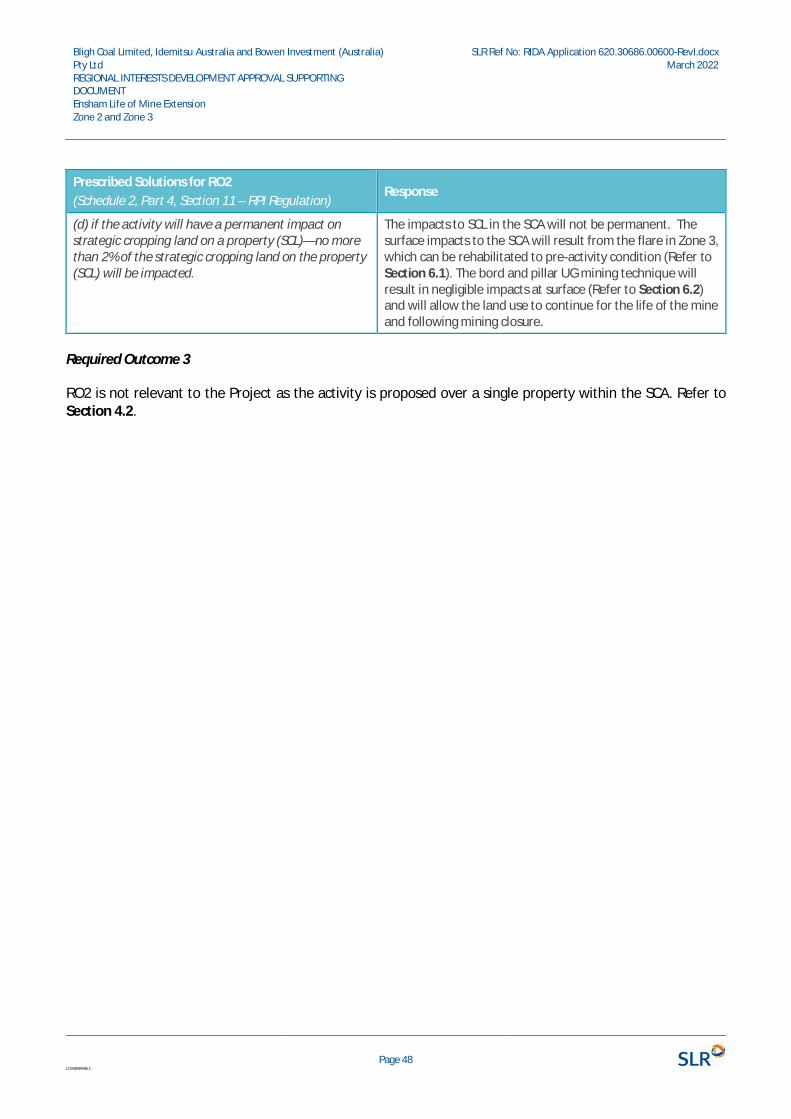
Bligh Coal Limited, Idemitsu Australia and Bowen Investment (Australia)Pty LtdREGIONAL INTERESTS DEVELOPMENT APPROVAL SUPPORTINGDOCUMENTEnsham Life of Mine ExtensionZone 2 and Zone 3
SLR Ref No: RIDA Application 620.30686.00600-RevI.docxMarch 2022
Page 48L\343884466.1
Prescribed Solutions for RO2(Schedule 2, Part 4, Section 11 – RPI Regulation)
Response
(d) if the activity will have a permanent impact onstrategic cropping land on a property (SCL)—no morethan 2% of the strategic cropping land on the property(SCL) will be impacted.
The impacts to SCL in the SCA will not be permanent. Thesurface impacts to the SCA will result from the flare in Zone 3,which can be rehabilitated to pre-activity condition (Refer toSection 6.1). The bord and pillar UG mining technique willresult in negligible impacts at surface (Refer to Section 6.2)and will allow the land use to continue for the life of the mineand following mining closure.
Required Outcome 3
RO2 is not relevant to the Project as the activity is proposed over a single property within the SCA. Refer toSection 4.2.
Bligh Coal Limited, Idemitsu Australia and Bowen Investment (Australia)Pty LtdREGIONAL INTERESTS DEVELOPMENT APPROVAL SUPPORTINGDOCUMENTEnsham Life of Mine ExtensionZone 2 and Zone 3
SLR Ref No: RIDA Application 620.30686.00600-RevI.docxMarch 2022
Page 49L\343884466.1
5 Existing Environment
5.1 Land Use within the Project
Land in the vicinity of the Project consists of mining operations, irrigated/dryland cropping and dryland grazingland. Land uses and activities inside and surrounding the proposed Project (1 km radius) are shown on Figure 11.
5.2 Property
Lots underlying the Project are continuous between Zone 2 and 3 and are commonly owned by Bligh Coal Ltd,Bowen Investment (Australia) Pty Ltd and Idemitsu Australia Pty Ltd. Lots underlying the Project are continuousbetween Zone 2 and 3 and are commonly owned by Bligh Coal Ltd, Bowen Investment (Australia) Pty Ltd andIdemitsu Australia Pty Ltd. Bligh Coal Ltd, Bowen Investment (Australia) Pty Ltd and Idemitsu Australia Pty Ltdhave confirmed that these lots are operated as a single agricultural enterprise, principally cattle grazing. A mapoutlining the lots and plan for each land parcel inside and surrounding the Project is presented in Figure 12.
5.3 Land Resources Assessment
A Soil and Land Resource Assessment (the Assessment) for the Project (SLR, 2022) has been undertaken. Thisassessment characterised and detailed the type, distribution and quality of soils within the Project. Fourdominant soil map units (SMUs) were identified across the Project and consisted of the following:
· 1: Crusty Brown Vertosols
· 2A: Eutrophic Brown Dermosols
· 2B: Eutrophic Brown Dermosols
· 3: Magnesic Brown Kandosols
· 4: Clastic Rudosols
5.3.1 Dispersive Soils
Some slightly dispersive topsoils were identified from SMUs 2A, 2B and 3 in Zone 2 and 3 , with some moderatelydispersive subsoils also being identified across the Project. These subsoils will be appropriately ameliorated asper the requirements of the EA.
5.3.2 Land Suitability and Agricultural Land Classes
Due to the minimal surface footprint from the construction of each flare (see disturbance footprint details inSection 1.1.3), no material impact will be present on the land inside the Project. Flare construction will thereforenot influence the Land Suitability Class or the Agricultural Land Class areas categorised from the soils in theAssessment. The Land Resources assessment is included in Appendix C.
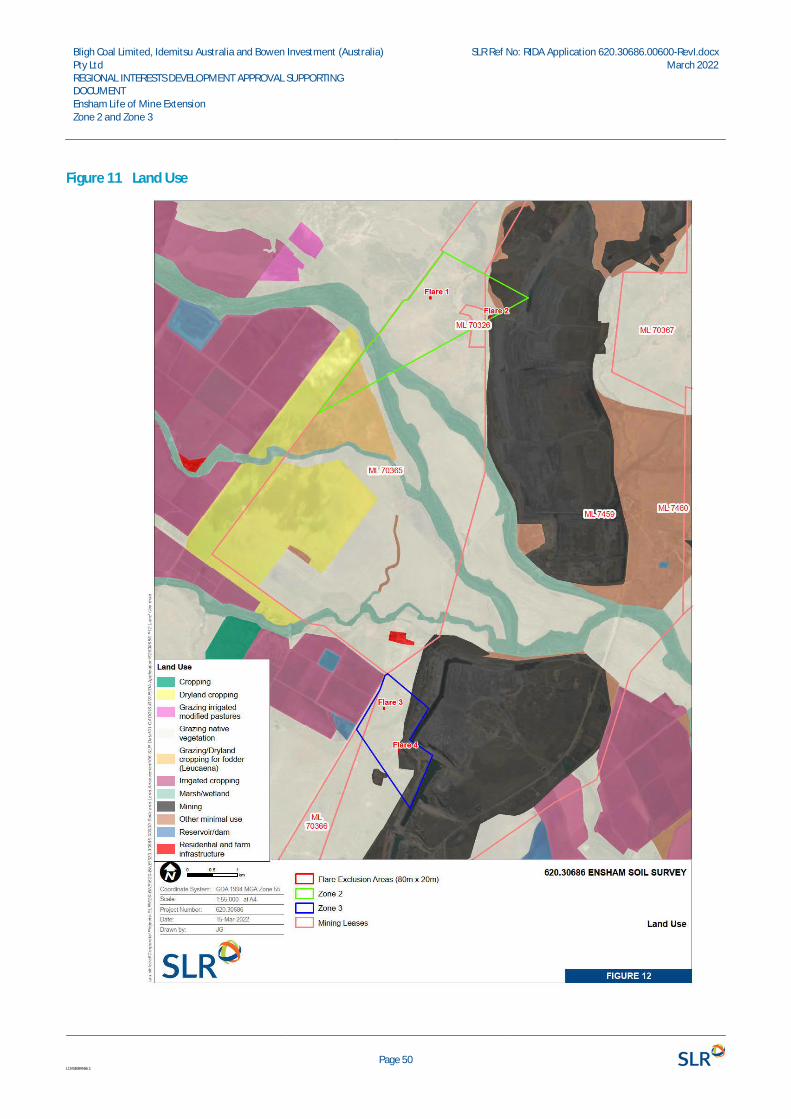
Bligh Coal Limited, Idemitsu Australia and Bowen Investment (Australia)Pty LtdREGIONAL INTERESTS DEVELOPMENT APPROVAL SUPPORTINGDOCUMENTEnsham Life of Mine ExtensionZone 2 and Zone 3
SLR Ref No: RIDA Application 620.30686.00600-RevI.docxMarch 2022
Page 50L\343884466.1
Figure 11 Land Use

Bligh Coal Limited, Idemitsu Australia and Bowen Investment (Australia)Pty LtdREGIONAL INTERESTS DEVELOPMENT APPROVAL SUPPORTINGDOCUMENTEnsham Life of Mine ExtensionZone 2 and Zone 3
SLR Ref No: RIDA Application 620.30686.00600-RevI.docxMarch 2022
Page 51L\343884466.1
Figure 12 Underlying Property Ownership
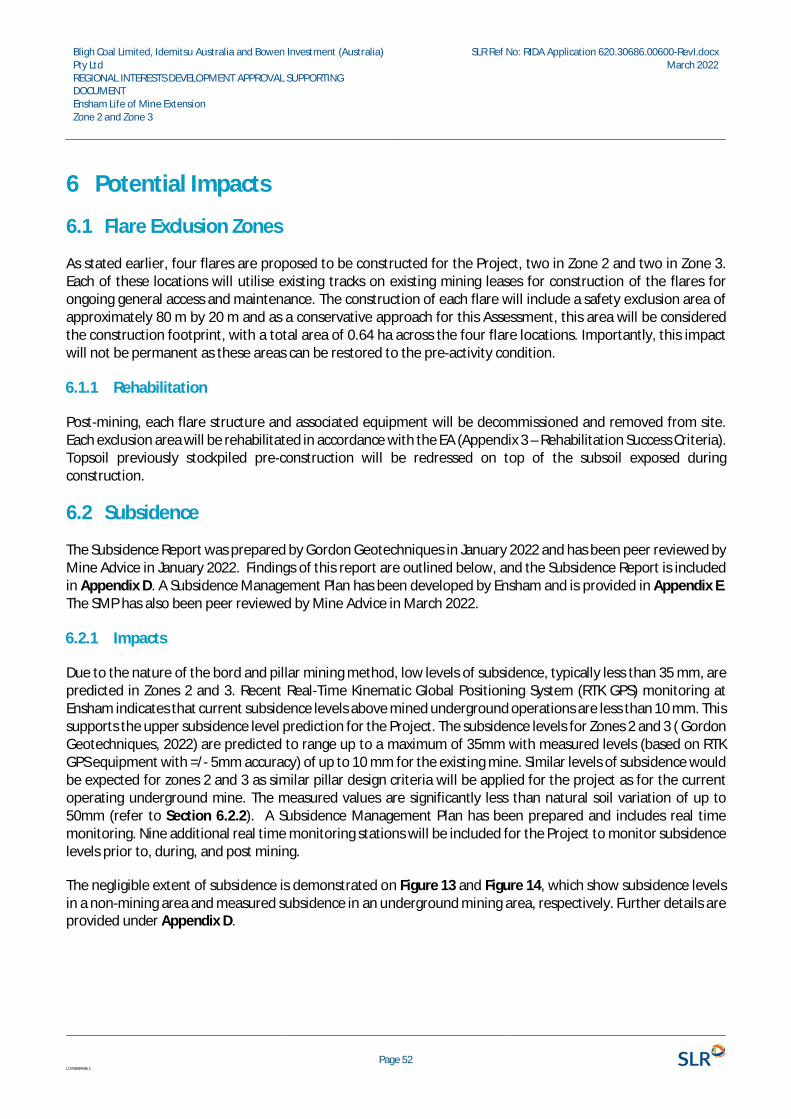
Bligh Coal Limited, Idemitsu Australia and Bowen Investment (Australia)Pty LtdREGIONAL INTERESTS DEVELOPMENT APPROVAL SUPPORTINGDOCUMENTEnsham Life of Mine ExtensionZone 2 and Zone 3
SLR Ref No: RIDA Application 620.30686.00600-RevI.docxMarch 2022
Page 52L\343884466.1
6 Potential Impacts
6.1 Flare Exclusion Zones
As stated earlier, four flares are proposed to be constructed for the Project, two in Zone 2 and two in Zone 3.Each of these locations will utilise existing tracks on existing mining leases for construction of the flares forongoing general access and maintenance. The construction of each flare will include a safety exclusion area ofapproximately 80 m by 20 m and as a conservative approach for this Assessment, this area will be consideredthe construction footprint, with a total area of 0.64 ha across the four flare locations. Importantly, this impactwill not be permanent as these areas can be restored to the pre-activity condition.
6.1.1 Rehabilitation
Post-mining, each flare structure and associated equipment will be decommissioned and removed from site.Each exclusion area will be rehabilitated in accordance with the EA (Appendix 3 – Rehabilitation Success Criteria).Topsoil previously stockpiled pre-construction will be redressed on top of the subsoil exposed duringconstruction.
6.2 Subsidence
The Subsidence Report was prepared by Gordon Geotechniques in January 2022 and has been peer reviewed byMine Advice in January 2022. Findings of this report are outlined below, and the Subsidence Report is includedin Appendix D. A Subsidence Management Plan has been developed by Ensham and is provided in Appendix E.The SMP has also been peer reviewed by Mine Advice in March 2022.
6.2.1 Impacts
Due to the nature of the bord and pillar mining method, low levels of subsidence, typically less than 35 mm, arepredicted in Zones 2 and 3. Recent Real-Time Kinematic Global Positioning System (RTK GPS) monitoring atEnsham indicates that current subsidence levels above mined underground operations are less than 10 mm. Thissupports the upper subsidence level prediction for the Project. The subsidence levels for Zones 2 and 3 ( GordonGeotechniques, 2022) are predicted to range up to a maximum of 35mm with measured levels (based on RTKGPS equipment with =/- 5mm accuracy) of up to 10 mm for the existing mine. Similar levels of subsidence wouldbe expected for zones 2 and 3 as similar pillar design criteria will be applied for the project as for the currentoperating underground mine. The measured values are significantly less than natural soil variation of up to50mm (refer to Section 6.2.2). A Subsidence Management Plan has been prepared and includes real timemonitoring. Nine additional real time monitoring stations will be included for the Project to monitor subsidencelevels prior to, during, and post mining.
The negligible extent of subsidence is demonstrated on Figure 13 and Figure 14, which show subsidence levelsin a non-mining area and measured subsidence in an underground mining area, respectively. Further details areprovided under Appendix D.
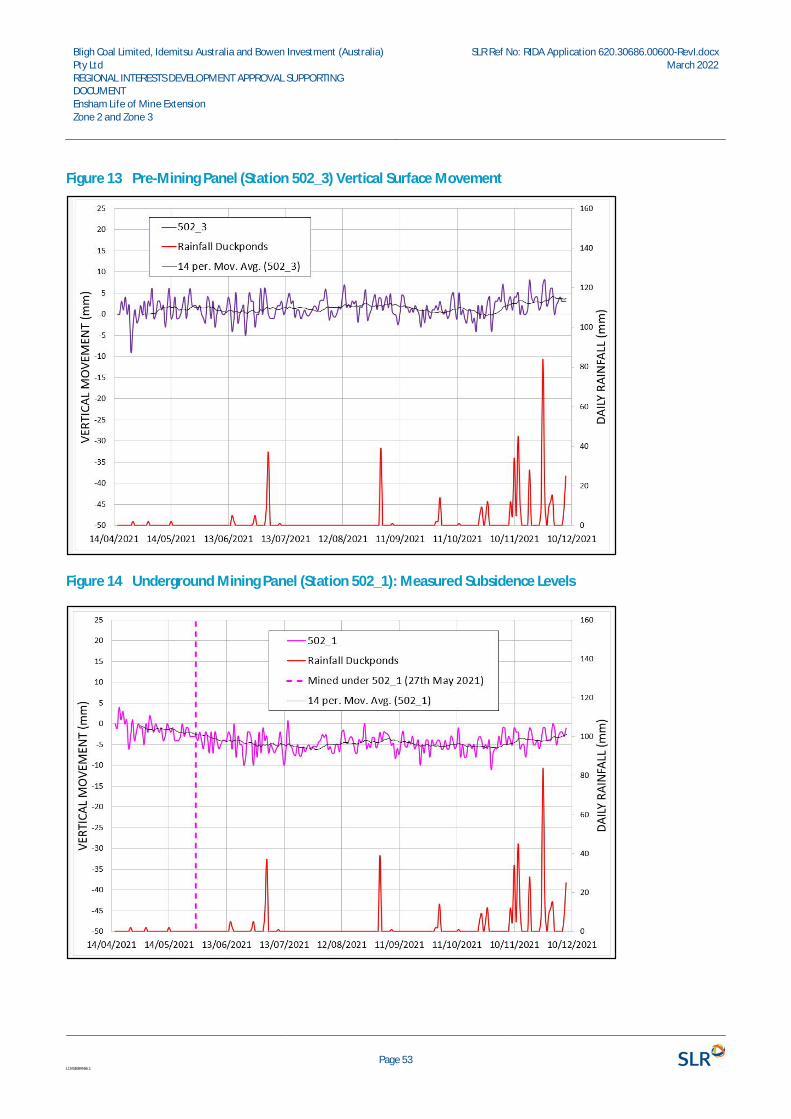
Bligh Coal Limited, Idemitsu Australia and Bowen Investment (Australia)Pty LtdREGIONAL INTERESTS DEVELOPMENT APPROVAL SUPPORTINGDOCUMENTEnsham Life of Mine ExtensionZone 2 and Zone 3
SLR Ref No: RIDA Application 620.30686.00600-RevI.docxMarch 2022
Page 53L\343884466.1
Figure 13 Pre-Mining Panel (Station 502_3) Vertical Surface Movement
Figure 14 Underground Mining Panel (Station 502_1): Measured Subsidence Levels
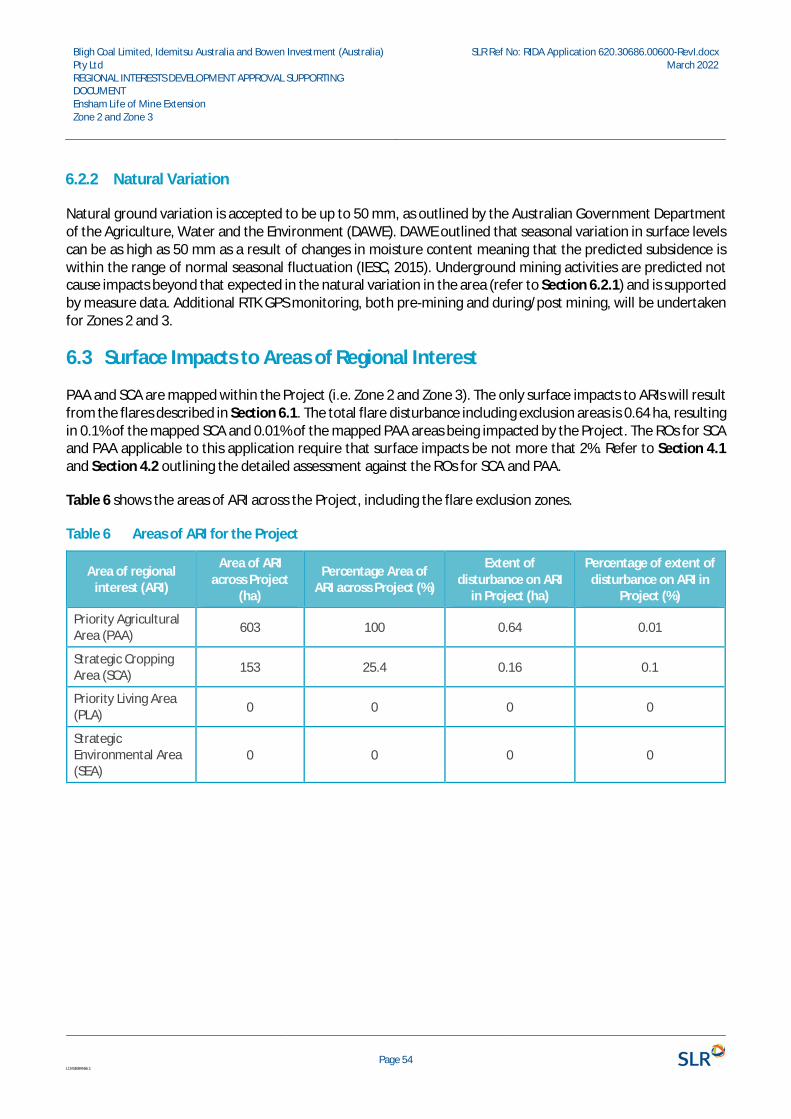
Bligh Coal Limited, Idemitsu Australia and Bowen Investment (Australia)Pty LtdREGIONAL INTERESTS DEVELOPMENT APPROVAL SUPPORTINGDOCUMENTEnsham Life of Mine ExtensionZone 2 and Zone 3
SLR Ref No: RIDA Application 620.30686.00600-RevI.docxMarch 2022
Page 54L\343884466.1
6.2.2 Natural Variation
Natural ground variation is accepted to be up to 50 mm, as outlined by the Australian Government Departmentof the Agriculture, Water and the Environment (DAWE). DAWE outlined that seasonal variation in surface levelscan be as high as 50 mm as a result of changes in moisture content meaning that the predicted subsidence iswithin the range of normal seasonal fluctuation (IESC, 2015). Underground mining activities are predicted notcause impacts beyond that expected in the natural variation in the area (refer to Section 6.2.1) and is supportedby measure data. Additional RTK GPS monitoring, both pre-mining and during/post mining, will be undertakenfor Zones 2 and 3.
6.3 Surface Impacts to Areas of Regional Interest
PAA and SCA are mapped within the Project (i.e. Zone 2 and Zone 3). The only surface impacts to ARIs will resultfrom the flares described in Section 6.1. The total flare disturbance including exclusion areas is 0.64 ha, resultingin 0.1% of the mapped SCA and 0.01% of the mapped PAA areas being impacted by the Project. The ROs for SCAand PAA applicable to this application require that surface impacts be not more that 2%. Refer to Section 4.1and Section 4.2 outlining the detailed assessment against the ROs for SCA and PAA.
Table 6 shows the areas of ARI across the Project, including the flare exclusion zones.
Table 6 Areas of ARI for the Project
Area of regionalinterest (ARI)
Area of ARIacross Project
(ha)
Percentage Area ofARI across Project (%)
Extent ofdisturbance on ARI
in Project (ha)
Percentage of extent ofdisturbance on ARI in
Project (%)
Priority AgriculturalArea (PAA) 603 100 0.64 0.01
Strategic CroppingArea (SCA) 153 25.4 0.16 0.1
Priority Living Area(PLA) 0 0 0 0
StrategicEnvironmental Area(SEA)
0 0 0 0
Bligh Coal Limited, Idemitsu Australia and Bowen Investment (Australia)Pty LtdREGIONAL INTERESTS DEVELOPMENT APPROVAL SUPPORTINGDOCUMENTEnsham Life of Mine ExtensionZone 2 and Zone 3
SLR Ref No: RIDA Application 620.30686.00600-RevI.docxMarch 2022
Page 55L\343884466.1
7 ConclusionsThe Project will not have a material impact on SCA or PAA and satisfies the prescribed solutions under the RPIRegulation as follows:
· The Project satisfies all prescribed solutions for RO1 under Schedule 2, Part 2 of the RPI Regulation and willnot result in material impact on the use of the property or a PALU.
· The Project satisfies all prescribed solutions for RO2 under Schedule 2, Part 4 of the RPI Regulation and willnot result in a material impact to SCL on the property.
· The underground mining method (bord and pillar) would continue to be used to ensure that surface impactsare minimised. Subsidence from underground mine activities is not predicted to cause any material impactson ground elevations and supported by measure subsidence levels based on similar pillar design criteria.Measured subsidence levels (5-10mm) and the maximum predicted level (35mm) are well below thereported natural variation in surface levels of up to 50 mm caused by changes in moisture content.
Recommendation
Under Section 34 (3) of the RPI Act ‘the chief executive may, on the written request of the applicant, grant anexemption from notification for an assessment application if satisfied there has been sufficient notificationunder another Act or law of the resource activity or regulated activity to the public’. An EIS (including Zones 2and 3) has been prepared to address requirements under the Queensland Environmental Protection Act 1994and the Commonwealth Environment Protection and Biodiversity and Conservation Act 1999. The EIS wasadvertised under both these sets of legislation, with public comments received and responded to, and an EISassessment report issued by the Department of Environment and Science in November 2021. it is requested thatadequate public notice has been undertaken for the Project and an exemption to publicly notify this RIDA begranted.
Bligh Coal Limited, Idemitsu Australia and Bowen Investment (Australia)Pty LtdREGIONAL INTERESTS DEVELOPMENT APPROVAL SUPPORTINGDOCUMENTEnsham Life of Mine ExtensionZone 2 and Zone 3
SLR Ref No: RIDA Application 620.30686.00600-RevI.docxMarch 2022
Page 56L\343884466.1
8 ReferencesAECOM, 2020. Environmental Impact Statement – Ensham Life of Mine Extension Project.
Central Queensland Regional Plan, 2013
Gordon Geotechniques Pty Ltd, 2022, Subsidence Report for the Ensham Life of Mine Extension – Zone 2 and 3,prepared for Ensham Resources Pty Ltd 2022.
Independent Expert Steering Committee (IESC), 2015. Monitoring and Management of Subsidence Induced byLongwall Coal Mining Activity. Report to the Department of the Environment.
Regional Planning Interests Act, 2014
Regional Planning Interests Regulation, 2014
RPI Act Statutory Guideline 01/14, 2019
RPI Act Statutory Guideline 02/14, 2019
RPI Act Statutory Guideline 03/14, 2019
RPI Act Statutory Guideline 06/14, 2019
RPI Act Statutory Guideline 07/14, 2019
RPI Act Statutory Guideline 09/14, 2019SLR, 2022, Soil and Land Resource Assessment - Zone 2 and 3, EnshamLife of Mine Extension -Zone 2 and 3, prepared for Ensham Resources Pty Ltd 2022.

RIDA Application 620.30686.00600-RevI.docx Page 1 of 2L\343884466.1
APPENDIX AProject Description
IDEMITSU AUSTRALIA
CHAPTER 4 – PROJECT DESCRIPTION AND ALTERNATIVES 1
4.0 Project description and alternatives
4.1 Introduction This chapter presents information on the Ensham Life of Mine Extension Project – Zones 2 and 3 which is the subject of the environmental authority (EA) amendment application (hereafter referred to as ‘the Project’) including an overview of the mining activities proposed for the Project, and a brief overview of the existing Ensham Mine operations.
4.2 Project overview Ensham Mine is an existing open-cut and underground bord and pillar coal mine located approximately 35
kilometres (km) east of Emerald in Queensland. The existing bord and pillar operations are currently authorised
to continue until 2028 within Mining Lease (ML) 7459, ML 70326 and ML 70365, and extract a portion of the
various combined Aries/Castor seam plies. An extension of these leases to 2050 would be sought to
accommodate the additional underground mining and mine rehabilitation obligations under the current EA, and
proposed Progressive Rehabilitation Closure Plan (PRCP). The open-cut mine is due to commence closure in
2022. However, Pits C and D within the open-cut mine will be retained to allow for access to the underground
mine portals and will be rehabilitated towards the end of the open-cut rehabilitation program.
The proponents for the Project propose to increase the life of the existing underground operations by extending the underground bord and pillar mine into an area identified as Zones 2 and 3 as shown in Figure 4-1.
The Project covers approximately 603 hectares (ha) and includes two zones:
• Zone 2: partially includes existing leases ML 70326, ML 70365, and ML 7459 (total area is approximately
394 ha of which 346 ha would represent the projected mining footprint), and
• Zone 3: partially includes existing leases ML 7459 and ML 70366 (total area is approximately 209 ha of
which 175 ha would represent the projected mining footprint).
The above-nominated mining footprint areas for Zones 2 and 3 are projected areas under which
underground mining would occur. This total projected mining footprint area of 521 ha for both Zones 2 and 3
represents 8.17% of the total 6376 ha currently disturbed open-cut and current underground mining areas.
In addition, the total mining footprint of 521 ha for both Zones 2 and 3 represents a 7.01% of the total 7429
ha approved for mining (open cut and underground).
Zones 2 and 3 have been subject to surface activities associated with the open cut mining mine since the
grant of the mining leases. It is proposed to continue to mine these zones using bord and pillar underground
methods which will considerably minimise future land disturbance. This will mean limited future surface
disturbance with only 2 gas drainage flares planned in each zone in an area of approximately 0.6 hectares.
Given the current mine design, it is not expected that the measured subsidence levels would contribute
significantly to land disturbance when compared to soil expansion rates of 50mm observed. Recent
monitoring at Ensham has indicated subsidence levels of less than 10 mm above mined underground
panels. This monitoring has an accuracy of ±5 mm and is able to detect the observed low levels of
IDEMITSU AUSTRALIA
CHAPTER 4 – PROJECT DESCRIPTION AND ALTERNATIVES 2
movement. It is expected that similar levels of subsidence will be generated in Zones 2 and 3 based on
similar design principles used in the current underground operations.
The proponents intend to separately progress the Ensham Life of Mine Extension – Zone 1. This Zone 1
extension is also proposed as a bord and pillar underground mine and will require a new mining lease to the
north-west of the existing approved mine. The Zone 1 extension is not the subject of this EA amendment
application, but will be the subject of separate EA amendment and mining lease applications (see section
4.7).
Project objectives
Approval of the Project will allow Ensham Mine to:
• Continue to produce at current planned coal production rate of approximately 4.5 million tonnes per
annum (Mtpa) of product coal while remaining within the current Environmental Authority (EA) limit
(condition A5) which authorises the mining of 12 million tonnes of run of mine (ROM) coal per annum.
Without zones 2 and 3, the current underground operations will become physically restrained to lower
production levels and affect the overall economic viability of the mine,
• Extend the life of mine (LOM) by up to two years with sufficient coal reserves to approximately 2029,
• Progress the underground operation within existing mining leases. The Project would continue to utilise
existing operational mine equipment, existing mining methodologies, and existing infrastructure located
on the existing mining leases, and
• Continue to provide substantial employment opportunities within the Central Highlands region. The
Project is proposed to commence in late H1 2022 in Zone 2.
IDEMITSU AUSTRALIA
CHAPTER 4 – PROJECT DESCRIPTION AND ALTERNATIVES 3
Figure 4-1 Ensham underground mine plan (currently approved and the indicative
Project)
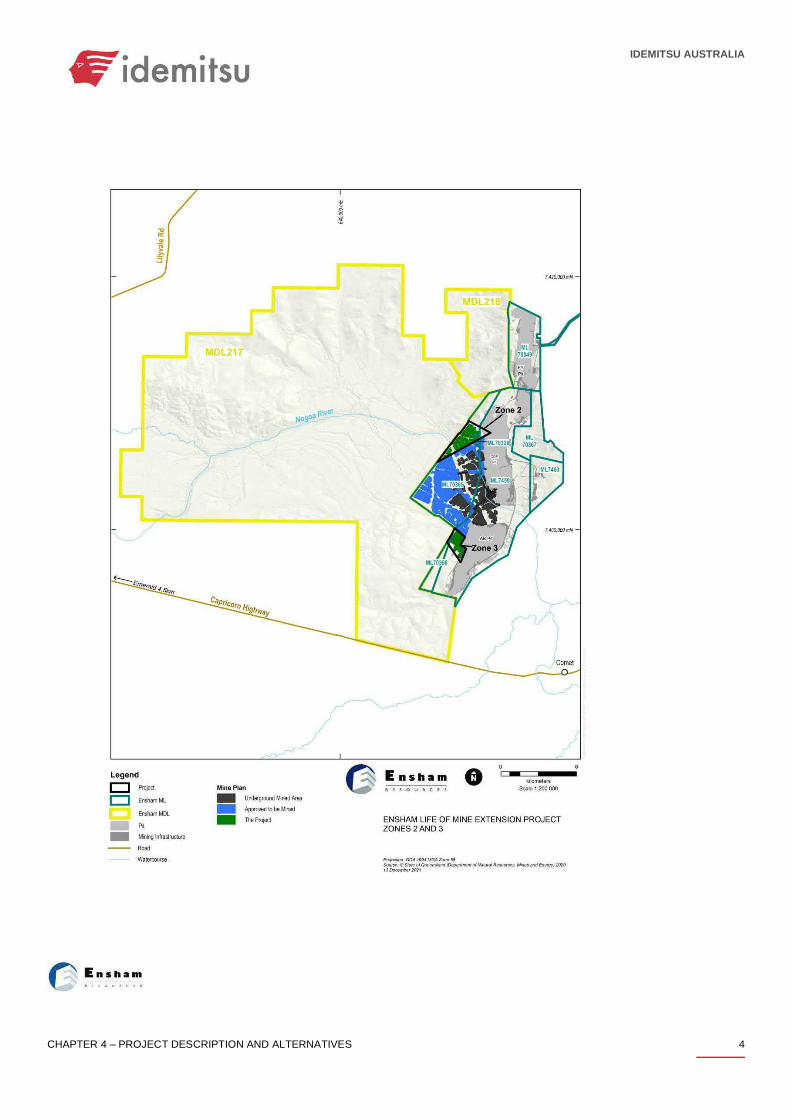
IDEMITSU AUSTRALIA
CHAPTER 4 – PROJECT DESCRIPTION AND ALTERNATIVES 4
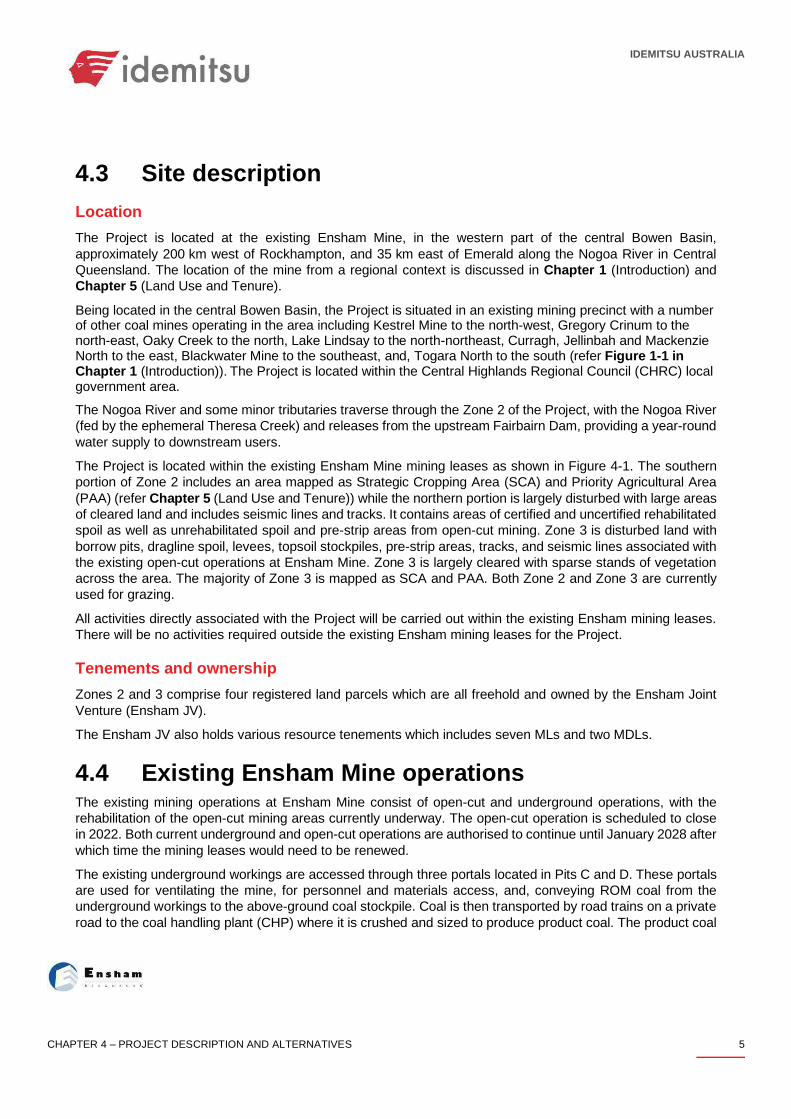
IDEMITSU AUSTRALIA
CHAPTER 4 – PROJECT DESCRIPTION AND ALTERNATIVES 5
4.3 Site description
Location
The Project is located at the existing Ensham Mine, in the western part of the central Bowen Basin,
approximately 200 km west of Rockhampton, and 35 km east of Emerald along the Nogoa River in Central
Queensland. The location of the mine from a regional context is discussed in Chapter 1 (Introduction) and
Chapter 5 (Land Use and Tenure).
Being located in the central Bowen Basin, the Project is situated in an existing mining precinct with a number of other coal mines operating in the area including Kestrel Mine to the north-west, Gregory Crinum to the north-east, Oaky Creek to the north, Lake Lindsay to the north-northeast, Curragh, Jellinbah and Mackenzie North to the east, Blackwater Mine to the southeast, and, Togara North to the south (refer Figure 1-1 in Chapter 1 (Introduction)). The Project is located within the Central Highlands Regional Council (CHRC) local government area.
The Nogoa River and some minor tributaries traverse through the Zone 2 of the Project, with the Nogoa River
(fed by the ephemeral Theresa Creek) and releases from the upstream Fairbairn Dam, providing a year-round
water supply to downstream users.
The Project is located within the existing Ensham Mine mining leases as shown in Figure 4-1. The southern
portion of Zone 2 includes an area mapped as Strategic Cropping Area (SCA) and Priority Agricultural Area
(PAA) (refer Chapter 5 (Land Use and Tenure)) while the northern portion is largely disturbed with large areas
of cleared land and includes seismic lines and tracks. It contains areas of certified and uncertified rehabilitated
spoil as well as unrehabilitated spoil and pre-strip areas from open-cut mining. Zone 3 is disturbed land with
borrow pits, dragline spoil, levees, topsoil stockpiles, pre-strip areas, tracks, and seismic lines associated with
the existing open-cut operations at Ensham Mine. Zone 3 is largely cleared with sparse stands of vegetation
across the area. The majority of Zone 3 is mapped as SCA and PAA. Both Zone 2 and Zone 3 are currently
used for grazing.
All activities directly associated with the Project will be carried out within the existing Ensham mining leases.
There will be no activities required outside the existing Ensham mining leases for the Project.
Tenements and ownership
Zones 2 and 3 comprise four registered land parcels which are all freehold and owned by the Ensham Joint
Venture (Ensham JV).
The Ensham JV also holds various resource tenements which includes seven MLs and two MDLs.
4.4 Existing Ensham Mine operations The existing mining operations at Ensham Mine consist of open-cut and underground operations, with the
rehabilitation of the open-cut mining areas currently underway. The open-cut operation is scheduled to close
in 2022. Both current underground and open-cut operations are authorised to continue until January 2028 after
which time the mining leases would need to be renewed.
The existing underground workings are accessed through three portals located in Pits C and D. These portals
are used for ventilating the mine, for personnel and materials access, and, conveying ROM coal from the
underground workings to the above-ground coal stockpile. Coal is then transported by road trains on a private
road to the coal handling plant (CHP) where it is crushed and sized to produce product coal. The product coal
IDEMITSU AUSTRALIA
CHAPTER 4 – PROJECT DESCRIPTION AND ALTERNATIVES 6
is then transported via rail to Gladstone for electricity generation at the Gladstone Power Station, and, to the
Gladstone Coal Terminal for export overseas.
Methane gas is currently drained from the target coal seam through in-seam drainage holes that are connected
to an underground piping system which transports the gas to the surface via a borehole to where the gas is
flared. As is a common practice in the Bowen Basin, underground in-seam gas drainage is a means of draining
in-situ gas in advance of mining to maintain a safe working environment. Flaring of the drained gas is required
to reduce greenhouse gas emissions as required by the Clean Energy regulator and s318CO (2) of the
Minerals Resource Act 1989. Gas from the existing underground mining operation is currently being flared in
locations to the west of C and D pits as shown in Figure 4-2.
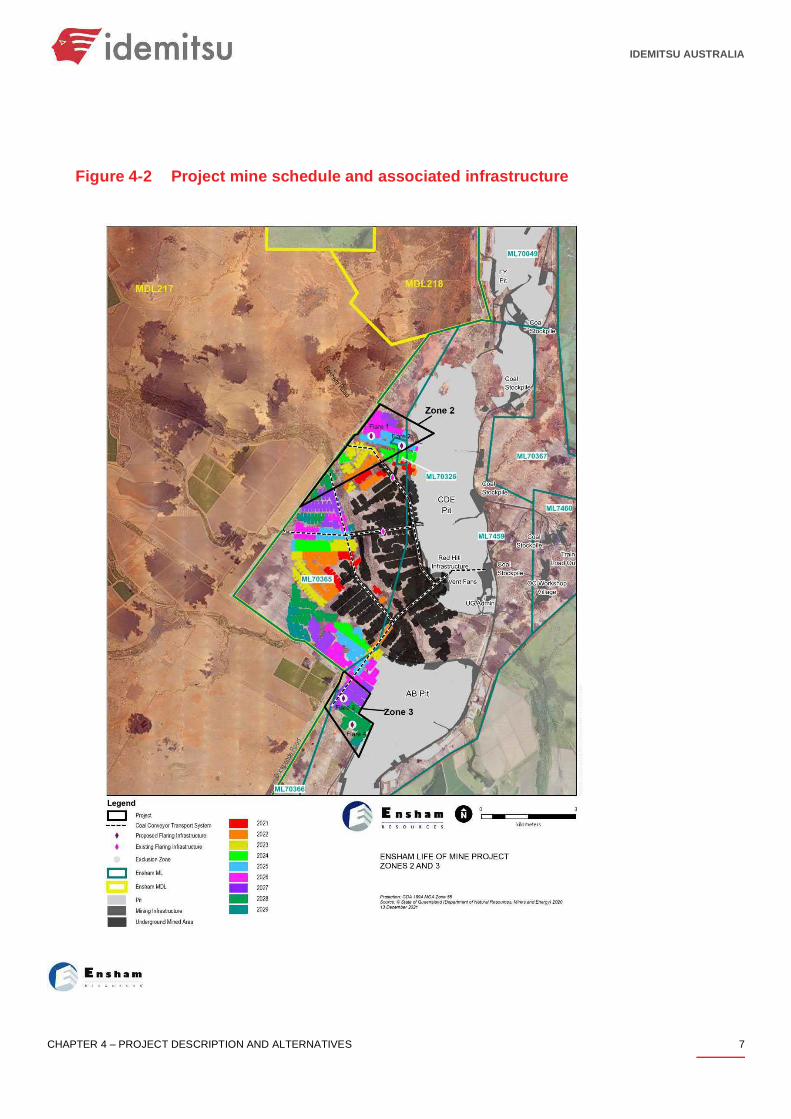
IDEMITSU AUSTRALIA
CHAPTER 4 – PROJECT DESCRIPTION AND ALTERNATIVES 7
Figure 4-2 Project mine schedule and associated infrastructure
IDEMITSU AUSTRALIA
CHAPTER 4 – PROJECT DESCRIPTION AND ALTERNATIVES 8
Project construction
The Project is a continuation of the existing underground mine and will continue to use existing surface
infrastructure located on the existing approved MLs (which includes Zone 2 and Zone 3). No additional material
infrastructure other than installation of four flares (as shown in Figure 4-2 and described in Section 0) will be
required. This work would likely involve approximately 5 people to construct the flaring infrastructure.
As there will be no material surface construction activities or construction traffic, nor increases in ROM coal
production, the Project will not require any upgrades to the existing road, rail, or port infrastructure. The
transport assessment for the Project is discussed further in Chapter 16 (Transport).
4.5 Proposed Project operations
Exploration Activities
No additional exploration will be required for the Project. There is sufficient geological data available for the
anticipated mine plan shown in Figure 4-2.
Conceptual mine design, schedules, and ROM production
The mining sequence for the Project is based on the extension of the current approved mine workings. Figure
4-2 shows the existing approved mined underground areas (approved under EA EPML00732813), the mine
schedule from 2022 to 2029, and the infrastructure required to support the existing approved underground
mining areas and the Project. Figure 4-3 shows the planned coal production from 2022 to 2029. As discussed
in Section 4.7, operations in Zone 1 would commence at a later time after obtaining all necessary approvals.
If approved, production is expected to be maintained up to approximately 4.5 Mtpa of product coal until
approximately 2037.
As shown in Figure 4-2, Zone 2 would be the first underground area to be accessed from ML 70365 in 2022.
Mining in Zone 3 would commence also from ML 70365 in approximately 2026 and continue until 2029.
The mine design has been completed with a factor of safety of 1.6 for bord and pillar workings beneath the
Nogoa River floodplain and 2.11 beneath the Nogoa River to connect the bord and pillar mining areas as
discussed further in Chapter 5 (Land resources). Underground mining for the Project will range from a depth
of approximately 80 to 210 metres (m) below the surface. The will no mining under the Nogoa River.
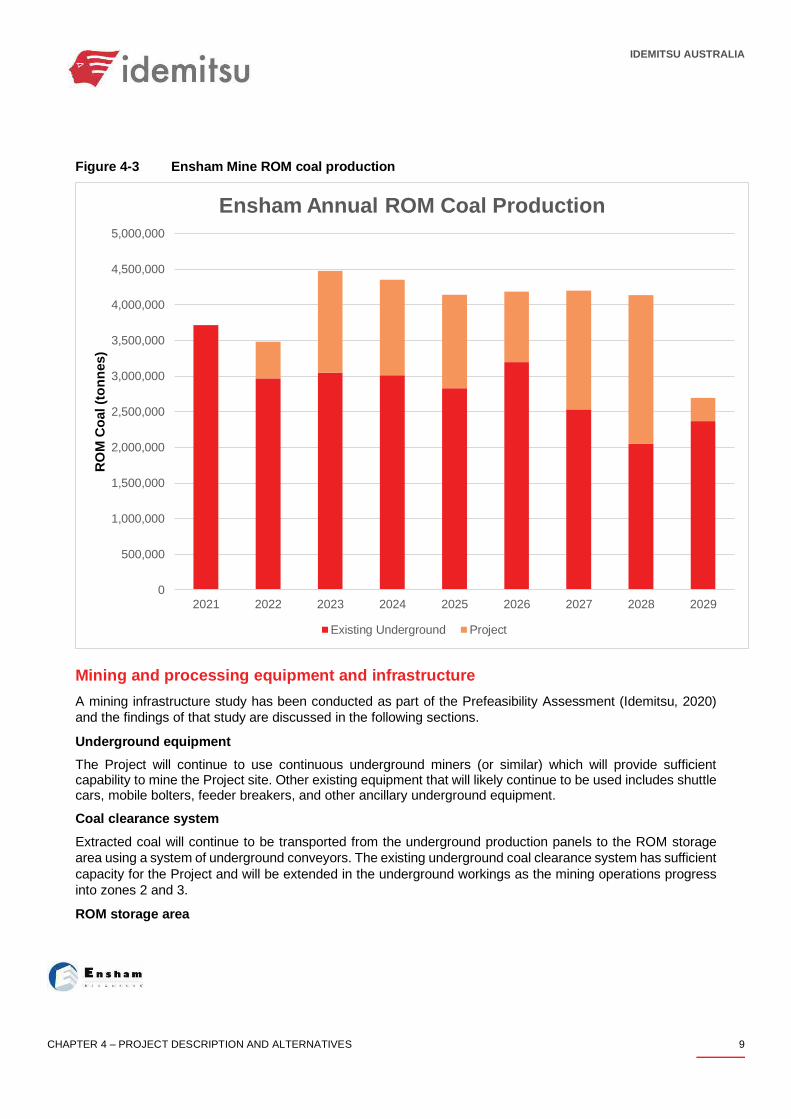
IDEMITSU AUSTRALIA
CHAPTER 4 – PROJECT DESCRIPTION AND ALTERNATIVES 9
Figure 4-3 Ensham Mine ROM coal production
Mining and processing equipment and infrastructure
A mining infrastructure study has been conducted as part of the Prefeasibility Assessment (Idemitsu, 2020)
and the findings of that study are discussed in the following sections.
Underground equipment
The Project will continue to use continuous underground miners (or similar) which will provide sufficient capability to mine the Project site. Other existing equipment that will likely continue to be used includes shuttle cars, mobile bolters, feeder breakers, and other ancillary underground equipment.
Coal clearance system
Extracted coal will continue to be transported from the underground production panels to the ROM storage
area using a system of underground conveyors. The existing underground coal clearance system has sufficient
capacity for the Project and will be extended in the underground workings as the mining operations progress
into zones 2 and 3.
ROM storage area
0
500,000
1,000,000
1,500,000
2,000,000
2,500,000
3,000,000
3,500,000
4,000,000
4,500,000
5,000,000
2021 2022 2023 2024 2025 2026 2027 2028 2029
RO
M C
oal (t
on
nes)
Ensham Annual ROM Coal Production
Existing Underground Project
IDEMITSU AUSTRALIA
CHAPTER 4 – PROJECT DESCRIPTION AND ALTERNATIVES 10
The ROM stockpile area is expected to remain approximately the same size during the Project. Existing or
similar loaders and road trains will continue to be utilised to manage the ROM stockpiles.
Coal handling plant
The existing CHP comprises a truck dump station, crushing and screening plant, product conveyors, stackers,
reclaim system, and loadout system. After crushing, the product coal will continue to be stockpiled and loaded
onto trains via the existing train loadout facility. Currently, no waste rock is produced.
A minor upgrade of the CHP, within the footprint of the current CHP disturbed area, is currently being trialled.
The trial includes a small dry processing module which complies with existing EA conditions. This module, if
successful, would be integrated into the existing footprint of the CHP to assist with the dry removal of rock from
the seam coal. The introduction of technology to remove rock from the coal is consistent with the previously
approved coal handling and preparation plant (CHPP) function with a significantly lower environmental impact
(i.e. no tailings facility and associated additional water use). This is discussed further in section 4.6.7 - Waste
Materials.
Associated infrastructure
Ventilation
Existing underground ventilation systems will be extended for the Project as zones 2 and 3 are developed
using current practices and procedures.
Gas drainage and management
Consistent with existing practices at Ensham Mine, gas drainage will be required for the Project to allow seam gas pre-drainage to ensure a safe working environment in the underground workings. Coal seam drainage gas will be vented in Zone 2 and Zone 3 via flaring infrastructure. A total of four flares will operate on existing mining leases - two flares will be located in Zone 2 and two flares in Zone 3 in locations as shown in Figure 4-2.
Installation and use of these gas flares is for safety mitigation and represents a lower environmental impact than free venting as required under Mineral Resources Act 1989 legislation. The flares would be initially established in locations already approved for disturbance identified in Zones 2 and 3. The flares will be constructed and operated at a time consistent with the mining schedule currently anticipated around 2022-2029 for Zone 2, and approximately 2026-2029 for Zone 3. Flares will be established in cleared areas. The Project flares would all be constructed and operated at least one kilometre away from waterways which provide fish passage. The coordinates of the flares are shown in Table 4-1.
Table 4-1 Proposed flare locations
Flare Coordinates (GDA 94)
mE mN
1 649916.6 7407667
2 651108.9 7407285
3 648985 7399439
IDEMITSU AUSTRALIA
CHAPTER 4 – PROJECT DESCRIPTION AND ALTERNATIVES 11
4 649285.5 7398580
The setup of the flares will be risk based and include an exclusion zone which will be fenced to prohibit wildlife and people from unauthorised entry. This exclusion area would be approximately 80 m by 20 m on disturbed land and would not require vegetation clearing (other than maintenance of grass levels to minimise fire risk). These locations would utilise existing tracks on existing mining leases for construction purposes and ongoing general access and maintenance matters. Flaring stacks would be approximately 8 m tall with the flare height being up to 3 m above the stack. The total area of the exclusion zones for the 4 flares would be approximately 0.6ha.
Further information regarding the greenhouse gas assessment is presented in Chapter 7 (Air Quality and Greenhouse Gases).
Compressed air
Surface compressors are currently located within the Red Hill infrastructure complex located in Pit C above the portals as shown in Figure 4-2. The existing compressed air system will be adequate to support the Project.
Electricity supply
66 kilovolt (kV) power is currently provided to Ensham Mine from the Ergon Lilyvale substation via an existing 27km overhead transmission line. The underground mine is supplied via an existing 66/11 kV 10 megavolt amp transformer located at Red Hill.
Demand modelling conducted for the Project indicates there is sufficient capacity to supply power for the Project and no new surface electrical infrastructure will be required.
Should additional underground power be required for the Project then a borehole will be established. The location of the borehole would be in the northern section of ML 70365 on non-strategic cropping land and above 0.1% AEP flood line.
Communications
The current underground communications system is located along conveyors, mining operations and
substations to provide communications between underground and surface personnel.
The existing underground fibre optic communication network is adequately servicing the current mining
operations and will be extended underground as required for the Project.
Raw water supply
The current water supply system at Ensham Mine, including surface potable water infrastructure, will be utilised
for the Project. Additional piping and booster pumps will be installed underground to supply the required water
pressure for the Project.
No changes in water licencing arrangements are expected for the Project.
Mine dewatering
Mine affected water is currently pumped from the underground to surface infrastructure using a dedicated
dewatering system. This dewatering system would be extended underground for the Project.
No changes to the surface mine water infrastructure would to be required. The water management system will
be adequate to manage Project mine water as assessed in Chapter 9 (Water Balance and Water Quality).
Flood protection
Flood protection will continue to be provided to the open cut pits and underground portals in proximity to the
floodplain using the existing Regulated Structures (the levees) as licenced under the current EA. These levees

IDEMITSU AUSTRALIA
CHAPTER 4 – PROJECT DESCRIPTION AND ALTERNATIVES 12
are certified on an annual basis by a suitably qualified RPEQ engineer to a 0.1% AEP + 0.5m flood height. No
changes to these levees will be required. This matter is discussed in more detail in Chapter 10 (Flooding and
Hydrology).
IDEMITSU AUSTRALIA
CHAPTER 4 – PROJECT DESCRIPTION AND ALTERNATIVES 13
Surface buildings
The existing surface buildings have sufficient capacity for the Project. No new surface buildings will be required
to be constructed for the Project.
Workforce
Operational workforce
The Ensham Mine currently employs approximately 692 full-time equivalent (FTE) personnel, who are a
mixture of local Emerald and surrounding community-based persons, and, drive in/drive out and fly in/fly out
persons. This workforce will be maintained up to approximately 2022 when the current open-cut operations
are scheduled to be completed. From that time, the workforce will reduce to approximately 613 FTE personnel
inclusive of the Project. As discussed in Section 4.7, operations in Zone 1 would commence at a later time
after obtaining all necessary approvals. If approved, the workforce is expected to be maintained at
approximately 613 FTE personnel until approximately 2037. After completion of the underground mining
activities, the workforce will decline with the remaining personnel dedicated to completing rehabilitation
activities for the site.
Secondary employment opportunities currently supported through the ancillary services to the Ensham Mine include extended requirements for workforce accommodation and a large range of mine support services such as, fabrication, maintenance, and rehabilitation related services.
Hours of operation
Production personnel currently work 12 hour rotating shifts (day/night) on a 7/7 roster, whereas staff principally
work 10-hour day shifts on a 5/2 roster.
No changes to the existing roster arrangements and workforce residential locations, other than the extension
of production activities to 2029, are expected for the Project.
Workforce accommodation
The current workforce is a mixture of local Emerald and surrounding community-based persons and drive
in/drive out and fly in/fly out personnel. The Social Impact Assessment previously prepared for zones 1,2,3
(AECOM 2020) identifies that approximately 78 per cent of Ensham Mine personnel are either Emerald based
or drive in/drive out based. In addition to the local workforce that reside in local community housing, Ensham
Mine maintains a 600 person worker camp.
As the Project does not involve any material construction activity, there would be no construction workforce required. It is expected that current operational workforce arrangements will continue for the Project and no new accommodation facilities would therefore be required.
Transport infrastructure
Road transport and traffic
As there is no construction phase or increase in personnel numbers required for the Project, there will be no
increase in traffic volume from current approved levels, and will have no discernible impact on the operation
of the relevant sections of both the state-controlled (Capricorn Highway) and CHRC controlled (Duckponds
Road) networks. A detailed assessment of the Capricorn Highway/Duckponds Road intersection identified that
the current configuration would be more than adequate to cater for Project traffic volumes is shown in Chapter
16 (Transport).
As such, the existing access facilities for Ensham Mine currently provided via the gated access on Duckponds Road will be suitable to cater for the Project. Accordingly, no changes to the road infrastructure will be required.
IDEMITSU AUSTRALIA
CHAPTER 4 – PROJECT DESCRIPTION AND ALTERNATIVES 14
Rail transport and port operations
Product coal from Ensham Mine is railed on the Aurizon managed Central Queensland Coal Network known as the Blackwater System for delivery to both the Gladstone Coal Terminal and the Gladstone Power Station. As there are no expected increases to the annual coal production rate as shown in Figure 4-3, there will be no requirement for changes in either the rail or port requirements.
Coal collected for marketing and quality control purposes may be transported by road. Volumes to be transported are not forecast to exceed 20 tonnes per annum and around 1 tonne per item. Exports from Gladstone Port Corporation will continue to contractually require all vessels to meet all performance and vetting requirements published by Gladstone Ports Corporation in alignment with MSQ, AMSA and IMSO prescribed code and legislation.
Waste materials
The Project will continue to generate mining and non-mining waste materials during the operational phase, as
well as wastewater and air emissions. As seen in Figure 4-3, there is no expected increase in the annual coal
production for the mine. Waste generated as part of the Project will be managed using the existing waste
management systems currently utilised by the existing mine operations. No changes to the waste management
systems onsite will be required.
A detailed waste assessment is included in Chapter 6 (Land Resources) and Chapter 15 (Waste
Management).
Mine waste - waste rock
Waste rock produced by the Project will be generated from the coal handling plant at approximately 5,700 m3
per annum. The Project will place the waste interburden, and roof and floor rock into Pit C and Pit D. The
estimated volume of waste rock from the proposed Project over the life of the mine is 45,600 m3 in total which
is approximately 0.1 per cent of total approved waste rock volumes (36 million m3) currently approved for the
rehabilitation of Pit C and Pit D. At approximately 0.1 per cent of total approved rock volume for Pit C and Pit
D, it is not expected that this addition would impact the approved final landform outcomes including final void
water heights shown in Appendix 3 of the 5A EPML00732813.
Characterisation of this waste rock including AMD potential and metalloid mobility is discussed in more detail in Chapter 6 (Land Resources).
Non-mine waste
Ensham Mine’s existing operations produce general solid and liquid wastes that are typical of mine site
operations. These sources include:
• regulated waste including hydrocarbon waste such as waste oil, oily water, oily sludge, grease, oil rags,
oil filters, as well as coolant, drums, detergents, solvents, batteries, tyres, paints, and resins
• general waste including food waste, packaging, and food containers
• recyclable waste including paper, cardboard, plastics, glass, and aluminium cans
• wood waste including timber, pallets, and off-cuts
• tyres including light vehicle tyres and mine truck tyres
• scrap metal from mine infrastructure areas including drums, conveyor rollers, air filters and
miscellaneous metal from maintenance activities.
IDEMITSU AUSTRALIA
CHAPTER 4 – PROJECT DESCRIPTION AND ALTERNATIVES 15
Waste types, annual generation rates and applied management strategies for the mine site are not expected to materially change from current operations for the Project as coal production rates will remain relatively
constant as seen in Figure 4-3.
General waste is currently transported and disposed of by an authorised waste management contractor at a
licenced landfill. There are a number of local landfills available for the site waste contractor to utilise.
Recyclable materials are taken to an authorised recycling centre for initial processing, involving segregation,
crushing, and baling for transport to various companies for recycling. Regulated wastes are transported by a
licenced waste contractor to an authorised resources recovery facility for recycling, reprocessing, treatment,
and disposal.
Sewage is treated at existing onsite sewage treatment plants with effluent used for the irrigation of rehabilitated
areas and plantation trees as authorised under the Ensham Mine EA. As there is no increase in personnel
numbers, the current system capacity will be adequate and no upgrade will be required for the Project.
The waste inventory, characteristics of non-mining wastes and their management are discussed in detail in
Chapter 14 (Waste management).
Wastewater
Waste mine water will continue to be managed using the existing water management system or the Project.
There will be no proposed changes to EA conditions for water discharges. Modelling has indicated that the
water management system will be adequate to manage mine water generated by the Project as demonstrated
in Chapter 9 (Water Balance and Water Quality).
Air emissions
Surface activities at the existing Ensham Mine with the potential to impact air quality include vehicle
movements on unsealed roads, and coal handling and crushing operations.
The main sources of direct and indirect greenhouse gas emissions from the Project are:
• Fugitive emissions of CH4 (methane) and CO2 (carbon dioxide) due to underground air ventilation
processes,
• Direct CO2 from gas flaring of coal seam methane pre-drainage,
• Direct CO2 emissions from fuel combusted by mining equipment/vehicles,
• Fugitive emissions from mining activities such as coal stockpiling, and, conveying of coal from the
underground to the CHP, and
• Indirect CO2 emissions from off-site electricity generation.
Modelling of air quality impacts associated with the Project predicts compliance with the current EA conditions
and will reduce over the life of the Project when the open-cut operations cease. Management of greenhouse
gas emissions from the underground mine will be achieved through flaring activities to be undertaken for Zones
2 and 3.
Air emissions associated with the Project are discussed in more detail in Chapter 7 (Air quality and
Greenhouse Gases).
4.6 Project sequencing and environmental approvals
The mining sequence for the Project will involve Zone 2 as the first underground area to be accessed in 2022.
Mining in Zone 3 is anticipated to commence in approximately 2026 and continue until 2029. Due to the need
IDEMITSU AUSTRALIA
CHAPTER 4 – PROJECT DESCRIPTION AND ALTERNATIVES 16
to obtain entry to Zone 2 in H1 2022, this environmental authority (EA) amendment application is to seek
approval for Zone 2 and 3 only. As the underground mining and associated activities for Zones 2 and 3 will
occur on existing mining leases, there will be no requirement to apply for a new mining lease. The land for
Zones 2 and 3 is owned by the Ensham JV.
The Ensham Life of Mine - Zone 1 extension is proposed on land within MDL 217 and will require a new mining
lease. It is not part of this EA amendment application, but will be the subject of separate EA amendment and
ML applications. Operations in Zone 1 would commence after obtaining all necessary approvals. The purpose
of sequencing the necessary approvals is to ensure continuity of the operations within the existing mining
leases as a priority. The proponents are committed to mining zones 1, 2, 3 subject to obtaining the necessary
approvals.
4.7 Feasible alternatives
A range of alternative options have been considered in the development of the Project. Alternatives were
considered in terms of location, mine plan and infrastructure configuration, and mining methods. This section
discusses the range of alternatives considered and provides justification for the Project. As the development
of Zone 1 will occur at a later date and will be subject to a separate approvals process, it has been considered
in the range of feasible alternatives discussed below.
Cumulatively with zone 1, the capital costs of the Project (in 2020 dollars) are estimated at $314.9 million, and
comprise:
• $72.4 million incurred within Central Queensland,
• $107.1 million incurred within the rest of Queensland,
• $66.1 million incurred within the rest of Australia, and
• $69.3 million incurred overseas.
Of the $314.9 million, $10.9 million are one-off sustaining costs, and $304 million are ongoing sustaining costs.
Strategic alternatives
A prefeasibility assessment (PFA) (Idemitsu, 2020) was undertaken which considered a number of strategic
alternatives as discussed in summary below.
A ‘do nothing’ scenario was considered as an alternative option to the Project. This option showed that
employment for the workforce (approximately 607 FTEs) and the community and economic benefits to the
regional, state, and national economies reduce over the years leading up to the existing mine closure in 2028.
State royalties and Commonwealth tax revenue derived from the additional coal resource in the Project would
be foregone and the contribution to Queensland’s economy and COVID-19 recovery would not be realised.
This was not seen as a preferred outcome given the social and economic harm that closure of the mine would
cause, and as such, this scenario was not advanced.
Additional scenarios considered are discussed further in Table 4.2 and summarised below:
• Development of a greenfields mine separate to the existing Ensham Mine and current infrastructure, and
• Development of a brownfields mine expansion utilising existing Ensham Mine and current infrastructure.
Development of a greenfields underground mine was considered to involve:
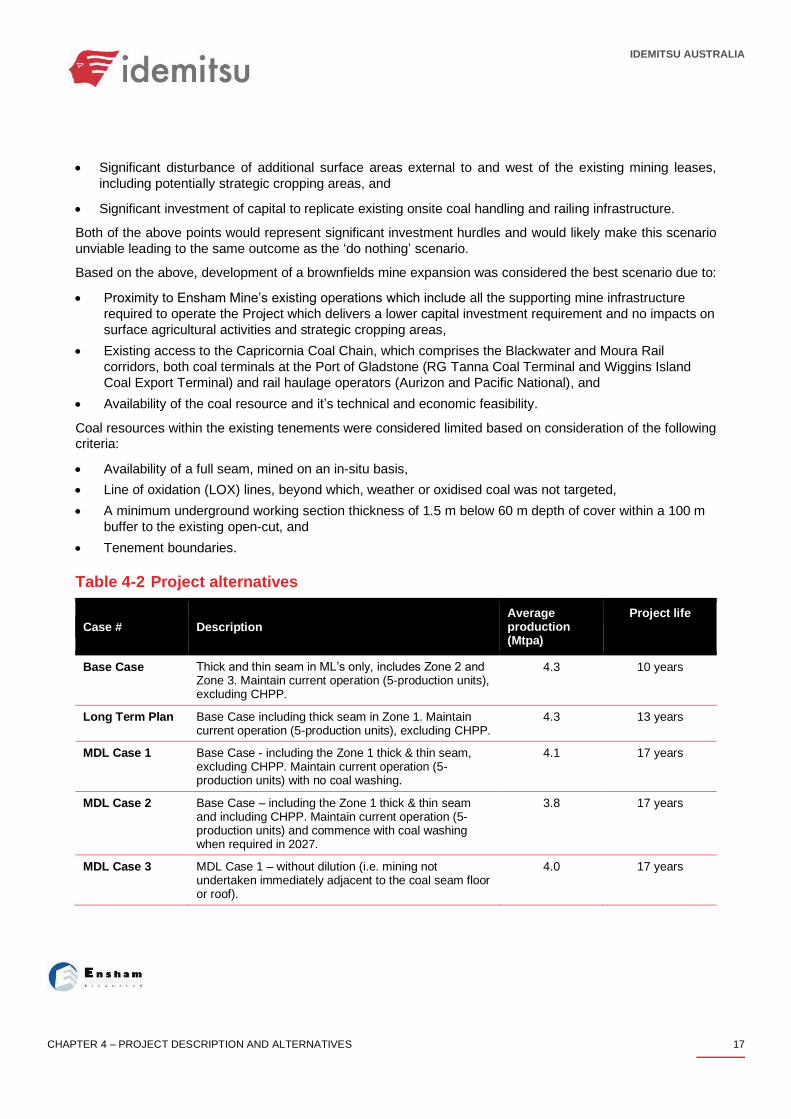
IDEMITSU AUSTRALIA
CHAPTER 4 – PROJECT DESCRIPTION AND ALTERNATIVES 17
• Significant disturbance of additional surface areas external to and west of the existing mining leases,
including potentially strategic cropping areas, and
• Significant investment of capital to replicate existing onsite coal handling and railing infrastructure.
Both of the above points would represent significant investment hurdles and would likely make this scenario
unviable leading to the same outcome as the ‘do nothing’ scenario.
Based on the above, development of a brownfields mine expansion was considered the best scenario due to:
• Proximity to Ensham Mine’s existing operations which include all the supporting mine infrastructure
required to operate the Project which delivers a lower capital investment requirement and no impacts on
surface agricultural activities and strategic cropping areas,
• Existing access to the Capricornia Coal Chain, which comprises the Blackwater and Moura Rail
corridors, both coal terminals at the Port of Gladstone (RG Tanna Coal Terminal and Wiggins Island
Coal Export Terminal) and rail haulage operators (Aurizon and Pacific National), and
• Availability of the coal resource and it’s technical and economic feasibility.
Coal resources within the existing tenements were considered limited based on consideration of the following criteria:
• Availability of a full seam, mined on an in-situ basis,
• Line of oxidation (LOX) lines, beyond which, weather or oxidised coal was not targeted,
• A minimum underground working section thickness of 1.5 m below 60 m depth of cover within a 100 m
buffer to the existing open-cut, and
• Tenement boundaries.
Table 4-2 Project alternatives
Case # Description Average production (Mtpa)
Project life
Base Case Thick and thin seam in ML’s only, includes Zone 2 and Zone 3. Maintain current operation (5-production units), excluding CHPP.
4.3 10 years
Long Term Plan Base Case including thick seam in Zone 1. Maintain current operation (5-production units), excluding CHPP.
4.3 13 years
MDL Case 1 Base Case - including the Zone 1 thick & thin seam, excluding CHPP. Maintain current operation (5-production units) with no coal washing.
4.1 17 years
MDL Case 2 Base Case – including the Zone 1 thick & thin seam and including CHPP. Maintain current operation (5-production units) and commence with coal washing when required in 2027.
3.8 17 years
MDL Case 3 MDL Case 1 – without dilution (i.e. mining not undertaken immediately adjacent to the coal seam floor or roof).
4.0 17 years
IDEMITSU AUSTRALIA
CHAPTER 4 – PROJECT DESCRIPTION AND ALTERNATIVES 18
The Base Case is limited to mining within existing approved MLs only, with no mining proposed in MDL 217.
MDL Cases 1 to 3 consider thin seam mining in Zone 1 only, and a coal handling and preparation plant is
considered in MDL Case 2 only.
MDL Case 1 was considered the preferred option. The selected option has been evaluated and proven to be
technically and financially feasible (Idemitsu, 2020). This option provides easy access to the existing coal
reserves within existing mining leases, generates minimal surface impacts, allows continuity of mining, and
ensures continuity in the associated employment to 2029.
Mine plan options analysis
With the brownfields scenario identified, the PFA undertook an analysis of potential mine plans to select a
preferred mine plan and preferred mining methodology. Having considered the social and economic aspects
in the mine scenario phase (above) the mine plan and methodology for the project were considered based on
technical and financial feasibility (Idemitsu, 2020).
Six underground mine development cases were evaluated in the PFA. All options sought to extend the Ensham
LOM to ensure employment for the existing workforce is maintained up to and beyond 2028. The identification
of options and alternatives was primarily based on:
• Seam thickness and structure (fault locations),
• Access for personnel and materials,
• Conveyor access to the surface, and
• Ventilation requirements.
The mine plan is based on the current design principles currently used at the existing Ensham Mine.
Mining methods
The existing underground mine extracts a portion of the various combined Aries/Castor seam plies using the
place change bord and pillar mining method. Bord and pillar mining was adopted due to the intensity of faulting
(typical of the Rangal Coal Measures) and the presence of the Nogoa River and its floodplain (Idemitsu, 2020).
All of the alternative options considered would adopt the same bord and pillar mining method.
Ecologically sustainable development
The Project’s compatibility was reviewed against the objectives and principles defined in the National Strategy
for Ecologically Sustainable Development (Ecologically Sustainable Development Steering Committee, 1992)
(Table 4-3).
The goals of ecologically sustainable development are to develop and improve the quality of life, both now and
in the future, in a manner that maintains the integrity of ecological processes on which life depends.
IDEMITSU AUSTRALIA
CHAPTER 4 – PROJECT DESCRIPTION AND ALTERNATIVES 19
Table 4-3 Integration of ESD principles into the Project development
Guiding principles of ESD Integration into Project development
Core objectives
To enhance individual and community well-being and welfare by following a path of economic development that safeguards the welfare of future generations
The Project will provide significant social and economic benefits to the broader community in terms of economic stimulus from export revenues and royalties, increased employment opportunities and opportunities for suppliers. Outcomes for the “do nothing” and “greenfields development” scenarios would not assist in the enhancement of individual and community well-being and welfare through economic development that safeguards the welfare of future generations.
To provide for equity within and between generations (the Intergenerational Equity Principle)
Through appropriate management strategies and monitoring of the impacts, the Project will not significantly reduce, or fail to maintain the health, diversity and productivity of the Queensland environment or affect future generations.
Disturbed land associated with the Project will be progressively rehabilitated as detailed in Chapter 6 (Land Resources).
The brownfields nature of the Project provides opportunities for the Project to minimise impacts. This will include making use of existing infrastructure within previously disturbed areas at Ensham Mine, thereby avoiding the requirement for clearing of vegetation.
Water management practices currently employed at Ensham Mine will ensure that the downstream water quality is not adversely affected by the Project. Measures to protect water quality are detailed in Chapter 9 (Water Balance and Water Quality).
Project emissions will be minimised or mitigated to have no significant long-term adverse effect on the surrounding environment. Mitigation measures are discussed in more detail in Chapter 7 (Air Quality and Greenhouse Gases).
To protect biological diversity and maintain essential ecological processes and life-support systems
The terrestrial and aquatic ecology values in the vicinity of the Project are described in Chapter 12 (Terrestrial Ecology) and Chapter 13 (Aquatic Ecology) respectively. These chapters also provide an assessment of the impacts along with mitigation measures throughout the life of the Project.
As very limited surface disturbance and groundwater drawdown is expected as a result of the Project, including surface subsidence, potential impacts to terrestrial and aquatic ecosystems from the Project are very limited.
IDEMITSU AUSTRALIA
CHAPTER 4 – PROJECT DESCRIPTION AND ALTERNATIVES 20
Guiding principles of ESD Integration into Project development
Guiding ESD principles
Decision-making processes should effectively integrate both long and short term economic, environmental, social and equity considerations
The Project will provide immediate and long-term benefits to the economic and social fabric of Queensland and in particular the Central Highlands region. The Project will contribute to the national, state, and local economies.
Where there are threats of serious or irreversible environmental damage, lack of full scientific certainty should not be used as a reason for postponing measures to prevent environmental degradation (the Precautionary Principle)
Ensham JV has undertaken an assessment of the risk of serious or irreversible environmental damage consistent with the Precautionary Principle and used the findings to determine appropriate environmental control strategies. The assessment identified that there are no serious or irreversible environmental damage for the Project. Full details of the risk assessment are detailed in this EA Amendment Chapter 18 (Commitments). The Project has the technical and financial support and resources to establish and maintain these environmental protection controls.
The global dimension of environmental impacts of actions and policies should be recognised and considered
Ensham JV is aware of their corporate responsibilities in relation to the Project. The Ensham JV participates in the Australian Greenhouse Challenge program, a federal government initiative to encourage reductions in greenhouse gas emissions.
The Project will generate greenhouse gas emissions from site operations, product transport and product use. As outlined in Chapter 7 (Air Quality and Greenhouse Gases), Ensham JV has recognised and considered these aspects and proposes a range of mitigation measures for site level emissions.
The need to develop a strong, growing and diversified economy which can enhance the capacity for environmental protection should be recognised
The Project will add value to international, Australian and Queensland economies. There will be indirect flow on effects to other areas of the Queensland economy as a result of the Project. Ensham Mine will continue to make use of local suppliers and contractors during the Project as detailed in Chapter 4 (Project Description and Alternatives).
The need to maintain and enhance international competitiveness in an environmentally sound manner should be recognised
Ensham Mine currently performs consistently in the top ten bord and pillar operations globally. The Project will continue Australia’s international competitiveness. Ensham JV has used the Project’s proximity to the existing Ensham Mine to minimise environmental impacts and will be subject to an EA and contemporary management plans ensuring that all environmental impacts are managed appropriately.
Cost-effective and flexible policy instruments should be adopted, such as improved valuation, pricing, and incentives mechanisms
The Project is consistent with the relevant local, State and Commonwealth government policies. By expanding within the existing mining leases and utilizing existing site infrastructure,
IDEMITSU AUSTRALIA
CHAPTER 4 – PROJECT DESCRIPTION AND ALTERNATIVES 21
Guiding principles of ESD Integration into Project development
the proposed expansion will be both cost effective and will minimise additional environmental impacts.
Decisions and actions should provide for broad community involvement on issues which affect them
Ensham JV has undertaken community consultation prior to preparing the EIS, which is detailed in Chapter 3 (Stakeholder Consultation) process and will continue the progress through the Project’s life. Ensham JV will continue to work with and maintain open communication with the community and stakeholders on all aspects of Ensham Mine. Ensham JV will continue to have meetings with local councils and continue briefings with community groups and stakeholders.
To maintain and enhance compliance
to export guidelines, regulations, and protocols
Exports from Gladstone Port Corporation will continue to contractually require all vessels to meet all performance and vetting requirements published by Gladstone Ports Corporation in alignment with MSQ, AMSA and IMSO prescribed code and legislation.
Specific ESD objectives for the mining sector
To ensure mine sites are rehabilitated to sound environmental and safety standards and to a level at least consistent with the condition of surrounding land
Ensham JV has prepared a Rehabilitation Management Plan for the Project (refer Chapter 6 (Land Resources) in which the land disturbed by the Project is to be progressively rehabilitated to a safe and stable landform that does not cause environmental harm and is able to sustain an approved post-mining land use.
To provide appropriate community returns for using mineral resources and achieve better environmental protection and management in the mining sector
This Project will produce coal for domestic and international consumption. Increased demand for coal products in south-east Asia and other international markets has created a window of opportunity for the extension of Ensham Mine. For the foreseeable future, coal exports from the Project will provide significant revenues to Commonwealth, State, and local Governments.
The Project will be developed to minimise resource waste and sterilisation. The mine sequencing will be designed to maximise resource extraction.
Ensham JV has undertaken a comprehensive environmental assessment process to identify the opportunities to improve environmental protection and management for the Project. This assessment documents the detailed assessments that have been undertaken. In addition, the summary of commitments (Chapter 18 (Commitments)) outlines the proposed environmental management strategies for the Project. The Project has the technical and financial support to establish and maintain these environmental management controls.
IDEMITSU AUSTRALIA
CHAPTER 4 – PROJECT DESCRIPTION AND ALTERNATIVES 22
Guiding principles of ESD Integration into Project development
To improve community consultation and information, improve performance in occupational health and safety and achieve social equity objectives
Ensham JV has undertaken community consultation prior to preparing this EA Amendment. The details of which, are presented in Chapter 3 (Stakeholder Consultation). The Ensham JV has undertaken a review of the risks to occupational health and safety posed by the Project and proposes appropriate management measures as detailed throughout the respective documents.

RIDA Application 620.30686.00600-RevI.docx Page 1 of 4L\343884466.1
APPENDIX BEIS Submissions Register

RIDA Application 620.30686.00600-RevI.docx Page 2 of 4L\343884466.1
THE EIS SUBMISSIONS REGISTER INSIDE THE ENSHAM LIFE OFMINE EXTENSION PROJECT EIS IN 2021 CAN BE FOUND:
HTTPS://WWW.IDEMITSU.COM.AU/MINING/WP-CONTENT/UPLOADS/2020/07/CHAPTER-
28-SUBMISSION-REGISTER.PDF
RIDA Application 620.30686.00600-RevI.docx Page 3 of 4L\343884466.1
APPENDIX CSoil and Land Resource Assessment
SLR Ref: 620.30686.00000-R01 Version No: -v4.0 March 2022
ENSHAM LIFE OF MINE EXTENSION PROJECT - ZONES 2 AND 3
Land Resources
Prepared for:
Ensham Resources Pty Ltd Level 9/175 Eagle Street
Brisbane QLD 4000
Ensham Resources Pty Ltd Ensham Life of Mine Extension Project - Zones 2 and 3 Land Resources
SLR Ref No: 620.30686.00000-R01-v4.0-RevF.docx March 2022
620.30686.00000-R01-v4.0-RevF.docx Page 2
PREPARED BY
SLR Consulting Australia Pty Ltd ABN 29 001 584 612 Level 16, 175 Eagle Street Brisbane QLD 4000 Australia (PO Box 26 Spring Hill QLD 4004) T: +61 7 3858 4800 E: [email protected] www.slrconsulting.com
BASIS OF REPORT
This report has been prepared by SLR Consulting Australia Pty Ltd (SLR) with all reasonable skill, care and diligence, and taking account of the timescale and resources allocated to it by agreement with Ensham Resources Pty Ltd (the Client). Information reported herein is based on the interpretation of data collected, which has been accepted in good faith as being accurate and valid.
This report is for the exclusive use of the Client. No warranties or guarantees are expressed or should be inferred by any third parties. This report may not be relied upon by other parties without written consent from SLR.
SLR disclaims any responsibility to the Client and others in respect of any matters outside the agreed scope of the work.
DOCUMENT CONTROL
Reference Date Prepared Checked Authorised
620.30686.00000-R01-v4.0 14 March 2022 D. Clarke A. Koeman A. Koeman
620.30686.00000-R01-v3.0 3 March 2022 D. Clarke A. Koeman A. Koeman
620.30686.00000-R01-v3.0 3 March 2022 D. Clarke A. Koeman A. Koeman
620.30686.00000-R01-v2.0 24 February 2022 D. Clarke A. Koeman A. Koeman
Ensham Resources Pty Ltd Ensham Life of Mine Extension Project - Zones 2 and 3 Land Resources
SLR Ref No: 620.30686.00000-R01-v4.0-RevF.docx March 2022
EXECUTIVE SUMMARY
620.30686.00000-R01-v4.0-RevF.docx Page 3
SLR Consulting Pty Ltd (SLR) was commissioned by Ensham Resources Pty Ltd to complete a Soil and Land Resource Assessment (the Assessment) of the Ensham Life of Mine Extension Project – Zones 2 and 3 (the Project) at Ensham Mine (Ensham), which is the subject of an environmental authority (EA) Amendment application.
The scope of the Assessment included a soil survey, interpretation of soil testing results and a geochemical waste rock assessment to determine the following:
• Soil types
• Land suitability assessment
• Soil resources assessment (topsoil and subsoil volumes)
• Description of soil qualities (erosion risk, dispersion and salinity risks), and
• Waste rock acid generating potential, metal abundance and leachability.
Within the Project, a total of five Soil Map Units (SMU) were identified based on the dominant Australian Soil Classification (ASC) soil types. The majority soil type within the Project is a Eutrophic Brown Dermosol, which has been split into 2A and 2B to represent the changes between Zone 2 and Zone 3. The other SMUs are made up of smaller areas of Magnesic Brown Kandosols, Clastic Rudosols and Crusty Brown Vertosols.
The land suitability assessment indicates the Project consists of:
• Class 4 (marginal land with severe limitations) and Class 5 (unsuitable land) for cropping, and
• Class 2 (suitable land with minor limitations), Class 3 (suitable land with moderate limitations) and Class 5 for grazing.
The main limitations of the soil in the Project were soil wetness (w) and soil water availability (m). There will be no decrease in quality of suitability class land within the Project resulting from the four proposed flares post-rehabilitation.
The agricultural land assessment indicates the Project consists of:
• Class A2 (a wide range of crops and/or horticultural crops)
• Class C2 (grazing native pastures on with lower fertility soils than C1), and
• Class C3 (light grazing of native pastures and land suited to forestry).
The Project will require the addition of four flares in already cleared areas. There will be no decrease in quality of agricultural land within the Project resulting from the proposed flares post-rehabilitation.
Soil resources include a topsoil volume of 1,594,400 m3 and a subsoil volume of 3,825,600 m3. It is noted that no soil stripping is proposed as part of the Project as no land is required to be cleared. Therefore, no changes in soil resource volume will occur.
The waste rock assessment indicates:
• The waste rock is non-acid generating and has significant buffering capacity

Ensham Resources Pty Ltd Ensham Life of Mine Extension Project - Zones 2 and 3 Land Resources
SLR Ref No: 620.30686.00000-R01-v4.0-RevF.docx March 2022
EXECUTIVE SUMMARY
620.30686.00000-R01-v4.0-RevF.docx Page 4
• The geochemical abundance index results showed very low and depleted (compared to median crustal concentrations) metal concentrations for most metals
• Leachability of metals showed several exceedances of guideline values for aquatic ecosystem protection, particularly aluminium and vanadium. Such exceedances are unlikely at the reported pH and are likely to be the result of colloid transport through the 0.45µm filter membrane
• The waste rock will be buried within the open cut pits and results indicate any adverse impact from metals concentration and leachability is unlikely, and
• The estimated volume of waste rock from the proposed Project over the life of the mine is 45,600 m3 in total, which is approximately less than 0.13% of total approved waste rock volumes (36 million m3) currently approved for the rehabilitation of open cut Pit C and Pit D. At less than 0.13% of total approved rock volume for Pit C and Pit D, it is not envisaged that this addition would impact the approved final landform outcomes in Appendix 3 of the EA.
Ensham Resources Pty Ltd Ensham Life of Mine Extension Project - Zones 2 and 3 Land Resources
SLR Ref No: 620.30686.00000-R01-v4.0-RevF.docx March 2022
CONTENTS
620.30686.00000-R01-v4.0-RevF.docx Page 5
1 INTRODUCTION ....................................................................................................... 9
1.1 Purpose ............................................................................................................................. 9
1.2 Relevant Guidelines and Standards ................................................................................ 11
1.3 Assessment Considerations ............................................................................................ 11
1.3.1 Mine Spoil Areas ........................................................................................................................................... 11
1.3.2 Flare Exclusion Areas .................................................................................................................................... 11
2 METHODOLOGY .................................................................................................... 13
2.1 Desktop Review of Geology, Geomorphology, Land Systems and Soils ......................... 13
2.2 Regional Planning Interests Act ...................................................................................... 13
2.3 Field Assessment and Sampling Program ....................................................................... 16
2.3.1 Soil Field Program ......................................................................................................................................... 16
2.3.2 Waste Rock Characterisation ....................................................................................................................... 18
2.4 Land Classification Systems ............................................................................................ 21
2.4.1 Land Suitability Class .................................................................................................................................... 21
2.4.2 Agricultural Land Class ................................................................................................................................. 21
3 EXISTING ENVIRONMENT ....................................................................................... 22
3.1 Climate ............................................................................................................................ 22
3.2 Geology ........................................................................................................................... 22
3.3 Topography and Hydrology ............................................................................................ 22
3.4 Vegetation and Land Use ................................................................................................ 24
3.5 Land Systems .................................................................................................................. 24
3.6 Waste Rock Source ......................................................................................................... 26
3.7 Previous Investigations ................................................................................................... 26
3.7.1 Hansen Consulting ........................................................................................................................................ 26
3.7.1.1 Soil Classification .......................................................................................................................................... 26
3.7.1.2 Land Suitability ............................................................................................................................................. 26
3.7.1.3 Agricultural Land .......................................................................................................................................... 27
3.7.2 GT Environmental ......................................................................................................................................... 27
3.7.2.1 Soil Classification .......................................................................................................................................... 27
3.7.2.2 Agricultural Land .......................................................................................................................................... 28
3.7.3 Waste Rock Characterisation ....................................................................................................................... 28
3.7.3.1 URS 2005 ...................................................................................................................................................... 28
3.7.3.2 URS 2015 ...................................................................................................................................................... 28
4 SOIL SURVEY RESULTS ........................................................................................... 29
Ensham Resources Pty Ltd Ensham Life of Mine Extension Project - Zones 2 and 3 Land Resources
SLR Ref No: 620.30686.00000-R01-v4.0-RevF.docx March 2022
CONTENTS
620.30686.00000-R01-v4.0-RevF.docx Page 6
4.1 Soil Classification and Description .................................................................................. 29
4.1.1 Vertosols....................................................................................................................................................... 29
4.1.2 Dermosols .................................................................................................................................................... 29
4.1.3 Kandosols ..................................................................................................................................................... 30
4.1.4 Rudosols ....................................................................................................................................................... 30
4.2 Soil Map Units ................................................................................................................. 30
4.2.1 Soil Map Unit 1 ............................................................................................................................................. 34
4.2.1.1 Description ................................................................................................................................................... 34
4.2.1.2 Location ........................................................................................................................................................ 34
4.2.1.3 Land Use ....................................................................................................................................................... 34
4.2.1.4 Management Considerations ....................................................................................................................... 34
4.2.2 Soil Map Unit 2A ........................................................................................................................................... 34
4.2.2.1 Description ................................................................................................................................................... 34
4.2.2.2 Location ........................................................................................................................................................ 34
4.2.2.3 Land Use ....................................................................................................................................................... 34
4.2.2.4 Management Considerations ....................................................................................................................... 34
4.2.3 Soil Map Unit 2B ........................................................................................................................................... 35
4.2.3.1 Description ................................................................................................................................................... 35
4.2.3.2 Location ........................................................................................................................................................ 35
4.2.3.3 Land Use ....................................................................................................................................................... 35
4.2.3.4 Management Considerations ....................................................................................................................... 35
4.2.4 Soil Map Unit 3 ............................................................................................................................................. 35
4.2.4.1 Description ................................................................................................................................................... 35
4.2.4.2 Location ........................................................................................................................................................ 35
4.2.4.3 Land Use ....................................................................................................................................................... 35
4.2.4.4 Management Considerations ....................................................................................................................... 35
4.2.5 Soil Map Unit 4 ............................................................................................................................................. 36
4.2.5.1 Description ................................................................................................................................................... 36
4.2.5.2 Location ........................................................................................................................................................ 36
4.2.5.3 Land Use ....................................................................................................................................................... 36
4.2.5.4 Management Considerations ....................................................................................................................... 36
4.3 Erosion Potential ............................................................................................................. 36
4.4 Waste Rock Characterisation .......................................................................................... 37
4.4.1 Waste Rock Characterisation ....................................................................................................................... 37
4.4.2 Acid Producing Potential .............................................................................................................................. 37
4.4.3 Geochemical Abundance Index (GAI) ........................................................................................................... 38
Ensham Resources Pty Ltd Ensham Life of Mine Extension Project - Zones 2 and 3 Land Resources
SLR Ref No: 620.30686.00000-R01-v4.0-RevF.docx March 2022
CONTENTS
620.30686.00000-R01-v4.0-RevF.docx Page 7
4.4.4 Waste Rock Leachate Characteristics ........................................................................................................... 41
4.5 Soil Resources ................................................................................................................. 43
5 SOIL AND LAND RESOURCE IMPACT ASSESSMENT .................................................. 43
5.1 Land Suitability Methodology ......................................................................................... 44
5.2 Pre-Mining Land Suitability Results ................................................................................ 45
5.2.1 Pre-Mining Land Suitability for Cropping ..................................................................................................... 45
5.2.2 Pre-Mining Land Suitability for Grazing ........................................................................................................ 45
5.2.3 Post-Mining .................................................................................................................................................. 45
5.3 Agricultural Land Class Assessment ................................................................................ 48
5.4 Agricultural Land Class Results ....................................................................................... 49
5.4.1 Pre-Mining .................................................................................................................................................... 49
5.4.2 Post-Mining .................................................................................................................................................. 49
6 CONCLUSIONS ....................................................................................................... 51
7 REFERENCES .......................................................................................................... 53
DOCUMENT REFERENCES
TABLES
Table 1 Approximate Flare Locations ....................................................................................... 11 Table 2 Field Assessment Parameters ...................................................................................... 18 Table 3 Sampling frequency based on waste rock tonnage (MEND, 2009) .............................. 18 Table 4 Average Monthly Climate Data for Emerald Airport .................................................... 22 Table 5 Land Systems in Project Area ....................................................................................... 24 Table 6 SMU Soil Types ............................................................................................................. 30 Table 7 Field Investigation Sites ................................................................................................ 31 Table 8 Summary of results for 12 waste rock samples ........................................................... 38 Table 9 Median crustal abundance for trace metals (Berkman and Ryall, 1976; Bowen,
1979) ............................................................................................................................ 39 Table 10 GAI summary of 12 waste rock samples ...................................................................... 40 Table 11 ASLP results of the 12 drill core waste rock samples compared to the aquatic
ecosystem 95% protection level .................................................................................. 42 Table 12 Available Topsoil Resource Summary .......................................................................... 43 Table 13 Available Subsoil Resource Summary .......................................................................... 43 Table 14 Land Suitability Classes ................................................................................................ 44 Table 15 Pre- and Post-Mining Cropping Land Suitability Class ................................................. 46 Table 16 Pre- and Post-Mining Grazing Land Suitability Class .................................................... 46 Table 17 Agricultural Land Classes .............................................................................................. 48 Table 18 Pre- and Post-Mining Agricultural Land Classes ........................................................... 49
Ensham Resources Pty Ltd Ensham Life of Mine Extension Project - Zones 2 and 3 Land Resources
SLR Ref No: 620.30686.00000-R01-v4.0-RevF.docx March 2022
CONTENTS
620.30686.00000-R01-v4.0-RevF.docx Page 8
FIGURES
Figure 1 Project Regional Setting ............................................................................................... 10 Figure 2 Project Location............................................................................................................ 12 Figure 3 Priority Agricultural Area .............................................................................................. 14 Figure 4 Strategic Cropping Area ............................................................................................... 15 Figure 5 Field Sampling Plan ...................................................................................................... 17 Figure 6 Zone 2 Waste Rock Characterisation Boreholes .......................................................... 19 Figure 7 Zone 3 Waste Rock Characterisation Boreholes .......................................................... 20 Figure 8 Topography & Hydrology ............................................................................................. 23 Figure 9 Land Systems ................................................................................................................ 25 Figure 10 Soil Map Units .............................................................................................................. 32 Figure 11 Sample Sites & ASC Soil Types ...................................................................................... 33 Figure 12 Acid producing potential characteristics of total 12 waste rock samples ................... 38 Figure 13 Cropping and Grazing Land Suitability Class ................................................................ 47 Figure 14 Agricultural Land Classes .............................................................................................. 50
APPENDICES
Appendix A Soil Laboratory Certificates of Analysis Appendix B Detailed Profile Descriptions Appendix C Check Site Descriptions Appendix D Emerson Aggregate Test Ratings Appendix E Land Suitability and Agricultural Land Classification

Ensham Resources Pty Ltd Ensham Life of Mine Extension Project - Zones 2 and 3 Land Resources
SLR Ref No: 620.30686.00000-R01-v4.0-RevF.docx March 2022
620.30686.00000-R01-v4.0-RevF.docx Page 9
1 Introduction
SLR Consulting Pty Ltd (SLR) was commissioned by Ensham Resources Pty Ltd to complete a soil and land resource assessment (the Assessment) of the Ensham Life of Mine Extension Project – Zones 2 and 3 (the Project) at Ensham Mine (Ensham), which is the subject of an environmental authority (EA) Amendment application. The Project is located approximately 35 km east of Emerald.
The Project aims to extend the life of the existing underground operations at Ensham by two years, with coal production planned to continue at a rate of approximately 4.5 million tonnes per annum (Mtpa). The Project covers approximately 603 hectares (ha), with approximately 521 ha encompassing the mining footprint and includes two zones:
• Zone 2: partially includes existing leases ML 70326, ML 70365, and ML 7459 (total area is approximately 394 ha of which 346 ha would represent the mining footprint), and
• Zone 3: partially includes existing leases ML 7459 and ML 70366 (total area is approximately 209 ha of which 175 ha would represent the mining footprint).
The regional setting of the Project is depicted in Figure 1.
1.1 Purpose
The purpose of the Assessment is to provide an assessment of impacts to the soil and land resources within the Project as a result of surface disturbance. The Assessment included a soil survey, interpretation and waste rock geochemical characterisation to summarise the following:
• Soil types
• Land suitability assessment
• Soil resources assessment
• Waste rock acid generating potential, metal abundance and leachability, and
• Description of soil qualities (erosion risk, dispersion and salinity risks).
Gordon Geotechniques Pty Ltd was commissioned by Ensham to undertake subsidence modelling to assess the potential impacts of the Project (Idemitsu Australia, 2022 – Appendix B (Subsidence), which includes a peer review letter (Idemitsu Australia, 2022 – Appendix B-1)) and prepare a Subsidence Management Plan (Idemitsu Australia, 2022 – Appendix C (Subsidence Management Plan), which includes a peer review letter (Idemitsu Australia, 2022 – Appendix C-1). Results indicated low levels of subsidence, typically less than 35 mm, are predicted for the Project. Real-Time Kinematic Global Positioning System monitoring indicates subsidence levels of less than 10 mm above underground mining operations (Gordon Geotechniques Pty Ltd, 2022). Given this level of subsidence (less than 10 mm) and compared to natural soil movement of approximately 50 mm (IESC, 2015), subsidence will not impact land resources for the Project. Accordingly, subsidence is not considered further in this Assessment.
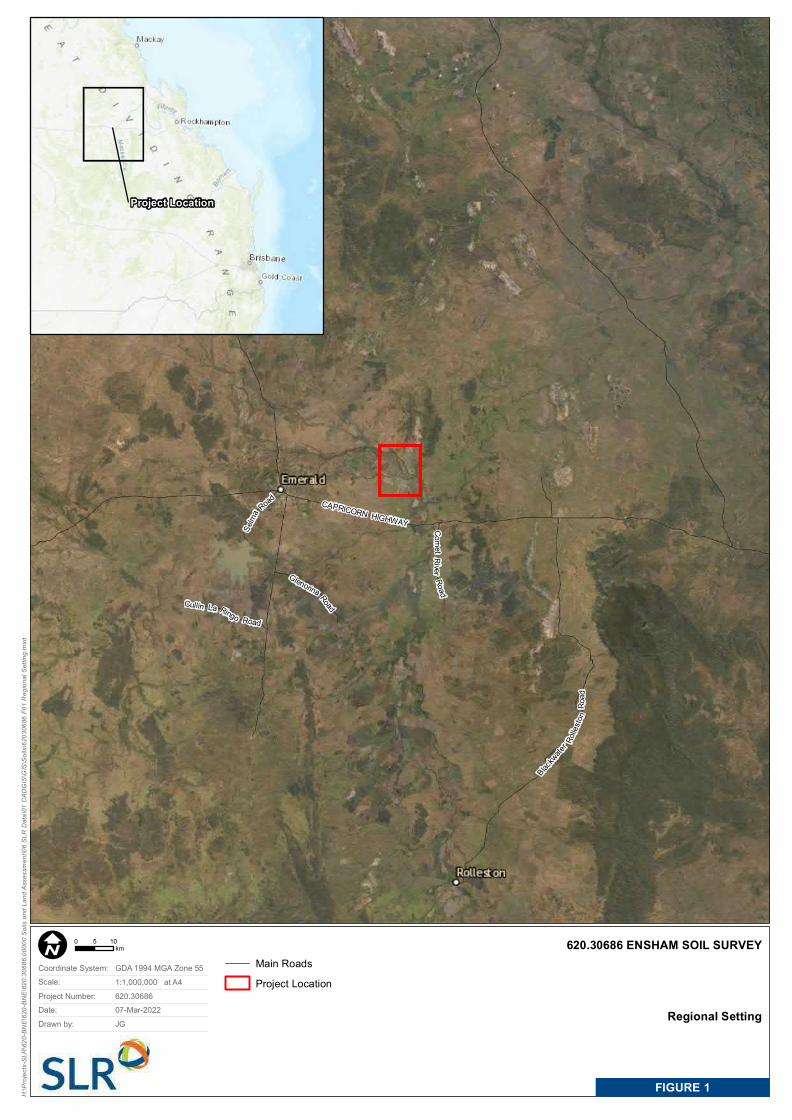
H:\P
rojec
ts-SL
R\62
0-BNE
\620-B
NE\62
0.306
86.00
000 S
oils a
nd La
nd As
sess
ment\
06 SL
R Da
ta\01
CAD
GIS\G
IS\So
ils\62
0306
86 F0
1 Reg
ional
Settin
g.mxd
620.30686 ENSHAM SOIL SURVEY
Regional Setting
FIGURE 1
CAPRICORN HIGHWAY
Gregory
Highway
Yan Yan Road
Selma
Road
Com etRiver Road
Glenorina RoadCullin La Ringo Road
Blackwate
r Rolles
tonRo
a d
0 105kmI1:1,000,000 at A4
Coordinate System: GDA 1994 MGA Zone 55Scale:Project Number: 620.30686Date: 07-Mar-2022 Drawn by: JG
Project Location
Main RoadsProject Location
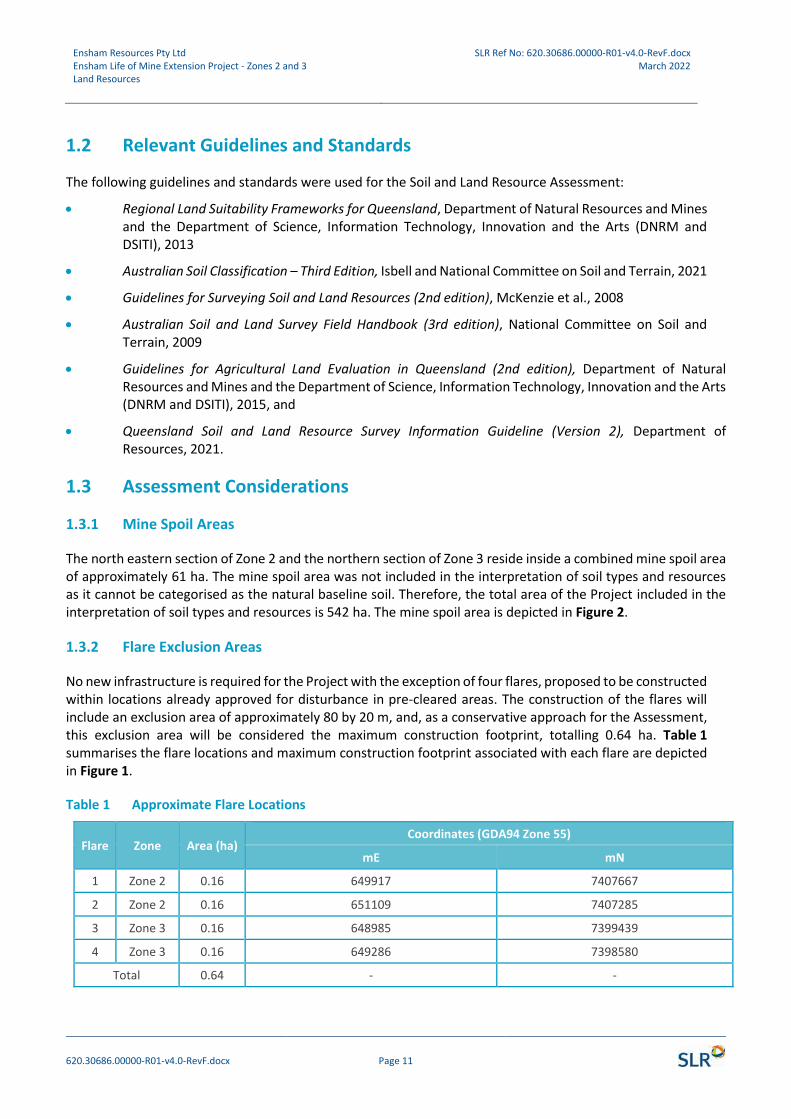
Ensham Resources Pty Ltd Ensham Life of Mine Extension Project - Zones 2 and 3 Land Resources
SLR Ref No: 620.30686.00000-R01-v4.0-RevF.docx March 2022
620.30686.00000-R01-v4.0-RevF.docx Page 11
1.2 Relevant Guidelines and Standards
The following guidelines and standards were used for the Soil and Land Resource Assessment:
• Regional Land Suitability Frameworks for Queensland, Department of Natural Resources and Mines and the Department of Science, Information Technology, Innovation and the Arts (DNRM and DSITI), 2013
• Australian Soil Classification – Third Edition, Isbell and National Committee on Soil and Terrain, 2021
• Guidelines for Surveying Soil and Land Resources (2nd edition), McKenzie et al., 2008
• Australian Soil and Land Survey Field Handbook (3rd edition), National Committee on Soil and Terrain, 2009
• Guidelines for Agricultural Land Evaluation in Queensland (2nd edition), Department of Natural Resources and Mines and the Department of Science, Information Technology, Innovation and the Arts (DNRM and DSITI), 2015, and
• Queensland Soil and Land Resource Survey Information Guideline (Version 2), Department of Resources, 2021.
1.3 Assessment Considerations
1.3.1 Mine Spoil Areas
The north eastern section of Zone 2 and the northern section of Zone 3 reside inside a combined mine spoil area of approximately 61 ha. The mine spoil area was not included in the interpretation of soil types and resources as it cannot be categorised as the natural baseline soil. Therefore, the total area of the Project included in the interpretation of soil types and resources is 542 ha. The mine spoil area is depicted in Figure 2.
1.3.2 Flare Exclusion Areas
No new infrastructure is required for the Project with the exception of four flares, proposed to be constructed within locations already approved for disturbance in pre-cleared areas. The construction of the flares will include an exclusion area of approximately 80 by 20 m, and, as a conservative approach for the Assessment, this exclusion area will be considered the maximum construction footprint, totalling 0.64 ha. Table 1 summarises the flare locations and maximum construction footprint associated with each flare are depicted in Figure 1.
Table 1 Approximate Flare Locations
Flare Zone Area (ha) Coordinates (GDA94 Zone 55)
mE mN
1 Zone 2 0.16 649917 7407667
2 Zone 2 0.16 651109 7407285
3 Zone 3 0.16 648985 7399439
4 Zone 3 0.16 649286 7398580
Total 0.64 - -
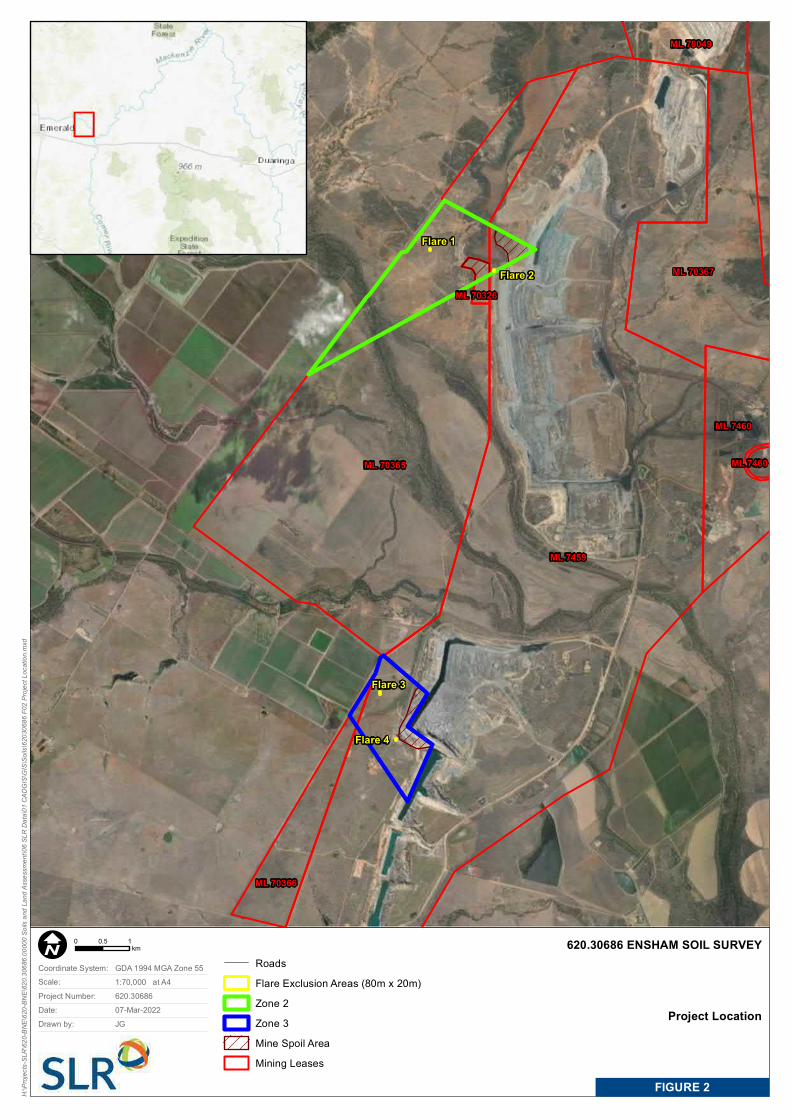
H:\P
rojec
ts-SL
R\62
0-BNE
\620-B
NE\62
0.306
86.00
000 S
oils a
nd La
nd As
sess
ment\
06 S
LR D
ata\01
CAD
GIS\
GIS\
Soils
\6203
0686
F02 P
rojec
t Loc
ation
.mxd
620.30686 ENSHAM SOIL SURVEY
Project Location
FIGURE 2
ML 70049
ML 70326
ML 70365
ML 70366
ML 70367
ML 7459
ML 7460
ML 7460
Flare 1
Flare 2
Flare 3
Flare 4
RoadsFlare Exclusion Areas (80m x 20m)Zone 2Zone 3Mine Spoil AreaMining Leases
0 10.5kmI
1:70,000 at A4Coordinate System: GDA 1994 MGA Zone 55Scale:Project Number: 620.30686Date: 07-Mar-2022 Drawn by: JG
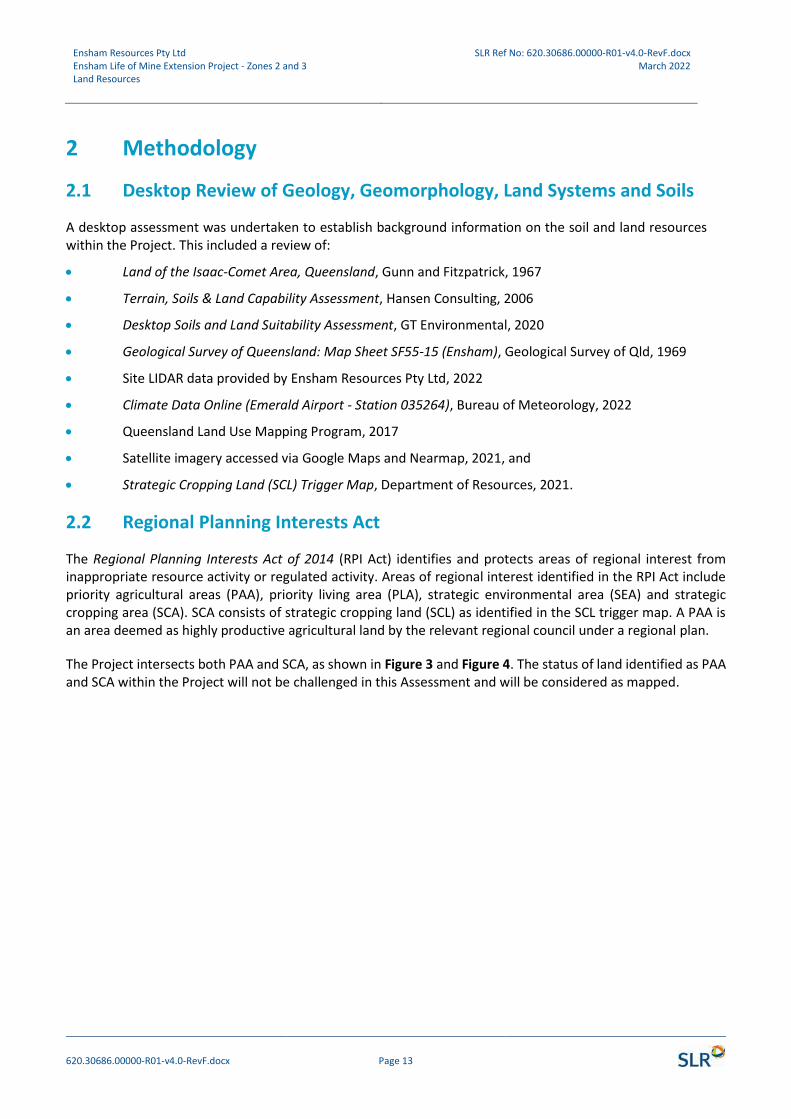
Ensham Resources Pty Ltd Ensham Life of Mine Extension Project - Zones 2 and 3 Land Resources
SLR Ref No: 620.30686.00000-R01-v4.0-RevF.docx March 2022
620.30686.00000-R01-v4.0-RevF.docx Page 13
2 Methodology
2.1 Desktop Review of Geology, Geomorphology, Land Systems and Soils
A desktop assessment was undertaken to establish background information on the soil and land resources within the Project. This included a review of:
• Land of the Isaac-Comet Area, Queensland, Gunn and Fitzpatrick, 1967
• Terrain, Soils & Land Capability Assessment, Hansen Consulting, 2006
• Desktop Soils and Land Suitability Assessment, GT Environmental, 2020
• Geological Survey of Queensland: Map Sheet SF55-15 (Ensham), Geological Survey of Qld, 1969
• Site LIDAR data provided by Ensham Resources Pty Ltd, 2022
• Climate Data Online (Emerald Airport - Station 035264), Bureau of Meteorology, 2022
• Queensland Land Use Mapping Program, 2017
• Satellite imagery accessed via Google Maps and Nearmap, 2021, and
• Strategic Cropping Land (SCL) Trigger Map, Department of Resources, 2021.
2.2 Regional Planning Interests Act
The Regional Planning Interests Act of 2014 (RPI Act) identifies and protects areas of regional interest from inappropriate resource activity or regulated activity. Areas of regional interest identified in the RPI Act include priority agricultural areas (PAA), priority living area (PLA), strategic environmental area (SEA) and strategic cropping area (SCA). SCA consists of strategic cropping land (SCL) as identified in the SCL trigger map. A PAA is an area deemed as highly productive agricultural land by the relevant regional council under a regional plan.
The Project intersects both PAA and SCA, as shown in Figure 3 and Figure 4. The status of land identified as PAA and SCA within the Project will not be challenged in this Assessment and will be considered as mapped.
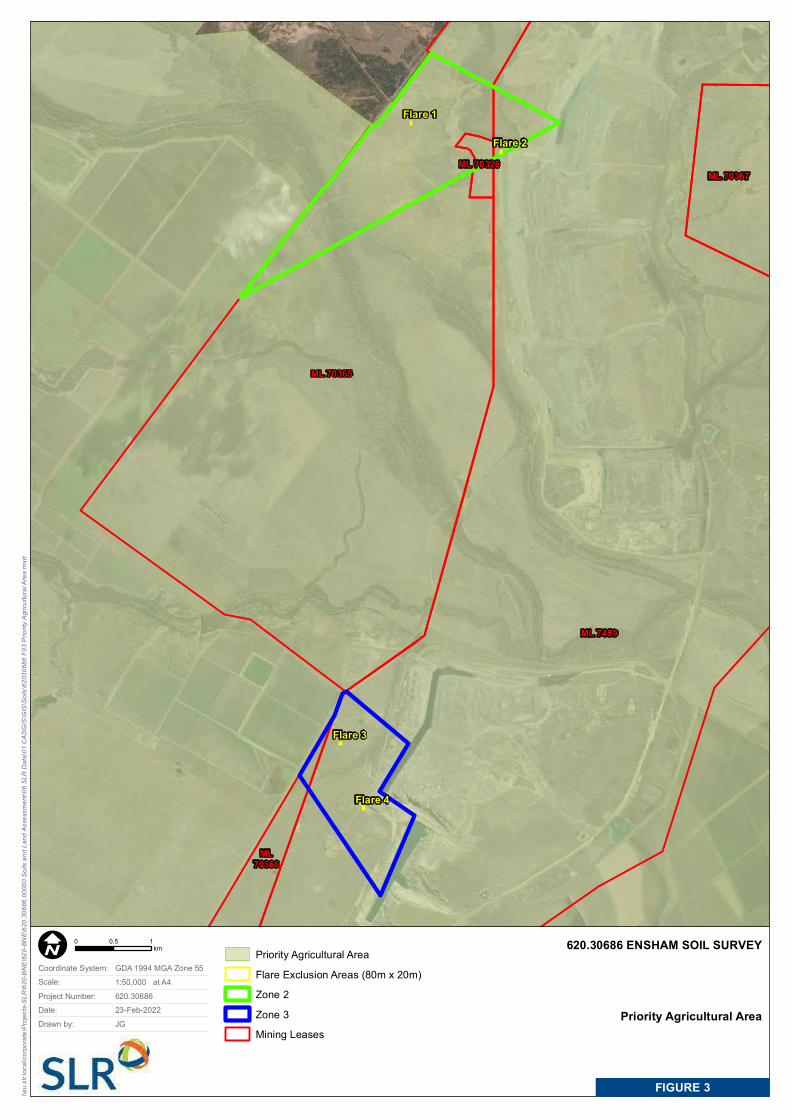
\\au.s
lr.loc
al\co
rporat
e\Proj
ects-
SLR\
620-B
NE\62
0-BNE
\620.3
0686
.0000
0 Soil
s and
Land
Asse
ssme
nt\06
SLR
Data
\01 C
ADGI
S\GI
S\So
ils\62
0306
86 F0
3 Prio
rity Ag
ricult
ural A
rea.m
xd
620.30686 ENSHAM SOIL SURVEY
Priority Agricultural Area
FIGURE 3
ML 70326
ML 70365
ML70366
ML 70367
ML 7459
Flare 1
Flare 2
Flare 3
Flare 4
Priority Agricultural AreaFlare Exclusion Areas (80m x 20m)Zone 2Zone 3Mining Leases
0 10.5kmI
1:50,000 at A4Coordinate System: GDA 1994 MGA Zone 55Scale:Project Number: 620.30686Date: 23-Feb-2022 Drawn by: JG
\\au.s
lr.loc
al\co
rporat
e\Proj
ects-
SLR\
620-B
NE\62
0-BNE
\620.3
0686
.0000
0 Soil
s and
Land
Asse
ssme
nt\06
SLR
Data
\01 C
ADGI
S\GI
S\So
ils\62
0306
86 F0
4 Stra
tegic
Crop
ping A
rea.m
xd
620.30686 ENSHAM SOIL SURVEY
Strategic Cropping Area
FIGURE 4
ML 70326
ML 70365
ML70366
ML 70367
ML 7459
Flare 1
Flare 2
Flare 3
Flare 4
Flare Exclusion Areas (80m x 20m)Strategic Cropping LandZone 2Zone 3Mining Leases
0 10.5kmI
1:50,000 at A4Coordinate System: GDA 1994 MGA Zone 55Scale:Project Number: 620.30686Date: 23-Feb-2022 Drawn by: JG
Ensham Resources Pty Ltd Ensham Life of Mine Extension Project - Zones 2 and 3 Land Resources
SLR Ref No: 620.30686.00000-R01-v4.0-RevF.docx March 2022
620.30686.00000-R01-v4.0-RevF.docx Page 16
2.3 Field Assessment and Sampling Program
2.3.1 Soil Field Program
The soil field program was designed as an integrated free survey, which assumes that land characteristics are interdependent and tend to occur in correlated sets (NCST, 2008). Preliminary survey points were located based on the desktop assessment and refined during the field survey according to the site observations and landform interpretation to target representative soil type identification and boundary delineation. Bore holes were excavated using a hand auger or soil corer to a maximum depth of 1.0 m or upon encountering refusal e.g., consolidated rock. Soil profile logging was undertaken in the field using SLR electronic soil data sheets, including Global Positioning System (GPS) recordings and photographs of the landforms and soil profiles. For those soils which were analysed in the laboratory, certificates of analysis are shown in Appendix A. Appendix B and Appendix C present the detailed and check site descriptions respectively.
Three types of observations were used for this Soil and Land Resource Assessment:
• Detailed sites – Excavated sites that allow for the identification of physical and chemical factors which characterise the major pedological features of the soil profile and allow the characterisation of an associated map unit
• Analysed sites – Detailed sites from which soil samples are collected and sent to a National Association of Testing Authorities (NATA) Australia accredited laboratory for analysis, and
• Check sites - Observations examined in sufficient detail to allocate the site to a specific soil type.
A total of 16 detailed sites (prefix BH) were assessed, with soil samples taken from each site. An additional 26 check sites (prefix CH) were assessed producing a survey density of 1 site per 14 ha. Laboratory analysis was undertaken for 11 sites, representing 68.75% of the 16 detailed sites. Typical sample depths were 0-10, 20-30, 50-60 and 90-100 centimetres (cm). The frequency of the detailed, analysed and check sites are in accordance with the relevant guidelines (McKenzie et al., 2008). Locations of detailed, check and analysed sites are depicted in Figure 5.
Laboratory analysis was performed by Environmental Analysis Laboratory (EAL) at the Southern Cross University Lismore, a laboratory with NATA accreditation for the analyses conducted. The soil testing suite included:
• pH (1:5 water)
• Electrical conductivity (EC)
• Cation exchange capacity (CEC)
• Exchangeable sodium percentage (ESP)
• Colour (Munsell)
• Particle size analysis (PSA), and
• Emerson aggregate test (EAT).
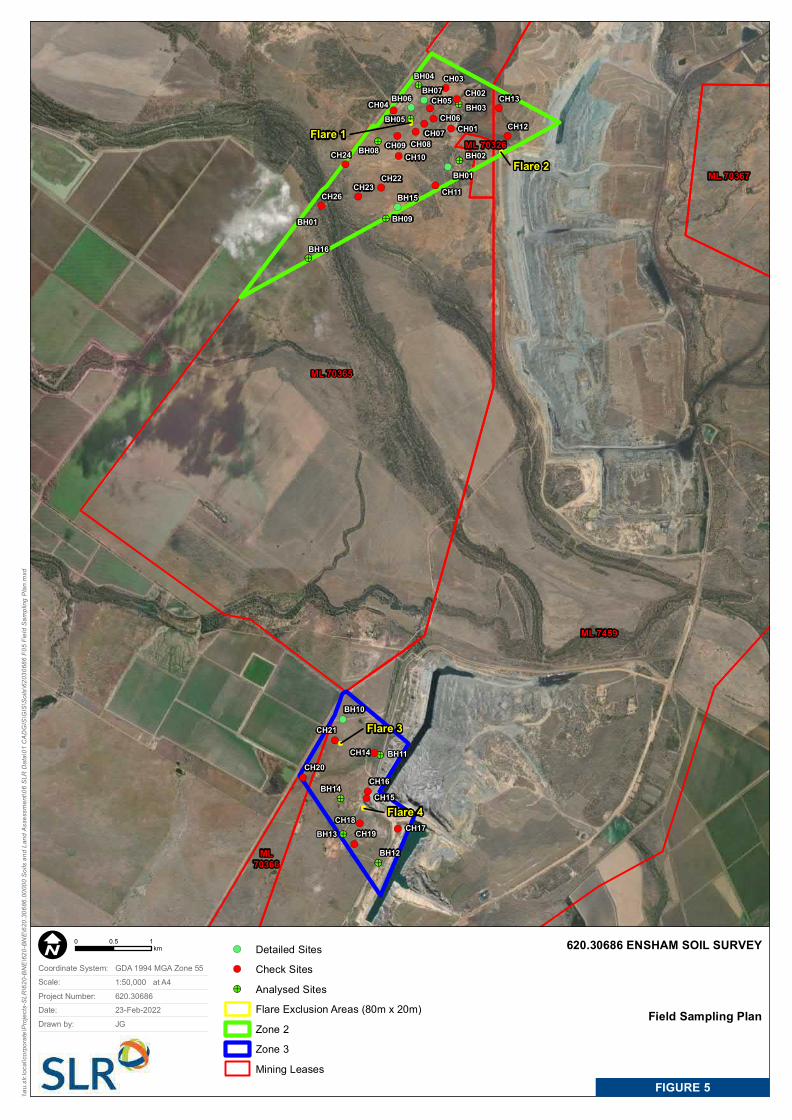
\\au.s
lr.loc
al\co
rporat
e\Proj
ects-
SLR\
620-B
NE\62
0-BNE
\620.3
0686
.0000
0 Soil
s and
Land
Asse
ssme
nt\06
SLR
Data
\01 C
ADGI
S\GI
S\So
ils\62
0306
86 F0
5 Fiel
d Sam
pling
Plan
.mxd
620.30686 ENSHAM SOIL SURVEY
Field Sampling Plan
FIGURE 5
!(
!>!(
!(!>
!(!>
!(!(!(!(
!(!(!(
!>
!(
!(
!(
!(
!>
!(
!>!(
!(!(
!>
!(!(
!(!>
!>
!(
!(
!(
!(!(
!(
!>
!(
!(!>
BH01
BH02
Flare 1
Flare 2
Flare 3
Flare 4
CH01
BH03CH02
CH03BH04
CH04BH05
BH06BH07
CH05CH06
CH07CH08CH09BH08 CH10
CH11
CH12
CH13
BH09
BH10
BH11CH14
CH15CH16
BH12
CH17CH18
CH19BH13
BH14
CH20
CH21
BH15
CH22CH23
CH24
BH16
BH01
CH26
ML 70326
ML 70365
ML70366
ML 70367
ML 7459
!( Detailed Sites!( Check Sites!> Analysed Sites
Flare Exclusion Areas (80m x 20m)Zone 2Zone 3Mining Leases
0 10.5kmI
1:50,000 at A4Coordinate System: GDA 1994 MGA Zone 55Scale:Project Number: 620.30686Date: 23-Feb-2022 Drawn by: JG
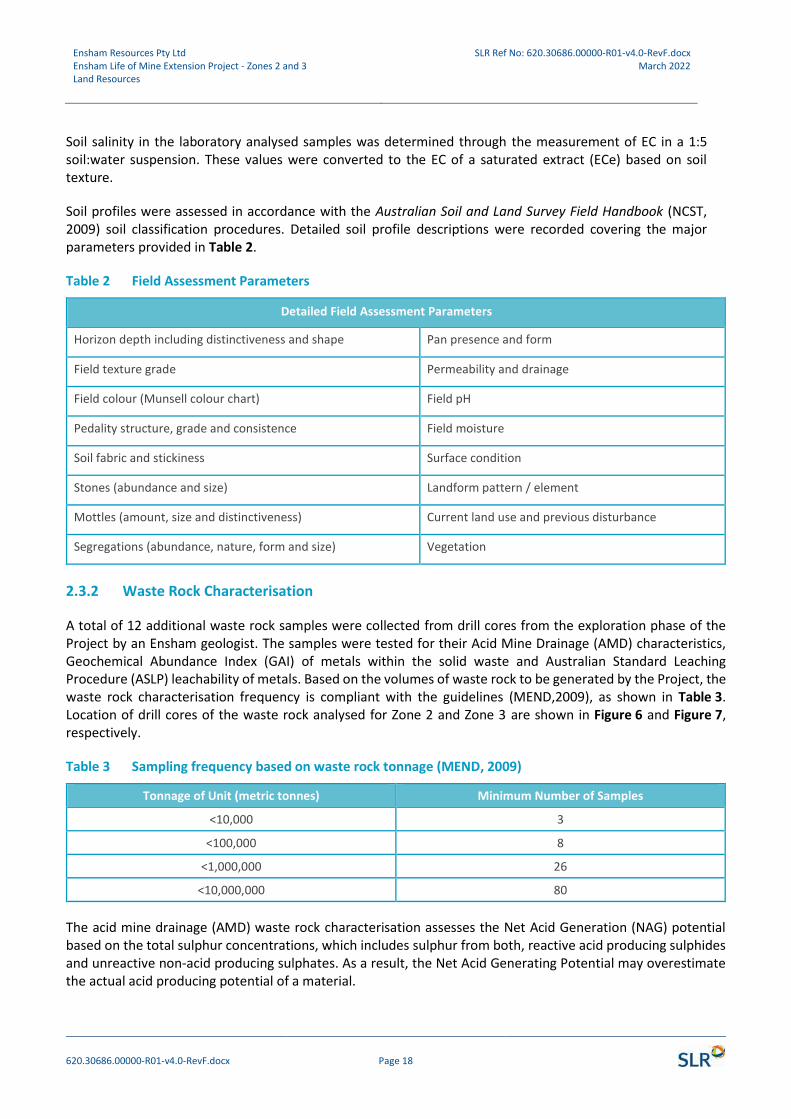
Ensham Resources Pty Ltd Ensham Life of Mine Extension Project - Zones 2 and 3 Land Resources
SLR Ref No: 620.30686.00000-R01-v4.0-RevF.docx March 2022
620.30686.00000-R01-v4.0-RevF.docx Page 18
Soil salinity in the laboratory analysed samples was determined through the measurement of EC in a 1:5 soil:water suspension. These values were converted to the EC of a saturated extract (ECe) based on soil texture.
Soil profiles were assessed in accordance with the Australian Soil and Land Survey Field Handbook (NCST, 2009) soil classification procedures. Detailed soil profile descriptions were recorded covering the major parameters provided in Table 2.
Table 2 Field Assessment Parameters
Detailed Field Assessment Parameters
Horizon depth including distinctiveness and shape Pan presence and form
Field texture grade Permeability and drainage
Field colour (Munsell colour chart) Field pH
Pedality structure, grade and consistence Field moisture
Soil fabric and stickiness Surface condition
Stones (abundance and size) Landform pattern / element
Mottles (amount, size and distinctiveness) Current land use and previous disturbance
Segregations (abundance, nature, form and size) Vegetation
2.3.2 Waste Rock Characterisation
A total of 12 additional waste rock samples were collected from drill cores from the exploration phase of the Project by an Ensham geologist. The samples were tested for their Acid Mine Drainage (AMD) characteristics, Geochemical Abundance Index (GAI) of metals within the solid waste and Australian Standard Leaching Procedure (ASLP) leachability of metals. Based on the volumes of waste rock to be generated by the Project, the waste rock characterisation frequency is compliant with the guidelines (MEND,2009), as shown in Table 3. Location of drill cores of the waste rock analysed for Zone 2 and Zone 3 are shown in Figure 6 and Figure 7, respectively.
Table 3 Sampling frequency based on waste rock tonnage (MEND, 2009)
Tonnage of Unit (metric tonnes) Minimum Number of Samples
<10,000 3
<100,000 8
<1,000,000 26
<10,000,000 80
The acid mine drainage (AMD) waste rock characterisation assesses the Net Acid Generation (NAG) potential based on the total sulphur concentrations, which includes sulphur from both, reactive acid producing sulphides and unreactive non-acid producing sulphates. As a result, the Net Acid Generating Potential may overestimate the actual acid producing potential of a material.
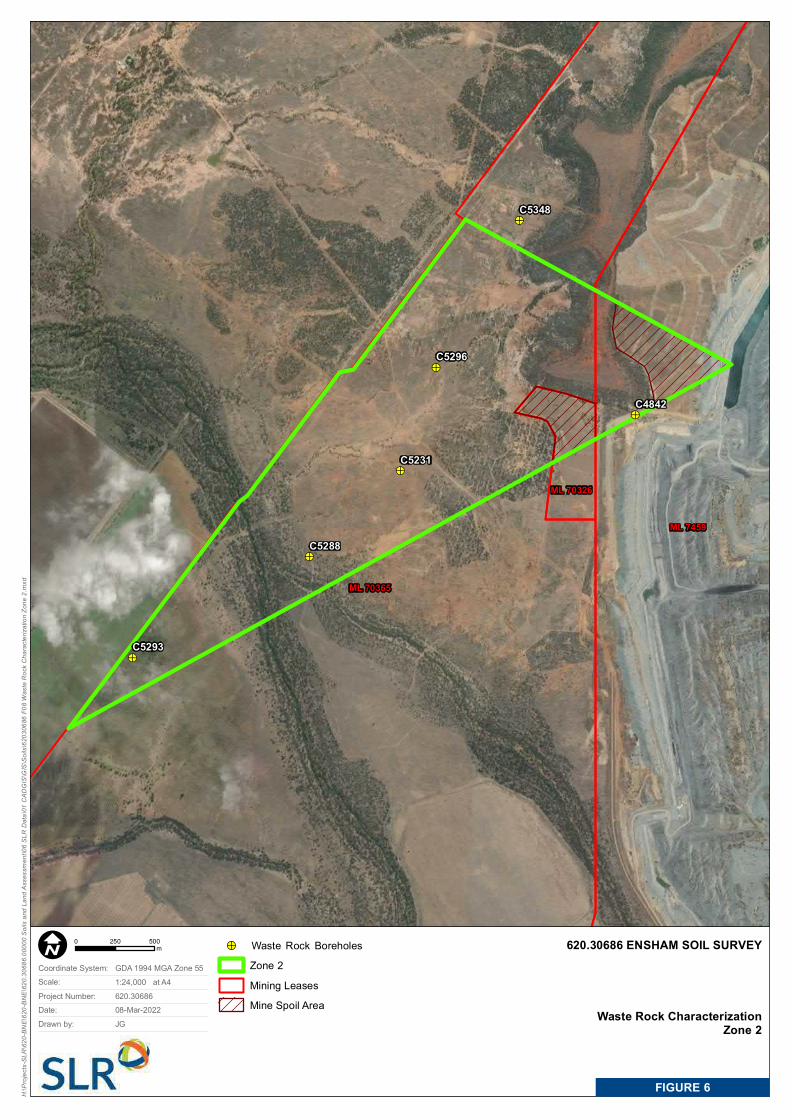
H:\P
rojec
ts-SL
R\62
0-BNE
\620-B
NE\62
0.306
86.00
000 S
oils a
nd La
nd As
sess
ment\
06 SL
R Da
ta\01
CAD
GIS\G
IS\So
ils\62
0306
86 F0
8 Was
te Ro
ck C
harac
teriza
tion Z
one 2
.mxd
620.30686 ENSHAM SOIL SURVEY
Waste Rock CharacterizationZone 2
FIGURE 6
!>
!>
!>
!>
!>
!>
ML 70326
ML 70365
ML 7459
C5293
C5288
C5231
C5296
C5348
C4842
!> Waste Rock BoreholesZone 2Mining Leases Mine Spoil Area
0 500250mI
1:24,000 at A4Coordinate System: GDA 1994 MGA Zone 55Scale:Project Number: 620.30686Date: 08-Mar-2022 Drawn by: JG
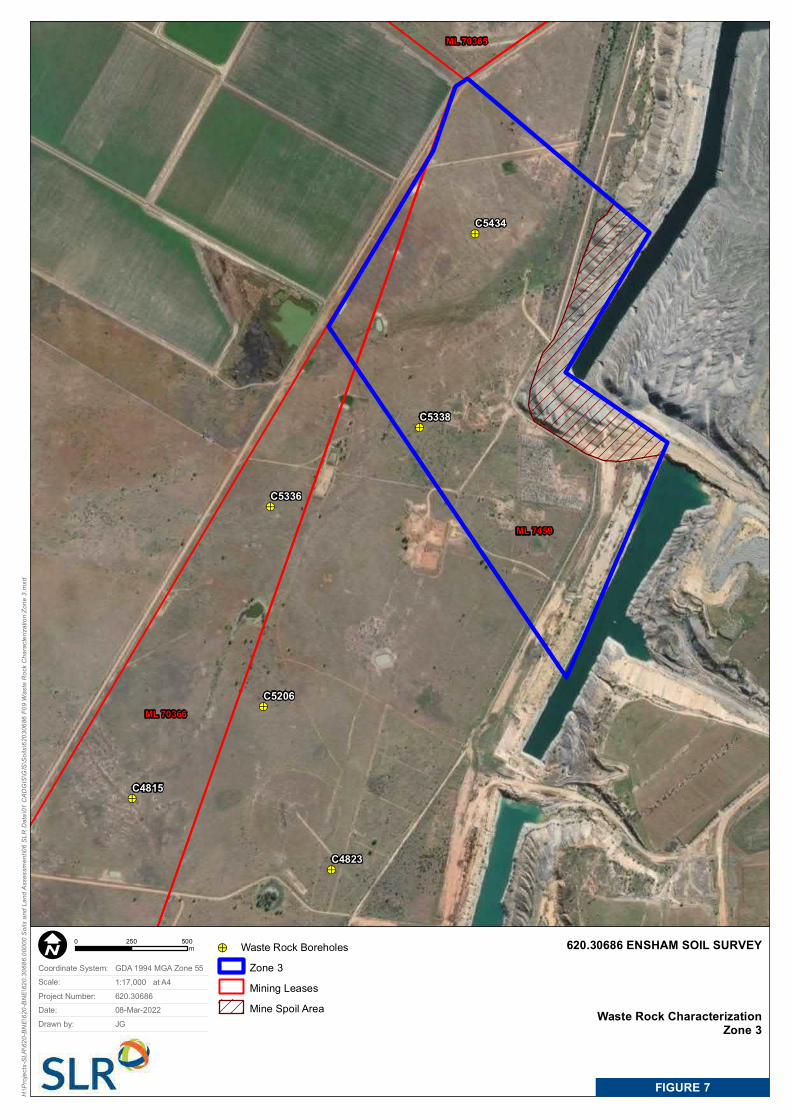
H:\P
rojec
ts-SL
R\62
0-BNE
\620-B
NE\62
0.306
86.00
000 S
oils a
nd La
nd As
sess
ment\
06 SL
R Da
ta\01
CAD
GIS\G
IS\So
ils\62
0306
86 F0
9 Was
te Ro
ck C
harac
teriza
tion Z
one 3
.mxd
620.30686 ENSHAM SOIL SURVEY
Waste Rock CharacterizationZone 3
FIGURE 7
!>
!>
!>
!>
!>
!>
ML 70365
ML 70366
ML 7459
C4815
C5206
C5336
C4823
C5338
C5434
!> Waste Rock Boreholes Zone 3 Mining Leases Mine Spoil Area
0 500250mI
1:17,000 at A4Coordinate System: GDA 1994 MGA Zone 55Scale:Project Number: 620.30686Date: 08-Mar-2022 Drawn by: JG
Ensham Resources Pty Ltd Ensham Life of Mine Extension Project - Zones 2 and 3 Land Resources
SLR Ref No: 620.30686.00000-R01-v4.0-RevF.docx March 2022
620.30686.00000-R01-v4.0-RevF.docx Page 21
To evaluate the potential for overestimation of acid generation, all samples analysed as part of this assessment, were also tested for HCl-extractable sulfur (SHCl). This method determines soluble sulphate from gypsum and a large proportion of iron and aluminium hydroxysulphate compounds (for example jarosite, natrojarosite, schwertmannite), which are generally insoluble in the surface environment. This method determines also some sulphur from organic matter, but not pyrite sulphur.
Waste rock leachate results were compared to water quality parameters with regards to the toxicant default guideline values for water quality in aquatic ecosystems (95% protection level) of the Australian & New Zealand Guidelines for Fresh & Marine Water Quality (Australian Government, 2022)
2.4 Land Classification Systems
The information reviewed and collected as part of the desktop and field assessments was used to determine land classifications. The land classification systems used for the assessment are:
• Land suitability class, and
• Agricultural land class.
These classification systems are applied to the assessment to consider specific and broad land uses. These systems and their purpose for assessing impacts to land resources are summarised in the following sections.
2.4.1 Land Suitability Class
The land suitability classification was applied across the Project in accordance with the Regional Land Suitability Frameworks for Queensland (DSITI & DNRM, 2015). This scheme uses the biophysical features of the land and soil to derive detailed rating tables for a range of land and soil hazards. The scheme consists of eight limitations that classify the land based on the severity against the suitability subclasses for various land management options.
The suitability framework provides details for assessing which crops are suitable for individual mapped areas of land or soil and defines land suitable for grazing. Each hazard (refer Section 6) was assessed against a set of criteria tables described in the framework, with each hazard ranked from 1 (most suitable) through to 5 (least suitable) with the overall ranking of the land determined by its most significant limitation.
2.4.2 Agricultural Land Class
Agricultural land classification follows a hierarchical scheme that allows the presentation of interpreted land evaluation data to indicate the location and extent of agricultural land that can be used sustainably for a wide range of land uses with minimal land degradation. Three broad classes of agricultural land and one non-agricultural land class are identified in the Agricultural Land Class System (DSITI & DNRM, 2015).
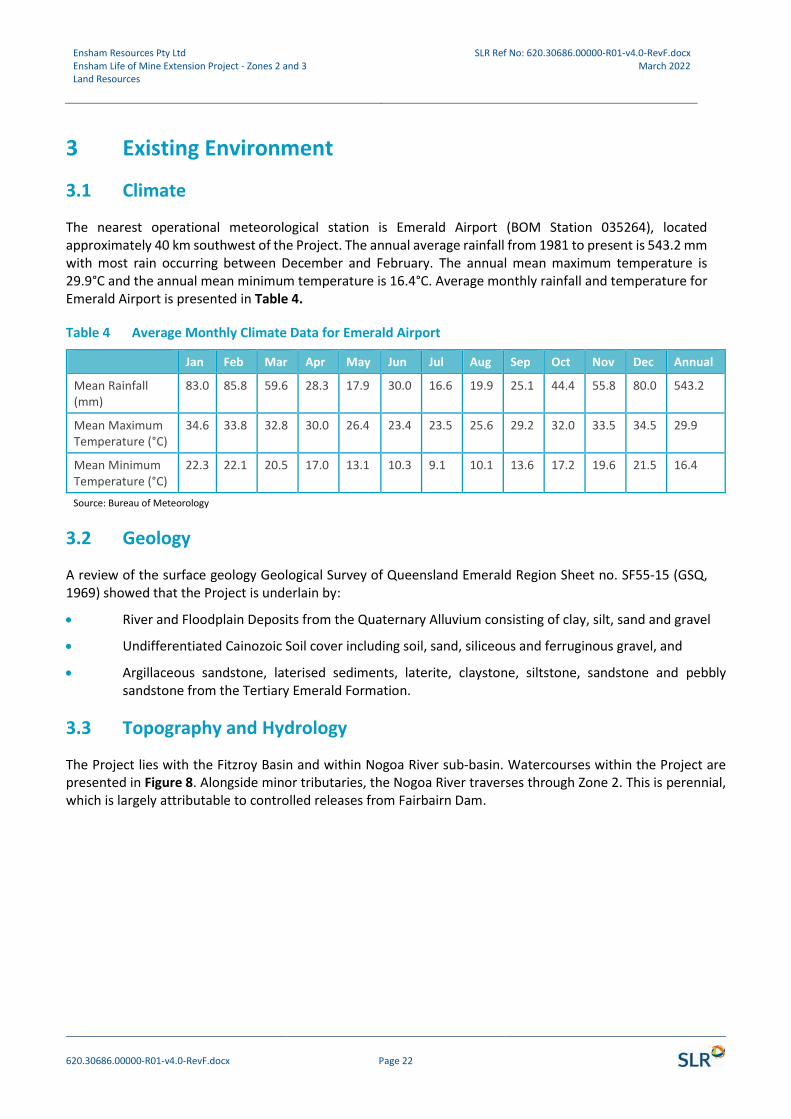
Ensham Resources Pty Ltd Ensham Life of Mine Extension Project - Zones 2 and 3 Land Resources
SLR Ref No: 620.30686.00000-R01-v4.0-RevF.docx March 2022
620.30686.00000-R01-v4.0-RevF.docx Page 22
3 Existing Environment
3.1 Climate
The nearest operational meteorological station is Emerald Airport (BOM Station 035264), located approximately 40 km southwest of the Project. The annual average rainfall from 1981 to present is 543.2 mm with most rain occurring between December and February. The annual mean maximum temperature is 29.9°C and the annual mean minimum temperature is 16.4°C. Average monthly rainfall and temperature for Emerald Airport is presented in Table 4.
Table 4 Average Monthly Climate Data for Emerald Airport
Jan Feb Mar Apr May Jun Jul Aug Sep Oct Nov Dec Annual
Mean Rainfall (mm)
83.0 85.8 59.6 28.3 17.9 30.0 16.6 19.9 25.1 44.4 55.8 80.0 543.2
Mean Maximum Temperature (°C)
34.6 33.8 32.8 30.0 26.4 23.4 23.5 25.6 29.2 32.0 33.5 34.5 29.9
Mean Minimum Temperature (°C)
22.3 22.1 20.5 17.0 13.1 10.3 9.1 10.1 13.6 17.2 19.6 21.5 16.4
Source: Bureau of Meteorology
3.2 Geology
A review of the surface geology Geological Survey of Queensland Emerald Region Sheet no. SF55-15 (GSQ, 1969) showed that the Project is underlain by:
• River and Floodplain Deposits from the Quaternary Alluvium consisting of clay, silt, sand and gravel
• Undifferentiated Cainozoic Soil cover including soil, sand, siliceous and ferruginous gravel, and
• Argillaceous sandstone, laterised sediments, laterite, claystone, siltstone, sandstone and pebbly sandstone from the Tertiary Emerald Formation.
3.3 Topography and Hydrology
The Project lies with the Fitzroy Basin and within Nogoa River sub-basin. Watercourses within the Project are presented in Figure 8. Alongside minor tributaries, the Nogoa River traverses through Zone 2. This is perennial, which is largely attributable to controlled releases from Fairbairn Dam.

\\au.s
lr.loc
al\co
rporat
e\Proj
ects-
SLR\
620-B
NE\62
0-BNE
\620.3
0686
.0000
0 Soil
s and
Land
Asse
ssme
nt\06
SLR
Data
\01 C
ADGI
S\GI
S\So
ils\62
0306
86 F0
6 Top
ograp
hy an
d Hyd
rolog
y.mxd
620.30686 ENSHAM SOIL SURVEY
Topography and Hydrology
FIGURE 8
ML 70326
ML 70365
ML70366
ML 70367
ML 7459
Nogoa River Anabranch
Winton Creek
Bogg
yCre
e k
Nogoa River
Mosquito Creek
Nogoa River
Major WatercoursesMinor WatercoursesZone 2Zone 3Mining Leases
Elevation (mAHD)< 100100 - 150150 - 200200 - 250250 - 350350 - 500> 500
0 10.5kmI
1:50,000 at A4Coordinate System: GDA 1994 MGA Zone 55Scale:Project Number: 620.30686Date: 23-Feb-2022 Drawn by: JG
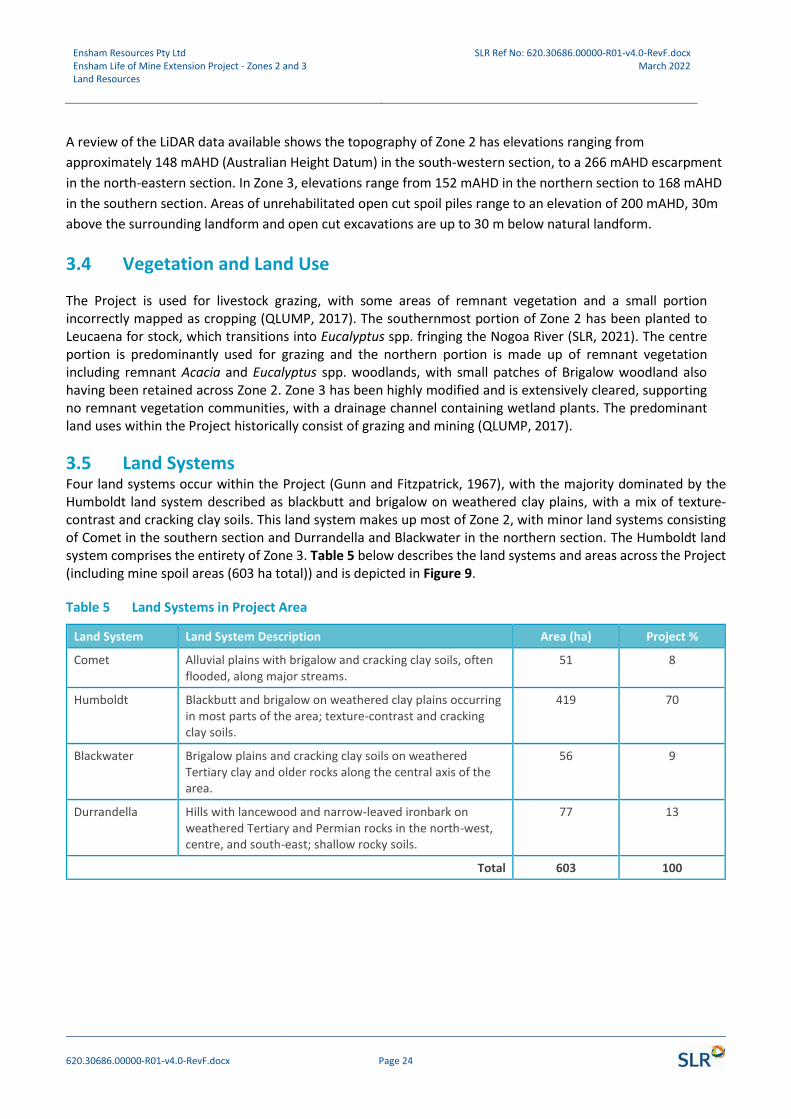
Ensham Resources Pty Ltd Ensham Life of Mine Extension Project - Zones 2 and 3 Land Resources
SLR Ref No: 620.30686.00000-R01-v4.0-RevF.docx March 2022
620.30686.00000-R01-v4.0-RevF.docx Page 24
A review of the LiDAR data available shows the topography of Zone 2 has elevations ranging from
approximately 148 mAHD (Australian Height Datum) in the south-western section, to a 266 mAHD escarpment
in the north-eastern section. In Zone 3, elevations range from 152 mAHD in the northern section to 168 mAHD
in the southern section. Areas of unrehabilitated open cut spoil piles range to an elevation of 200 mAHD, 30m
above the surrounding landform and open cut excavations are up to 30 m below natural landform.
3.4 Vegetation and Land Use
The Project is used for livestock grazing, with some areas of remnant vegetation and a small portion incorrectly mapped as cropping (QLUMP, 2017). The southernmost portion of Zone 2 has been planted to Leucaena for stock, which transitions into Eucalyptus spp. fringing the Nogoa River (SLR, 2021). The centre portion is predominantly used for grazing and the northern portion is made up of remnant vegetation including remnant Acacia and Eucalyptus spp. woodlands, with small patches of Brigalow woodland also having been retained across Zone 2. Zone 3 has been highly modified and is extensively cleared, supporting no remnant vegetation communities, with a drainage channel containing wetland plants. The predominant land uses within the Project historically consist of grazing and mining (QLUMP, 2017).
3.5 Land Systems Four land systems occur within the Project (Gunn and Fitzpatrick, 1967), with the majority dominated by the Humboldt land system described as blackbutt and brigalow on weathered clay plains, with a mix of texture-contrast and cracking clay soils. This land system makes up most of Zone 2, with minor land systems consisting of Comet in the southern section and Durrandella and Blackwater in the northern section. The Humboldt land system comprises the entirety of Zone 3. Table 5 below describes the land systems and areas across the Project (including mine spoil areas (603 ha total)) and is depicted in Figure 9.
Table 5 Land Systems in Project Area
Land System Land System Description Area (ha) Project %
Comet Alluvial plains with brigalow and cracking clay soils, often flooded, along major streams.
51 8
Humboldt Blackbutt and brigalow on weathered clay plains occurring in most parts of the area; texture-contrast and cracking clay soils.
419 70
Blackwater Brigalow plains and cracking clay soils on weathered Tertiary clay and older rocks along the central axis of the area.
56 9
Durrandella Hills with lancewood and narrow-leaved ironbark on weathered Tertiary and Permian rocks in the north-west, centre, and south-east; shallow rocky soils.
77 13
Total 603 100
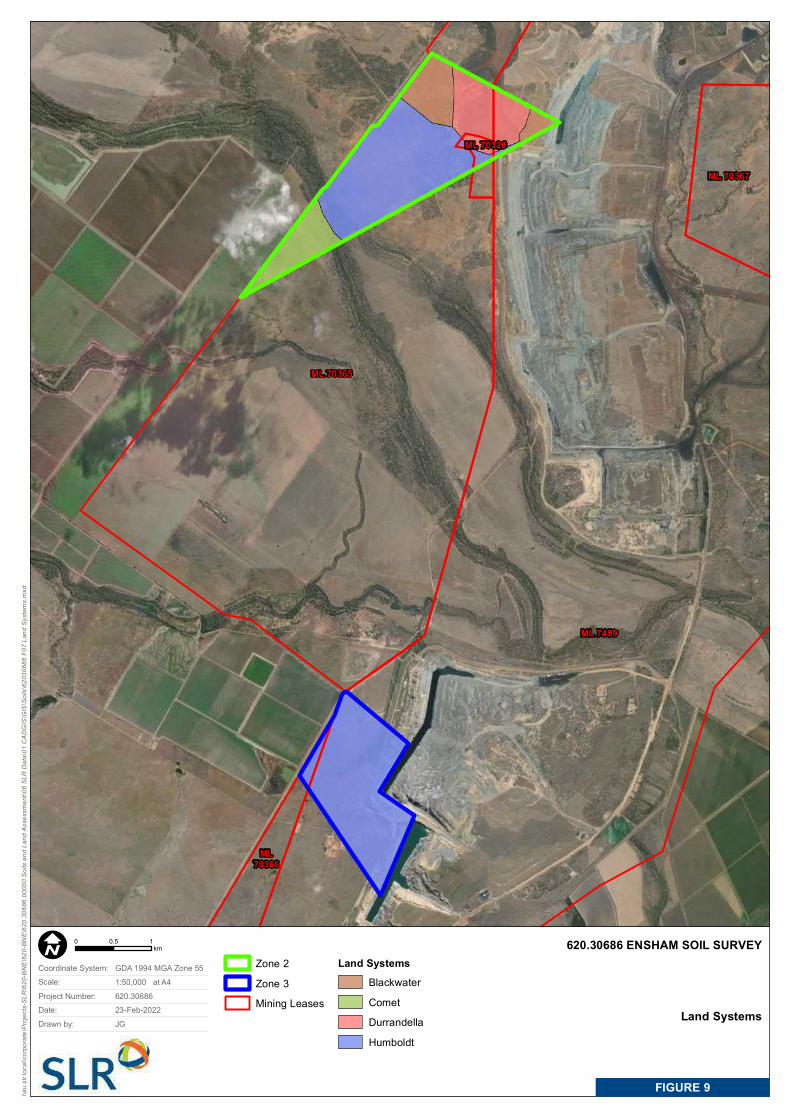
\\au.s
lr.loc
al\co
rporat
e\Proj
ects-
SLR\
620-B
NE\62
0-BNE
\620.3
0686
.0000
0 Soil
s and
Land
Asse
ssme
nt\06
SLR
Data
\01 C
ADGI
S\GI
S\So
ils\62
0306
86 F0
7 Lan
d Sys
tems.m
xd
620.30686 ENSHAM SOIL SURVEY
Land Systems
FIGURE 9
ML 70326
ML 70365
ML70366
ML 70367
ML 7459
Zone 2Zone 3Mining Leases
Land SystemsBlackwaterCometDurrandellaHumboldt
0 10.5kmI
1:50,000 at A4Coordinate System: GDA 1994 MGA Zone 55Scale:Project Number: 620.30686Date: 23-Feb-2022 Drawn by: JG
Ensham Resources Pty Ltd Ensham Life of Mine Extension Project - Zones 2 and 3 Land Resources
SLR Ref No: 620.30686.00000-R01-v4.0-RevF.docx March 2022
620.30686.00000-R01-v4.0-RevF.docx Page 26
3.6 Waste Rock Source
The coal seam at Ensham is part of the Permian age Rangal Coal Measures. The Rangal Coal Measures are characteristically non-marine sediments and low in sulphur, essentially deposited as one homogeneous unit. With regards to the waste rock characterisation, the coal seam and associated interburden/overburden may be accompanied by low concentrations of primary sulphides, mainly pyrite.
3.7 Previous Investigations
3.7.1 Hansen Consulting
Hansen Consulting (Hansen, 2006) completed a soils and land capability assessment for Ensham Resources Pty Ltd to assist in planning for a mine expansion program (the Hansen Report). The Hansen Report assessed the middle and northern portions of Zone 3 and the north-eastern portion of Zone 2. Field investigations informed a soil survey, classifying soil types and their properties, estimating volumes of topsoil resources available and assessed the agricultural land suitability.
3.7.1.1 Soil Classification
The Hansen Report classified soil types based upon the Australian Soil Classification (ASC) (1996) into the following groups:
• Leptic Rudosols which occur to the north-west of Zone 2
• Petroferric Red Kandosols-Tenosols, Acidic Mesotrophic Red Kandosols and Haplic Mesotrophic Red Ferrosols which occur to the north-west of Zone 2 and the southern boundary of Zone 3
• Colluvic Clastic Rudosols, Regolithic Chernic Tenosols or Acidic Brown Clastic-Leptic Rudosols across the western boundary of Zone 2
• Sodic Pedaric Brown Dermosols Uniform (non-cracking) clay soils which occur in the south of Zone 2 as well as the centre and south of Zone 3, and
• Endohypersodic, or Epipedal Black, Grey or Brown Vertosols which occur at the southern boundary of Zone 2 and across the centre and north of Zone 3.
3.7.1.2 Land Suitability
The Hansen Report described the following land suitability classes:
• Class 1 indicates with negligible limitations to sustaining the intended land use
• Class 2 with minor limitations
• Class 3 with moderate limitations
• Class 4 is classified as marginal land, and
• Class 5 is unsuitable land.
The method for the land suitability classification was adapted from the guidelines for agricultural land evaluation published by the Department of Primary Industries (DPI) (1990) with reference to the publication by Shields and Williams (1991) for a land resources survey in the Kilcummin area of Central Queensland.
The land suitability relevant to the Project was classed as:
Ensham Resources Pty Ltd Ensham Life of Mine Extension Project - Zones 2 and 3 Land Resources
SLR Ref No: 620.30686.00000-R01-v4.0-RevF.docx March 2022
620.30686.00000-R01-v4.0-RevF.docx Page 27
• Class 4 and 5 for cropping and grazing in the north and western section of Zone 2, and
• Class 2, 3, 4 and 5 for cropping and Class 1, 2 and 3 for grazing in the northern section of Zone 3
These classes indicate that the north and western land in Zone 2 might be unsuitable for cropping. However, land in the north of Zone 3 could be suitable for both cropping and grazing purposes, particularly the northernmost part of the Zone.
3.7.1.3 Agricultural Land
The Hansen Report classified the land into the following classes:
• Class A described as crop land that is suitable for crops with nil to moderate limitations to production
• Class B described as limited crop land that is marginal for crops due to severe limitations and suitable for pastures. Engineering or agronomic improvements may be required before this land is suitable for cropping
• Class C described as pasture land suitable only for improved or native pastures, continuous cultivation precluded; some areas may tolerate short periods of ground disturbance for pasture establishment, and
• Class D described as non-agricultural land and land not suitable for agricultural uses due to extreme limitations including steep slopes, shallow rocky soils or poor drainage.
The method for the land suitability classification was assessed based on the Guidelines for Agricultural Land Evaluation in Queensland published by the DPI (1990) and in accordance with State Planning Policy 1/92: Development and the Conservation of Good Quality Agricultural Land prepared by the DPI and the Queensland Department of Housing Local Government Planning (DH&LGP) (1993).
The agricultural land suitability relevant to the Project was classed as:
• The majority of land in the north and western section of Zone 2 was described as Class C, with small areas of D identified, and
• Land in the north section of Zone 3 was described as Class A, B and, with a very small section of Class D.
Lands in north and western Zone 2 would be mostly suited to pastureland, whereas Zone 3’s northern section would be more suited to both cropping and pastureland.
3.7.2 GT Environmental
GT Environmental (GT Environmental, 2020) conducted a desktop assessment on behalf of Ensham Resources Pty Ltd to assess the potential impacts of the Project on soils and land suitability values and provided a baseline assessment of the soil and land suitability.
3.7.2.1 Soil Classification
The majority of soil types were classified in accordance with the ASC (2002) into the following groups:
• Endohypersodic and Epipedal Black, Grey or Brown Vertosols across the southern area of Zone 2 and across the majority of Zone 3
Ensham Resources Pty Ltd Ensham Life of Mine Extension Project - Zones 2 and 3 Land Resources
SLR Ref No: 620.30686.00000-R01-v4.0-RevF.docx March 2022
620.30686.00000-R01-v4.0-RevF.docx Page 28
• Sodic Pedaric Brown Dermosols across the central area of Zone 2 and the southern portion of Zone 3, and
• Acidic and Leptic Rudosols across the northern portion of Zone 2.
3.7.2.2 Agricultural Land
The method for the agricultural land suitability classification was assessed in accordance with State Planning Policy 1/92: Development and the Conservation of Good Quality Agricultural Land and rated in terms of the DH&LGP (1993).
The land suitability was classed as:
• Class 4 for cropping and Class 3 and 4 for grazing for the majority of the southern and middle portion of Zone 2 with a minor belt of Class 3 cropping and Class 2 for grazing along a tributary that feeds the Nogoa River, dividing the southern and middle portions
• Class 4 and 5 for cropping and Class 3, 4 and 5 for grazing in the northern portion of Zone 2, and
• Class 4 for cropping and grazing in Zone 3.
These classes indicate the land in the Project might be unsuitable for cropping. However, some land could be suitable for grazing purposes.
3.7.3 Waste Rock Characterisation
Previous waste rock characterisations at Ensham investigated 66 overburden and reject samples in 2005 (URS, 2005) and 34 samples from drill holes that intersected the roof, interburden and floor of the then to be mined coal seam (URS, 2015).
3.7.3.1 URS 2005
Of the 2005 samples 88% of samples had a total sulfur content of less than or equal to 0.1%, the remaining 12% had a total sulfur content of between 0.1 to 0.75%, none of which are considered PAF. All samples had a negative net acid producing potential (NAPP), ranging from -9 kg H2SO4/t to -215 kg H2SO4/t (average for overburden -42 kg H2SO4/t and potential reject -46 H2SO4/t). This means that those samples were all non-acid forming (NAF).
3.7.3.2 URS 2015
Of the 2015 samples all had a negative NAPP, ranging from -1 kg H2SO4/t to -119.8 kg H2SO4/t (average -35.7 kg H2SO4/t). This means that those samples were all NAF.
Ensham Resources Pty Ltd Ensham Life of Mine Extension Project - Zones 2 and 3 Land Resources
SLR Ref No: 620.30686.00000-R01-v4.0-RevF.docx March 2022
620.30686.00000-R01-v4.0-RevF.docx Page 29
4 Soil Survey Results
4.1 Soil Classification and Description
The field assessment and subsequent laboratory analysis indicated a total of four soil orders within the Project according to the Revised Australian Soil Classification (Isbell, 2021). These included Vertosols, Dermosols, Kandosols and Rudosols. Representative profile descriptions for all detailed profile descriptions are shown in Appendix B and check site descriptions are shown in Appendix C.
4.1.1 Vertosols
These are soils with the following:
• A clay field texture or 35% or more clay throughout the solum except for a thin, surface crusty horizons 0.03 m or less thick
• When dry, open cracks occur at some time in most years. These are at least 5 mm wide and extend upward to the surface or to the base of any plough layer, peaty horizon, self-mulching horizon, or thin, surface crusty horizon, and
• Slickensides and/or lenticular peds occur at some depth in the solum.
The Vertosols were further classified into Crusty Brown Vertosols.
The Vertosols on site generally consisted of brown medium clay A horizons (topsoil) with moderate structure, overlying a medium clay B2 horizon with strong angular blocky structure. The topsoil showed strongly alkaline, non-sodic and low saline properties. The B2 horizon generally showed strongly alkaline, sodic and very high saline properties.
4.1.2 Dermosols
These are soils other than Vertosols, Hydrosols and Calcarosols which:
• Have B2 horizons with a structure more developed than weak throughout the major part of the horizon, and
• Do not have clear or abrupt textural B horizons.
The Dermosols were further classified into Eutrophic Brown, Black and Grey Dermosols, Magnesic Brown Dermosols and Dystrophic Red Dermosols. Eutrophic Brown Dermosols were identified as the dominant Dermosol type.
The Dermosols on site generally consisted of grey to black clay loam to light clay to medium clay A horizons (topsoil) with weak to moderate structure, overlying a light medium clay to medium clay B2 horizon with moderate to strong angular to sub angular blocky structure. The topsoil showed neutral, non-sodic and low saline properties, whilst the B2 horizon generally showed moderately alkaline, sodic and low saline properties.
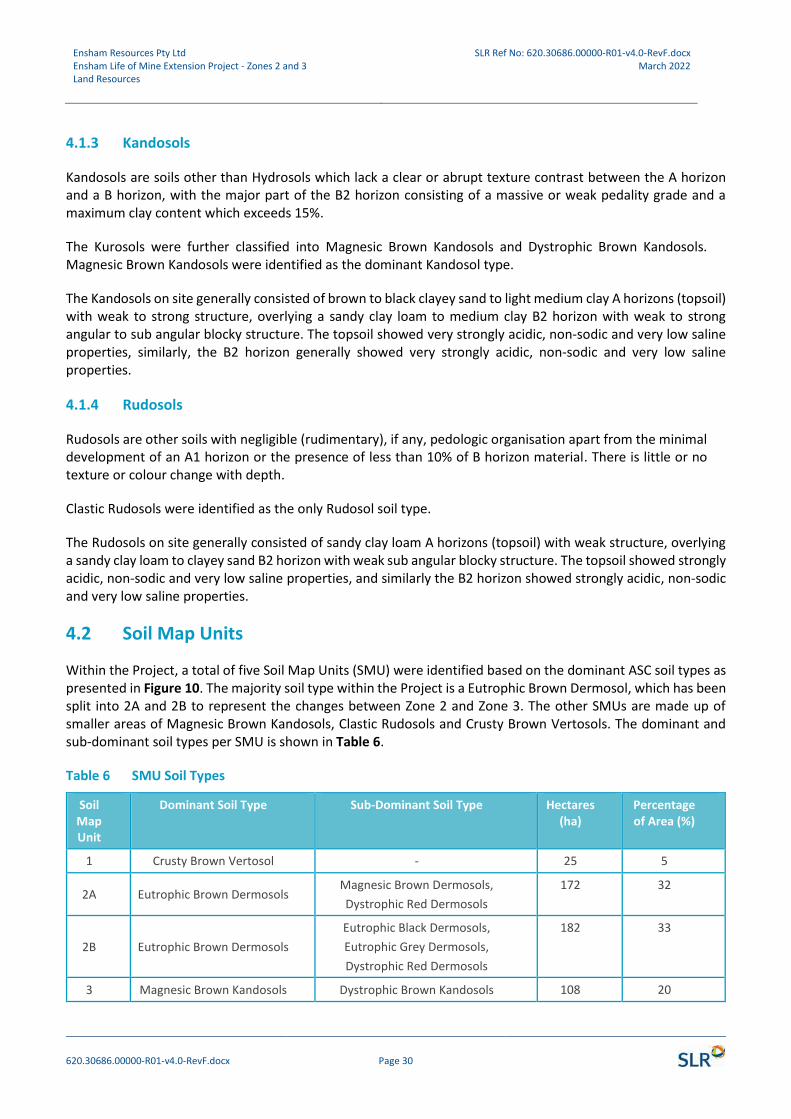
Ensham Resources Pty Ltd Ensham Life of Mine Extension Project - Zones 2 and 3 Land Resources
SLR Ref No: 620.30686.00000-R01-v4.0-RevF.docx March 2022
620.30686.00000-R01-v4.0-RevF.docx Page 30
4.1.3 Kandosols
Kandosols are soils other than Hydrosols which lack a clear or abrupt texture contrast between the A horizon and a B horizon, with the major part of the B2 horizon consisting of a massive or weak pedality grade and a maximum clay content which exceeds 15%.
The Kurosols were further classified into Magnesic Brown Kandosols and Dystrophic Brown Kandosols. Magnesic Brown Kandosols were identified as the dominant Kandosol type.
The Kandosols on site generally consisted of brown to black clayey sand to light medium clay A horizons (topsoil) with weak to strong structure, overlying a sandy clay loam to medium clay B2 horizon with weak to strong angular to sub angular blocky structure. The topsoil showed very strongly acidic, non-sodic and very low saline properties, similarly, the B2 horizon generally showed very strongly acidic, non-sodic and very low saline properties.
4.1.4 Rudosols
Rudosols are other soils with negligible (rudimentary), if any, pedologic organisation apart from the minimal development of an A1 horizon or the presence of less than 10% of B horizon material. There is little or no texture or colour change with depth.
Clastic Rudosols were identified as the only Rudosol soil type.
The Rudosols on site generally consisted of sandy clay loam A horizons (topsoil) with weak structure, overlying a sandy clay loam to clayey sand B2 horizon with weak sub angular blocky structure. The topsoil showed strongly acidic, non-sodic and very low saline properties, and similarly the B2 horizon showed strongly acidic, non-sodic and very low saline properties.
4.2 Soil Map Units
Within the Project, a total of five Soil Map Units (SMU) were identified based on the dominant ASC soil types as presented in Figure 10. The majority soil type within the Project is a Eutrophic Brown Dermosol, which has been split into 2A and 2B to represent the changes between Zone 2 and Zone 3. The other SMUs are made up of smaller areas of Magnesic Brown Kandosols, Clastic Rudosols and Crusty Brown Vertosols. The dominant and sub-dominant soil types per SMU is shown in Table 6.
Table 6 SMU Soil Types
Soil Map Unit
Dominant Soil Type Sub-Dominant Soil Type Hectares (ha)
Percentage of Area (%)
1 Crusty Brown Vertosol - 25 5
2A Eutrophic Brown Dermosols Magnesic Brown Dermosols,
Dystrophic Red Dermosols
172 32
2B Eutrophic Brown Dermosols
Eutrophic Black Dermosols,
Eutrophic Grey Dermosols,
Dystrophic Red Dermosols
182 33
3 Magnesic Brown Kandosols Dystrophic Brown Kandosols 108 20
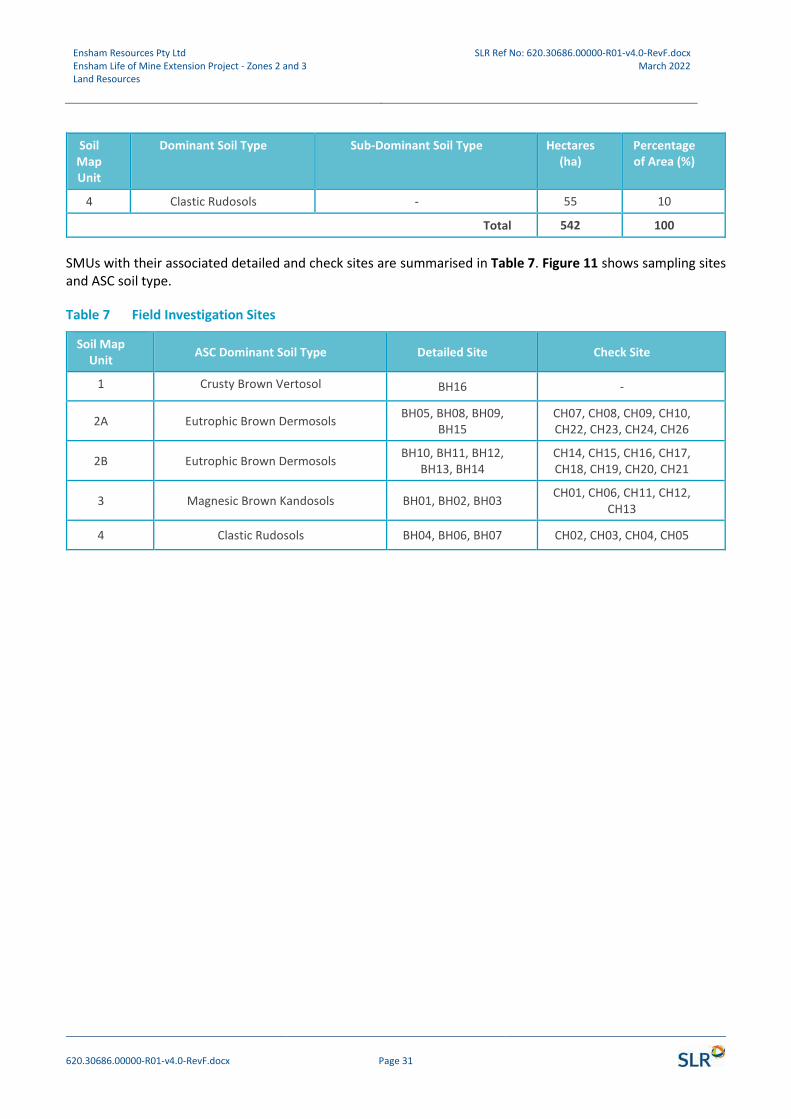
Ensham Resources Pty Ltd Ensham Life of Mine Extension Project - Zones 2 and 3 Land Resources
SLR Ref No: 620.30686.00000-R01-v4.0-RevF.docx March 2022
620.30686.00000-R01-v4.0-RevF.docx Page 31
Soil Map Unit
Dominant Soil Type Sub-Dominant Soil Type Hectares (ha)
Percentage of Area (%)
4 Clastic Rudosols - 55 10
Total 542 100
SMUs with their associated detailed and check sites are summarised in Table 7. Figure 11 shows sampling sites and ASC soil type.
Table 7 Field Investigation Sites
Soil Map Unit
ASC Dominant Soil Type Detailed Site Check Site
1 Crusty Brown Vertosol BH16 -
2A Eutrophic Brown Dermosols BH05, BH08, BH09,
BH15 CH07, CH08, CH09, CH10, CH22, CH23, CH24, CH26
2B Eutrophic Brown Dermosols BH10, BH11, BH12,
BH13, BH14 CH14, CH15, CH16, CH17, CH18, CH19, CH20, CH21
3 Magnesic Brown Kandosols BH01, BH02, BH03 CH01, CH06, CH11, CH12,
CH13
4 Clastic Rudosols BH04, BH06, BH07 CH02, CH03, CH04, CH05
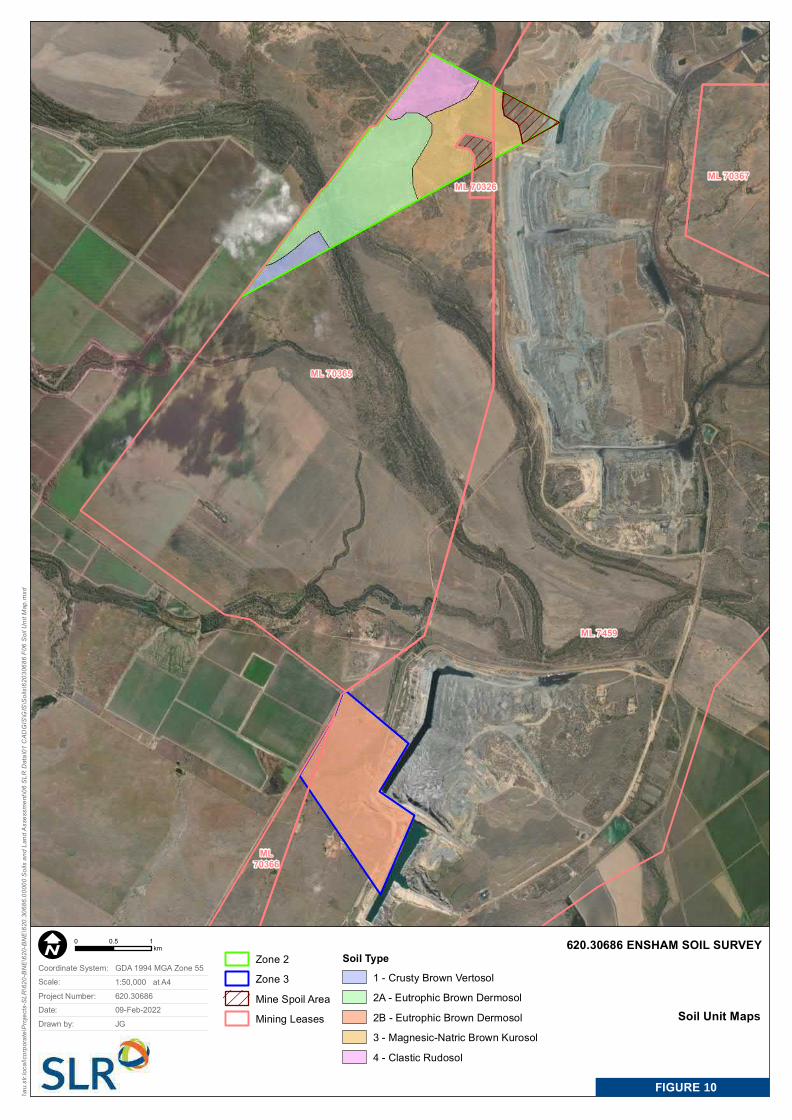
\\au.s
lr.loc
al\co
rporat
e\Proj
ects-
SLR\
620-B
NE\62
0-BNE
\620.3
0686
.0000
0 Soil
s and
Land
Asse
ssme
nt\06
SLR
Data
\01 C
ADGI
S\GIS\
Soils\
6203
0686
F06 S
oil U
nit M
ap.m
xd
620.30686 ENSHAM SOIL SURVEY
Soil Unit Maps
FIGURE 10
ML 70326
ML 70365
ML70366
ML 70367
ML 7459
Zone 2Zone 3Mine Spoil AreaMining Leases
Soil Type1 - Crusty Brown Vertosol2A - Eutrophic Brown Dermosol2B - Eutrophic Brown Dermosol3 - Magnesic-Natric Brown Kurosol4 - Clastic Rudosol
0 10.5kmI
1:50,000 at A4Coordinate System: GDA 1994 MGA Zone 55Scale:Project Number: 620.30686Date: 09-Feb-2022 Drawn by: JG
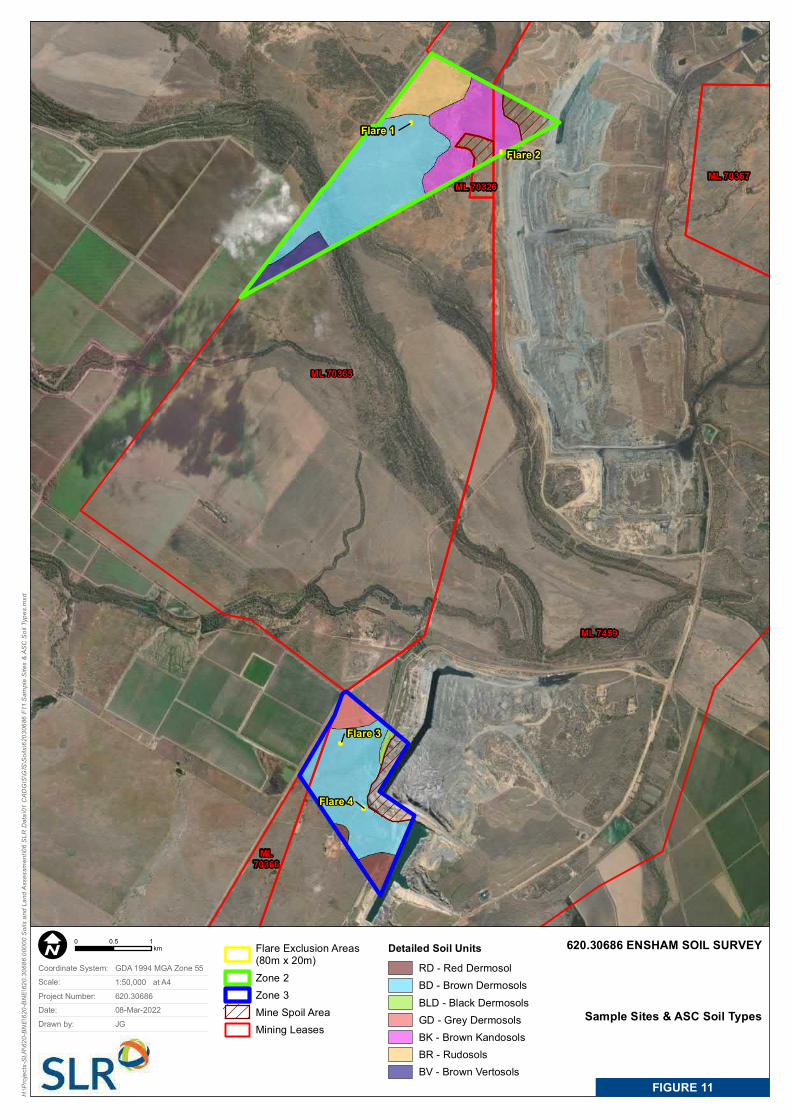
H:\P
rojec
ts-SL
R\62
0-BNE
\620-B
NE\62
0.306
86.00
000 S
oils a
nd La
nd As
sess
ment\
06 SL
R Da
ta\01
CAD
GIS\G
IS\So
ils\62
0306
86 F1
1 Sam
ple Si
tes &
ASC
Soil T
ypes
.mxd
620.30686 ENSHAM SOIL SURVEY
Sample Sites & ASC Soil Types
FIGURE 11
Flare 1Flare 2
Flare 3
Flare 4
ML 70326
ML 70365
ML70366
ML 70367
ML 7459
Flare Exclusion Areas(80m x 20m)Zone 2Zone 3Mine Spoil AreaMining Leases
Detailed Soil UnitsRD - Red DermosolBD - Brown DermosolsBLD - Black DermosolsGD - Grey DermosolsBK - Brown KandosolsBR - RudosolsBV - Brown Vertosols
0 10.5kmI
1:50,000 at A4Coordinate System: GDA 1994 MGA Zone 55Scale:Project Number: 620.30686Date: 08-Mar-2022 Drawn by: JG
Ensham Resources Pty Ltd Ensham Life of Mine Extension Project - Zones 2 and 3 Land Resources
SLR Ref No: 620.30686.00000-R01-v4.0-RevF.docx March 2022
620.30686.00000-R01-v4.0-RevF.docx Page 34
4.2.1 Soil Map Unit 1
4.2.1.1 Description
SMU 1 soil type included Crusty Brown Vertosols.
4.2.1.2 Location
SMU 1 is located in the southern portion of Zone 2 and comprises approximately 5% or 25 ha of the Project.
4.2.1.3 Land Use
At the time of the field assessment, the land use within SMU 1 was planted with Leucaena for cattle grazing.
4.2.1.4 Management Considerations
Generally, the topsoil does not exhibit any characteristics that require any non-standard management practices. The subsoil generally exhibits high alkalinity, high sodicity and high salinity. If the subsoil is exposed and not managed impacts may include:
• Erosion hazards including tunnel erosion
• Impeded soil infiltration and permeability, and
• Soil dispersion leading to soil structure breakdown, increased run-off and increased turbidity run-off.
4.2.2 Soil Map Unit 2A
4.2.2.1 Description
SMU 2A dominant soil type included Eutrophic Brown Dermosols and the subdominant soil types included Magnesic Brown Dermosols and Dystrophic Red Dermosols.
4.2.2.2 Location
SMU 2A is located across the middle portion of Zone 2 and comprises approximately 32% or 172 ha of the Project.
4.2.2.3 Land Use
At the time of the field assessment, the land use within SMU 2A was grazing and patches of remnant vegetation.
4.2.2.4 Management Considerations
Generally, the topsoil does not exhibit any characteristics that require any non-standard management practices. The subsoil generally exhibits high alkalinity, high sodicity and high salinity. If the subsoil is exposed and not managed, in addition to severe agricultural productivity limitations, impacts may include:
• Erosion hazards including tunnel erosion
• Impeded soil infiltration and permeability, and
Ensham Resources Pty Ltd Ensham Life of Mine Extension Project - Zones 2 and 3 Land Resources
SLR Ref No: 620.30686.00000-R01-v4.0-RevF.docx March 2022
620.30686.00000-R01-v4.0-RevF.docx Page 35
• Soil dispersion leading to soil structure breakdown, increased run-off and increased turbidity run-off.
4.2.3 Soil Map Unit 2B
4.2.3.1 Description
SMU 2B dominant soil type included Eutrophic Brown Dermosols and the subdominant soil types included Eutrophic Black Dermosols, Eutrophic Grey Dermosols and Dystrophic Red Dermosols.
4.2.3.2 Location
SMU 2B is located across the entire portion of Zone 3 and comprises approximately 33% or 182 ha of the Project.
4.2.3.3 Land Use
At the time of the field assessment, the land use within SMU 2B was grazing.
4.2.3.4 Management Considerations
Generally, the topsoil or subsoil do not exbibit any characteristics that require any non-standard management practices.
4.2.4 Soil Map Unit 3
4.2.4.1 Description
SMU 3 dominant soil type included Magnesic Brown Kandosols and the subdominant soil types included Dystrophic Brown Kandosols.
4.2.4.2 Location
SMU 3 is located in the north-eastern portion of Zone 2 and comprises approximately 20% or 108 ha of the Project.
4.2.4.3 Land Use
At the time of the field assessment, the land use within SMU 3 was grazing and patches of remnant vegetation.
4.2.4.4 Management Considerations
Generally, the topsoil does exhibit highly acidic properties at the surface. The subsoil generally exhibits highly acidic, non-sodic and slightly-saline properties. The subsoil would have minimal impacts if exposed as it does not exhibit any characteristics that require any non-standard management practices.
Ensham Resources Pty Ltd Ensham Life of Mine Extension Project - Zones 2 and 3 Land Resources
SLR Ref No: 620.30686.00000-R01-v4.0-RevF.docx March 2022
620.30686.00000-R01-v4.0-RevF.docx Page 36
4.2.5 Soil Map Unit 4
4.2.5.1 Description
SMU 4 soil type included Clastic Rudosols.
4.2.5.2 Location
SMU 4 is located in the north-western portion of Zone 2 and comprises approximately 10% or 55 ha of the Project Area.
4.2.5.3 Land Use
At the time of the field assessment, the land use within SMU 4 was grazing and patches of remnant vegetation.
4.2.5.4 Management Considerations
The topsoil and subsoil both exhibit strongly acidic properties. The non-uniformity and lack of structure typical of this soil types means impacts to management may include:
• Erosion hazards including tunnel erosion
• Impeded soil infiltration and permeability, and
• Soil dispersion leading to soil structure breakdown, increased run-off and increased turbidity run-off.
4.3 Erosion Potential
An Emerson Aggregate Test (EAT) semi-quantitatively classifies the coherence of soil aggregates in water to provide an indication of dispersive properties and susceptibility to erosion. The ratings are based on a hierarchical class system where a rating of 1 being the most dispersive and 8 being non-dispersive.
Approximately 64% of the analysed sites have topsoil with moderately high to high potential for dispersion and erosion, having EAT ratings of 2 and 3. The remaining 36% analysed topsoil sites have an EAT rating of 4, which indicates a negligible potential for dispersion and erosion. Approximately 78% of subsoil samples have EAT ratings of 2 and 3, indicating a moderately high to high potential for dispersion. The remaining 22% of subsoil samples have a negligible dispersion potential of EAT 4.
Once the dispersive subsoils are disturbed, the potential for erosion should be increased. If this disturbance occurs within the vicinity of a drainage line, this could impact on the health of downstream watercourses through an increase in sediment load. Full EAT results are shown in Appendix D.
Ensham Resources Pty Ltd Ensham Life of Mine Extension Project - Zones 2 and 3 Land Resources
SLR Ref No: 620.30686.00000-R01-v4.0-RevF.docx March 2022
620.30686.00000-R01-v4.0-RevF.docx Page 37
4.4 Waste Rock Characterisation
4.4.1 Waste Rock Characterisation
The 12 samples from the Project were analysed for their GAI, the ASLP and Acid Mine Drainage AMD characteristics. Instructions were given to sample waste rock from above and below the coal seam. In addition to the standard parameters, samples were further assessed for their HCl-extractable sulphur concentrations. The incorporation of HCL extractable sulphur resulted in a reduction of the Maximum Potential Acidity (MPA) in all 12 samples, confirming the conservative nature of the calculated standard NAPP. Locations of the sampled drill core locations are presented in Figure 6 and Figure 7 and laboratory documents are provided in Appendix A.
The Project will place the waste rock into open cut Pit C and Pit D. The estimated volume of waste rock from the proposed Project over the life of the mine is 45,600 m3 in total which is approximately less than 0.13% of total approved waste rock volumes (36 million m3) currently approved for the rehabilitation of Pit C and Pit D. At less than 0.13% of total approved rock volume for Pit C and Pit D, it is not expected that this addition would impact the approved final landform outcomes in Appendix 3 of the EA.
Quality assurance of the sampling results was achieved by including two duplicate samples into the sampling suite. Results of the duplicates were in good agreement (less than 10% variance) with regards to the AMD characterisation and GAI classification involving total metal analysis. Duplicate sample analysis for the Australian Standard Leaching Procedure (ASLP) leachability of metals was generally not in agreement, showing a greater than 10% variance. The discrepancy with regards to metal leachability was uniform between major metals like aluminium and iron and minor metals like nickel and lead and may be due to sample slitting of the partially oxidised drill core, resulting in a greater fraction of leachable metals being present in one fraction of the QA samples.
4.4.2 Acid Producing Potential
The additional characterisation of 12 drill core waste rock samples from the Project suggests that 10 of 12 samples are NAF. One sample is classified as uncertain and one sample potentially acid generating (PAF). The NAPP of all 12 samples ranges from positive 6.2 to negative 91.3 kg/H2SO4/tonne. Combined with the mostly alkaline NAG pH (8 of 12 samples) the overwhelming negative NAPP indicates a strong and available alkaline buffering capacity. Comparison between total and HCl extractable sulphur shows that sulphur is present as primary reactive sulphide in 11 of the 12 samples, ranging from 44.4% to 97.4% with an average of 82.4%. The acid producing potential results are shown in Figure 12 and Table 8.
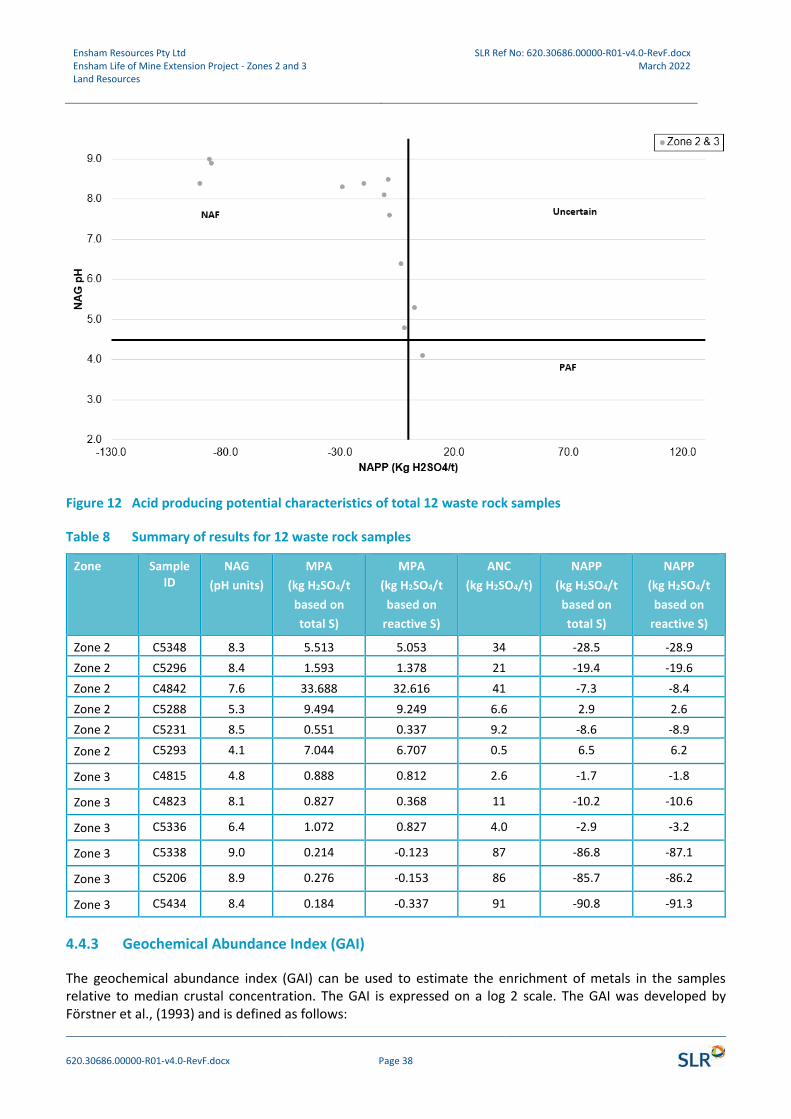
Ensham Resources Pty Ltd Ensham Life of Mine Extension Project - Zones 2 and 3 Land Resources
SLR Ref No: 620.30686.00000-R01-v4.0-RevF.docx March 2022
620.30686.00000-R01-v4.0-RevF.docx Page 38
Figure 12 Acid producing potential characteristics of total 12 waste rock samples
Table 8 Summary of results for 12 waste rock samples
Zone Sample ID
NAG
(pH units)
MPA
(kg H2SO4/t
based on
total S)
MPA
(kg H2SO4/t
based on
reactive S)
ANC
(kg H2SO4/t)
NAPP
(kg H2SO4/t
based on
total S)
NAPP
(kg H2SO4/t
based on
reactive S)
Zone 2 C5348 8.3 5.513 5.053 34 -28.5 -28.9
Zone 2 C5296 8.4 1.593 1.378 21 -19.4 -19.6
Zone 2 C4842 7.6 33.688 32.616 41 -7.3 -8.4
Zone 2 C5288 5.3 9.494 9.249 6.6 2.9 2.6
Zone 2 C5231 8.5 0.551 0.337 9.2 -8.6 -8.9
Zone 2 C5293 4.1 7.044 6.707 0.5 6.5 6.2
Zone 3 C4815 4.8 0.888 0.812 2.6 -1.7 -1.8
Zone 3 C4823 8.1 0.827 0.368 11 -10.2 -10.6
Zone 3 C5336 6.4 1.072 0.827 4.0 -2.9 -3.2
Zone 3 C5338 9.0 0.214 -0.123 87 -86.8 -87.1
Zone 3 C5206 8.9 0.276 -0.153 86 -85.7 -86.2
Zone 3 C5434 8.4 0.184 -0.337 91 -90.8 -91.3
4.4.3 Geochemical Abundance Index (GAI)
The geochemical abundance index (GAI) can be used to estimate the enrichment of metals in the samples relative to median crustal concentration. The GAI is expressed on a log 2 scale. The GAI was developed by Förstner et al., (1993) and is defined as follows:

Ensham Resources Pty Ltd Ensham Life of Mine Extension Project - Zones 2 and 3 Land Resources
SLR Ref No: 620.30686.00000-R01-v4.0-RevF.docx March 2022
620.30686.00000-R01-v4.0-RevF.docx Page 39
𝐺𝐴𝐼 = 𝑙𝑜𝑔2 (𝐶(1.5 ∗ 𝐵)⁄ )
𝐶 = 𝑚𝑒𝑎𝑠𝑢𝑟𝑒𝑑 𝑐𝑜𝑛𝑐𝑒𝑛𝑡𝑟𝑎𝑡𝑖𝑜𝑛 𝑖𝑛 𝑠𝑎𝑚𝑝𝑙𝑒𝐵 = 𝑎𝑣𝑒𝑟𝑎𝑔𝑒 𝑐𝑟𝑢𝑠𝑡𝑎𝑙 𝑎𝑏𝑢𝑛𝑑𝑎𝑛𝑐𝑒
The enrichment ranges of a metal based on the GAI values are interpreted as follow:
• GAI=0 indicates <3 times median crustal abundance
• GAI=1 indicates 3 to 6 times median crustal abundance
• GAI=2 indicates 6 to 12 times median crustal abundance
• GAI=3 indicates 12 to 24 times median crustal abundance
• GAI=4 indicates 24 to 48 times median crustal abundance
• GAI=5 indicates 48 to 96 times median crustal abundance
• GAI=6 indicates more than 96 times median crustal abundance
GAI value of 3 is taken as the threshold for predicting potential metalliferous drainage from samples. The median crustal abundances used to compare results against in the GAI are provided in Table 9.
Table 9 Median crustal abundance for trace metals (Berkman and Ryall, 1976; Bowen, 1979)
Name Symbol Median Crustal Abundance (mg/kg)
Aluminium Al 71,000
Arsenic As 6
Beryllium Be 6
Boron B 8.6
Cadmium Cd 0.35
Cobalt Co 8
Chromium Cr 70
Copper Cu 30
Iron Fe 40,000
Manganese Mn 1,000
Molybdenum Mo 2
Nickel Ni 50
Lead Pb 35
Zinc Zn 90
Selenium Se 0.4
Vanadium V 90
The GAI assessment of the 12 Drill core waste rock samples (presented in Table 10) shows that the waste rock is depleted with regards to most metals. A slight enrichment only exists for cobalt, molybdenum and selenium.
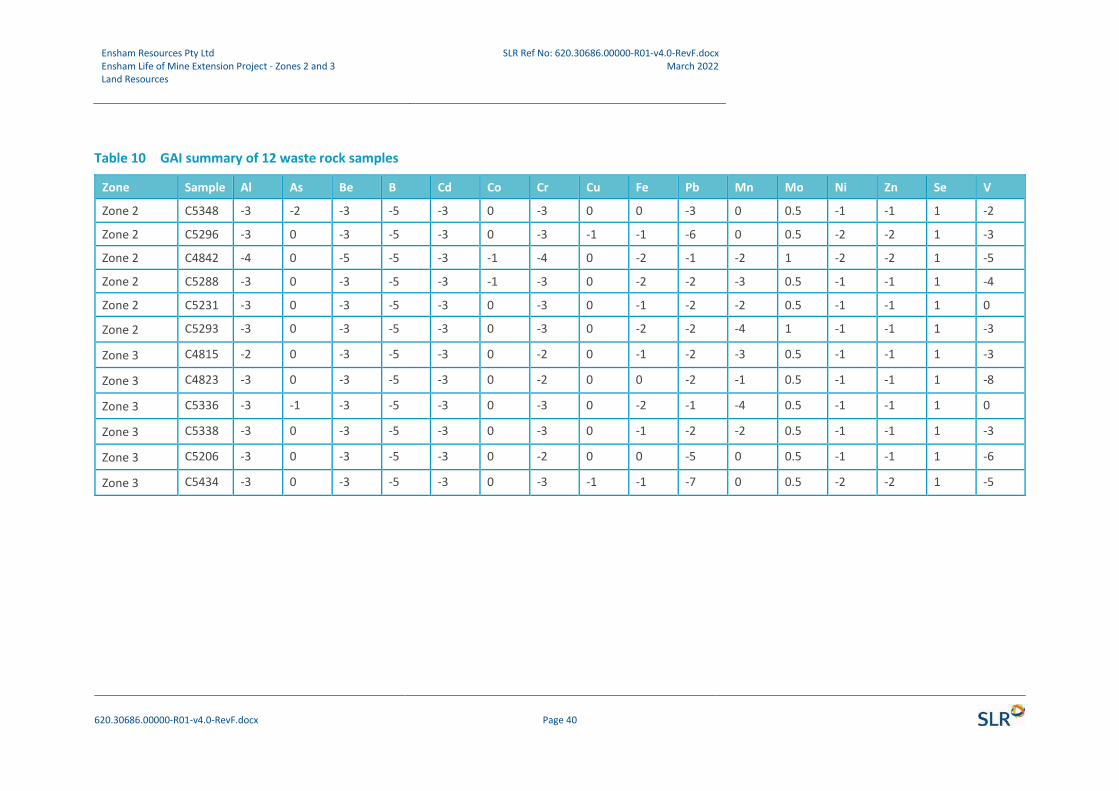
Ensham Resources Pty Ltd Ensham Life of Mine Extension Project - Zones 2 and 3 Land Resources
SLR Ref No: 620.30686.00000-R01-v4.0-RevF.docx March 2022
620.30686.00000-R01-v4.0-RevF.docx Page 40
Table 10 GAI summary of 12 waste rock samples
Zone Sample Al As Be B Cd Co Cr Cu Fe Pb Mn Mo Ni Zn Se V
Zone 2 C5348 -3 -2 -3 -5 -3 0 -3 0 0 -3 0 0.5 -1 -1 1 -2
Zone 2 C5296 -3 0 -3 -5 -3 0 -3 -1 -1 -6 0 0.5 -2 -2 1 -3
Zone 2 C4842 -4 0 -5 -5 -3 -1 -4 0 -2 -1 -2 1 -2 -2 1 -5
Zone 2 C5288 -3 0 -3 -5 -3 -1 -3 0 -2 -2 -3 0.5 -1 -1 1 -4
Zone 2 C5231 -3 0 -3 -5 -3 0 -3 0 -1 -2 -2 0.5 -1 -1 1 0
Zone 2 C5293 -3 0 -3 -5 -3 0 -3 0 -2 -2 -4 1 -1 -1 1 -3
Zone 3 C4815 -2 0 -3 -5 -3 0 -2 0 -1 -2 -3 0.5 -1 -1 1 -3
Zone 3 C4823 -3 0 -3 -5 -3 0 -2 0 0 -2 -1 0.5 -1 -1 1 -8
Zone 3 C5336 -3 -1 -3 -5 -3 0 -3 0 -2 -1 -4 0.5 -1 -1 1 0
Zone 3 C5338 -3 0 -3 -5 -3 0 -3 0 -1 -2 -2 0.5 -1 -1 1 -3
Zone 3 C5206 -3 0 -3 -5 -3 0 -2 0 0 -5 0 0.5 -1 -1 1 -6
Zone 3 C5434 -3 0 -3 -5 -3 0 -3 -1 -1 -7 0 0.5 -2 -2 1 -5
Ensham Resources Pty Ltd Ensham Life of Mine Extension Project - Zones 2 and 3 Land Resources
SLR Ref No: 620.30686.00000-R01-v4.0-RevF.docx March 2022
620.30686.00000-R01-v4.0-RevF.docx Page 41
4.4.4 Waste Rock Leachate Characteristics
The ASLP results for the 12 samples from the Project are shown in Table 11 and compared to the toxicant default guideline values for water quality in aquatic ecosystems (95% protection level) (Australian Government, 2022). Guideline exceedances in the leachate was reported for aluminium, arsenic, copper, cobalt, zinc, lead, molybdenum, nickel, selenium and vanadium. At the pH values measured (pH 8.4 – 9.8) most of these metals are unlikely be mobile and bioavailable. Hence, the exceedances of these metal are likely due to the presence of natural clays (Brookins; 1988, Meunier; 1994), which will disperse and potentially pass through the standard (0.45 µm) filtration as particles.
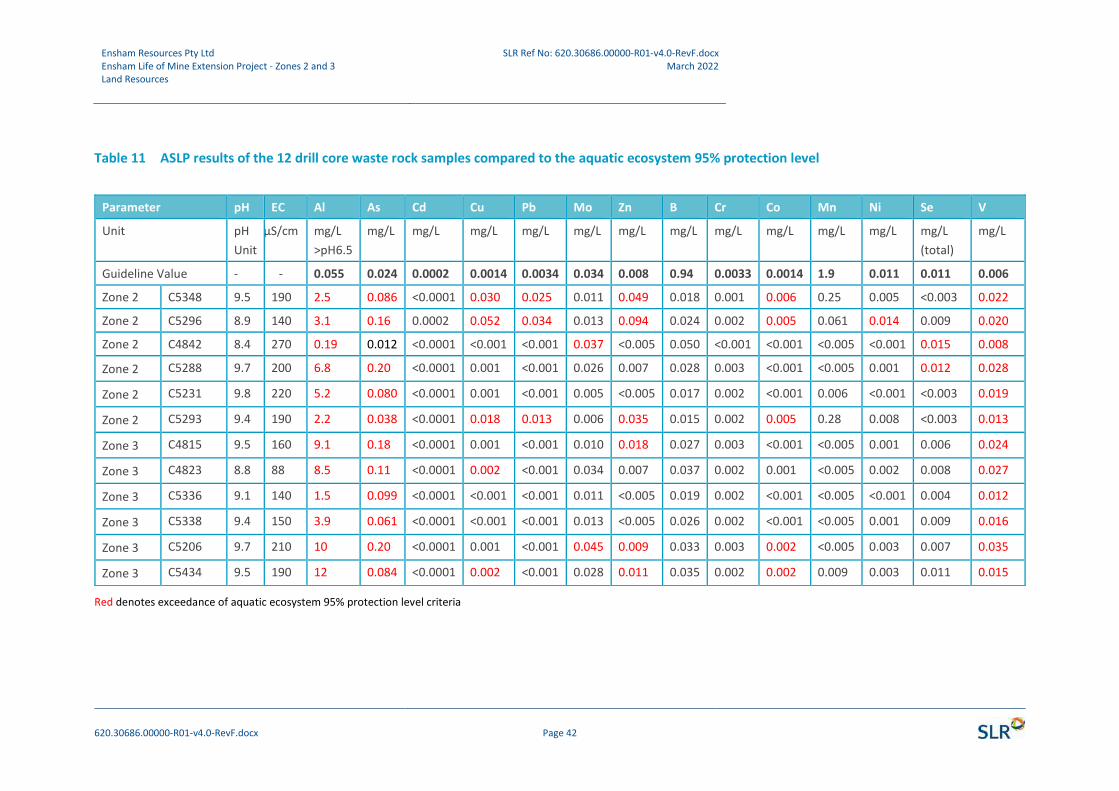
Ensham Resources Pty Ltd Ensham Life of Mine Extension Project - Zones 2 and 3 Land Resources
SLR Ref No: 620.30686.00000-R01-v4.0-RevF.docx March 2022
620.30686.00000-R01-v4.0-RevF.docx Page 42
Table 11 ASLP results of the 12 drill core waste rock samples compared to the aquatic ecosystem 95% protection level
Red denotes exceedance of aquatic ecosystem 95% protection level criteria
Parameter pH EC Al As Cd Cu Pb Mo Zn B Cr Co Mn Ni Se V
Unit pH
Unit
µS/cm mg/L
>pH6.5
mg/L mg/L mg/L mg/L mg/L mg/L mg/L mg/L mg/L mg/L mg/L mg/L
(total)
mg/L
Guideline Value - - 0.055 0.024 0.0002 0.0014 0.0034 0.034 0.008 0.94 0.0033 0.0014 1.9 0.011 0.011 0.006
Zone 2 C5348 9.5 190 2.5 0.086 <0.0001 0.030 0.025 0.011 0.049 0.018 0.001 0.006 0.25 0.005 <0.003 0.022
Zone 2 C5296 8.9 140 3.1 0.16 0.0002 0.052 0.034 0.013 0.094 0.024 0.002 0.005 0.061 0.014 0.009 0.020
Zone 2 C4842 8.4 270 0.19 0.012 <0.0001 <0.001 <0.001 0.037 <0.005 0.050 <0.001 <0.001 <0.005 <0.001 0.015 0.008
Zone 2 C5288 9.7 200 6.8 0.20 <0.0001 0.001 <0.001 0.026 0.007 0.028 0.003 <0.001 <0.005 0.001 0.012 0.028
Zone 2 C5231 9.8 220 5.2 0.080 <0.0001 0.001 <0.001 0.005 <0.005 0.017 0.002 <0.001 0.006 <0.001 <0.003 0.019
Zone 2 C5293 9.4 190 2.2 0.038 <0.0001 0.018 0.013 0.006 0.035 0.015 0.002 0.005 0.28 0.008 <0.003 0.013
Zone 3 C4815 9.5 160 9.1 0.18 <0.0001 0.001 <0.001 0.010 0.018 0.027 0.003 <0.001 <0.005 0.001 0.006 0.024
Zone 3 C4823 8.8 88 8.5 0.11 <0.0001 0.002 <0.001 0.034 0.007 0.037 0.002 0.001 <0.005 0.002 0.008 0.027
Zone 3 C5336 9.1 140 1.5 0.099 <0.0001 <0.001 <0.001 0.011 <0.005 0.019 0.002 <0.001 <0.005 <0.001 0.004 0.012
Zone 3 C5338 9.4 150 3.9 0.061 <0.0001 <0.001 <0.001 0.013 <0.005 0.026 0.002 <0.001 <0.005 0.001 0.009 0.016
Zone 3 C5206 9.7 210 10 0.20 <0.0001 0.001 <0.001 0.045 0.009 0.033 0.003 0.002 <0.005 0.003 0.007 0.035
Zone 3 C5434 9.5 190 12 0.084 <0.0001 0.002 <0.001 0.028 0.011 0.035 0.002 0.002 0.009 0.003 0.011 0.015
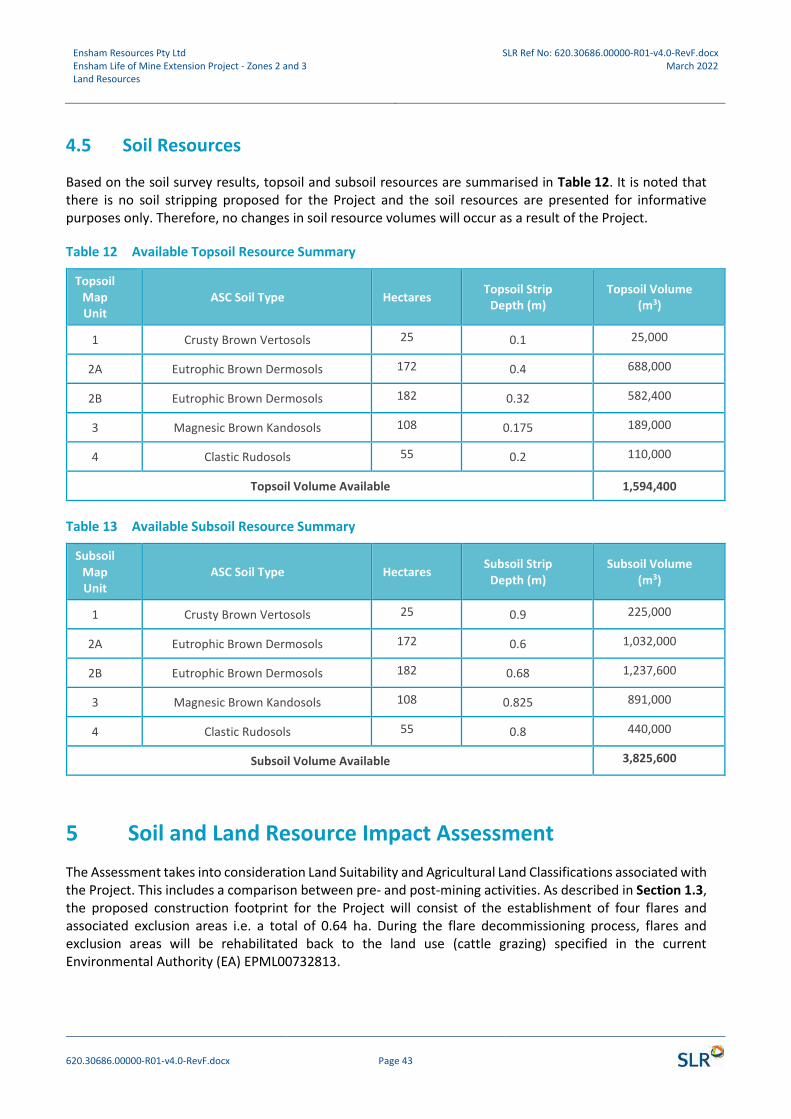
Ensham Resources Pty Ltd Ensham Life of Mine Extension Project - Zones 2 and 3 Land Resources
SLR Ref No: 620.30686.00000-R01-v4.0-RevF.docx March 2022
620.30686.00000-R01-v4.0-RevF.docx Page 43
4.5 Soil Resources
Based on the soil survey results, topsoil and subsoil resources are summarised in Table 12. It is noted that there is no soil stripping proposed for the Project and the soil resources are presented for informative purposes only. Therefore, no changes in soil resource volumes will occur as a result of the Project.
Table 12 Available Topsoil Resource Summary
Topsoil Map Unit
ASC Soil Type Hectares Topsoil Strip
Depth (m) Topsoil Volume
(m3)
1 Crusty Brown Vertosols 25 0.1 25,000
2A Eutrophic Brown Dermosols 172 0.4 688,000
2B Eutrophic Brown Dermosols 182 0.32 582,400
3 Magnesic Brown Kandosols 108 0.175 189,000
4 Clastic Rudosols 55 0.2 110,000
Topsoil Volume Available 1,594,400
Table 13 Available Subsoil Resource Summary
Subsoil Map Unit
ASC Soil Type Hectares Subsoil Strip
Depth (m) Subsoil Volume
(m3)
1 Crusty Brown Vertosols 25 0.9 225,000
2A Eutrophic Brown Dermosols 172 0.6 1,032,000
2B Eutrophic Brown Dermosols 182 0.68 1,237,600
3 Magnesic Brown Kandosols 108 0.825 891,000
4 Clastic Rudosols 55 0.8 440,000
Subsoil Volume Available 3,825,600
5 Soil and Land Resource Impact Assessment
The Assessment takes into consideration Land Suitability and Agricultural Land Classifications associated with the Project. This includes a comparison between pre- and post-mining activities. As described in Section 1.3, the proposed construction footprint for the Project will consist of the establishment of four flares and associated exclusion areas i.e. a total of 0.64 ha. During the flare decommissioning process, flares and exclusion areas will be rehabilitated back to the land use (cattle grazing) specified in the current Environmental Authority (EA) EPML00732813.
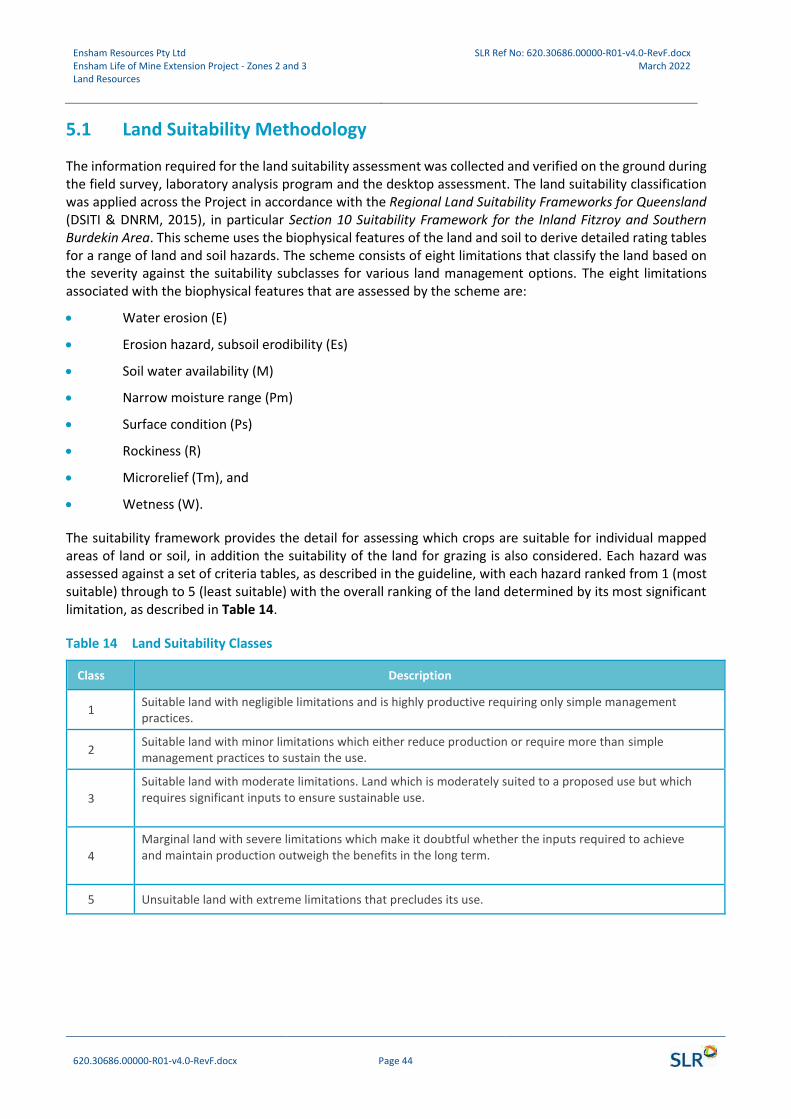
Ensham Resources Pty Ltd Ensham Life of Mine Extension Project - Zones 2 and 3 Land Resources
SLR Ref No: 620.30686.00000-R01-v4.0-RevF.docx March 2022
620.30686.00000-R01-v4.0-RevF.docx Page 44
5.1 Land Suitability Methodology
The information required for the land suitability assessment was collected and verified on the ground during the field survey, laboratory analysis program and the desktop assessment. The land suitability classification was applied across the Project in accordance with the Regional Land Suitability Frameworks for Queensland (DSITI & DNRM, 2015), in particular Section 10 Suitability Framework for the Inland Fitzroy and Southern Burdekin Area. This scheme uses the biophysical features of the land and soil to derive detailed rating tables for a range of land and soil hazards. The scheme consists of eight limitations that classify the land based on the severity against the suitability subclasses for various land management options. The eight limitations associated with the biophysical features that are assessed by the scheme are:
• Water erosion (E)
• Erosion hazard, subsoil erodibility (Es)
• Soil water availability (M)
• Narrow moisture range (Pm)
• Surface condition (Ps)
• Rockiness (R)
• Microrelief (Tm), and
• Wetness (W).
The suitability framework provides the detail for assessing which crops are suitable for individual mapped areas of land or soil, in addition the suitability of the land for grazing is also considered. Each hazard was assessed against a set of criteria tables, as described in the guideline, with each hazard ranked from 1 (most suitable) through to 5 (least suitable) with the overall ranking of the land determined by its most significant limitation, as described in Table 14.
Table 14 Land Suitability Classes
Class Description
1 Suitable land with negligible limitations and is highly productive requiring only simple management practices.
2 Suitable land with minor limitations which either reduce production or require more than simple management practices to sustain the use.
3
Suitable land with moderate limitations. Land which is moderately suited to a proposed use but which requires significant inputs to ensure sustainable use.
4
Marginal land with severe limitations which make it doubtful whether the inputs required to achieve and maintain production outweigh the benefits in the long term.
5 Unsuitable land with extreme limitations that precludes its use.
Ensham Resources Pty Ltd Ensham Life of Mine Extension Project - Zones 2 and 3 Land Resources
SLR Ref No: 620.30686.00000-R01-v4.0-RevF.docx March 2022
620.30686.00000-R01-v4.0-RevF.docx Page 45
5.2 Pre-Mining Land Suitability Results
5.2.1 Pre-Mining Land Suitability for Cropping
The land suitability assessment for cropping indicates the main limitations for the Project are soil wetness (w) and soil water availability (m). Soil wetness is predominantly influenced by the permeability and drainage capacity of the soil. Soil water availability is predominately influenced by the soil texture. The land suitability ratings are as follows:
• Approximately 25 ha of land associated with SMU 1 is rated as Class 4, and
• Approximately 517 ha of land associated with SMUs 2A, 2B, 3 & 4 is rated as Class 5.
Results for the Land Suitability Assessment for cropping are outlined in Table 15 and shown in Figure 13, with the detailed Land Suitability Assessment provided in Appendix E.
5.2.2 Pre-Mining Land Suitability for Grazing
The land suitability assessment for grazing indicates the main limitations for the Project are soil wetness (w) and soil water availability (m) and ratings as follows:
• Approximately 25 ha of land associated with SMU 1 is rated as Class 2
• Approximately 462 ha of land associated with SMU 2A, 2B & 3 is rated as Class 3, and
• Approximately 55 ha of land associated with SMU 4 is rated as Class 5.
Results for the Land Suitability Assessment for grazing are outlined in Table 16 and shown in Figure 13, with the detailed Land Suitability Assessment provided in Appendix E.
5.2.3 Post-Mining
Land suitability classes for areas not scheduled for the proposed mining minor construction footprint (ie 4 flares) will remain the same. Surface disturbance predicted for this Project will be limited to the flare construction footprint. Upon flare decommission, these classes will remain the same post-mining.
Changes in the areas of land suitability classes within the Project Area between pre- and post-mining are summarised in Table 15 and Table 16 and also include the mine spoil areas.
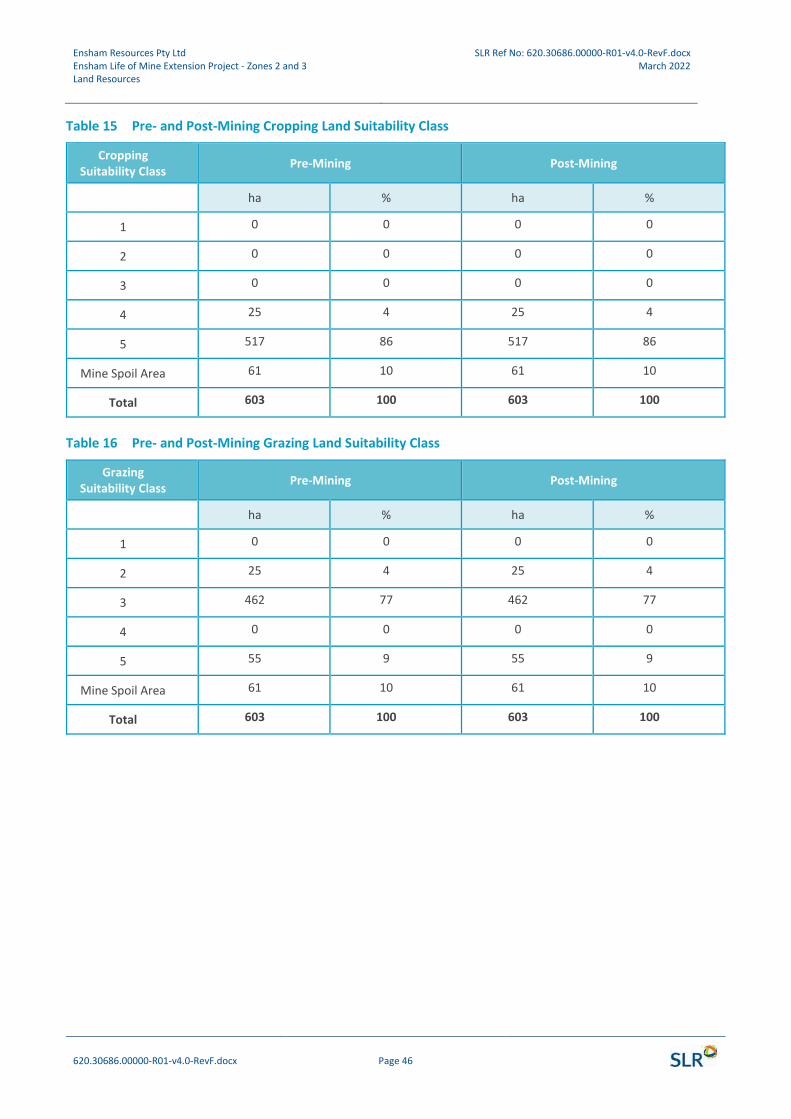
Ensham Resources Pty Ltd Ensham Life of Mine Extension Project - Zones 2 and 3 Land Resources
SLR Ref No: 620.30686.00000-R01-v4.0-RevF.docx March 2022
620.30686.00000-R01-v4.0-RevF.docx Page 46
Table 15 Pre- and Post-Mining Cropping Land Suitability Class
Cropping Suitability Class
Pre-Mining Post-Mining
ha % ha %
1 0 0 0 0
2 0 0 0 0
3 0 0 0 0
4 25 4 25 4
5 517 86 517 86
Mine Spoil Area 61 10 61 10
Total 603 100 603 100
Table 16 Pre- and Post-Mining Grazing Land Suitability Class
Grazing Suitability Class
Pre-Mining Post-Mining
ha % ha %
1 0 0 0 0
2 25 4 25 4
3 462 77 462 77
4 0 0 0 0
5 55 9 55 9
Mine Spoil Area 61 10 61 10
Total 603 100 603 100
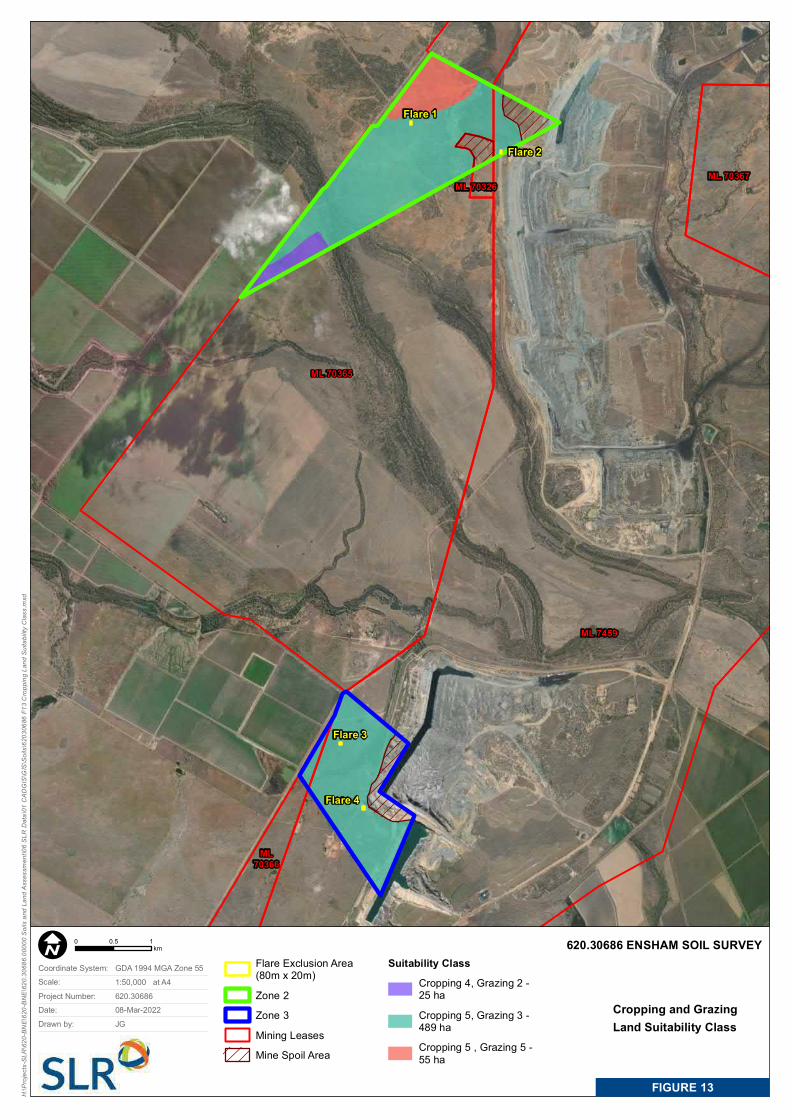
H:\P
rojec
ts-SL
R\62
0-BNE
\620-B
NE\62
0.306
86.00
000 S
oils a
nd La
nd As
sess
ment\
06 SL
R Da
ta\01
CAD
GIS\G
IS\So
ils\62
0306
86 F1
3 Crop
ping L
and S
uitab
ility C
lass.m
xd
620.30686 ENSHAM SOIL SURVEY
Cropping and Grazing Land Suitability Class
FIGURE 13
ML 70326
ML 70365
ML70366
ML 70367
ML 7459
Flare 1
Flare 2
Flare 3
Flare 4
Flare Exclusion Area(80m x 20m)Zone 2Zone 3Mining LeasesMine Spoil Area
Suitability ClassCropping 4, Grazing 2 -25 haCropping 5, Grazing 3 -489 haCropping 5 , Grazing 5 -55 ha
0 10.5kmI
1:50,000 at A4Coordinate System: GDA 1994 MGA Zone 55Scale:Project Number: 620.30686Date: 08-Mar-2022 Drawn by: JG
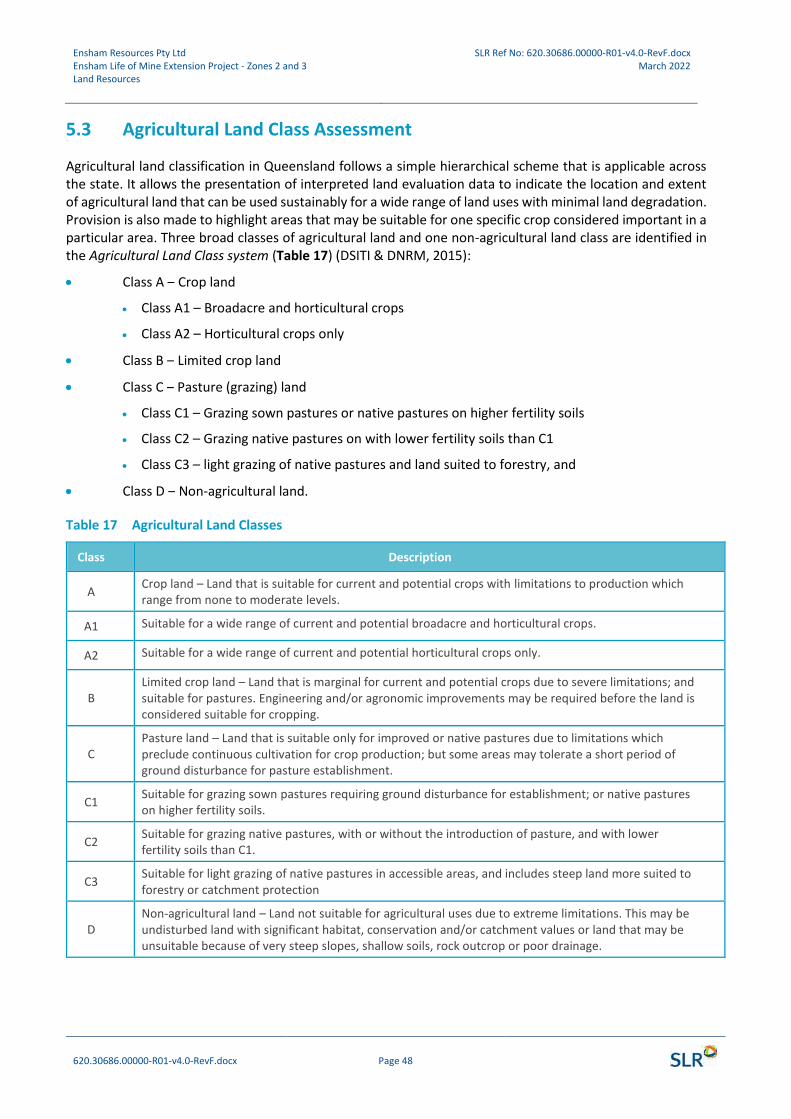
Ensham Resources Pty Ltd Ensham Life of Mine Extension Project - Zones 2 and 3 Land Resources
SLR Ref No: 620.30686.00000-R01-v4.0-RevF.docx March 2022
620.30686.00000-R01-v4.0-RevF.docx Page 48
5.3 Agricultural Land Class Assessment
Agricultural land classification in Queensland follows a simple hierarchical scheme that is applicable across the state. It allows the presentation of interpreted land evaluation data to indicate the location and extent of agricultural land that can be used sustainably for a wide range of land uses with minimal land degradation. Provision is also made to highlight areas that may be suitable for one specific crop considered important in a particular area. Three broad classes of agricultural land and one non-agricultural land class are identified in the Agricultural Land Class system (Table 17) (DSITI & DNRM, 2015):
• Class A ‒ Crop land
• Class A1 – Broadacre and horticultural crops
• Class A2 – Horticultural crops only
• Class B ‒ Limited crop land
• Class C ‒ Pasture (grazing) land
• Class C1 – Grazing sown pastures or native pastures on higher fertility soils
• Class C2 – Grazing native pastures on with lower fertility soils than C1
• Class C3 – light grazing of native pastures and land suited to forestry, and
• Class D ‒ Non-agricultural land.
Table 17 Agricultural Land Classes
Class Description
A Crop land – Land that is suitable for current and potential crops with limitations to production which range from none to moderate levels.
A1 Suitable for a wide range of current and potential broadacre and horticultural crops.
A2 Suitable for a wide range of current and potential horticultural crops only.
B Limited crop land – Land that is marginal for current and potential crops due to severe limitations; and suitable for pastures. Engineering and/or agronomic improvements may be required before the land is considered suitable for cropping.
C Pasture land – Land that is suitable only for improved or native pastures due to limitations which preclude continuous cultivation for crop production; but some areas may tolerate a short period of ground disturbance for pasture establishment.
C1 Suitable for grazing sown pastures requiring ground disturbance for establishment; or native pastures on higher fertility soils.
C2 Suitable for grazing native pastures, with or without the introduction of pasture, and with lower fertility soils than C1.
C3 Suitable for light grazing of native pastures in accessible areas, and includes steep land more suited to forestry or catchment protection
D Non-agricultural land – Land not suitable for agricultural uses due to extreme limitations. This may be undisturbed land with significant habitat, conservation and/or catchment values or land that may be unsuitable because of very steep slopes, shallow soils, rock outcrop or poor drainage.

Ensham Resources Pty Ltd Ensham Life of Mine Extension Project - Zones 2 and 3 Land Resources
SLR Ref No: 620.30686.00000-R01-v4.0-RevF.docx March 2022
620.30686.00000-R01-v4.0-RevF.docx Page 49
5.4 Agricultural Land Class Results
5.4.1 Pre-Mining
The agricultural land class ratings for the Project are soil wetness (w) and soil water availability (m) with ratings as follows:
• Approximately 25 ha of land associated with SMU 1 is rated as Class A2
• Approximately 462 ha of land associated with SMU 2A, 2B & 3 is rated as Class C2, and
• Approximately 55 ha of land associated with SMU 4 is rated as Class C3.
Results for the pre-mining agricultural land classes are outlined in Table 18 and shown in Figure 14, with the detailed agricultural land assessment provided in Appendix E.
5.4.2 Post-Mining
Agricultural land classes for areas not scheduled for the proposed mining construction footprint (e.g. flares) will remain the same. Surface disturbance predicted for this Project, will be limited to the flare construction footprint. Upon flare decommission, these classes will remain the same post-mining.
Changes in the areas of agricultural land classes within the Project between pre- and post-mining are summarised in Table 18 and includes the mine spoil areas.
Table 18 Pre- and Post-Mining Agricultural Land Classes
Agricultural Land Class
Pre-Mining Post-Mining
ha % ha %
A1 0 0 0 0
A2 25 4 25 4
B 0 0 0 0
C1 0 0 0 0
C2 462 77 462 77
C3 55 9 55 9
D 0 0 0 0
Mine Spoil Area 61 10 61 10
Total 603 100 603 100
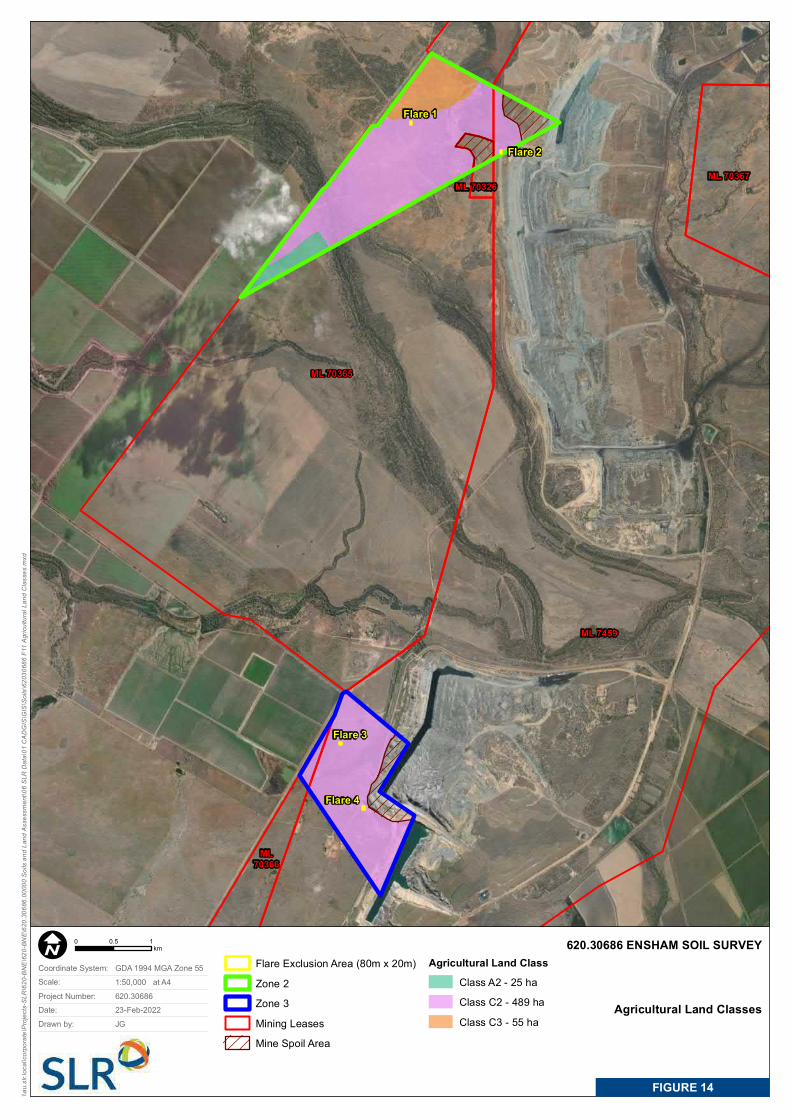
\\au.s
lr.loc
al\co
rporat
e\Proj
ects-
SLR\
620-B
NE\62
0-BNE
\620.3
0686
.0000
0 Soil
s and
Land
Asse
ssme
nt\06
SLR
Data
\01 C
ADGI
S\GI
S\So
ils\62
0306
86 F1
1 Agri
cultu
ral La
nd C
lasse
s.mxd
620.30686 ENSHAM SOIL SURVEY
Agricultural Land Classes
FIGURE 14
ML 70326
ML 70365
ML70366
ML 70367
ML 7459
Flare 1
Flare 2
Flare 3
Flare 4
Flare Exclusion Area (80m x 20m)Zone 2Zone 3Mining LeasesMine Spoil Area
Agricultural Land ClassClass A2 - 25 haClass C2 - 489 haClass C3 - 55 ha
0 10.5kmI
1:50,000 at A4Coordinate System: GDA 1994 MGA Zone 55Scale:Project Number: 620.30686Date: 23-Feb-2022 Drawn by: JG
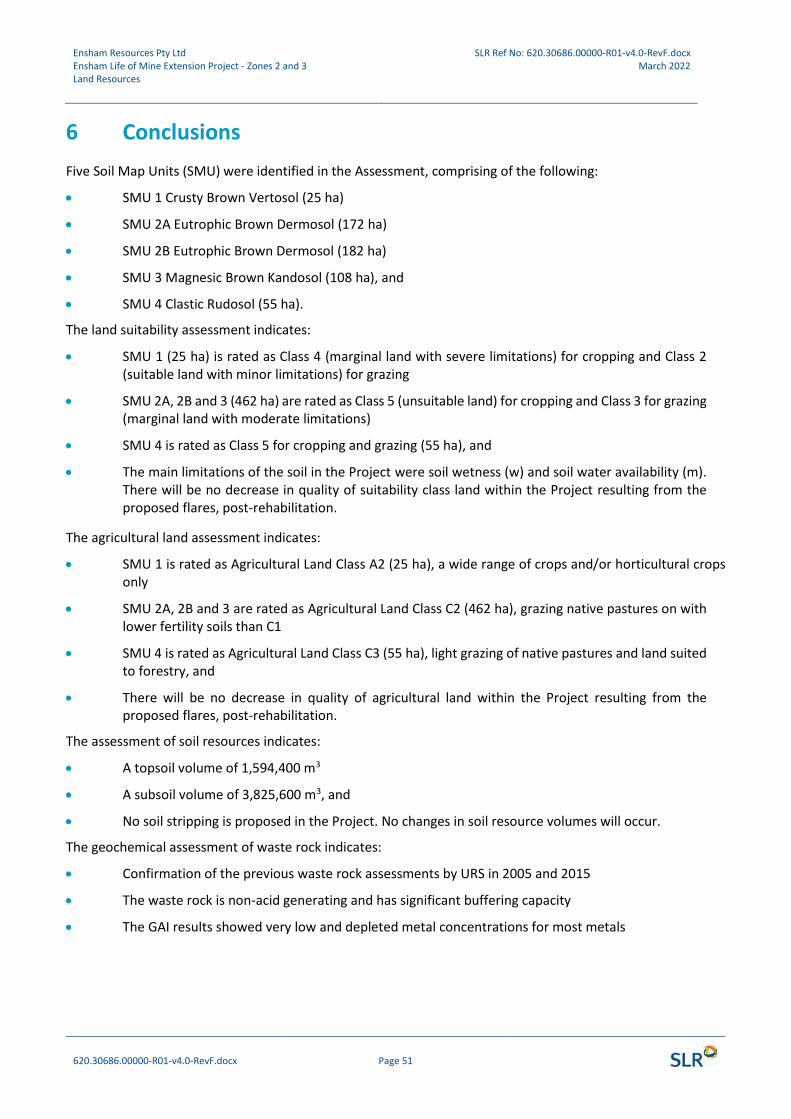
Ensham Resources Pty Ltd Ensham Life of Mine Extension Project - Zones 2 and 3 Land Resources
SLR Ref No: 620.30686.00000-R01-v4.0-RevF.docx March 2022
620.30686.00000-R01-v4.0-RevF.docx Page 51
6 Conclusions
Five Soil Map Units (SMU) were identified in the Assessment, comprising of the following:
• SMU 1 Crusty Brown Vertosol (25 ha)
• SMU 2A Eutrophic Brown Dermosol (172 ha)
• SMU 2B Eutrophic Brown Dermosol (182 ha)
• SMU 3 Magnesic Brown Kandosol (108 ha), and
• SMU 4 Clastic Rudosol (55 ha).
The land suitability assessment indicates:
• SMU 1 (25 ha) is rated as Class 4 (marginal land with severe limitations) for cropping and Class 2 (suitable land with minor limitations) for grazing
• SMU 2A, 2B and 3 (462 ha) are rated as Class 5 (unsuitable land) for cropping and Class 3 for grazing (marginal land with moderate limitations)
• SMU 4 is rated as Class 5 for cropping and grazing (55 ha), and
• The main limitations of the soil in the Project were soil wetness (w) and soil water availability (m). There will be no decrease in quality of suitability class land within the Project resulting from the proposed flares, post-rehabilitation.
The agricultural land assessment indicates:
• SMU 1 is rated as Agricultural Land Class A2 (25 ha), a wide range of crops and/or horticultural crops only
• SMU 2A, 2B and 3 are rated as Agricultural Land Class C2 (462 ha), grazing native pastures on with lower fertility soils than C1
• SMU 4 is rated as Agricultural Land Class C3 (55 ha), light grazing of native pastures and land suited to forestry, and
• There will be no decrease in quality of agricultural land within the Project resulting from the proposed flares, post-rehabilitation.
The assessment of soil resources indicates:
• A topsoil volume of 1,594,400 m3
• A subsoil volume of 3,825,600 m3, and
• No soil stripping is proposed in the Project. No changes in soil resource volumes will occur.
The geochemical assessment of waste rock indicates:
• Confirmation of the previous waste rock assessments by URS in 2005 and 2015
• The waste rock is non-acid generating and has significant buffering capacity
• The GAI results showed very low and depleted metal concentrations for most metals
Ensham Resources Pty Ltd Ensham Life of Mine Extension Project - Zones 2 and 3 Land Resources
SLR Ref No: 620.30686.00000-R01-v4.0-RevF.docx March 2022
620.30686.00000-R01-v4.0-RevF.docx Page 52
• ASLP metal concentrations showed several exceedances of guideline values for aquatic ecosystem protection, particularly aluminium and vanadium. Such exceedances are unlikely at the reported pH and are likely to be the result of colloid transport through the 0.45µm filter membrane
• Waste rock produced will not be placed on agricultural land, but be buried within the open cut pit and results indicate any adverse impact from metals concentration and leachability is unlikely, and
• The estimated volume of waste rock from the Project over the life of the mine is 45,600 m3 in total, which is approximately less than 0.13% of total waste rock volumes (36 million m3) currently approved for the rehabilitation of open cut Pit C and Pit D. It is not expected to impact the approved final landform outcomes in Appendix 3 Rehabilitation Success Criteria of the EA.
Ensham Resources Pty Ltd Ensham Life of Mine Extension Project - Zones 2 and 3 Land Resources
SLR Ref No: 620.30686.00000-R01-v4.0-RevF.docx March 2022
620.30686.00000-R01-v4.0-RevF.docx Page 53
7 References
Gordon Geotechniques Pty Ltd, 2022, Subsidence Report for the Ensham Life of Mine Extension – Zone 2 and 3, prepared for Ensham Resources Pty Ltd 2022.
Idemitsu Australia, 2022. Supporting documentation for EA Amendment Report.
Idemitsu Australia Resources. (2021). Ensham Life of Mine Extension Project Environmental Impact Statement, Chapter 10 – Surface Water Resources.
Independent Expert Steering Committee (IESC), 2015. Monitoring and Management of Subsidence Induced by Longwall Coal Mining Activity. Report to the Department of the Environment.
Ensham Resources Pty Ltd Ensham Life of Mine Extension Project - Zones 2 and 3 Land Resources
SLR Ref No: 620.30686.00000-R01-v4.0-RevF.docx March 2022
620.30686.00000-R01-v4.0-RevF.docx Page 54
APPENDIX A
Soil Laboratory Certificates of Analysis
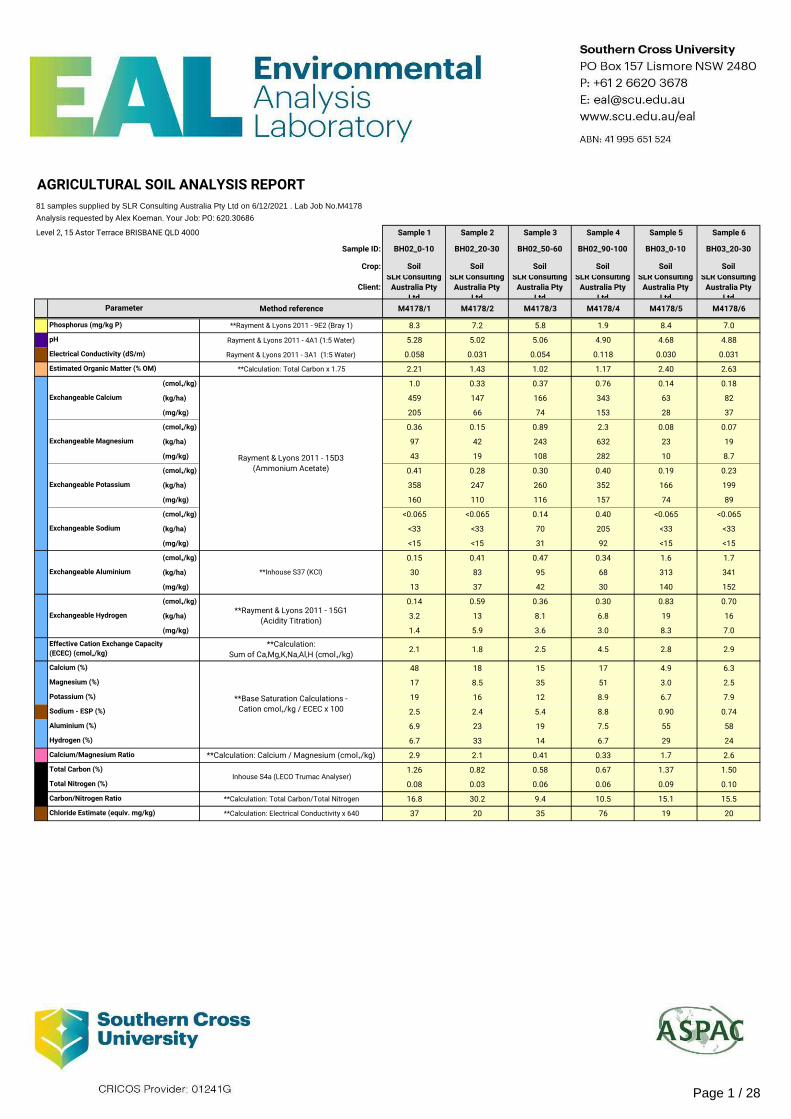
AGRICULTURAL SOIL ANALYSIS REPORT
81 samples supplied by SLR Consulting Australia Pty Ltd on 6/12/2021 . Lab Job No.M4178
Analysis requested by Alex Koeman. Your Job: PO: 620.30686
Level 2, 15 Astor Terrace BRISBANE QLD 4000 Sample 1 Sample 2 Sample 3 Sample 4 Sample 5 Sample 6
Sample ID: BH02_0-10 BH02_20-30 BH02_50-60 BH02_90-100 BH03_0-10 BH03_20-30
Crop: Soil Soil Soil Soil Soil Soil
Client:
SLR Consulting
Australia Pty
Ltd
SLR Consulting
Australia Pty
Ltd
SLR Consulting
Australia Pty
Ltd
SLR Consulting
Australia Pty
Ltd
SLR Consulting
Australia Pty
Ltd
SLR Consulting
Australia Pty
Ltd
Method reference M4178/1 M4178/2 M4178/3 M4178/4 M4178/5 M4178/6
**Rayment & Lyons 2011 - 9E2 (Bray 1) 8.3 7.2 5.8 1.9 8.4 7.0
Rayment & Lyons 2011 - 4A1 (1:5 Water) 5.28 5.02 5.06 4.90 4.68 4.88
Rayment & Lyons 2011 - 3A1 (1:5 Water) 0.058 0.031 0.054 0.118 0.030 0.031
**Calculation: Total Carbon x 1.75 2.21 1.43 1.02 1.17 2.40 2.63
(cmol+/kg) 1.0 0.33 0.37 0.76 0.14 0.18
(kg/ha) 459 147 166 343 63 82
(mg/kg) 205 66 74 153 28 37
(cmol+/kg) 0.36 0.15 0.89 2.3 0.08 0.07
(kg/ha) 97 42 243 632 23 19
(mg/kg) 43 19 108 282 10 8.7
(cmol+/kg) 0.41 0.28 0.30 0.40 0.19 0.23
(kg/ha) 358 247 260 352 166 199
(mg/kg) 160 110 116 157 74 89
(cmol+/kg) <0.065 <0.065 0.14 0.40 <0.065 <0.065
(kg/ha) <33 <33 70 205 <33 <33
(mg/kg) <15 <15 31 92 <15 <15
(cmol+/kg) 0.15 0.41 0.47 0.34 1.6 1.7
(kg/ha) 30 83 95 68 313 341
(mg/kg) 13 37 42 30 140 152
(cmol+/kg) 0.14 0.59 0.36 0.30 0.83 0.70
(kg/ha) 3.2 13 8.1 6.8 19 16
(mg/kg) 1.4 5.9 3.6 3.0 8.3 7.0
**Calculation:
Sum of Ca,Mg,K,Na,Al,H (cmol+/kg)2.1 1.8 2.5 4.5 2.8 2.9
48 18 15 17 4.9 6.3
17 8.5 35 51 3.0 2.5
19 16 12 8.9 6.7 7.9
2.5 2.4 5.4 8.8 0.90 0.74
6.9 23 19 7.5 55 58
6.7 33 14 6.7 29 24
**Calculation: Calcium / Magnesium (cmol+/kg) 2.9 2.1 0.41 0.33 1.7 2.6
1.26 0.82 0.58 0.67 1.37 1.50
0.08 0.03 0.06 0.06 0.09 0.10
**Calculation: Total Carbon/Total Nitrogen 16.8 30.2 9.4 10.5 15.1 15.5
**Calculation: Electrical Conductivity x 640 37 20 35 76 19 20
Parameter
Electrical Conductivity (dS/m)
Estimated Organic Matter (% OM)
Rayment & Lyons 2011 - 15D3
(Ammonium Acetate)
**Inhouse S37 (KCl)
Phosphorus (mg/kg P)
pH
Exchangeable Calcium
Exchangeable Magnesium
Exchangeable Potassium
Exchangeable Sodium
Exchangeable Aluminium
Potassium (%)
Sodium - ESP (%)
Aluminium (%)
Hydrogen (%)
Chloride Estimate (equiv. mg/kg)
**Rayment & Lyons 2011 - 15G1
(Acidity Titration)
Effective Cation Exchange Capacity
(ECEC) (cmol+/kg)
Calcium (%)
Magnesium (%)
Exchangeable Hydrogen
Total Carbon (%)
Total Nitrogen (%)
Carbon/Nitrogen Ratio
Calcium/Magnesium Ratio
Inhouse S4a (LECO Trumac Analyser)
**Base Saturation Calculations -
Cation cmol+/kg / ECEC x 100
Page 1 / 28

AGRICULTURAL SOIL ANALYSIS REPORT
81 samples supplied by SLR Consulting Australia Pty Ltd on 6/12/2021 . Lab Job No.M4178
Analysis requested by Alex Koeman. Your Job: PO: 620.30686
Level 2, 15 Astor Terrace BRISBANE QLD 4000 Sample 1 Sample 2 Sample 3 Sample 4 Sample 5 Sample 6
Sample ID: BH02_0-10 BH02_20-30 BH02_50-60 BH02_90-100 BH03_0-10 BH03_20-30
Crop: Soil Soil Soil Soil Soil Soil
Client:
SLR Consulting
Australia Pty
Ltd
SLR Consulting
Australia Pty
Ltd
SLR Consulting
Australia Pty
Ltd
SLR Consulting
Australia Pty
Ltd
SLR Consulting
Australia Pty
Ltd
SLR Consulting
Australia Pty
Ltd
Method reference M4178/1 M4178/2 M4178/3 M4178/4 M4178/5 M4178/6Parameter
Phosphorus (mg/kg P)Notes: 1. All results presented as a 40°C oven dried weight. Soil sieved and lightly crushed to < 2 mm.
2. Methods from Rayment and Lyons, 2011. Soil Chemical Methods - Australasia. CSIRO Publishing: Collingwood.
3. Soluble Salts included in Exchangeable Cations - NO PRE-WASH (unless requested).
4. 'Morgan 1 Extract' adapted from 'Science in Agriculture', 'Non-Toxic Farming' and LaMotte Soil Handbook.
5. Guidelines for phosphorus have been reduced for Australian soils.
6. Indicative guidelines are based on 'Albrecht' and 'Reams' concepts.
7. Total Acid Extractable Nutrients indicate a store of nutrients.
8. National Environmental Protection (Assessment of Site Contamination) Measure 2013,
Schedule B(1) - Guideline on Investigation Levels for Soil and Groundwater. Table 5-A Background Ranges.
9. Information relating to testing colour codes is available on sheet 2 - 'Understanding your agricultural soil results'.
10. Conversions for 1 cmol+/kg = 230 mg/kg Sodium, 390 mg/kg Potassium,
122 mg/kg Magnesium, 200 mg/kg Calcium
11. Conversions to kg/ha = mg/kg x 2.24
12. The chloride calculation of Cl mg/L = EC x 640 is considered an estimate, and most likely an over-estimate
13. ** NATA accreditation does not cover the performance of this service.
14. Analysis conducted between sample arrival date and reporting date.
15. This report is not to be reproduced except in full. Results only relate to the item tested.
16. All services undertaken by EAL are covered by the EAL Laboratory Services Terms and Conditions (refer SCU.edu.au/eal/t&cs).
17. This report was issued on 14/12/2021.
Quality Checked: Kris SavilleAgricultural Co-Ordinator
Page 2 / 28

AGRICULTURAL SOIL ANALYSIS REPORT
81 samples supplied by SLR Consulting Australia Pty Ltd on 6/12/2021 . Lab Job No.M4178
Analysis requested by Alex Koeman. Your Job: PO: 620.30686
Level 2, 15 Astor Terrace BRISBANE QLD 4000
Sample ID:
Crop:
Client:
Method reference
**Rayment & Lyons 2011 - 9E2 (Bray 1)
Rayment & Lyons 2011 - 4A1 (1:5 Water)
Rayment & Lyons 2011 - 3A1 (1:5 Water)
**Calculation: Total Carbon x 1.75
(cmol+/kg)
(kg/ha)
(mg/kg)
(cmol+/kg)
(kg/ha)
(mg/kg)
(cmol+/kg)
(kg/ha)
(mg/kg)
(cmol+/kg)
(kg/ha)
(mg/kg)
(cmol+/kg)
(kg/ha)
(mg/kg)
(cmol+/kg)
(kg/ha)
(mg/kg)
**Calculation:
Sum of Ca,Mg,K,Na,Al,H (cmol+/kg)
**Calculation: Calcium / Magnesium (cmol+/kg)
**Calculation: Total Carbon/Total Nitrogen
**Calculation: Electrical Conductivity x 640
Parameter
Electrical Conductivity (dS/m)
Estimated Organic Matter (% OM)
Rayment & Lyons 2011 - 15D3
(Ammonium Acetate)
**Inhouse S37 (KCl)
Phosphorus (mg/kg P)
pH
Exchangeable Calcium
Exchangeable Magnesium
Exchangeable Potassium
Exchangeable Sodium
Exchangeable Aluminium
Potassium (%)
Sodium - ESP (%)
Aluminium (%)
Hydrogen (%)
Chloride Estimate (equiv. mg/kg)
**Rayment & Lyons 2011 - 15G1
(Acidity Titration)
Effective Cation Exchange Capacity
(ECEC) (cmol+/kg)
Calcium (%)
Magnesium (%)
Exchangeable Hydrogen
Total Carbon (%)
Total Nitrogen (%)
Carbon/Nitrogen Ratio
Calcium/Magnesium Ratio
Inhouse S4a (LECO Trumac Analyser)
**Base Saturation Calculations -
Cation cmol+/kg / ECEC x 100
Sample 7 Sample 8 Sample 9 Sample 10 Sample 11 Sample 12
BH03_30-40 BH04_0-10 BH04_15-25 BH05_0-10 BH05_20-30 BH05_50-60
Soil Soil Soil Soil Soil Soil
SLR Consulting
Australia Pty
Ltd
SLR Consulting
Australia Pty
Ltd
SLR Consulting
Australia Pty
Ltd
SLR Consulting
Australia Pty
Ltd
SLR Consulting
Australia Pty
Ltd
SLR Consulting
Australia Pty
Ltd
M4178/7 M4178/8 M4178/9 M4178/10 M4178/11 M4178/12
4.9 14 11 5.3 7.8 3.5
4.58 5.26 5.03 5.31 4.93 4.81
0.028 0.031 0.030 1.618 0.497 0.577
2.28 3.54 4.31 2.17 2.12 0.90
0.19 0.71 0.67 1.5 0.59 0.17
87 320 302 662 267 78
39 143 135 295 119 35
0.09 0.18 0.17 12 7.7 8.3
24 49 47 3,261 2,095 2,264
11 22 21 1,456 935 1,011
0.19 0.22 0.22 0.25 0.24 0.33
169 191 190 222 209 286
75 85 85 99 93 127
<0.065 <0.065 <0.065 5.2 3.3 3.9
<33 <33 <33 2,700 1,676 2,032
<15 <15 <15 1,205 748 907
1.9 0.87 1.4 0.08 0.67 0.74
386 176 280 17 135 149
172 79 125 7.5 60 67
0.91 0.52 0.73 0.08 0.56 0.66
20 12 16 1.8 13 15
9.1 5.2 7.3 <1 5.6 6.6
3.3 2.5 3.2 19 13 14
5.8 28 21 7.7 4.6 1.2
2.6 7.2 5.4 63 59 59
5.8 8.6 6.8 1.3 1.8 2.3
1.1 0.82 0.70 27 25 28
57 35 43 0.44 5.1 5.2
27 21 23 0.42 4.3 4.7
2.2 3.9 3.9 0.12 0.08 0.02
1.30 2.02 2.46 1.24 1.21 0.52
0.12 0.10 0.12 0.12 0.09 0.06
11.1 19.4 21.2 10.0 13.0 9.4
18 20 19 1,036 318 369
Page 3 / 28
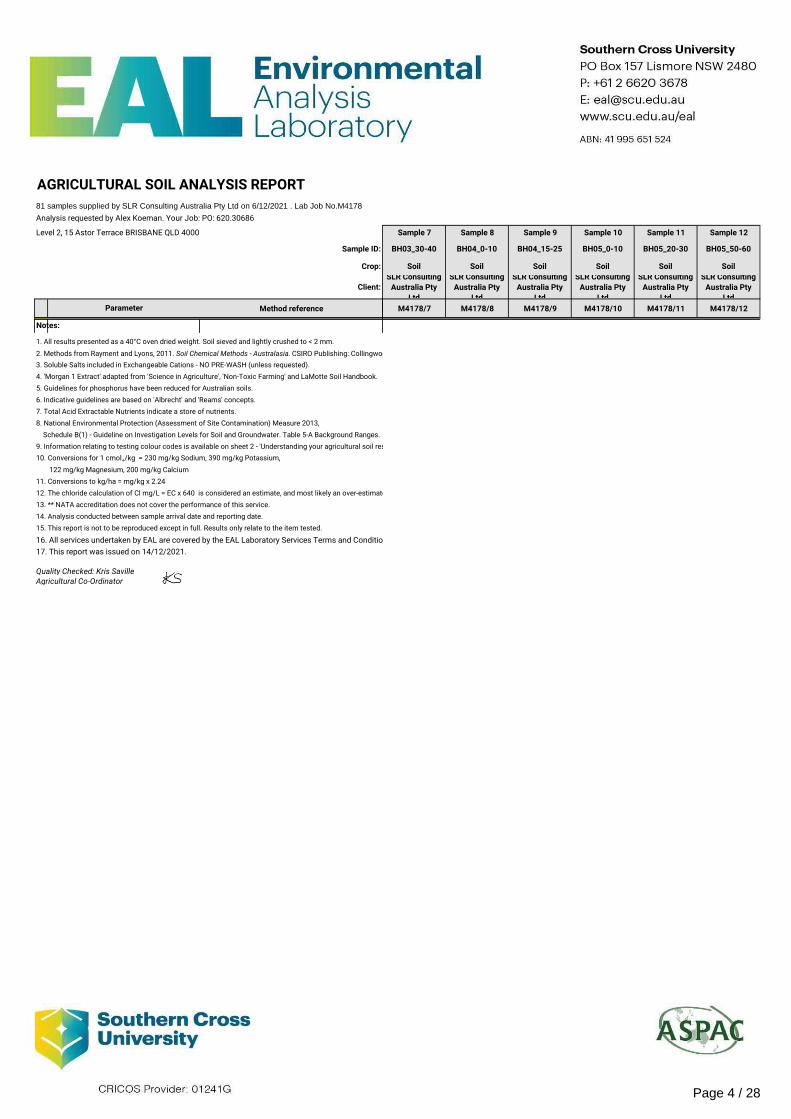
AGRICULTURAL SOIL ANALYSIS REPORT
81 samples supplied by SLR Consulting Australia Pty Ltd on 6/12/2021 . Lab Job No.M4178
Analysis requested by Alex Koeman. Your Job: PO: 620.30686
Level 2, 15 Astor Terrace BRISBANE QLD 4000
Sample ID:
Crop:
Client:
Method reference
**Rayment & Lyons 2011 - 9E2 (Bray 1)
Parameter
Phosphorus (mg/kg P)Notes: 1. All results presented as a 40°C oven dried weight. Soil sieved and lightly crushed to < 2 mm.
2. Methods from Rayment and Lyons, 2011. Soil Chemical Methods - Australasia. CSIRO Publishing: Collingwood.
3. Soluble Salts included in Exchangeable Cations - NO PRE-WASH (unless requested).
4. 'Morgan 1 Extract' adapted from 'Science in Agriculture', 'Non-Toxic Farming' and LaMotte Soil Handbook.
5. Guidelines for phosphorus have been reduced for Australian soils.
6. Indicative guidelines are based on 'Albrecht' and 'Reams' concepts.
7. Total Acid Extractable Nutrients indicate a store of nutrients.
8. National Environmental Protection (Assessment of Site Contamination) Measure 2013,
Schedule B(1) - Guideline on Investigation Levels for Soil and Groundwater. Table 5-A Background Ranges.
9. Information relating to testing colour codes is available on sheet 2 - 'Understanding your agricultural soil results'.
10. Conversions for 1 cmol+/kg = 230 mg/kg Sodium, 390 mg/kg Potassium,
122 mg/kg Magnesium, 200 mg/kg Calcium
11. Conversions to kg/ha = mg/kg x 2.24
12. The chloride calculation of Cl mg/L = EC x 640 is considered an estimate, and most likely an over-estimate
13. ** NATA accreditation does not cover the performance of this service.
14. Analysis conducted between sample arrival date and reporting date.
15. This report is not to be reproduced except in full. Results only relate to the item tested.
16. All services undertaken by EAL are covered by the EAL Laboratory Services Terms and Conditions (refer SCU.edu.au/eal/t&cs).
17. This report was issued on 14/12/2021.
Quality Checked: Kris SavilleAgricultural Co-Ordinator
Sample 7 Sample 8 Sample 9 Sample 10 Sample 11 Sample 12
BH03_30-40 BH04_0-10 BH04_15-25 BH05_0-10 BH05_20-30 BH05_50-60
Soil Soil Soil Soil Soil Soil
SLR Consulting
Australia Pty
Ltd
SLR Consulting
Australia Pty
Ltd
SLR Consulting
Australia Pty
Ltd
SLR Consulting
Australia Pty
Ltd
SLR Consulting
Australia Pty
Ltd
SLR Consulting
Australia Pty
Ltd
M4178/7 M4178/8 M4178/9 M4178/10 M4178/11 M4178/12
Page 4 / 28

AGRICULTURAL SOIL ANALYSIS REPORT
81 samples supplied by SLR Consulting Australia Pty Ltd on 6/12/2021 . Lab Job No.M4178
Analysis requested by Alex Koeman. Your Job: PO: 620.30686
Level 2, 15 Astor Terrace BRISBANE QLD 4000
Sample ID:
Crop:
Client:
Method reference
**Rayment & Lyons 2011 - 9E2 (Bray 1)
Rayment & Lyons 2011 - 4A1 (1:5 Water)
Rayment & Lyons 2011 - 3A1 (1:5 Water)
**Calculation: Total Carbon x 1.75
(cmol+/kg)
(kg/ha)
(mg/kg)
(cmol+/kg)
(kg/ha)
(mg/kg)
(cmol+/kg)
(kg/ha)
(mg/kg)
(cmol+/kg)
(kg/ha)
(mg/kg)
(cmol+/kg)
(kg/ha)
(mg/kg)
(cmol+/kg)
(kg/ha)
(mg/kg)
**Calculation:
Sum of Ca,Mg,K,Na,Al,H (cmol+/kg)
**Calculation: Calcium / Magnesium (cmol+/kg)
**Calculation: Total Carbon/Total Nitrogen
**Calculation: Electrical Conductivity x 640
Parameter
Electrical Conductivity (dS/m)
Estimated Organic Matter (% OM)
Rayment & Lyons 2011 - 15D3
(Ammonium Acetate)
**Inhouse S37 (KCl)
Phosphorus (mg/kg P)
pH
Exchangeable Calcium
Exchangeable Magnesium
Exchangeable Potassium
Exchangeable Sodium
Exchangeable Aluminium
Potassium (%)
Sodium - ESP (%)
Aluminium (%)
Hydrogen (%)
Chloride Estimate (equiv. mg/kg)
**Rayment & Lyons 2011 - 15G1
(Acidity Titration)
Effective Cation Exchange Capacity
(ECEC) (cmol+/kg)
Calcium (%)
Magnesium (%)
Exchangeable Hydrogen
Total Carbon (%)
Total Nitrogen (%)
Carbon/Nitrogen Ratio
Calcium/Magnesium Ratio
Inhouse S4a (LECO Trumac Analyser)
**Base Saturation Calculations -
Cation cmol+/kg / ECEC x 100
Sample 13 Sample 14 Sample 15 Sample 16 Sample 17 Sample 18
BH05_90-100 BH08_0-10 BH08_20-30 BH08_50-60 BH08_90-100 BH09_0-10
Soil Soil Soil Soil Soil Soil
SLR Consulting
Australia Pty
Ltd
SLR Consulting
Australia Pty
Ltd
SLR Consulting
Australia Pty
Ltd
SLR Consulting
Australia Pty
Ltd
SLR Consulting
Australia Pty
Ltd
SLR Consulting
Australia Pty
Ltd
M4178/13 M4178/14 M4178/15 M4178/16 M4178/17 M4178/18
2.9 5.4 2.9 2.4 2.5 1.5
4.95 8.95 8.94 8.82 9.01 9.45
0.679 0.470 0.997 1.246 0.726 0.218
0.56 2.22 1.73 0.87 1.04 1.50
0.05 22 22 12 15 23
23 9,867 9,862 5,506 6,597 10,150
10 4,405 4,403 2,458 2,945 4,531
8.7 11 12 14 13 12
2,364 2,868 3,228 3,811 3,470 3,204
1,056 1,280 1,441 1,701 1,549 1,430
0.39 0.53 0.43 0.39 0.41 0.44
341 467 373 343 355 384
152 209 167 153 158 171
5.0 3.4 5.8 8.5 5.6 2.4
2,599 1,745 2,968 4,393 2,865 1,244
1,160 779 1,325 1,961 1,279 555
0.49 0.02 <0.01 <0.01 <0.01 <0.01
99 3.9 1.1 <1 <1 <1
44 1.7 <1 <1 <1 <1
0.74 <0.01 <0.01 <0.01 <0.01 <0.01
17 <1 <1 <1 <1 <1
7.4 <1 <1 <1 <1 <1
15 36 40 35 33 37
0.33 60 55 35 44 61
56 29 30 40 38 32
2.5 1.5 1.1 1.1 1.2 1.2
33 9.3 14 24 17 6.5
3.2 0.05 0.01 0.01 0.01 0.00
4.8 0.00 0.00 0.00 0.00 0.00
0.01 2.1 1.9 0.88 1.2 1.9
0.32 1.27 0.99 0.50 0.59 0.86
0.06 0.10 0.07 0.08 0.08 0.06
5.6 12.2 13.7 6.7 7.3 15.5
435 301 638 797 465 140
Page 5 / 28

AGRICULTURAL SOIL ANALYSIS REPORT
81 samples supplied by SLR Consulting Australia Pty Ltd on 6/12/2021 . Lab Job No.M4178
Analysis requested by Alex Koeman. Your Job: PO: 620.30686
Level 2, 15 Astor Terrace BRISBANE QLD 4000
Sample ID:
Crop:
Client:
Method reference
**Rayment & Lyons 2011 - 9E2 (Bray 1)
Parameter
Phosphorus (mg/kg P)Notes: 1. All results presented as a 40°C oven dried weight. Soil sieved and lightly crushed to < 2 mm.
2. Methods from Rayment and Lyons, 2011. Soil Chemical Methods - Australasia. CSIRO Publishing: Collingwood.
3. Soluble Salts included in Exchangeable Cations - NO PRE-WASH (unless requested).
4. 'Morgan 1 Extract' adapted from 'Science in Agriculture', 'Non-Toxic Farming' and LaMotte Soil Handbook.
5. Guidelines for phosphorus have been reduced for Australian soils.
6. Indicative guidelines are based on 'Albrecht' and 'Reams' concepts.
7. Total Acid Extractable Nutrients indicate a store of nutrients.
8. National Environmental Protection (Assessment of Site Contamination) Measure 2013,
Schedule B(1) - Guideline on Investigation Levels for Soil and Groundwater. Table 5-A Background Ranges.
9. Information relating to testing colour codes is available on sheet 2 - 'Understanding your agricultural soil results'.
10. Conversions for 1 cmol+/kg = 230 mg/kg Sodium, 390 mg/kg Potassium,
122 mg/kg Magnesium, 200 mg/kg Calcium
11. Conversions to kg/ha = mg/kg x 2.24
12. The chloride calculation of Cl mg/L = EC x 640 is considered an estimate, and most likely an over-estimate
13. ** NATA accreditation does not cover the performance of this service.
14. Analysis conducted between sample arrival date and reporting date.
15. This report is not to be reproduced except in full. Results only relate to the item tested.
16. All services undertaken by EAL are covered by the EAL Laboratory Services Terms and Conditions (refer SCU.edu.au/eal/t&cs).
17. This report was issued on 14/12/2021.
Quality Checked: Kris SavilleAgricultural Co-Ordinator
Sample 13 Sample 14 Sample 15 Sample 16 Sample 17 Sample 18
BH05_90-100 BH08_0-10 BH08_20-30 BH08_50-60 BH08_90-100 BH09_0-10
Soil Soil Soil Soil Soil Soil
SLR Consulting
Australia Pty
Ltd
SLR Consulting
Australia Pty
Ltd
SLR Consulting
Australia Pty
Ltd
SLR Consulting
Australia Pty
Ltd
SLR Consulting
Australia Pty
Ltd
SLR Consulting
Australia Pty
Ltd
M4178/13 M4178/14 M4178/15 M4178/16 M4178/17 M4178/18
Page 6 / 28
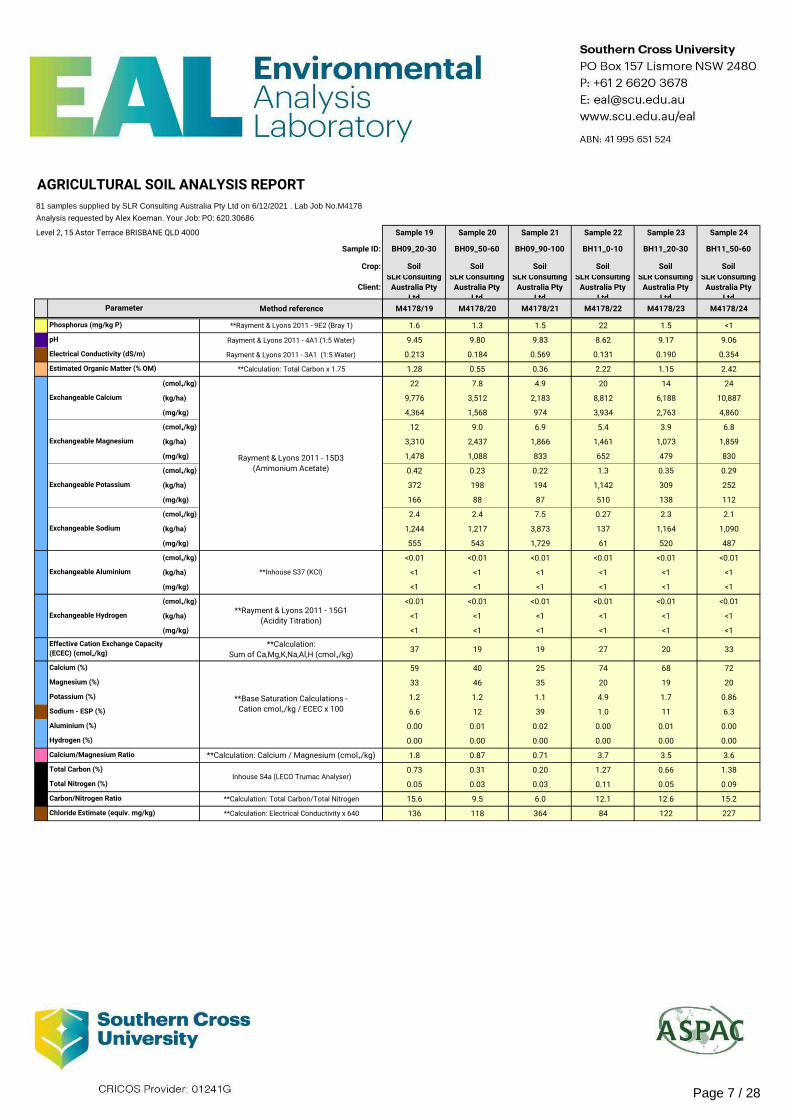
AGRICULTURAL SOIL ANALYSIS REPORT
81 samples supplied by SLR Consulting Australia Pty Ltd on 6/12/2021 . Lab Job No.M4178
Analysis requested by Alex Koeman. Your Job: PO: 620.30686
Level 2, 15 Astor Terrace BRISBANE QLD 4000
Sample ID:
Crop:
Client:
Method reference
**Rayment & Lyons 2011 - 9E2 (Bray 1)
Rayment & Lyons 2011 - 4A1 (1:5 Water)
Rayment & Lyons 2011 - 3A1 (1:5 Water)
**Calculation: Total Carbon x 1.75
(cmol+/kg)
(kg/ha)
(mg/kg)
(cmol+/kg)
(kg/ha)
(mg/kg)
(cmol+/kg)
(kg/ha)
(mg/kg)
(cmol+/kg)
(kg/ha)
(mg/kg)
(cmol+/kg)
(kg/ha)
(mg/kg)
(cmol+/kg)
(kg/ha)
(mg/kg)
**Calculation:
Sum of Ca,Mg,K,Na,Al,H (cmol+/kg)
**Calculation: Calcium / Magnesium (cmol+/kg)
**Calculation: Total Carbon/Total Nitrogen
**Calculation: Electrical Conductivity x 640
Parameter
Electrical Conductivity (dS/m)
Estimated Organic Matter (% OM)
Rayment & Lyons 2011 - 15D3
(Ammonium Acetate)
**Inhouse S37 (KCl)
Phosphorus (mg/kg P)
pH
Exchangeable Calcium
Exchangeable Magnesium
Exchangeable Potassium
Exchangeable Sodium
Exchangeable Aluminium
Potassium (%)
Sodium - ESP (%)
Aluminium (%)
Hydrogen (%)
Chloride Estimate (equiv. mg/kg)
**Rayment & Lyons 2011 - 15G1
(Acidity Titration)
Effective Cation Exchange Capacity
(ECEC) (cmol+/kg)
Calcium (%)
Magnesium (%)
Exchangeable Hydrogen
Total Carbon (%)
Total Nitrogen (%)
Carbon/Nitrogen Ratio
Calcium/Magnesium Ratio
Inhouse S4a (LECO Trumac Analyser)
**Base Saturation Calculations -
Cation cmol+/kg / ECEC x 100
Sample 19 Sample 20 Sample 21 Sample 22 Sample 23 Sample 24
BH09_20-30 BH09_50-60 BH09_90-100 BH11_0-10 BH11_20-30 BH11_50-60
Soil Soil Soil Soil Soil Soil
SLR Consulting
Australia Pty
Ltd
SLR Consulting
Australia Pty
Ltd
SLR Consulting
Australia Pty
Ltd
SLR Consulting
Australia Pty
Ltd
SLR Consulting
Australia Pty
Ltd
SLR Consulting
Australia Pty
Ltd
M4178/19 M4178/20 M4178/21 M4178/22 M4178/23 M4178/24
1.6 1.3 1.5 22 1.5 <1
9.45 9.80 9.83 8.62 9.17 9.06
0.213 0.184 0.569 0.131 0.190 0.354
1.28 0.55 0.36 2.22 1.15 2.42
22 7.8 4.9 20 14 24
9,776 3,512 2,183 8,812 6,188 10,887
4,364 1,568 974 3,934 2,763 4,860
12 9.0 6.9 5.4 3.9 6.8
3,310 2,437 1,866 1,461 1,073 1,859
1,478 1,088 833 652 479 830
0.42 0.23 0.22 1.3 0.35 0.29
372 198 194 1,142 309 252
166 88 87 510 138 112
2.4 2.4 7.5 0.27 2.3 2.1
1,244 1,217 3,873 137 1,164 1,090
555 543 1,729 61 520 487
<0.01 <0.01 <0.01 <0.01 <0.01 <0.01
<1 <1 <1 <1 <1 <1
<1 <1 <1 <1 <1 <1
<0.01 <0.01 <0.01 <0.01 <0.01 <0.01
<1 <1 <1 <1 <1 <1
<1 <1 <1 <1 <1 <1
37 19 19 27 20 33
59 40 25 74 68 72
33 46 35 20 19 20
1.2 1.2 1.1 4.9 1.7 0.86
6.6 12 39 1.0 11 6.3
0.00 0.01 0.02 0.00 0.01 0.00
0.00 0.00 0.00 0.00 0.00 0.00
1.8 0.87 0.71 3.7 3.5 3.6
0.73 0.31 0.20 1.27 0.66 1.38
0.05 0.03 0.03 0.11 0.05 0.09
15.6 9.5 6.0 12.1 12.6 15.2
136 118 364 84 122 227
Page 7 / 28

AGRICULTURAL SOIL ANALYSIS REPORT
81 samples supplied by SLR Consulting Australia Pty Ltd on 6/12/2021 . Lab Job No.M4178
Analysis requested by Alex Koeman. Your Job: PO: 620.30686
Level 2, 15 Astor Terrace BRISBANE QLD 4000
Sample ID:
Crop:
Client:
Method reference
**Rayment & Lyons 2011 - 9E2 (Bray 1)
Parameter
Phosphorus (mg/kg P)Notes: 1. All results presented as a 40°C oven dried weight. Soil sieved and lightly crushed to < 2 mm.
2. Methods from Rayment and Lyons, 2011. Soil Chemical Methods - Australasia. CSIRO Publishing: Collingwood.
3. Soluble Salts included in Exchangeable Cations - NO PRE-WASH (unless requested).
4. 'Morgan 1 Extract' adapted from 'Science in Agriculture', 'Non-Toxic Farming' and LaMotte Soil Handbook.
5. Guidelines for phosphorus have been reduced for Australian soils.
6. Indicative guidelines are based on 'Albrecht' and 'Reams' concepts.
7. Total Acid Extractable Nutrients indicate a store of nutrients.
8. National Environmental Protection (Assessment of Site Contamination) Measure 2013,
Schedule B(1) - Guideline on Investigation Levels for Soil and Groundwater. Table 5-A Background Ranges.
9. Information relating to testing colour codes is available on sheet 2 - 'Understanding your agricultural soil results'.
10. Conversions for 1 cmol+/kg = 230 mg/kg Sodium, 390 mg/kg Potassium,
122 mg/kg Magnesium, 200 mg/kg Calcium
11. Conversions to kg/ha = mg/kg x 2.24
12. The chloride calculation of Cl mg/L = EC x 640 is considered an estimate, and most likely an over-estimate
13. ** NATA accreditation does not cover the performance of this service.
14. Analysis conducted between sample arrival date and reporting date.
15. This report is not to be reproduced except in full. Results only relate to the item tested.
16. All services undertaken by EAL are covered by the EAL Laboratory Services Terms and Conditions (refer SCU.edu.au/eal/t&cs).
17. This report was issued on 14/12/2021.
Quality Checked: Kris SavilleAgricultural Co-Ordinator
Sample 19 Sample 20 Sample 21 Sample 22 Sample 23 Sample 24
BH09_20-30 BH09_50-60 BH09_90-100 BH11_0-10 BH11_20-30 BH11_50-60
Soil Soil Soil Soil Soil Soil
SLR Consulting
Australia Pty
Ltd
SLR Consulting
Australia Pty
Ltd
SLR Consulting
Australia Pty
Ltd
SLR Consulting
Australia Pty
Ltd
SLR Consulting
Australia Pty
Ltd
SLR Consulting
Australia Pty
Ltd
M4178/19 M4178/20 M4178/21 M4178/22 M4178/23 M4178/24
Page 8 / 28

AGRICULTURAL SOIL ANALYSIS REPORT
81 samples supplied by SLR Consulting Australia Pty Ltd on 6/12/2021 . Lab Job No.M4178
Analysis requested by Alex Koeman. Your Job: PO: 620.30686
Level 2, 15 Astor Terrace BRISBANE QLD 4000
Sample ID:
Crop:
Client:
Method reference
**Rayment & Lyons 2011 - 9E2 (Bray 1)
Rayment & Lyons 2011 - 4A1 (1:5 Water)
Rayment & Lyons 2011 - 3A1 (1:5 Water)
**Calculation: Total Carbon x 1.75
(cmol+/kg)
(kg/ha)
(mg/kg)
(cmol+/kg)
(kg/ha)
(mg/kg)
(cmol+/kg)
(kg/ha)
(mg/kg)
(cmol+/kg)
(kg/ha)
(mg/kg)
(cmol+/kg)
(kg/ha)
(mg/kg)
(cmol+/kg)
(kg/ha)
(mg/kg)
**Calculation:
Sum of Ca,Mg,K,Na,Al,H (cmol+/kg)
**Calculation: Calcium / Magnesium (cmol+/kg)
**Calculation: Total Carbon/Total Nitrogen
**Calculation: Electrical Conductivity x 640
Parameter
Electrical Conductivity (dS/m)
Estimated Organic Matter (% OM)
Rayment & Lyons 2011 - 15D3
(Ammonium Acetate)
**Inhouse S37 (KCl)
Phosphorus (mg/kg P)
pH
Exchangeable Calcium
Exchangeable Magnesium
Exchangeable Potassium
Exchangeable Sodium
Exchangeable Aluminium
Potassium (%)
Sodium - ESP (%)
Aluminium (%)
Hydrogen (%)
Chloride Estimate (equiv. mg/kg)
**Rayment & Lyons 2011 - 15G1
(Acidity Titration)
Effective Cation Exchange Capacity
(ECEC) (cmol+/kg)
Calcium (%)
Magnesium (%)
Exchangeable Hydrogen
Total Carbon (%)
Total Nitrogen (%)
Carbon/Nitrogen Ratio
Calcium/Magnesium Ratio
Inhouse S4a (LECO Trumac Analyser)
**Base Saturation Calculations -
Cation cmol+/kg / ECEC x 100
Sample 25 Sample 26 Sample 27 Sample 28 Sample 29 Sample 30
BH11_90-100 BH12_0-10 BH12_20-30 BH12_50-60 BH12_90-100 BH13_0-10
Soil Soil Soil Soil Soil Soil
SLR Consulting
Australia Pty
Ltd
SLR Consulting
Australia Pty
Ltd
SLR Consulting
Australia Pty
Ltd
SLR Consulting
Australia Pty
Ltd
SLR Consulting
Australia Pty
Ltd
SLR Consulting
Australia Pty
Ltd
M4178/25 M4178/26 M4178/27 M4178/28 M4178/29 M4178/30
1.4 4.7 1.4 1.2 1.2 3.0
9.04 7.66 7.41 7.45 7.89 7.58
0.796 0.060 0.019 0.028 0.030 0.020
2.21 1.32 0.76 0.43 0.41 0.74
21 3.7 2.6 3.3 4.5 2.8
9,293 1,657 1,158 1,490 1,998 1,242
4,149 740 517 665 892 554
10 0.88 0.46 0.46 0.93 0.21
2,816 239 126 126 254 56
1,257 107 56 56 113 25
0.25 0.51 0.23 0.32 0.16 0.19
221 445 203 276 138 165
98 199 91 123 61 74
4.4 <0.065 <0.065 <0.065 0.07 <0.065
2,263 <33 <33 <33 <33 <33
1,010 <15 <15 <15 <15 <15
<0.01 <0.01 <0.01 <0.01 <0.01 <0.01
<1 <1 <1 <1 <1 <1
<1 <1 <1 <1 <1 <1
<0.01 <0.01 <0.01 <0.01 <0.01 <0.01
<1 <1 <1 <1 <1 <1
<1 <1 <1 <1 <1 <1
36 5.1 3.3 4.1 5.6 3.2
58 72 78 80 79 87
29 17 14 11 17 6.4
0.71 9.9 7.0 7.6 2.8 5.9
12 1.0 0.77 0.85 1.2 0.65
0.00 0.05 0.08 0.08 0.07 0.13
0.00 0.00 0.00 0.00 0.00 0.00
2.0 4.2 5.6 7.2 4.8 13
1.26 0.76 0.43 0.25 0.24 0.43
0.04 0.08 0.04 0.04 0.03 0.03
30.0 10.0 11.7 6.9 9.0 12.9
509 38 12 18 19 13
Page 9 / 28

AGRICULTURAL SOIL ANALYSIS REPORT
81 samples supplied by SLR Consulting Australia Pty Ltd on 6/12/2021 . Lab Job No.M4178
Analysis requested by Alex Koeman. Your Job: PO: 620.30686
Level 2, 15 Astor Terrace BRISBANE QLD 4000
Sample ID:
Crop:
Client:
Method reference
**Rayment & Lyons 2011 - 9E2 (Bray 1)
Parameter
Phosphorus (mg/kg P)Notes: 1. All results presented as a 40°C oven dried weight. Soil sieved and lightly crushed to < 2 mm.
2. Methods from Rayment and Lyons, 2011. Soil Chemical Methods - Australasia. CSIRO Publishing: Collingwood.
3. Soluble Salts included in Exchangeable Cations - NO PRE-WASH (unless requested).
4. 'Morgan 1 Extract' adapted from 'Science in Agriculture', 'Non-Toxic Farming' and LaMotte Soil Handbook.
5. Guidelines for phosphorus have been reduced for Australian soils.
6. Indicative guidelines are based on 'Albrecht' and 'Reams' concepts.
7. Total Acid Extractable Nutrients indicate a store of nutrients.
8. National Environmental Protection (Assessment of Site Contamination) Measure 2013,
Schedule B(1) - Guideline on Investigation Levels for Soil and Groundwater. Table 5-A Background Ranges.
9. Information relating to testing colour codes is available on sheet 2 - 'Understanding your agricultural soil results'.
10. Conversions for 1 cmol+/kg = 230 mg/kg Sodium, 390 mg/kg Potassium,
122 mg/kg Magnesium, 200 mg/kg Calcium
11. Conversions to kg/ha = mg/kg x 2.24
12. The chloride calculation of Cl mg/L = EC x 640 is considered an estimate, and most likely an over-estimate
13. ** NATA accreditation does not cover the performance of this service.
14. Analysis conducted between sample arrival date and reporting date.
15. This report is not to be reproduced except in full. Results only relate to the item tested.
16. All services undertaken by EAL are covered by the EAL Laboratory Services Terms and Conditions (refer SCU.edu.au/eal/t&cs).
17. This report was issued on 14/12/2021.
Quality Checked: Kris SavilleAgricultural Co-Ordinator
Sample 25 Sample 26 Sample 27 Sample 28 Sample 29 Sample 30
BH11_90-100 BH12_0-10 BH12_20-30 BH12_50-60 BH12_90-100 BH13_0-10
Soil Soil Soil Soil Soil Soil
SLR Consulting
Australia Pty
Ltd
SLR Consulting
Australia Pty
Ltd
SLR Consulting
Australia Pty
Ltd
SLR Consulting
Australia Pty
Ltd
SLR Consulting
Australia Pty
Ltd
SLR Consulting
Australia Pty
Ltd
M4178/25 M4178/26 M4178/27 M4178/28 M4178/29 M4178/30
Page 10 / 28

AGRICULTURAL SOIL ANALYSIS REPORT
81 samples supplied by SLR Consulting Australia Pty Ltd on 6/12/2021 . Lab Job No.M4178
Analysis requested by Alex Koeman. Your Job: PO: 620.30686
Level 2, 15 Astor Terrace BRISBANE QLD 4000
Sample ID:
Crop:
Client:
Method reference
**Rayment & Lyons 2011 - 9E2 (Bray 1)
Rayment & Lyons 2011 - 4A1 (1:5 Water)
Rayment & Lyons 2011 - 3A1 (1:5 Water)
**Calculation: Total Carbon x 1.75
(cmol+/kg)
(kg/ha)
(mg/kg)
(cmol+/kg)
(kg/ha)
(mg/kg)
(cmol+/kg)
(kg/ha)
(mg/kg)
(cmol+/kg)
(kg/ha)
(mg/kg)
(cmol+/kg)
(kg/ha)
(mg/kg)
(cmol+/kg)
(kg/ha)
(mg/kg)
**Calculation:
Sum of Ca,Mg,K,Na,Al,H (cmol+/kg)
**Calculation: Calcium / Magnesium (cmol+/kg)
**Calculation: Total Carbon/Total Nitrogen
**Calculation: Electrical Conductivity x 640
Parameter
Electrical Conductivity (dS/m)
Estimated Organic Matter (% OM)
Rayment & Lyons 2011 - 15D3
(Ammonium Acetate)
**Inhouse S37 (KCl)
Phosphorus (mg/kg P)
pH
Exchangeable Calcium
Exchangeable Magnesium
Exchangeable Potassium
Exchangeable Sodium
Exchangeable Aluminium
Potassium (%)
Sodium - ESP (%)
Aluminium (%)
Hydrogen (%)
Chloride Estimate (equiv. mg/kg)
**Rayment & Lyons 2011 - 15G1
(Acidity Titration)
Effective Cation Exchange Capacity
(ECEC) (cmol+/kg)
Calcium (%)
Magnesium (%)
Exchangeable Hydrogen
Total Carbon (%)
Total Nitrogen (%)
Carbon/Nitrogen Ratio
Calcium/Magnesium Ratio
Inhouse S4a (LECO Trumac Analyser)
**Base Saturation Calculations -
Cation cmol+/kg / ECEC x 100
Sample 31 Sample 32 Sample 33 Sample 34 Sample 35 Sample 36
BH13_20-30 BH13_50-60 BH13_90-100 BH14_0-10 BH14_20-30 BH14_50-60
Soil Soil Soil Soil Soil Soil
SLR Consulting
Australia Pty
Ltd
SLR Consulting
Australia Pty
Ltd
SLR Consulting
Australia Pty
Ltd
SLR Consulting
Australia Pty
Ltd
SLR Consulting
Australia Pty
Ltd
SLR Consulting
Australia Pty
Ltd
M4178/31 M4178/32 M4178/33 M4178/34 M4178/35 M4178/36
2.0 1.8 2.5 5.5 2.9 1.0
7.85 8.35 8.69 6.61 6.47 8.18
0.023 0.040 0.058 0.038 0.022 0.093
0.46 0.55 0.38 1.69 1.27 0.62
2.5 2.9 4.0 3.1 3.0 11
1,141 1,322 1,802 1,385 1,338 5,149
509 590 804 618 597 2,298
0.26 0.42 0.71 0.96 0.68 3.3
70 115 193 261 184 887
31 51 86 116 82 396
0.23 0.41 0.74 0.49 0.33 0.26
204 358 648 426 288 226
91 160 289 190 129 101
<0.065 0.07 <0.065 <0.065 <0.065 0.25
<33 36 <33 <33 <33 129
<15 16 <15 <15 <15 58
<0.01 <0.01 <0.01 <0.01 <0.01 <0.01
<1 1.3 1.0 <1 <1 1.3
<1 <1 <1 <1 <1 <1
<0.01 <0.01 <0.01 <0.01 0.02 <0.01
<1 <1 <1 <1 <1 <1
<1 <1 <1 <1 <1 <1
3.1 3.9 5.5 4.6 4.0 15
83 76 73 68 74 75
8.4 11 13 21 17 21
7.6 11 13 11 8.2 1.7
1.1 1.8 0.80 0.56 0.51 1.6
0.14 0.16 0.09 0.08 0.08 0.04
0.00 0.00 0.00 0.00 0.50 0.00
9.9 7.0 5.7 3.2 4.4 3.5
0.26 0.32 0.22 0.97 0.72 0.35
0.04 0.04 0.04 0.11 0.06 0.04
6.5 8.6 6.0 9.0 11.9 8.4
15 26 37 24 14 60
Page 11 / 28

AGRICULTURAL SOIL ANALYSIS REPORT
81 samples supplied by SLR Consulting Australia Pty Ltd on 6/12/2021 . Lab Job No.M4178
Analysis requested by Alex Koeman. Your Job: PO: 620.30686
Level 2, 15 Astor Terrace BRISBANE QLD 4000
Sample ID:
Crop:
Client:
Method reference
**Rayment & Lyons 2011 - 9E2 (Bray 1)
Parameter
Phosphorus (mg/kg P)Notes: 1. All results presented as a 40°C oven dried weight. Soil sieved and lightly crushed to < 2 mm.
2. Methods from Rayment and Lyons, 2011. Soil Chemical Methods - Australasia. CSIRO Publishing: Collingwood.
3. Soluble Salts included in Exchangeable Cations - NO PRE-WASH (unless requested).
4. 'Morgan 1 Extract' adapted from 'Science in Agriculture', 'Non-Toxic Farming' and LaMotte Soil Handbook.
5. Guidelines for phosphorus have been reduced for Australian soils.
6. Indicative guidelines are based on 'Albrecht' and 'Reams' concepts.
7. Total Acid Extractable Nutrients indicate a store of nutrients.
8. National Environmental Protection (Assessment of Site Contamination) Measure 2013,
Schedule B(1) - Guideline on Investigation Levels for Soil and Groundwater. Table 5-A Background Ranges.
9. Information relating to testing colour codes is available on sheet 2 - 'Understanding your agricultural soil results'.
10. Conversions for 1 cmol+/kg = 230 mg/kg Sodium, 390 mg/kg Potassium,
122 mg/kg Magnesium, 200 mg/kg Calcium
11. Conversions to kg/ha = mg/kg x 2.24
12. The chloride calculation of Cl mg/L = EC x 640 is considered an estimate, and most likely an over-estimate
13. ** NATA accreditation does not cover the performance of this service.
14. Analysis conducted between sample arrival date and reporting date.
15. This report is not to be reproduced except in full. Results only relate to the item tested.
16. All services undertaken by EAL are covered by the EAL Laboratory Services Terms and Conditions (refer SCU.edu.au/eal/t&cs).
17. This report was issued on 14/12/2021.
Quality Checked: Kris SavilleAgricultural Co-Ordinator
Sample 31 Sample 32 Sample 33 Sample 34 Sample 35 Sample 36
BH13_20-30 BH13_50-60 BH13_90-100 BH14_0-10 BH14_20-30 BH14_50-60
Soil Soil Soil Soil Soil Soil
SLR Consulting
Australia Pty
Ltd
SLR Consulting
Australia Pty
Ltd
SLR Consulting
Australia Pty
Ltd
SLR Consulting
Australia Pty
Ltd
SLR Consulting
Australia Pty
Ltd
SLR Consulting
Australia Pty
Ltd
M4178/31 M4178/32 M4178/33 M4178/34 M4178/35 M4178/36
Page 12 / 28

AGRICULTURAL SOIL ANALYSIS REPORT
81 samples supplied by SLR Consulting Australia Pty Ltd on 6/12/2021 . Lab Job No.M4178
Analysis requested by Alex Koeman. Your Job: PO: 620.30686
Level 2, 15 Astor Terrace BRISBANE QLD 4000
Sample ID:
Crop:
Client:
Method reference
**Rayment & Lyons 2011 - 9E2 (Bray 1)
Rayment & Lyons 2011 - 4A1 (1:5 Water)
Rayment & Lyons 2011 - 3A1 (1:5 Water)
**Calculation: Total Carbon x 1.75
(cmol+/kg)
(kg/ha)
(mg/kg)
(cmol+/kg)
(kg/ha)
(mg/kg)
(cmol+/kg)
(kg/ha)
(mg/kg)
(cmol+/kg)
(kg/ha)
(mg/kg)
(cmol+/kg)
(kg/ha)
(mg/kg)
(cmol+/kg)
(kg/ha)
(mg/kg)
**Calculation:
Sum of Ca,Mg,K,Na,Al,H (cmol+/kg)
**Calculation: Calcium / Magnesium (cmol+/kg)
**Calculation: Total Carbon/Total Nitrogen
**Calculation: Electrical Conductivity x 640
Parameter
Electrical Conductivity (dS/m)
Estimated Organic Matter (% OM)
Rayment & Lyons 2011 - 15D3
(Ammonium Acetate)
**Inhouse S37 (KCl)
Phosphorus (mg/kg P)
pH
Exchangeable Calcium
Exchangeable Magnesium
Exchangeable Potassium
Exchangeable Sodium
Exchangeable Aluminium
Potassium (%)
Sodium - ESP (%)
Aluminium (%)
Hydrogen (%)
Chloride Estimate (equiv. mg/kg)
**Rayment & Lyons 2011 - 15G1
(Acidity Titration)
Effective Cation Exchange Capacity
(ECEC) (cmol+/kg)
Calcium (%)
Magnesium (%)
Exchangeable Hydrogen
Total Carbon (%)
Total Nitrogen (%)
Carbon/Nitrogen Ratio
Calcium/Magnesium Ratio
Inhouse S4a (LECO Trumac Analyser)
**Base Saturation Calculations -
Cation cmol+/kg / ECEC x 100
Sample 37 Sample 38 Sample 39 Sample 40 Sample 41 Sample 42
BH14_90-100 BH16_0-10 BH16_20-30 BH16_50-60 BH16_90-100 BH18_0-10
Soil Soil Soil Soil Soil Soil
SLR Consulting
Australia Pty
Ltd
SLR Consulting
Australia Pty
Ltd
SLR Consulting
Australia Pty
Ltd
SLR Consulting
Australia Pty
Ltd
SLR Consulting
Australia Pty
Ltd
SLR Consulting
Australia Pty
Ltd
M4178/37 M4178/38 M4178/39 M4178/40 M4178/41 M4178/42
<1 9.5 4.2 7.6 17 21
8.89 8.90 9.01 8.71 8.58 8.81
0.094 0.152 0.272 0.904 0.914 0.216
0.35 2.54 2.24 1.47 0.65 1.50
7.3 31 28 20 13 30
3,286 14,026 12,602 9,000 5,713 13,674
1,467 6,262 5,626 4,018 2,550 6,104
4.6 9.8 12 13 10 8.7
1,249 2,680 3,249 3,498 2,748 2,379
557 1,196 1,450 1,562 1,227 1,062
0.38 1.1 0.90 0.77 0.58 1.2
332 973 789 673 510 1,051
148 435 352 300 228 469
0.62 1.4 3.0 5.5 5.0 1.3
318 696 1,536 2,827 2,590 665
142 311 686 1,262 1,156 297
<0.01 <0.01 <0.01 <0.01 <0.01 <0.01
<1 <1 <1 <1 <1 <1
<1 <1 <1 <1 <1 <1
<0.01 <0.01 <0.01 <0.01 <0.01 <0.01
<1 <1 <1 <1 <1 <1
<1 <1 <1 <1 <1 <1
13 44 44 39 28 42
57 72 64 51 45 73
36 23 27 33 35 21
2.9 2.6 2.1 2.0 2.0 2.9
4.8 3.1 6.8 14 18 3.1
0.03 0.00 0.00 0.00 0.01 0.00
0.00 0.00 0.00 0.00 0.00 0.00
1.6 3.2 2.4 1.6 1.3 3.5
0.20 1.45 1.28 0.84 0.37 0.86
0.08 0.09 0.08 0.03 0.02 0.06
2.6 16.3 15.6 27.9 17.7 14.5
60 97 174 579 585 138
Page 13 / 28

AGRICULTURAL SOIL ANALYSIS REPORT
81 samples supplied by SLR Consulting Australia Pty Ltd on 6/12/2021 . Lab Job No.M4178
Analysis requested by Alex Koeman. Your Job: PO: 620.30686
Level 2, 15 Astor Terrace BRISBANE QLD 4000
Sample ID:
Crop:
Client:
Method reference
**Rayment & Lyons 2011 - 9E2 (Bray 1)
Parameter
Phosphorus (mg/kg P)Notes: 1. All results presented as a 40°C oven dried weight. Soil sieved and lightly crushed to < 2 mm.
2. Methods from Rayment and Lyons, 2011. Soil Chemical Methods - Australasia. CSIRO Publishing: Collingwood.
3. Soluble Salts included in Exchangeable Cations - NO PRE-WASH (unless requested).
4. 'Morgan 1 Extract' adapted from 'Science in Agriculture', 'Non-Toxic Farming' and LaMotte Soil Handbook.
5. Guidelines for phosphorus have been reduced for Australian soils.
6. Indicative guidelines are based on 'Albrecht' and 'Reams' concepts.
7. Total Acid Extractable Nutrients indicate a store of nutrients.
8. National Environmental Protection (Assessment of Site Contamination) Measure 2013,
Schedule B(1) - Guideline on Investigation Levels for Soil and Groundwater. Table 5-A Background Ranges.
9. Information relating to testing colour codes is available on sheet 2 - 'Understanding your agricultural soil results'.
10. Conversions for 1 cmol+/kg = 230 mg/kg Sodium, 390 mg/kg Potassium,
122 mg/kg Magnesium, 200 mg/kg Calcium
11. Conversions to kg/ha = mg/kg x 2.24
12. The chloride calculation of Cl mg/L = EC x 640 is considered an estimate, and most likely an over-estimate
13. ** NATA accreditation does not cover the performance of this service.
14. Analysis conducted between sample arrival date and reporting date.
15. This report is not to be reproduced except in full. Results only relate to the item tested.
16. All services undertaken by EAL are covered by the EAL Laboratory Services Terms and Conditions (refer SCU.edu.au/eal/t&cs).
17. This report was issued on 14/12/2021.
Quality Checked: Kris SavilleAgricultural Co-Ordinator
Sample 37 Sample 38 Sample 39 Sample 40 Sample 41 Sample 42
BH14_90-100 BH16_0-10 BH16_20-30 BH16_50-60 BH16_90-100 BH18_0-10
Soil Soil Soil Soil Soil Soil
SLR Consulting
Australia Pty
Ltd
SLR Consulting
Australia Pty
Ltd
SLR Consulting
Australia Pty
Ltd
SLR Consulting
Australia Pty
Ltd
SLR Consulting
Australia Pty
Ltd
SLR Consulting
Australia Pty
Ltd
M4178/37 M4178/38 M4178/39 M4178/40 M4178/41 M4178/42
Page 14 / 28

AGRICULTURAL SOIL ANALYSIS REPORT
81 samples supplied by SLR Consulting Australia Pty Ltd on 6/12/2021 . Lab Job No.M4178
Analysis requested by Alex Koeman. Your Job: PO: 620.30686
Level 2, 15 Astor Terrace BRISBANE QLD 4000
Sample ID:
Crop:
Client:
Method reference
**Rayment & Lyons 2011 - 9E2 (Bray 1)
Rayment & Lyons 2011 - 4A1 (1:5 Water)
Rayment & Lyons 2011 - 3A1 (1:5 Water)
**Calculation: Total Carbon x 1.75
(cmol+/kg)
(kg/ha)
(mg/kg)
(cmol+/kg)
(kg/ha)
(mg/kg)
(cmol+/kg)
(kg/ha)
(mg/kg)
(cmol+/kg)
(kg/ha)
(mg/kg)
(cmol+/kg)
(kg/ha)
(mg/kg)
(cmol+/kg)
(kg/ha)
(mg/kg)
**Calculation:
Sum of Ca,Mg,K,Na,Al,H (cmol+/kg)
**Calculation: Calcium / Magnesium (cmol+/kg)
**Calculation: Total Carbon/Total Nitrogen
**Calculation: Electrical Conductivity x 640
Parameter
Electrical Conductivity (dS/m)
Estimated Organic Matter (% OM)
Rayment & Lyons 2011 - 15D3
(Ammonium Acetate)
**Inhouse S37 (KCl)
Phosphorus (mg/kg P)
pH
Exchangeable Calcium
Exchangeable Magnesium
Exchangeable Potassium
Exchangeable Sodium
Exchangeable Aluminium
Potassium (%)
Sodium - ESP (%)
Aluminium (%)
Hydrogen (%)
Chloride Estimate (equiv. mg/kg)
**Rayment & Lyons 2011 - 15G1
(Acidity Titration)
Effective Cation Exchange Capacity
(ECEC) (cmol+/kg)
Calcium (%)
Magnesium (%)
Exchangeable Hydrogen
Total Carbon (%)
Total Nitrogen (%)
Carbon/Nitrogen Ratio
Calcium/Magnesium Ratio
Inhouse S4a (LECO Trumac Analyser)
**Base Saturation Calculations -
Cation cmol+/kg / ECEC x 100
Sample 43 Sample 44 Sample 45 Sample 46 Sample 47 Sample 48
BH18_20-30 BH18_50-60 BH18_90-100 BH22_0-10 BH22_20-30 BH22_50-60
Soil Soil Soil Soil Soil Soil
SLR Consulting
Australia Pty
Ltd
SLR Consulting
Australia Pty
Ltd
SLR Consulting
Australia Pty
Ltd
SLR Consulting
Australia Pty
Ltd
SLR Consulting
Australia Pty
Ltd
SLR Consulting
Australia Pty
Ltd
M4178/43 M4178/44 M4178/45 M4178/46 M4178/47 M4178/48
20 21 24 15 7.6 4.3
8.78 8.71 8.44 8.65 8.64 8.68
0.366 0.533 0.993 0.521 0.527 0.476
1.59 1.54 1.12 2.03 1.56 1.82
31 31 22 32 31 30
14,004 13,898 9,778 14,344 13,706 13,386
6,252 6,205 4,365 6,404 6,119 5,976
11 14 13 10 11 12
3,065 3,823 3,637 2,797 2,880 3,138
1,368 1,707 1,624 1,249 1,285 1,401
1.3 1.1 0.88 1.2 1.0 0.89
1,097 935 771 1,033 910 780
490 417 344 461 406 348
2.8 3.7 4.8 3.2 3.3 3.6
1,465 1,912 2,460 1,625 1,715 1,855
654 854 1,098 725 765 828
<0.01 <0.01 <0.01 <0.01 <0.01 <0.01
<1 <1 <1 <1 <1 <1
<1 <1 <1 <1 <1 <1
<0.01 <0.01 <0.01 <0.01 <0.01 <0.01
<1 <1 <1 <1 <1 <1
<1 <1 <1 <1 <1 <1
47 50 41 47 45 46
67 62 53 69 67 65
24 28 33 22 23 25
2.7 2.1 2.2 2.5 2.3 1.9
6.1 7.5 12 6.8 7.3 7.9
0.00 0.00 0.00 0.00 0.00 0.00
0.00 0.00 0.00 0.00 0.00 0.00
2.8 2.2 1.6 3.1 2.9 2.6
0.91 0.88 0.64 1.16 0.89 1.04
0.06 0.07 0.74 0.12 0.11 0.10
15.4 12.2 0.9 9.7 8.4 10.1
234 341 636 333 337 305
Page 15 / 28

AGRICULTURAL SOIL ANALYSIS REPORT
81 samples supplied by SLR Consulting Australia Pty Ltd on 6/12/2021 . Lab Job No.M4178
Analysis requested by Alex Koeman. Your Job: PO: 620.30686
Level 2, 15 Astor Terrace BRISBANE QLD 4000
Sample ID:
Crop:
Client:
Method reference
**Rayment & Lyons 2011 - 9E2 (Bray 1)
Parameter
Phosphorus (mg/kg P)Notes: 1. All results presented as a 40°C oven dried weight. Soil sieved and lightly crushed to < 2 mm.
2. Methods from Rayment and Lyons, 2011. Soil Chemical Methods - Australasia. CSIRO Publishing: Collingwood.
3. Soluble Salts included in Exchangeable Cations - NO PRE-WASH (unless requested).
4. 'Morgan 1 Extract' adapted from 'Science in Agriculture', 'Non-Toxic Farming' and LaMotte Soil Handbook.
5. Guidelines for phosphorus have been reduced for Australian soils.
6. Indicative guidelines are based on 'Albrecht' and 'Reams' concepts.
7. Total Acid Extractable Nutrients indicate a store of nutrients.
8. National Environmental Protection (Assessment of Site Contamination) Measure 2013,
Schedule B(1) - Guideline on Investigation Levels for Soil and Groundwater. Table 5-A Background Ranges.
9. Information relating to testing colour codes is available on sheet 2 - 'Understanding your agricultural soil results'.
10. Conversions for 1 cmol+/kg = 230 mg/kg Sodium, 390 mg/kg Potassium,
122 mg/kg Magnesium, 200 mg/kg Calcium
11. Conversions to kg/ha = mg/kg x 2.24
12. The chloride calculation of Cl mg/L = EC x 640 is considered an estimate, and most likely an over-estimate
13. ** NATA accreditation does not cover the performance of this service.
14. Analysis conducted between sample arrival date and reporting date.
15. This report is not to be reproduced except in full. Results only relate to the item tested.
16. All services undertaken by EAL are covered by the EAL Laboratory Services Terms and Conditions (refer SCU.edu.au/eal/t&cs).
17. This report was issued on 14/12/2021.
Quality Checked: Kris SavilleAgricultural Co-Ordinator
Sample 43 Sample 44 Sample 45 Sample 46 Sample 47 Sample 48
BH18_20-30 BH18_50-60 BH18_90-100 BH22_0-10 BH22_20-30 BH22_50-60
Soil Soil Soil Soil Soil Soil
SLR Consulting
Australia Pty
Ltd
SLR Consulting
Australia Pty
Ltd
SLR Consulting
Australia Pty
Ltd
SLR Consulting
Australia Pty
Ltd
SLR Consulting
Australia Pty
Ltd
SLR Consulting
Australia Pty
Ltd
M4178/43 M4178/44 M4178/45 M4178/46 M4178/47 M4178/48
Page 16 / 28
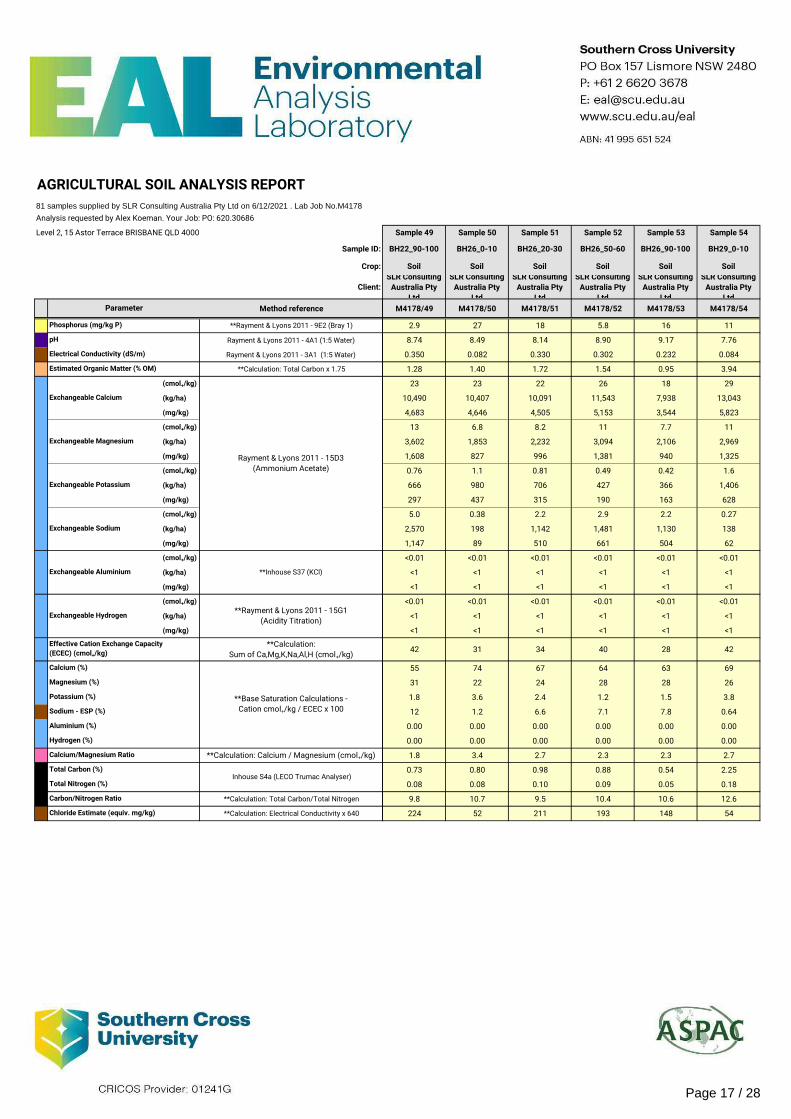
AGRICULTURAL SOIL ANALYSIS REPORT
81 samples supplied by SLR Consulting Australia Pty Ltd on 6/12/2021 . Lab Job No.M4178
Analysis requested by Alex Koeman. Your Job: PO: 620.30686
Level 2, 15 Astor Terrace BRISBANE QLD 4000
Sample ID:
Crop:
Client:
Method reference
**Rayment & Lyons 2011 - 9E2 (Bray 1)
Rayment & Lyons 2011 - 4A1 (1:5 Water)
Rayment & Lyons 2011 - 3A1 (1:5 Water)
**Calculation: Total Carbon x 1.75
(cmol+/kg)
(kg/ha)
(mg/kg)
(cmol+/kg)
(kg/ha)
(mg/kg)
(cmol+/kg)
(kg/ha)
(mg/kg)
(cmol+/kg)
(kg/ha)
(mg/kg)
(cmol+/kg)
(kg/ha)
(mg/kg)
(cmol+/kg)
(kg/ha)
(mg/kg)
**Calculation:
Sum of Ca,Mg,K,Na,Al,H (cmol+/kg)
**Calculation: Calcium / Magnesium (cmol+/kg)
**Calculation: Total Carbon/Total Nitrogen
**Calculation: Electrical Conductivity x 640
Parameter
Electrical Conductivity (dS/m)
Estimated Organic Matter (% OM)
Rayment & Lyons 2011 - 15D3
(Ammonium Acetate)
**Inhouse S37 (KCl)
Phosphorus (mg/kg P)
pH
Exchangeable Calcium
Exchangeable Magnesium
Exchangeable Potassium
Exchangeable Sodium
Exchangeable Aluminium
Potassium (%)
Sodium - ESP (%)
Aluminium (%)
Hydrogen (%)
Chloride Estimate (equiv. mg/kg)
**Rayment & Lyons 2011 - 15G1
(Acidity Titration)
Effective Cation Exchange Capacity
(ECEC) (cmol+/kg)
Calcium (%)
Magnesium (%)
Exchangeable Hydrogen
Total Carbon (%)
Total Nitrogen (%)
Carbon/Nitrogen Ratio
Calcium/Magnesium Ratio
Inhouse S4a (LECO Trumac Analyser)
**Base Saturation Calculations -
Cation cmol+/kg / ECEC x 100
Sample 49 Sample 50 Sample 51 Sample 52 Sample 53 Sample 54
BH22_90-100 BH26_0-10 BH26_20-30 BH26_50-60 BH26_90-100 BH29_0-10
Soil Soil Soil Soil Soil Soil
SLR Consulting
Australia Pty
Ltd
SLR Consulting
Australia Pty
Ltd
SLR Consulting
Australia Pty
Ltd
SLR Consulting
Australia Pty
Ltd
SLR Consulting
Australia Pty
Ltd
SLR Consulting
Australia Pty
Ltd
M4178/49 M4178/50 M4178/51 M4178/52 M4178/53 M4178/54
2.9 27 18 5.8 16 11
8.74 8.49 8.14 8.90 9.17 7.76
0.350 0.082 0.330 0.302 0.232 0.084
1.28 1.40 1.72 1.54 0.95 3.94
23 23 22 26 18 29
10,490 10,407 10,091 11,543 7,938 13,043
4,683 4,646 4,505 5,153 3,544 5,823
13 6.8 8.2 11 7.7 11
3,602 1,853 2,232 3,094 2,106 2,969
1,608 827 996 1,381 940 1,325
0.76 1.1 0.81 0.49 0.42 1.6
666 980 706 427 366 1,406
297 437 315 190 163 628
5.0 0.38 2.2 2.9 2.2 0.27
2,570 198 1,142 1,481 1,130 138
1,147 89 510 661 504 62
<0.01 <0.01 <0.01 <0.01 <0.01 <0.01
<1 <1 <1 <1 <1 <1
<1 <1 <1 <1 <1 <1
<0.01 <0.01 <0.01 <0.01 <0.01 <0.01
<1 <1 <1 <1 <1 <1
<1 <1 <1 <1 <1 <1
42 31 34 40 28 42
55 74 67 64 63 69
31 22 24 28 28 26
1.8 3.6 2.4 1.2 1.5 3.8
12 1.2 6.6 7.1 7.8 0.64
0.00 0.00 0.00 0.00 0.00 0.00
0.00 0.00 0.00 0.00 0.00 0.00
1.8 3.4 2.7 2.3 2.3 2.7
0.73 0.80 0.98 0.88 0.54 2.25
0.08 0.08 0.10 0.09 0.05 0.18
9.8 10.7 9.5 10.4 10.6 12.6
224 52 211 193 148 54
Page 17 / 28

AGRICULTURAL SOIL ANALYSIS REPORT
81 samples supplied by SLR Consulting Australia Pty Ltd on 6/12/2021 . Lab Job No.M4178
Analysis requested by Alex Koeman. Your Job: PO: 620.30686
Level 2, 15 Astor Terrace BRISBANE QLD 4000
Sample ID:
Crop:
Client:
Method reference
**Rayment & Lyons 2011 - 9E2 (Bray 1)
Parameter
Phosphorus (mg/kg P)Notes: 1. All results presented as a 40°C oven dried weight. Soil sieved and lightly crushed to < 2 mm.
2. Methods from Rayment and Lyons, 2011. Soil Chemical Methods - Australasia. CSIRO Publishing: Collingwood.
3. Soluble Salts included in Exchangeable Cations - NO PRE-WASH (unless requested).
4. 'Morgan 1 Extract' adapted from 'Science in Agriculture', 'Non-Toxic Farming' and LaMotte Soil Handbook.
5. Guidelines for phosphorus have been reduced for Australian soils.
6. Indicative guidelines are based on 'Albrecht' and 'Reams' concepts.
7. Total Acid Extractable Nutrients indicate a store of nutrients.
8. National Environmental Protection (Assessment of Site Contamination) Measure 2013,
Schedule B(1) - Guideline on Investigation Levels for Soil and Groundwater. Table 5-A Background Ranges.
9. Information relating to testing colour codes is available on sheet 2 - 'Understanding your agricultural soil results'.
10. Conversions for 1 cmol+/kg = 230 mg/kg Sodium, 390 mg/kg Potassium,
122 mg/kg Magnesium, 200 mg/kg Calcium
11. Conversions to kg/ha = mg/kg x 2.24
12. The chloride calculation of Cl mg/L = EC x 640 is considered an estimate, and most likely an over-estimate
13. ** NATA accreditation does not cover the performance of this service.
14. Analysis conducted between sample arrival date and reporting date.
15. This report is not to be reproduced except in full. Results only relate to the item tested.
16. All services undertaken by EAL are covered by the EAL Laboratory Services Terms and Conditions (refer SCU.edu.au/eal/t&cs).
17. This report was issued on 14/12/2021.
Quality Checked: Kris SavilleAgricultural Co-Ordinator
Sample 49 Sample 50 Sample 51 Sample 52 Sample 53 Sample 54
BH22_90-100 BH26_0-10 BH26_20-30 BH26_50-60 BH26_90-100 BH29_0-10
Soil Soil Soil Soil Soil Soil
SLR Consulting
Australia Pty
Ltd
SLR Consulting
Australia Pty
Ltd
SLR Consulting
Australia Pty
Ltd
SLR Consulting
Australia Pty
Ltd
SLR Consulting
Australia Pty
Ltd
SLR Consulting
Australia Pty
Ltd
M4178/49 M4178/50 M4178/51 M4178/52 M4178/53 M4178/54
Page 18 / 28

AGRICULTURAL SOIL ANALYSIS REPORT
81 samples supplied by SLR Consulting Australia Pty Ltd on 6/12/2021 . Lab Job No.M4178
Analysis requested by Alex Koeman. Your Job: PO: 620.30686
Level 2, 15 Astor Terrace BRISBANE QLD 4000
Sample ID:
Crop:
Client:
Method reference
**Rayment & Lyons 2011 - 9E2 (Bray 1)
Rayment & Lyons 2011 - 4A1 (1:5 Water)
Rayment & Lyons 2011 - 3A1 (1:5 Water)
**Calculation: Total Carbon x 1.75
(cmol+/kg)
(kg/ha)
(mg/kg)
(cmol+/kg)
(kg/ha)
(mg/kg)
(cmol+/kg)
(kg/ha)
(mg/kg)
(cmol+/kg)
(kg/ha)
(mg/kg)
(cmol+/kg)
(kg/ha)
(mg/kg)
(cmol+/kg)
(kg/ha)
(mg/kg)
**Calculation:
Sum of Ca,Mg,K,Na,Al,H (cmol+/kg)
**Calculation: Calcium / Magnesium (cmol+/kg)
**Calculation: Total Carbon/Total Nitrogen
**Calculation: Electrical Conductivity x 640
Parameter
Electrical Conductivity (dS/m)
Estimated Organic Matter (% OM)
Rayment & Lyons 2011 - 15D3
(Ammonium Acetate)
**Inhouse S37 (KCl)
Phosphorus (mg/kg P)
pH
Exchangeable Calcium
Exchangeable Magnesium
Exchangeable Potassium
Exchangeable Sodium
Exchangeable Aluminium
Potassium (%)
Sodium - ESP (%)
Aluminium (%)
Hydrogen (%)
Chloride Estimate (equiv. mg/kg)
**Rayment & Lyons 2011 - 15G1
(Acidity Titration)
Effective Cation Exchange Capacity
(ECEC) (cmol+/kg)
Calcium (%)
Magnesium (%)
Exchangeable Hydrogen
Total Carbon (%)
Total Nitrogen (%)
Carbon/Nitrogen Ratio
Calcium/Magnesium Ratio
Inhouse S4a (LECO Trumac Analyser)
**Base Saturation Calculations -
Cation cmol+/kg / ECEC x 100
Sample 55 Sample 56 Sample 57 Sample 58 Sample 59 Sample 60
BH29_20-30 BH29_50-60 BH29_90-100 BH30_0-10 BH30_20-30 BH30_50-60
Soil Soil Soil Soil Soil Soil
SLR Consulting
Australia Pty
Ltd
SLR Consulting
Australia Pty
Ltd
SLR Consulting
Australia Pty
Ltd
SLR Consulting
Australia Pty
Ltd
SLR Consulting
Australia Pty
Ltd
SLR Consulting
Australia Pty
Ltd
M4178/55 M4178/56 M4178/57 M4178/58 M4178/59 M4178/60
15 31 35 2.1 1.5 1.1
8.19 8.28 8.34 7.31 7.97 8.11
0.099 0.084 0.069 0.026 0.022 0.022
3.66 2.57 2.29 0.89 0.46 0.30
24 21 20 20 13 12
10,821 9,298 8,761 9,167 5,994 5,198
4,831 4,151 3,911 4,093 2,676 2,320
8.3 7.6 7.2 8.8 7.5 8.1
2,257 2,073 1,947 2,407 2,048 2,199
1,008 925 869 1,074 914 982
0.86 0.91 1.0 0.28 0.23 0.23
755 797 881 248 203 198
337 356 393 111 91 88
0.32 0.32 0.30 0.20 0.25 0.22
164 165 154 103 130 114
73 74 69 46 58 51
<0.01 <0.01 <0.01 <0.01 <0.01 <0.01
<1 <1 <1 <1 <1 <1
<1 <1 <1 <1 <1 <1
<0.01 <0.01 <0.01 <0.01 <0.01 <0.01
<1 <1 <1 <1 <1 <1
<1 <1 <1 <1 <1 <1
34 30 28 30 21 20
72 70 70 69 63 58
25 26 26 30 35 40
2.6 3.1 3.6 0.95 1.1 1.1
0.95 1.1 1.1 0.67 1.2 1.1
0.00 0.00 0.00 0.01 0.01 0.01
0.00 0.00 0.00 0.00 0.00 0.00
2.9 2.7 2.7 2.3 1.8 1.4
2.09 1.47 1.31 0.51 0.27 0.17
0.15 0.12 0.13 0.11 0.09 0.07
14.4 12.5 10.2 4.5 3.1 2.4
63 54 44 17 14 14
Page 19 / 28

AGRICULTURAL SOIL ANALYSIS REPORT
81 samples supplied by SLR Consulting Australia Pty Ltd on 6/12/2021 . Lab Job No.M4178
Analysis requested by Alex Koeman. Your Job: PO: 620.30686
Level 2, 15 Astor Terrace BRISBANE QLD 4000
Sample ID:
Crop:
Client:
Method reference
**Rayment & Lyons 2011 - 9E2 (Bray 1)
Parameter
Phosphorus (mg/kg P)Notes: 1. All results presented as a 40°C oven dried weight. Soil sieved and lightly crushed to < 2 mm.
2. Methods from Rayment and Lyons, 2011. Soil Chemical Methods - Australasia. CSIRO Publishing: Collingwood.
3. Soluble Salts included in Exchangeable Cations - NO PRE-WASH (unless requested).
4. 'Morgan 1 Extract' adapted from 'Science in Agriculture', 'Non-Toxic Farming' and LaMotte Soil Handbook.
5. Guidelines for phosphorus have been reduced for Australian soils.
6. Indicative guidelines are based on 'Albrecht' and 'Reams' concepts.
7. Total Acid Extractable Nutrients indicate a store of nutrients.
8. National Environmental Protection (Assessment of Site Contamination) Measure 2013,
Schedule B(1) - Guideline on Investigation Levels for Soil and Groundwater. Table 5-A Background Ranges.
9. Information relating to testing colour codes is available on sheet 2 - 'Understanding your agricultural soil results'.
10. Conversions for 1 cmol+/kg = 230 mg/kg Sodium, 390 mg/kg Potassium,
122 mg/kg Magnesium, 200 mg/kg Calcium
11. Conversions to kg/ha = mg/kg x 2.24
12. The chloride calculation of Cl mg/L = EC x 640 is considered an estimate, and most likely an over-estimate
13. ** NATA accreditation does not cover the performance of this service.
14. Analysis conducted between sample arrival date and reporting date.
15. This report is not to be reproduced except in full. Results only relate to the item tested.
16. All services undertaken by EAL are covered by the EAL Laboratory Services Terms and Conditions (refer SCU.edu.au/eal/t&cs).
17. This report was issued on 14/12/2021.
Quality Checked: Kris SavilleAgricultural Co-Ordinator
Sample 55 Sample 56 Sample 57 Sample 58 Sample 59 Sample 60
BH29_20-30 BH29_50-60 BH29_90-100 BH30_0-10 BH30_20-30 BH30_50-60
Soil Soil Soil Soil Soil Soil
SLR Consulting
Australia Pty
Ltd
SLR Consulting
Australia Pty
Ltd
SLR Consulting
Australia Pty
Ltd
SLR Consulting
Australia Pty
Ltd
SLR Consulting
Australia Pty
Ltd
SLR Consulting
Australia Pty
Ltd
M4178/55 M4178/56 M4178/57 M4178/58 M4178/59 M4178/60
Page 20 / 28

AGRICULTURAL SOIL ANALYSIS REPORT
81 samples supplied by SLR Consulting Australia Pty Ltd on 6/12/2021 . Lab Job No.M4178
Analysis requested by Alex Koeman. Your Job: PO: 620.30686
Level 2, 15 Astor Terrace BRISBANE QLD 4000
Sample ID:
Crop:
Client:
Method reference
**Rayment & Lyons 2011 - 9E2 (Bray 1)
Rayment & Lyons 2011 - 4A1 (1:5 Water)
Rayment & Lyons 2011 - 3A1 (1:5 Water)
**Calculation: Total Carbon x 1.75
(cmol+/kg)
(kg/ha)
(mg/kg)
(cmol+/kg)
(kg/ha)
(mg/kg)
(cmol+/kg)
(kg/ha)
(mg/kg)
(cmol+/kg)
(kg/ha)
(mg/kg)
(cmol+/kg)
(kg/ha)
(mg/kg)
(cmol+/kg)
(kg/ha)
(mg/kg)
**Calculation:
Sum of Ca,Mg,K,Na,Al,H (cmol+/kg)
**Calculation: Calcium / Magnesium (cmol+/kg)
**Calculation: Total Carbon/Total Nitrogen
**Calculation: Electrical Conductivity x 640
Parameter
Electrical Conductivity (dS/m)
Estimated Organic Matter (% OM)
Rayment & Lyons 2011 - 15D3
(Ammonium Acetate)
**Inhouse S37 (KCl)
Phosphorus (mg/kg P)
pH
Exchangeable Calcium
Exchangeable Magnesium
Exchangeable Potassium
Exchangeable Sodium
Exchangeable Aluminium
Potassium (%)
Sodium - ESP (%)
Aluminium (%)
Hydrogen (%)
Chloride Estimate (equiv. mg/kg)
**Rayment & Lyons 2011 - 15G1
(Acidity Titration)
Effective Cation Exchange Capacity
(ECEC) (cmol+/kg)
Calcium (%)
Magnesium (%)
Exchangeable Hydrogen
Total Carbon (%)
Total Nitrogen (%)
Carbon/Nitrogen Ratio
Calcium/Magnesium Ratio
Inhouse S4a (LECO Trumac Analyser)
**Base Saturation Calculations -
Cation cmol+/kg / ECEC x 100
Sample 61 Sample 62 Sample 63 Sample 64 Sample 65 Sample 66
BH30_70-80 BH32_0-10 BH32_20-30 BH32_50-60 BH32_90-100 BH34_0-10
Soil Soil Soil Soil Soil Soil
SLR Consulting
Australia Pty
Ltd
SLR Consulting
Australia Pty
Ltd
SLR Consulting
Australia Pty
Ltd
SLR Consulting
Australia Pty
Ltd
SLR Consulting
Australia Pty
Ltd
SLR Consulting
Australia Pty
Ltd
M4178/61 M4178/62 M4178/63 M4178/64 M4178/65 M4178/66
1.3 11 5.3 1.7 2.6 9.3
8.86 7.02 7.39 8.44 8.81 5.97
0.125 0.025 0.026 0.070 0.159 0.910
0.55 1.23 1.30 0.89 0.87 1.75
17 3.8 4.6 8.9 13 5.6
7,842 1,685 2,044 4,003 6,043 2,497
3,501 752 913 1,787 2,698 1,115
11 0.80 0.80 2.4 3.2 3.9
2,990 218 218 667 865 1,074
1,335 98 97 298 386 480
0.33 0.70 0.46 0.49 0.45 0.53
288 610 407 428 396 463
129 272 182 191 177 207
0.35 <0.065 0.07 0.30 0.36 1.8
180 <33 34 156 186 921
81 <15 15 69 83 411
<0.01 <0.01 <0.01 <0.01 <0.01 <0.01
<1 <1 <1 <1 <1 <1
<1 <1 <1 <1 <1 <1
<0.01 <0.01 <0.01 <0.01 <0.01 0.01
<1 <1 <1 <1 <1 <1
<1 <1 <1 <1 <1 <1
29 5.3 5.9 12 17 12
60 71 77 73 77 47
38 15 14 20 18 33
1.1 13 7.9 4.0 2.6 4.5
1.2 1.1 1.1 2.5 2.1 15
0.01 0.06 0.06 0.02 0.02 0.03
0.00 0.00 0.00 0.00 0.00 0.10
1.6 4.7 5.7 3.6 4.2 1.4
0.32 0.71 0.74 0.51 0.50 1.00
0.08 0.10 0.09 0.10 0.07 0.14
3.8 7.3 8.0 5.1 7.0 7.4
80 16 17 45 102 582
Page 21 / 28
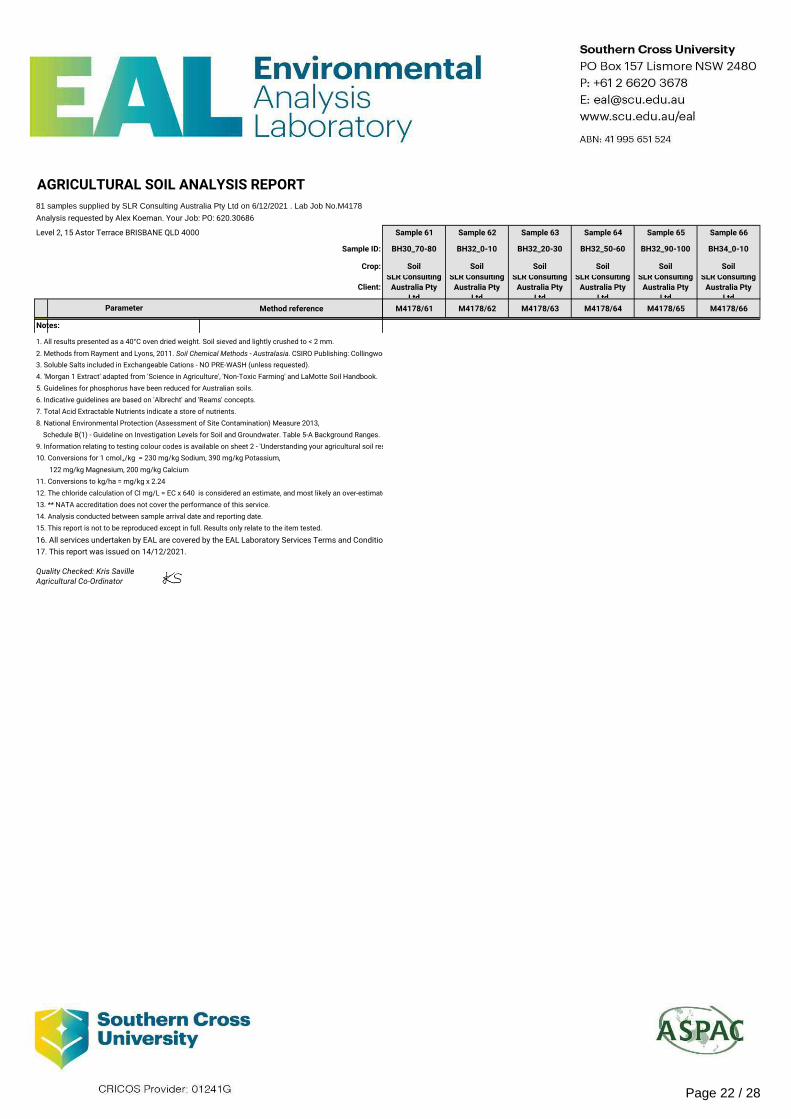
AGRICULTURAL SOIL ANALYSIS REPORT
81 samples supplied by SLR Consulting Australia Pty Ltd on 6/12/2021 . Lab Job No.M4178
Analysis requested by Alex Koeman. Your Job: PO: 620.30686
Level 2, 15 Astor Terrace BRISBANE QLD 4000
Sample ID:
Crop:
Client:
Method reference
**Rayment & Lyons 2011 - 9E2 (Bray 1)
Parameter
Phosphorus (mg/kg P)Notes: 1. All results presented as a 40°C oven dried weight. Soil sieved and lightly crushed to < 2 mm.
2. Methods from Rayment and Lyons, 2011. Soil Chemical Methods - Australasia. CSIRO Publishing: Collingwood.
3. Soluble Salts included in Exchangeable Cations - NO PRE-WASH (unless requested).
4. 'Morgan 1 Extract' adapted from 'Science in Agriculture', 'Non-Toxic Farming' and LaMotte Soil Handbook.
5. Guidelines for phosphorus have been reduced for Australian soils.
6. Indicative guidelines are based on 'Albrecht' and 'Reams' concepts.
7. Total Acid Extractable Nutrients indicate a store of nutrients.
8. National Environmental Protection (Assessment of Site Contamination) Measure 2013,
Schedule B(1) - Guideline on Investigation Levels for Soil and Groundwater. Table 5-A Background Ranges.
9. Information relating to testing colour codes is available on sheet 2 - 'Understanding your agricultural soil results'.
10. Conversions for 1 cmol+/kg = 230 mg/kg Sodium, 390 mg/kg Potassium,
122 mg/kg Magnesium, 200 mg/kg Calcium
11. Conversions to kg/ha = mg/kg x 2.24
12. The chloride calculation of Cl mg/L = EC x 640 is considered an estimate, and most likely an over-estimate
13. ** NATA accreditation does not cover the performance of this service.
14. Analysis conducted between sample arrival date and reporting date.
15. This report is not to be reproduced except in full. Results only relate to the item tested.
16. All services undertaken by EAL are covered by the EAL Laboratory Services Terms and Conditions (refer SCU.edu.au/eal/t&cs).
17. This report was issued on 14/12/2021.
Quality Checked: Kris SavilleAgricultural Co-Ordinator
Sample 61 Sample 62 Sample 63 Sample 64 Sample 65 Sample 66
BH30_70-80 BH32_0-10 BH32_20-30 BH32_50-60 BH32_90-100 BH34_0-10
Soil Soil Soil Soil Soil Soil
SLR Consulting
Australia Pty
Ltd
SLR Consulting
Australia Pty
Ltd
SLR Consulting
Australia Pty
Ltd
SLR Consulting
Australia Pty
Ltd
SLR Consulting
Australia Pty
Ltd
SLR Consulting
Australia Pty
Ltd
M4178/61 M4178/62 M4178/63 M4178/64 M4178/65 M4178/66
Page 22 / 28

AGRICULTURAL SOIL ANALYSIS REPORT
81 samples supplied by SLR Consulting Australia Pty Ltd on 6/12/2021 . Lab Job No.M4178
Analysis requested by Alex Koeman. Your Job: PO: 620.30686
Level 2, 15 Astor Terrace BRISBANE QLD 4000
Sample ID:
Crop:
Client:
Method reference
**Rayment & Lyons 2011 - 9E2 (Bray 1)
Rayment & Lyons 2011 - 4A1 (1:5 Water)
Rayment & Lyons 2011 - 3A1 (1:5 Water)
**Calculation: Total Carbon x 1.75
(cmol+/kg)
(kg/ha)
(mg/kg)
(cmol+/kg)
(kg/ha)
(mg/kg)
(cmol+/kg)
(kg/ha)
(mg/kg)
(cmol+/kg)
(kg/ha)
(mg/kg)
(cmol+/kg)
(kg/ha)
(mg/kg)
(cmol+/kg)
(kg/ha)
(mg/kg)
**Calculation:
Sum of Ca,Mg,K,Na,Al,H (cmol+/kg)
**Calculation: Calcium / Magnesium (cmol+/kg)
**Calculation: Total Carbon/Total Nitrogen
**Calculation: Electrical Conductivity x 640
Parameter
Electrical Conductivity (dS/m)
Estimated Organic Matter (% OM)
Rayment & Lyons 2011 - 15D3
(Ammonium Acetate)
**Inhouse S37 (KCl)
Phosphorus (mg/kg P)
pH
Exchangeable Calcium
Exchangeable Magnesium
Exchangeable Potassium
Exchangeable Sodium
Exchangeable Aluminium
Potassium (%)
Sodium - ESP (%)
Aluminium (%)
Hydrogen (%)
Chloride Estimate (equiv. mg/kg)
**Rayment & Lyons 2011 - 15G1
(Acidity Titration)
Effective Cation Exchange Capacity
(ECEC) (cmol+/kg)
Calcium (%)
Magnesium (%)
Exchangeable Hydrogen
Total Carbon (%)
Total Nitrogen (%)
Carbon/Nitrogen Ratio
Calcium/Magnesium Ratio
Inhouse S4a (LECO Trumac Analyser)
**Base Saturation Calculations -
Cation cmol+/kg / ECEC x 100
Sample 67 Sample 68 Sample 69 Sample 70 Sample 71 Sample 72
BH34_20-30 BH34_50-60 BH34_90-100 BH36_0-10 BH36_20-30 BH36_50-60
Soil Soil Soil Soil Soil Soil
SLR Consulting
Australia Pty
Ltd
SLR Consulting
Australia Pty
Ltd
SLR Consulting
Australia Pty
Ltd
SLR Consulting
Australia Pty
Ltd
SLR Consulting
Australia Pty
Ltd
SLR Consulting
Australia Pty
Ltd
M4178/67 M4178/68 M4178/69 M4178/70 M4178/71 M4178/72
3.9 2.4 4.6 2.9 2.0 1.1
6.05 8.17 8.60 7.14 7.17 5.88
1.132 0.335 0.226 0.041 0.025 0.046
1.39 0.78 0.50 1.98 0.79 0.59
6.1 3.6 1.8 4.7 4.2 4.0
2,741 1,634 790 2,119 1,887 1,798
1,224 730 353 946 842 803
6.5 5.8 3.3 0.47 0.71 2.1
1,773 1,589 903 128 193 581
792 709 403 57 86 259
<0.12 <0.12 <0.12 0.46 0.13 0.17
<112 <112 <112 406 <112 152
<50 <50 <50 181 <50 68
3.6 3.1 1.9 <0.065 <0.065 0.20
1,879 1,615 996 <33 <33 103
839 721 445 <15 <15 46
<0.01 <0.01 <0.01 <0.01 <0.01 <0.01
<1 <1 <1 <1 <1 1.7
<1 <1 <1 <1 <1 <1
0.01 <0.01 <0.01 <0.01 <0.01 0.03
<1 <1 <1 <1 <1 <1
<1 <1 <1 <1 <1 <1
16 13 7.1 5.7 5.1 6.6
37 29 25 83 83 61
40 46 47 8.3 14 33
0.67 0.88 0.99 8.1 2.5 2.6
22 25 27 0.67 0.94 3.0
0.02 0.03 0.04 0.06 0.07 0.13
0.07 0.00 0.00 0.00 0.00 0.47
0.94 0.62 0.53 10 5.9 1.9
0.80 0.45 0.29 1.13 0.45 0.34
0.13 0.09 0.09 0.14 0.10 0.10
6.3 4.8 3.1 7.9 4.8 3.3
724 214 145 26 16 29
Page 23 / 28

AGRICULTURAL SOIL ANALYSIS REPORT
81 samples supplied by SLR Consulting Australia Pty Ltd on 6/12/2021 . Lab Job No.M4178
Analysis requested by Alex Koeman. Your Job: PO: 620.30686
Level 2, 15 Astor Terrace BRISBANE QLD 4000
Sample ID:
Crop:
Client:
Method reference
**Rayment & Lyons 2011 - 9E2 (Bray 1)
Parameter
Phosphorus (mg/kg P)Notes: 1. All results presented as a 40°C oven dried weight. Soil sieved and lightly crushed to < 2 mm.
2. Methods from Rayment and Lyons, 2011. Soil Chemical Methods - Australasia. CSIRO Publishing: Collingwood.
3. Soluble Salts included in Exchangeable Cations - NO PRE-WASH (unless requested).
4. 'Morgan 1 Extract' adapted from 'Science in Agriculture', 'Non-Toxic Farming' and LaMotte Soil Handbook.
5. Guidelines for phosphorus have been reduced for Australian soils.
6. Indicative guidelines are based on 'Albrecht' and 'Reams' concepts.
7. Total Acid Extractable Nutrients indicate a store of nutrients.
8. National Environmental Protection (Assessment of Site Contamination) Measure 2013,
Schedule B(1) - Guideline on Investigation Levels for Soil and Groundwater. Table 5-A Background Ranges.
9. Information relating to testing colour codes is available on sheet 2 - 'Understanding your agricultural soil results'.
10. Conversions for 1 cmol+/kg = 230 mg/kg Sodium, 390 mg/kg Potassium,
122 mg/kg Magnesium, 200 mg/kg Calcium
11. Conversions to kg/ha = mg/kg x 2.24
12. The chloride calculation of Cl mg/L = EC x 640 is considered an estimate, and most likely an over-estimate
13. ** NATA accreditation does not cover the performance of this service.
14. Analysis conducted between sample arrival date and reporting date.
15. This report is not to be reproduced except in full. Results only relate to the item tested.
16. All services undertaken by EAL are covered by the EAL Laboratory Services Terms and Conditions (refer SCU.edu.au/eal/t&cs).
17. This report was issued on 14/12/2021.
Quality Checked: Kris SavilleAgricultural Co-Ordinator
Sample 67 Sample 68 Sample 69 Sample 70 Sample 71 Sample 72
BH34_20-30 BH34_50-60 BH34_90-100 BH36_0-10 BH36_20-30 BH36_50-60
Soil Soil Soil Soil Soil Soil
SLR Consulting
Australia Pty
Ltd
SLR Consulting
Australia Pty
Ltd
SLR Consulting
Australia Pty
Ltd
SLR Consulting
Australia Pty
Ltd
SLR Consulting
Australia Pty
Ltd
SLR Consulting
Australia Pty
Ltd
M4178/67 M4178/68 M4178/69 M4178/70 M4178/71 M4178/72
Page 24 / 28

AGRICULTURAL SOIL ANALYSIS REPORT
81 samples supplied by SLR Consulting Australia Pty Ltd on 6/12/2021 . Lab Job No.M4178
Analysis requested by Alex Koeman. Your Job: PO: 620.30686
Level 2, 15 Astor Terrace BRISBANE QLD 4000
Sample ID:
Crop:
Client:
Method reference
**Rayment & Lyons 2011 - 9E2 (Bray 1)
Rayment & Lyons 2011 - 4A1 (1:5 Water)
Rayment & Lyons 2011 - 3A1 (1:5 Water)
**Calculation: Total Carbon x 1.75
(cmol+/kg)
(kg/ha)
(mg/kg)
(cmol+/kg)
(kg/ha)
(mg/kg)
(cmol+/kg)
(kg/ha)
(mg/kg)
(cmol+/kg)
(kg/ha)
(mg/kg)
(cmol+/kg)
(kg/ha)
(mg/kg)
(cmol+/kg)
(kg/ha)
(mg/kg)
**Calculation:
Sum of Ca,Mg,K,Na,Al,H (cmol+/kg)
**Calculation: Calcium / Magnesium (cmol+/kg)
**Calculation: Total Carbon/Total Nitrogen
**Calculation: Electrical Conductivity x 640
Parameter
Electrical Conductivity (dS/m)
Estimated Organic Matter (% OM)
Rayment & Lyons 2011 - 15D3
(Ammonium Acetate)
**Inhouse S37 (KCl)
Phosphorus (mg/kg P)
pH
Exchangeable Calcium
Exchangeable Magnesium
Exchangeable Potassium
Exchangeable Sodium
Exchangeable Aluminium
Potassium (%)
Sodium - ESP (%)
Aluminium (%)
Hydrogen (%)
Chloride Estimate (equiv. mg/kg)
**Rayment & Lyons 2011 - 15G1
(Acidity Titration)
Effective Cation Exchange Capacity
(ECEC) (cmol+/kg)
Calcium (%)
Magnesium (%)
Exchangeable Hydrogen
Total Carbon (%)
Total Nitrogen (%)
Carbon/Nitrogen Ratio
Calcium/Magnesium Ratio
Inhouse S4a (LECO Trumac Analyser)
**Base Saturation Calculations -
Cation cmol+/kg / ECEC x 100
Sample 73 Sample 74 Sample 75 Sample 76 Sample 77 Sample 78
BH36_90-100 BH38_0-10 BH38_20-30 BH38_50-60 BH38_90-100 BH39_0-10
Soil Soil Soil Soil Soil Soil
SLR Consulting
Australia Pty
Ltd
SLR Consulting
Australia Pty
Ltd
SLR Consulting
Australia Pty
Ltd
SLR Consulting
Australia Pty
Ltd
SLR Consulting
Australia Pty
Ltd
SLR Consulting
Australia Pty
Ltd
M4178/73 M4178/74 M4178/75 M4178/76 M4178/77 M4178/78
1.1 14 9.4 2.0 1.7 4.6
6.66 5.63 4.96 4.58 4.63 8.74
0.091 0.324 0.635 0.849 0.944 0.126
0.41 5.43 3.41 1.13 0.60 2.14
4.8 2.7 0.89 0.18 0.13 31
2,160 1,225 399 81 57 13,883
964 547 178 36 25 6,198
3.6 6.4 7.1 8.7 9.3 9.2
969 1,738 1,926 2,356 2,536 2,496
433 776 860 1,052 1,132 1,114
0.16 0.62 0.37 0.30 0.31 1.0
138 539 328 261 272 883
61 241 147 117 121 394
0.78 0.78 1.9 3.9 5.6 1.2
402 402 987 2,009 2,872 618
179 180 441 897 1,282 276
<0.01 0.02 0.29 0.48 0.48 <0.01
1.1 4.9 59 98 98 <1
<1 2.2 26 44 44 <1
<0.01 0.04 0.28 0.46 0.60 <0.01
<1 <1 6.2 10 14 <1
<1 <1 2.8 4.6 6.0 <1
9.3 11 11 14 16 42
52 26 8.2 1.3 0.77 73
38 60 65 62 57 22
1.7 5.8 3.5 2.1 1.9 2.4
8.4 7.4 18 28 34 2.8
0.06 0.23 2.7 3.5 3.0 0.00
0.00 0.36 2.6 3.3 3.7 0.00
1.4 0.43 0.13 0.02 0.01 3.4
0.24 3.10 1.95 0.65 0.34 1.22
0.08 0.22 0.17 0.11 0.03 0.06
2.8 14.4 11.8 5.8 13.8 20.3
58 207 406 543 604 81
Page 25 / 28

AGRICULTURAL SOIL ANALYSIS REPORT
81 samples supplied by SLR Consulting Australia Pty Ltd on 6/12/2021 . Lab Job No.M4178
Analysis requested by Alex Koeman. Your Job: PO: 620.30686
Level 2, 15 Astor Terrace BRISBANE QLD 4000
Sample ID:
Crop:
Client:
Method reference
**Rayment & Lyons 2011 - 9E2 (Bray 1)
Parameter
Phosphorus (mg/kg P)Notes: 1. All results presented as a 40°C oven dried weight. Soil sieved and lightly crushed to < 2 mm.
2. Methods from Rayment and Lyons, 2011. Soil Chemical Methods - Australasia. CSIRO Publishing: Collingwood.
3. Soluble Salts included in Exchangeable Cations - NO PRE-WASH (unless requested).
4. 'Morgan 1 Extract' adapted from 'Science in Agriculture', 'Non-Toxic Farming' and LaMotte Soil Handbook.
5. Guidelines for phosphorus have been reduced for Australian soils.
6. Indicative guidelines are based on 'Albrecht' and 'Reams' concepts.
7. Total Acid Extractable Nutrients indicate a store of nutrients.
8. National Environmental Protection (Assessment of Site Contamination) Measure 2013,
Schedule B(1) - Guideline on Investigation Levels for Soil and Groundwater. Table 5-A Background Ranges.
9. Information relating to testing colour codes is available on sheet 2 - 'Understanding your agricultural soil results'.
10. Conversions for 1 cmol+/kg = 230 mg/kg Sodium, 390 mg/kg Potassium,
122 mg/kg Magnesium, 200 mg/kg Calcium
11. Conversions to kg/ha = mg/kg x 2.24
12. The chloride calculation of Cl mg/L = EC x 640 is considered an estimate, and most likely an over-estimate
13. ** NATA accreditation does not cover the performance of this service.
14. Analysis conducted between sample arrival date and reporting date.
15. This report is not to be reproduced except in full. Results only relate to the item tested.
16. All services undertaken by EAL are covered by the EAL Laboratory Services Terms and Conditions (refer SCU.edu.au/eal/t&cs).
17. This report was issued on 14/12/2021.
Quality Checked: Kris SavilleAgricultural Co-Ordinator
Sample 73 Sample 74 Sample 75 Sample 76 Sample 77 Sample 78
BH36_90-100 BH38_0-10 BH38_20-30 BH38_50-60 BH38_90-100 BH39_0-10
Soil Soil Soil Soil Soil Soil
SLR Consulting
Australia Pty
Ltd
SLR Consulting
Australia Pty
Ltd
SLR Consulting
Australia Pty
Ltd
SLR Consulting
Australia Pty
Ltd
SLR Consulting
Australia Pty
Ltd
SLR Consulting
Australia Pty
Ltd
M4178/73 M4178/74 M4178/75 M4178/76 M4178/77 M4178/78
Page 26 / 28
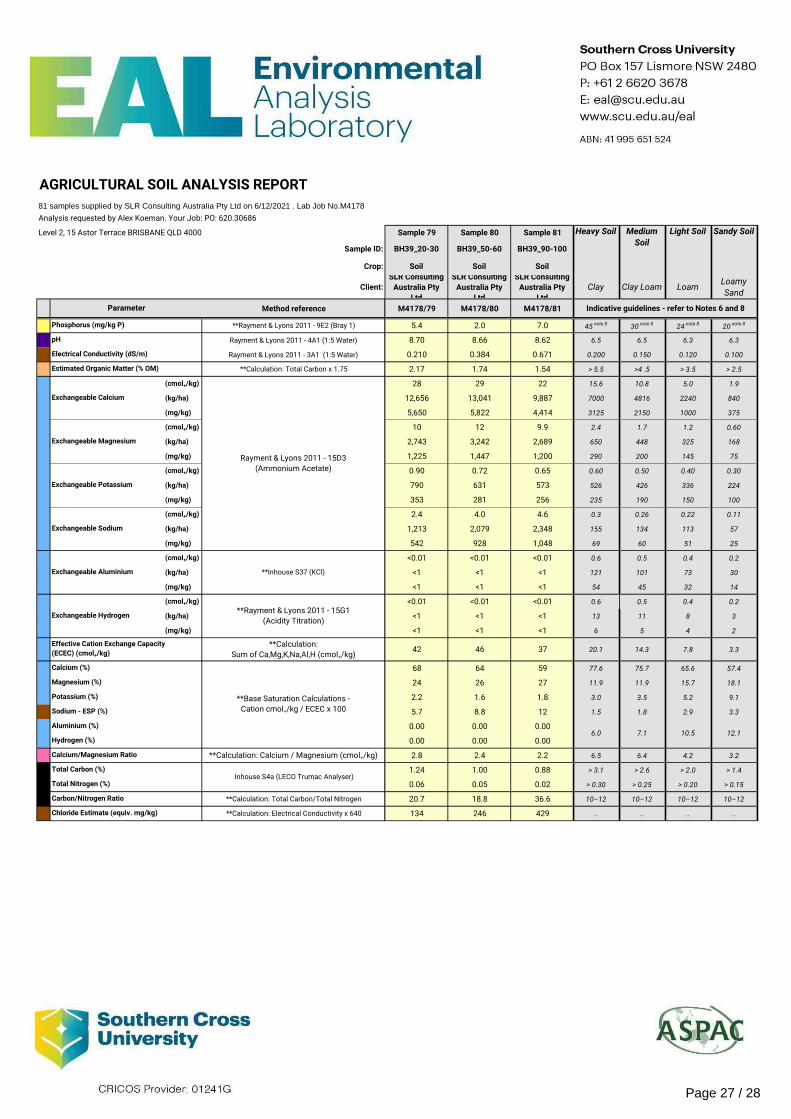
AGRICULTURAL SOIL ANALYSIS REPORT
81 samples supplied by SLR Consulting Australia Pty Ltd on 6/12/2021 . Lab Job No.M4178
Analysis requested by Alex Koeman. Your Job: PO: 620.30686
Level 2, 15 Astor Terrace BRISBANE QLD 4000
Sample ID:
Crop:
Client:
Method reference
**Rayment & Lyons 2011 - 9E2 (Bray 1)
Rayment & Lyons 2011 - 4A1 (1:5 Water)
Rayment & Lyons 2011 - 3A1 (1:5 Water)
**Calculation: Total Carbon x 1.75
(cmol+/kg)
(kg/ha)
(mg/kg)
(cmol+/kg)
(kg/ha)
(mg/kg)
(cmol+/kg)
(kg/ha)
(mg/kg)
(cmol+/kg)
(kg/ha)
(mg/kg)
(cmol+/kg)
(kg/ha)
(mg/kg)
(cmol+/kg)
(kg/ha)
(mg/kg)
**Calculation:
Sum of Ca,Mg,K,Na,Al,H (cmol+/kg)
**Calculation: Calcium / Magnesium (cmol+/kg)
**Calculation: Total Carbon/Total Nitrogen
**Calculation: Electrical Conductivity x 640
Parameter
Electrical Conductivity (dS/m)
Estimated Organic Matter (% OM)
Rayment & Lyons 2011 - 15D3
(Ammonium Acetate)
**Inhouse S37 (KCl)
Phosphorus (mg/kg P)
pH
Exchangeable Calcium
Exchangeable Magnesium
Exchangeable Potassium
Exchangeable Sodium
Exchangeable Aluminium
Potassium (%)
Sodium - ESP (%)
Aluminium (%)
Hydrogen (%)
Chloride Estimate (equiv. mg/kg)
**Rayment & Lyons 2011 - 15G1
(Acidity Titration)
Effective Cation Exchange Capacity
(ECEC) (cmol+/kg)
Calcium (%)
Magnesium (%)
Exchangeable Hydrogen
Total Carbon (%)
Total Nitrogen (%)
Carbon/Nitrogen Ratio
Calcium/Magnesium Ratio
Inhouse S4a (LECO Trumac Analyser)
**Base Saturation Calculations -
Cation cmol+/kg / ECEC x 100
Sample 79 Sample 80 Sample 81
BH39_20-30 BH39_50-60 BH39_90-100
Soil Soil Soil
SLR Consulting
Australia Pty
Ltd
SLR Consulting
Australia Pty
Ltd
SLR Consulting
Australia Pty
Ltd
Clay Clay Loam LoamLoamy
Sand
M4178/79 M4178/80 M4178/81
5.4 2.0 7.0 45 note 8 30 note 8 24 note 8 20 note 8
8.70 8.66 8.62 6.5 6.5 6.3 6.3
0.210 0.384 0.671 0.200 0.150 0.120 0.100
2.17 1.74 1.54 > 5.5 >4 .5 > 3.5 > 2.5
28 29 22 15.6 10.8 5.0 1.9
12,656 13,041 9,887 7000 4816 2240 840
5,650 5,822 4,414 3125 2150 1000 375
10 12 9.9 2.4 1.7 1.2 0.60
2,743 3,242 2,689 650 448 325 168
1,225 1,447 1,200 290 200 145 75
0.90 0.72 0.65 0.60 0.50 0.40 0.30
790 631 573 526 426 336 224
353 281 256 235 190 150 100
2.4 4.0 4.6 0.3 0.26 0.22 0.11
1,213 2,079 2,348 155 134 113 57
542 928 1,048 69 60 51 25
<0.01 <0.01 <0.01 0.6 0.5 0.4 0.2
<1 <1 <1 121 101 73 30
<1 <1 <1 54 45 32 14
<0.01 <0.01 <0.01 0.6 0.5 0.4 0.2
<1 <1 <1 13 11 8 3
<1 <1 <1 6 5 4 2
42 46 37 20.1 14.3 7.8 3.3
68 64 59 77.6 75.7 65.6 57.4
24 26 27 11.9 11.9 15.7 18.1
2.2 1.6 1.8 3.0 3.5 5.2 9.1
5.7 8.8 12 1.5 1.8 2.9 3.3
0.00 0.00 0.00
0.00 0.00 0.00
2.8 2.4 2.2 6.5 6.4 4.2 3.2
1.24 1.00 0.88 > 3.1 > 2.6 > 2.0 > 1.4
0.06 0.05 0.02 > 0.30 > 0.25 > 0.20 > 0.15
20.7 18.8 36.6 10–12 10–12 10–12 10–12
134 246 429 .. .. .. ..
Light Soil
Indicative guidelines - refer to Notes 6 and 8
Sandy SoilHeavy Soil Medium
Soil
6.0 12.17.1 10.5
Page 27 / 28
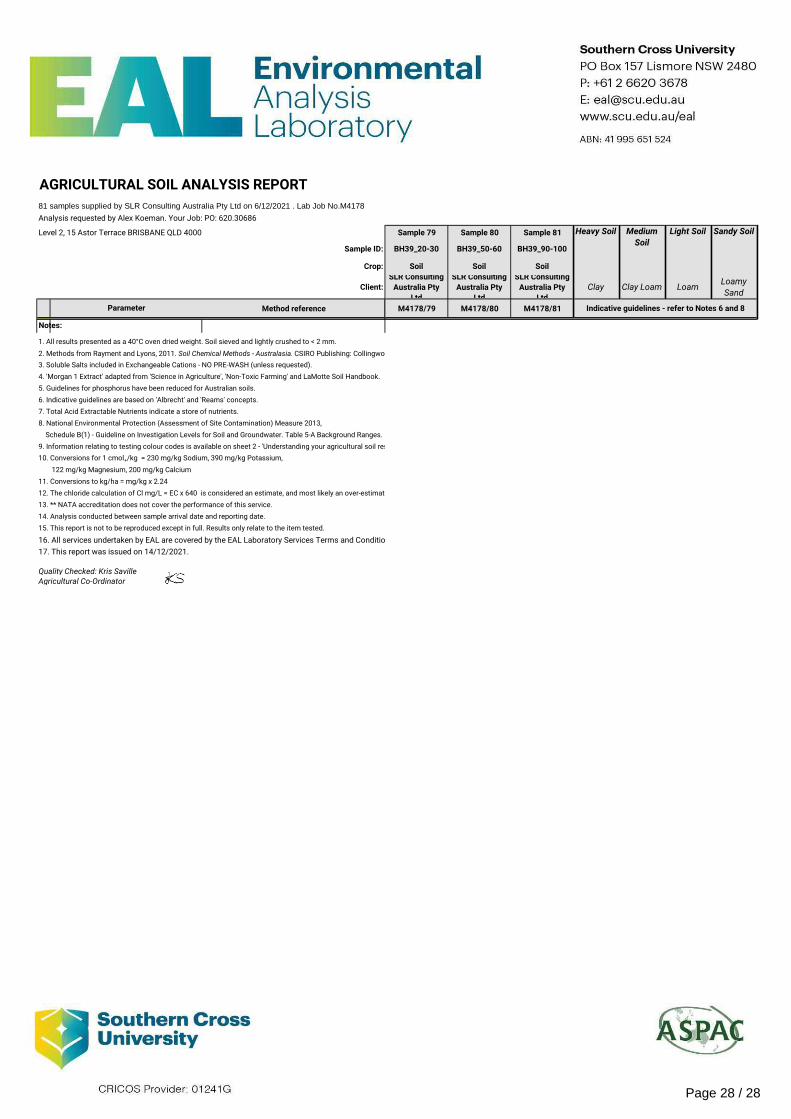
AGRICULTURAL SOIL ANALYSIS REPORT
81 samples supplied by SLR Consulting Australia Pty Ltd on 6/12/2021 . Lab Job No.M4178
Analysis requested by Alex Koeman. Your Job: PO: 620.30686
Level 2, 15 Astor Terrace BRISBANE QLD 4000
Sample ID:
Crop:
Client:
Method reference
**Rayment & Lyons 2011 - 9E2 (Bray 1)
Parameter
Phosphorus (mg/kg P)Notes: 1. All results presented as a 40°C oven dried weight. Soil sieved and lightly crushed to < 2 mm.
2. Methods from Rayment and Lyons, 2011. Soil Chemical Methods - Australasia. CSIRO Publishing: Collingwood.
3. Soluble Salts included in Exchangeable Cations - NO PRE-WASH (unless requested).
4. 'Morgan 1 Extract' adapted from 'Science in Agriculture', 'Non-Toxic Farming' and LaMotte Soil Handbook.
5. Guidelines for phosphorus have been reduced for Australian soils.
6. Indicative guidelines are based on 'Albrecht' and 'Reams' concepts.
7. Total Acid Extractable Nutrients indicate a store of nutrients.
8. National Environmental Protection (Assessment of Site Contamination) Measure 2013,
Schedule B(1) - Guideline on Investigation Levels for Soil and Groundwater. Table 5-A Background Ranges.
9. Information relating to testing colour codes is available on sheet 2 - 'Understanding your agricultural soil results'.
10. Conversions for 1 cmol+/kg = 230 mg/kg Sodium, 390 mg/kg Potassium,
122 mg/kg Magnesium, 200 mg/kg Calcium
11. Conversions to kg/ha = mg/kg x 2.24
12. The chloride calculation of Cl mg/L = EC x 640 is considered an estimate, and most likely an over-estimate
13. ** NATA accreditation does not cover the performance of this service.
14. Analysis conducted between sample arrival date and reporting date.
15. This report is not to be reproduced except in full. Results only relate to the item tested.
16. All services undertaken by EAL are covered by the EAL Laboratory Services Terms and Conditions (refer SCU.edu.au/eal/t&cs).
17. This report was issued on 14/12/2021.
Quality Checked: Kris SavilleAgricultural Co-Ordinator
Sample 79 Sample 80 Sample 81
BH39_20-30 BH39_50-60 BH39_90-100
Soil Soil Soil
SLR Consulting
Australia Pty
Ltd
SLR Consulting
Australia Pty
Ltd
SLR Consulting
Australia Pty
Ltd
Clay Clay Loam LoamLoamy
Sand
M4178/79 M4178/80 M4178/81
Light Soil
Indicative guidelines - refer to Notes 6 and 8
Sandy SoilHeavy Soil Medium
Soil
Page 28 / 28

Ensham Resources Pty Ltd Ensham Life of Mine Extension Project - Zones 2 and 3 Land Resources
SLR Ref No: 620.30686.00000-R01-v4.0-RevF.docx March 2022
620.30686.00000-R01-v4.0-RevF.docx Page 1
APPENDIX B
Detailed Profile Descriptions
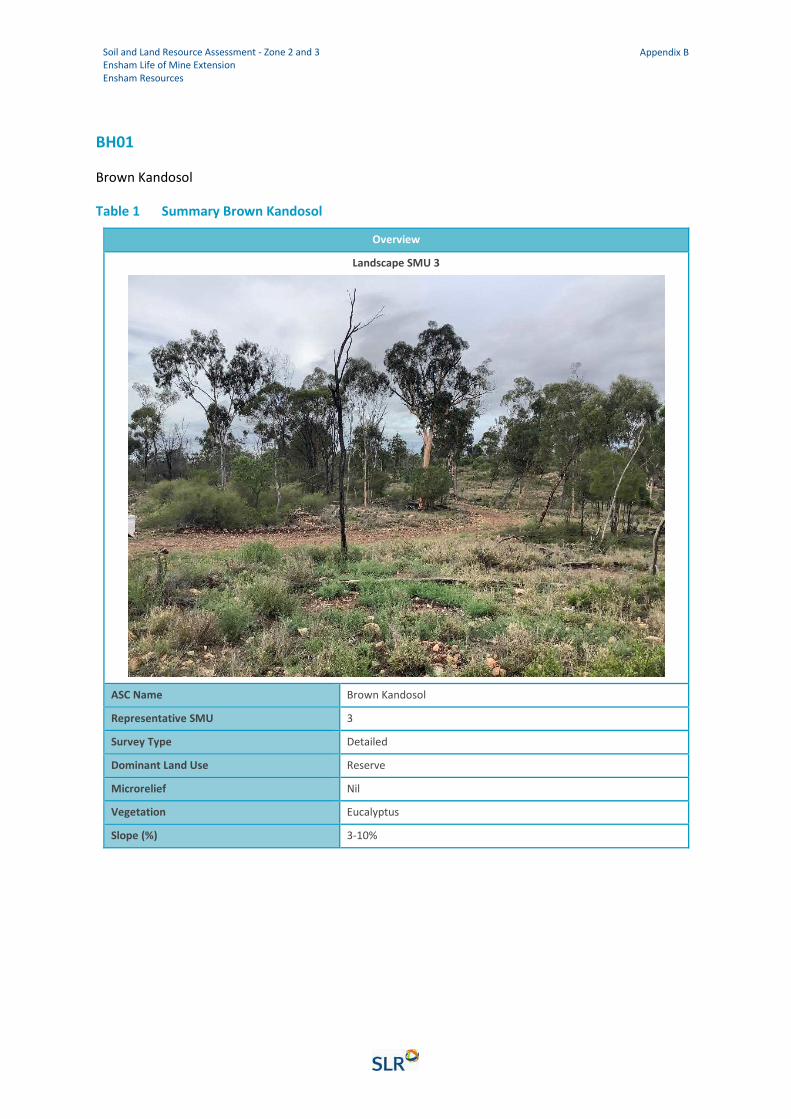
Soil and Land Resource Assessment - Zone 2 and 3 Ensham Life of Mine Extension Ensham Resources
Appendix B
BH01
Brown Kandosol
Table 1 Summary Brown Kandosol
Overview
Landscape SMU 3
ASC Name Brown Kandosol
Representative SMU 3
Survey Type Detailed
Dominant Land Use Reserve
Microrelief Nil
Vegetation Eucalyptus
Slope (%) 3-10%
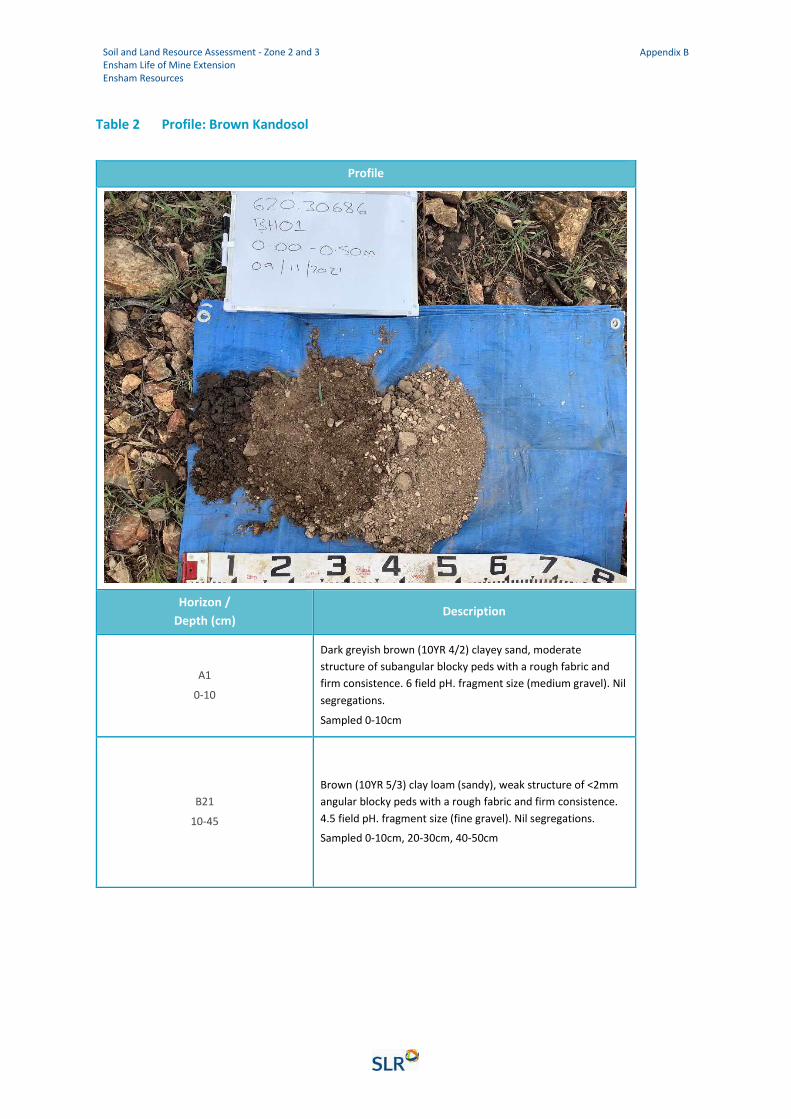
Soil and Land Resource Assessment - Zone 2 and 3 Ensham Life of Mine Extension Ensham Resources
Appendix B
Table 2 Profile: Brown Kandosol
Profile
Horizon /
Depth (cm) Description
A1
0-10
Dark greyish brown (10YR 4/2) clayey sand, moderate
structure of subangular blocky peds with a rough fabric and
firm consistence. 6 field pH. fragment size (medium gravel). Nil
segregations.
Sampled 0-10cm
B21
10-45
Brown (10YR 5/3) clay loam (sandy), weak structure of <2mm
angular blocky peds with a rough fabric and firm consistence.
4.5 field pH. fragment size (fine gravel). Nil segregations.
Sampled 0-10cm, 20-30cm, 40-50cm

Soil and Land Resource Assessment - Zone 2 and 3 Ensham Life of Mine Extension Ensham Resources
Appendix B
Profile
45-60cm
Pale brown (10YR 5/3) clayey sand, weak structure of <2mm
angular blocky peds with a rough fabric and a firm consistence.
4 field pH. fragment size (fine gravel). Nil segregations.
Sampled 40-50cm, 50-60cm
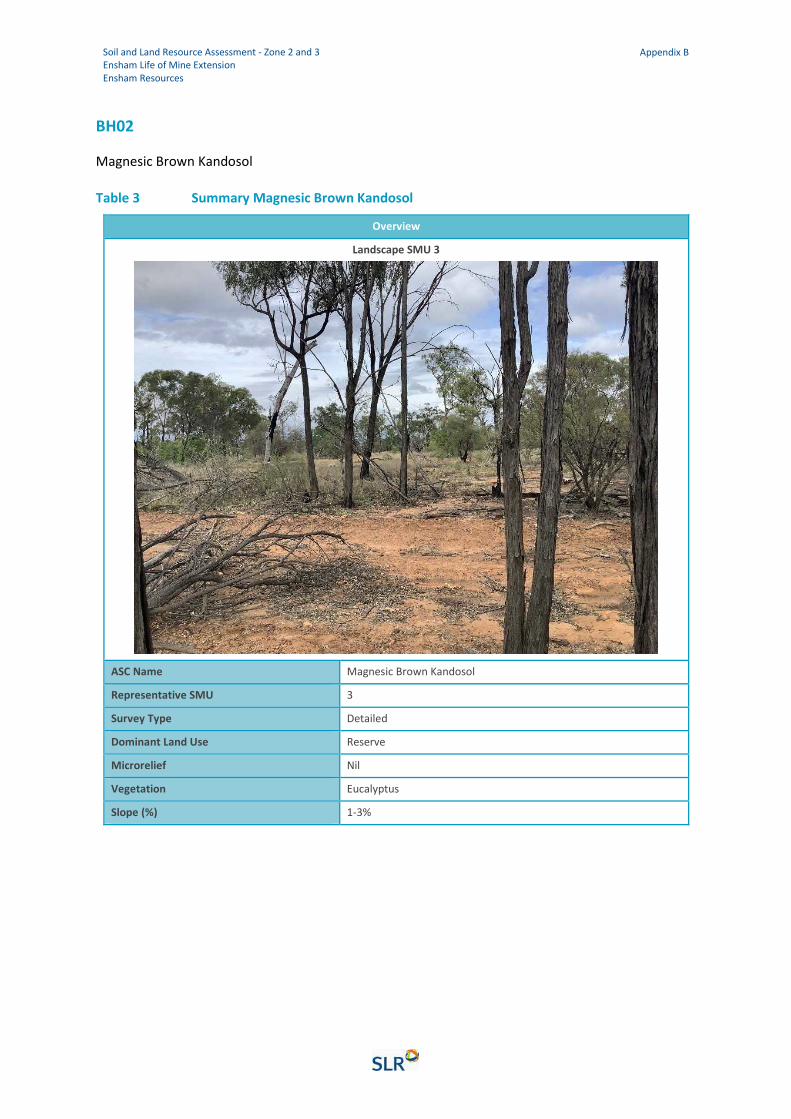
Soil and Land Resource Assessment - Zone 2 and 3 Ensham Life of Mine Extension Ensham Resources
Appendix B
BH02
Magnesic Brown Kandosol
Table 3 Summary Magnesic Brown Kandosol
Overview
Landscape SMU 3
ASC Name Magnesic Brown Kandosol
Representative SMU 3
Survey Type Detailed
Dominant Land Use Reserve
Microrelief Nil
Vegetation Eucalyptus
Slope (%) 1-3%
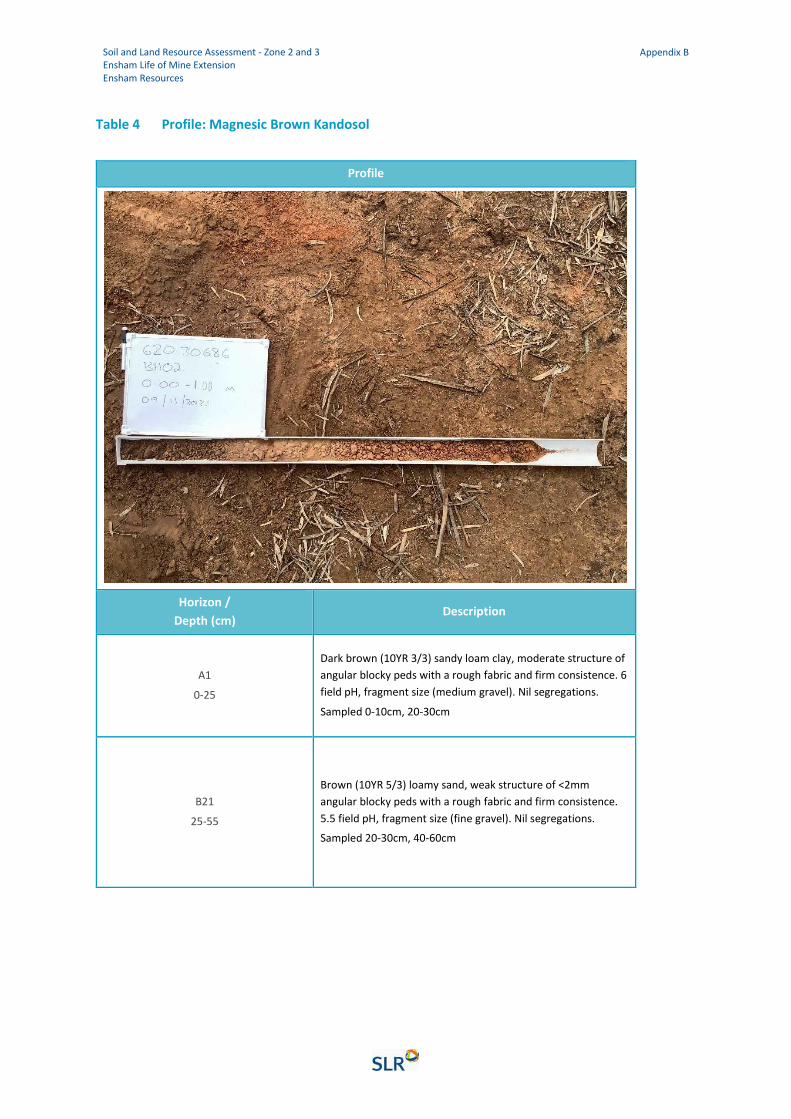
Soil and Land Resource Assessment - Zone 2 and 3 Ensham Life of Mine Extension Ensham Resources
Appendix B
Table 4 Profile: Magnesic Brown Kandosol
Profile
Horizon /
Depth (cm) Description
A1
0-25
Dark brown (10YR 3/3) sandy loam clay, moderate structure of
angular blocky peds with a rough fabric and firm consistence. 6
field pH, fragment size (medium gravel). Nil segregations.
Sampled 0-10cm, 20-30cm
B21
25-55
Brown (10YR 5/3) loamy sand, weak structure of <2mm
angular blocky peds with a rough fabric and firm consistence.
5.5 field pH, fragment size (fine gravel). Nil segregations.
Sampled 20-30cm, 40-60cm

Soil and Land Resource Assessment - Zone 2 and 3 Ensham Life of Mine Extension Ensham Resources
Appendix B
Profile
B22
55cm – 1m
Strong brown (7.5YR 5/6) sandy loam, weak structure of
angular blocky peds with a rough fabric and firm consistence. 5
field pH, fragment size (fine gravel). Nil segregations.
Sampled 40-60cm, 70-90cm, 1m+
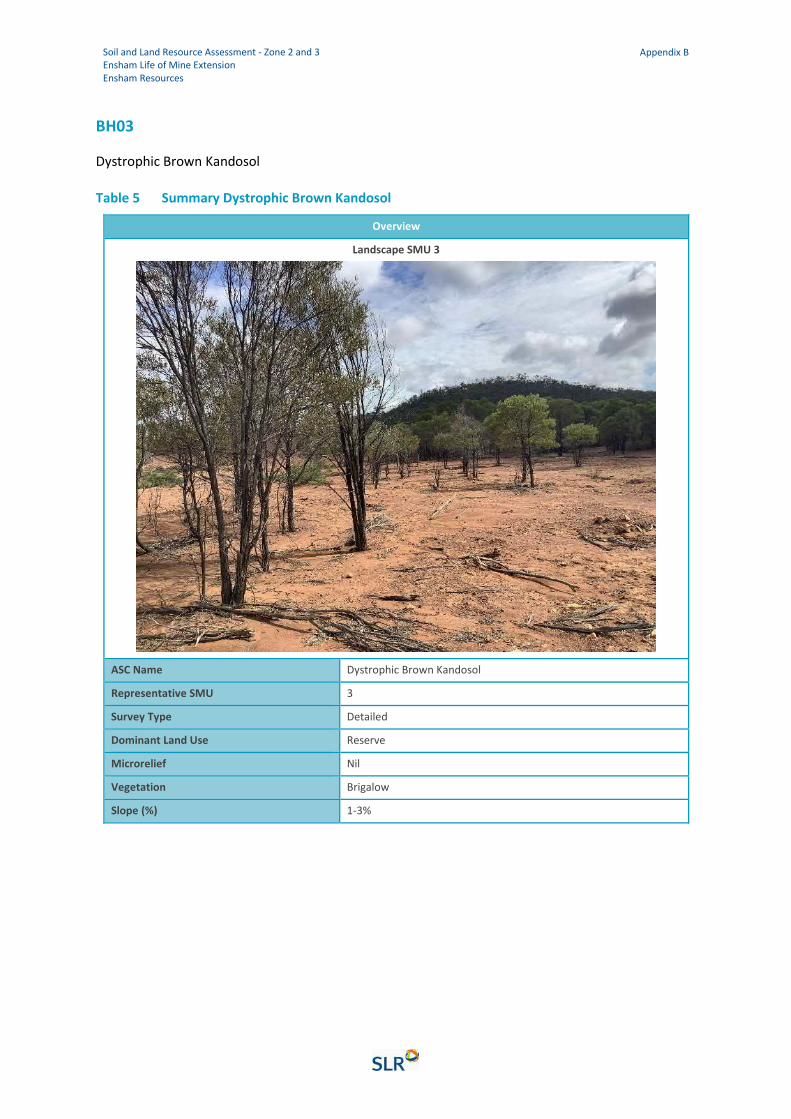
Soil and Land Resource Assessment - Zone 2 and 3 Ensham Life of Mine Extension Ensham Resources
Appendix B
BH03
Dystrophic Brown Kandosol
Table 5 Summary Dystrophic Brown Kandosol
Overview
Landscape SMU 3
ASC Name Dystrophic Brown Kandosol
Representative SMU 3
Survey Type Detailed
Dominant Land Use Reserve
Microrelief Nil
Vegetation Brigalow
Slope (%) 1-3%
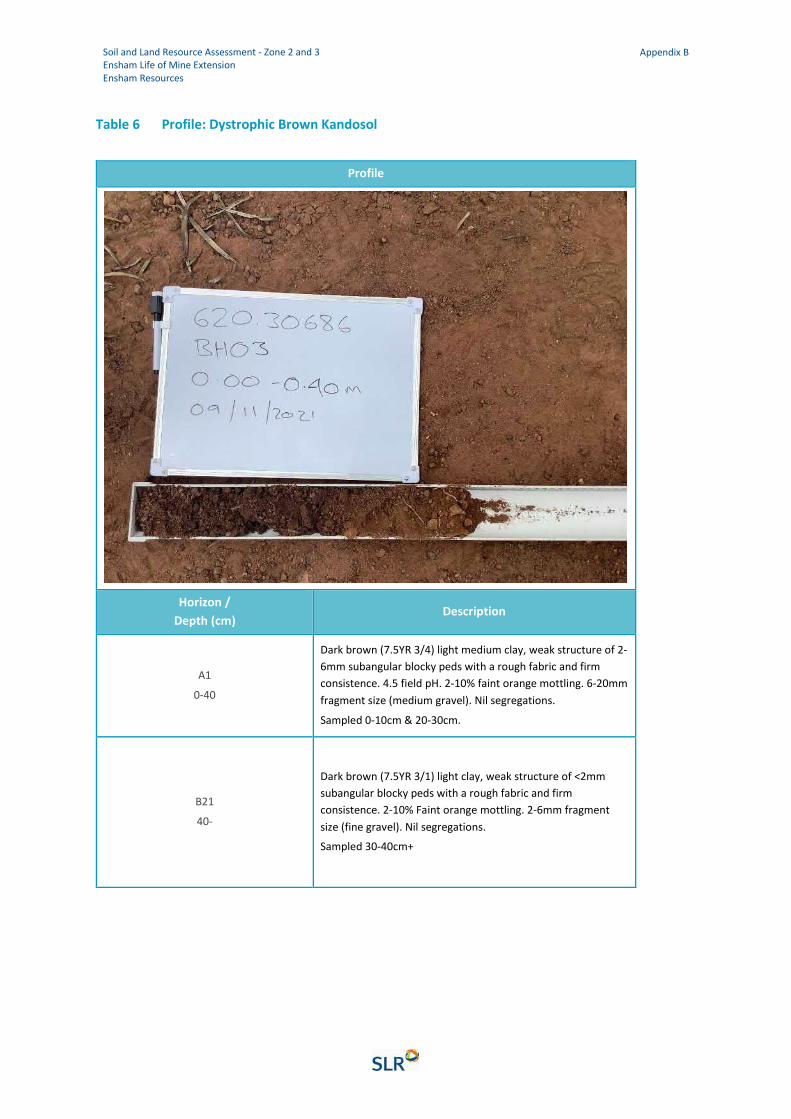
Soil and Land Resource Assessment - Zone 2 and 3 Ensham Life of Mine Extension Ensham Resources
Appendix B
Table 6 Profile: Dystrophic Brown Kandosol
Profile
Horizon /
Depth (cm) Description
A1
0-40
Dark brown (7.5YR 3/4) light medium clay, weak structure of 2-
6mm subangular blocky peds with a rough fabric and firm
consistence. 4.5 field pH. 2-10% faint orange mottling. 6-20mm
fragment size (medium gravel). Nil segregations.
Sampled 0-10cm & 20-30cm.
B21
40-
Dark brown (7.5YR 3/1) light clay, weak structure of <2mm
subangular blocky peds with a rough fabric and firm
consistence. 2-10% Faint orange mottling. 2-6mm fragment
size (fine gravel). Nil segregations.
Sampled 30-40cm+
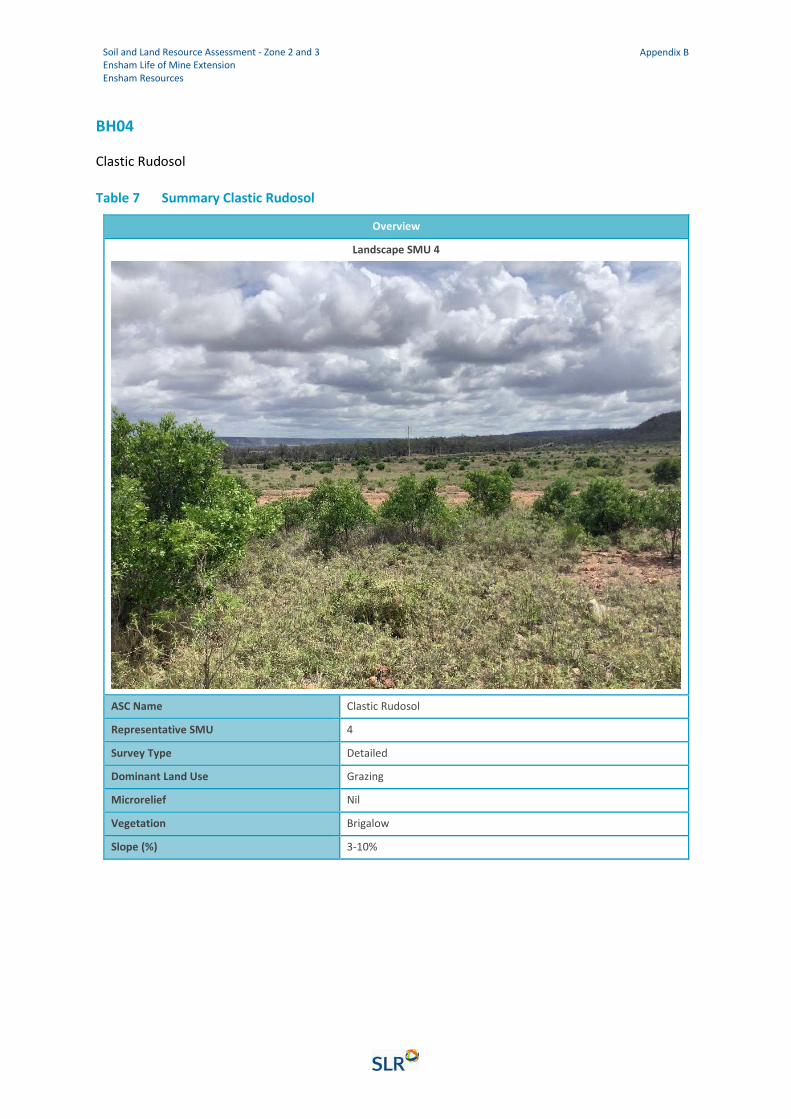
Soil and Land Resource Assessment - Zone 2 and 3 Ensham Life of Mine Extension Ensham Resources
Appendix B
BH04
Clastic Rudosol
Table 7 Summary Clastic Rudosol
Overview
Landscape SMU 4
ASC Name Clastic Rudosol
Representative SMU 4
Survey Type Detailed
Dominant Land Use Grazing
Microrelief Nil
Vegetation Brigalow
Slope (%) 3-10%
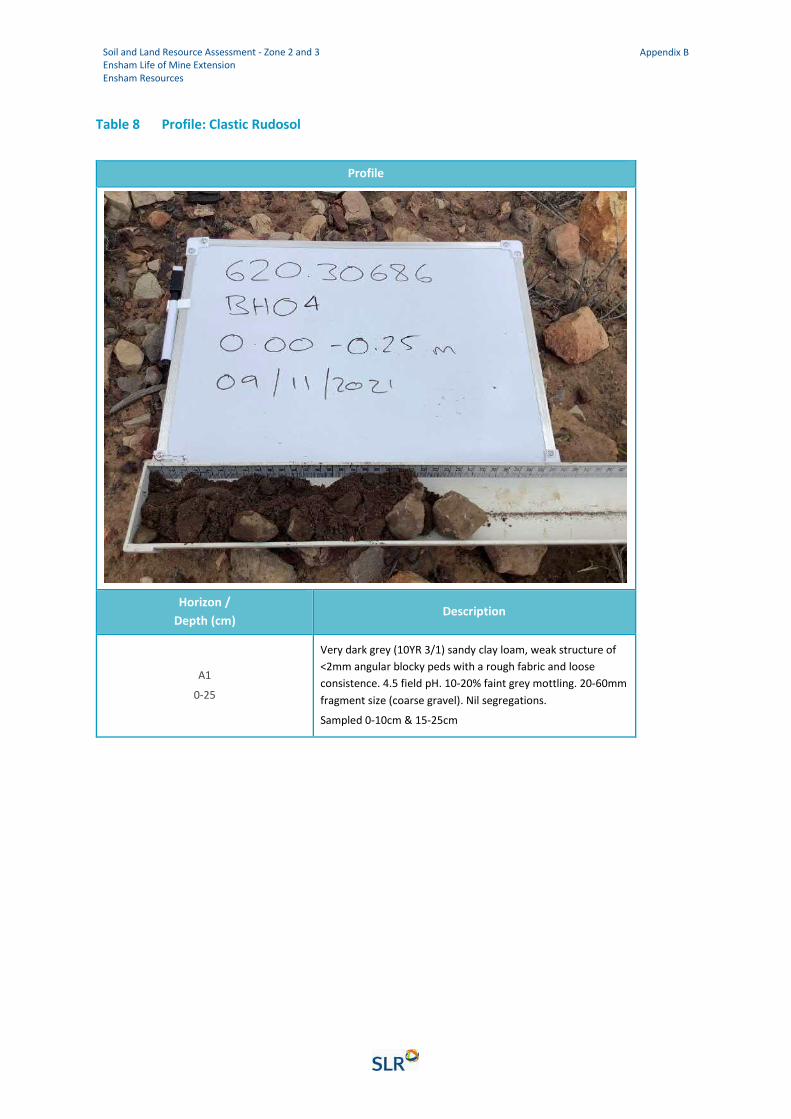
Soil and Land Resource Assessment - Zone 2 and 3 Ensham Life of Mine Extension Ensham Resources
Appendix B
Table 8 Profile: Clastic Rudosol
Profile
Horizon /
Depth (cm) Description
A1
0-25
Very dark grey (10YR 3/1) sandy clay loam, weak structure of
<2mm angular blocky peds with a rough fabric and loose
consistence. 4.5 field pH. 10-20% faint grey mottling. 20-60mm
fragment size (coarse gravel). Nil segregations.
Sampled 0-10cm & 15-25cm
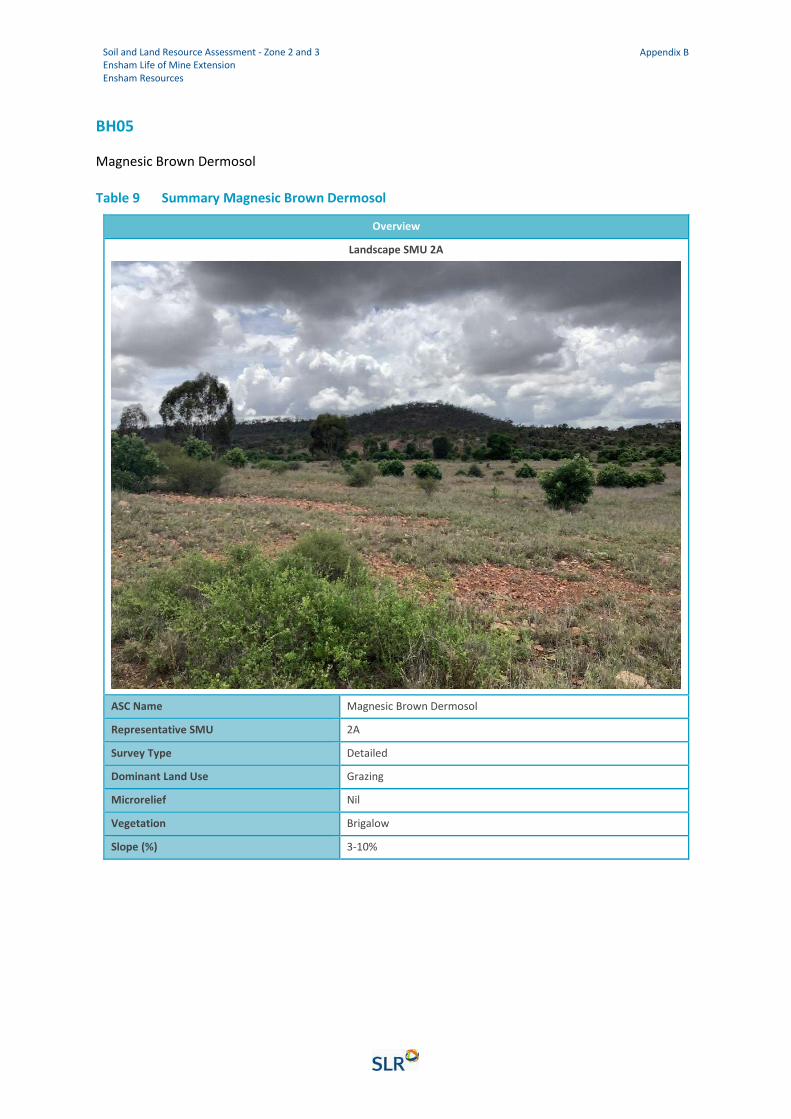
Soil and Land Resource Assessment - Zone 2 and 3 Ensham Life of Mine Extension Ensham Resources
Appendix B
BH05
Magnesic Brown Dermosol
Table 9 Summary Magnesic Brown Dermosol
Overview
Landscape SMU 2A
ASC Name Magnesic Brown Dermosol
Representative SMU 2A
Survey Type Detailed
Dominant Land Use Grazing
Microrelief Nil
Vegetation Brigalow
Slope (%) 3-10%
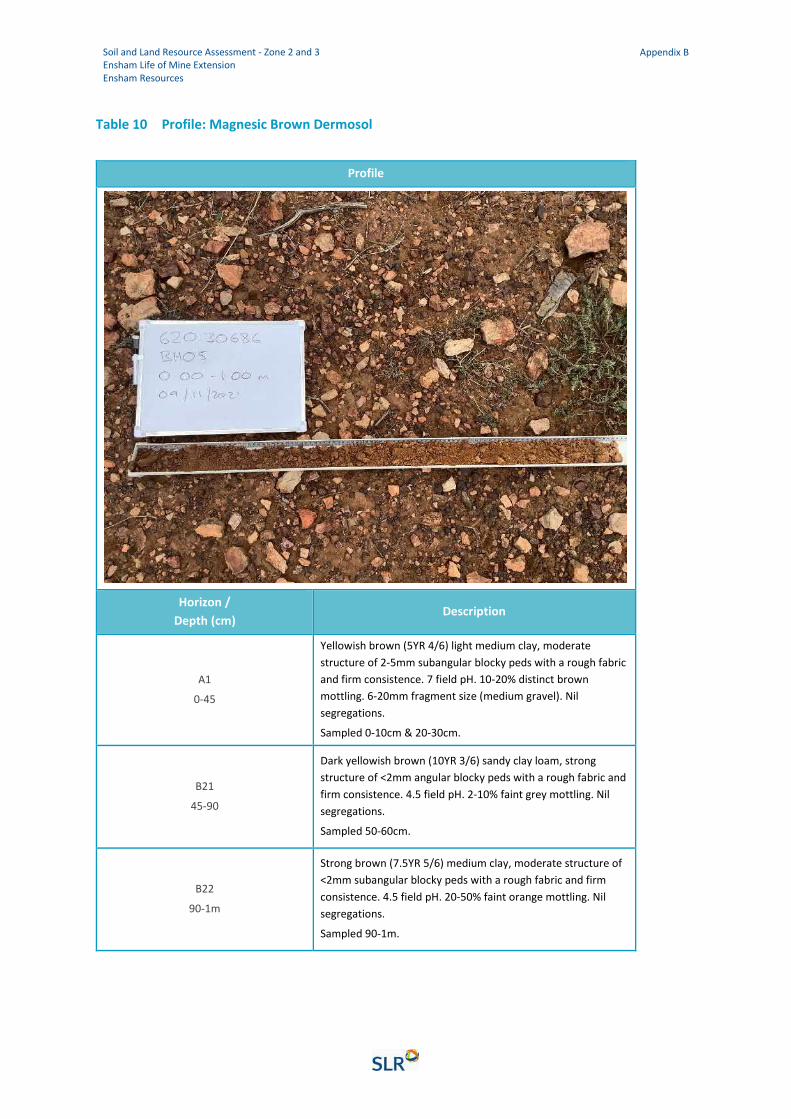
Soil and Land Resource Assessment - Zone 2 and 3 Ensham Life of Mine Extension Ensham Resources
Appendix B
Table 10 Profile: Magnesic Brown Dermosol
Profile
Horizon /
Depth (cm) Description
A1
0-45
Yellowish brown (5YR 4/6) light medium clay, moderate
structure of 2-5mm subangular blocky peds with a rough fabric
and firm consistence. 7 field pH. 10-20% distinct brown
mottling. 6-20mm fragment size (medium gravel). Nil
segregations.
Sampled 0-10cm & 20-30cm.
B21
45-90
Dark yellowish brown (10YR 3/6) sandy clay loam, strong
structure of <2mm angular blocky peds with a rough fabric and
firm consistence. 4.5 field pH. 2-10% faint grey mottling. Nil
segregations.
Sampled 50-60cm.
B22
90-1m
Strong brown (7.5YR 5/6) medium clay, moderate structure of
<2mm subangular blocky peds with a rough fabric and firm
consistence. 4.5 field pH. 20-50% faint orange mottling. Nil
segregations.
Sampled 90-1m.

Soil and Land Resource Assessment - Zone 2 and 3 Ensham Life of Mine Extension Ensham Resources
Appendix B
Profile
B23
100-
Light brownish grey (10YR 6/2) medium clay, moderate
structure of <2mm subangular blocky peds with a rough fabric
and firm consistence. 4.5 field pH. 20-50% distinct red
mottling. Nil segregations.
Sampled 1m.
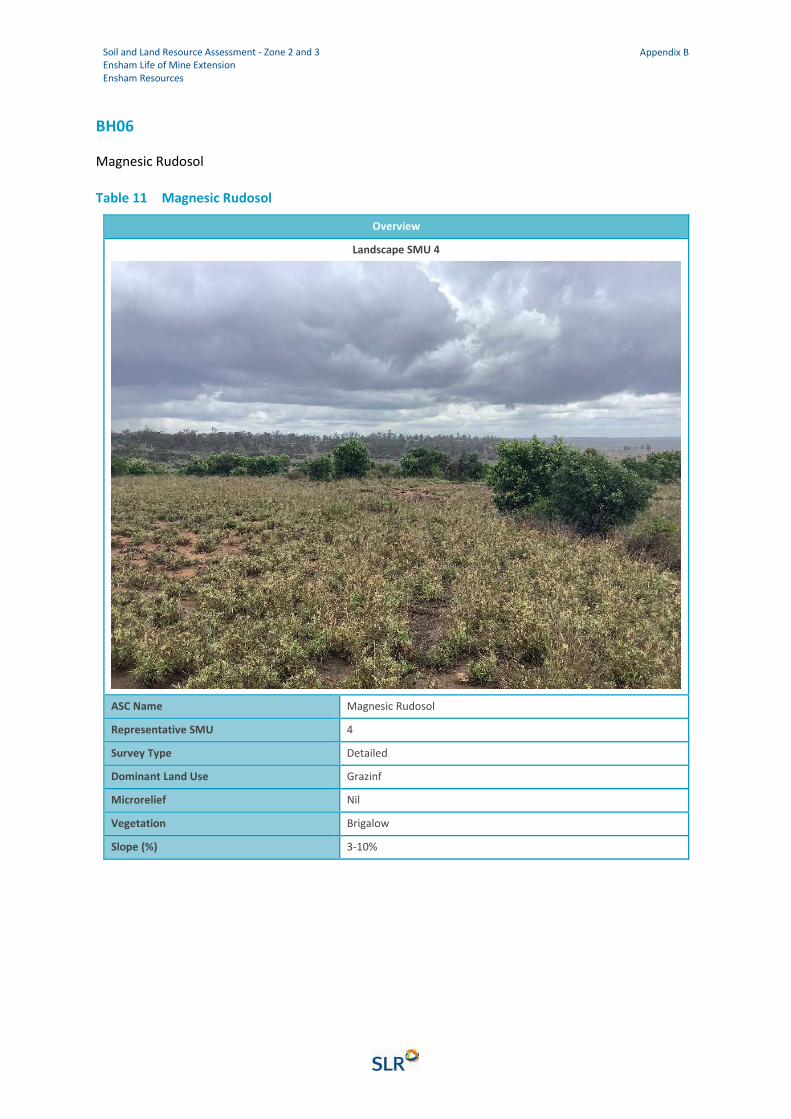
Soil and Land Resource Assessment - Zone 2 and 3 Ensham Life of Mine Extension Ensham Resources
Appendix B
BH06
Magnesic Rudosol
Table 11 Magnesic Rudosol
Overview
Landscape SMU 4
ASC Name Magnesic Rudosol
Representative SMU 4
Survey Type Detailed
Dominant Land Use Grazinf
Microrelief Nil
Vegetation Brigalow
Slope (%) 3-10%
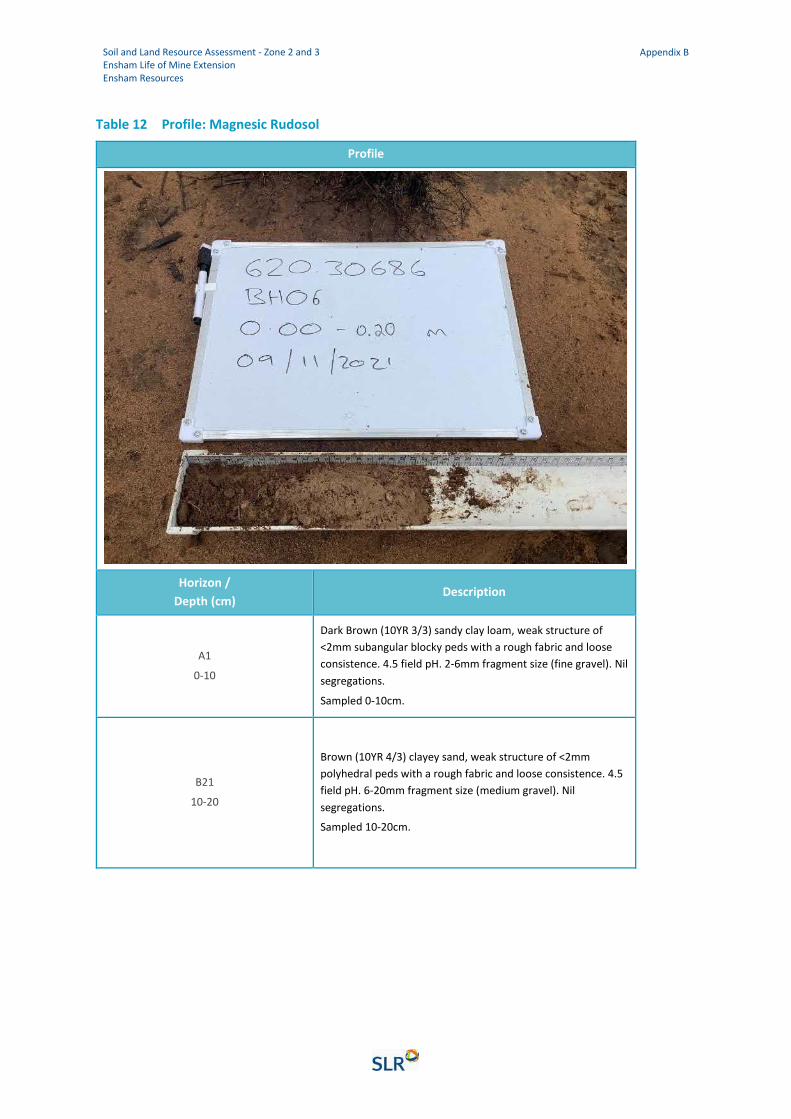
Soil and Land Resource Assessment - Zone 2 and 3 Ensham Life of Mine Extension Ensham Resources
Appendix B
Table 12 Profile: Magnesic Rudosol
Profile
Horizon /
Depth (cm) Description
A1
0-10
Dark Brown (10YR 3/3) sandy clay loam, weak structure of
<2mm subangular blocky peds with a rough fabric and loose
consistence. 4.5 field pH. 2-6mm fragment size (fine gravel). Nil
segregations.
Sampled 0-10cm.
B21
10-20
Brown (10YR 4/3) clayey sand, weak structure of <2mm
polyhedral peds with a rough fabric and loose consistence. 4.5
field pH. 6-20mm fragment size (medium gravel). Nil
segregations.
Sampled 10-20cm.
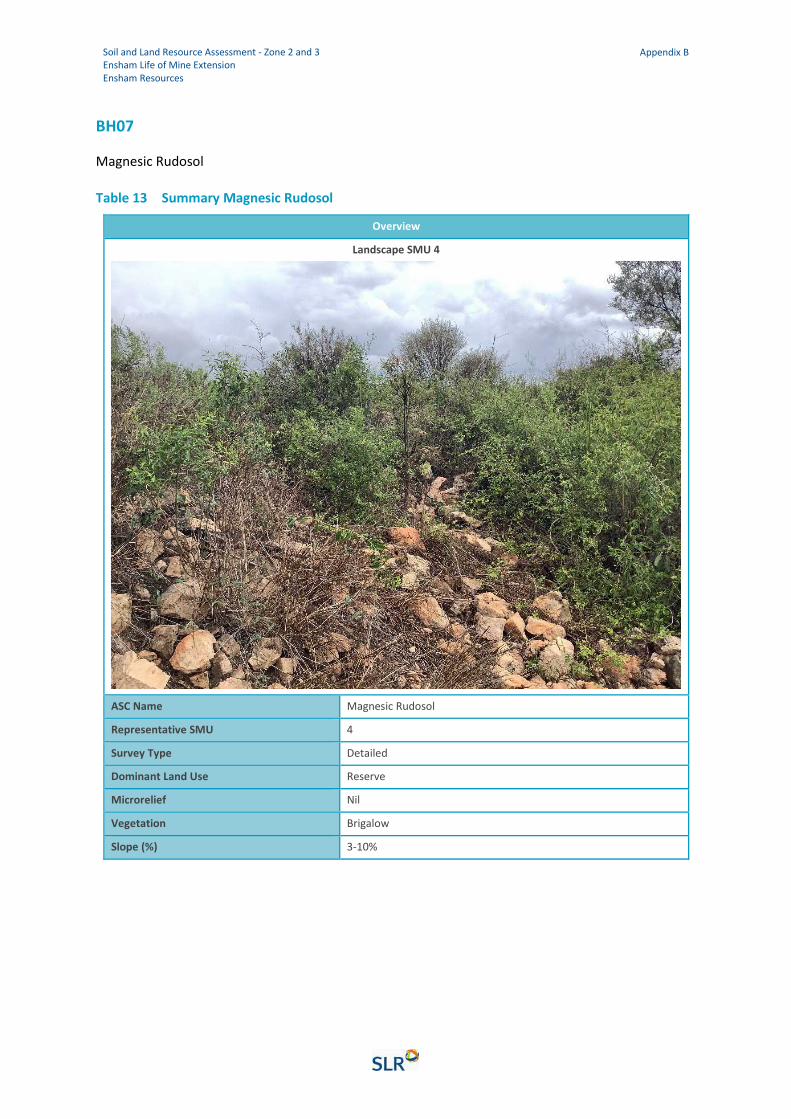
Soil and Land Resource Assessment - Zone 2 and 3 Ensham Life of Mine Extension Ensham Resources
Appendix B
BH07
Magnesic Rudosol
Table 13 Summary Magnesic Rudosol
Overview
Landscape SMU 4
ASC Name Magnesic Rudosol
Representative SMU 4
Survey Type Detailed
Dominant Land Use Reserve
Microrelief Nil
Vegetation Brigalow
Slope (%) 3-10%
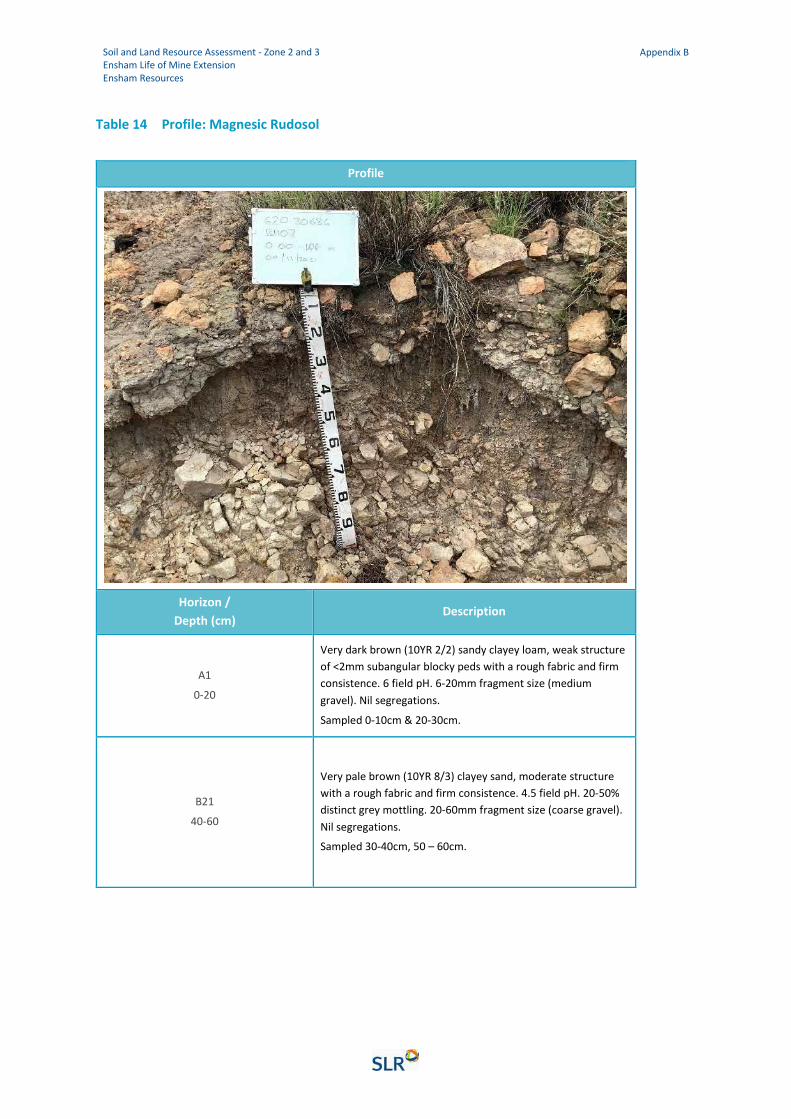
Soil and Land Resource Assessment - Zone 2 and 3 Ensham Life of Mine Extension Ensham Resources
Appendix B
Table 14 Profile: Magnesic Rudosol
Profile
Horizon /
Depth (cm) Description
A1
0-20
Very dark brown (10YR 2/2) sandy clayey loam, weak structure
of <2mm subangular blocky peds with a rough fabric and firm
consistence. 6 field pH. 6-20mm fragment size (medium
gravel). Nil segregations.
Sampled 0-10cm & 20-30cm.
B21
40-60
Very pale brown (10YR 8/3) clayey sand, moderate structure
with a rough fabric and firm consistence. 4.5 field pH. 20-50%
distinct grey mottling. 20-60mm fragment size (coarse gravel).
Nil segregations.
Sampled 30-40cm, 50 – 60cm.
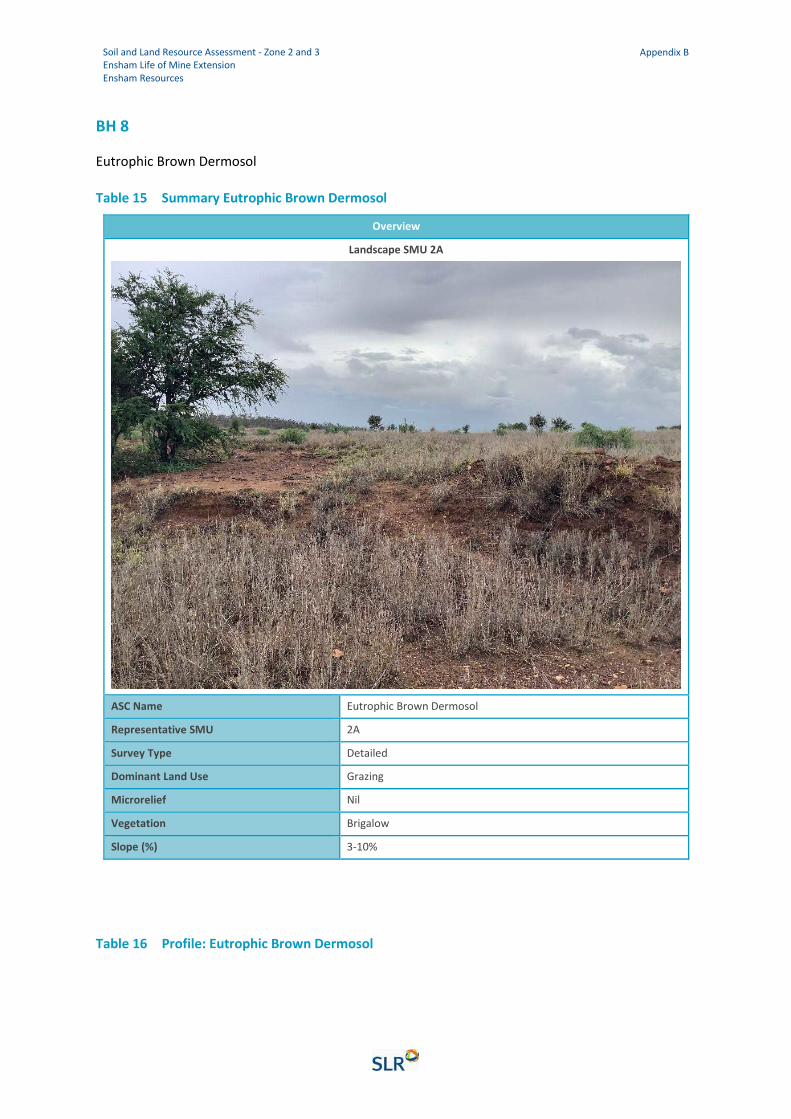
Soil and Land Resource Assessment - Zone 2 and 3 Ensham Life of Mine Extension Ensham Resources
Appendix B
BH 8
Eutrophic Brown Dermosol
Table 15 Summary Eutrophic Brown Dermosol
Overview
Landscape SMU 2A
ASC Name Eutrophic Brown Dermosol
Representative SMU 2A
Survey Type Detailed
Dominant Land Use Grazing
Microrelief Nil
Vegetation Brigalow
Slope (%) 3-10%
Table 16 Profile: Eutrophic Brown Dermosol
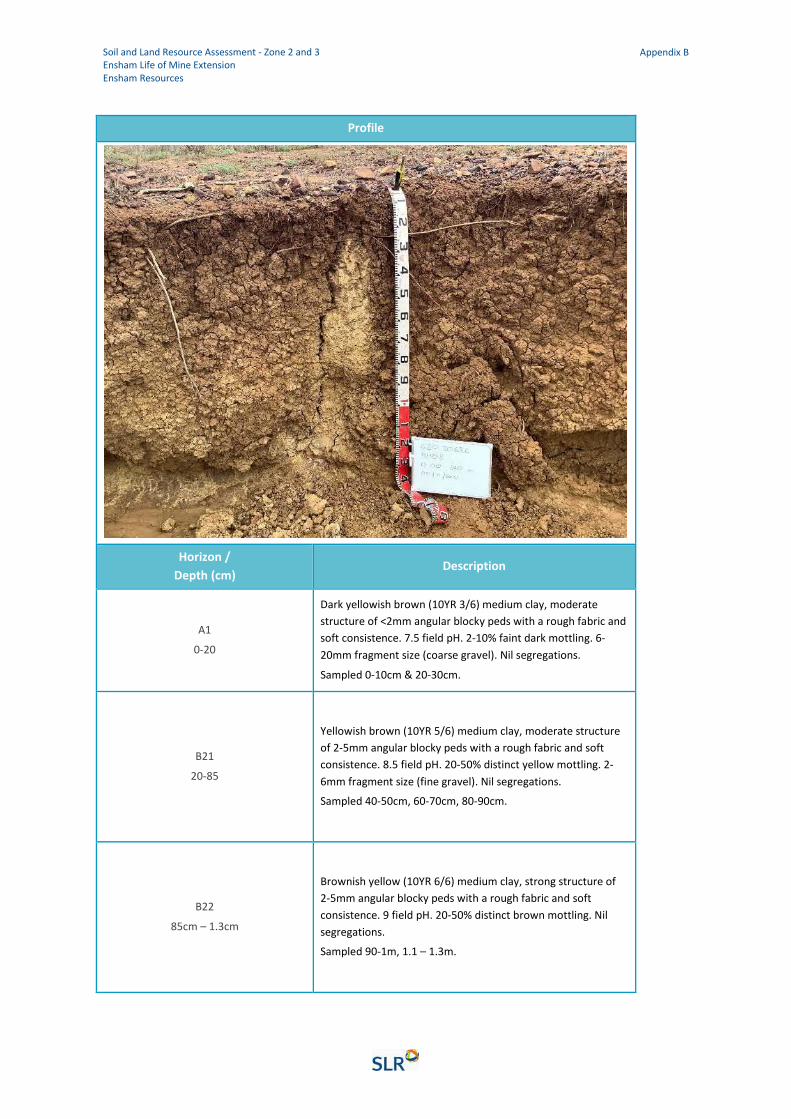
Soil and Land Resource Assessment - Zone 2 and 3 Ensham Life of Mine Extension Ensham Resources
Appendix B
Profile
Horizon /
Depth (cm) Description
A1
0-20
Dark yellowish brown (10YR 3/6) medium clay, moderate
structure of <2mm angular blocky peds with a rough fabric and
soft consistence. 7.5 field pH. 2-10% faint dark mottling. 6-
20mm fragment size (coarse gravel). Nil segregations.
Sampled 0-10cm & 20-30cm.
B21
20-85
Yellowish brown (10YR 5/6) medium clay, moderate structure
of 2-5mm angular blocky peds with a rough fabric and soft
consistence. 8.5 field pH. 20-50% distinct yellow mottling. 2-
6mm fragment size (fine gravel). Nil segregations.
Sampled 40-50cm, 60-70cm, 80-90cm.
B22
85cm – 1.3cm
Brownish yellow (10YR 6/6) medium clay, strong structure of
2-5mm angular blocky peds with a rough fabric and soft
consistence. 9 field pH. 20-50% distinct brown mottling. Nil
segregations.
Sampled 90-1m, 1.1 – 1.3m.

Soil and Land Resource Assessment - Zone 2 and 3 Ensham Life of Mine Extension Ensham Resources
Appendix B
Profile
B23
1.3 – 1.5
Light grey (10YR 7/2) medium heavy clay, moderate structure
of <2mm subangular blocky peds with a rough fabric and soft
consistence. 6 field pH. 50-90% prominent other mottling. Nil
segregations.
Sampled 1.1 – 1.3m, 1.3 – 1.5m.
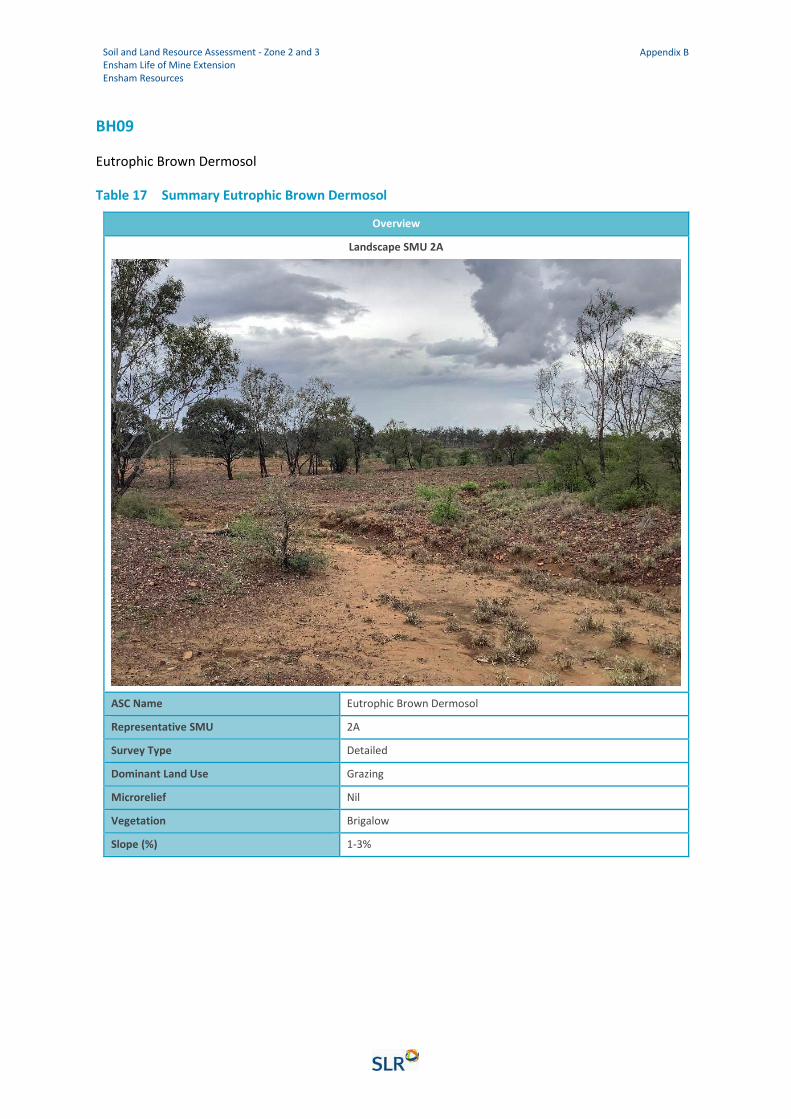
Soil and Land Resource Assessment - Zone 2 and 3 Ensham Life of Mine Extension Ensham Resources
Appendix B
BH09
Eutrophic Brown Dermosol
Table 17 Summary Eutrophic Brown Dermosol
Overview
Landscape SMU 2A
ASC Name Eutrophic Brown Dermosol
Representative SMU 2A
Survey Type Detailed
Dominant Land Use Grazing
Microrelief Nil
Vegetation Brigalow
Slope (%) 1-3%
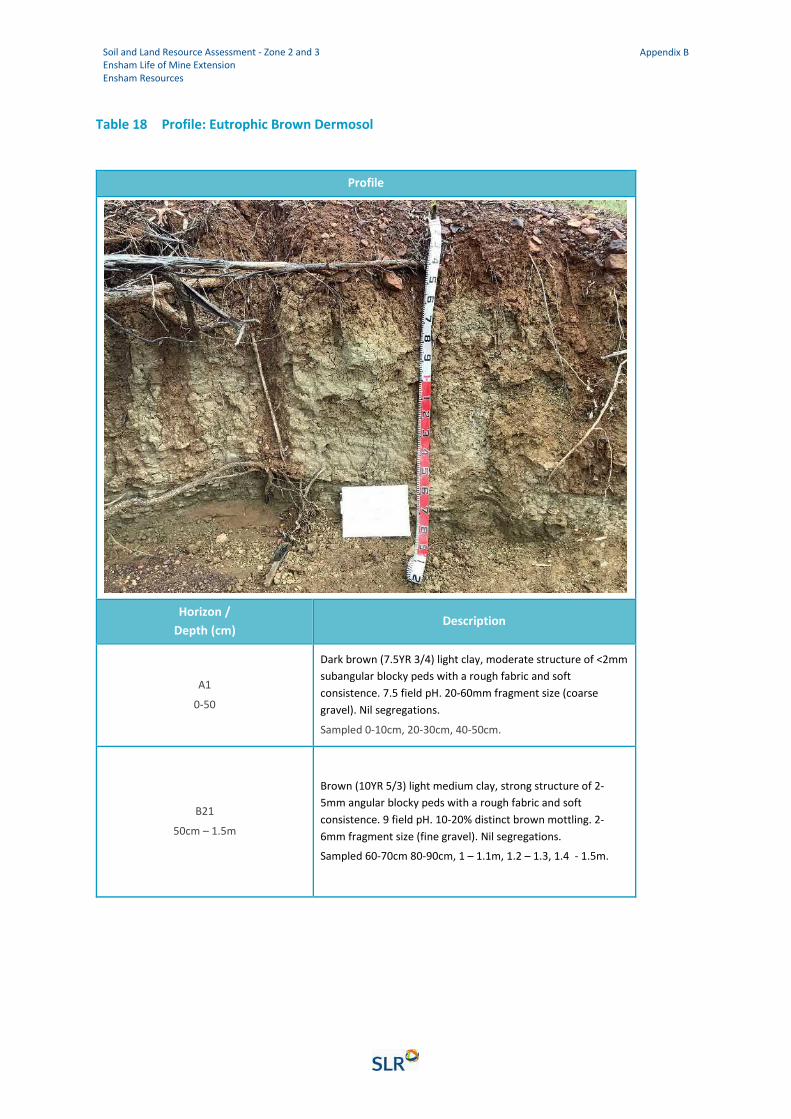
Soil and Land Resource Assessment - Zone 2 and 3 Ensham Life of Mine Extension Ensham Resources
Appendix B
Table 18 Profile: Eutrophic Brown Dermosol
Profile
Horizon /
Depth (cm) Description
A1
0-50
Dark brown (7.5YR 3/4) light clay, moderate structure of <2mm
subangular blocky peds with a rough fabric and soft
consistence. 7.5 field pH. 20-60mm fragment size (coarse
gravel). Nil segregations.
Sampled 0-10cm, 20-30cm, 40-50cm.
B21
50cm – 1.5m
Brown (10YR 5/3) light medium clay, strong structure of 2-
5mm angular blocky peds with a rough fabric and soft
consistence. 9 field pH. 10-20% distinct brown mottling. 2-
6mm fragment size (fine gravel). Nil segregations.
Sampled 60-70cm 80-90cm, 1 – 1.1m, 1.2 – 1.3, 1.4 - 1.5m.

Soil and Land Resource Assessment - Zone 2 and 3 Ensham Life of Mine Extension Ensham Resources
Appendix B
Profile
B22
1.5 – 1.8m
Dark greyish brown (2.5YR 4/2) clay loam (sandy), strong
structure of <2mm angular blocky peds with a rough fabric and
soft consistence. 9 field pH. Nil segregations.
Sampled 1.5 – 1.6m, 1.7 – 1.8m.
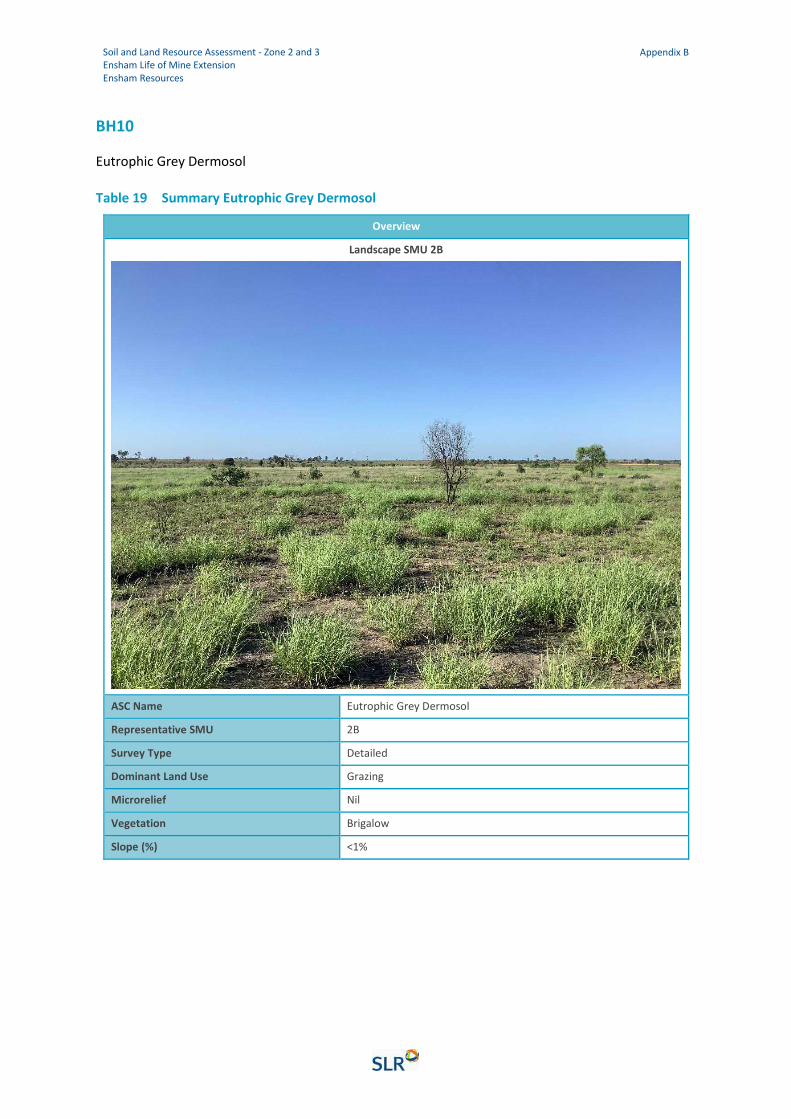
Soil and Land Resource Assessment - Zone 2 and 3 Ensham Life of Mine Extension Ensham Resources
Appendix B
BH10
Eutrophic Grey Dermosol
Table 19 Summary Eutrophic Grey Dermosol
Overview
Landscape SMU 2B
ASC Name Eutrophic Grey Dermosol
Representative SMU 2B
Survey Type Detailed
Dominant Land Use Grazing
Microrelief Nil
Vegetation Brigalow
Slope (%) <1%
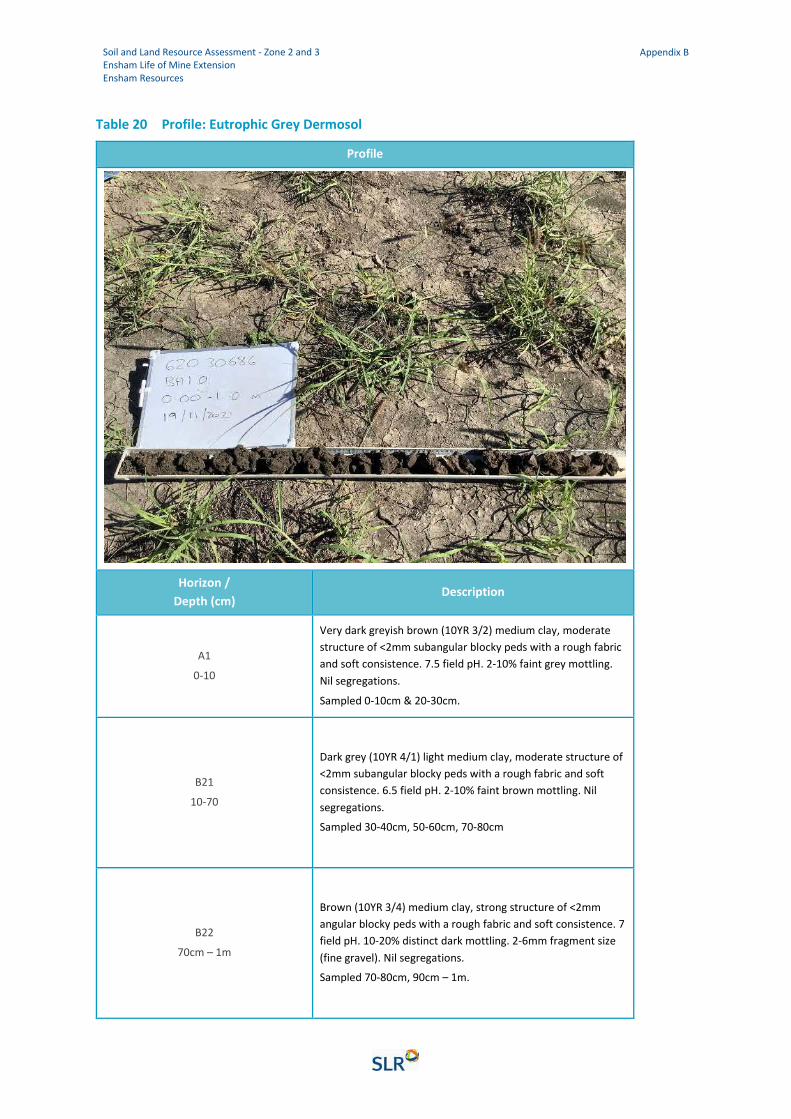
Soil and Land Resource Assessment - Zone 2 and 3 Ensham Life of Mine Extension Ensham Resources
Appendix B
Table 20 Profile: Eutrophic Grey Dermosol
Profile
Horizon /
Depth (cm) Description
A1
0-10
Very dark greyish brown (10YR 3/2) medium clay, moderate
structure of <2mm subangular blocky peds with a rough fabric
and soft consistence. 7.5 field pH. 2-10% faint grey mottling.
Nil segregations.
Sampled 0-10cm & 20-30cm.
B21
10-70
Dark grey (10YR 4/1) light medium clay, moderate structure of
<2mm subangular blocky peds with a rough fabric and soft
consistence. 6.5 field pH. 2-10% faint brown mottling. Nil
segregations.
Sampled 30-40cm, 50-60cm, 70-80cm
B22
70cm – 1m
Brown (10YR 3/4) medium clay, strong structure of <2mm
angular blocky peds with a rough fabric and soft consistence. 7
field pH. 10-20% distinct dark mottling. 2-6mm fragment size
(fine gravel). Nil segregations.
Sampled 70-80cm, 90cm – 1m.
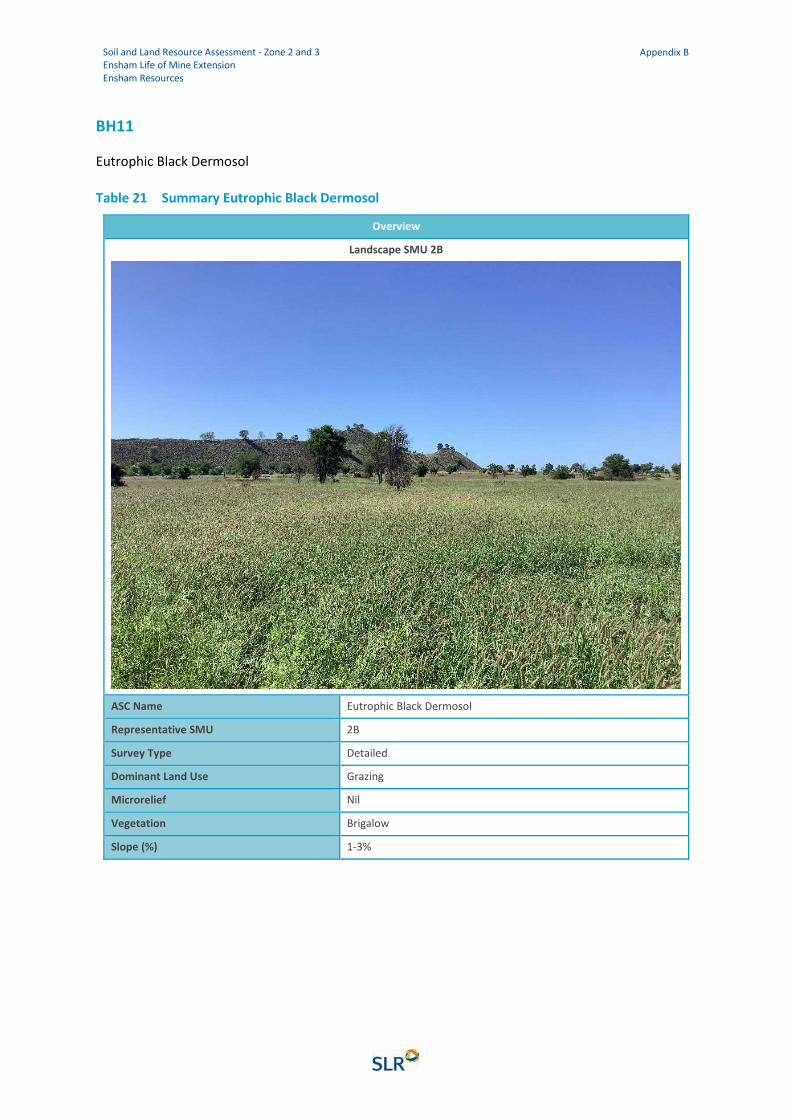
Soil and Land Resource Assessment - Zone 2 and 3 Ensham Life of Mine Extension Ensham Resources
Appendix B
BH11
Eutrophic Black Dermosol
Table 21 Summary Eutrophic Black Dermosol
Overview
Landscape SMU 2B
ASC Name Eutrophic Black Dermosol
Representative SMU 2B
Survey Type Detailed
Dominant Land Use Grazing
Microrelief Nil
Vegetation Brigalow
Slope (%) 1-3%
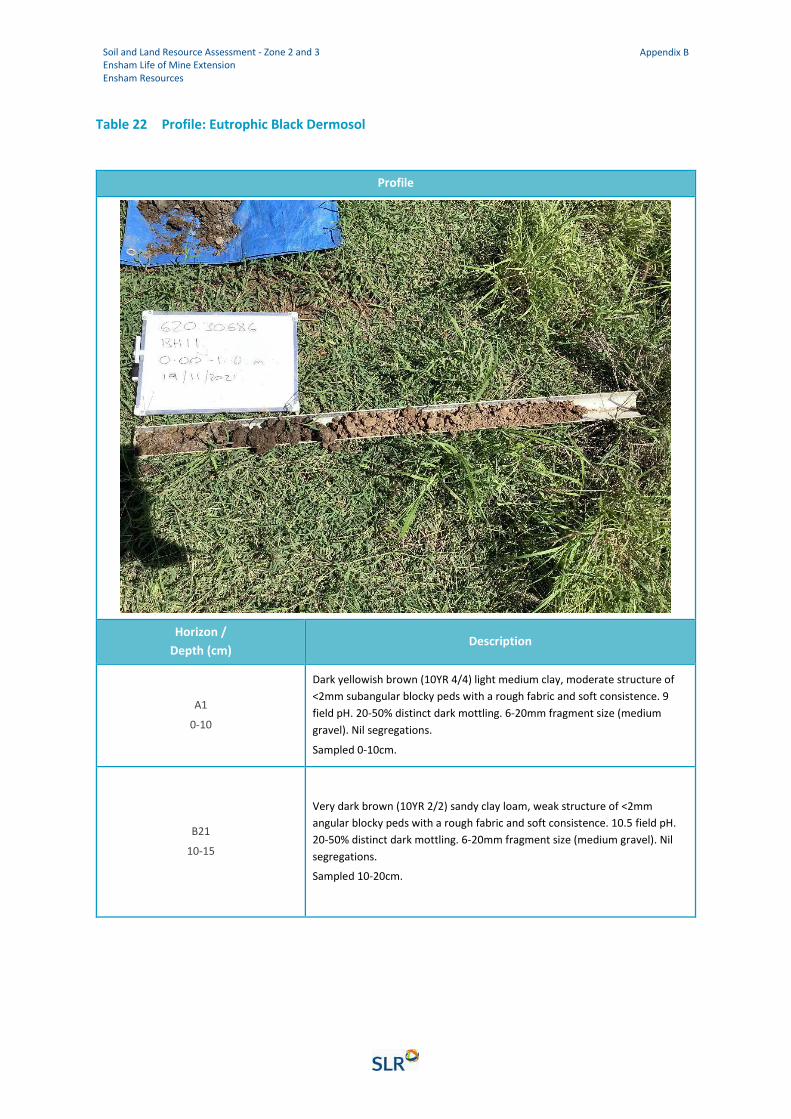
Soil and Land Resource Assessment - Zone 2 and 3 Ensham Life of Mine Extension Ensham Resources
Appendix B
Table 22 Profile: Eutrophic Black Dermosol
Profile
Horizon /
Depth (cm) Description
A1
0-10
Dark yellowish brown (10YR 4/4) light medium clay, moderate structure of
<2mm subangular blocky peds with a rough fabric and soft consistence. 9
field pH. 20-50% distinct dark mottling. 6-20mm fragment size (medium
gravel). Nil segregations.
Sampled 0-10cm.
B21
10-15
Very dark brown (10YR 2/2) sandy clay loam, weak structure of <2mm
angular blocky peds with a rough fabric and soft consistence. 10.5 field pH.
20-50% distinct dark mottling. 6-20mm fragment size (medium gravel). Nil
segregations.
Sampled 10-20cm.

Soil and Land Resource Assessment - Zone 2 and 3 Ensham Life of Mine Extension Ensham Resources
Appendix B
Profile
B22
15cm – 1m
Dark yellowish brown (10YR 3/4) medium clay, moderate structure of <2mm
angular blocky peds with a rough fabric and soft consistence. 9 field pH. 20-
50% prominent pale mottling. 6-20mm fragment size (medium gravel). Nil
segregations.
Sampled 10-20cm, 30-40cm, 50-60cm, 70-80cm, 90cm – 1m.
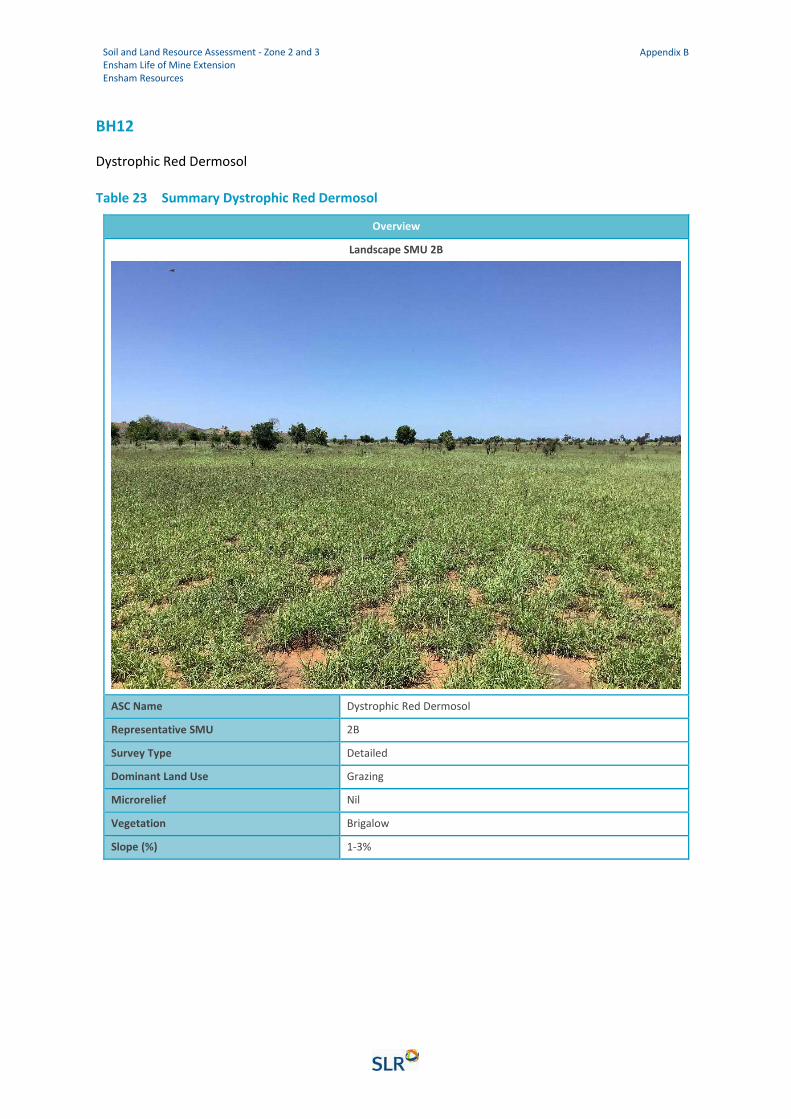
Soil and Land Resource Assessment - Zone 2 and 3 Ensham Life of Mine Extension Ensham Resources
Appendix B
BH12
Dystrophic Red Dermosol
Table 23 Summary Dystrophic Red Dermosol
Overview
Landscape SMU 2B
ASC Name Dystrophic Red Dermosol
Representative SMU 2B
Survey Type Detailed
Dominant Land Use Grazing
Microrelief Nil
Vegetation Brigalow
Slope (%) 1-3%

Soil and Land Resource Assessment - Zone 2 and 3 Ensham Life of Mine Extension Ensham Resources
Appendix B
Table 24 Profile: Dystrophic Red Dermosol
Profile
Horizon /
Depth (cm) Description
A1
0-10
Dark yellowish brown (10YR 3/4) sandy clay loam, weak structure of <2mm
angular blocky peds with a rough fabric and loose consistence. 7 field pH.
<2% faint orange mottling2-6mm fragment size (fine gravel). Nil
segregations.
Sampled 0-10cm.
B21
10-25
Dark red (10YR 3/6) sandy clay loam, weak structure of <2mm angular blocky
peds with a rough fabric and loose consistence. 7 field pH. <2% faint brown
mottling. 2-6mm fragment size (fine gravel). Nil segregations.
Sampled 10-20cm, 30-40cm.
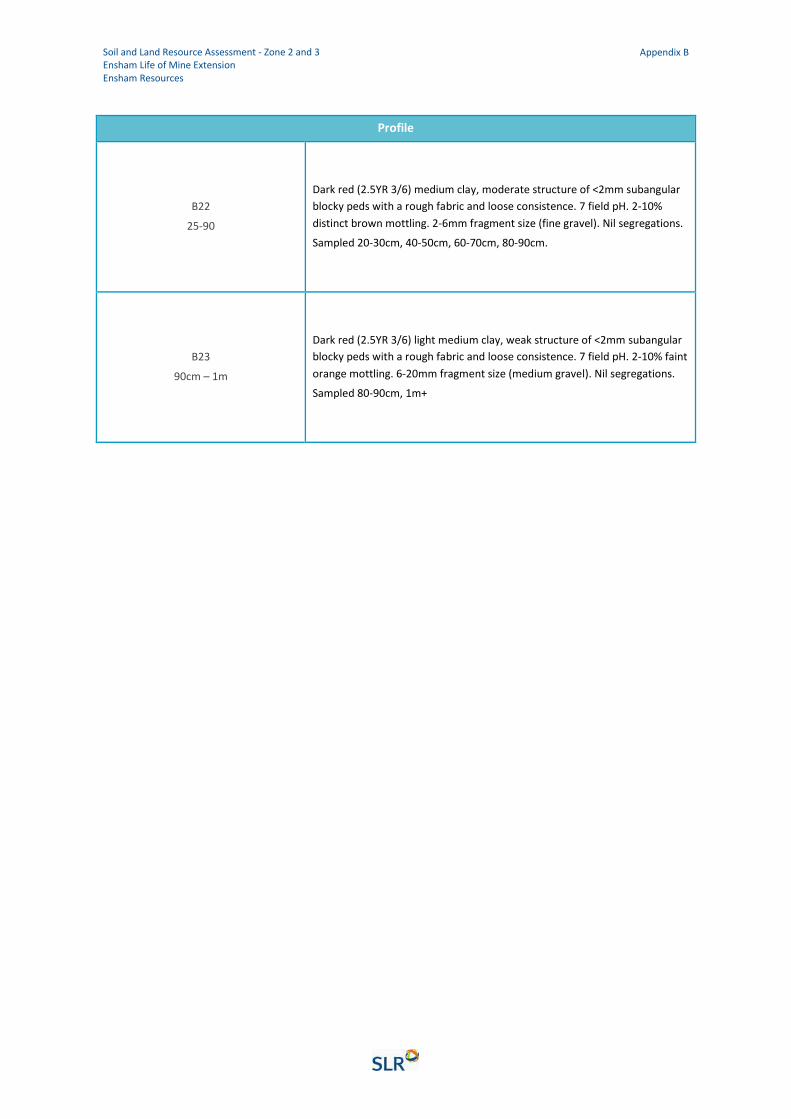
Soil and Land Resource Assessment - Zone 2 and 3 Ensham Life of Mine Extension Ensham Resources
Appendix B
Profile
B22
25-90
Dark red (2.5YR 3/6) medium clay, moderate structure of <2mm subangular
blocky peds with a rough fabric and loose consistence. 7 field pH. 2-10%
distinct brown mottling. 2-6mm fragment size (fine gravel). Nil segregations.
Sampled 20-30cm, 40-50cm, 60-70cm, 80-90cm.
B23
90cm – 1m
Dark red (2.5YR 3/6) light medium clay, weak structure of <2mm subangular
blocky peds with a rough fabric and loose consistence. 7 field pH. 2-10% faint
orange mottling. 6-20mm fragment size (medium gravel). Nil segregations.
Sampled 80-90cm, 1m+
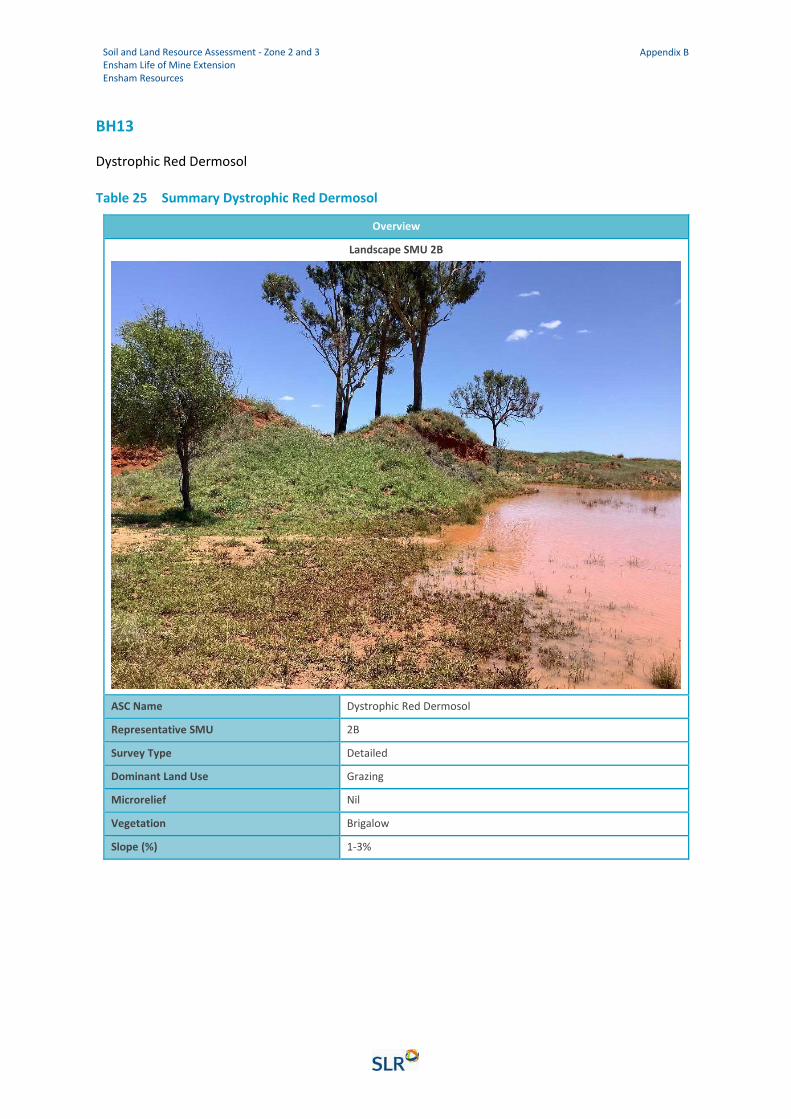
Soil and Land Resource Assessment - Zone 2 and 3 Ensham Life of Mine Extension Ensham Resources
Appendix B
BH13
Dystrophic Red Dermosol
Table 25 Summary Dystrophic Red Dermosol
Overview
Landscape SMU 2B
ASC Name Dystrophic Red Dermosol
Representative SMU 2B
Survey Type Detailed
Dominant Land Use Grazing
Microrelief Nil
Vegetation Brigalow
Slope (%) 1-3%
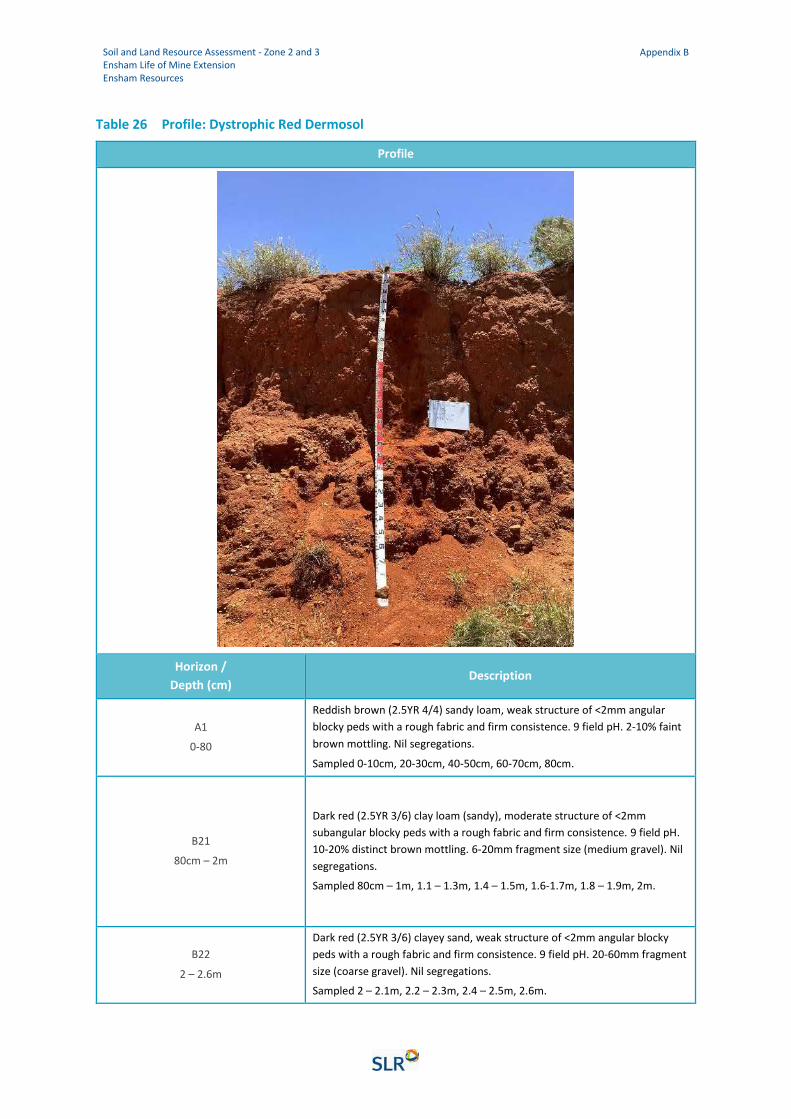
Soil and Land Resource Assessment - Zone 2 and 3 Ensham Life of Mine Extension Ensham Resources
Appendix B
Table 26 Profile: Dystrophic Red Dermosol
Profile
Horizon /
Depth (cm) Description
A1
0-80
Reddish brown (2.5YR 4/4) sandy loam, weak structure of <2mm angular
blocky peds with a rough fabric and firm consistence. 9 field pH. 2-10% faint
brown mottling. Nil segregations.
Sampled 0-10cm, 20-30cm, 40-50cm, 60-70cm, 80cm.
B21
80cm – 2m
Dark red (2.5YR 3/6) clay loam (sandy), moderate structure of <2mm
subangular blocky peds with a rough fabric and firm consistence. 9 field pH.
10-20% distinct brown mottling. 6-20mm fragment size (medium gravel). Nil
segregations.
Sampled 80cm – 1m, 1.1 – 1.3m, 1.4 – 1.5m, 1.6-1.7m, 1.8 – 1.9m, 2m.
B22
2 – 2.6m
Dark red (2.5YR 3/6) clayey sand, weak structure of <2mm angular blocky
peds with a rough fabric and firm consistence. 9 field pH. 20-60mm fragment
size (coarse gravel). Nil segregations.
Sampled 2 – 2.1m, 2.2 – 2.3m, 2.4 – 2.5m, 2.6m.
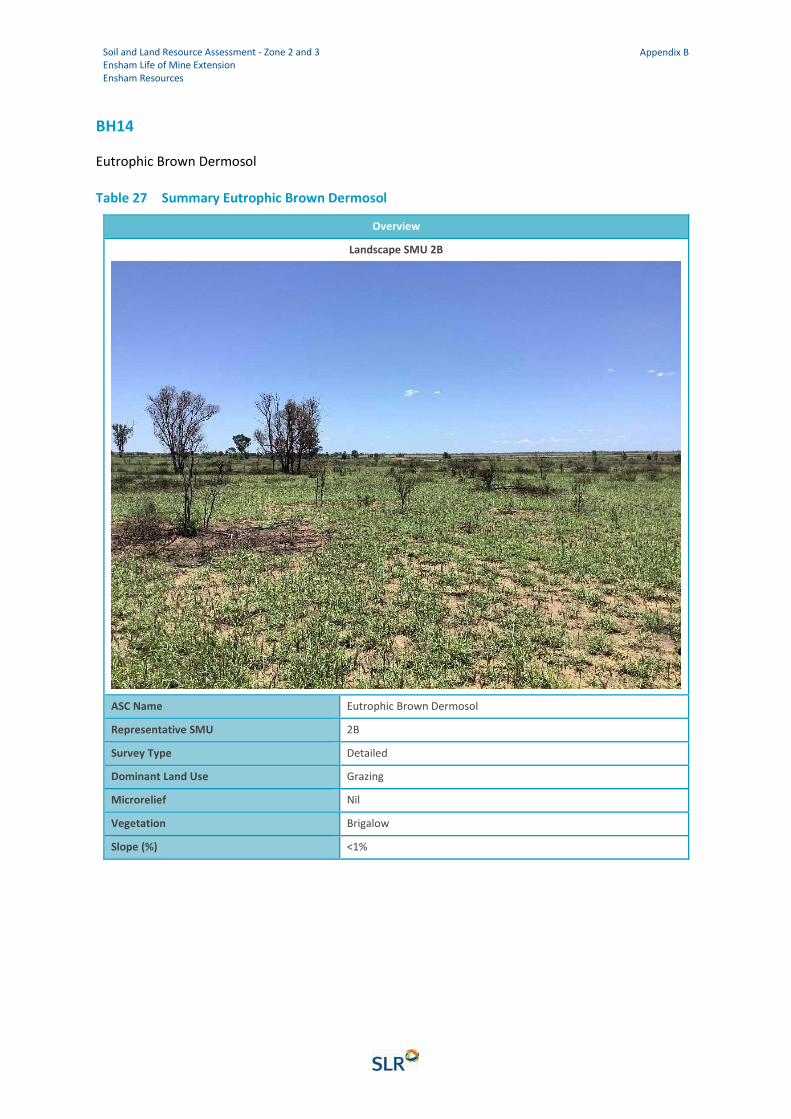
Soil and Land Resource Assessment - Zone 2 and 3 Ensham Life of Mine Extension Ensham Resources
Appendix B
BH14
Eutrophic Brown Dermosol
Table 27 Summary Eutrophic Brown Dermosol
Overview
Landscape SMU 2B
ASC Name Eutrophic Brown Dermosol
Representative SMU 2B
Survey Type Detailed
Dominant Land Use Grazing
Microrelief Nil
Vegetation Brigalow
Slope (%) <1%
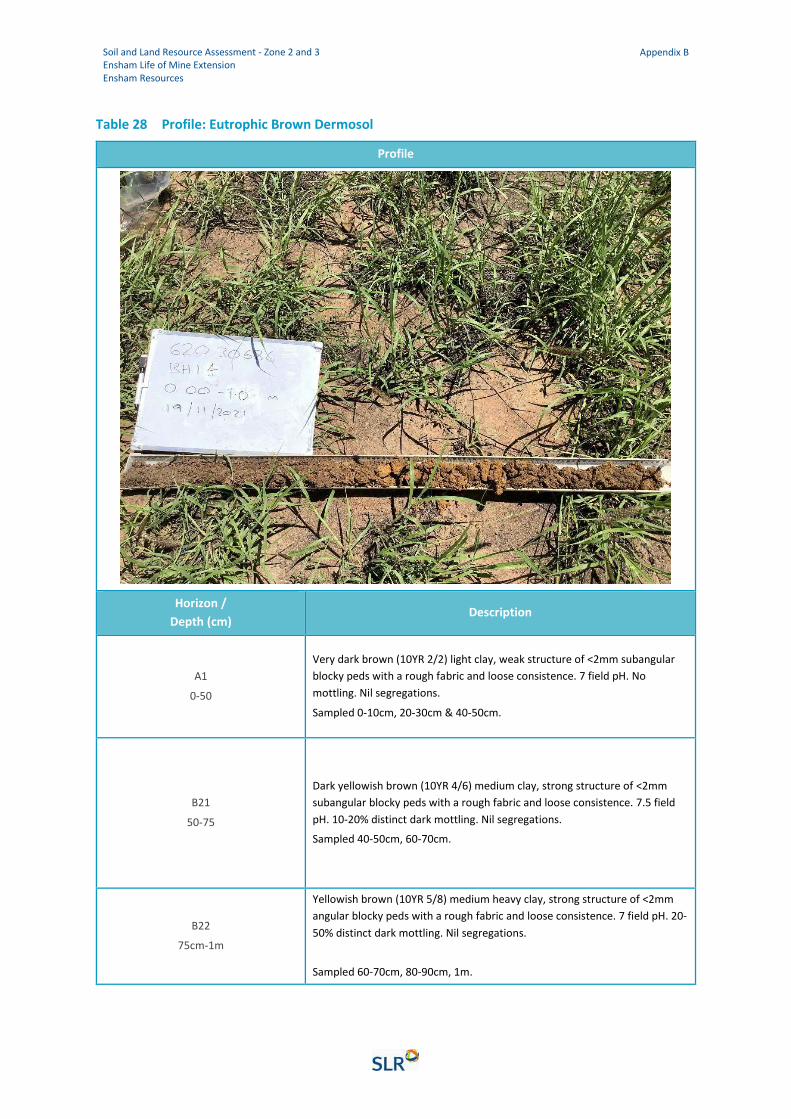
Soil and Land Resource Assessment - Zone 2 and 3 Ensham Life of Mine Extension Ensham Resources
Appendix B
Table 28 Profile: Eutrophic Brown Dermosol
Profile
Horizon /
Depth (cm) Description
A1
0-50
Very dark brown (10YR 2/2) light clay, weak structure of <2mm subangular
blocky peds with a rough fabric and loose consistence. 7 field pH. No
mottling. Nil segregations.
Sampled 0-10cm, 20-30cm & 40-50cm.
B21
50-75
Dark yellowish brown (10YR 4/6) medium clay, strong structure of <2mm
subangular blocky peds with a rough fabric and loose consistence. 7.5 field
pH. 10-20% distinct dark mottling. Nil segregations.
Sampled 40-50cm, 60-70cm.
B22
75cm-1m
Yellowish brown (10YR 5/8) medium heavy clay, strong structure of <2mm
angular blocky peds with a rough fabric and loose consistence. 7 field pH. 20-
50% distinct dark mottling. Nil segregations.
Sampled 60-70cm, 80-90cm, 1m.
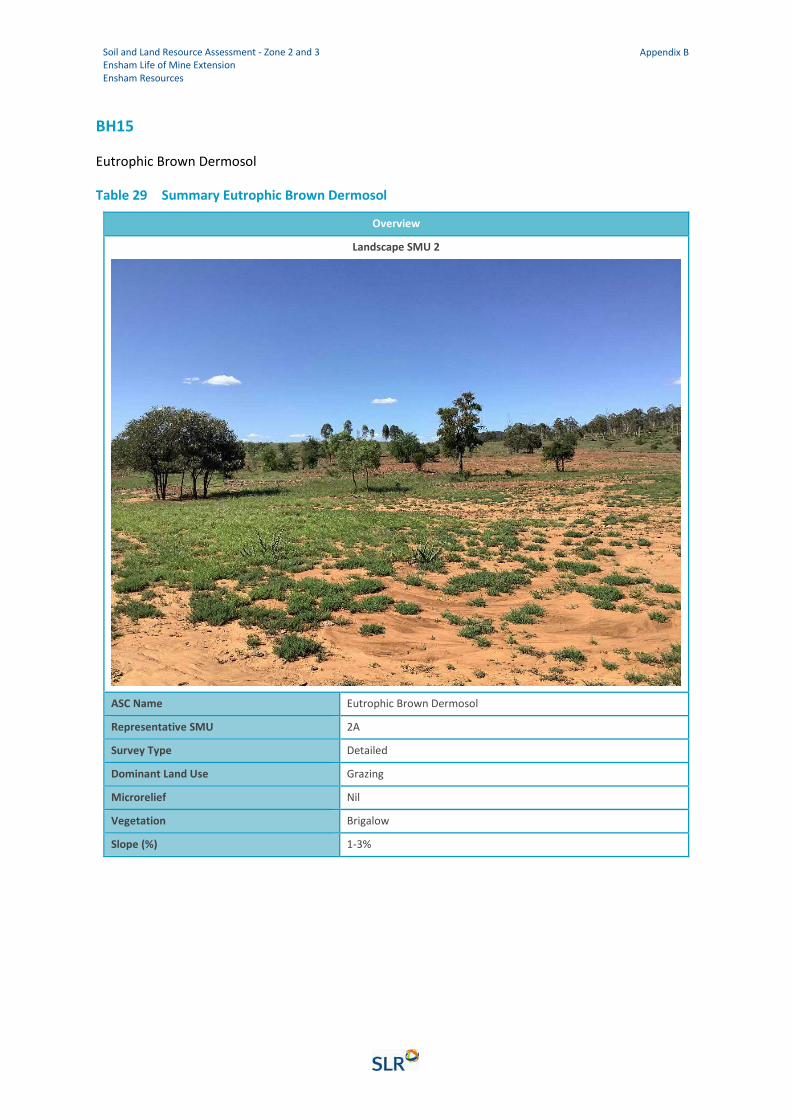
Soil and Land Resource Assessment - Zone 2 and 3 Ensham Life of Mine Extension Ensham Resources
Appendix B
BH15
Eutrophic Brown Dermosol
Table 29 Summary Eutrophic Brown Dermosol
Overview
Landscape SMU 2
ASC Name Eutrophic Brown Dermosol
Representative SMU 2A
Survey Type Detailed
Dominant Land Use Grazing
Microrelief Nil
Vegetation Brigalow
Slope (%) 1-3%
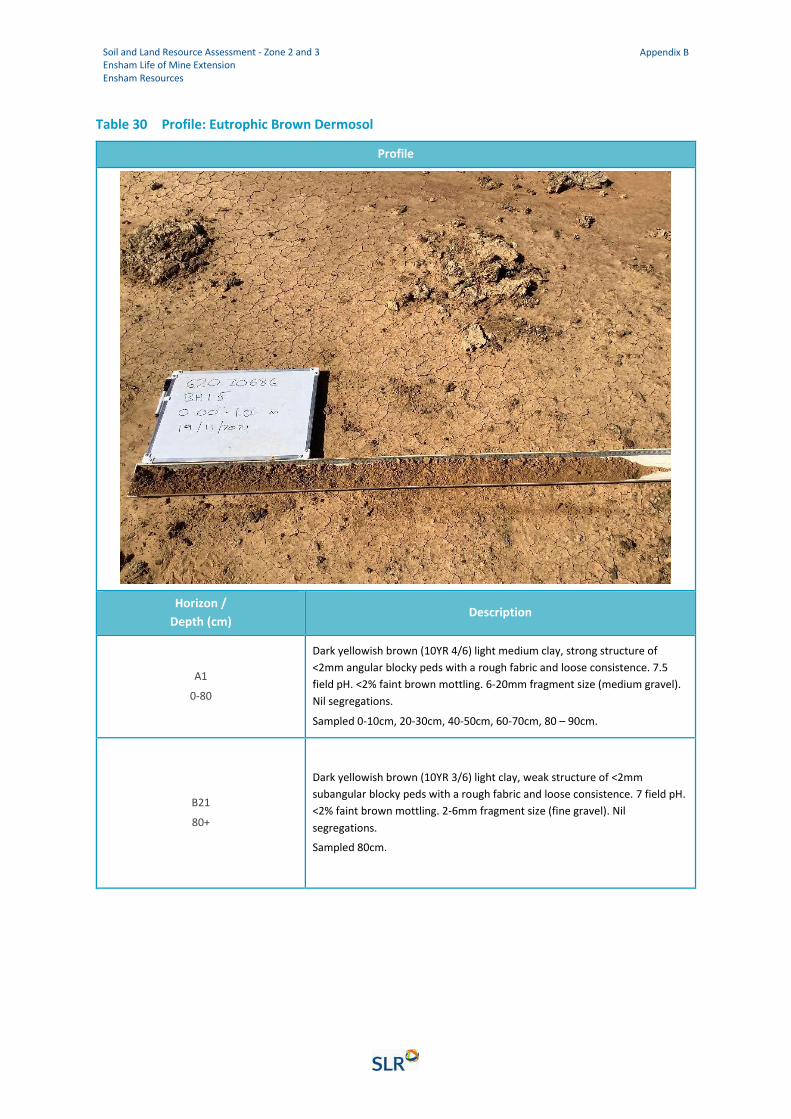
Soil and Land Resource Assessment - Zone 2 and 3 Ensham Life of Mine Extension Ensham Resources
Appendix B
Table 30 Profile: Eutrophic Brown Dermosol
Profile
Horizon /
Depth (cm) Description
A1
0-80
Dark yellowish brown (10YR 4/6) light medium clay, strong structure of
<2mm angular blocky peds with a rough fabric and loose consistence. 7.5
field pH. <2% faint brown mottling. 6-20mm fragment size (medium gravel).
Nil segregations.
Sampled 0-10cm, 20-30cm, 40-50cm, 60-70cm, 80 – 90cm.
B21
80+
Dark yellowish brown (10YR 3/6) light clay, weak structure of <2mm
subangular blocky peds with a rough fabric and loose consistence. 7 field pH.
<2% faint brown mottling. 2-6mm fragment size (fine gravel). Nil
segregations.
Sampled 80cm.
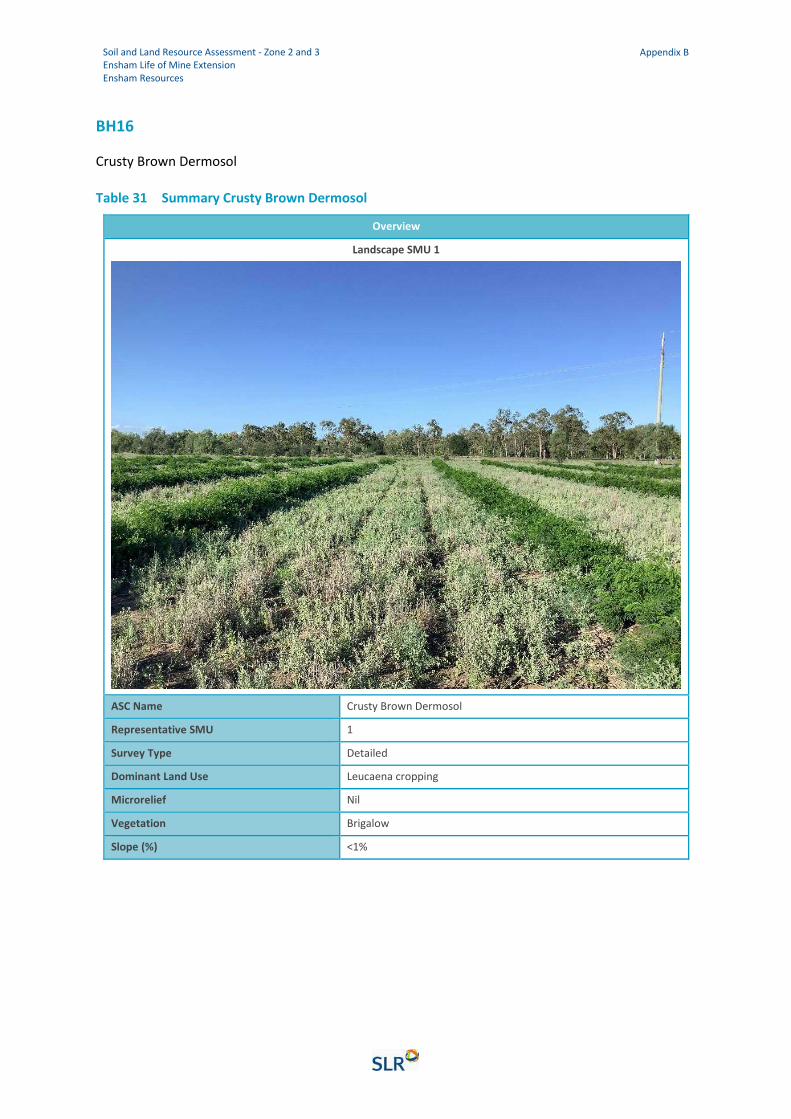
Soil and Land Resource Assessment - Zone 2 and 3 Ensham Life of Mine Extension Ensham Resources
Appendix B
BH16
Crusty Brown Dermosol
Table 31 Summary Crusty Brown Dermosol
Overview
Landscape SMU 1
ASC Name Crusty Brown Dermosol
Representative SMU 1
Survey Type Detailed
Dominant Land Use Leucaena cropping
Microrelief Nil
Vegetation Brigalow
Slope (%) <1%

Soil and Land Resource Assessment - Zone 2 and 3 Ensham Life of Mine Extension Ensham Resources
Appendix B
Table 32 Profile: Crusty Brown Vertosol
Profile
Horizon /
Depth (cm) Description
A1
0-10
Very dark greyish brown (10YR 3/2) medium clay, moderate structure of
<2mm angular blocky peds with a rough fabric and cracking consistence. 8
field pH. Nil segregations.
Sampled 0-10cm.
B21
10-80
Very dark brown (10YR 2/2) medium clay, strong structure of angular blocky
peds with a rough fabric and cracking consistence. 8.5 field pH. <2% faint
orange mottling. Nil segregations.
Sampled 30-40cm, 50-60cm, 70-80cm.

Soil and Land Resource Assessment - Zone 2 and 3 Ensham Life of Mine Extension Ensham Resources
Appendix B
Profile
B22
80cm-1m
Dark yellowish brown (10YR 4/4) medium clay, moderate structure of
angular blocky peds with a rough fabric and cracking consistence. 8.5 field
pH. 2-6mm fragment size (fine gravel). Nil segregations.
Sampled 80-90cm, 1m.
Ensham Resources Pty Ltd Ensham Life of Mine Extension Project - Zones 2 and 3 Land Resources
SLR Ref No: 620.30686.00000-R01-v4.0-RevF.docx March 2022
620.30686.00000-R01-v4.0-RevF.docx Page 1
APPENDIX C
Check Site Descriptions
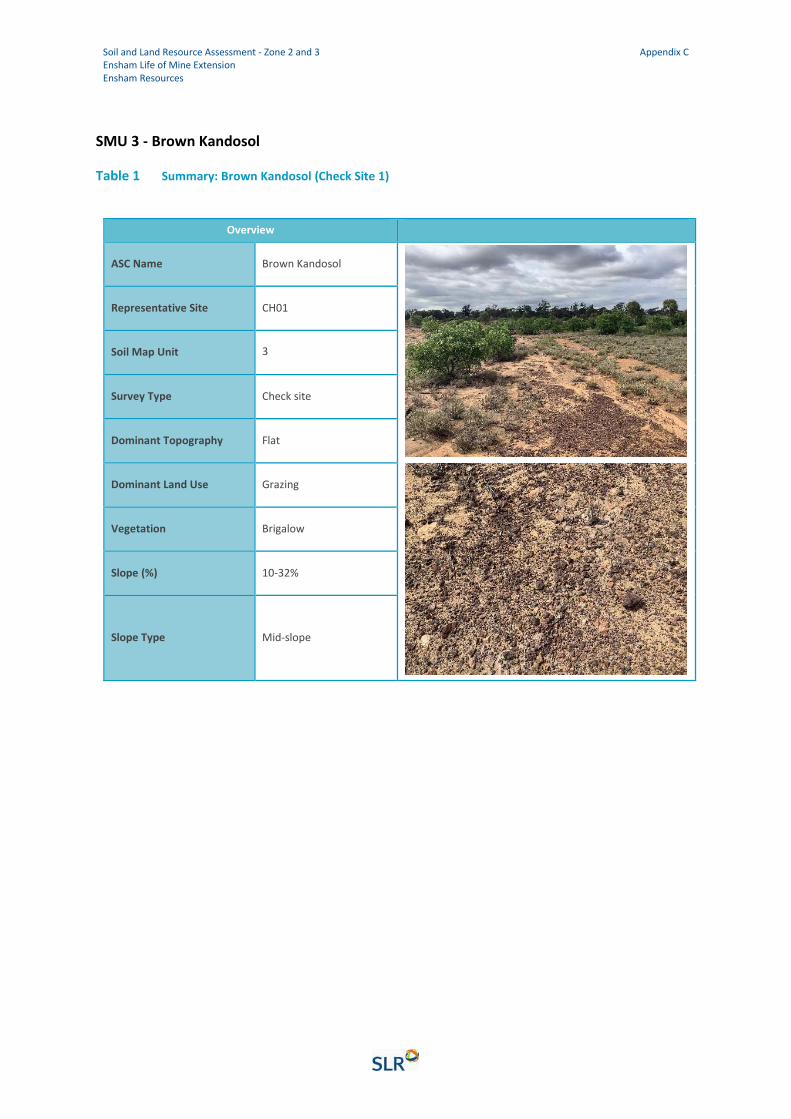
Soil and Land Resource Assessment - Zone 2 and 3 Ensham Life of Mine Extension Ensham Resources
Appendix C
SMU 3 - Brown Kandosol
Table 1 Summary: Brown Kandosol (Check Site 1)
Overview
ASC Name Brown Kandosol
Representative Site CH01
Soil Map Unit 3
Survey Type Check site
Dominant Topography Flat
Dominant Land Use Grazing
Vegetation Brigalow
Slope (%) 10-32%
Slope Type Mid-slope
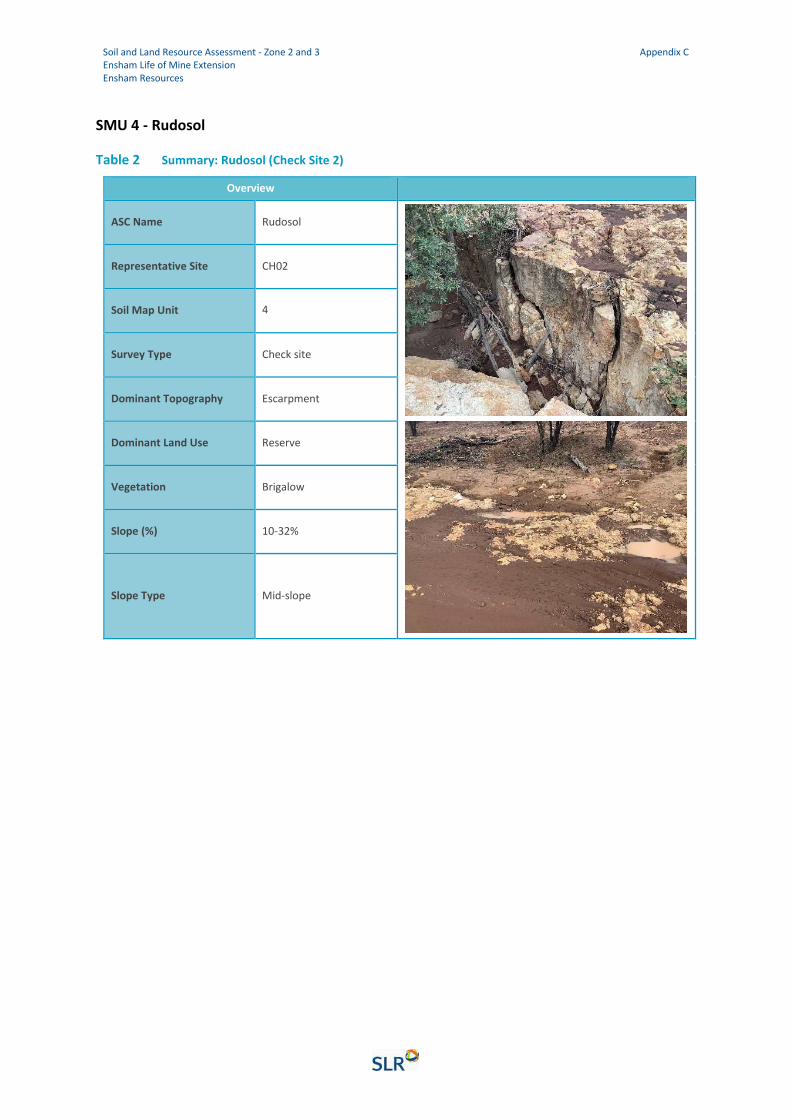
Soil and Land Resource Assessment - Zone 2 and 3 Ensham Life of Mine Extension Ensham Resources
Appendix C
SMU 4 - Rudosol
Table 2 Summary: Rudosol (Check Site 2)
Overview
ASC Name Rudosol
Representative Site CH02
Soil Map Unit 4
Survey Type Check site
Dominant Topography Escarpment
Dominant Land Use Reserve
Vegetation Brigalow
Slope (%) 10-32%
Slope Type Mid-slope
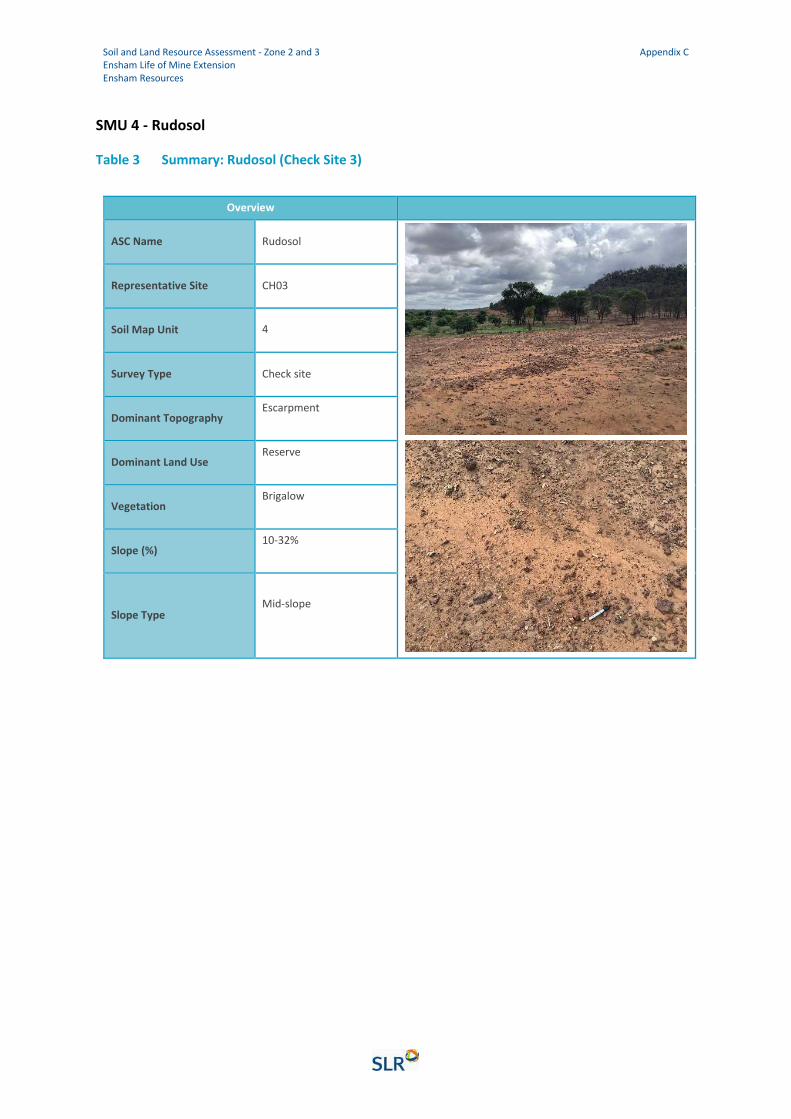
Soil and Land Resource Assessment - Zone 2 and 3 Ensham Life of Mine Extension Ensham Resources
Appendix C
SMU 4 - Rudosol
Table 3 Summary: Rudosol (Check Site 3)
Overview
ASC Name Rudosol
Representative Site CH03
Soil Map Unit 4
Survey Type Check site
Dominant Topography Escarpment
Dominant Land Use Reserve
Vegetation Brigalow
Slope (%) 10-32%
Slope Type
Mid-slope
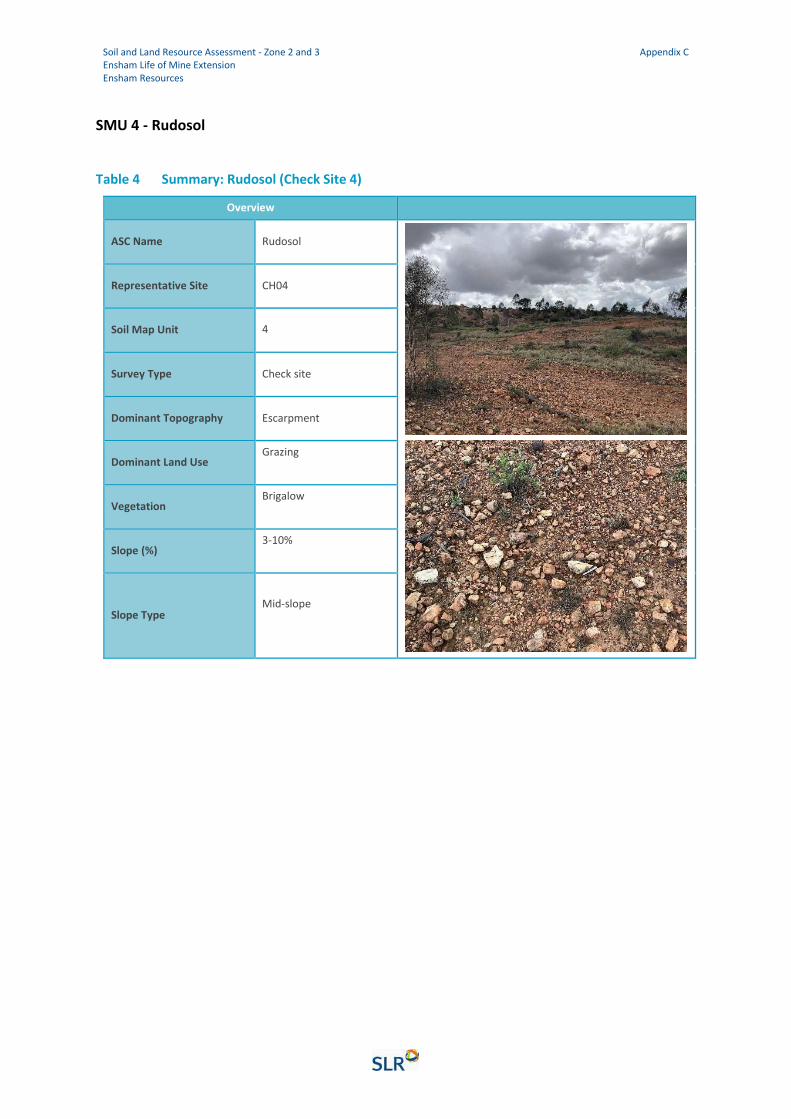
Soil and Land Resource Assessment - Zone 2 and 3 Ensham Life of Mine Extension Ensham Resources
Appendix C
SMU 4 - Rudosol
Table 4 Summary: Rudosol (Check Site 4)
Overview
ASC Name Rudosol
Representative Site CH04
Soil Map Unit 4
Survey Type Check site
Dominant Topography Escarpment
Dominant Land Use Grazing
Vegetation Brigalow
Slope (%) 3-10%
Slope Type
Mid-slope
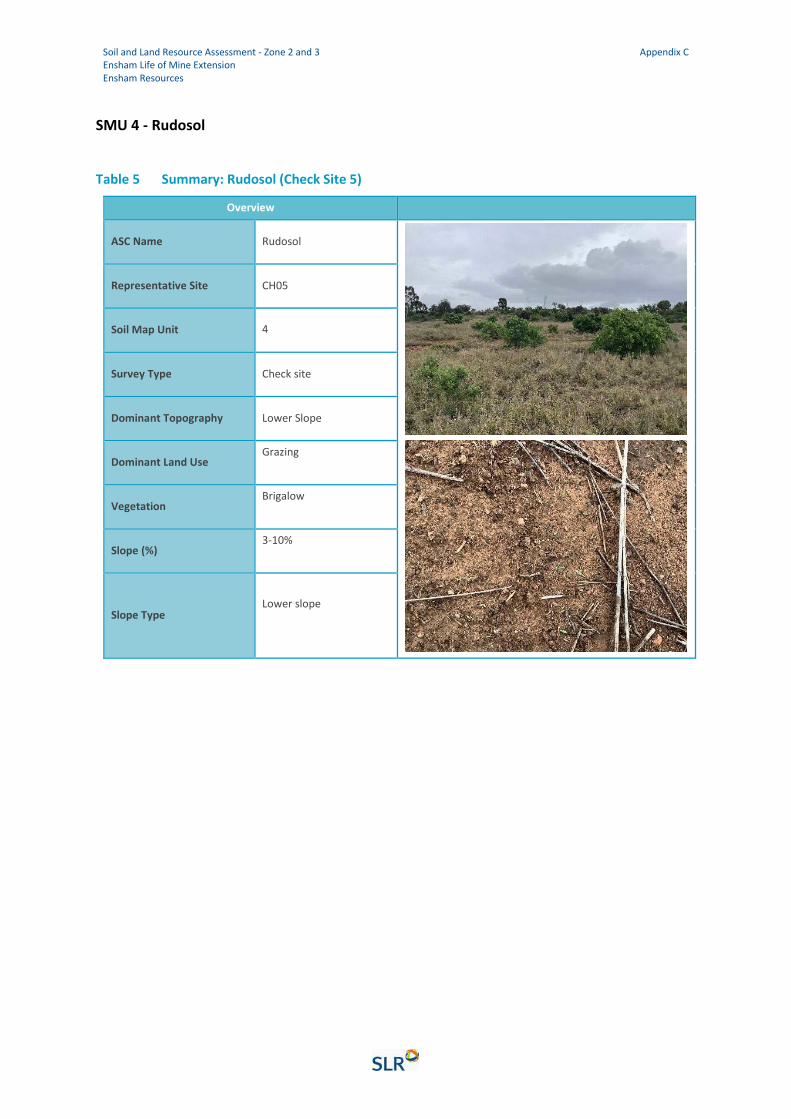
Soil and Land Resource Assessment - Zone 2 and 3 Ensham Life of Mine Extension Ensham Resources
Appendix C
SMU 4 - Rudosol
Table 5 Summary: Rudosol (Check Site 5)
Overview
ASC Name Rudosol
Representative Site CH05
Soil Map Unit 4
Survey Type Check site
Dominant Topography Lower Slope
Dominant Land Use Grazing
Vegetation Brigalow
Slope (%) 3-10%
Slope Type
Lower slope
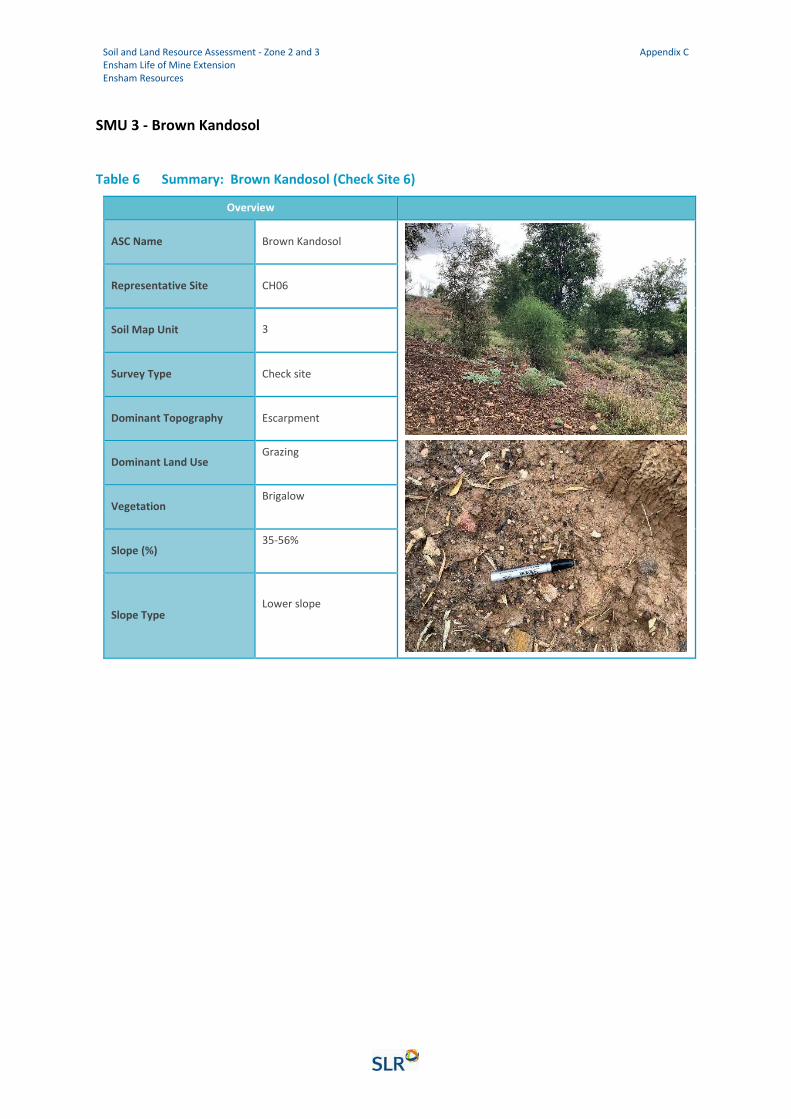
Soil and Land Resource Assessment - Zone 2 and 3 Ensham Life of Mine Extension Ensham Resources
Appendix C
SMU 3 - Brown Kandosol
Table 6 Summary: Brown Kandosol (Check Site 6)
Overview
ASC Name Brown Kandosol
Representative Site CH06
Soil Map Unit 3
Survey Type Check site
Dominant Topography Escarpment
Dominant Land Use Grazing
Vegetation Brigalow
Slope (%) 35-56%
Slope Type
Lower slope
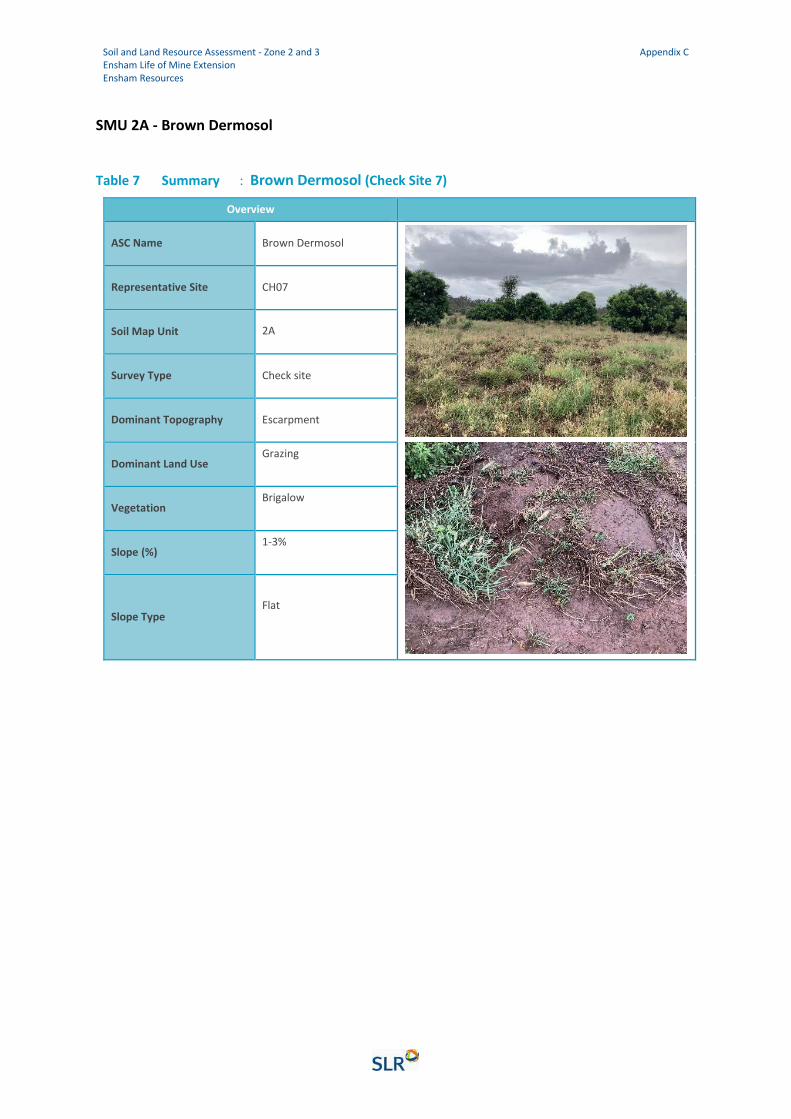
Soil and Land Resource Assessment - Zone 2 and 3 Ensham Life of Mine Extension Ensham Resources
Appendix C
SMU 2A - Brown Dermosol
Table 7 Summary : Brown Dermosol (Check Site 7)
Overview
ASC Name Brown Dermosol
Representative Site CH07
Soil Map Unit 2A
Survey Type Check site
Dominant Topography Escarpment
Dominant Land Use Grazing
Vegetation Brigalow
Slope (%) 1-3%
Slope Type
Flat
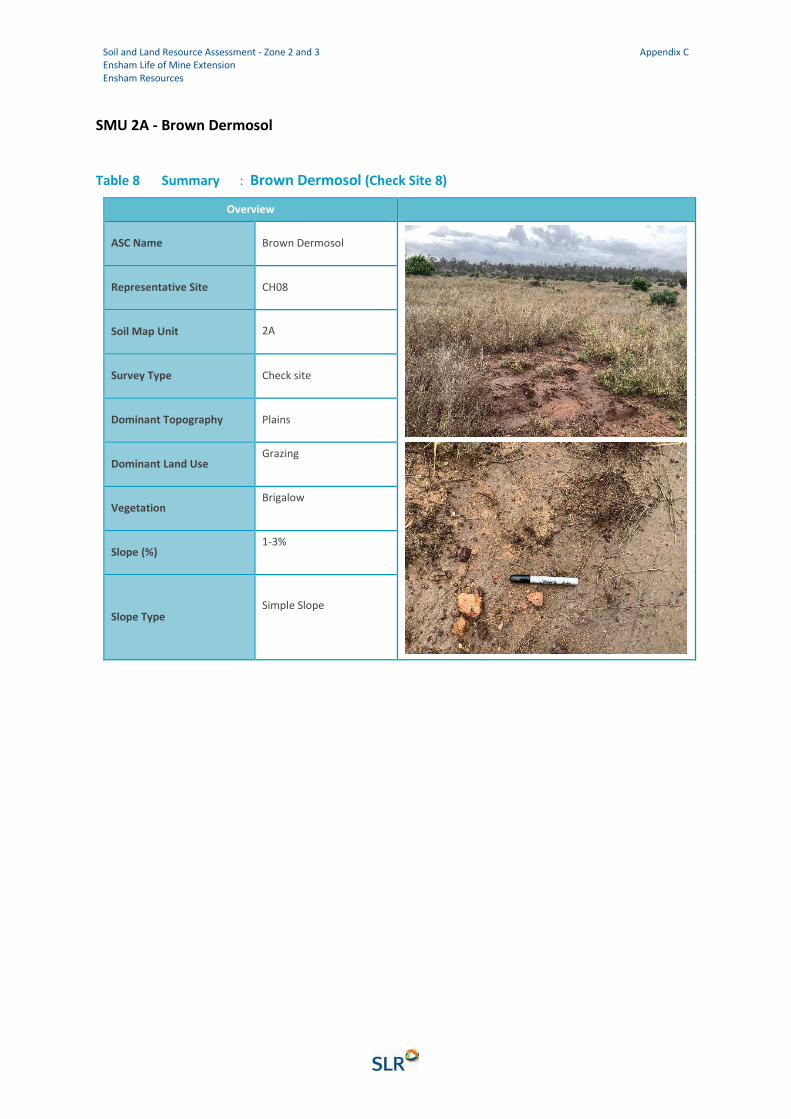
Soil and Land Resource Assessment - Zone 2 and 3 Ensham Life of Mine Extension Ensham Resources
Appendix C
SMU 2A - Brown Dermosol
Table 8 Summary : Brown Dermosol (Check Site 8)
Overview
ASC Name Brown Dermosol
Representative Site CH08
Soil Map Unit 2A
Survey Type Check site
Dominant Topography Plains
Dominant Land Use Grazing
Vegetation Brigalow
Slope (%) 1-3%
Slope Type
Simple Slope
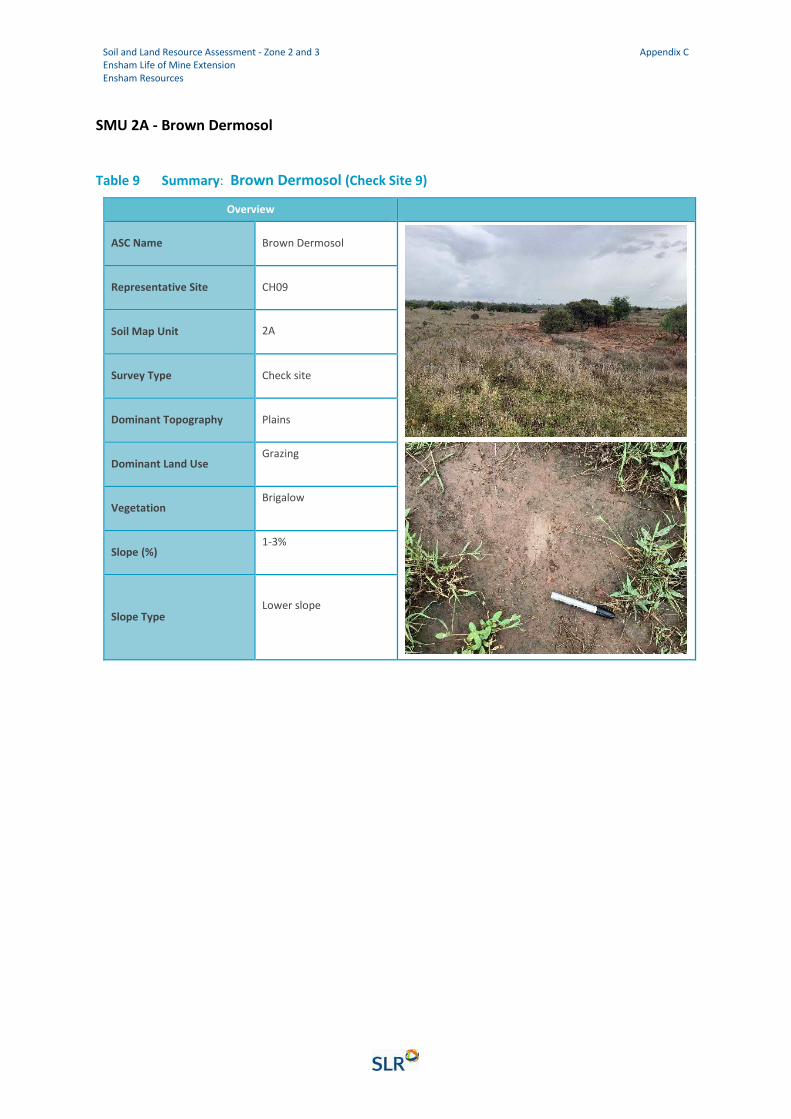
Soil and Land Resource Assessment - Zone 2 and 3 Ensham Life of Mine Extension Ensham Resources
Appendix C
SMU 2A - Brown Dermosol
Table 9 Summary: Brown Dermosol (Check Site 9)
Overview
ASC Name Brown Dermosol
Representative Site CH09
Soil Map Unit 2A
Survey Type Check site
Dominant Topography Plains
Dominant Land Use Grazing
Vegetation Brigalow
Slope (%) 1-3%
Slope Type
Lower slope

Soil and Land Resource Assessment - Zone 2 and 3 Ensham Life of Mine Extension Ensham Resources
Appendix C
SMU 2A - Brown Dermosol
Table 10 Summary : Brown Dermosol (Check Site 10)
Overview
ASC Name Brown Dermosol
Representative Site CH10
Soil Map Unit 2A
Survey Type Check site
Dominant Topography Plains
Dominant Land Use Grazing
Vegetation Brigalow
Slope (%) 1-3%
Slope Type
Open depression
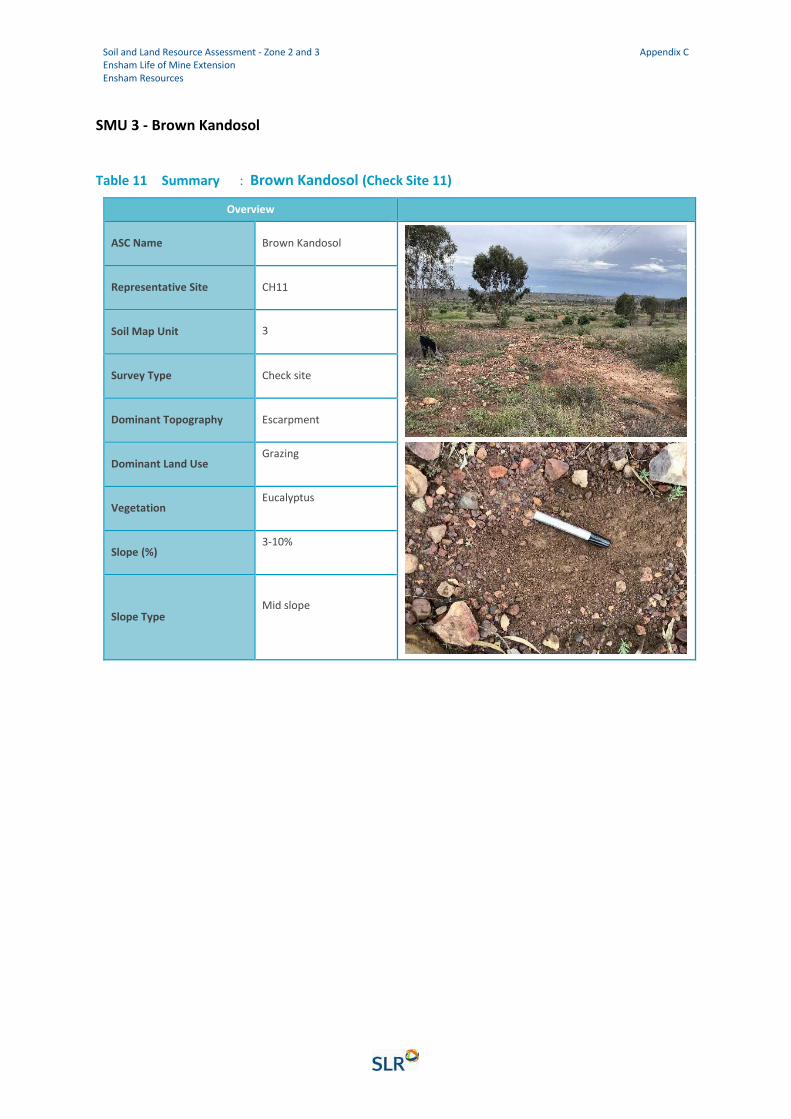
Soil and Land Resource Assessment - Zone 2 and 3 Ensham Life of Mine Extension Ensham Resources
Appendix C
SMU 3 - Brown Kandosol
Table 11 Summary : Brown Kandosol (Check Site 11)
Overview
ASC Name Brown Kandosol
Representative Site CH11
Soil Map Unit 3
Survey Type Check site
Dominant Topography Escarpment
Dominant Land Use Grazing
Vegetation Eucalyptus
Slope (%) 3-10%
Slope Type
Mid slope
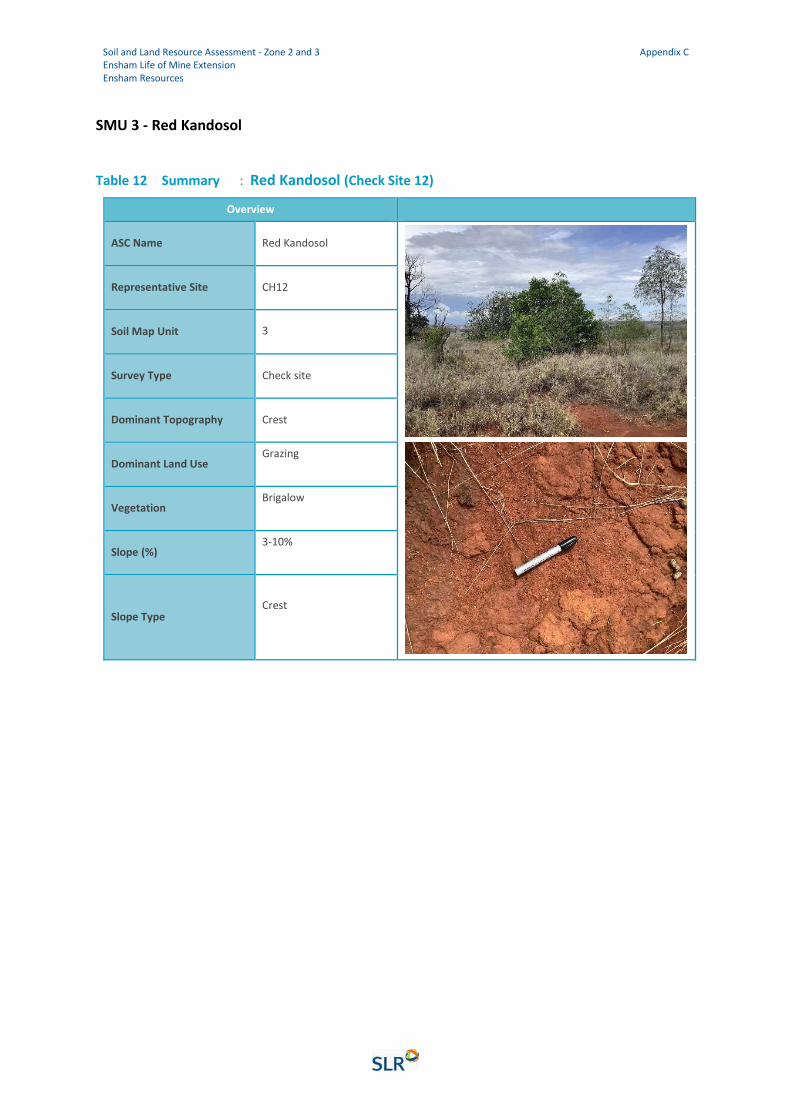
Soil and Land Resource Assessment - Zone 2 and 3 Ensham Life of Mine Extension Ensham Resources
Appendix C
SMU 3 - Red Kandosol
Table 12 Summary : Red Kandosol (Check Site 12)
Overview
ASC Name Red Kandosol
Representative Site CH12
Soil Map Unit 3
Survey Type Check site
Dominant Topography Crest
Dominant Land Use Grazing
Vegetation Brigalow
Slope (%) 3-10%
Slope Type
Crest
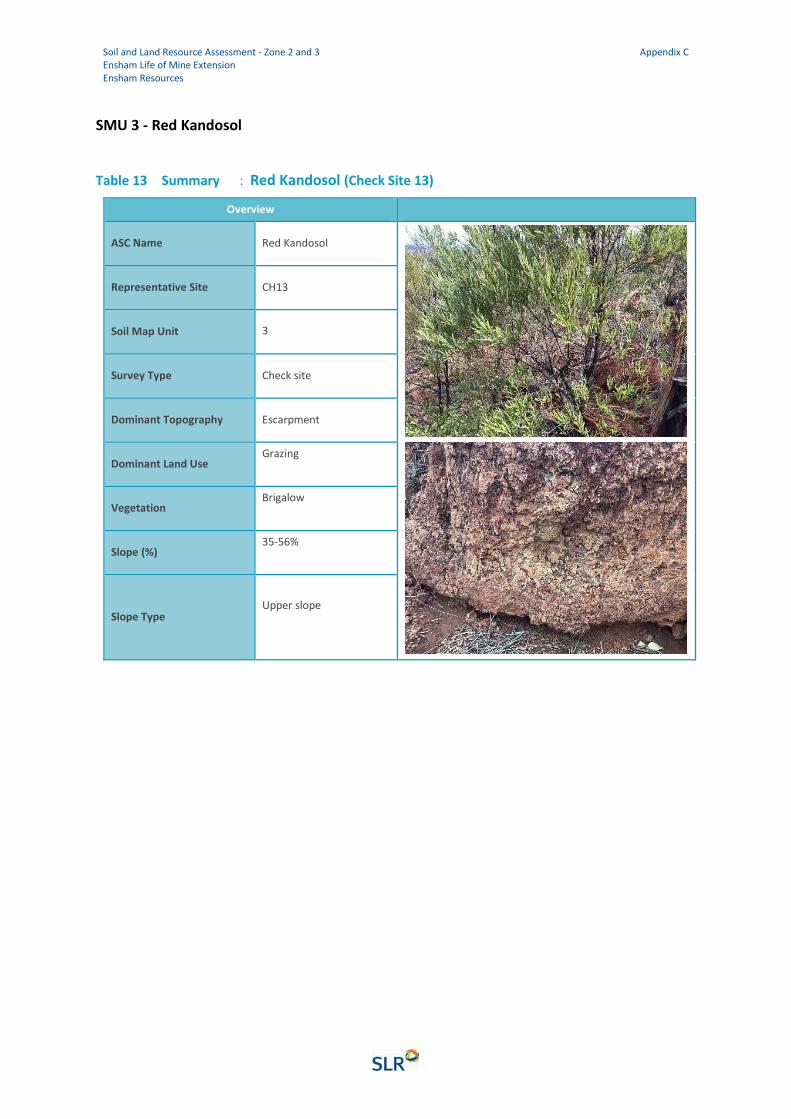
Soil and Land Resource Assessment - Zone 2 and 3 Ensham Life of Mine Extension Ensham Resources
Appendix C
SMU 3 - Red Kandosol
Table 13 Summary : Red Kandosol (Check Site 13)
Overview
ASC Name Red Kandosol
Representative Site CH13
Soil Map Unit 3
Survey Type Check site
Dominant Topography Escarpment
Dominant Land Use Grazing
Vegetation Brigalow
Slope (%) 35-56%
Slope Type
Upper slope
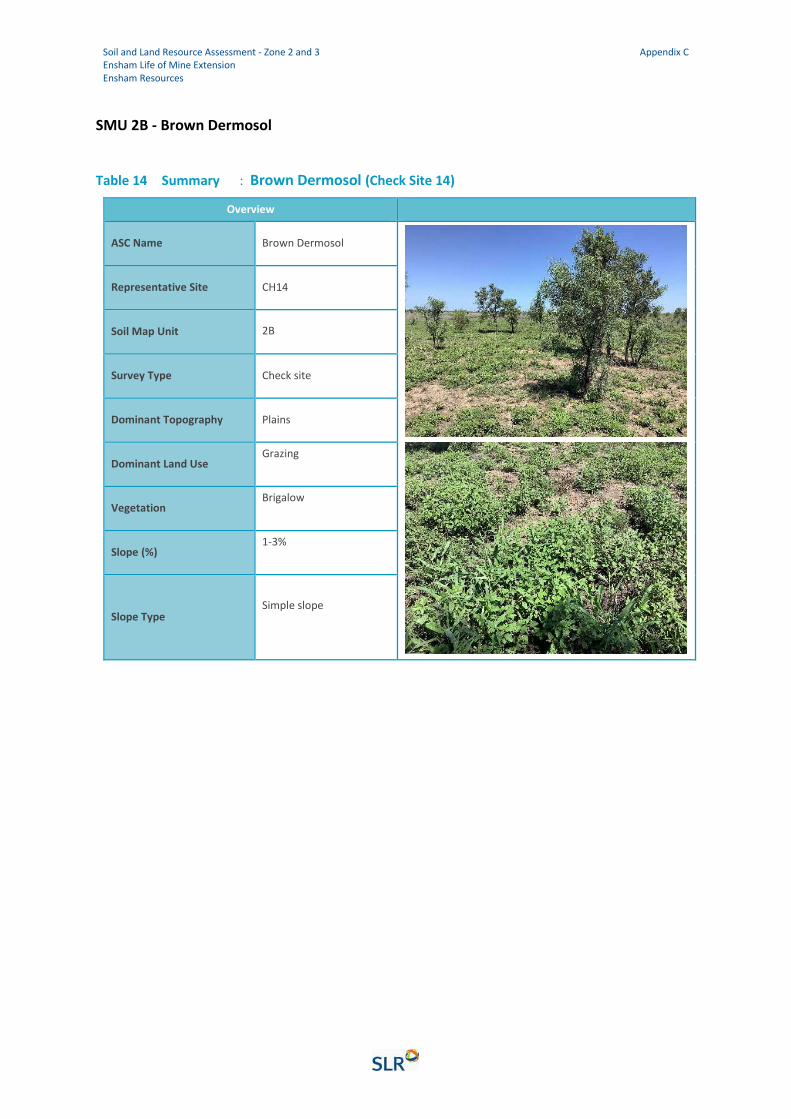
Soil and Land Resource Assessment - Zone 2 and 3 Ensham Life of Mine Extension Ensham Resources
Appendix C
SMU 2B - Brown Dermosol
Table 14 Summary : Brown Dermosol (Check Site 14)
Overview
ASC Name Brown Dermosol
Representative Site CH14
Soil Map Unit 2B
Survey Type Check site
Dominant Topography Plains
Dominant Land Use Grazing
Vegetation Brigalow
Slope (%) 1-3%
Slope Type
Simple slope
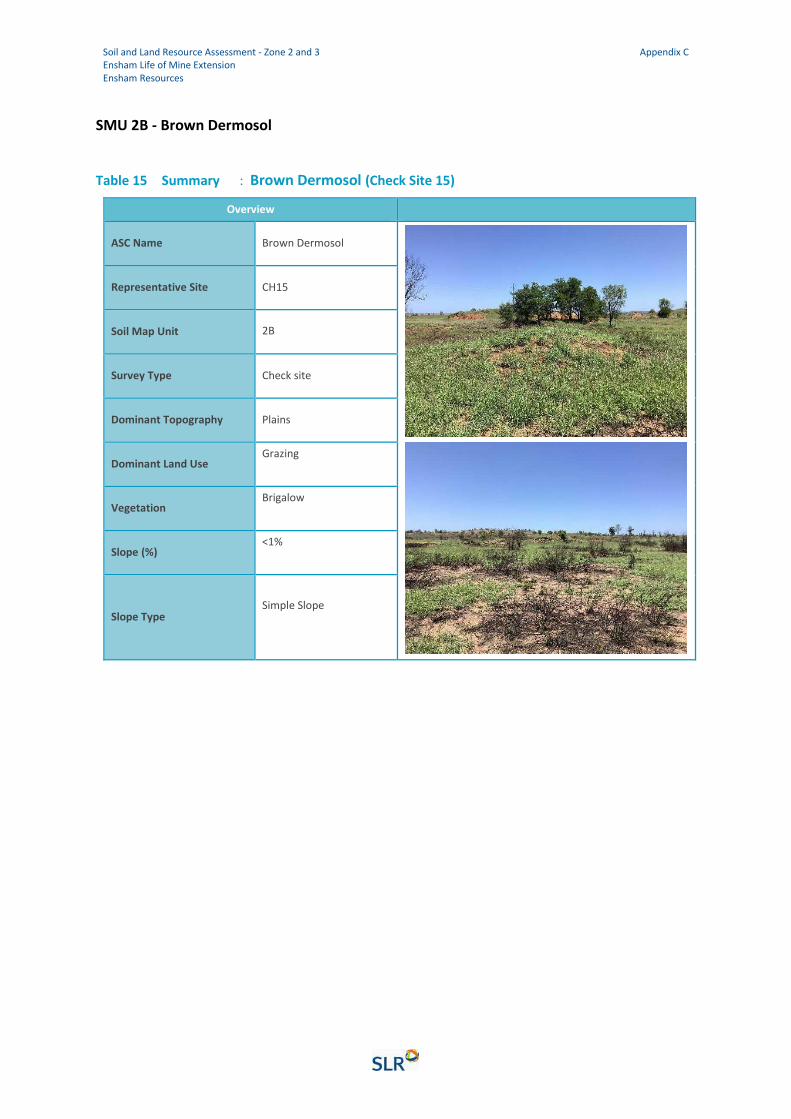
Soil and Land Resource Assessment - Zone 2 and 3 Ensham Life of Mine Extension Ensham Resources
Appendix C
SMU 2B - Brown Dermosol
Table 15 Summary : Brown Dermosol (Check Site 15)
Overview
ASC Name Brown Dermosol
Representative Site CH15
Soil Map Unit 2B
Survey Type Check site
Dominant Topography Plains
Dominant Land Use Grazing
Vegetation Brigalow
Slope (%) <1%
Slope Type
Simple Slope

Soil and Land Resource Assessment - Zone 2 and 3 Ensham Life of Mine Extension Ensham Resources
Appendix C
SMU 2B - Brown Dermosol
Table 16 Summary : Brown Dermosol (Check Site 16)
Overview
ASC Name Brown Dermosol
Representative Site CH16
Soil Map Unit 2B
Survey Type Check site
Dominant Topography Plains
Dominant Land Use Grazing
Vegetation Brigalow
Slope (%) 1-3%
Slope Type
Crest
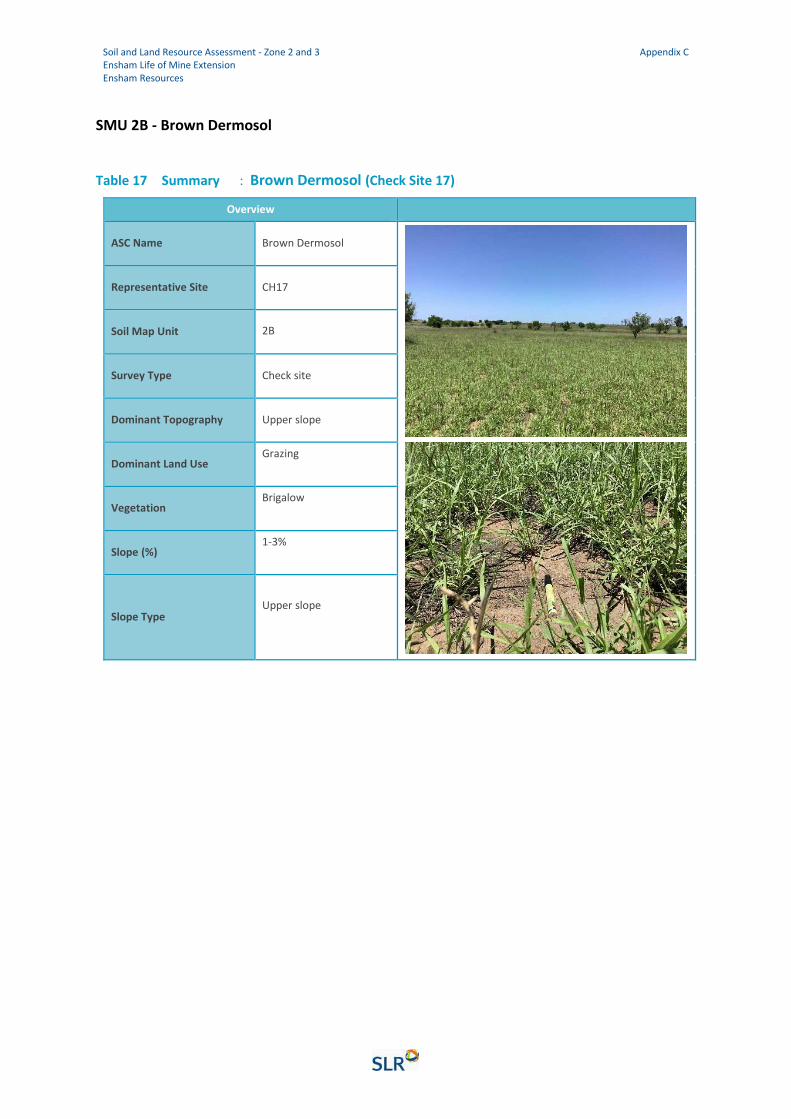
Soil and Land Resource Assessment - Zone 2 and 3 Ensham Life of Mine Extension Ensham Resources
Appendix C
SMU 2B - Brown Dermosol
Table 17 Summary : Brown Dermosol (Check Site 17)
Overview
ASC Name Brown Dermosol
Representative Site CH17
Soil Map Unit 2B
Survey Type Check site
Dominant Topography Upper slope
Dominant Land Use Grazing
Vegetation Brigalow
Slope (%) 1-3%
Slope Type
Upper slope

Soil and Land Resource Assessment - Zone 2 and 3 Ensham Life of Mine Extension Ensham Resources
Appendix C
SMU 2B - Brown Dermosol
Table 18 Summary : Brown Dermosol (Check Site 18)
Overview
ASC Name Brown Dermosol
Representative Site CH18
Soil Map Unit 2B
Survey Type Check site
Dominant Topography Mid slope
Dominant Land Use Grazing
Vegetation Brigalow
Slope (%) 1-3%
Slope Type
Mid slope
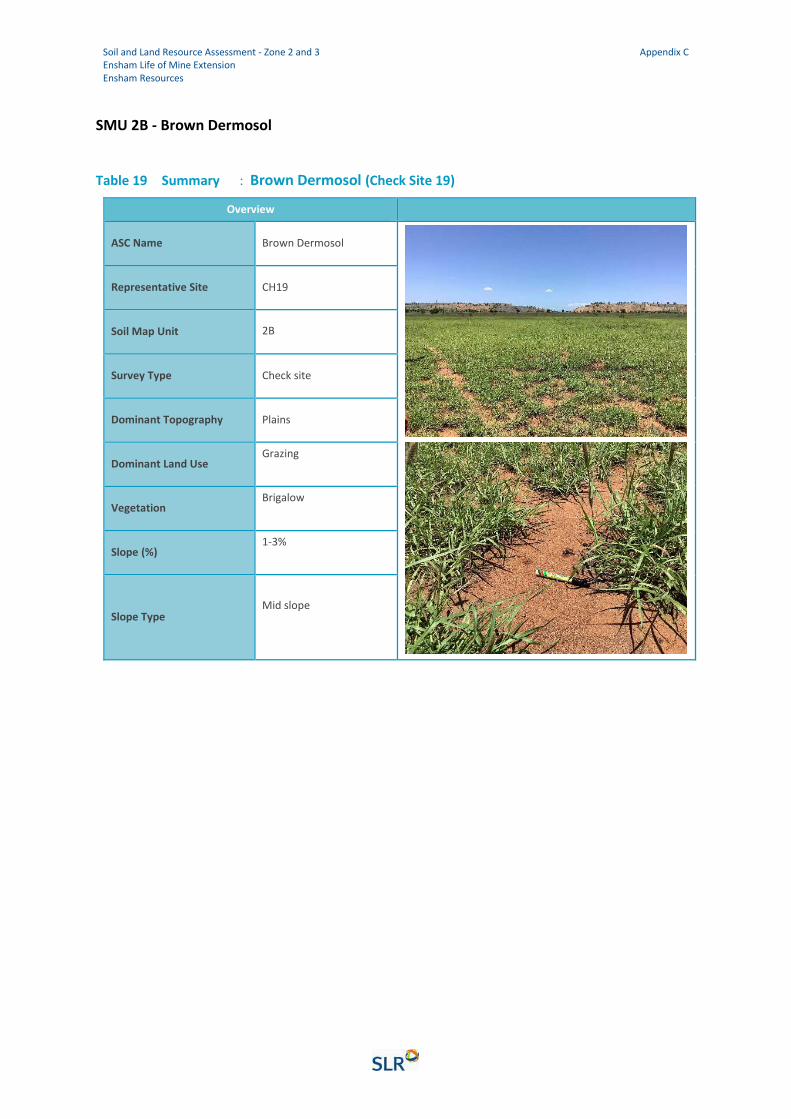
Soil and Land Resource Assessment - Zone 2 and 3 Ensham Life of Mine Extension Ensham Resources
Appendix C
SMU 2B - Brown Dermosol
Table 19 Summary : Brown Dermosol (Check Site 19)
Overview
ASC Name Brown Dermosol
Representative Site CH19
Soil Map Unit 2B
Survey Type Check site
Dominant Topography Plains
Dominant Land Use Grazing
Vegetation Brigalow
Slope (%) 1-3%
Slope Type
Mid slope
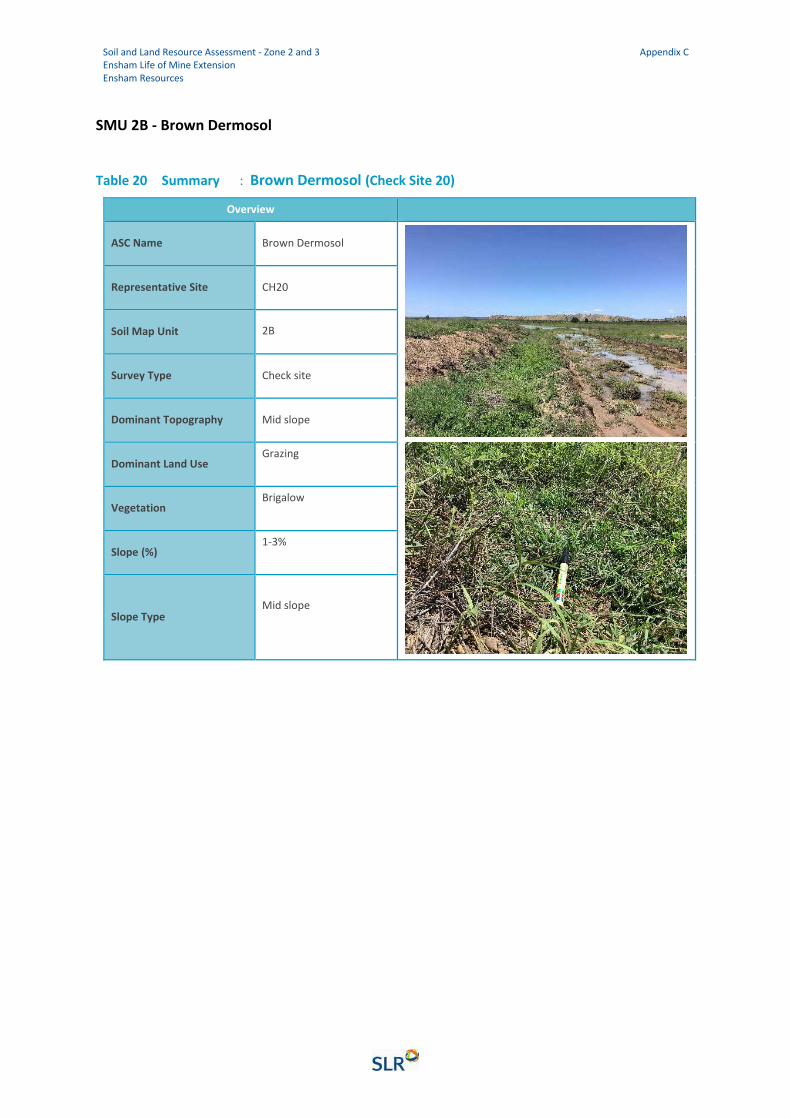
Soil and Land Resource Assessment - Zone 2 and 3 Ensham Life of Mine Extension Ensham Resources
Appendix C
SMU 2B - Brown Dermosol
Table 20 Summary : Brown Dermosol (Check Site 20)
Overview
ASC Name Brown Dermosol
Representative Site CH20
Soil Map Unit 2B
Survey Type Check site
Dominant Topography Mid slope
Dominant Land Use Grazing
Vegetation Brigalow
Slope (%) 1-3%
Slope Type
Mid slope
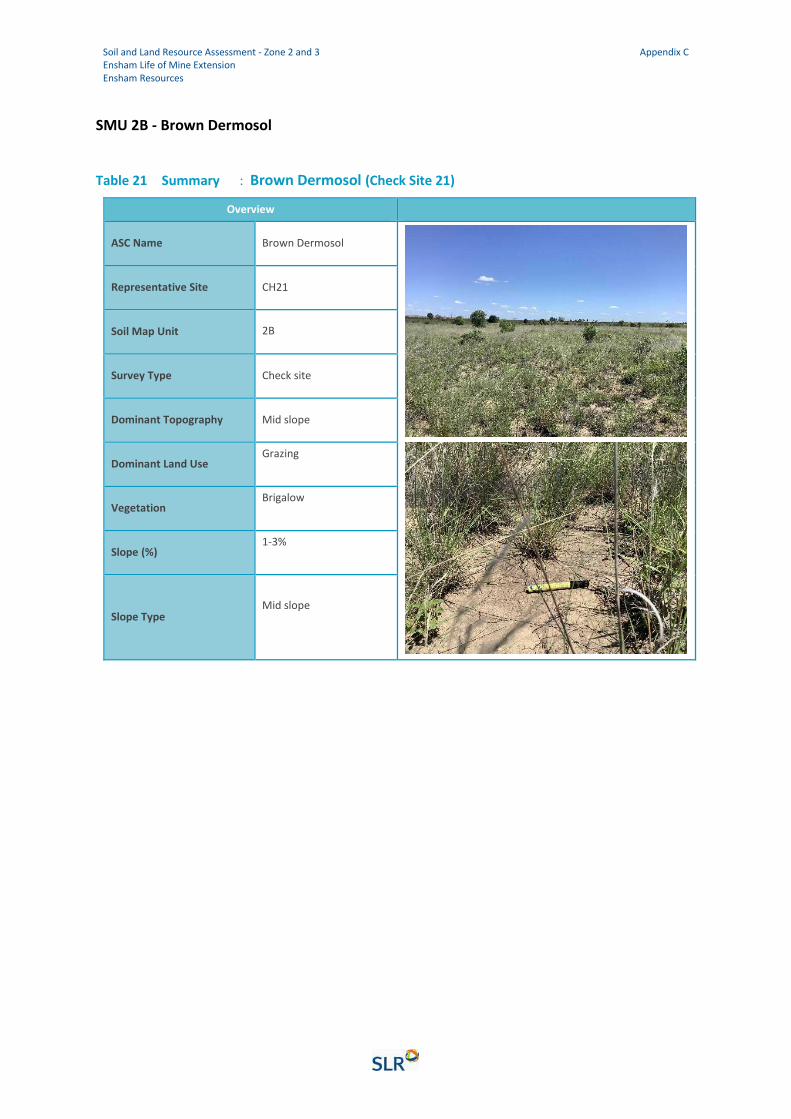
Soil and Land Resource Assessment - Zone 2 and 3 Ensham Life of Mine Extension Ensham Resources
Appendix C
SMU 2B - Brown Dermosol
Table 21 Summary : Brown Dermosol (Check Site 21)
Overview
ASC Name Brown Dermosol
Representative Site CH21
Soil Map Unit 2B
Survey Type Check site
Dominant Topography Mid slope
Dominant Land Use Grazing
Vegetation Brigalow
Slope (%) 1-3%
Slope Type
Mid slope
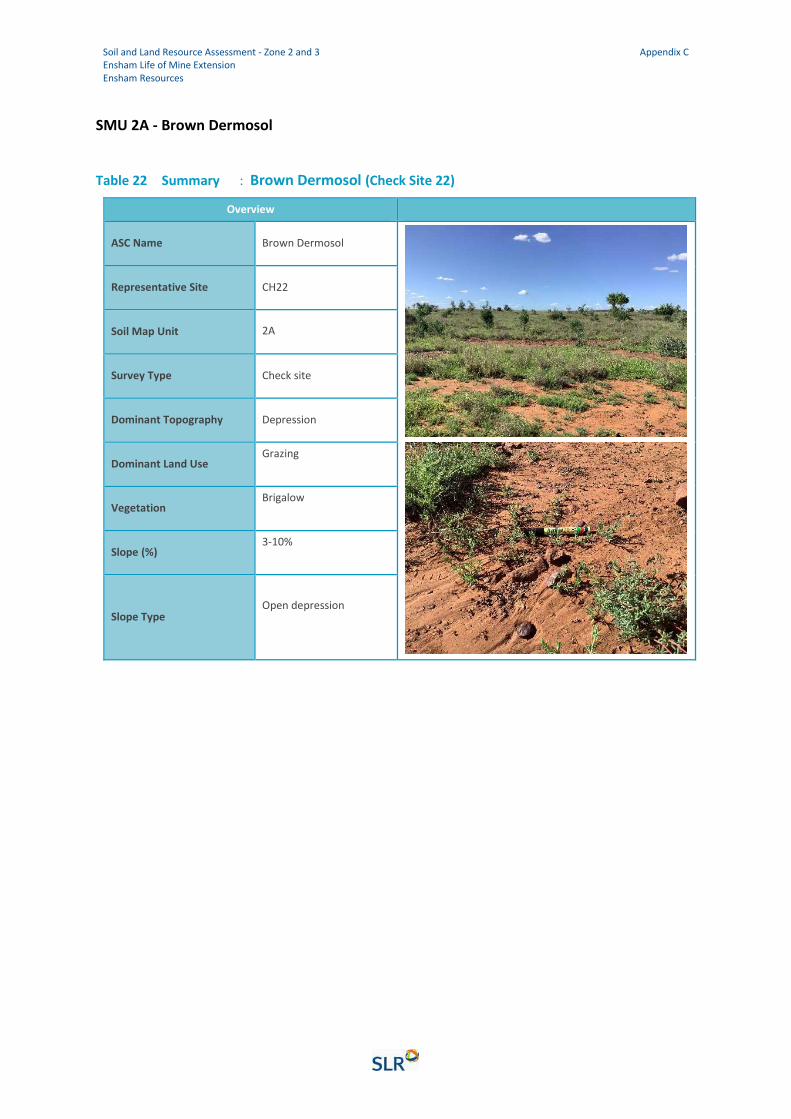
Soil and Land Resource Assessment - Zone 2 and 3 Ensham Life of Mine Extension Ensham Resources
Appendix C
SMU 2A - Brown Dermosol
Table 22 Summary : Brown Dermosol (Check Site 22)
Overview
ASC Name Brown Dermosol
Representative Site CH22
Soil Map Unit 2A
Survey Type Check site
Dominant Topography Depression
Dominant Land Use Grazing
Vegetation Brigalow
Slope (%) 3-10%
Slope Type
Open depression
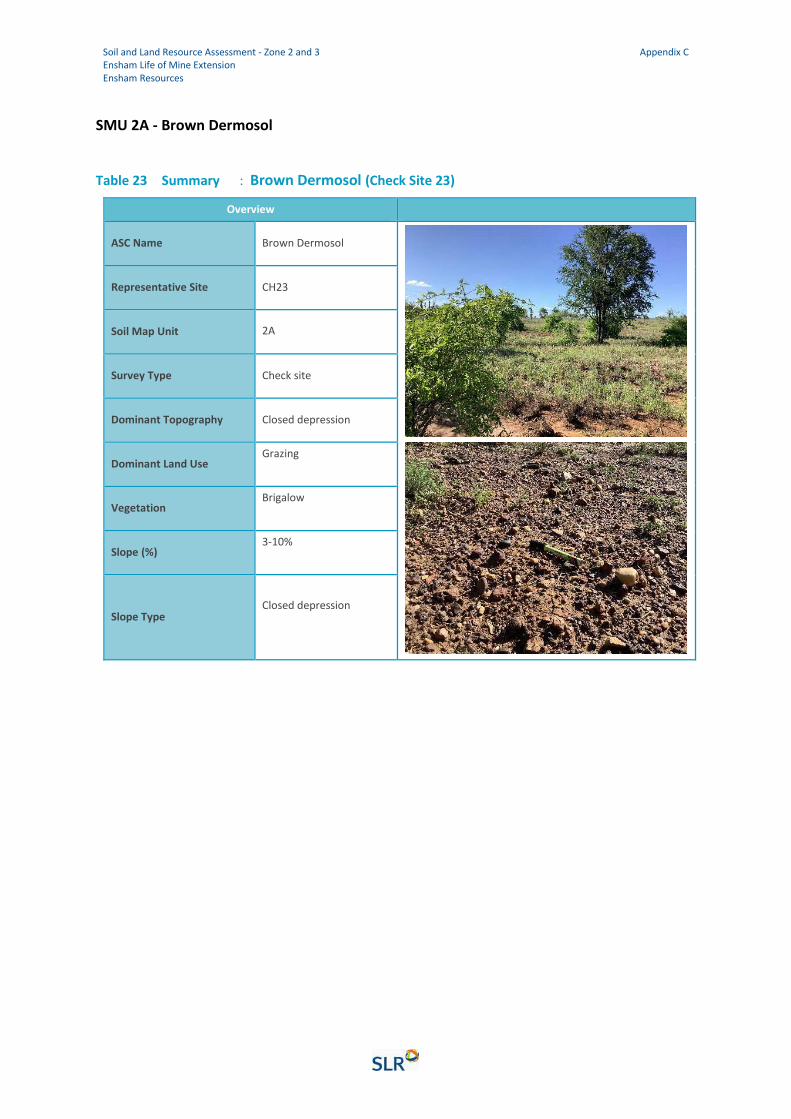
Soil and Land Resource Assessment - Zone 2 and 3 Ensham Life of Mine Extension Ensham Resources
Appendix C
SMU 2A - Brown Dermosol
Table 23 Summary : Brown Dermosol (Check Site 23)
Overview
ASC Name Brown Dermosol
Representative Site CH23
Soil Map Unit 2A
Survey Type Check site
Dominant Topography Closed depression
Dominant Land Use Grazing
Vegetation Brigalow
Slope (%) 3-10%
Slope Type
Closed depression
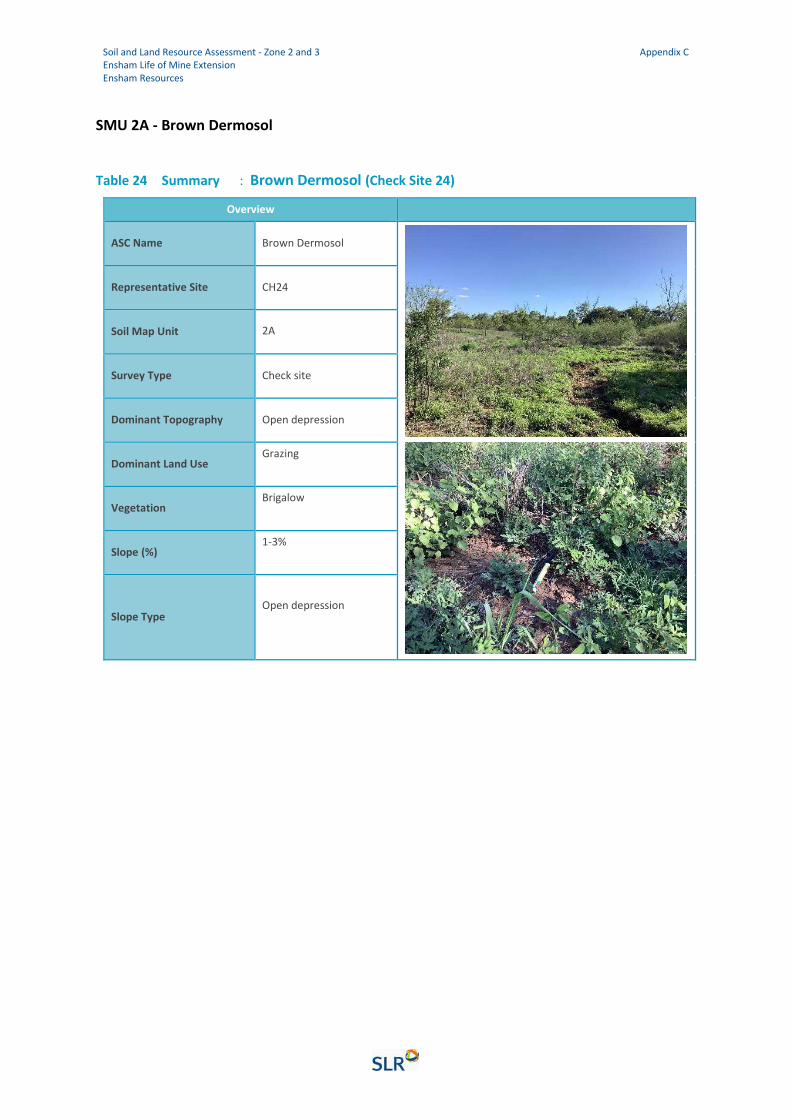
Soil and Land Resource Assessment - Zone 2 and 3 Ensham Life of Mine Extension Ensham Resources
Appendix C
SMU 2A - Brown Dermosol
Table 24 Summary : Brown Dermosol (Check Site 24)
Overview
ASC Name Brown Dermosol
Representative Site CH24
Soil Map Unit 2A
Survey Type Check site
Dominant Topography Open depression
Dominant Land Use Grazing
Vegetation Brigalow
Slope (%) 1-3%
Slope Type
Open depression
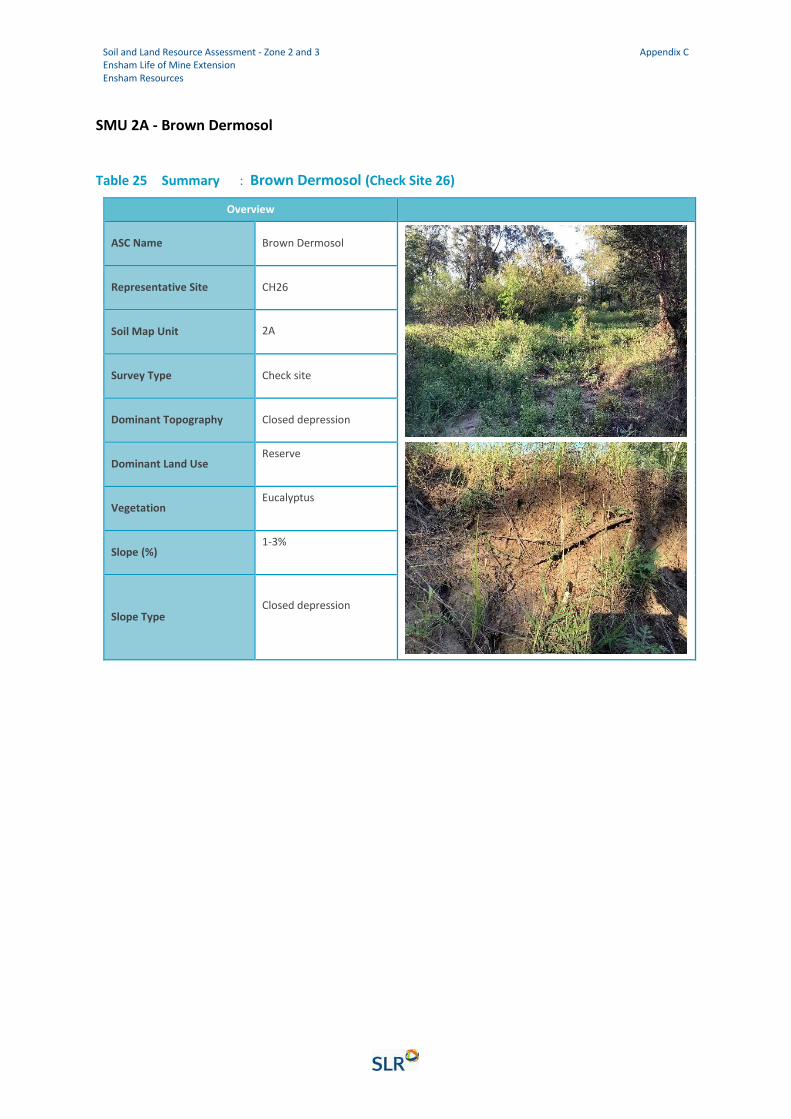
Soil and Land Resource Assessment - Zone 2 and 3 Ensham Life of Mine Extension Ensham Resources
Appendix C
SMU 2A - Brown Dermosol
Table 25 Summary : Brown Dermosol (Check Site 26)
Overview
ASC Name Brown Dermosol
Representative Site CH26
Soil Map Unit 2A
Survey Type Check site
Dominant Topography Closed depression
Dominant Land Use Reserve
Vegetation Eucalyptus
Slope (%) 1-3%
Slope Type
Closed depression

Ensham Resources Pty Ltd Ensham Life of Mine Extension Project - Zones 2 and 3 Land Resources
SLR Ref No: 620.30686.00000-R01-v4.0-RevF.docx March 2022
620.30686.00000-R01-v4.0-RevF.docx Page 3 of 5
APPENDIX D
Emerson Aggregate Test Ratings
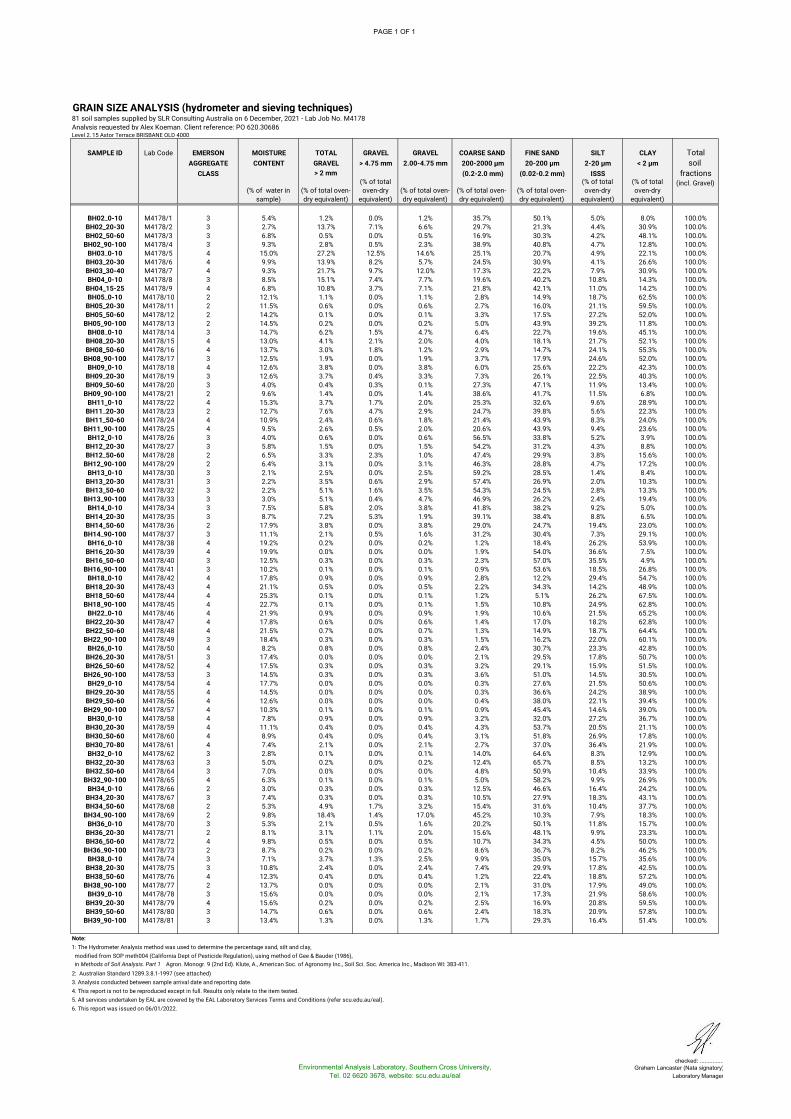
PAGE 1 OF 1
Environmental Analysis Laboratory, Southern Cross University, Tel. 02 6620 3678, website: scu.edu.au/eal
checked: ...............Graham Lancaster (Nata signatory)
Laboratory Manager
GRAIN SIZE ANALYSIS (hydrometer and sieving techniques) 81 soil samples supplied by SLR Consulting Australia on 6 December, 2021 - Lab Job No. M4178Analysis requested by Alex Koeman. Client reference: PO 620.30686Level 2, 15 Astor Terrace BRISBANE QLD 4000
SAMPLE ID Lab Code EMERSON MOISTURE TOTAL GRAVEL GRAVEL COARSE SAND FINE SAND SILT CLAY TotalAGGREGATE CONTENT GRAVEL > 4.75 mm 2.00-4.75 mm 200-2000 µm 20-200 µm 2-20 µm < 2 µm soil
CLASS > 2 mm (0.2-2.0 mm) (0.02-0.2 mm) ISSS fractions
(% of water in sample)
(% of total oven-dry equivalent)
(% of total oven-dry
equivalent)(% of total oven-dry equivalent)
(% of total oven-dry equivalent)
(% of total oven-dry equivalent)
(% of total oven-dry
equivalent)
(% of total oven-dry
equivalent)
(incl. Gravel)
BH02_0-10 M4178/1 3 5.4% 1.2% 0.0% 1.2% 35.7% 50.1% 5.0% 8.0% 100.0%BH02_20-30 M4178/2 3 2.7% 13.7% 7.1% 6.6% 29.7% 21.3% 4.4% 30.9% 100.0%BH02_50-60 M4178/3 3 6.8% 0.5% 0.0% 0.5% 16.9% 30.3% 4.2% 48.1% 100.0%
BH02_90-100 M4178/4 3 9.3% 2.8% 0.5% 2.3% 38.9% 40.8% 4.7% 12.8% 100.0%BH03_0-10 M4178/5 4 15.0% 27.2% 12.5% 14.6% 25.1% 20.7% 4.9% 22.1% 100.0%
BH03_20-30 M4178/6 4 9.9% 13.9% 8.2% 5.7% 24.5% 30.9% 4.1% 26.6% 100.0%BH03_30-40 M4178/7 4 9.3% 21.7% 9.7% 12.0% 17.3% 22.2% 7.9% 30.9% 100.0%BH04_0-10 M4178/8 3 8.5% 15.1% 7.4% 7.7% 19.6% 40.2% 10.8% 14.3% 100.0%
BH04_15-25 M4178/9 4 6.8% 10.8% 3.7% 7.1% 21.8% 42.1% 11.0% 14.2% 100.0%BH05_0-10 M4178/10 2 12.1% 1.1% 0.0% 1.1% 2.8% 14.9% 18.7% 62.5% 100.0%
BH05_20-30 M4178/11 2 11.5% 0.6% 0.0% 0.6% 2.7% 16.0% 21.1% 59.5% 100.0%BH05_50-60 M4178/12 2 14.2% 0.1% 0.0% 0.1% 3.3% 17.5% 27.2% 52.0% 100.0%
BH05_90-100 M4178/13 2 14.5% 0.2% 0.0% 0.2% 5.0% 43.9% 39.2% 11.8% 100.0%BH08_0-10 M4178/14 3 14.7% 6.2% 1.5% 4.7% 6.4% 22.7% 19.6% 45.1% 100.0%
BH08_20-30 M4178/15 4 13.0% 4.1% 2.1% 2.0% 4.0% 18.1% 21.7% 52.1% 100.0%BH08_50-60 M4178/16 4 13.7% 3.0% 1.8% 1.2% 2.9% 14.7% 24.1% 55.3% 100.0%
BH08_90-100 M4178/17 3 12.5% 1.9% 0.0% 1.9% 3.7% 17.9% 24.6% 52.0% 100.0%BH09_0-10 M4178/18 4 12.6% 3.8% 0.0% 3.8% 6.0% 25.6% 22.2% 42.3% 100.0%
BH09_20-30 M4178/19 3 12.6% 3.7% 0.4% 3.3% 7.3% 26.1% 22.5% 40.3% 100.0%BH09_50-60 M4178/20 3 4.0% 0.4% 0.3% 0.1% 27.3% 47.1% 11.9% 13.4% 100.0%
BH09_90-100 M4178/21 2 9.6% 1.4% 0.0% 1.4% 38.6% 41.7% 11.5% 6.8% 100.0%BH11_0-10 M4178/22 4 15.3% 3.7% 1.7% 2.0% 25.3% 32.6% 9.6% 28.9% 100.0%
BH11_20-30 M4178/23 2 12.7% 7.6% 4.7% 2.9% 24.7% 39.8% 5.6% 22.3% 100.0%BH11_50-60 M4178/24 4 10.9% 2.4% 0.6% 1.8% 21.4% 43.9% 8.3% 24.0% 100.0%
BH11_90-100 M4178/25 4 9.5% 2.6% 0.5% 2.0% 20.6% 43.9% 9.4% 23.6% 100.0%BH12_0-10 M4178/26 3 4.0% 0.6% 0.0% 0.6% 56.5% 33.8% 5.2% 3.9% 100.0%
BH12_20-30 M4178/27 3 5.8% 1.5% 0.0% 1.5% 54.2% 31.2% 4.3% 8.8% 100.0%BH12_50-60 M4178/28 2 6.5% 3.3% 2.3% 1.0% 47.4% 29.9% 3.8% 15.6% 100.0%
BH12_90-100 M4178/29 2 6.4% 3.1% 0.0% 3.1% 46.3% 28.8% 4.7% 17.2% 100.0%BH13_0-10 M4178/30 3 2.1% 2.5% 0.0% 2.5% 59.2% 28.5% 1.4% 8.4% 100.0%
BH13_20-30 M4178/31 3 2.2% 3.5% 0.6% 2.9% 57.4% 26.9% 2.0% 10.3% 100.0%BH13_50-60 M4178/32 3 2.2% 5.1% 1.6% 3.5% 54.3% 24.5% 2.8% 13.3% 100.0%
BH13_90-100 M4178/33 3 3.0% 5.1% 0.4% 4.7% 46.9% 26.2% 2.4% 19.4% 100.0%BH14_0-10 M4178/34 3 7.5% 5.8% 2.0% 3.8% 41.8% 38.2% 9.2% 5.0% 100.0%
BH14_20-30 M4178/35 3 8.7% 7.2% 5.3% 1.9% 39.1% 38.4% 8.8% 6.5% 100.0%BH14_50-60 M4178/36 2 17.9% 3.8% 0.0% 3.8% 29.0% 24.7% 19.4% 23.0% 100.0%
BH14_90-100 M4178/37 3 11.1% 2.1% 0.5% 1.6% 31.2% 30.4% 7.3% 29.1% 100.0%BH16_0-10 M4178/38 4 19.2% 0.2% 0.0% 0.2% 1.2% 18.4% 26.2% 53.9% 100.0%
BH16_20-30 M4178/39 4 19.9% 0.0% 0.0% 0.0% 1.9% 54.0% 36.6% 7.5% 100.0%BH16_50-60 M4178/40 3 12.5% 0.3% 0.0% 0.3% 2.3% 57.0% 35.5% 4.9% 100.0%
BH16_90-100 M4178/41 3 10.2% 0.1% 0.0% 0.1% 0.9% 53.6% 18.5% 26.8% 100.0%BH18_0-10 M4178/42 4 17.8% 0.9% 0.0% 0.9% 2.8% 12.2% 29.4% 54.7% 100.0%
BH18_20-30 M4178/43 4 21.1% 0.5% 0.0% 0.5% 2.2% 34.3% 14.2% 48.9% 100.0%BH18_50-60 M4178/44 4 25.3% 0.1% 0.0% 0.1% 1.2% 5.1% 26.2% 67.5% 100.0%
BH18_90-100 M4178/45 4 22.7% 0.1% 0.0% 0.1% 1.5% 10.8% 24.9% 62.8% 100.0%BH22_0-10 M4178/46 4 21.9% 0.9% 0.0% 0.9% 1.9% 10.6% 21.5% 65.2% 100.0%
BH22_20-30 M4178/47 4 17.8% 0.6% 0.0% 0.6% 1.4% 17.0% 18.2% 62.8% 100.0%BH22_50-60 M4178/48 4 21.5% 0.7% 0.0% 0.7% 1.3% 14.9% 18.7% 64.4% 100.0%
BH22_90-100 M4178/49 3 18.4% 0.3% 0.0% 0.3% 1.5% 16.2% 22.0% 60.1% 100.0%BH26_0-10 M4178/50 4 8.2% 0.8% 0.0% 0.8% 2.4% 30.7% 23.3% 42.8% 100.0%
BH26_20-30 M4178/51 3 17.4% 0.0% 0.0% 0.0% 2.1% 29.5% 17.8% 50.7% 100.0%BH26_50-60 M4178/52 4 17.5% 0.3% 0.0% 0.3% 3.2% 29.1% 15.9% 51.5% 100.0%
BH26_90-100 M4178/53 3 14.5% 0.3% 0.0% 0.3% 3.6% 51.0% 14.5% 30.5% 100.0%BH29_0-10 M4178/54 4 17.7% 0.0% 0.0% 0.0% 0.3% 27.6% 21.5% 50.6% 100.0%
BH29_20-30 M4178/55 4 14.5% 0.0% 0.0% 0.0% 0.3% 36.6% 24.2% 38.9% 100.0%BH29_50-60 M4178/56 4 12.6% 0.0% 0.0% 0.0% 0.4% 38.0% 22.1% 39.4% 100.0%
BH29_90-100 M4178/57 4 10.3% 0.1% 0.0% 0.1% 0.9% 45.4% 14.6% 39.0% 100.0%BH30_0-10 M4178/58 4 7.8% 0.9% 0.0% 0.9% 3.2% 32.0% 27.2% 36.7% 100.0%
BH30_20-30 M4178/59 4 11.1% 0.4% 0.0% 0.4% 4.3% 53.7% 20.5% 21.1% 100.0%BH30_50-60 M4178/60 4 8.9% 0.4% 0.0% 0.4% 3.1% 51.8% 26.9% 17.8% 100.0%BH30_70-80 M4178/61 4 7.4% 2.1% 0.0% 2.1% 2.7% 37.0% 36.4% 21.9% 100.0%BH32_0-10 M4178/62 3 2.8% 0.1% 0.0% 0.1% 14.0% 64.6% 8.3% 12.9% 100.0%
BH32_20-30 M4178/63 3 5.0% 0.2% 0.0% 0.2% 12.4% 65.7% 8.5% 13.2% 100.0%BH32_50-60 M4178/64 3 7.0% 0.0% 0.0% 0.0% 4.8% 50.9% 10.4% 33.9% 100.0%
BH32_90-100 M4178/65 4 6.3% 0.1% 0.0% 0.1% 5.0% 58.2% 9.9% 26.9% 100.0%BH34_0-10 M4178/66 2 3.0% 0.3% 0.0% 0.3% 12.5% 46.6% 16.4% 24.2% 100.0%
BH34_20-30 M4178/67 3 7.4% 0.3% 0.0% 0.3% 10.5% 27.9% 18.3% 43.1% 100.0%BH34_50-60 M4178/68 2 5.3% 4.9% 1.7% 3.2% 15.4% 31.6% 10.4% 37.7% 100.0%
BH34_90-100 M4178/69 2 9.8% 18.4% 1.4% 17.0% 45.2% 10.3% 7.9% 18.3% 100.0%BH36_0-10 M4178/70 3 5.3% 2.1% 0.5% 1.6% 20.2% 50.1% 11.8% 15.7% 100.0%
BH36_20-30 M4178/71 2 8.1% 3.1% 1.1% 2.0% 15.6% 48.1% 9.9% 23.3% 100.0%BH36_50-60 M4178/72 4 9.8% 0.5% 0.0% 0.5% 10.7% 34.3% 4.5% 50.0% 100.0%
BH36_90-100 M4178/73 2 8.7% 0.2% 0.0% 0.2% 8.6% 36.7% 8.2% 46.2% 100.0%BH38_0-10 M4178/74 3 7.1% 3.7% 1.3% 2.5% 9.9% 35.0% 15.7% 35.6% 100.0%
BH38_20-30 M4178/75 3 10.8% 2.4% 0.0% 2.4% 7.4% 29.9% 17.8% 42.5% 100.0%BH38_50-60 M4178/76 4 12.3% 0.4% 0.0% 0.4% 1.2% 22.4% 18.8% 57.2% 100.0%
BH38_90-100 M4178/77 2 13.7% 0.0% 0.0% 0.0% 2.1% 31.0% 17.9% 49.0% 100.0%BH39_0-10 M4178/78 3 15.6% 0.0% 0.0% 0.0% 2.1% 17.3% 21.9% 58.6% 100.0%
BH39_20-30 M4178/79 4 15.6% 0.2% 0.0% 0.2% 2.5% 16.9% 20.8% 59.5% 100.0%BH39_50-60 M4178/80 3 14.7% 0.6% 0.0% 0.6% 2.4% 18.3% 20.9% 57.8% 100.0%
BH39_90-100 M4178/81 3 13.4% 1.3% 0.0% 1.3% 1.7% 29.3% 16.4% 51.4% 100.0%
Note: 1: The Hydrometer Analysis method was used to determine the percentage sand, silt and clay, modified from SOP meth004 (California Dept of Pesticide Regulation), using method of Gee & Bauder (1986), in Methods of Soil Analysis. Part 1 Agron. Monogr. 9 (2nd Ed). Klute, A., American Soc. of Agronomy Inc., Soil Sci. Soc. America Inc., Madison WI: 383-411.2: Australian Standard 1289.3.8.1-1997 (see attached)3. Analysis conducted between sample arrival date and reporting date.4. This report is not to be reproduced except in full. Results only relate to the item tested.5. All services undertaken by EAL are covered by the EAL Laboratory Services Terms and Conditions (refer scu.edu.au/eal).6. This report was issued on 06/01/2022.
Ensham Resources Pty Ltd Ensham Life of Mine Extension Project - Zones 2 and 3 Land Resources
SLR Ref No: 620.30686.00000-R01-v4.0-RevF.docx March 2022
620.30686.00000-R01-v4.0-RevF.docx Page 5 of 5
APPENDIX E
Land Suitability and Agricultural Land Classification

Ensham Resources Pty Ltd Ensham Life of Mine Extension Project - Zones 2 and 3 Land Resources
SLR Ref No: 620.30686.00000-R01-v4.0-RevF.docx March 2022
620.30686.00000-R01-v4.0-RevF.docx Page 1
SMU
E Es M M M Pm Ps R R Tm W W W
SUITABILITY CLASS - Cropping
Water erosio
n
Erosion hazard, subsoil
erodibility
Soil Water availabilit
y
Soil Water availabilit
y
Soil Water availabilit
y
Narrow moisture range
Surface conditio
n
Rockiness
Rockiness
Microrelief
Wetness
Wetness
Wetness
1 1 1 3 3 4 4 3 1 1 1 1 1 2 4
2A 5 4 4 5 5 4 3 2 3 1 4 4 4 5
2B 5 3 5 5 5 4 2 3 4 1 4 4 4 5
3 5 5 5 5 5 4 4 3 4 1 4 4 4 5
4 5 4 5 5 5 4 2 5 5 1 5 5 5 5
Dominant Soil Type SMU LAND SUITABILITY CLASS - Cropping
LAND SUITABILITY CLASS - Grazing
AGRICULTURAL LAND CLASS
Crusty Brown Vertosols 1 4 2 A2
Eutrophic Brown Dermosols 2A 5 3 C2
Eutrophic Brown Dermosols 2B 5 3 C2
Magnesic Brown Kandosols 3 5 3 C2
Clastic Rudosols 4 5 5 C3
ASIA PACIFIC OFFICES
ADELAIDE
60 Halifax Street
Adelaide SA 5000
Australia
T: +61 431 516 449
BRISBANE
Level 16, 175 Eagle Street
Brisbane QLD 4000
Australia
T: +61 7 3858 4800
F: +61 7 3858 4801
CAIRNS
Level 1 Suite 1.06
Boland’s Centre
14 Spence Street
Cairns QLD 4870
Australia
T: +61 7 4722 8090
CANBERRA
GPO 410
Canberra ACT 2600
Australia
T: +61 2 6287 0800
F: +61 2 9427 8200
DARWIN
Unit 5, 21 Parap Road
Parap NT 0820
Australia
T: +61 8 8998 0100
F: +61 8 9370 0101
GOLD COAST
Level 2, 194 Varsity Parade
Varsity Lakes QLD 4227
Australia
M: +61 438 763 516
MACKAY
21 River Street
Mackay QLD 4740
Australia
T: +61 7 3181 3300
MELBOURNE
Level 11, 176 Wellington Parade
East Melbourne VIC 3002
Australia
T: +61 3 9249 9400
F: +61 3 9249 9499
NEWCASTLE CBD
Suite 2B, 125 Bull Street
Newcastle West NSW 2302
Australia
T: +61 2 4940 0442
NEWCASTLE
10 Kings Road
New Lambton NSW 2305
Australia
T: +61 2 4037 3200
F: +61 2 4037 3201
PERTH
Grd Floor, 503 Murray Street
Perth WA 6000
Australia
T: +61 8 9422 5900
F: +61 8 9422 5901
SYDNEY
Tenancy 202 Submarine School
Sub Base Platypus
120 High Street
North Sydney NSW 2060
Australia
T: +61 2 9427 8100
F: +61 2 9427 8200
TOWNSVILLE
12 Cannan Street
South Townsville QLD 4810
Australia
T: +61 7 4722 8000
F: +61 7 4722 8001
WOLLONGONG
Level 1, The Central Building
UoW Innovation Campus
North Wollongong NSW 2500
Australia
T: +61 2 4249 1000
AUCKLAND
Level 4, 12 O'Connell Street
Auckland 1010
New Zealand
T: 0800 757 695
NELSON
6/A Cambridge Street
Richmond, Nelson 7020
New Zealand
T: +64 274 898 628
WELLINGTON
12A Waterloo Quay
Wellington 6011
New Zealand
T: +64 2181 7186
SINGAPORE
39b Craig Road
Singapore 089677
T: +65 6822 2203

L\343884466.1
APPENDIX DSubsidence Report
GORDON GEOTECHNIQUES PTY LTD ACN 127 420 839
GORDON GEOTECHNIQUES
SUBSIDENCE REPORT FOR THE
ENSHAM LIFE OF MINE EXTENSION – ZONES 2 AND 3
Prepared for
Ensham Resources Pty Ltd
JANUARY 2022
SUBSIDENCE REPORT FOR THE ENSHAM
LIFE OF MINE EXTENSION – ZONES 2 AND 3
Final ii
GORDON GEOTECHNIQUES
EXECUTIVE SUMMARY
Ensham Mine is an existing open-cut and underground bord and pillar coal mine located approximately 35 kilometres (km) east of Emerald in Queensland. The Ensham Life of Mine Extension Project - Zones 2 and 3 (the Project) proposes to increase the life of the existing underground operations by extending the underground bord and pillar mine into Zones 2 and 3 within Mining Leases (ML) 7459, ML70326, ML70365, and, ML7459 and 70366 respectively.
The Project would produce at up to approximately 4.5 million tonnes of product coal per annum and would extend the Ensham Life of Mine (LOM) by up to one year to approximately 2029. Without zones 2 and 3, the current underground operations will become physically restrained to lower production levels and would affect the overall economic viability of the mine.
The extension of the underground operation using existing infrastructure means that no material surface construction or surface disturbance (other than the installation of four flares to be located on already cleared land) will be required to facilitate the Project.
The Project will operate using the same bord and pillar and single seam mining method currently being used on site. This mining system forms a regular array of long-term stable coal pillars and roadways in each panel and does not cause large scale overburden fracturing and subsidence. Where the Nogoa River flows through Zone 2, no mining beneath the river is proposed. In addition, greater than 75% of the Project area is located outside the flood plain.
The assessment of the long-term stability of the Project coal pillars resulting from the proposed underground mine has been undertaken using the industry accepted University of New South Wales Pillar Design Procedure. The subsidence predictions from the assessment have been verified to a high level of confidence using information from the existing bord and pillar operations at Ensham Mine site. The subsidence assessment is based on the Project design minimum pillar Factor of Safety (FoS) of 1.6 for areas beneath the floodplain, and 2.11 for access roadways beneath the Nogoa River to connect bord and pillar workings, and, for bord and pillar workings beneath the Nogoa River anabranch, has confirmed the long-term stability of the proposed mine layout. The assessment also considers the width: height ratios of the pillars, as well as the estimated critical level of overburden displacement.
The design criteria used to ensure long-term stability of the pillars has also been peer reviewed by three industry recognised (RPEQ) geotechnical consultants Mine Advice (Dr Russell Frith), Byrnes Geotechnical (Dr Ross Seedsman), and BK Hebblewhite Consulting (Emeritus Professor Bruce Hebblewhite), who all concluded that the proposed bord and pillar layout is an appropriate and well developed geotechnical design.
SUBSIDENCE REPORT FOR THE ENSHAM
LIFE OF MINE EXTENSION – ZONES 2 AND 3
Final iii
GORDON GEOTECHNIQUES
The temporary increase in cover depth during 0.1% AEP (Q1000) flood events has also been calculated below both the flood plain and Nogoa River and anabranch channels. Conservative maximum flood depth values of 16 m in the Nogoa River channel and 4 m across the flood plain have been used in the FoS calculations. The temporary increase in depth has been applied to the design figures to calculate the required mining height to satisfy the Project FoS during 0.1% AEP flood events.
As well as the factor of safety approach, the long-term life expectancy of pillars can be estimated using empirical studies from South Africa. Using this methodology, the proposed 24 m x 28 m (centres) pillars in the Project area, at 4.5 m high and 130 m depth of cover, are calculated to be stable in excess of 26,000 years. Furthermore in regards to long-term stability, after mining is completed and the workings flood with groundwater, the buoyancy effect of the groundwater will reduce the vertical load on the pillars by up to 40%. For a pillar below the Nogoa River anabranch, designed with a FoS of 2.11, at 140 m depth of cover, reducing the vertical load on the pillar by a conservative 25%, to account for any potential strength loss in the coal and surrounding strata, increases the FoS to 2.82. This FoS has a probability of failure well in excess of 1 in 10,000,000.
Due to the nature of the bord and pillar mining method, subsidence is predicted to be less than 30 mm in majority of the Project area, with localised areas less than 35 mm. This is as a result of elastic compression of the strata i.e. compression due to the additional load on the pillars after the coal is extracted. To provide context, the Australian Government Department of the Agriculture, Water and the Environment (DAWE) states that seasonal variation in surface levels can be up to 50 mm or more as a result of changes in moisture content.
Recent RTK (Real Time Kinematic) GPS monitoring at Ensham indicates subsidence levels of less than 10 mm above mined underground panels and confirms the predictions for the Project. This monitoring has an accuracy of ±5 mm and is able to detect the low levels of movement predicted for the Project. Further baseline reference and ongoing monitoring data will continue to be collected to ensure that any minor subsidence is occurring and recorded, and if so that mitigation measures are put in place where required, consistent with the SMP.
Based on the available data for the Project, including high density exploration boreholes, 3D seismic and underground geological mapping, there are no localised features or variations in the geology, geotechnical conditions or surface topography that are considered likely to result in any significant deviations from the subsidence predictions presented in this report.
There is therefore a high degree of confidence in the subsidence predictions due to the accurate RTK-GPS monitoring data above existing bord and pillar mining areas at Ensham with the Project design having similar mining heights, depth of cover and mining methodology. This information has allowed a robust calibration to be achieved and provided a sound basis to enable conservative subsidence predictions.
SUBSIDENCE REPORT FOR THE ENSHAM
LIFE OF MINE EXTENSION – ZONES 2 AND 3
Final iv
GORDON GEOTECHNIQUES
Due to the low levels of subsidence and associated strains and tilts, no surface cracking is anticipated within the Project area. The expected low levels of subsidence are also unlikely to result in the formation of significant depressions in the surface topography, where ponding of the surface drainage may occur. This is consistent with experience at the existing Ensham Mine operations, where no surface cracking or ponding has been observed above the bord and pillar mine that has been operating for more than 10 years.
Based on mining experience at shallow depths of cover in the current Ensham underground workings, as well as experience at other mining operations around the world, the risk of sinkhole subsidence occurring in the Project area, where the depth of cover for the entire area of mining is greater than 75 m, is therefore considered to be negligible.
To address the monitoring and management of any subsidence impacts, a Subsidence Management Plan (SMP) has been developed. This plan includes the triggers for investigation of any potential subsidence impacts, soil types, guidance on surface inspections, groundwater monitoring, mitigation and management measures as well as guidelines for landowner consultation if required.
SUBSIDENCE REPORT FOR THE ENSHAM
LIFE OF MINE EXTENSION – ZONES 2 AND 3
Final v
GORDON GEOTECHNIQUES
TABLE OF CONTENTS
EXECUTIVE SUMMARY ............................................................................................. ii
1 INTRODUCTION ................................................................................................. 1
1.1 Project Description ....................................................................................... 2
1.2 Project Setting .............................................................................................. 3
1.3 Project Mining Method .................................................................................. 4
1.4 Objectives .................................................................................................... 9
1.5 Report Structure ........................................................................................... 9
2 ENGINEERING GEOLOGY .............................................................................. 10
2.1 Geological Data .......................................................................................... 10
2.2 Stratigraphy ................................................................................................ 11
2.3 Seam Thickness ......................................................................................... 12
2.4 Depth of Cover ........................................................................................... 13
2.5 Depth of Weathering .................................................................................. 14
3 PREVIOUS SUBSIDENCE MONITORING DATA ............................................. 15
3.1 Ensham Mine ............................................................................................. 15
3.1.1 Fixed RTK-GPS Monitoring ................................................................. 15
3.1.2 LIDAR ................................................................................................. 20
3.1.3 Monitoring Review ............................................................................... 22
3.2 Clarence Mine ............................................................................................ 23
3.3 Tasman Mine ............................................................................................. 24
4 SUBSIDENCE PREDICTION METHODOLOGY AND RESULTS ..................... 27
4.1 Stability of Underground Workings ............................................................. 27
4.1.1 Factor of Safety ................................................................................... 27
4.1.2 Width to Height Ratio .......................................................................... 34
4.1.3 Criteria for Pillar Design ...................................................................... 35
4.1.4 Long Term Stability of the Overburden ............................................... 38
4.1.5 Comparison to Other Mines ................................................................ 38
4.1.6 Pillar Spalling ...................................................................................... 40
4.1.7 Potential For Sinkhole Subsidence ..................................................... 43
4.2 Subsidence Behaviour ............................................................................... 47
4.2.1 Bearing Capacity Failure of the Floor Beneath the Pillars ................... 48
4.2.2 Flooding Workings .............................................................................. 49
4.2.3 Strata Compression ............................................................................ 50
4.3 Prediction of Project Subsidence Effects .................................................... 56
4.3.1 Subsidence in the Project Mining Area ............................................... 56
4.3.2 Surface Cracking ................................................................................. 60
4.3.3 Sub-surface Cracking .......................................................................... 61
4.3.4 Limitations of the Subsidence Predictions ........................................... 61
5 CONCLUSIONS ................................................................................................ 62
SUBSIDENCE REPORT FOR THE ENSHAM
LIFE OF MINE EXTENSION – ZONES 2 AND 3
Final vi
GORDON GEOTECHNIQUES
6 APPENDIX 1. PANEL DATA – ZONE 2 AND ZONE 3 ..................................... 64
List of Figures
Figure 1. Location Plan – Ensham Mine Site ............................................................. 1
Figure 2. Access to the Underground Workings from Ramp 3 ................................... 2
Figure 3. Location of Workings in Zone 2 under the Nogoa River and Anabranch. ... 3
Figure 4. Surface Topography ................................................................................... 4
Figure 5. Bord and Pillar Layout Terminology ............................................................ 5
Figure 6. 6.5 m Wide x 3.3 m High Development Roadway (Bord) at Ensham ......... 6
Figure 7. 5.5-6.5 m Wide x 4.8 m High Roadway after Floor Coaling at Ensham ...... 7
Figure 8. Bord and Pillar Panel Nomenclature and Outline of 3D Seismic ................ 8
Figure 9. Location of Exploration Boreholes ............................................................ 10
Figure 10. Permian Coal Seams across the Ensham Area...................................... 11
Figure 11. Working Section Thickness .................................................................... 12
Figure 12. Working Section Depth ........................................................................... 13
Figure 13. Depth of Weathering ............................................................................... 14
Figure 14. Fixed GPS Monitoring Station ................................................................ 15
Figure 15. Location of Remote Subsidence Monitoring – Ensham Underground .... 16
Figure 16. Subsidence Monitoring above 503 Panel ............................................... 17
Figure 17. Subsidence Monitoring above 500 Mains and 502 Panel ....................... 18
Figure 18. Subsidence Monitoring above 114 Panel ............................................... 19
Figure 19. Extent of the Mine Workings at the time of each LIDAR Survey ............. 20
Figure 20. Section Line above 204 Panel ................................................................ 21
Figure 21. Section Line along the 105 Panel Belt Road .......................................... 22
Figure 22. Bord and Pillar Layout – Clarence Mine ................................................. 24
Figure 23. Subsidence over 3 North Panel at Tasman ............................................ 26
Figure 24. Influence of Panel Width on Pillar Load .................................................. 28
Figure 25. Paint Marks to Control the Thickness of Floor Coal Mined. .................... 30
Figure 26. Standard Pillars - Maximum Mining Height for a FoS of 1.6 ................... 31
Figure 27. Comparison of Bell Out and Standard Pillars ......................................... 32
Figure 28. Calculation of the Effective Width of the Bell Out Pillars ......................... 33
Figure 29. Bell Out Pillars - Maximum Mining Heights for a FoS of 1.6 ................... 33
Figure 30. Scaled Diagram of the Rib Canches Left Around Pillars ........................ 34
Figure 31. Post-failure Stiffness of Coal Pillars as a Function of Width to Height .... 35
Figure 32. Design Criteria for Bord and Pillar Workings .......................................... 36
Figure 33. Kinematic Failure of Wedges .................................................................. 37
Figure 34. Impact of Geological Structure ............................................................... 37
Figure 35. Summary of Pillar Design at Ensham ..................................................... 39
Figure 36. Factor of Safety versus Time to Failure .................................................. 40
Figure 37. Factor of Safety vs Depth of Cover ......................................................... 41
SUBSIDENCE REPORT FOR THE ENSHAM
LIFE OF MINE EXTENSION – ZONES 2 AND 3
Final vii
GORDON GEOTECHNIQUES
Figure 38. Typical Thin Rib Spall at Ensham after Secondary Coal Recovery – F23-24, 109A Panel .................................................................................................. 42
Figure 39. Illustration of Suggested Sinkhole Development Mechanism (Whittaker and Reddish, 1989). ................................................................................................. 44
Figure 40. Limiting Equilibrium Analysis for Sinkhole Subsidence above 6.5 m Wide Roadways. ......................................................................................................... 46
Figure 41. Limiting Equilibrium Analysis for Sinkhole Subsidence above Intersections and Bell Outs. .................................................................................................... 47
Figure 42. Bearing Capacity Analysis ...................................................................... 48
Figure 43. Minor Cracking of the Coal Floor, 101 Panel .......................................... 49
Figure 44. Average Strength for the Stone Roof 0 m to 17.5 m Interval .................. 51
Figure 45. Average Strength for the Stone Floor 0 m to 17.5 m Interval ................. 52
Figure 46. Determination of the Geological Strength Index (GSI) ............................ 53
Figure 47. Aries-Castor Seam Roof and Floor (Zone 2) – Borehole C4858 ............ 54
Figure 48. Aries-Castor Seam Roof and Floor (Zone 3) – Borehole C5384 ............ 54
Figure 49. Castor Seam Roof and Floor (Zone 2) - Borehole C4954 ...................... 55
Figure 50. Castor Seam Roof and Floor (Zone 3) - Borehole C4986 ...................... 55
Figure 51. Subsidence above the Panel Pillars in the Project area ......................... 57
Figure 52. Subsidence above the Sub Panel Pillars in the Project area .................. 58
Figure 53. Subsidence above the Bell Out Pillars in the Project area ...................... 59
List of Tables
Table 1. Calibration of Subsidence Data. ................................................................ 60
List of Abbreviations
AHD - Australian Height Datum
D - Disturbance Factor
DAWE- Department of the Agriculture, Water and the Environment
EA - Environmental Authority
Ei - Laboratory Modulus
Erm - Rock Mass Modulus
FoS - Factor of Safety
GGPL - Gordon Geotechniques Pty Ltd
GPS - Global Positioning System
GSI - Geological Strength Index
LIDAR - Light Detection and Ranging
LOM - Life of Mine
ML - Mining Lease
RTK - Real Time Kinematic
UCS - Uniaxial Compressive Strength
SUBSIDENCE REPORT FOR THE ENSHAM
LIFE OF MINE EXTENSION – ZONES 2 AND 3
Final viii
GORDON GEOTECHNIQUES
Glossary
Bell out An area on the perimeter of the panels where coal is mined and ground support is not installed.
Bord A roadway developed in an underground mine.
Empirical Based or acting on observation and experiment, not on theory.
Floor Strata immediately below the mined seam.
Inbye Direction towards the coal face.
Modulus The ratio between applied stress and resultant strain.
Outbye Direction away from the coal face.
Overburden Sequence of strata above the mined seam.
Pillar Coal that is not mined within the underground workings.
Roof Strata immediately above the mined seam.
Secondary Coal Mining of floor coal and bell outs.
Recovery
Stratigraphy A branch of geology that studies rock layers and layering. It is primarily used in the study of sedimentary and layered volcanic rocks.
Subsidence Sinking or settlement of the land surface, due to any of several processes. As commonly used, the term relates to the vertical downward movement of natural surfaces although small-scale horizontal components may be present. The term does not include landslides, which have large-scale horizontal displacements, or settlements of artificial fills.
Strain Relative change in the volume, area or length of a body as a result of stress. The change is expressed in terms of the amount of displacement measured in the body divided by its original volume, area, or length, and referred to as either a volume strain, areal strain, or one-dimensional strain, respectively. The unit measure of strain is dimensionless, as its value represents the fractional change from the former size.
Tilt The rate of change in vertical subsidence between two points divided by the horizontal distance between those two points.
Document Status
Revision No.
Date Purpose of Issue Prepared
By Approved for Issue
By
1 18/12/21 Draft N. Gordon G. Gough
2 14/01/22 Final N. Gordon G. Gough

SUBSIDENCE REPORT FOR THE ENSHAM
LIFE OF MINE EXTENSION – ZONES 2 AND 3
Final 1
GORDON GEOTECHNIQUES
1 INTRODUCTION
Gordon Geotechniques Pty Ltd (GGPL) was commissioned by Ensham Resources Pty Ltd (Ensham Resources) to assess the potential impacts of the proposed Ensham Life of Mine Extension Project – Zones 2 and 3 (the Project) on subsidence values, in support of the Environmental Authority (EA) amendment application for the Project.
Ensham Mine is an existing open-cut and underground bord and pillar coal mine located approximately 35 kilometres (km) east of Emerald in Queensland. The Ensham Life of Mine Extension Project - Zones 2 and 3 proposes to increase the life of the existing underground operations by extending the underground bord and pillar mine into Zones 2 and 3 within Mining Leases (ML) 7459, ML70326, ML70365, and, ML7459 and 70366 respectively (Figure 1).
Figure 1. Location Plan – Ensham Mine Site
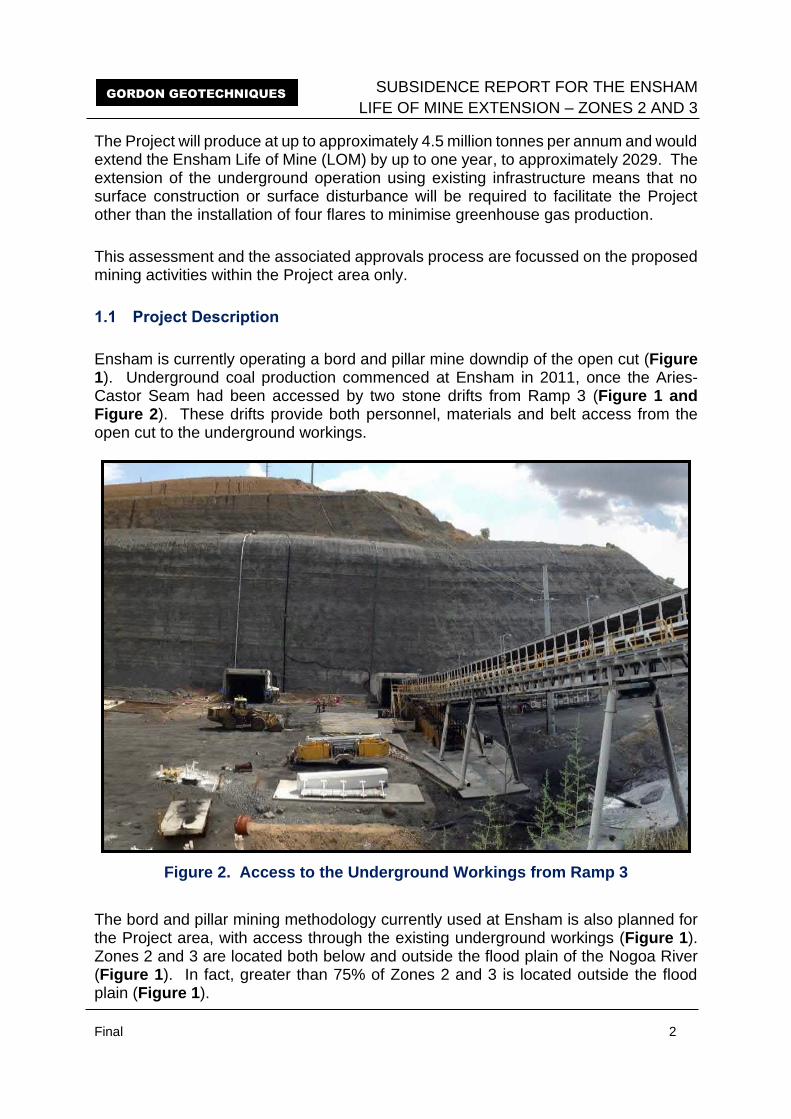
SUBSIDENCE REPORT FOR THE ENSHAM
LIFE OF MINE EXTENSION – ZONES 2 AND 3
Final 2
GORDON GEOTECHNIQUES
The Project will produce at up to approximately 4.5 million tonnes per annum and would extend the Ensham Life of Mine (LOM) by up to one year, to approximately 2029. The extension of the underground operation using existing infrastructure means that no surface construction or surface disturbance will be required to facilitate the Project other than the installation of four flares to minimise greenhouse gas production.
This assessment and the associated approvals process are focussed on the proposed mining activities within the Project area only.
1.1 Project Description
Ensham is currently operating a bord and pillar mine downdip of the open cut (Figure 1). Underground coal production commenced at Ensham in 2011, once the Aries-Castor Seam had been accessed by two stone drifts from Ramp 3 (Figure 1 and Figure 2). These drifts provide both personnel, materials and belt access from the open cut to the underground workings.
Figure 2. Access to the Underground Workings from Ramp 3
The bord and pillar mining methodology currently used at Ensham is also planned for the Project area, with access through the existing underground workings (Figure 1). Zones 2 and 3 are located both below and outside the flood plain of the Nogoa River (Figure 1). In fact, greater than 75% of Zones 2 and 3 is located outside the flood plain (Figure 1).
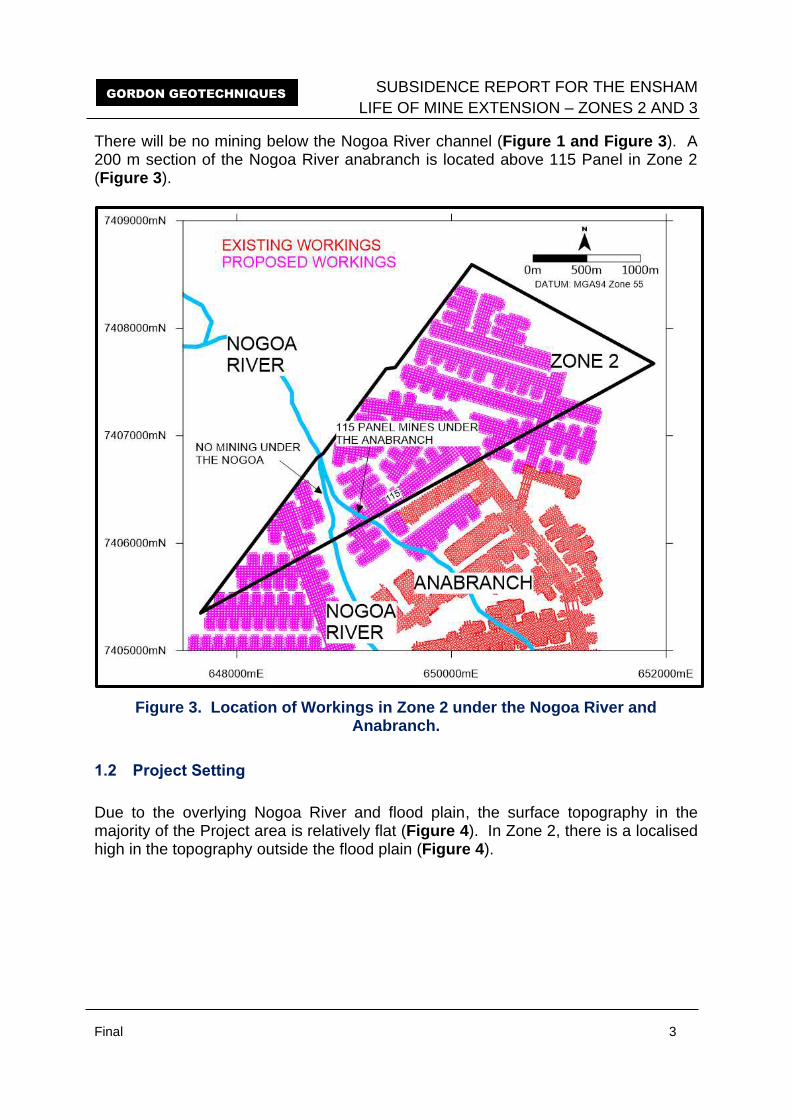
SUBSIDENCE REPORT FOR THE ENSHAM
LIFE OF MINE EXTENSION – ZONES 2 AND 3
Final 3
GORDON GEOTECHNIQUES
There will be no mining below the Nogoa River channel (Figure 1 and Figure 3). A 200 m section of the Nogoa River anabranch is located above 115 Panel in Zone 2 (Figure 3).
Figure 3. Location of Workings in Zone 2 under the Nogoa River and Anabranch.
1.2 Project Setting
Due to the overlying Nogoa River and flood plain, the surface topography in the majority of the Project area is relatively flat (Figure 4). In Zone 2, there is a localised high in the topography outside the flood plain (Figure 4).

SUBSIDENCE REPORT FOR THE ENSHAM
LIFE OF MINE EXTENSION – ZONES 2 AND 3
Final 4
GORDON GEOTECHNIQUES
Figure 4. Surface Topography
1.3 Project Mining Method
To assist in the discussion on the subsidence aspects of the proposed bord and pillar layout in the Project area, a description of the mining method is presented below.
The fundamental concept of the bord and pillar method is that the coal seam is divided into a regular block like array, by mining the coal to form bords or roadways (Figure 5). The headings are intersected at regular intervals by connecting cut-throughs (Figure 5).
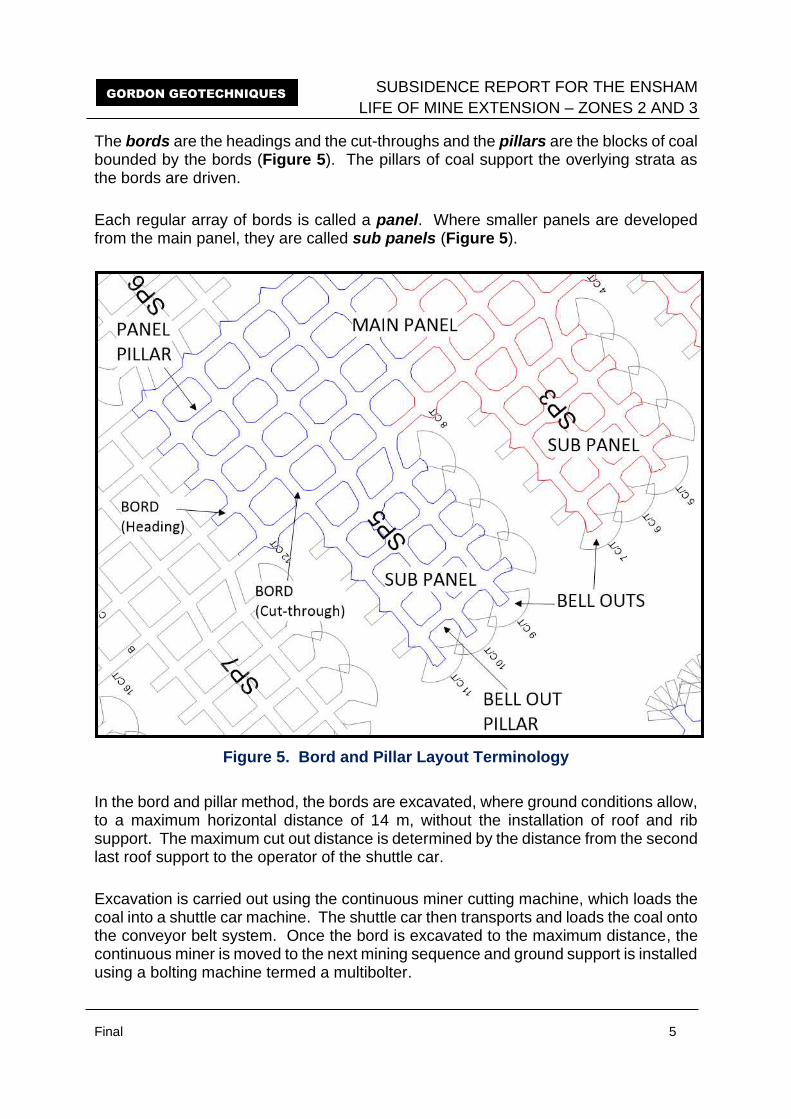
SUBSIDENCE REPORT FOR THE ENSHAM
LIFE OF MINE EXTENSION – ZONES 2 AND 3
Final 5
GORDON GEOTECHNIQUES
The bords are the headings and the cut-throughs and the pillars are the blocks of coal bounded by the bords (Figure 5). The pillars of coal support the overlying strata as the bords are driven.
Each regular array of bords is called a panel. Where smaller panels are developed from the main panel, they are called sub panels (Figure 5).
Figure 5. Bord and Pillar Layout Terminology
In the bord and pillar method, the bords are excavated, where ground conditions allow, to a maximum horizontal distance of 14 m, without the installation of roof and rib support. The maximum cut out distance is determined by the distance from the second last roof support to the operator of the shuttle car.
Excavation is carried out using the continuous miner cutting machine, which loads the coal into a shuttle car machine. The shuttle car then transports and loads the coal onto the conveyor belt system. Once the bord is excavated to the maximum distance, the continuous miner is moved to the next mining sequence and ground support is installed using a bolting machine termed a multibolter.
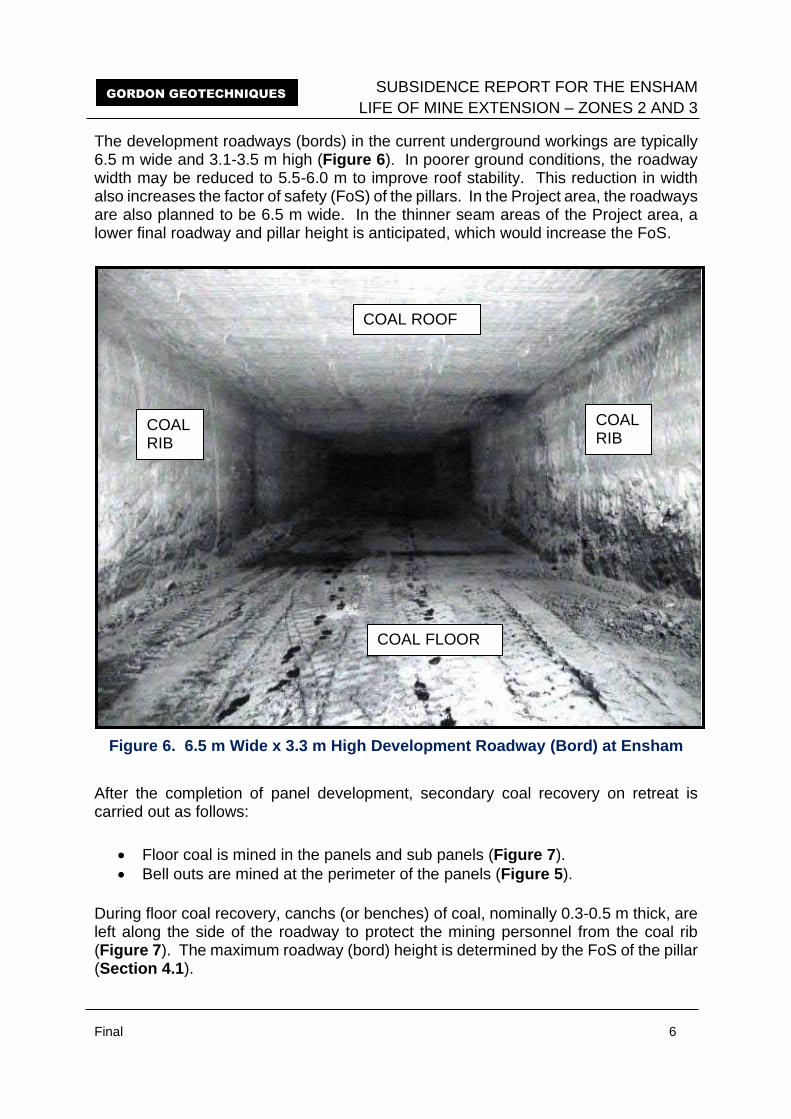
SUBSIDENCE REPORT FOR THE ENSHAM
LIFE OF MINE EXTENSION – ZONES 2 AND 3
Final 6
GORDON GEOTECHNIQUES
The development roadways (bords) in the current underground workings are typically 6.5 m wide and 3.1-3.5 m high (Figure 6). In poorer ground conditions, the roadway width may be reduced to 5.5-6.0 m to improve roof stability. This reduction in width also increases the factor of safety (FoS) of the pillars. In the Project area, the roadways are also planned to be 6.5 m wide. In the thinner seam areas of the Project area, a lower final roadway and pillar height is anticipated, which would increase the FoS.
Figure 6. 6.5 m Wide x 3.3 m High Development Roadway (Bord) at Ensham
After the completion of panel development, secondary coal recovery on retreat is carried out as follows:
• Floor coal is mined in the panels and sub panels (Figure 7).
• Bell outs are mined at the perimeter of the panels (Figure 5).
During floor coal recovery, canchs (or benches) of coal, nominally 0.3-0.5 m thick, are left along the side of the roadway to protect the mining personnel from the coal rib (Figure 7). The maximum roadway (bord) height is determined by the FoS of the pillar (Section 4.1).
COAL FLOOR
COAL ROOF
COAL RIB
COAL RIB
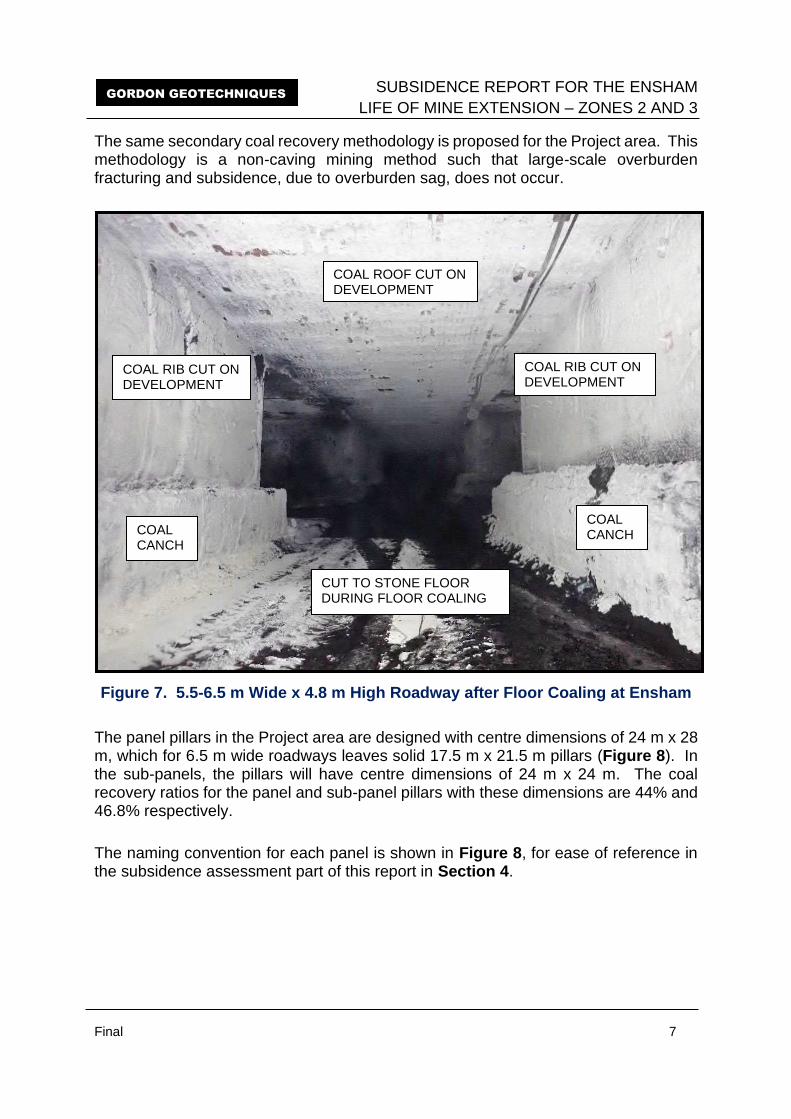
SUBSIDENCE REPORT FOR THE ENSHAM
LIFE OF MINE EXTENSION – ZONES 2 AND 3
Final 7
GORDON GEOTECHNIQUES
The same secondary coal recovery methodology is proposed for the Project area. This methodology is a non-caving mining method such that large-scale overburden fracturing and subsidence, due to overburden sag, does not occur.
Figure 7. 5.5-6.5 m Wide x 4.8 m High Roadway after Floor Coaling at Ensham
The panel pillars in the Project area are designed with centre dimensions of 24 m x 28 m, which for 6.5 m wide roadways leaves solid 17.5 m x 21.5 m pillars (Figure 8). In the sub-panels, the pillars will have centre dimensions of 24 m x 24 m. The coal recovery ratios for the panel and sub-panel pillars with these dimensions are 44% and 46.8% respectively.
The naming convention for each panel is shown in Figure 8, for ease of reference in the subsidence assessment part of this report in Section 4.
COAL CANCH COAL
CANCH
COAL RIB CUT ON DEVELOPMENT
COAL RIB CUT ON DEVELOPMENT
COAL ROOF CUT ON DEVELOPMENT
CUT TO STONE FLOOR DURING FLOOR COALING
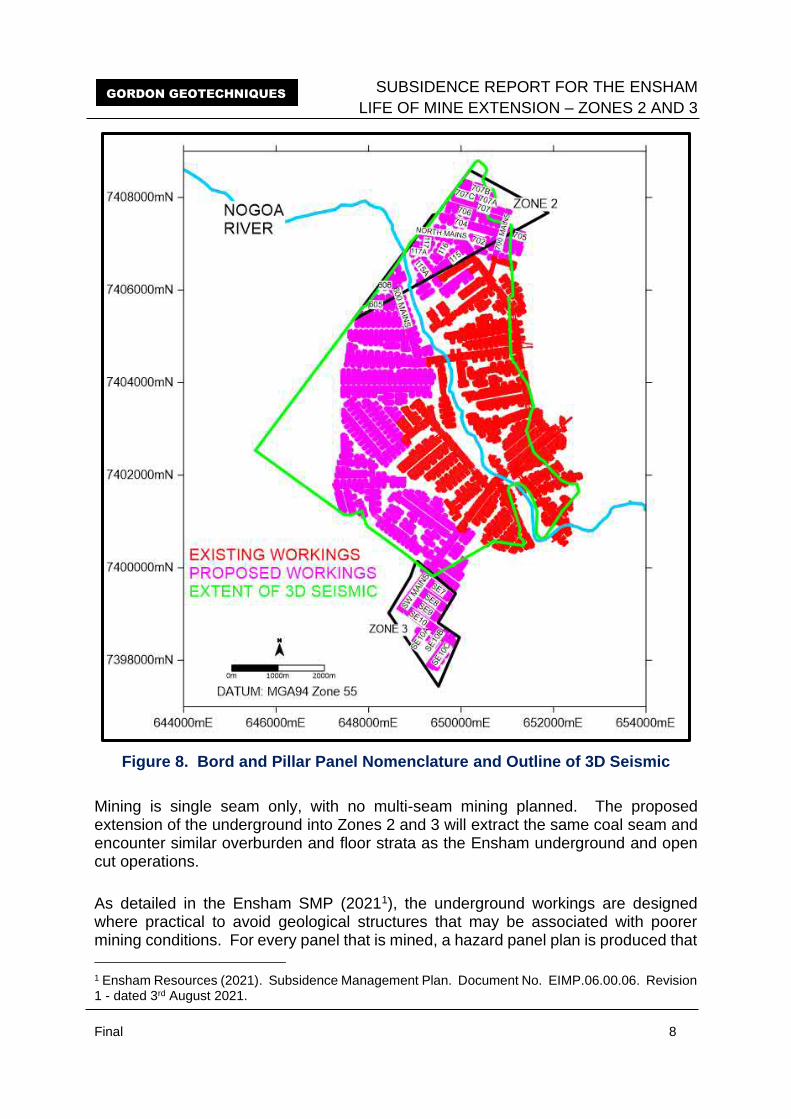
SUBSIDENCE REPORT FOR THE ENSHAM
LIFE OF MINE EXTENSION – ZONES 2 AND 3
Final 8
GORDON GEOTECHNIQUES
Figure 8. Bord and Pillar Panel Nomenclature and Outline of 3D Seismic
Mining is single seam only, with no multi-seam mining planned. The proposed extension of the underground into Zones 2 and 3 will extract the same coal seam and encounter similar overburden and floor strata as the Ensham underground and open cut operations.
As detailed in the Ensham SMP (20211), the underground workings are designed where practical to avoid geological structures that may be associated with poorer mining conditions. For every panel that is mined, a hazard panel plan is produced that
1 Ensham Resources (2021). Subsidence Management Plan. Document No. EIMP.06.00.06. Revision 1 - dated 3rd August 2021.
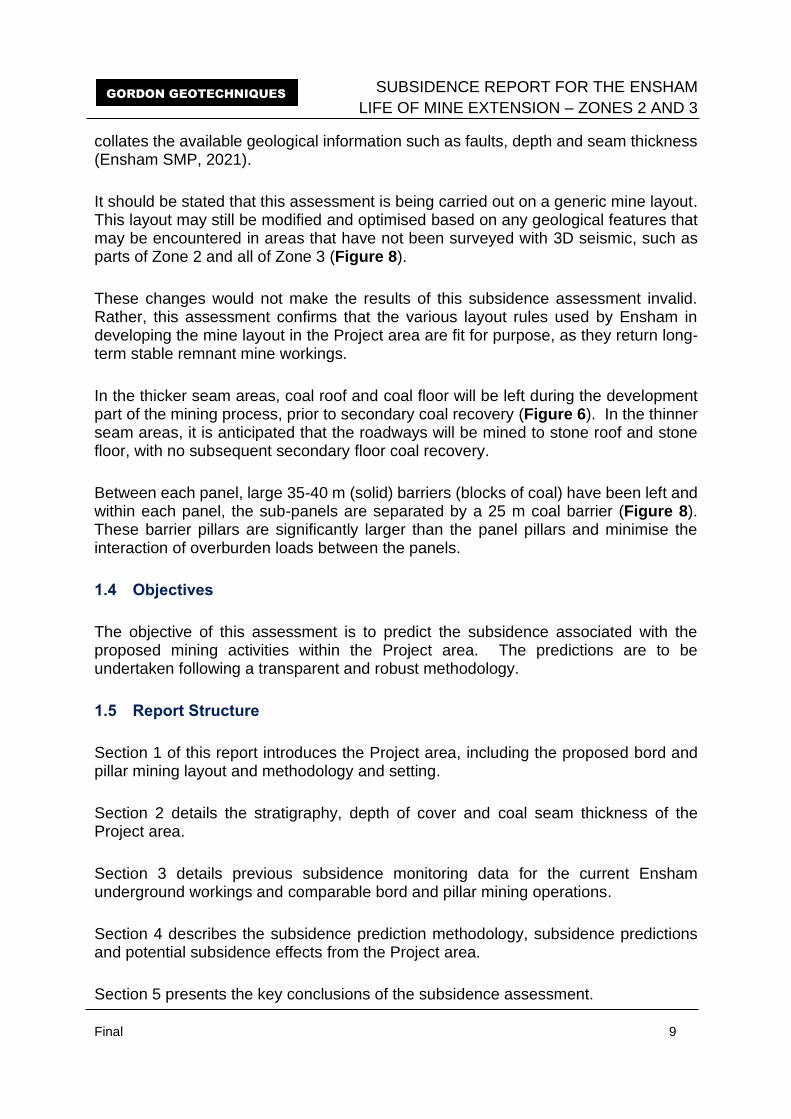
SUBSIDENCE REPORT FOR THE ENSHAM
LIFE OF MINE EXTENSION – ZONES 2 AND 3
Final 9
GORDON GEOTECHNIQUES
collates the available geological information such as faults, depth and seam thickness (Ensham SMP, 2021).
It should be stated that this assessment is being carried out on a generic mine layout. This layout may still be modified and optimised based on any geological features that may be encountered in areas that have not been surveyed with 3D seismic, such as parts of Zone 2 and all of Zone 3 (Figure 8).
These changes would not make the results of this subsidence assessment invalid. Rather, this assessment confirms that the various layout rules used by Ensham in developing the mine layout in the Project area are fit for purpose, as they return long-term stable remnant mine workings.
In the thicker seam areas, coal roof and coal floor will be left during the development part of the mining process, prior to secondary coal recovery (Figure 6). In the thinner seam areas, it is anticipated that the roadways will be mined to stone roof and stone floor, with no subsequent secondary floor coal recovery.
Between each panel, large 35-40 m (solid) barriers (blocks of coal) have been left and within each panel, the sub-panels are separated by a 25 m coal barrier (Figure 8). These barrier pillars are significantly larger than the panel pillars and minimise the interaction of overburden loads between the panels.
1.4 Objectives
The objective of this assessment is to predict the subsidence associated with the proposed mining activities within the Project area. The predictions are to be undertaken following a transparent and robust methodology.
1.5 Report Structure
Section 1 of this report introduces the Project area, including the proposed bord and pillar mining layout and methodology and setting.
Section 2 details the stratigraphy, depth of cover and coal seam thickness of the Project area.
Section 3 details previous subsidence monitoring data for the current Ensham underground workings and comparable bord and pillar mining operations.
Section 4 describes the subsidence prediction methodology, subsidence predictions and potential subsidence effects from the Project area.
Section 5 presents the key conclusions of the subsidence assessment.
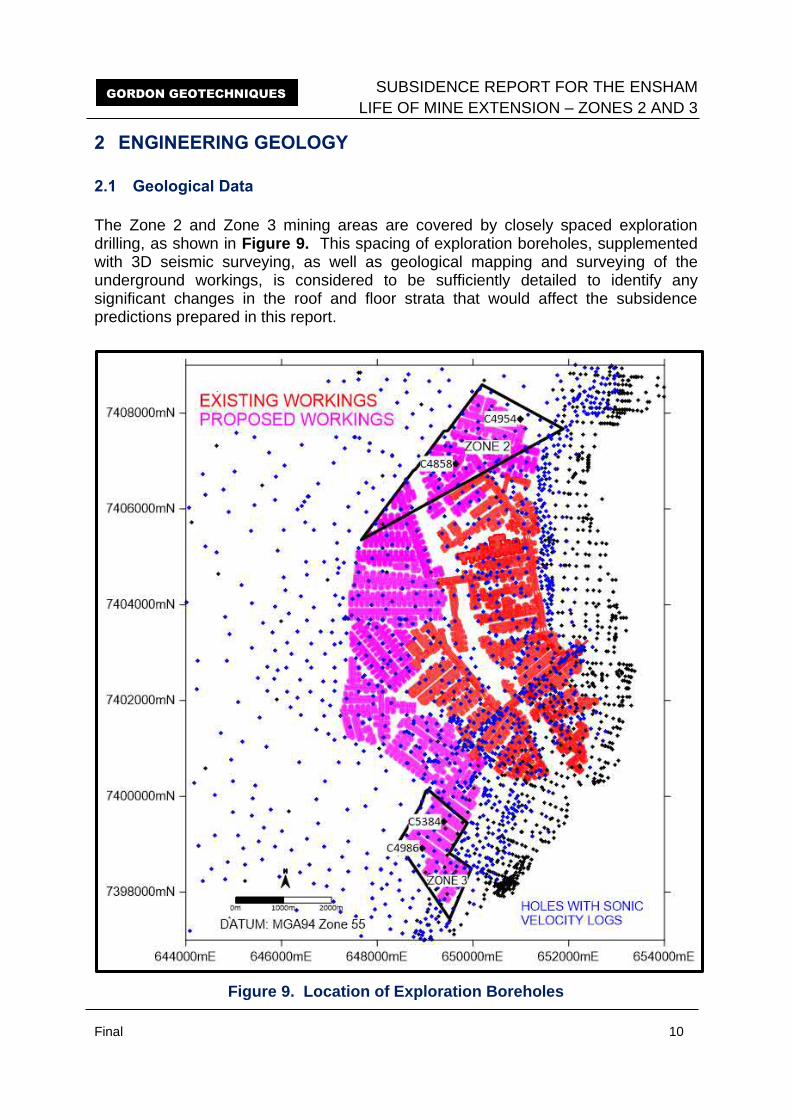
SUBSIDENCE REPORT FOR THE ENSHAM
LIFE OF MINE EXTENSION – ZONES 2 AND 3
Final 10
GORDON GEOTECHNIQUES
2 ENGINEERING GEOLOGY
2.1 Geological Data
The Zone 2 and Zone 3 mining areas are covered by closely spaced exploration drilling, as shown in Figure 9. This spacing of exploration boreholes, supplemented with 3D seismic surveying, as well as geological mapping and surveying of the underground workings, is considered to be sufficiently detailed to identify any significant changes in the roof and floor strata that would affect the subsidence predictions prepared in this report.
Figure 9. Location of Exploration Boreholes
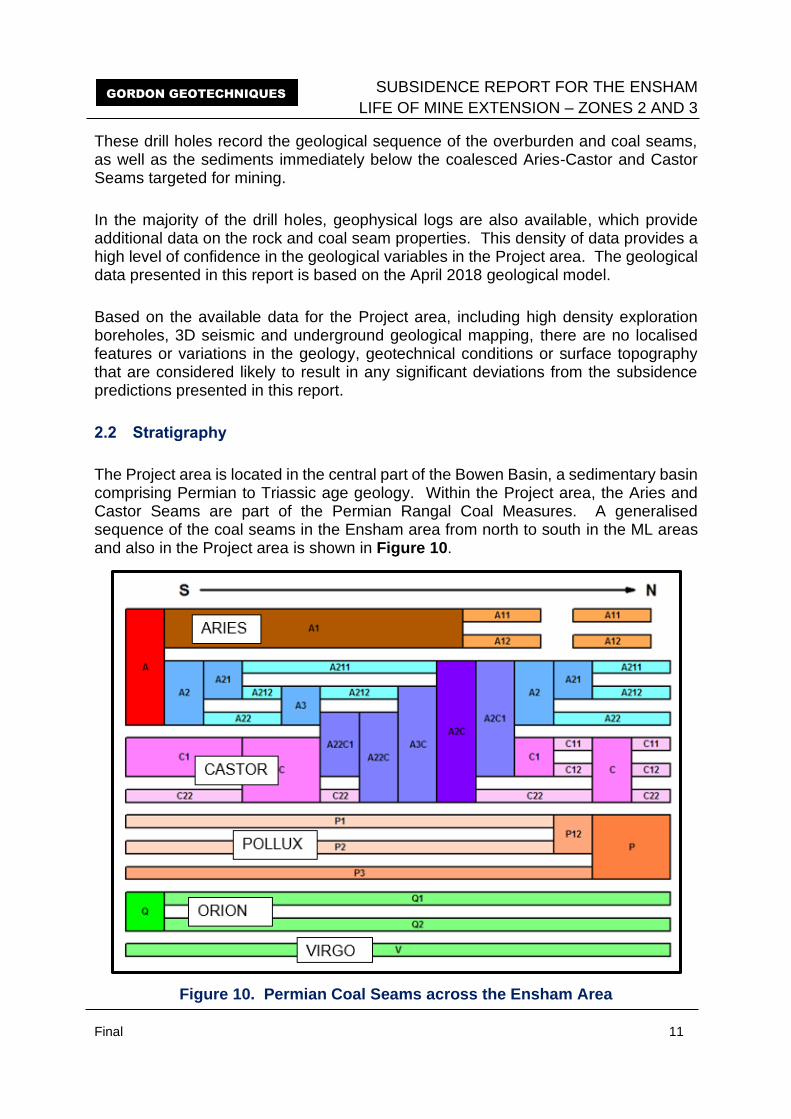
SUBSIDENCE REPORT FOR THE ENSHAM
LIFE OF MINE EXTENSION – ZONES 2 AND 3
Final 11
GORDON GEOTECHNIQUES
These drill holes record the geological sequence of the overburden and coal seams, as well as the sediments immediately below the coalesced Aries-Castor and Castor Seams targeted for mining.
In the majority of the drill holes, geophysical logs are also available, which provide additional data on the rock and coal seam properties. This density of data provides a high level of confidence in the geological variables in the Project area. The geological data presented in this report is based on the April 2018 geological model.
Based on the available data for the Project area, including high density exploration boreholes, 3D seismic and underground geological mapping, there are no localised features or variations in the geology, geotechnical conditions or surface topography that are considered likely to result in any significant deviations from the subsidence predictions presented in this report.
2.2 Stratigraphy
The Project area is located in the central part of the Bowen Basin, a sedimentary basin comprising Permian to Triassic age geology. Within the Project area, the Aries and Castor Seams are part of the Permian Rangal Coal Measures. A generalised sequence of the coal seams in the Ensham area from north to south in the ML areas and also in the Project area is shown in Figure 10.
Figure 10. Permian Coal Seams across the Ensham Area
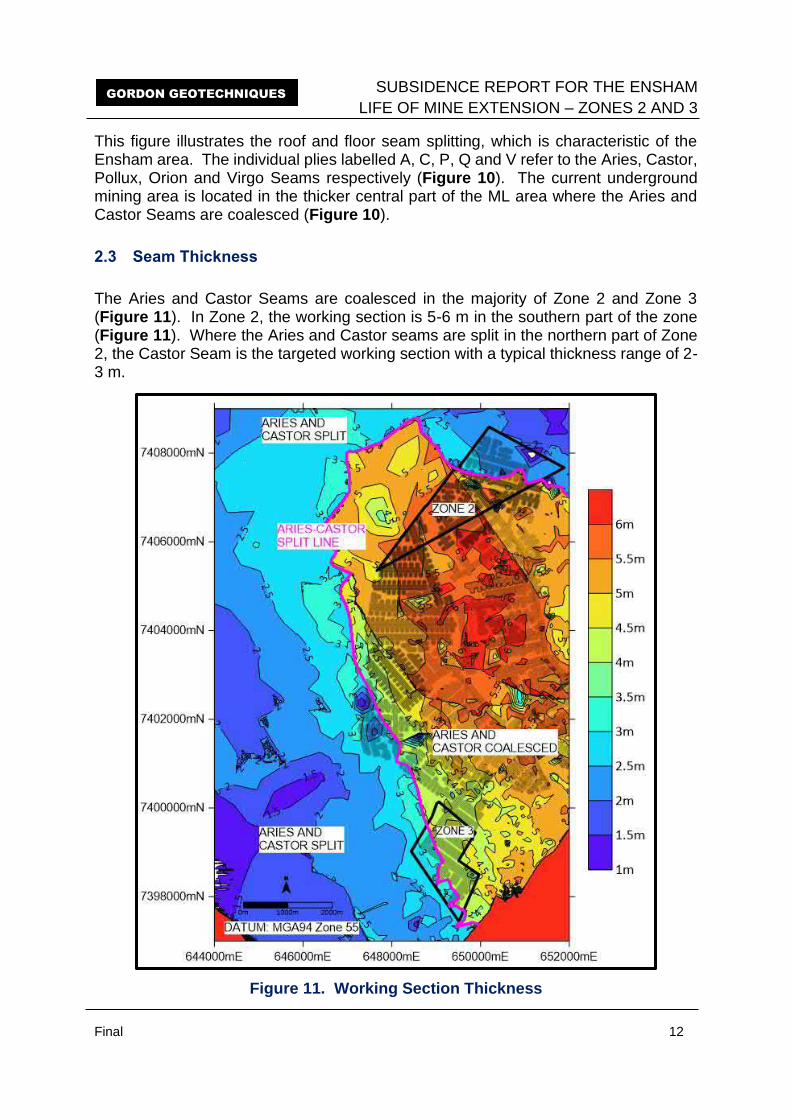
SUBSIDENCE REPORT FOR THE ENSHAM
LIFE OF MINE EXTENSION – ZONES 2 AND 3
Final 12
GORDON GEOTECHNIQUES
This figure illustrates the roof and floor seam splitting, which is characteristic of the Ensham area. The individual plies labelled A, C, P, Q and V refer to the Aries, Castor, Pollux, Orion and Virgo Seams respectively (Figure 10). The current underground mining area is located in the thicker central part of the ML area where the Aries and Castor Seams are coalesced (Figure 10).
2.3 Seam Thickness
The Aries and Castor Seams are coalesced in the majority of Zone 2 and Zone 3 (Figure 11). In Zone 2, the working section is 5-6 m in the southern part of the zone (Figure 11). Where the Aries and Castor seams are split in the northern part of Zone 2, the Castor Seam is the targeted working section with a typical thickness range of 2-3 m.
Figure 11. Working Section Thickness
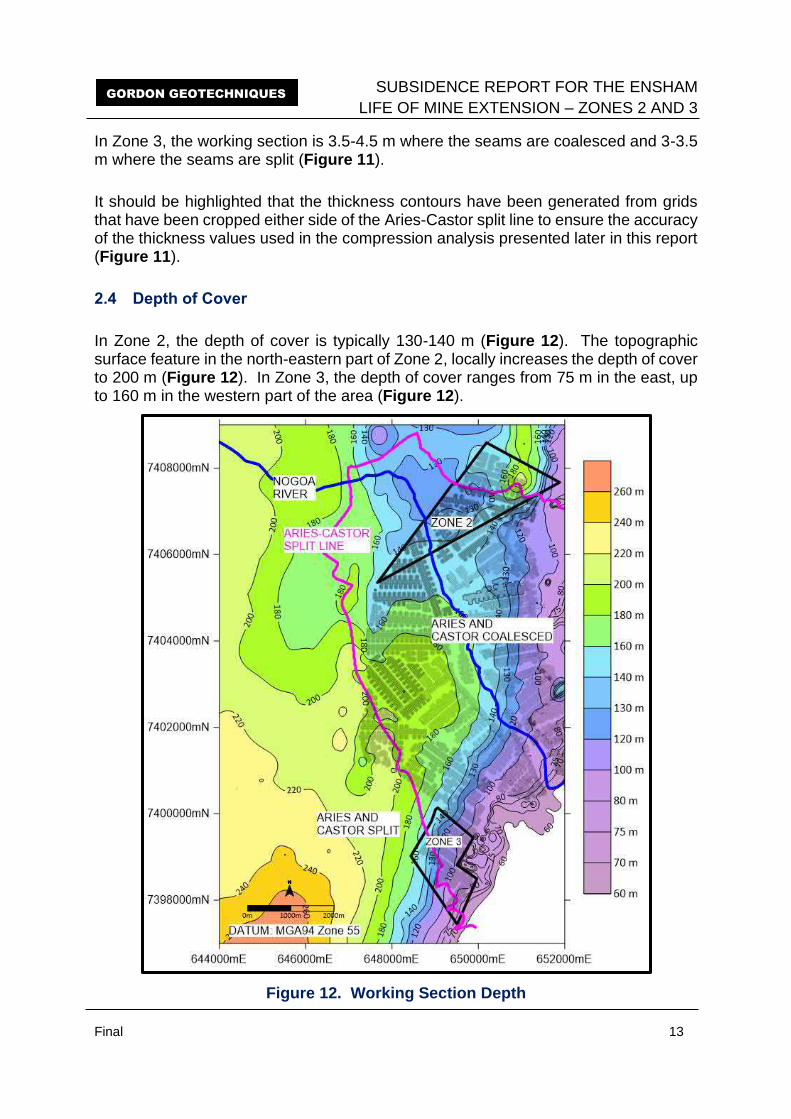
SUBSIDENCE REPORT FOR THE ENSHAM
LIFE OF MINE EXTENSION – ZONES 2 AND 3
Final 13
GORDON GEOTECHNIQUES
In Zone 3, the working section is 3.5-4.5 m where the seams are coalesced and 3-3.5 m where the seams are split (Figure 11).
It should be highlighted that the thickness contours have been generated from grids that have been cropped either side of the Aries-Castor split line to ensure the accuracy of the thickness values used in the compression analysis presented later in this report (Figure 11).
2.4 Depth of Cover
In Zone 2, the depth of cover is typically 130-140 m (Figure 12). The topographic surface feature in the north-eastern part of Zone 2, locally increases the depth of cover to 200 m (Figure 12). In Zone 3, the depth of cover ranges from 75 m in the east, up to 160 m in the western part of the area (Figure 12).
Figure 12. Working Section Depth

SUBSIDENCE REPORT FOR THE ENSHAM
LIFE OF MINE EXTENSION – ZONES 2 AND 3
Final 14
GORDON GEOTECHNIQUES
2.5 Depth of Weathering
The depth of weathering is typically 10-20 m thick in the majority of Zones 2 and 3 (Figure 13). The weathering depth locally increases to 50 m in the north-eastern part of Zone 2, due to the surface topographic feature in this area (Figure 13).
Figure 13. Depth of Weathering
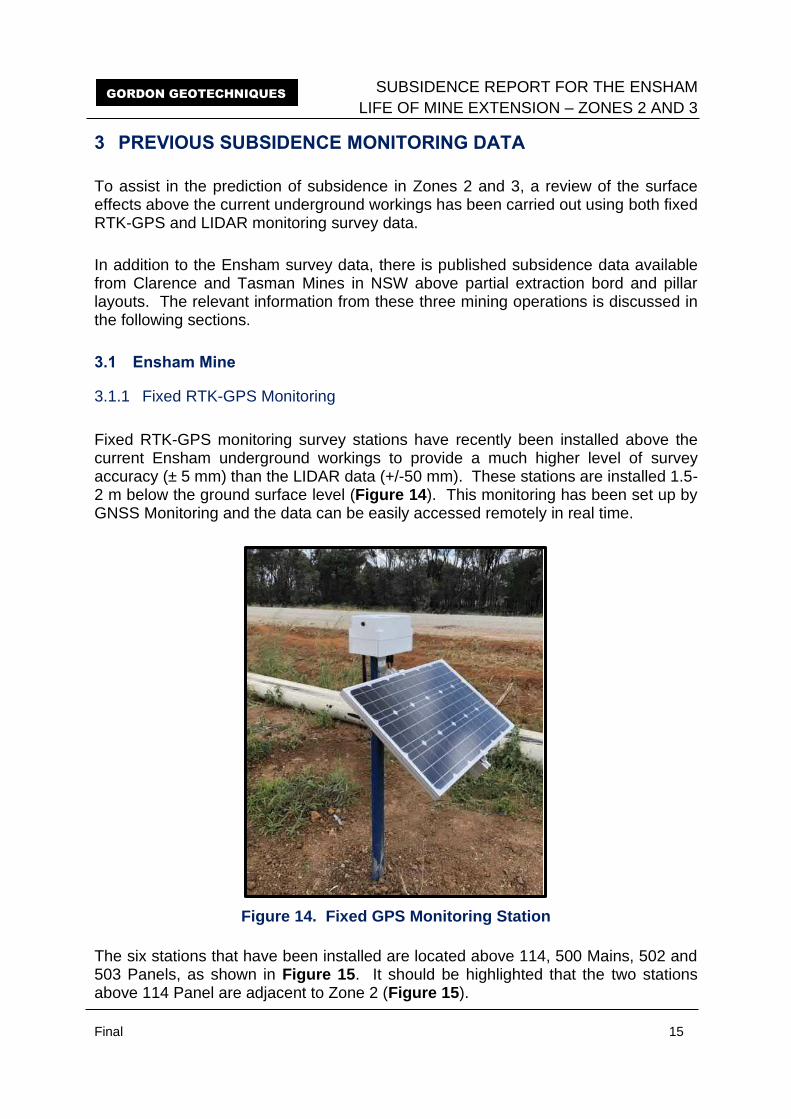
SUBSIDENCE REPORT FOR THE ENSHAM
LIFE OF MINE EXTENSION – ZONES 2 AND 3
Final 15
GORDON GEOTECHNIQUES
3 PREVIOUS SUBSIDENCE MONITORING DATA
To assist in the prediction of subsidence in Zones 2 and 3, a review of the surface effects above the current underground workings has been carried out using both fixed RTK-GPS and LIDAR monitoring survey data.
In addition to the Ensham survey data, there is published subsidence data available from Clarence and Tasman Mines in NSW above partial extraction bord and pillar layouts. The relevant information from these three mining operations is discussed in the following sections.
3.1 Ensham Mine
3.1.1 Fixed RTK-GPS Monitoring
Fixed RTK-GPS monitoring survey stations have recently been installed above the current Ensham underground workings to provide a much higher level of survey accuracy (± 5 mm) than the LIDAR data (+/-50 mm). These stations are installed 1.5-2 m below the ground surface level (Figure 14). This monitoring has been set up by GNSS Monitoring and the data can be easily accessed remotely in real time.
Figure 14. Fixed GPS Monitoring Station
The six stations that have been installed are located above 114, 500 Mains, 502 and 503 Panels, as shown in Figure 15. It should be highlighted that the two stations above 114 Panel are adjacent to Zone 2 (Figure 15).
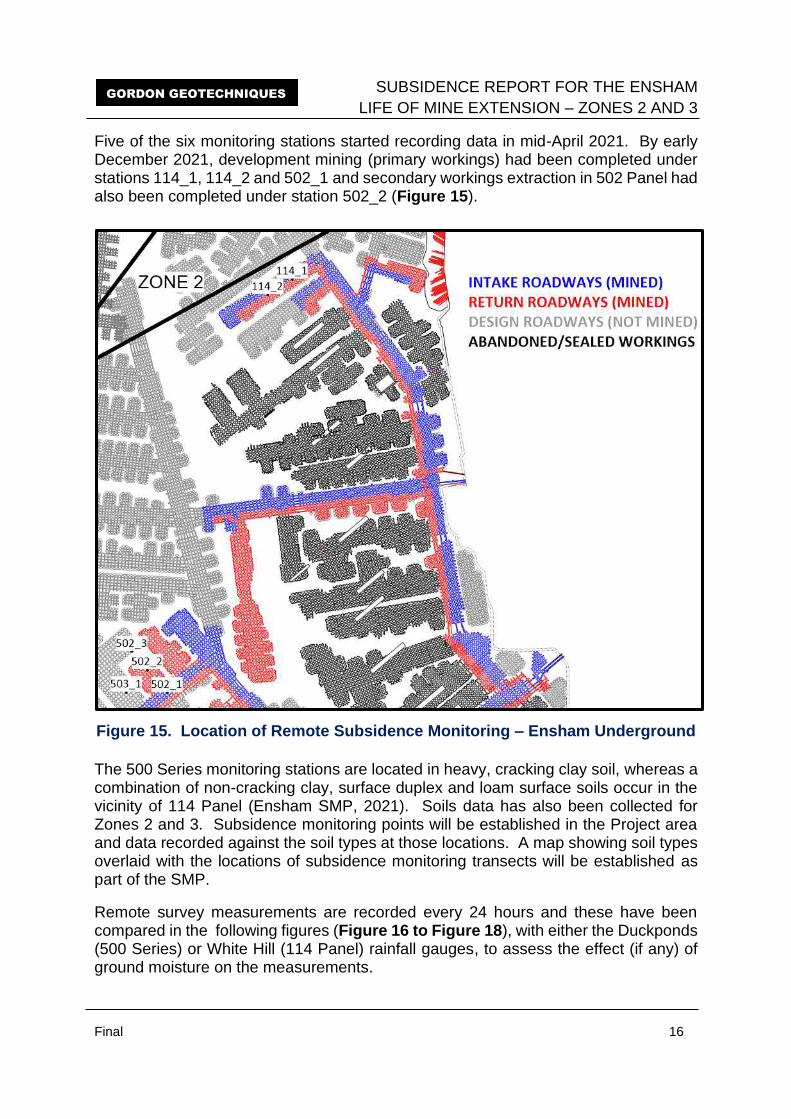
SUBSIDENCE REPORT FOR THE ENSHAM
LIFE OF MINE EXTENSION – ZONES 2 AND 3
Final 16
GORDON GEOTECHNIQUES
Five of the six monitoring stations started recording data in mid-April 2021. By early December 2021, development mining (primary workings) had been completed under stations 114_1, 114_2 and 502_1 and secondary workings extraction in 502 Panel had also been completed under station 502_2 (Figure 15).
Figure 15. Location of Remote Subsidence Monitoring – Ensham Underground
The 500 Series monitoring stations are located in heavy, cracking clay soil, whereas a combination of non-cracking clay, surface duplex and loam surface soils occur in the vicinity of 114 Panel (Ensham SMP, 2021). Soils data has also been collected for Zones 2 and 3. Subsidence monitoring points will be established in the Project area and data recorded against the soil types at those locations. A map showing soil types overlaid with the locations of subsidence monitoring transects will be established as part of the SMP.
Remote survey measurements are recorded every 24 hours and these have been compared in the following figures (Figure 16 to Figure 18), with either the Duckponds (500 Series) or White Hill (114 Panel) rainfall gauges, to assess the effect (if any) of ground moisture on the measurements.
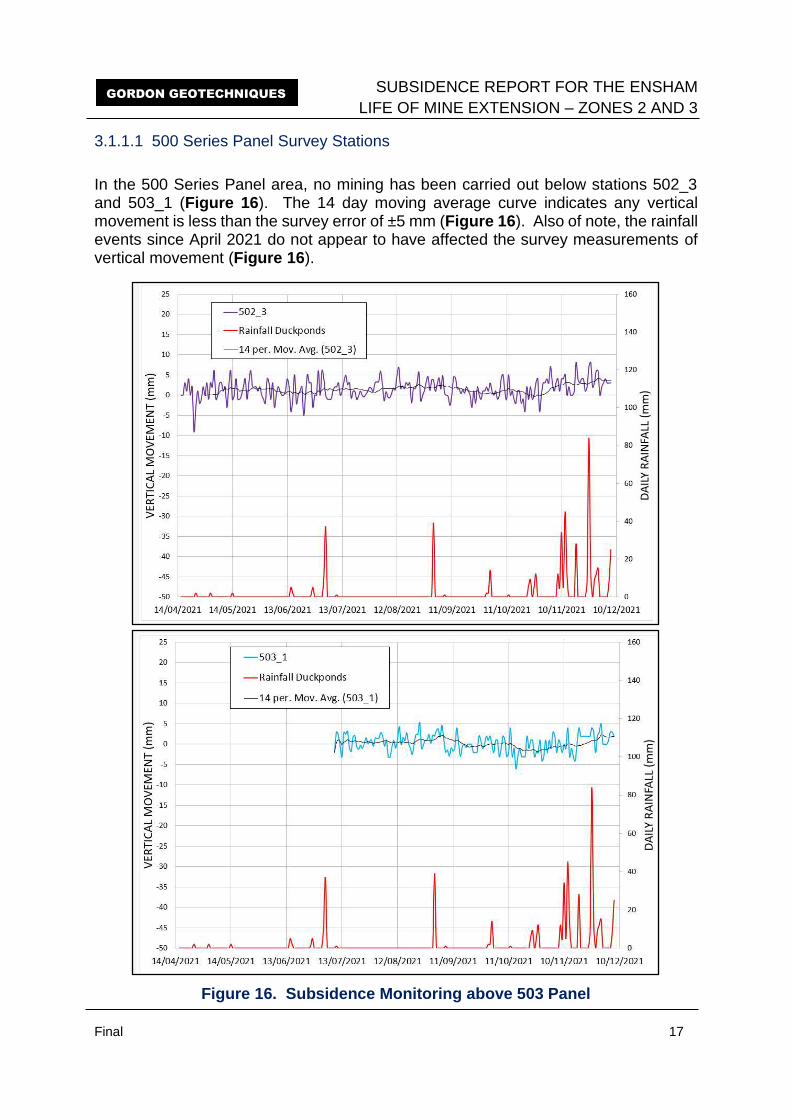
SUBSIDENCE REPORT FOR THE ENSHAM
LIFE OF MINE EXTENSION – ZONES 2 AND 3
Final 17
GORDON GEOTECHNIQUES
3.1.1.1 500 Series Panel Survey Stations
In the 500 Series Panel area, no mining has been carried out below stations 502_3 and 503_1 (Figure 16). The 14 day moving average curve indicates any vertical movement is less than the survey error of ±5 mm (Figure 16). Also of note, the rainfall events since April 2021 do not appear to have affected the survey measurements of vertical movement (Figure 16).
Figure 16. Subsidence Monitoring above 503 Panel
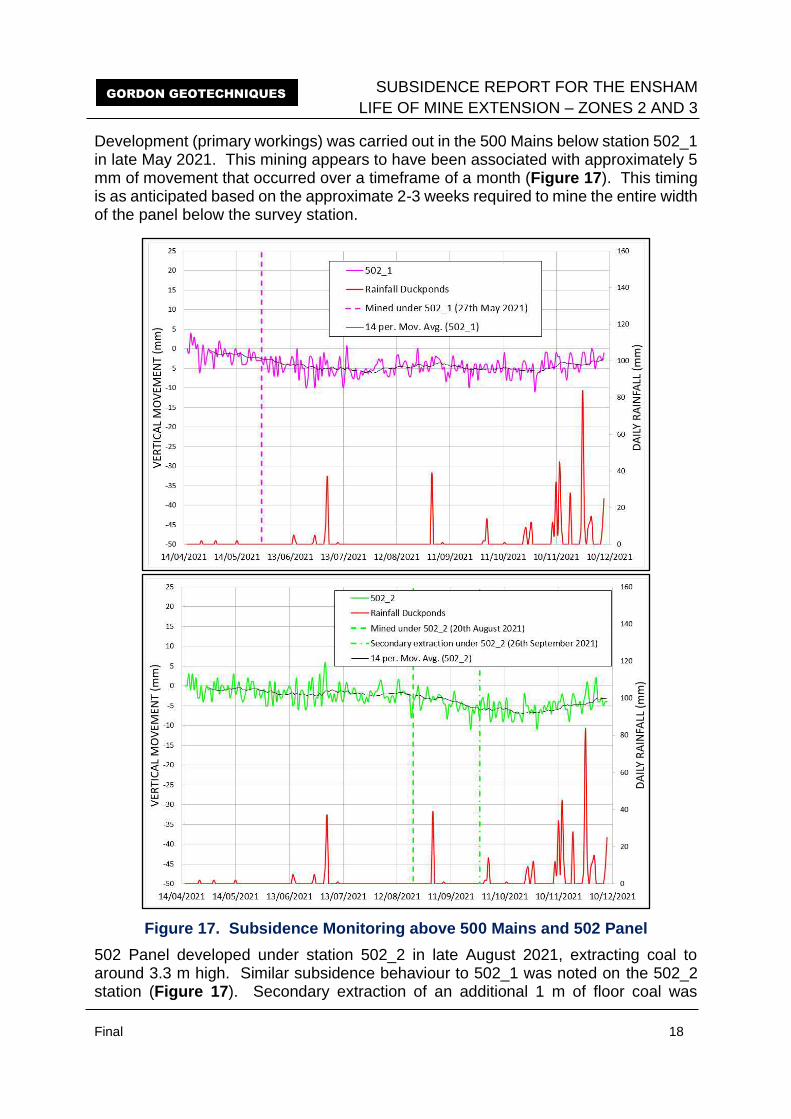
SUBSIDENCE REPORT FOR THE ENSHAM
LIFE OF MINE EXTENSION – ZONES 2 AND 3
Final 18
GORDON GEOTECHNIQUES
Development (primary workings) was carried out in the 500 Mains below station 502_1 in late May 2021. This mining appears to have been associated with approximately 5 mm of movement that occurred over a timeframe of a month (Figure 17). This timing is as anticipated based on the approximate 2-3 weeks required to mine the entire width of the panel below the survey station.
Figure 17. Subsidence Monitoring above 500 Mains and 502 Panel
502 Panel developed under station 502_2 in late August 2021, extracting coal to around 3.3 m high. Similar subsidence behaviour to 502_1 was noted on the 502_2 station (Figure 17). Secondary extraction of an additional 1 m of floor coal was
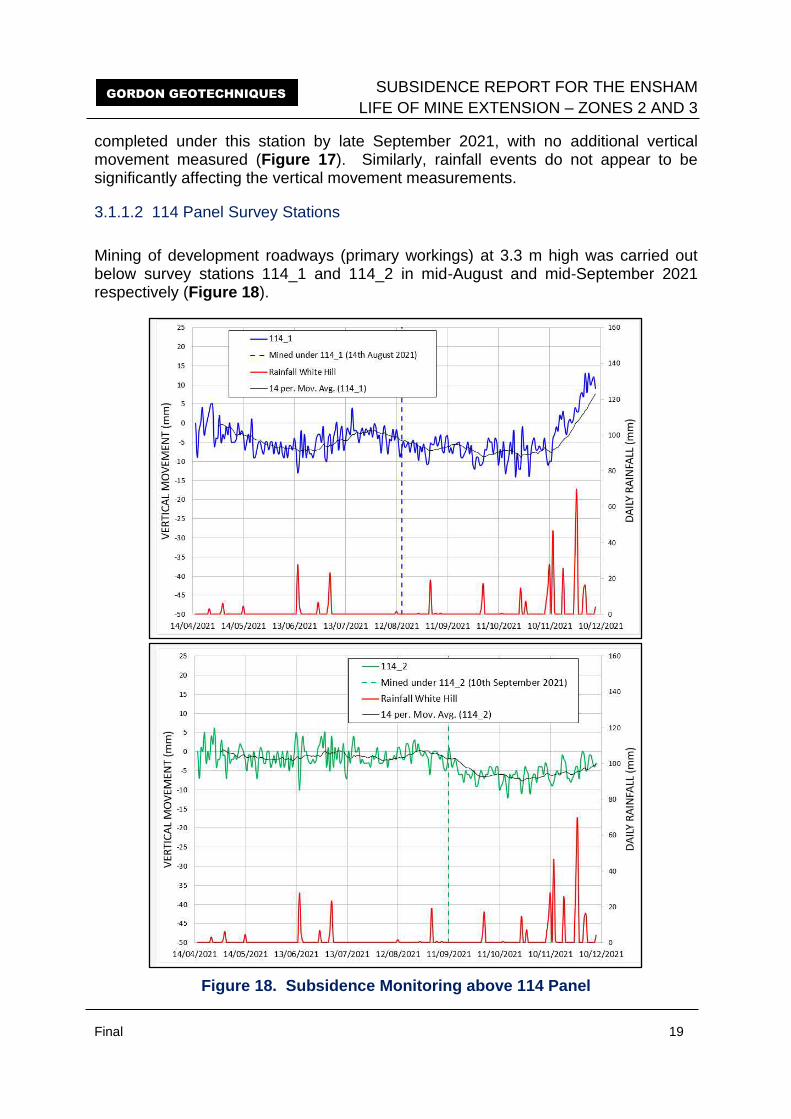
SUBSIDENCE REPORT FOR THE ENSHAM
LIFE OF MINE EXTENSION – ZONES 2 AND 3
Final 19
GORDON GEOTECHNIQUES
completed under this station by late September 2021, with no additional vertical movement measured (Figure 17). Similarly, rainfall events do not appear to be significantly affecting the vertical movement measurements.
3.1.1.2 114 Panel Survey Stations
Mining of development roadways (primary workings) at 3.3 m high was carried out below survey stations 114_1 and 114_2 in mid-August and mid-September 2021 respectively (Figure 18).
Figure 18. Subsidence Monitoring above 114 Panel
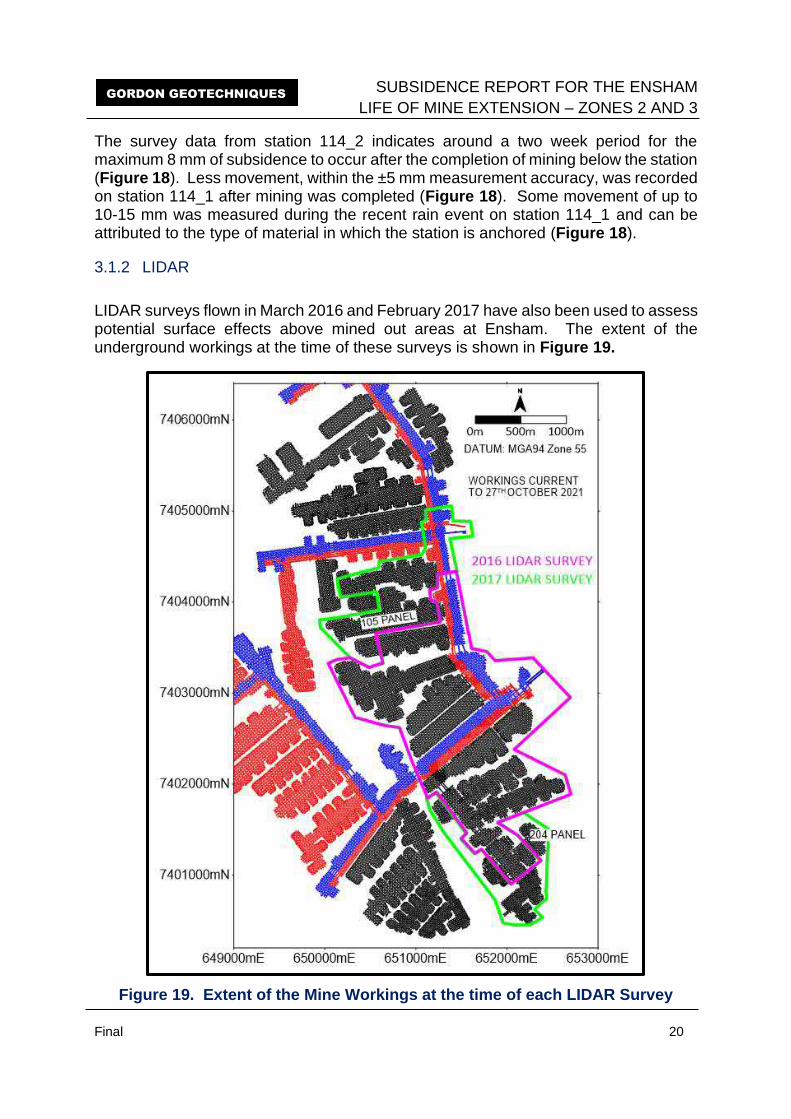
SUBSIDENCE REPORT FOR THE ENSHAM
LIFE OF MINE EXTENSION – ZONES 2 AND 3
Final 20
GORDON GEOTECHNIQUES
The survey data from station 114_2 indicates around a two week period for the maximum 8 mm of subsidence to occur after the completion of mining below the station (Figure 18). Less movement, within the ±5 mm measurement accuracy, was recorded on station 114_1 after mining was completed (Figure 18). Some movement of up to 10-15 mm was measured during the recent rain event on station 114_1 and can be attributed to the type of material in which the station is anchored (Figure 18).
3.1.2 LIDAR
LIDAR surveys flown in March 2016 and February 2017 have also been used to assess potential surface effects above mined out areas at Ensham. The extent of the underground workings at the time of these surveys is shown in Figure 19.
Figure 19. Extent of the Mine Workings at the time of each LIDAR Survey
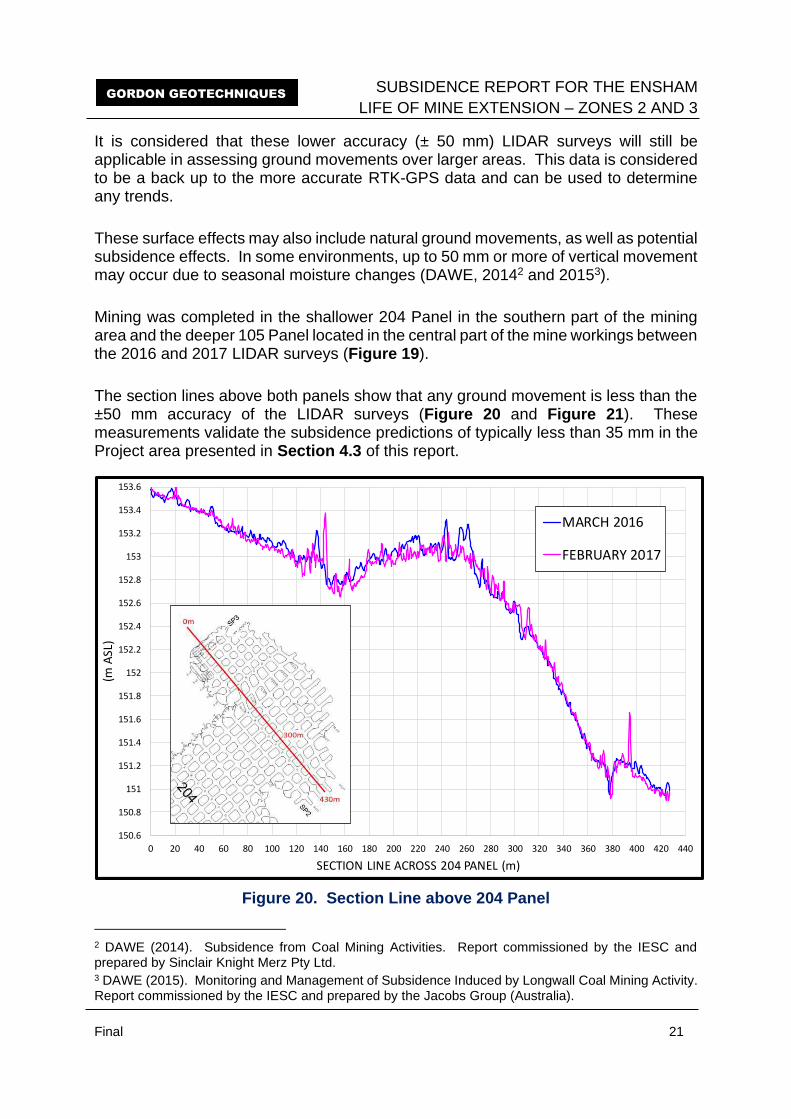
SUBSIDENCE REPORT FOR THE ENSHAM
LIFE OF MINE EXTENSION – ZONES 2 AND 3
Final 21
GORDON GEOTECHNIQUES
It is considered that these lower accuracy (± 50 mm) LIDAR surveys will still be applicable in assessing ground movements over larger areas. This data is considered to be a back up to the more accurate RTK-GPS data and can be used to determine any trends.
These surface effects may also include natural ground movements, as well as potential subsidence effects. In some environments, up to 50 mm or more of vertical movement may occur due to seasonal moisture changes (DAWE, 20142 and 20153).
Mining was completed in the shallower 204 Panel in the southern part of the mining area and the deeper 105 Panel located in the central part of the mine workings between the 2016 and 2017 LIDAR surveys (Figure 19).
The section lines above both panels show that any ground movement is less than the ±50 mm accuracy of the LIDAR surveys (Figure 20 and Figure 21). These measurements validate the subsidence predictions of typically less than 35 mm in the Project area presented in Section 4.3 of this report.
Figure 20. Section Line above 204 Panel
2 DAWE (2014). Subsidence from Coal Mining Activities. Report commissioned by the IESC and prepared by Sinclair Knight Merz Pty Ltd. 3 DAWE (2015). Monitoring and Management of Subsidence Induced by Longwall Coal Mining Activity. Report commissioned by the IESC and prepared by the Jacobs Group (Australia).
150.6
150.8
151
151.2
151.4
151.6
151.8
152
152.2
152.4
152.6
152.8
153
153.2
153.4
153.6
0 20 40 60 80 100 120 140 160 180 200 220 240 260 280 300 320 340 360 380 400 420 440
(m A
SL)
SECTION LINE ACROSS 204 PANEL (m)
MARCH 2016
FEBRUARY 2017
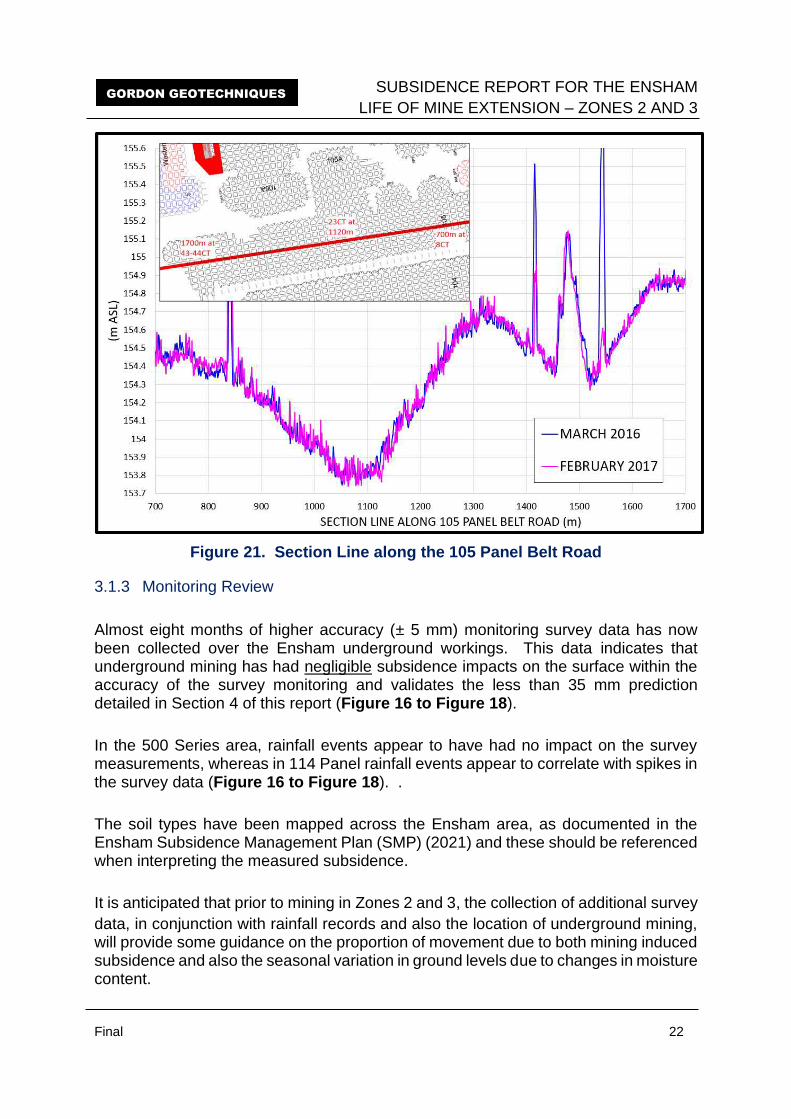
SUBSIDENCE REPORT FOR THE ENSHAM
LIFE OF MINE EXTENSION – ZONES 2 AND 3
Final 22
GORDON GEOTECHNIQUES
Figure 21. Section Line along the 105 Panel Belt Road
3.1.3 Monitoring Review
Almost eight months of higher accuracy (± 5 mm) monitoring survey data has now been collected over the Ensham underground workings. This data indicates that underground mining has had negligible subsidence impacts on the surface within the accuracy of the survey monitoring and validates the less than 35 mm prediction detailed in Section 4 of this report (Figure 16 to Figure 18).
In the 500 Series area, rainfall events appear to have had no impact on the survey measurements, whereas in 114 Panel rainfall events appear to correlate with spikes in the survey data (Figure 16 to Figure 18). .
The soil types have been mapped across the Ensham area, as documented in the Ensham Subsidence Management Plan (SMP) (2021) and these should be referenced when interpreting the measured subsidence.
It is anticipated that prior to mining in Zones 2 and 3, the collection of additional survey
data, in conjunction with rainfall records and also the location of underground mining, will provide some guidance on the proportion of movement due to both mining induced subsidence and also the seasonal variation in ground levels due to changes in moisture content.
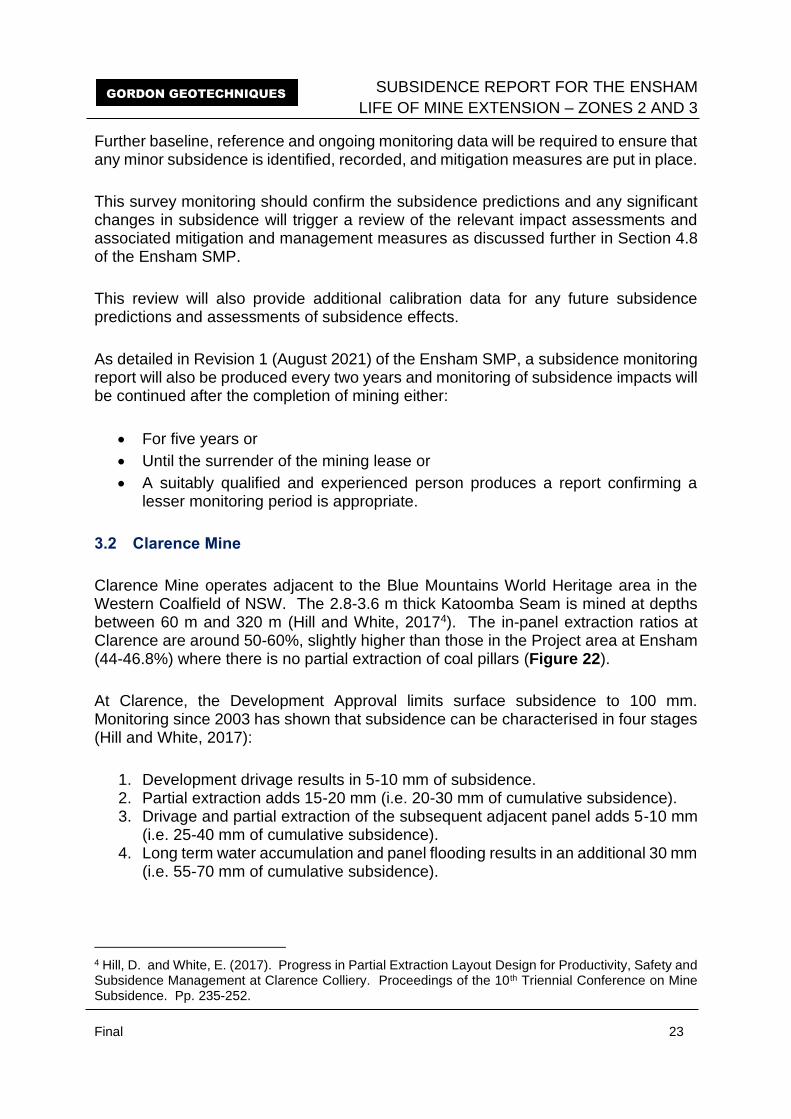
SUBSIDENCE REPORT FOR THE ENSHAM
LIFE OF MINE EXTENSION – ZONES 2 AND 3
Final 23
GORDON GEOTECHNIQUES
Further baseline, reference and ongoing monitoring data will be required to ensure that any minor subsidence is identified, recorded, and mitigation measures are put in place.
This survey monitoring should confirm the subsidence predictions and any significant changes in subsidence will trigger a review of the relevant impact assessments and associated mitigation and management measures as discussed further in Section 4.8 of the Ensham SMP.
This review will also provide additional calibration data for any future subsidence predictions and assessments of subsidence effects.
As detailed in Revision 1 (August 2021) of the Ensham SMP, a subsidence monitoring report will also be produced every two years and monitoring of subsidence impacts will be continued after the completion of mining either:
• For five years or
• Until the surrender of the mining lease or
• A suitably qualified and experienced person produces a report confirming a lesser monitoring period is appropriate.
3.2 Clarence Mine
Clarence Mine operates adjacent to the Blue Mountains World Heritage area in the Western Coalfield of NSW. The 2.8-3.6 m thick Katoomba Seam is mined at depths between 60 m and 320 m (Hill and White, 20174). The in-panel extraction ratios at Clarence are around 50-60%, slightly higher than those in the Project area at Ensham (44-46.8%) where there is no partial extraction of coal pillars (Figure 22).
At Clarence, the Development Approval limits surface subsidence to 100 mm. Monitoring since 2003 has shown that subsidence can be characterised in four stages (Hill and White, 2017):
1. Development drivage results in 5-10 mm of subsidence. 2. Partial extraction adds 15-20 mm (i.e. 20-30 mm of cumulative subsidence). 3. Drivage and partial extraction of the subsequent adjacent panel adds 5-10 mm
(i.e. 25-40 mm of cumulative subsidence). 4. Long term water accumulation and panel flooding results in an additional 30 mm
(i.e. 55-70 mm of cumulative subsidence).
4 Hill, D. and White, E. (2017). Progress in Partial Extraction Layout Design for Productivity, Safety and Subsidence Management at Clarence Colliery. Proceedings of the 10th Triennial Conference on Mine Subsidence. Pp. 235-252.
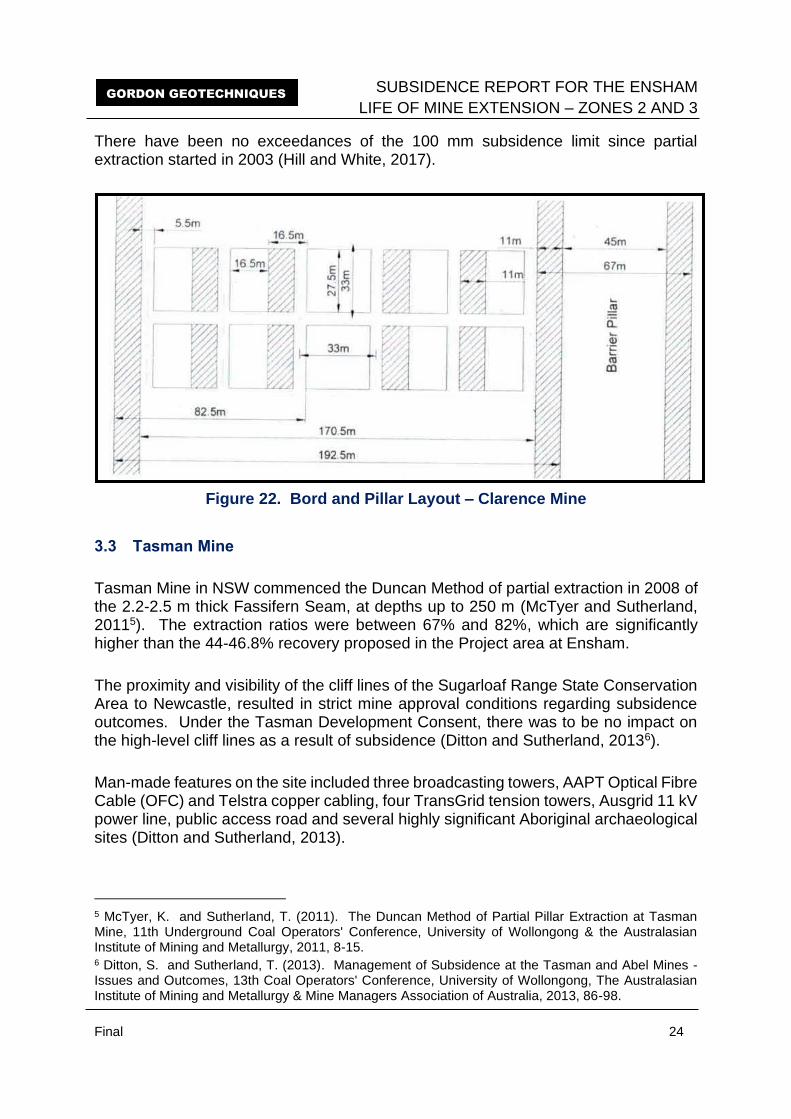
SUBSIDENCE REPORT FOR THE ENSHAM
LIFE OF MINE EXTENSION – ZONES 2 AND 3
Final 24
GORDON GEOTECHNIQUES
There have been no exceedances of the 100 mm subsidence limit since partial extraction started in 2003 (Hill and White, 2017).
Figure 22. Bord and Pillar Layout – Clarence Mine
3.3 Tasman Mine
Tasman Mine in NSW commenced the Duncan Method of partial extraction in 2008 of the 2.2-2.5 m thick Fassifern Seam, at depths up to 250 m (McTyer and Sutherland, 20115). The extraction ratios were between 67% and 82%, which are significantly higher than the 44-46.8% recovery proposed in the Project area at Ensham.
The proximity and visibility of the cliff lines of the Sugarloaf Range State Conservation Area to Newcastle, resulted in strict mine approval conditions regarding subsidence outcomes. Under the Tasman Development Consent, there was to be no impact on the high-level cliff lines as a result of subsidence (Ditton and Sutherland, 20136).
Man-made features on the site included three broadcasting towers, AAPT Optical Fibre Cable (OFC) and Telstra copper cabling, four TransGrid tension towers, Ausgrid 11 kV power line, public access road and several highly significant Aboriginal archaeological sites (Ditton and Sutherland, 2013).
5 McTyer, K. and Sutherland, T. (2011). The Duncan Method of Partial Pillar Extraction at Tasman Mine, 11th Underground Coal Operators' Conference, University of Wollongong & the Australasian Institute of Mining and Metallurgy, 2011, 8-15. 6 Ditton, S. and Sutherland, T. (2013). Management of Subsidence at the Tasman and Abel Mines - Issues and Outcomes, 13th Coal Operators' Conference, University of Wollongong, The Australasian Institute of Mining and Metallurgy & Mine Managers Association of Australia, 2013, 86-98.
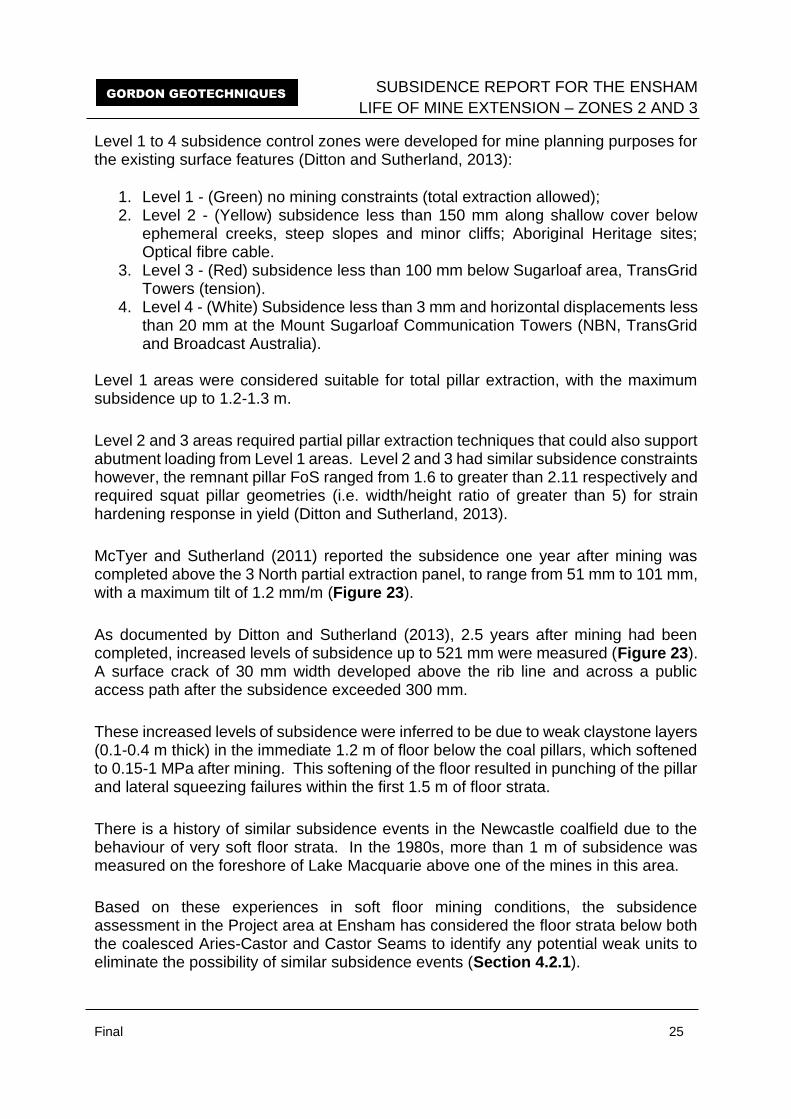
SUBSIDENCE REPORT FOR THE ENSHAM
LIFE OF MINE EXTENSION – ZONES 2 AND 3
Final 25
GORDON GEOTECHNIQUES
Level 1 to 4 subsidence control zones were developed for mine planning purposes for the existing surface features (Ditton and Sutherland, 2013):
1. Level 1 - (Green) no mining constraints (total extraction allowed); 2. Level 2 - (Yellow) subsidence less than 150 mm along shallow cover below
ephemeral creeks, steep slopes and minor cliffs; Aboriginal Heritage sites; Optical fibre cable.
3. Level 3 - (Red) subsidence less than 100 mm below Sugarloaf area, TransGrid Towers (tension).
4. Level 4 - (White) Subsidence less than 3 mm and horizontal displacements less than 20 mm at the Mount Sugarloaf Communication Towers (NBN, TransGrid and Broadcast Australia).
Level 1 areas were considered suitable for total pillar extraction, with the maximum subsidence up to 1.2-1.3 m.
Level 2 and 3 areas required partial pillar extraction techniques that could also support abutment loading from Level 1 areas. Level 2 and 3 had similar subsidence constraints however, the remnant pillar FoS ranged from 1.6 to greater than 2.11 respectively and required squat pillar geometries (i.e. width/height ratio of greater than 5) for strain hardening response in yield (Ditton and Sutherland, 2013).
McTyer and Sutherland (2011) reported the subsidence one year after mining was completed above the 3 North partial extraction panel, to range from 51 mm to 101 mm, with a maximum tilt of 1.2 mm/m (Figure 23).
As documented by Ditton and Sutherland (2013), 2.5 years after mining had been completed, increased levels of subsidence up to 521 mm were measured (Figure 23). A surface crack of 30 mm width developed above the rib line and across a public access path after the subsidence exceeded 300 mm.
These increased levels of subsidence were inferred to be due to weak claystone layers (0.1-0.4 m thick) in the immediate 1.2 m of floor below the coal pillars, which softened to 0.15-1 MPa after mining. This softening of the floor resulted in punching of the pillar and lateral squeezing failures within the first 1.5 m of floor strata.
There is a history of similar subsidence events in the Newcastle coalfield due to the behaviour of very soft floor strata. In the 1980s, more than 1 m of subsidence was measured on the foreshore of Lake Macquarie above one of the mines in this area.
Based on these experiences in soft floor mining conditions, the subsidence assessment in the Project area at Ensham has considered the floor strata below both the coalesced Aries-Castor and Castor Seams to identify any potential weak units to eliminate the possibility of similar subsidence events (Section 4.2.1).
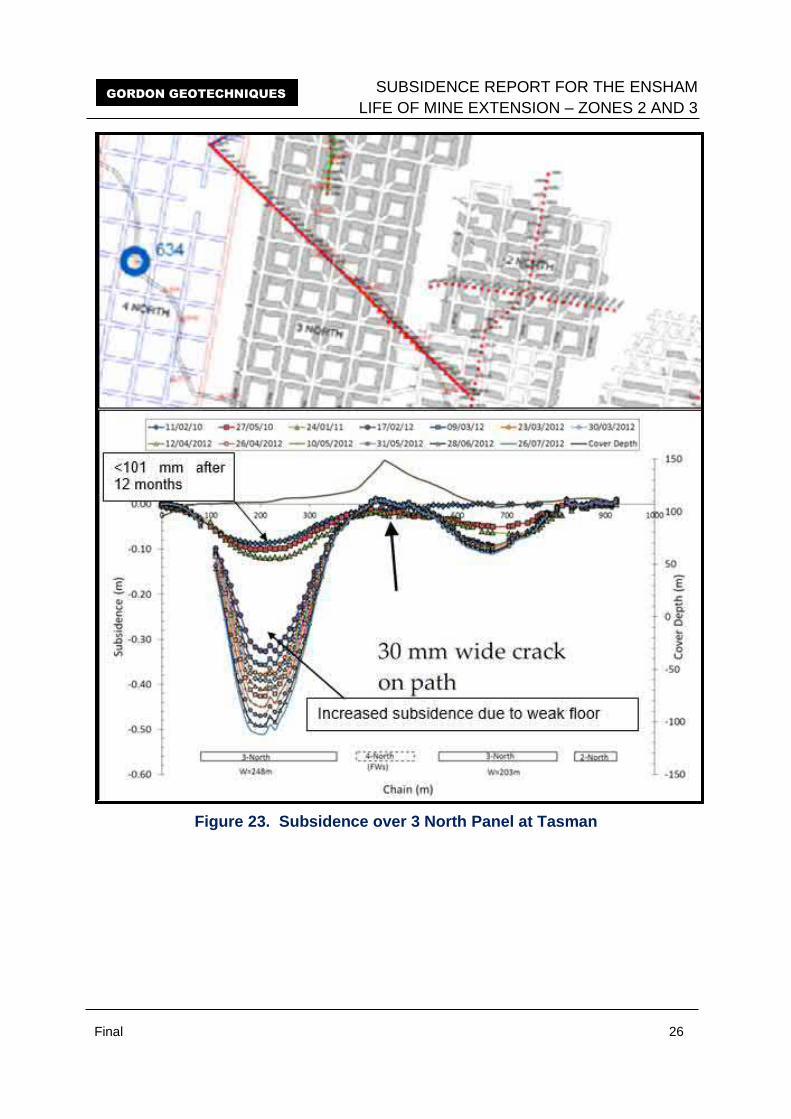
SUBSIDENCE REPORT FOR THE ENSHAM
LIFE OF MINE EXTENSION – ZONES 2 AND 3
Final 26
GORDON GEOTECHNIQUES
Figure 23. Subsidence over 3 North Panel at Tasman
SUBSIDENCE REPORT FOR THE ENSHAM
LIFE OF MINE EXTENSION – ZONES 2 AND 3
Final 27
GORDON GEOTECHNIQUES
4 SUBSIDENCE PREDICTION METHODOLOGY AND RESULTS
The bord and pillar mining method proposed in Zones 2 and 3 is described in Section 1.3. The proposed mine layout has been specifically designed to ensure that there will be no caving of the roof or collapse of the pillars.
The long-term stability of the proposed underground workings has been assessed in Sections 4.1.1, 4.1.2 and 4.1.4 using the design FoS, pillar dimensions (width to height ratio) and stability of the overburden respectively.
Section 4.1.5 provides a comparison of the stability of the pillars in the Project area, to published studies of pillar failure events and experience from the current Ensham underground workings.
The subsidence behaviour and effects have been assessed in Sections 4.2 and 4.3.
4.1 Stability of Underground Workings
4.1.1 Factor of Safety
The assessment of the long-term stability of the coal pillars in the Project area has been carried out using the industry accepted University of New South Wales Pillar Design Procedure to determine the design FoS as follows (Galvin et al, 19987):
FoS = Strength of Pillar/Load on Pillar
The strength of the pillars in the Project area was calculated using the UNSW Pillar Design Power Strength Formulae. The following FoS are planned for Zone 2 and Zone 3 in the Project area:
a) 2.11 for bord and pillar workings beneath the Nogoa River anabranch; b) 2.11 for access roadways beneath the Nogoa River to connect the bord and
pillar and longwall mining areas; and c) 1.6 for all other bord and pillar workings beneath the floodplain of the Nogoa
River.
4.1.1.1 Pillar Load
The load carried by the pillars was calculated using tributary area loading. The majority of the panels in the Project area have panel width to depth of cover ratios greater than 1, whereby the pillars experience the full tributary area load of the overlying strata.
7 Galvin, J., Hebblewhite, B., Salamon, M. and Lin, B. (1998). Establishing the Strength of Rectangular and Irregular Pillars. Final Report, ACARP Project C5024.
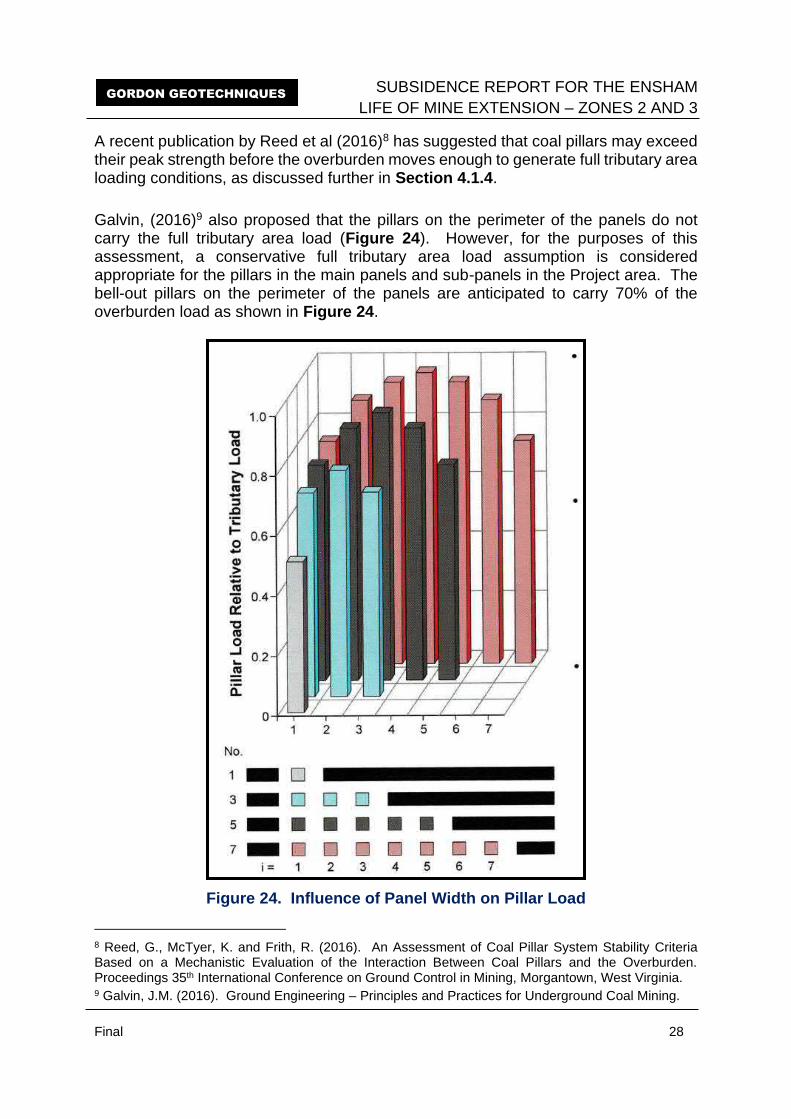
SUBSIDENCE REPORT FOR THE ENSHAM
LIFE OF MINE EXTENSION – ZONES 2 AND 3
Final 28
GORDON GEOTECHNIQUES
A recent publication by Reed et al (2016)8 has suggested that coal pillars may exceed their peak strength before the overburden moves enough to generate full tributary area loading conditions, as discussed further in Section 4.1.4.
Galvin, (2016)9 also proposed that the pillars on the perimeter of the panels do not carry the full tributary area load (Figure 24). However, for the purposes of this assessment, a conservative full tributary area load assumption is considered appropriate for the pillars in the main panels and sub-panels in the Project area. The bell-out pillars on the perimeter of the panels are anticipated to carry 70% of the overburden load as shown in Figure 24.
Figure 24. Influence of Panel Width on Pillar Load
8 Reed, G., McTyer, K. and Frith, R. (2016). An Assessment of Coal Pillar System Stability Criteria Based on a Mechanistic Evaluation of the Interaction Between Coal Pillars and the Overburden. Proceedings 35th International Conference on Ground Control in Mining, Morgantown, West Virginia. 9 Galvin, J.M. (2016). Ground Engineering – Principles and Practices for Underground Coal Mining.
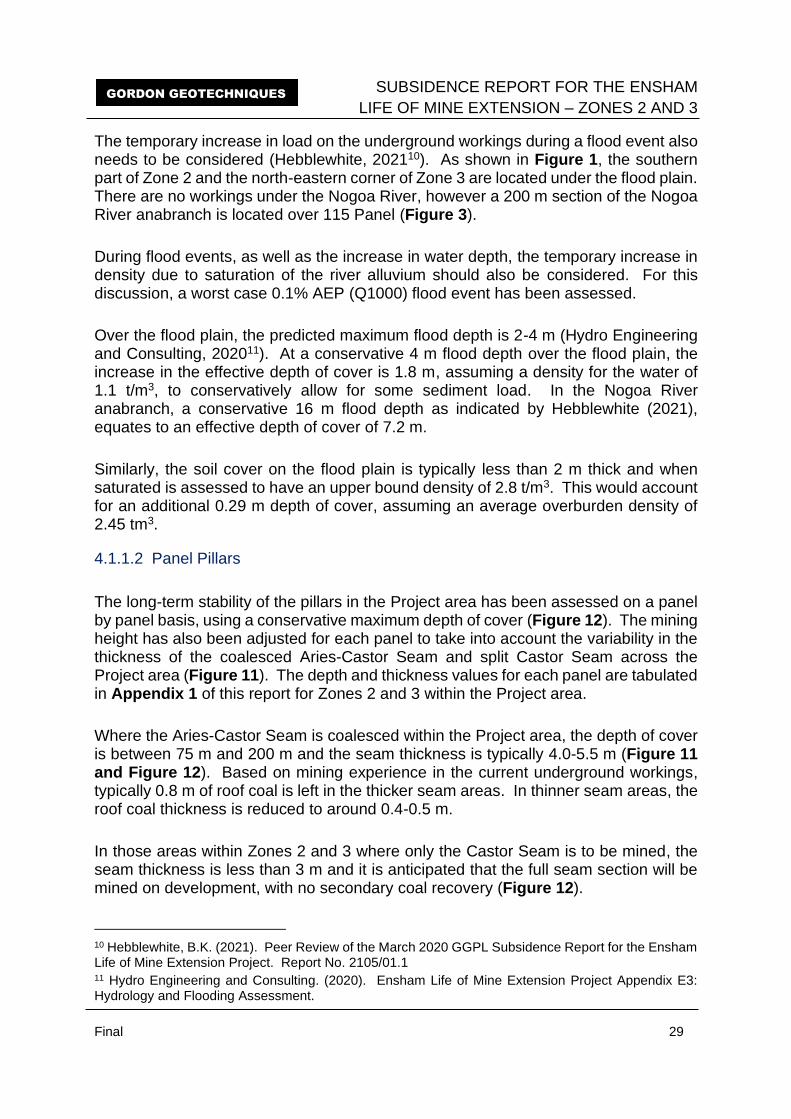
SUBSIDENCE REPORT FOR THE ENSHAM
LIFE OF MINE EXTENSION – ZONES 2 AND 3
Final 29
GORDON GEOTECHNIQUES
The temporary increase in load on the underground workings during a flood event also needs to be considered (Hebblewhite, 202110). As shown in Figure 1, the southern part of Zone 2 and the north-eastern corner of Zone 3 are located under the flood plain. There are no workings under the Nogoa River, however a 200 m section of the Nogoa River anabranch is located over 115 Panel (Figure 3).
During flood events, as well as the increase in water depth, the temporary increase in density due to saturation of the river alluvium should also be considered. For this discussion, a worst case 0.1% AEP (Q1000) flood event has been assessed.
Over the flood plain, the predicted maximum flood depth is 2-4 m (Hydro Engineering and Consulting, 202011). At a conservative 4 m flood depth over the flood plain, the increase in the effective depth of cover is 1.8 m, assuming a density for the water of 1.1 t/m3, to conservatively allow for some sediment load. In the Nogoa River anabranch, a conservative 16 m flood depth as indicated by Hebblewhite (2021), equates to an effective depth of cover of 7.2 m.
Similarly, the soil cover on the flood plain is typically less than 2 m thick and when saturated is assessed to have an upper bound density of 2.8 t/m3. This would account for an additional 0.29 m depth of cover, assuming an average overburden density of 2.45 tm3.
4.1.1.2 Panel Pillars
The long-term stability of the pillars in the Project area has been assessed on a panel by panel basis, using a conservative maximum depth of cover (Figure 12). The mining height has also been adjusted for each panel to take into account the variability in the thickness of the coalesced Aries-Castor Seam and split Castor Seam across the Project area (Figure 11). The depth and thickness values for each panel are tabulated in Appendix 1 of this report for Zones 2 and 3 within the Project area.
Where the Aries-Castor Seam is coalesced within the Project area, the depth of cover is between 75 m and 200 m and the seam thickness is typically 4.0-5.5 m (Figure 11 and Figure 12). Based on mining experience in the current underground workings, typically 0.8 m of roof coal is left in the thicker seam areas. In thinner seam areas, the roof coal thickness is reduced to around 0.4-0.5 m.
In those areas within Zones 2 and 3 where only the Castor Seam is to be mined, the seam thickness is less than 3 m and it is anticipated that the full seam section will be mined on development, with no secondary coal recovery (Figure 12).
10 Hebblewhite, B.K. (2021). Peer Review of the March 2020 GGPL Subsidence Report for the Ensham Life of Mine Extension Project. Report No. 2105/01.1 11 Hydro Engineering and Consulting. (2020). Ensham Life of Mine Extension Project Appendix E3: Hydrology and Flooding Assessment.
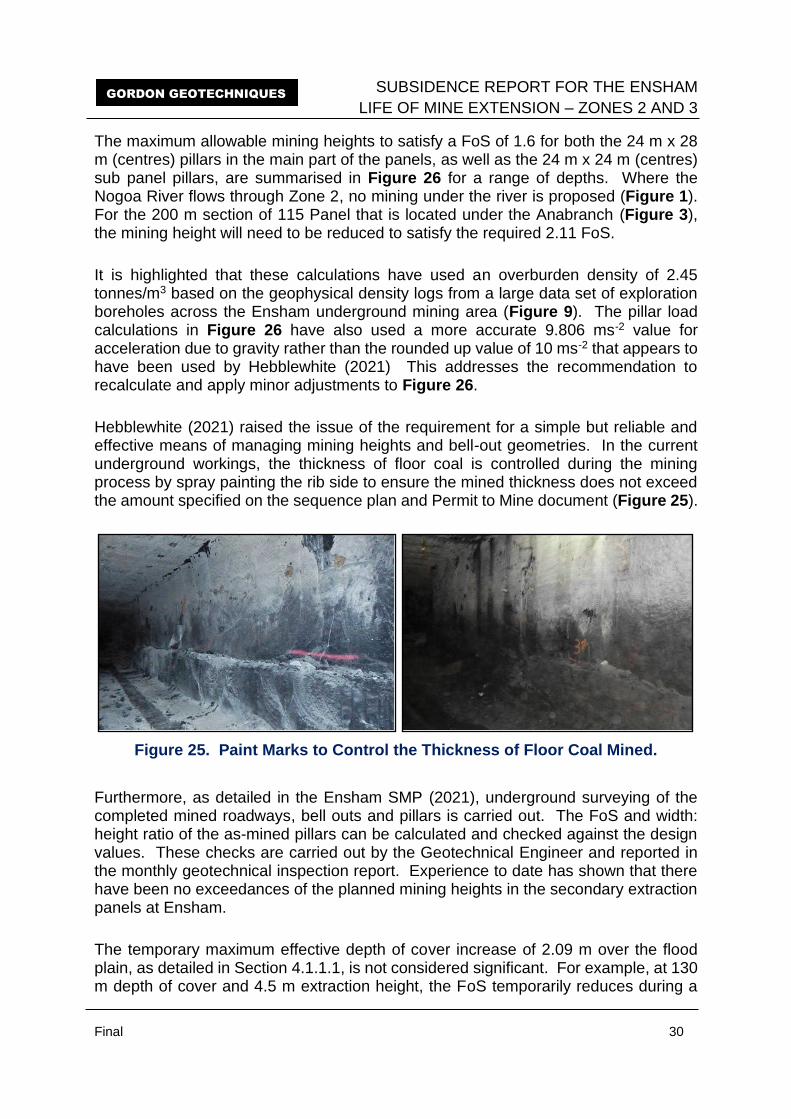
SUBSIDENCE REPORT FOR THE ENSHAM
LIFE OF MINE EXTENSION – ZONES 2 AND 3
Final 30
GORDON GEOTECHNIQUES
The maximum allowable mining heights to satisfy a FoS of 1.6 for both the 24 m x 28 m (centres) pillars in the main part of the panels, as well as the 24 m x 24 m (centres) sub panel pillars, are summarised in Figure 26 for a range of depths. Where the Nogoa River flows through Zone 2, no mining under the river is proposed (Figure 1). For the 200 m section of 115 Panel that is located under the Anabranch (Figure 3), the mining height will need to be reduced to satisfy the required 2.11 FoS.
It is highlighted that these calculations have used an overburden density of 2.45 tonnes/m3 based on the geophysical density logs from a large data set of exploration boreholes across the Ensham underground mining area (Figure 9). The pillar load calculations in Figure 26 have also used a more accurate 9.806 ms-2 value for acceleration due to gravity rather than the rounded up value of 10 ms-2 that appears to have been used by Hebblewhite (2021) This addresses the recommendation to recalculate and apply minor adjustments to Figure 26.
Hebblewhite (2021) raised the issue of the requirement for a simple but reliable and effective means of managing mining heights and bell-out geometries. In the current underground workings, the thickness of floor coal is controlled during the mining process by spray painting the rib side to ensure the mined thickness does not exceed the amount specified on the sequence plan and Permit to Mine document (Figure 25).
Figure 25. Paint Marks to Control the Thickness of Floor Coal Mined.
Furthermore, as detailed in the Ensham SMP (2021), underground surveying of the completed mined roadways, bell outs and pillars is carried out. The FoS and width: height ratio of the as-mined pillars can be calculated and checked against the design values. These checks are carried out by the Geotechnical Engineer and reported in the monthly geotechnical inspection report. Experience to date has shown that there have been no exceedances of the planned mining heights in the secondary extraction panels at Ensham.
The temporary maximum effective depth of cover increase of 2.09 m over the flood plain, as detailed in Section 4.1.1.1, is not considered significant. For example, at 130 m depth of cover and 4.5 m extraction height, the FoS temporarily reduces during a
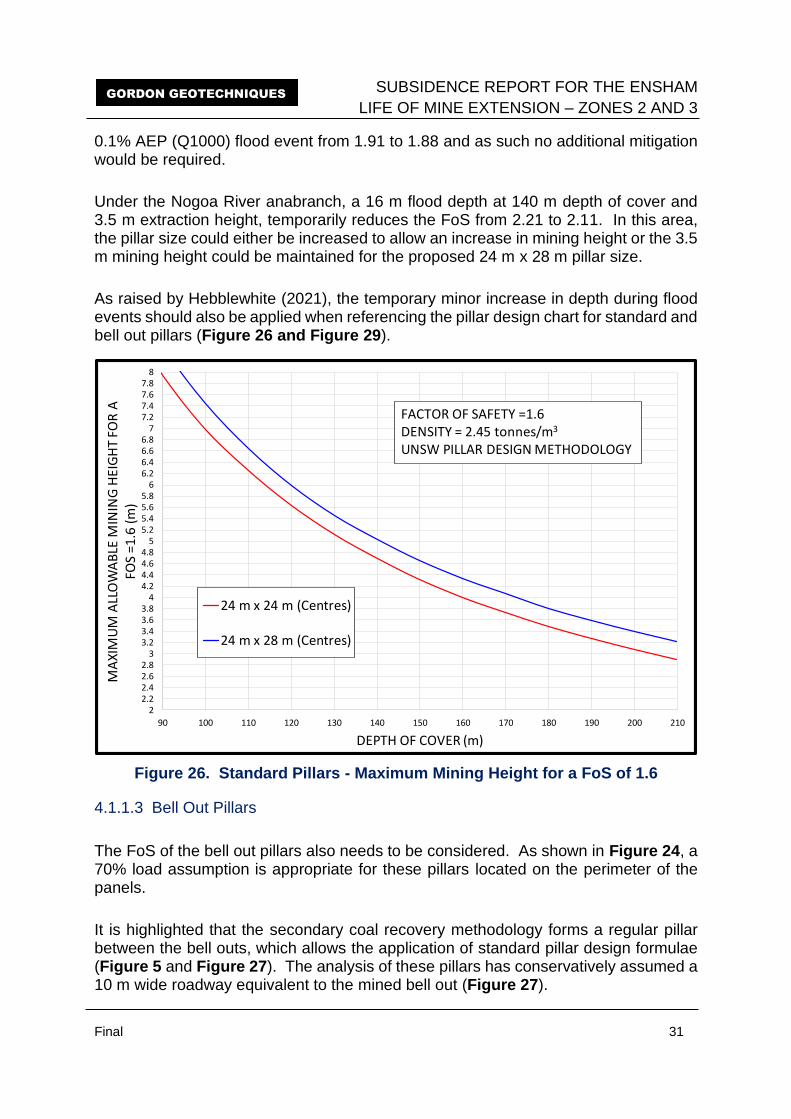
SUBSIDENCE REPORT FOR THE ENSHAM
LIFE OF MINE EXTENSION – ZONES 2 AND 3
Final 31
GORDON GEOTECHNIQUES
0.1% AEP (Q1000) flood event from 1.91 to 1.88 and as such no additional mitigation would be required.
Under the Nogoa River anabranch, a 16 m flood depth at 140 m depth of cover and 3.5 m extraction height, temporarily reduces the FoS from 2.21 to 2.11. In this area, the pillar size could either be increased to allow an increase in mining height or the 3.5 m mining height could be maintained for the proposed 24 m x 28 m pillar size.
As raised by Hebblewhite (2021), the temporary minor increase in depth during flood events should also be applied when referencing the pillar design chart for standard and bell out pillars (Figure 26 and Figure 29).
Figure 26. Standard Pillars - Maximum Mining Height for a FoS of 1.6
4.1.1.3 Bell Out Pillars
The FoS of the bell out pillars also needs to be considered. As shown in Figure 24, a 70% load assumption is appropriate for these pillars located on the perimeter of the panels.
It is highlighted that the secondary coal recovery methodology forms a regular pillar between the bell outs, which allows the application of standard pillar design formulae (Figure 5 and Figure 27). The analysis of these pillars has conservatively assumed a 10 m wide roadway equivalent to the mined bell out (Figure 27).
22.22.42.62.8
33.23.43.63.8
44.24.44.64.8
55.25.45.65.8
66.26.46.66.8
77.27.47.67.8
8
90 100 110 120 130 140 150 160 170 180 190 200 210
MA
XIM
UM
ALL
OW
AB
LE M
ININ
G H
EIG
HT
FOR
A
FOS
=1.6
(m
)
DEPTH OF COVER (m)
24 m x 24 m (Centres)
24 m x 28 m (Centres)
FACTOR OF SAFETY =1.6DENSITY = 2.45 tonnes/m3
UNSW PILLAR DESIGN METHODOLOGY
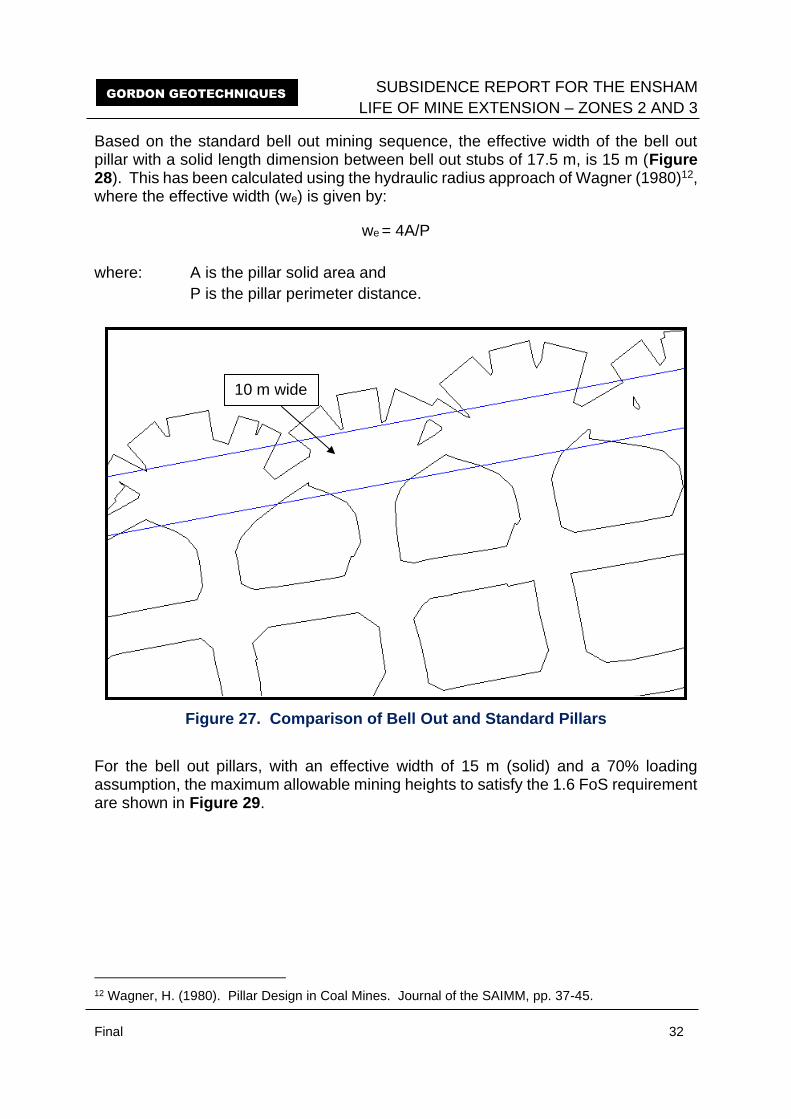
SUBSIDENCE REPORT FOR THE ENSHAM
LIFE OF MINE EXTENSION – ZONES 2 AND 3
Final 32
GORDON GEOTECHNIQUES
Based on the standard bell out mining sequence, the effective width of the bell out pillar with a solid length dimension between bell out stubs of 17.5 m, is 15 m (Figure 28). This has been calculated using the hydraulic radius approach of Wagner (1980)12, where the effective width (we) is given by:
we = 4A/P
where: A is the pillar solid area and
P is the pillar perimeter distance.
Figure 27. Comparison of Bell Out and Standard Pillars
For the bell out pillars, with an effective width of 15 m (solid) and a 70% loading assumption, the maximum allowable mining heights to satisfy the 1.6 FoS requirement are shown in Figure 29.
12 Wagner, H. (1980). Pillar Design in Coal Mines. Journal of the SAIMM, pp. 37-45.
10 m wide
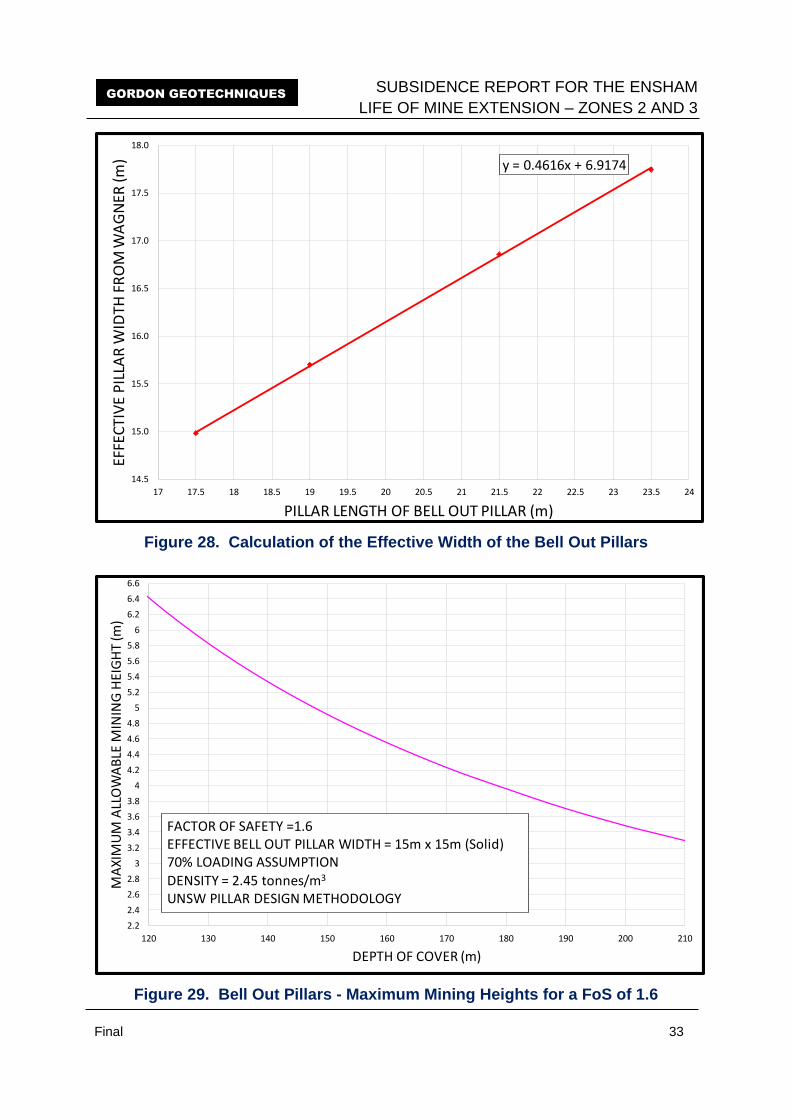
SUBSIDENCE REPORT FOR THE ENSHAM
LIFE OF MINE EXTENSION – ZONES 2 AND 3
Final 33
GORDON GEOTECHNIQUES
Figure 28. Calculation of the Effective Width of the Bell Out Pillars
Figure 29. Bell Out Pillars - Maximum Mining Heights for a FoS of 1.6
y = 0.4616x + 6.9174
14.5
15.0
15.5
16.0
16.5
17.0
17.5
18.0
17 17.5 18 18.5 19 19.5 20 20.5 21 21.5 22 22.5 23 23.5 24
EFFE
CTI
VE
PIL
LAR
WID
TH F
RO
M W
AG
NER
(m)
PILLAR LENGTH OF BELL OUT PILLAR (m)
2.2
2.4
2.6
2.8
3
3.2
3.4
3.6
3.8
4
4.2
4.4
4.6
4.8
5
5.2
5.4
5.6
5.8
6
6.2
6.4
6.6
120 130 140 150 160 170 180 190 200 210
MA
XIM
UM
ALL
OW
AB
LE M
ININ
G H
EIG
HT
(m)
DEPTH OF COVER (m)
FACTOR OF SAFETY =1.6EFFECTIVE BELL OUT PILLAR WIDTH = 15m x 15m (Solid)70% LOADING ASSUMPTION
DENSITY = 2.45 tonnes/m3
UNSW PILLAR DESIGN METHODOLOGY
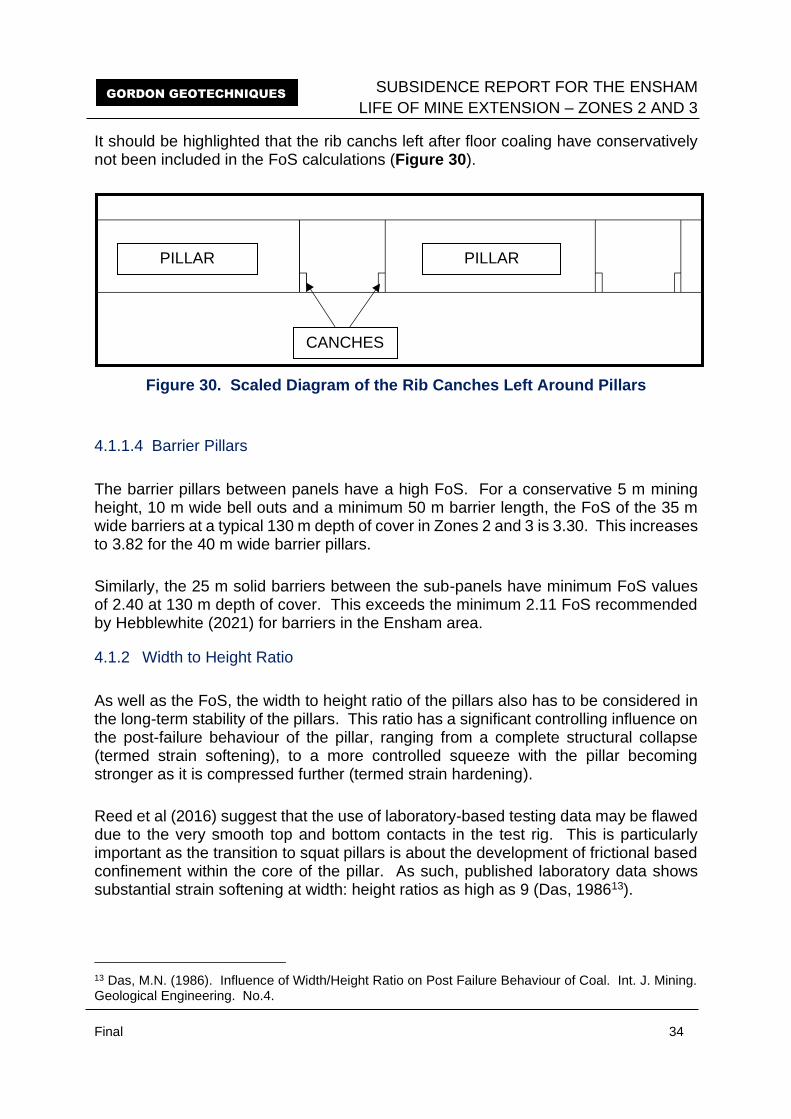
SUBSIDENCE REPORT FOR THE ENSHAM
LIFE OF MINE EXTENSION – ZONES 2 AND 3
Final 34
GORDON GEOTECHNIQUES
It should be highlighted that the rib canchs left after floor coaling have conservatively not been included in the FoS calculations (Figure 30).
Figure 30. Scaled Diagram of the Rib Canches Left Around Pillars
4.1.1.4 Barrier Pillars
The barrier pillars between panels have a high FoS. For a conservative 5 m mining height, 10 m wide bell outs and a minimum 50 m barrier length, the FoS of the 35 m wide barriers at a typical 130 m depth of cover in Zones 2 and 3 is 3.30. This increases to 3.82 for the 40 m wide barrier pillars.
Similarly, the 25 m solid barriers between the sub-panels have minimum FoS values of 2.40 at 130 m depth of cover. This exceeds the minimum 2.11 FoS recommended by Hebblewhite (2021) for barriers in the Ensham area.
4.1.2 Width to Height Ratio
As well as the FoS, the width to height ratio of the pillars also has to be considered in the long-term stability of the pillars. This ratio has a significant controlling influence on the post-failure behaviour of the pillar, ranging from a complete structural collapse (termed strain softening), to a more controlled squeeze with the pillar becoming stronger as it is compressed further (termed strain hardening).
Reed et al (2016) suggest that the use of laboratory-based testing data may be flawed due to the very smooth top and bottom contacts in the test rig. This is particularly important as the transition to squat pillars is about the development of frictional based confinement within the core of the pillar. As such, published laboratory data shows substantial strain softening at width: height ratios as high as 9 (Das, 198613).
13 Das, M.N. (1986). Influence of Width/Height Ratio on Post Failure Behaviour of Coal. Int. J. Mining. Geological Engineering. No.4.
PILLAR PILLAR
CANCHES
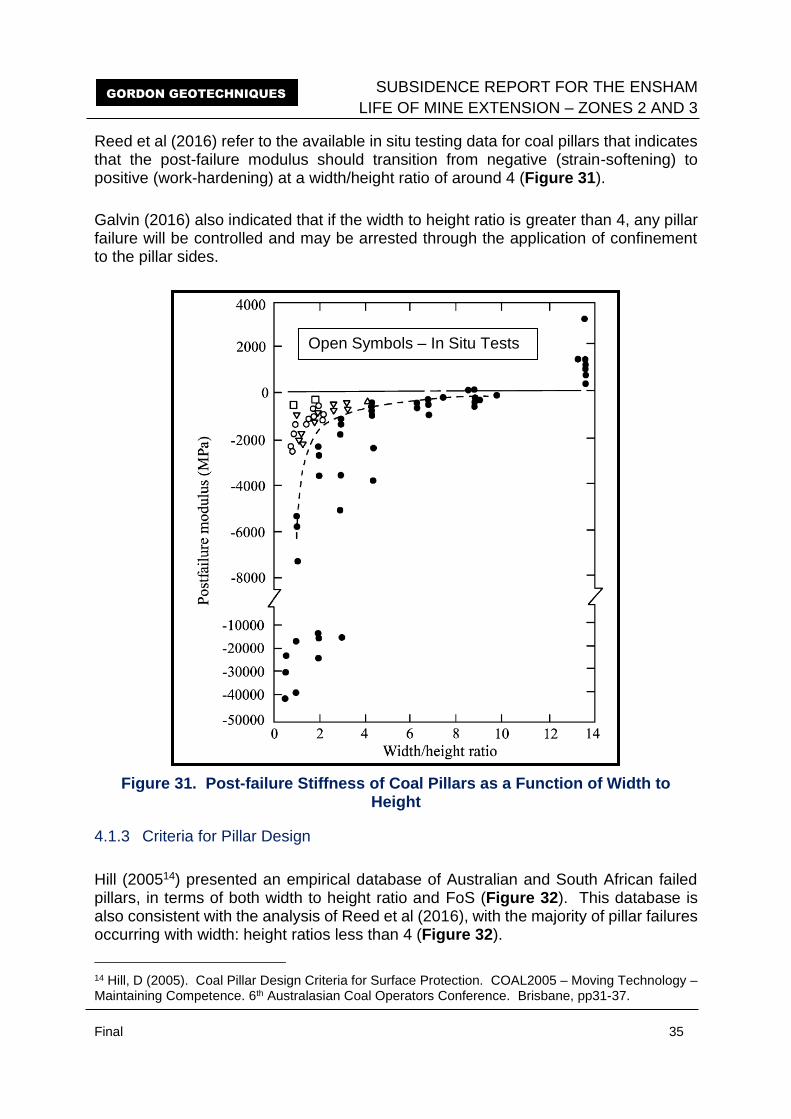
SUBSIDENCE REPORT FOR THE ENSHAM
LIFE OF MINE EXTENSION – ZONES 2 AND 3
Final 35
GORDON GEOTECHNIQUES
Reed et al (2016) refer to the available in situ testing data for coal pillars that indicates that the post-failure modulus should transition from negative (strain-softening) to positive (work-hardening) at a width/height ratio of around 4 (Figure 31).
Galvin (2016) also indicated that if the width to height ratio is greater than 4, any pillar failure will be controlled and may be arrested through the application of confinement to the pillar sides.
Figure 31. Post-failure Stiffness of Coal Pillars as a Function of Width to Height
4.1.3 Criteria for Pillar Design
Hill (200514) presented an empirical database of Australian and South African failed pillars, in terms of both width to height ratio and FoS (Figure 32). This database is also consistent with the analysis of Reed et al (2016), with the majority of pillar failures occurring with width: height ratios less than 4 (Figure 32).
14 Hill, D (2005). Coal Pillar Design Criteria for Surface Protection. COAL2005 – Moving Technology – Maintaining Competence. 6th Australasian Coal Operators Conference. Brisbane, pp31-37.
Open Symbols – In Situ Tests
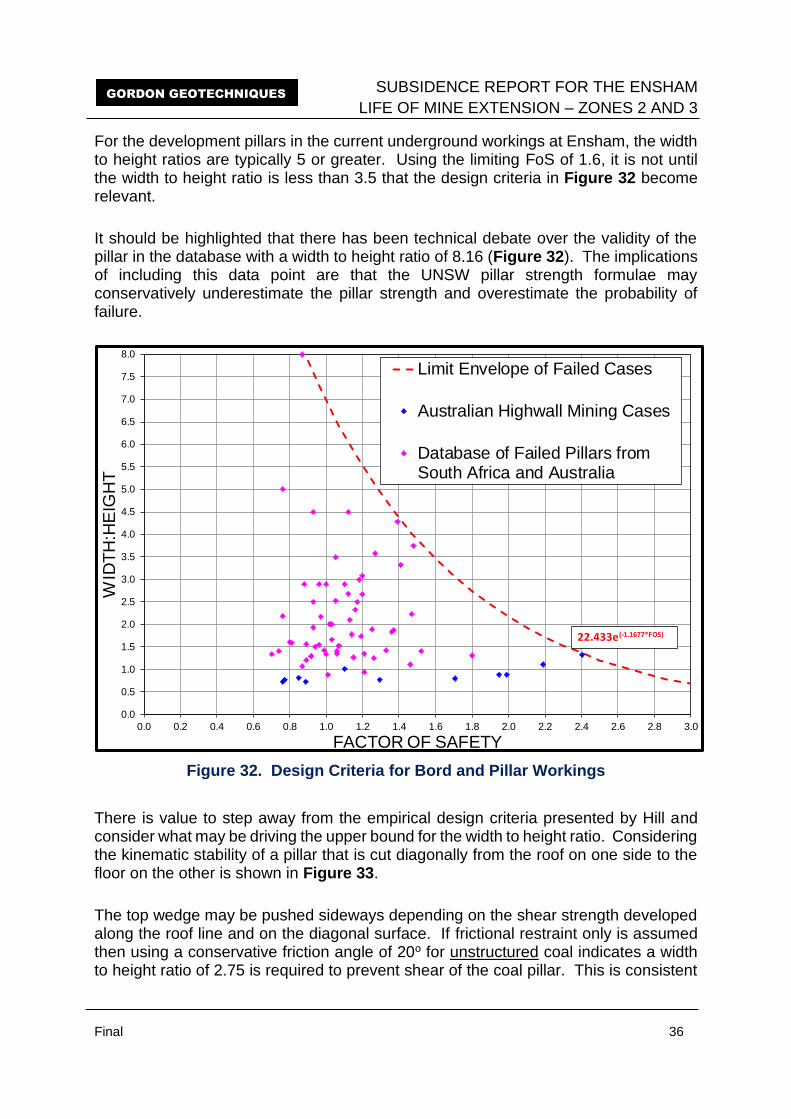
SUBSIDENCE REPORT FOR THE ENSHAM
LIFE OF MINE EXTENSION – ZONES 2 AND 3
Final 36
GORDON GEOTECHNIQUES
For the development pillars in the current underground workings at Ensham, the width to height ratios are typically 5 or greater. Using the limiting FoS of 1.6, it is not until the width to height ratio is less than 3.5 that the design criteria in Figure 32 become relevant.
It should be highlighted that there has been technical debate over the validity of the pillar in the database with a width to height ratio of 8.16 (Figure 32). The implications of including this data point are that the UNSW pillar strength formulae may conservatively underestimate the pillar strength and overestimate the probability of failure.
Figure 32. Design Criteria for Bord and Pillar Workings
There is value to step away from the empirical design criteria presented by Hill and consider what may be driving the upper bound for the width to height ratio. Considering the kinematic stability of a pillar that is cut diagonally from the roof on one side to the floor on the other is shown in Figure 33.
The top wedge may be pushed sideways depending on the shear strength developed along the roof line and on the diagonal surface. If frictional restraint only is assumed then using a conservative friction angle of 20o for unstructured coal indicates a width to height ratio of 2.75 is required to prevent shear of the coal pillar. This is consistent
0.0
0.5
1.0
1.5
2.0
2.5
3.0
3.5
4.0
4.5
5.0
5.5
6.0
6.5
7.0
7.5
8.0
0.0 0.2 0.4 0.6 0.8 1.0 1.2 1.4 1.6 1.8 2.0 2.2 2.4 2.6 2.8 3.0
WID
TH
:HE
IGH
T
FACTOR OF SAFETY
Limit Envelope of Failed Cases
Australian Highwall Mining Cases
Database of Failed Pillars fromSouth Africa and Australia
22.433e(-1.1677*FOS)
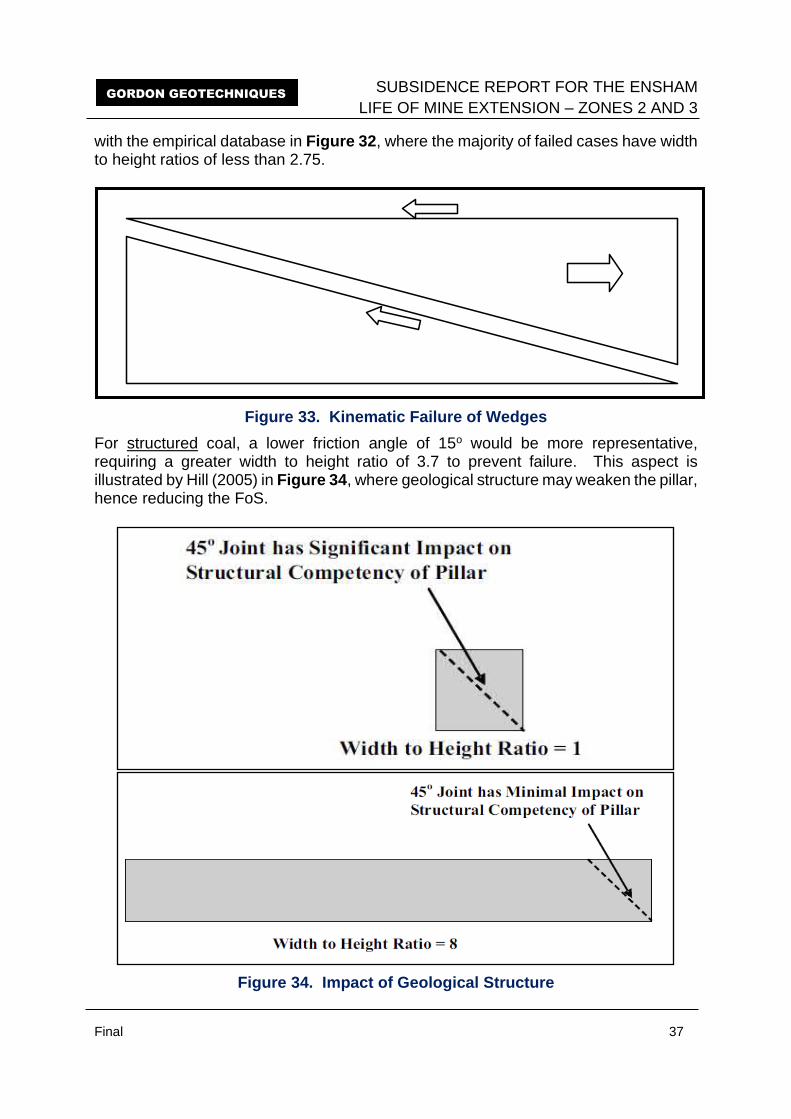
SUBSIDENCE REPORT FOR THE ENSHAM
LIFE OF MINE EXTENSION – ZONES 2 AND 3
Final 37
GORDON GEOTECHNIQUES
with the empirical database in Figure 32, where the majority of failed cases have width to height ratios of less than 2.75.
Figure 33. Kinematic Failure of Wedges
For structured coal, a lower friction angle of 15o would be more representative, requiring a greater width to height ratio of 3.7 to prevent failure. This aspect is illustrated by Hill (2005) in Figure 34, where geological structure may weaken the pillar, hence reducing the FoS.
Figure 34. Impact of Geological Structure
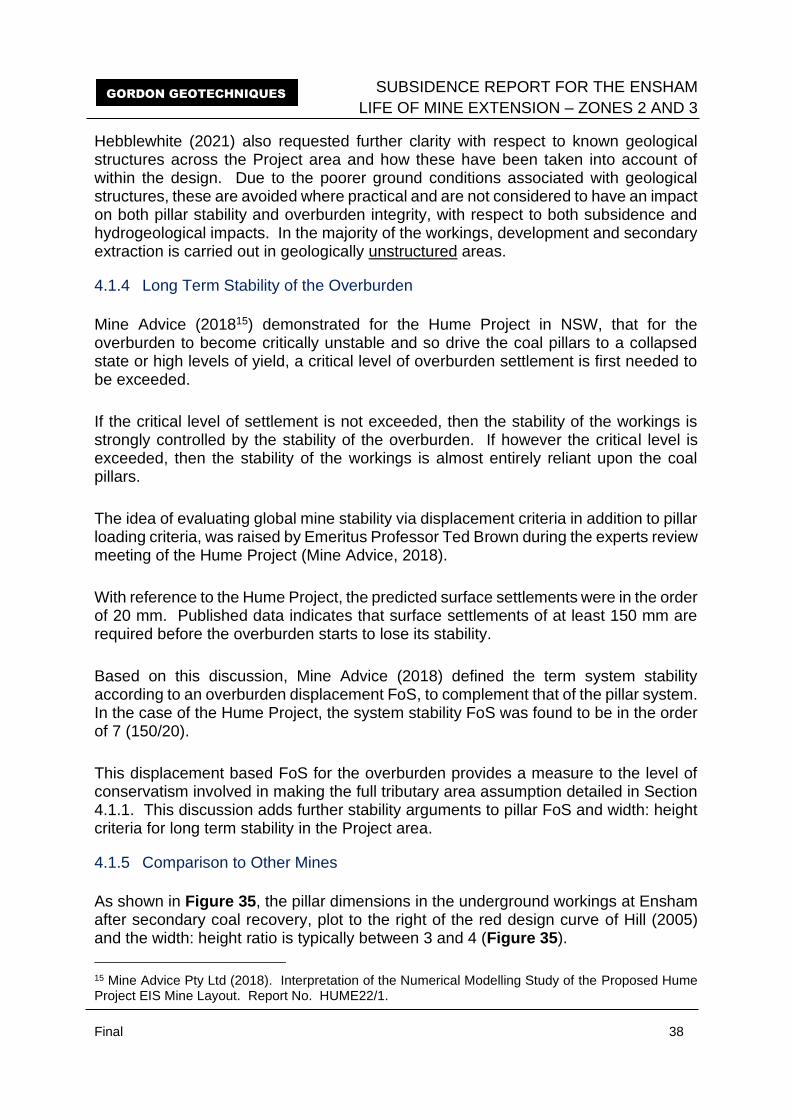
SUBSIDENCE REPORT FOR THE ENSHAM
LIFE OF MINE EXTENSION – ZONES 2 AND 3
Final 38
GORDON GEOTECHNIQUES
Hebblewhite (2021) also requested further clarity with respect to known geological structures across the Project area and how these have been taken into account of within the design. Due to the poorer ground conditions associated with geological structures, these are avoided where practical and are not considered to have an impact on both pillar stability and overburden integrity, with respect to both subsidence and hydrogeological impacts. In the majority of the workings, development and secondary extraction is carried out in geologically unstructured areas.
4.1.4 Long Term Stability of the Overburden
Mine Advice (201815) demonstrated for the Hume Project in NSW, that for the overburden to become critically unstable and so drive the coal pillars to a collapsed state or high levels of yield, a critical level of overburden settlement is first needed to be exceeded.
If the critical level of settlement is not exceeded, then the stability of the workings is strongly controlled by the stability of the overburden. If however the critical level is exceeded, then the stability of the workings is almost entirely reliant upon the coal pillars.
The idea of evaluating global mine stability via displacement criteria in addition to pillar loading criteria, was raised by Emeritus Professor Ted Brown during the experts review meeting of the Hume Project (Mine Advice, 2018).
With reference to the Hume Project, the predicted surface settlements were in the order of 20 mm. Published data indicates that surface settlements of at least 150 mm are required before the overburden starts to lose its stability.
Based on this discussion, Mine Advice (2018) defined the term system stability according to an overburden displacement FoS, to complement that of the pillar system. In the case of the Hume Project, the system stability FoS was found to be in the order of 7 (150/20).
This displacement based FoS for the overburden provides a measure to the level of conservatism involved in making the full tributary area assumption detailed in Section 4.1.1. This discussion adds further stability arguments to pillar FoS and width: height criteria for long term stability in the Project area.
4.1.5 Comparison to Other Mines
As shown in Figure 35, the pillar dimensions in the underground workings at Ensham after secondary coal recovery, plot to the right of the red design curve of Hill (2005) and the width: height ratio is typically between 3 and 4 (Figure 35).
15 Mine Advice Pty Ltd (2018). Interpretation of the Numerical Modelling Study of the Proposed Hume Project EIS Mine Layout. Report No. HUME22/1.
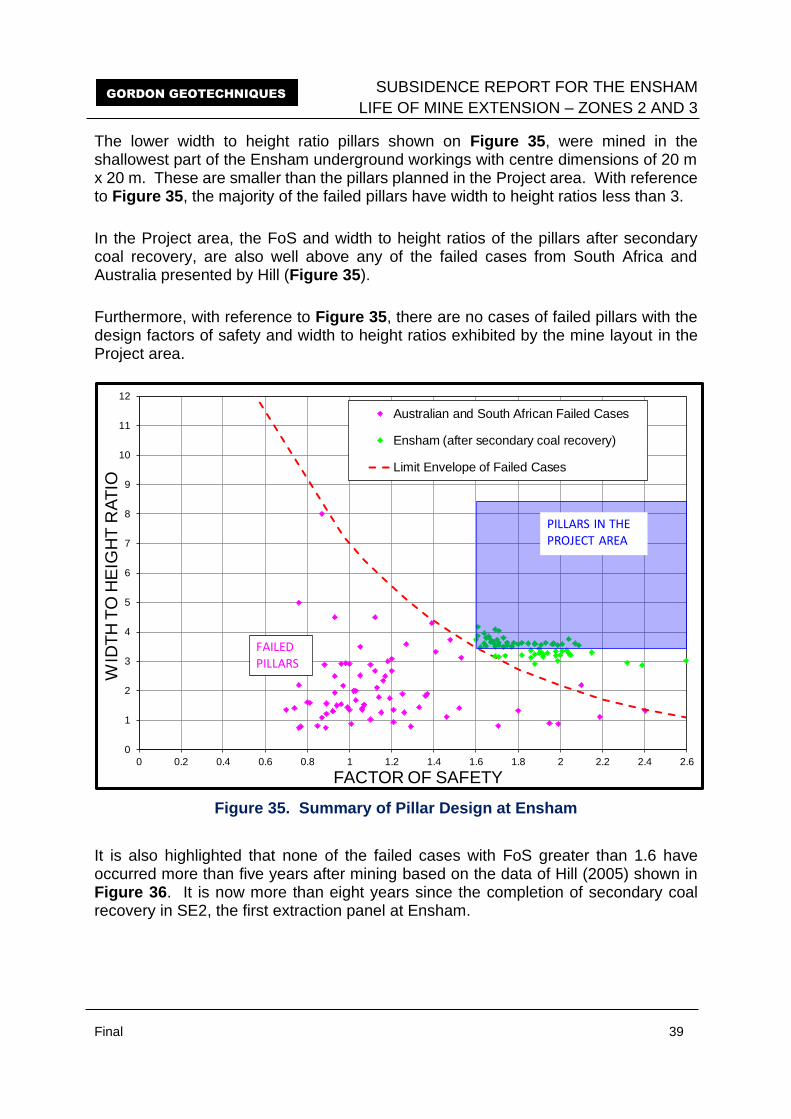
SUBSIDENCE REPORT FOR THE ENSHAM
LIFE OF MINE EXTENSION – ZONES 2 AND 3
Final 39
GORDON GEOTECHNIQUES
The lower width to height ratio pillars shown on Figure 35, were mined in the shallowest part of the Ensham underground workings with centre dimensions of 20 m x 20 m. These are smaller than the pillars planned in the Project area. With reference to Figure 35, the majority of the failed pillars have width to height ratios less than 3.
In the Project area, the FoS and width to height ratios of the pillars after secondary coal recovery, are also well above any of the failed cases from South Africa and Australia presented by Hill (Figure 35).
Furthermore, with reference to Figure 35, there are no cases of failed pillars with the design factors of safety and width to height ratios exhibited by the mine layout in the Project area.
Figure 35. Summary of Pillar Design at Ensham
It is also highlighted that none of the failed cases with FoS greater than 1.6 have occurred more than five years after mining based on the data of Hill (2005) shown in Figure 36. It is now more than eight years since the completion of secondary coal recovery in SE2, the first extraction panel at Ensham.
0
1
2
3
4
5
6
7
8
9
10
11
12
0 0.2 0.4 0.6 0.8 1 1.2 1.4 1.6 1.8 2 2.2 2.4 2.6
WID
TH
TO
HE
IGH
T R
AT
IO
FACTOR OF SAFETY
Australian and South African Failed Cases
Ensham (after secondary coal recovery)
Limit Envelope of Failed Cases
FAILED PILLARS
PILLARS IN THE PROJECT AREA
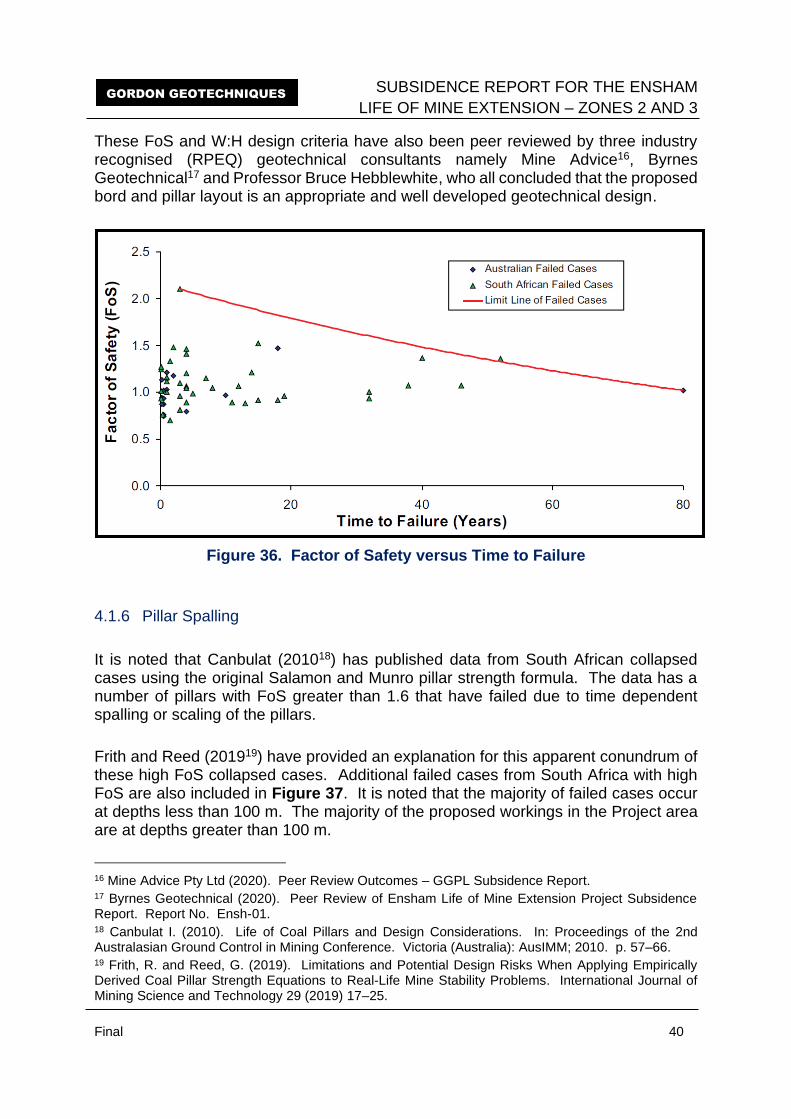
SUBSIDENCE REPORT FOR THE ENSHAM
LIFE OF MINE EXTENSION – ZONES 2 AND 3
Final 40
GORDON GEOTECHNIQUES
These FoS and W:H design criteria have also been peer reviewed by three industry recognised (RPEQ) geotechnical consultants namely Mine Advice16, Byrnes Geotechnical17 and Professor Bruce Hebblewhite, who all concluded that the proposed bord and pillar layout is an appropriate and well developed geotechnical design.
Figure 36. Factor of Safety versus Time to Failure
4.1.6 Pillar Spalling
It is noted that Canbulat (201018) has published data from South African collapsed cases using the original Salamon and Munro pillar strength formula. The data has a number of pillars with FoS greater than 1.6 that have failed due to time dependent spalling or scaling of the pillars.
Frith and Reed (201919) have provided an explanation for this apparent conundrum of these high FoS collapsed cases. Additional failed cases from South Africa with high FoS are also included in Figure 37. It is noted that the majority of failed cases occur at depths less than 100 m. The majority of the proposed workings in the Project area are at depths greater than 100 m.
16 Mine Advice Pty Ltd (2020). Peer Review Outcomes – GGPL Subsidence Report. 17 Byrnes Geotechnical (2020). Peer Review of Ensham Life of Mine Extension Project Subsidence Report. Report No. Ensh-01. 18 Canbulat I. (2010). Life of Coal Pillars and Design Considerations. In: Proceedings of the 2nd Australasian Ground Control in Mining Conference. Victoria (Australia): AusIMM; 2010. p. 57–66. 19 Frith, R. and Reed, G. (2019). Limitations and Potential Design Risks When Applying Empirically Derived Coal Pillar Strength Equations to Real-Life Mine Stability Problems. International Journal of Mining Science and Technology 29 (2019) 17–25.
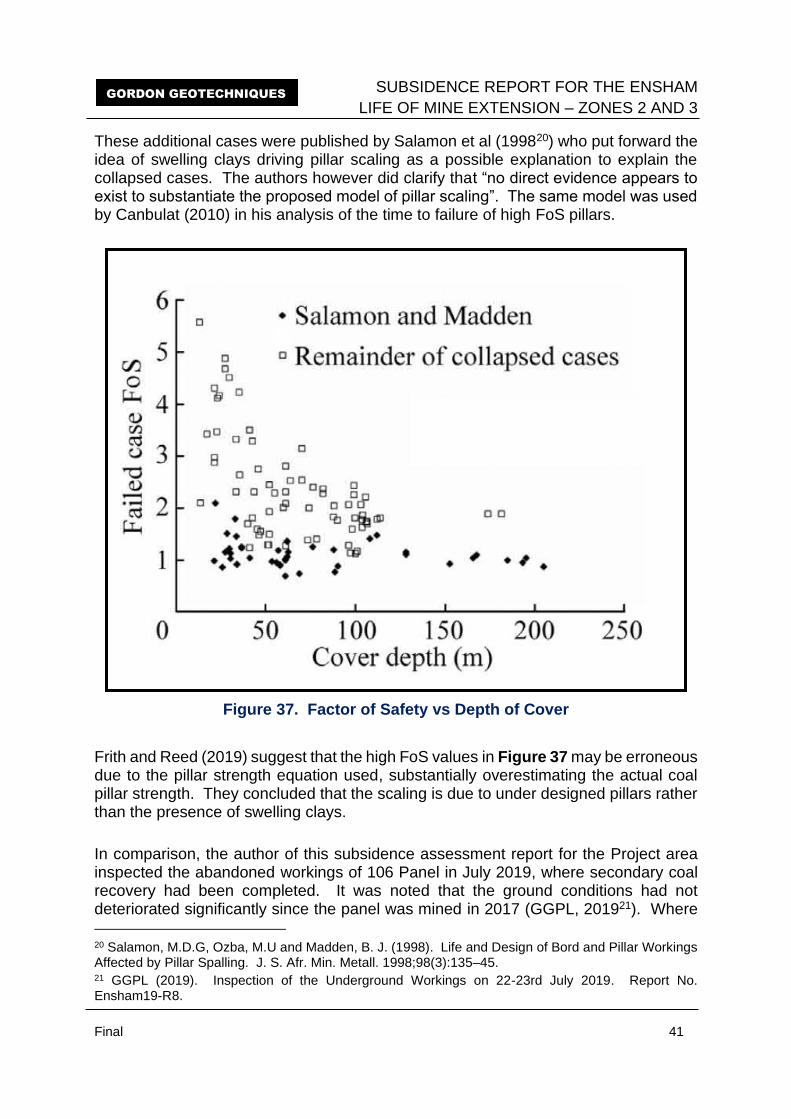
SUBSIDENCE REPORT FOR THE ENSHAM
LIFE OF MINE EXTENSION – ZONES 2 AND 3
Final 41
GORDON GEOTECHNIQUES
These additional cases were published by Salamon et al (199820) who put forward the idea of swelling clays driving pillar scaling as a possible explanation to explain the collapsed cases. The authors however did clarify that “no direct evidence appears to exist to substantiate the proposed model of pillar scaling”. The same model was used by Canbulat (2010) in his analysis of the time to failure of high FoS pillars.
Figure 37. Factor of Safety vs Depth of Cover
Frith and Reed (2019) suggest that the high FoS values in Figure 37 may be erroneous due to the pillar strength equation used, substantially overestimating the actual coal pillar strength. They concluded that the scaling is due to under designed pillars rather than the presence of swelling clays.
In comparison, the author of this subsidence assessment report for the Project area inspected the abandoned workings of 106 Panel in July 2019, where secondary coal recovery had been completed. It was noted that the ground conditions had not deteriorated significantly since the panel was mined in 2017 (GGPL, 201921). Where
20 Salamon, M.D.G, Ozba, M.U and Madden, B. J. (1998). Life and Design of Bord and Pillar Workings Affected by Pillar Spalling. J. S. Afr. Min. Metall. 1998;98(3):135–45. 21 GGPL (2019). Inspection of the Underground Workings on 22-23rd July 2019. Report No. Ensham19-R8.

SUBSIDENCE REPORT FOR THE ENSHAM
LIFE OF MINE EXTENSION – ZONES 2 AND 3
Final 42
GORDON GEOTECHNIQUES
rib spall occurs at Ensham, it is typified by thin 100-200 mm slabs and large-scale pillar spalling as documented by Canbulat (2010) is not present (Figure 38).
It should also be highlighted that there are no swelling clay bands, such as those referenced by Canbulat (2010), present within the Aries and Castor Seams in the Ensham underground mining area neither existing, nor proposed.
Figure 38. Typical Thin Rib Spall at Ensham after Secondary Coal Recovery – F23-24, 109A Panel
Van der Merwe (201622) also presented a formula to calculate the long-term life expectancy of pillars, as follows:
T = [dc/(m*hx)]^(1/(1-x))
Where: T = Time to failure (years)
h = Mining height (m)
m = 0.1799
x = 0.7549
and dc is the critical scaling distance, which for an ultimate safety factor of 0.5 is given by:
22 Van der Merwe, J.N. (2016). Review of Coal Pillar Lifespan Prediction for the Witbank and Highveld Coal Seams. The Journal of the Southern African Institute of Mining and Metallurgy. Pp. 1083-1090, Volume 116.
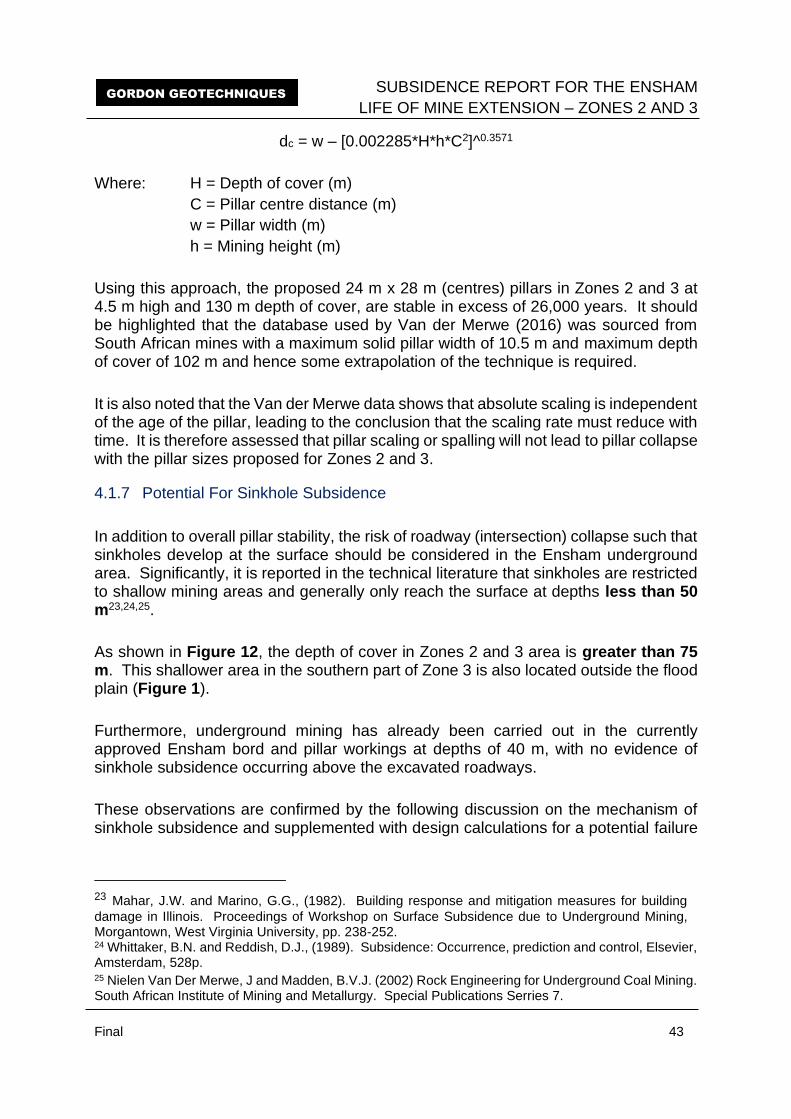
SUBSIDENCE REPORT FOR THE ENSHAM
LIFE OF MINE EXTENSION – ZONES 2 AND 3
Final 43
GORDON GEOTECHNIQUES
dc = w – [0.002285*H*h*C2]^0.3571
Where: H = Depth of cover (m)
C = Pillar centre distance (m)
w = Pillar width (m)
h = Mining height (m)
Using this approach, the proposed 24 m x 28 m (centres) pillars in Zones 2 and 3 at 4.5 m high and 130 m depth of cover, are stable in excess of 26,000 years. It should be highlighted that the database used by Van der Merwe (2016) was sourced from South African mines with a maximum solid pillar width of 10.5 m and maximum depth of cover of 102 m and hence some extrapolation of the technique is required.
It is also noted that the Van der Merwe data shows that absolute scaling is independent of the age of the pillar, leading to the conclusion that the scaling rate must reduce with time. It is therefore assessed that pillar scaling or spalling will not lead to pillar collapse with the pillar sizes proposed for Zones 2 and 3.
4.1.7 Potential For Sinkhole Subsidence
In addition to overall pillar stability, the risk of roadway (intersection) collapse such that sinkholes develop at the surface should be considered in the Ensham underground area. Significantly, it is reported in the technical literature that sinkholes are restricted to shallow mining areas and generally only reach the surface at depths less than 50 m23,24,25.
As shown in Figure 12, the depth of cover in Zones 2 and 3 area is greater than 75 m. This shallower area in the southern part of Zone 3 is also located outside the flood plain (Figure 1).
Furthermore, underground mining has already been carried out in the currently approved Ensham bord and pillar workings at depths of 40 m, with no evidence of sinkhole subsidence occurring above the excavated roadways.
These observations are confirmed by the following discussion on the mechanism of sinkhole subsidence and supplemented with design calculations for a potential failure
23 Mahar, J.W. and Marino, G.G., (1982). Building response and mitigation measures for building
damage in Illinois. Proceedings of Workshop on Surface Subsidence due to Underground Mining, Morgantown, West Virginia University, pp. 238-252. 24 Whittaker, B.N. and Reddish, D.J., (1989). Subsidence: Occurrence, prediction and control, Elsevier, Amsterdam, 528p. 25 Nielen Van Der Merwe, J and Madden, B.V.J. (2002) Rock Engineering for Underground Coal Mining. South African Institute of Mining and Metallurgy. Special Publications Serries 7.
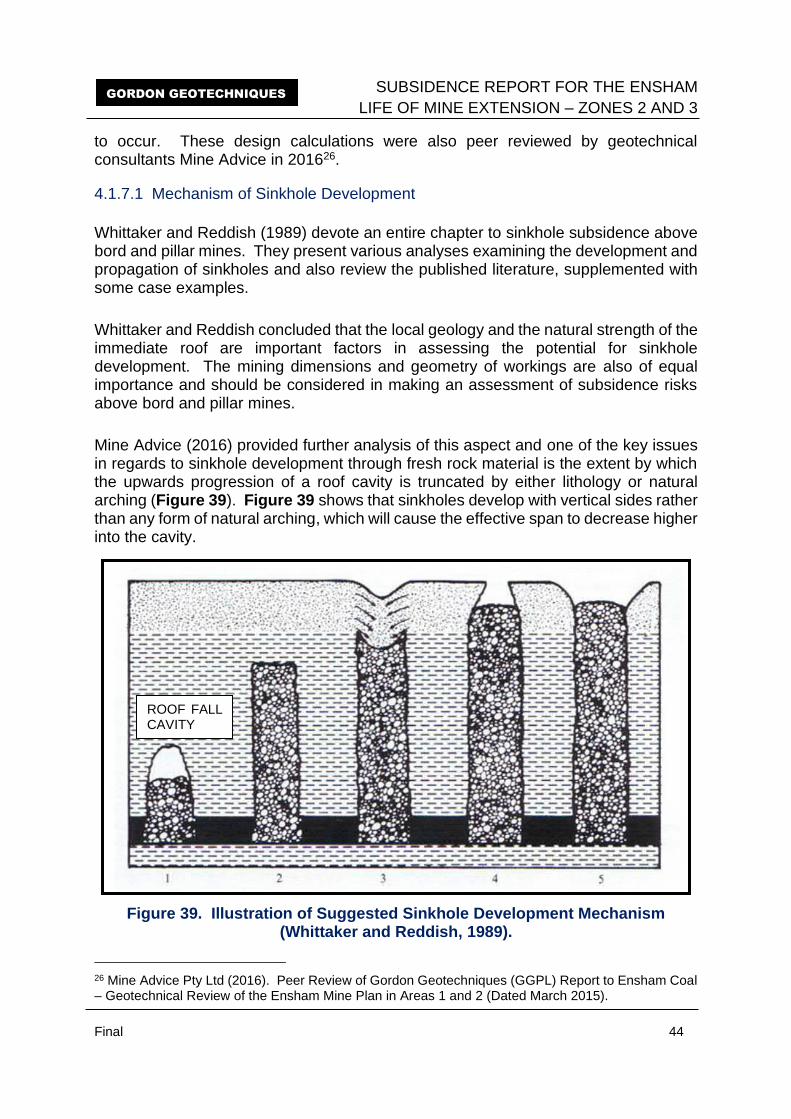
SUBSIDENCE REPORT FOR THE ENSHAM
LIFE OF MINE EXTENSION – ZONES 2 AND 3
Final 44
GORDON GEOTECHNIQUES
to occur. These design calculations were also peer reviewed by geotechnical consultants Mine Advice in 201626.
4.1.7.1 Mechanism of Sinkhole Development
Whittaker and Reddish (1989) devote an entire chapter to sinkhole subsidence above bord and pillar mines. They present various analyses examining the development and propagation of sinkholes and also review the published literature, supplemented with some case examples.
Whittaker and Reddish concluded that the local geology and the natural strength of the immediate roof are important factors in assessing the potential for sinkhole development. The mining dimensions and geometry of workings are also of equal importance and should be considered in making an assessment of subsidence risks above bord and pillar mines.
Mine Advice (2016) provided further analysis of this aspect and one of the key issues in regards to sinkhole development through fresh rock material is the extent by which the upwards progression of a roof cavity is truncated by either lithology or natural arching (Figure 39). Figure 39 shows that sinkholes develop with vertical sides rather than any form of natural arching, which will cause the effective span to decrease higher into the cavity.
Figure 39. Illustration of Suggested Sinkhole Development Mechanism (Whittaker and Reddish, 1989).
26 Mine Advice Pty Ltd (2016). Peer Review of Gordon Geotechniques (GGPL) Report to Ensham Coal – Geotechnical Review of the Ensham Mine Plan in Areas 1 and 2 (Dated March 2015).
ROOF FALL CAVITY

SUBSIDENCE REPORT FOR THE ENSHAM
LIFE OF MINE EXTENSION – ZONES 2 AND 3
Final 45
GORDON GEOTECHNIQUES
As discussed by Mine Advice, this failure mechanism is commonly observed in underground coal mines and along with roof lithology acts to restrict the height of roadway roof fall cavities to typically only a few metres rather than propagating higher as shown in Figure 39. This is consistent with observations in the current Ensham underground workings.
4.1.7.2 Analysis of Sinkhole Subsidence
The risk of sinkhole subsidence of shallow workings to the surface has been assessed using a limiting equilibrium analysis as detailed below. The analysis is presented in Brady and Brown (200627) as follows:
For dry conditions:
F1 = 2c’(a + b cosα) + ktanф’ * {h2 + (h-bsinα)2 + 2[h(h – bsinα) + b2sin2α]}
υabcosα (2h – bsinα) bcosα a 3
For saturated conditions:
F = F1 - 2υwtanф’ * {h2 + (h-bsinα)2 - 2d(2h – bsinα -d) +
3υ(2h-bsinα) bcosα
2 [3h(h – bsinα) + b2sin2α – 3d(2h – bsinα –d)]}
3a
where: F, F1 = factor of safety
c’ = cohesion in kPa
ф’ = friction angle in degrees
a = intersection width 1 (metres)
b = intersection width 2 (metres)
k = average of the horizontal to vertical stresses
α = seam dip in degrees
υ = rock density in kN/m3
υw = water density in kN/m3
d = water table depth (metres)
h = thickness of fresh rock (metres)
For the Ensham mining area, cohesion (c’) and friction angle (ф’) values of 0 kPa and 30o have been used respectively, assuming the failure mode is along joints, with some surface roughness. The roadway width is 6.5 m and the seam dip 3o.
27 Brady, B.H.G. and Brown, E.T. (2006) Rock Mechanics in Underground Mining. 3rd Edition.
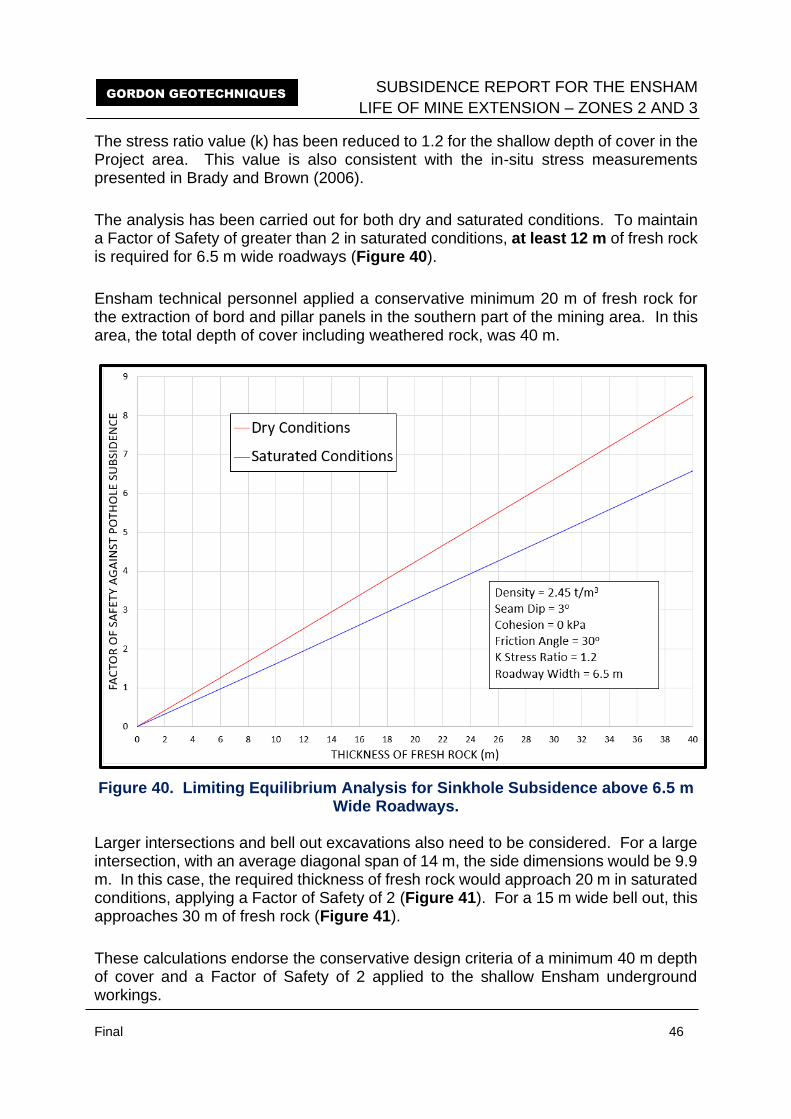
SUBSIDENCE REPORT FOR THE ENSHAM
LIFE OF MINE EXTENSION – ZONES 2 AND 3
Final 46
GORDON GEOTECHNIQUES
The stress ratio value (k) has been reduced to 1.2 for the shallow depth of cover in the Project area. This value is also consistent with the in-situ stress measurements presented in Brady and Brown (2006).
The analysis has been carried out for both dry and saturated conditions. To maintain a Factor of Safety of greater than 2 in saturated conditions, at least 12 m of fresh rock is required for 6.5 m wide roadways (Figure 40).
Ensham technical personnel applied a conservative minimum 20 m of fresh rock for the extraction of bord and pillar panels in the southern part of the mining area. In this area, the total depth of cover including weathered rock, was 40 m.
Figure 40. Limiting Equilibrium Analysis for Sinkhole Subsidence above 6.5 m Wide Roadways.
Larger intersections and bell out excavations also need to be considered. For a large intersection, with an average diagonal span of 14 m, the side dimensions would be 9.9 m. In this case, the required thickness of fresh rock would approach 20 m in saturated conditions, applying a Factor of Safety of 2 (Figure 41). For a 15 m wide bell out, this approaches 30 m of fresh rock (Figure 41).
These calculations endorse the conservative design criteria of a minimum 40 m depth of cover and a Factor of Safety of 2 applied to the shallow Ensham underground workings.
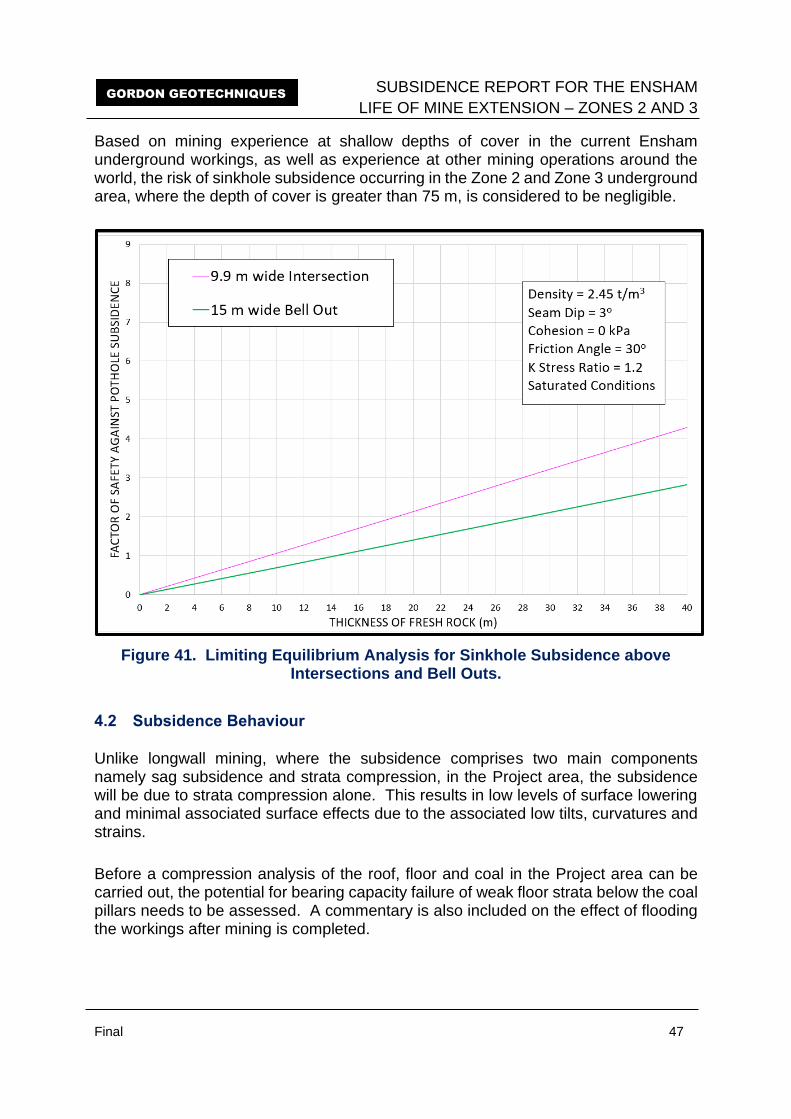
SUBSIDENCE REPORT FOR THE ENSHAM
LIFE OF MINE EXTENSION – ZONES 2 AND 3
Final 47
GORDON GEOTECHNIQUES
Based on mining experience at shallow depths of cover in the current Ensham underground workings, as well as experience at other mining operations around the world, the risk of sinkhole subsidence occurring in the Zone 2 and Zone 3 underground area, where the depth of cover is greater than 75 m, is considered to be negligible.
Figure 41. Limiting Equilibrium Analysis for Sinkhole Subsidence above Intersections and Bell Outs.
4.2 Subsidence Behaviour
Unlike longwall mining, where the subsidence comprises two main components namely sag subsidence and strata compression, in the Project area, the subsidence will be due to strata compression alone. This results in low levels of surface lowering and minimal associated surface effects due to the associated low tilts, curvatures and strains.
Before a compression analysis of the roof, floor and coal in the Project area can be carried out, the potential for bearing capacity failure of weak floor strata below the coal pillars needs to be assessed. A commentary is also included on the effect of flooding the workings after mining is completed.
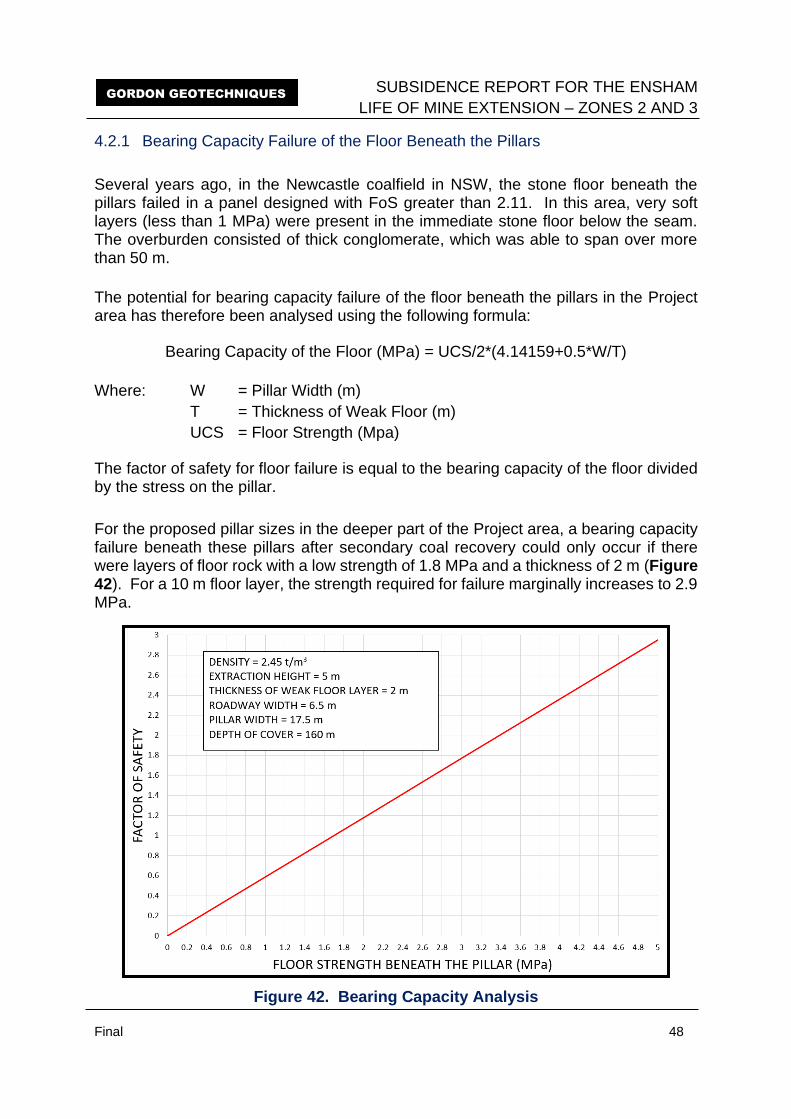
SUBSIDENCE REPORT FOR THE ENSHAM
LIFE OF MINE EXTENSION – ZONES 2 AND 3
Final 48
GORDON GEOTECHNIQUES
4.2.1 Bearing Capacity Failure of the Floor Beneath the Pillars
Several years ago, in the Newcastle coalfield in NSW, the stone floor beneath the pillars failed in a panel designed with FoS greater than 2.11. In this area, very soft layers (less than 1 MPa) were present in the immediate stone floor below the seam. The overburden consisted of thick conglomerate, which was able to span over more than 50 m.
The potential for bearing capacity failure of the floor beneath the pillars in the Project area has therefore been analysed using the following formula:
Bearing Capacity of the Floor (MPa) = UCS/2*(4.14159+0.5*W/T)
Where: W = Pillar Width (m)
T = Thickness of Weak Floor (m)
UCS = Floor Strength (Mpa)
The factor of safety for floor failure is equal to the bearing capacity of the floor divided by the stress on the pillar.
For the proposed pillar sizes in the deeper part of the Project area, a bearing capacity failure beneath these pillars after secondary coal recovery could only occur if there were layers of floor rock with a low strength of 1.8 MPa and a thickness of 2 m (Figure 42). For a 10 m floor layer, the strength required for failure marginally increases to 2.9 MPa.
Figure 42. Bearing Capacity Analysis
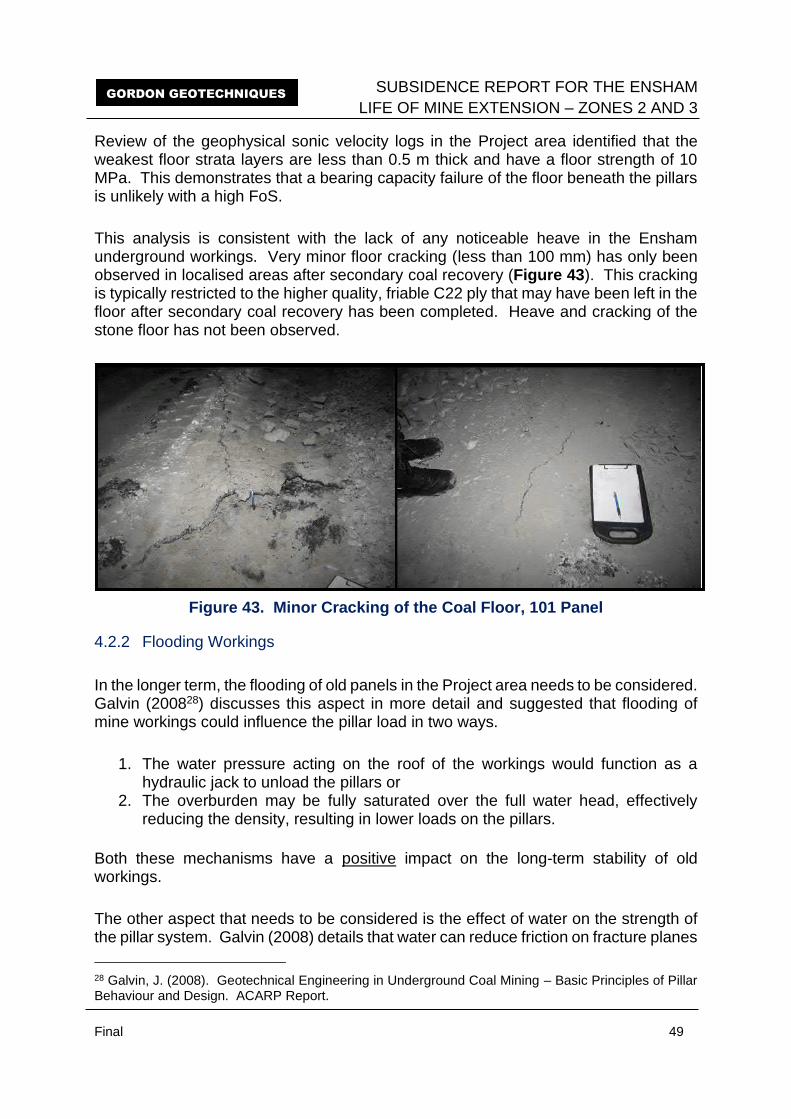
SUBSIDENCE REPORT FOR THE ENSHAM
LIFE OF MINE EXTENSION – ZONES 2 AND 3
Final 49
GORDON GEOTECHNIQUES
Review of the geophysical sonic velocity logs in the Project area identified that the weakest floor strata layers are less than 0.5 m thick and have a floor strength of 10 MPa. This demonstrates that a bearing capacity failure of the floor beneath the pillars is unlikely with a high FoS.
This analysis is consistent with the lack of any noticeable heave in the Ensham underground workings. Very minor floor cracking (less than 100 mm) has only been observed in localised areas after secondary coal recovery (Figure 43). This cracking is typically restricted to the higher quality, friable C22 ply that may have been left in the floor after secondary coal recovery has been completed. Heave and cracking of the stone floor has not been observed.
Figure 43. Minor Cracking of the Coal Floor, 101 Panel
4.2.2 Flooding Workings
In the longer term, the flooding of old panels in the Project area needs to be considered. Galvin (200828) discusses this aspect in more detail and suggested that flooding of mine workings could influence the pillar load in two ways.
1. The water pressure acting on the roof of the workings would function as a hydraulic jack to unload the pillars or
2. The overburden may be fully saturated over the full water head, effectively reducing the density, resulting in lower loads on the pillars.
Both these mechanisms have a positive impact on the long-term stability of old workings.
The other aspect that needs to be considered is the effect of water on the strength of the pillar system. Galvin (2008) details that water can reduce friction on fracture planes
28 Galvin, J. (2008). Geotechnical Engineering in Underground Coal Mining – Basic Principles of Pillar Behaviour and Design. ACARP Report.
SUBSIDENCE REPORT FOR THE ENSHAM
LIFE OF MINE EXTENSION – ZONES 2 AND 3
Final 50
GORDON GEOTECHNIQUES
and roof/floor interfaces. The water can also accelerate the degradation of clay rich minerals in the roof, floor and coal seam.
The buoyancy effect of water will reduce the vertical load on the pillars by up to 40% and hence increase the factor of safety. This effect is calculated using the formula:
Effective Stress on Pillar = Total stress on Pillar – Pore Pressure due to Flooding
The effective stress on the pillar is therefore 1.5 (2.5-1) or 60% (1.5/2.5) of the total stress. The extent of the increase in stability will depend on any strength loss in the coal and the surrounding strata, which may be up to 10-15%.
It should be highlighted that the coal seam and immediate roof and floor strata in the Project area do not contain puggy or water sensitive material that could degrade over time. Furthermore, failure of the floor due to transient strength reduction effects is unlikely as the groundwater recovers.
A conservative 25% reduction in load would significantly increase the FoS of 24 m x 28 m (centre) pillars at 5 m high and 130 m depth of cover, from 1.76 to 2.31.
There is a case of a pillar collapse in a flooded bord and pillar iron ore mine in France. Conversely, many of the mines in the Newcastle Coalfield of NSW have been flooded for years without adverse effect on stability.
Galvin cautions that careful consideration needs to be given to the possible adverse effects on stability by dewatering the workings, as there is a history of pillar collapses soon after being dewatered.
4.2.3 Strata Compression
The induced surface deformation due to strata compression has been estimated analytically by calculating the combined pillar, roof and floor compression using modulus values. This is discussed in the following sections.
4.2.3.1 Coal Strength Modulus
An in-situ modulus value of 2500 MPa has been used for the Aries-Castor and Castor Seams in the Project area, based on geotechnical testing of coal core samples recovered during exploration drilling at Ensham.
4.2.3.2 Strength of the Stone Roof and Stone Floor
For a 17.5 m wide pillar, the influence into the roof and floor is one pillar width. As such, the average strength of both the stone roof and stone floor above and below the

SUBSIDENCE REPORT FOR THE ENSHAM
LIFE OF MINE EXTENSION – ZONES 2 AND 3
Final 51
GORDON GEOTECHNIQUES
coal seam for this distance in the Project area has been determined from the geological model.
The average strength of these intervals typically ranges from 20 to 40 MPa (Figure 44 and Figure 45).
Figure 44. Average Strength for the Stone Roof 0 m to 17.5 m Interval
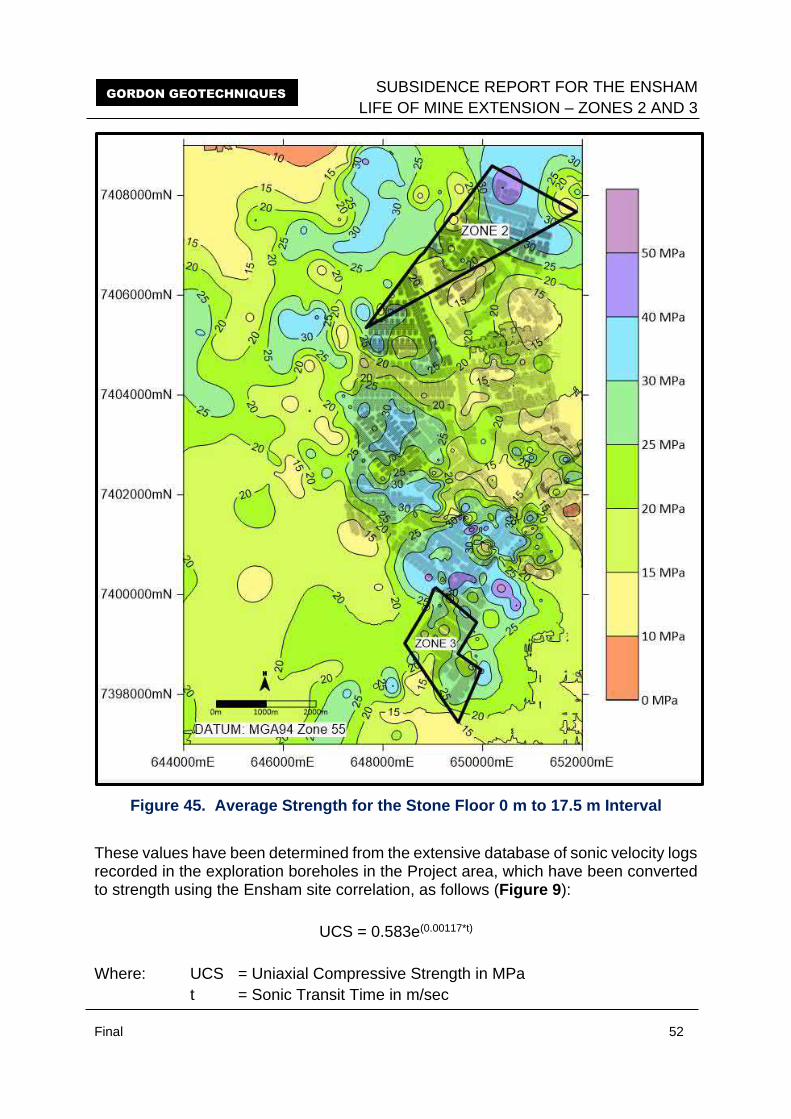
SUBSIDENCE REPORT FOR THE ENSHAM
LIFE OF MINE EXTENSION – ZONES 2 AND 3
Final 52
GORDON GEOTECHNIQUES
Figure 45. Average Strength for the Stone Floor 0 m to 17.5 m Interval
These values have been determined from the extensive database of sonic velocity logs recorded in the exploration boreholes in the Project area, which have been converted to strength using the Ensham site correlation, as follows (Figure 9):
UCS = 0.583e(0.00117*t)
Where: UCS = Uniaxial Compressive Strength in MPa
t = Sonic Transit Time in m/sec
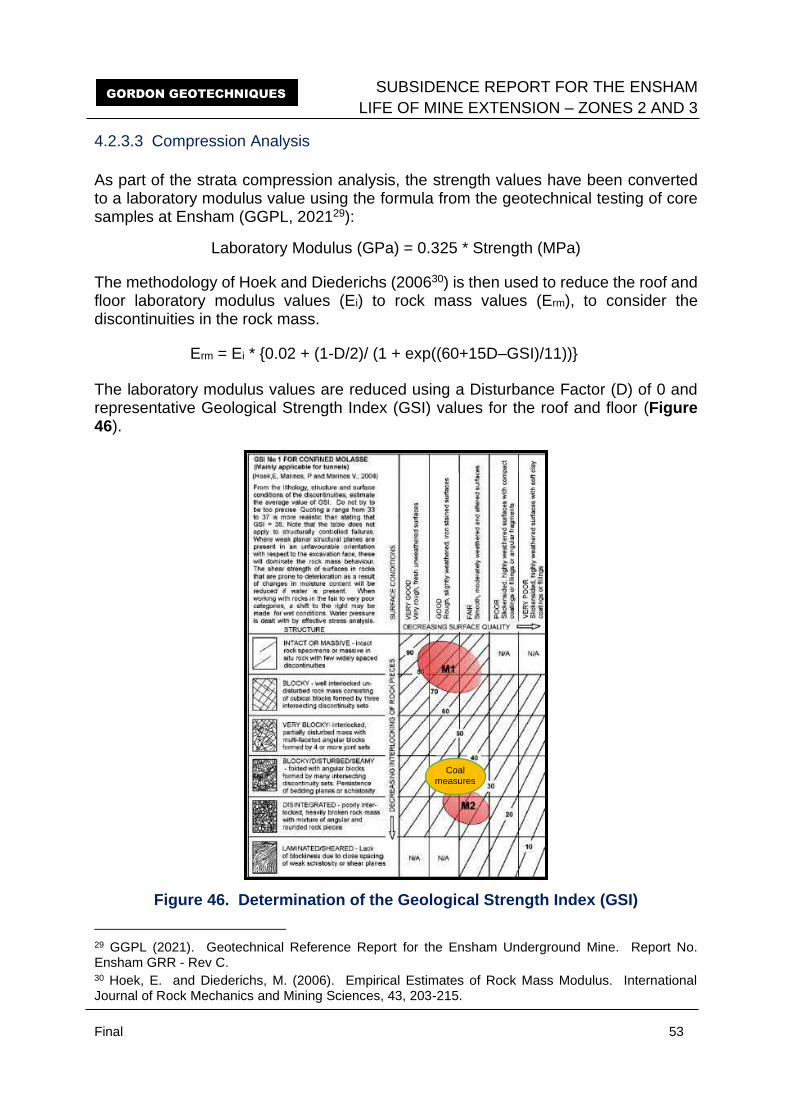
SUBSIDENCE REPORT FOR THE ENSHAM
LIFE OF MINE EXTENSION – ZONES 2 AND 3
Final 53
GORDON GEOTECHNIQUES
4.2.3.3 Compression Analysis
As part of the strata compression analysis, the strength values have been converted to a laboratory modulus value using the formula from the geotechnical testing of core samples at Ensham (GGPL, 202129):
Laboratory Modulus (GPa) = 0.325 * Strength (MPa)
The methodology of Hoek and Diederichs (200630) is then used to reduce the roof and floor laboratory modulus values (Ei) to rock mass values (Erm), to consider the discontinuities in the rock mass.
Erm = Ei * {0.02 + (1-D/2)/ (1 + exp((60+15D–GSI)/11))}
The laboratory modulus values are reduced using a Disturbance Factor (D) of 0 and representative Geological Strength Index (GSI) values for the roof and floor (Figure 46).
Figure 46. Determination of the Geological Strength Index (GSI)
29 GGPL (2021). Geotechnical Reference Report for the Ensham Underground Mine. Report No. Ensham GRR - Rev C. 30 Hoek, E. and Diederichs, M. (2006). Empirical Estimates of Rock Mass Modulus. International Journal of Rock Mechanics and Mining Sciences, 43, 203-215.
Coal measures
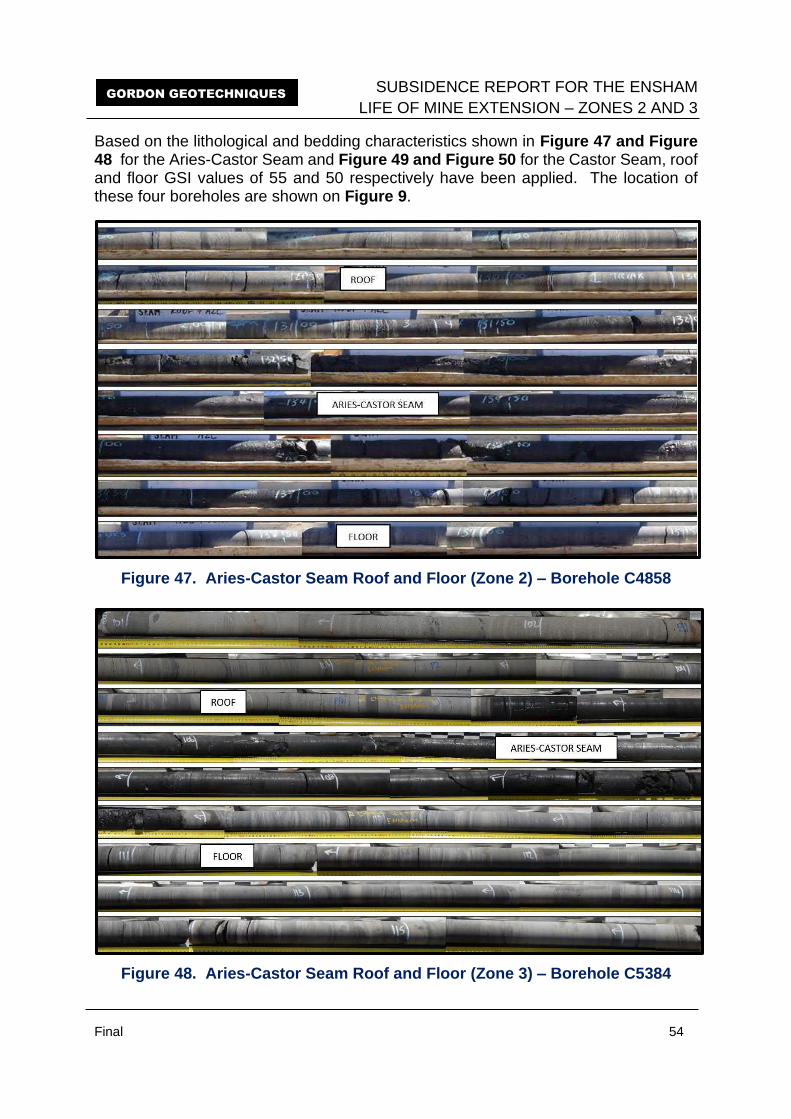
SUBSIDENCE REPORT FOR THE ENSHAM
LIFE OF MINE EXTENSION – ZONES 2 AND 3
Final 54
GORDON GEOTECHNIQUES
Based on the lithological and bedding characteristics shown in Figure 47 and Figure 48 for the Aries-Castor Seam and Figure 49 and Figure 50 for the Castor Seam, roof and floor GSI values of 55 and 50 respectively have been applied. The location of these four boreholes are shown on Figure 9.
Figure 47. Aries-Castor Seam Roof and Floor (Zone 2) – Borehole C4858
Figure 48. Aries-Castor Seam Roof and Floor (Zone 3) – Borehole C5384
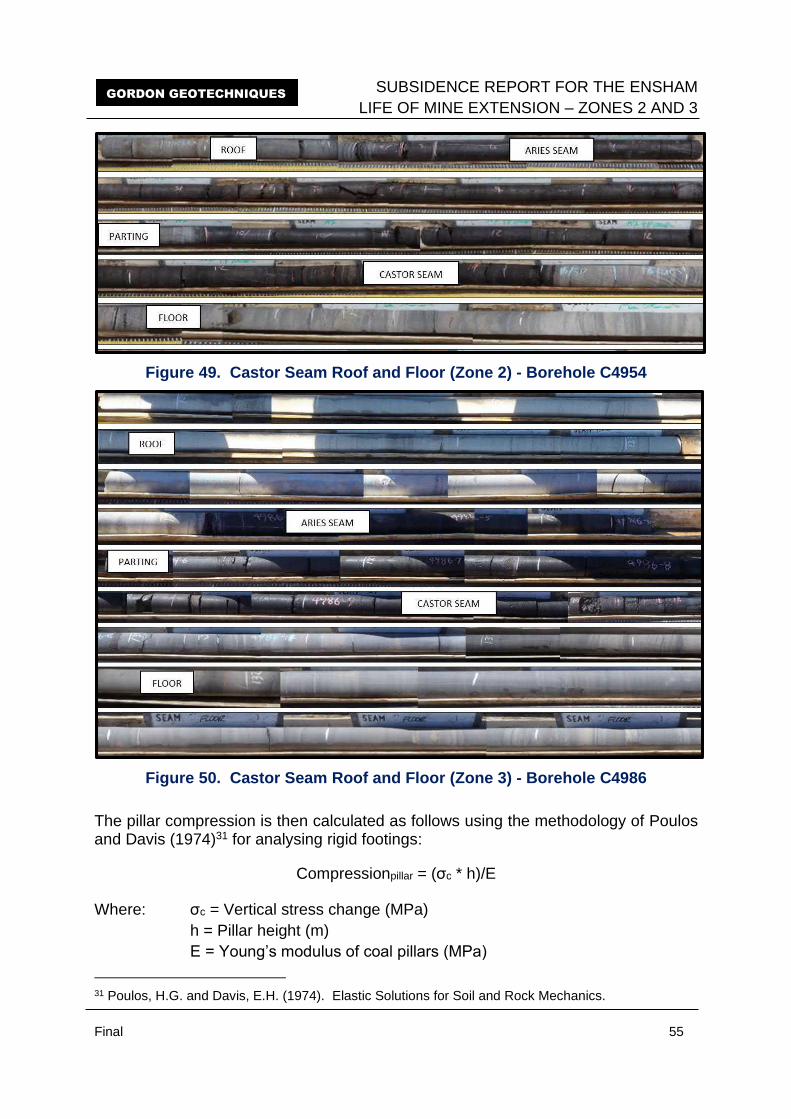
SUBSIDENCE REPORT FOR THE ENSHAM
LIFE OF MINE EXTENSION – ZONES 2 AND 3
Final 55
GORDON GEOTECHNIQUES
Figure 49. Castor Seam Roof and Floor (Zone 2) - Borehole C4954
Figure 50. Castor Seam Roof and Floor (Zone 3) - Borehole C4986
The pillar compression is then calculated as follows using the methodology of Poulos and Davis (1974)31 for analysing rigid footings:
Compressionpillar = (σc * h)/E
Where: σc = Vertical stress change (MPa)
h = Pillar height (m)
E = Young’s modulus of coal pillars (MPa)
31 Poulos, H.G. and Davis, E.H. (1974). Elastic Solutions for Soil and Rock Mechanics.
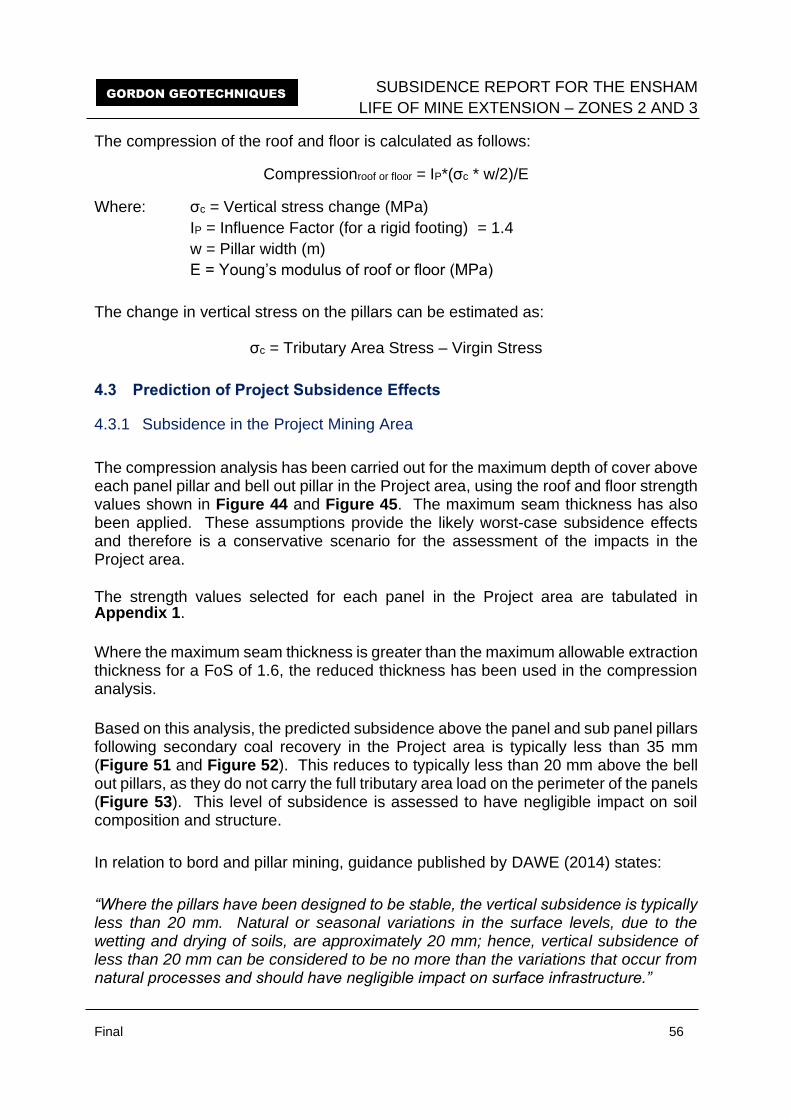
SUBSIDENCE REPORT FOR THE ENSHAM
LIFE OF MINE EXTENSION – ZONES 2 AND 3
Final 56
GORDON GEOTECHNIQUES
The compression of the roof and floor is calculated as follows:
Compressionroof or floor = IP*(σc * w/2)/E
Where: σc = Vertical stress change (MPa)
IP = Influence Factor (for a rigid footing) = 1.4
w = Pillar width (m)
E = Young’s modulus of roof or floor (MPa)
The change in vertical stress on the pillars can be estimated as:
σc = Tributary Area Stress – Virgin Stress
4.3 Prediction of Project Subsidence Effects
4.3.1 Subsidence in the Project Mining Area
The compression analysis has been carried out for the maximum depth of cover above each panel pillar and bell out pillar in the Project area, using the roof and floor strength values shown in Figure 44 and Figure 45. The maximum seam thickness has also been applied. These assumptions provide the likely worst-case subsidence effects and therefore is a conservative scenario for the assessment of the impacts in the Project area. The strength values selected for each panel in the Project area are tabulated in Appendix 1.
Where the maximum seam thickness is greater than the maximum allowable extraction thickness for a FoS of 1.6, the reduced thickness has been used in the compression analysis.
Based on this analysis, the predicted subsidence above the panel and sub panel pillars following secondary coal recovery in the Project area is typically less than 35 mm (Figure 51 and Figure 52). This reduces to typically less than 20 mm above the bell out pillars, as they do not carry the full tributary area load on the perimeter of the panels (Figure 53). This level of subsidence is assessed to have negligible impact on soil composition and structure.
In relation to bord and pillar mining, guidance published by DAWE (2014) states:
“Where the pillars have been designed to be stable, the vertical subsidence is typically less than 20 mm. Natural or seasonal variations in the surface levels, due to the wetting and drying of soils, are approximately 20 mm; hence, vertical subsidence of less than 20 mm can be considered to be no more than the variations that occur from natural processes and should have negligible impact on surface infrastructure.”
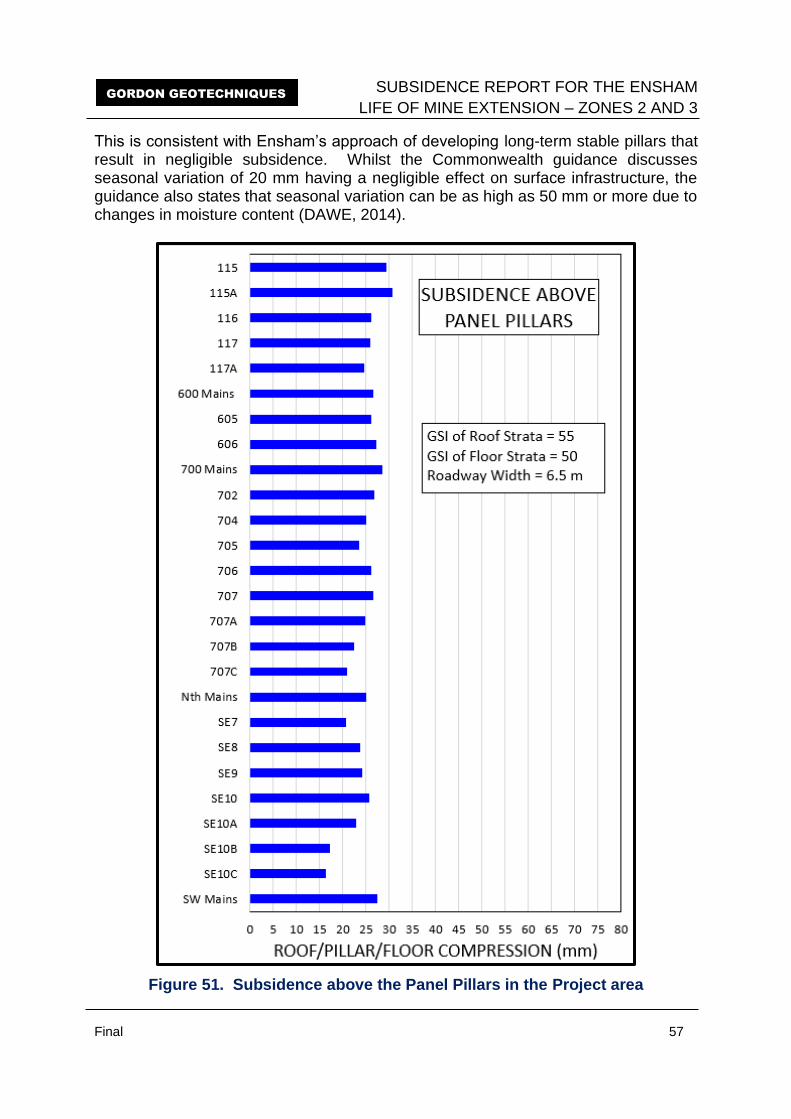
SUBSIDENCE REPORT FOR THE ENSHAM
LIFE OF MINE EXTENSION – ZONES 2 AND 3
Final 57
GORDON GEOTECHNIQUES
This is consistent with Ensham’s approach of developing long-term stable pillars that result in negligible subsidence. Whilst the Commonwealth guidance discusses seasonal variation of 20 mm having a negligible effect on surface infrastructure, the guidance also states that seasonal variation can be as high as 50 mm or more due to changes in moisture content (DAWE, 2014).
Figure 51. Subsidence above the Panel Pillars in the Project area
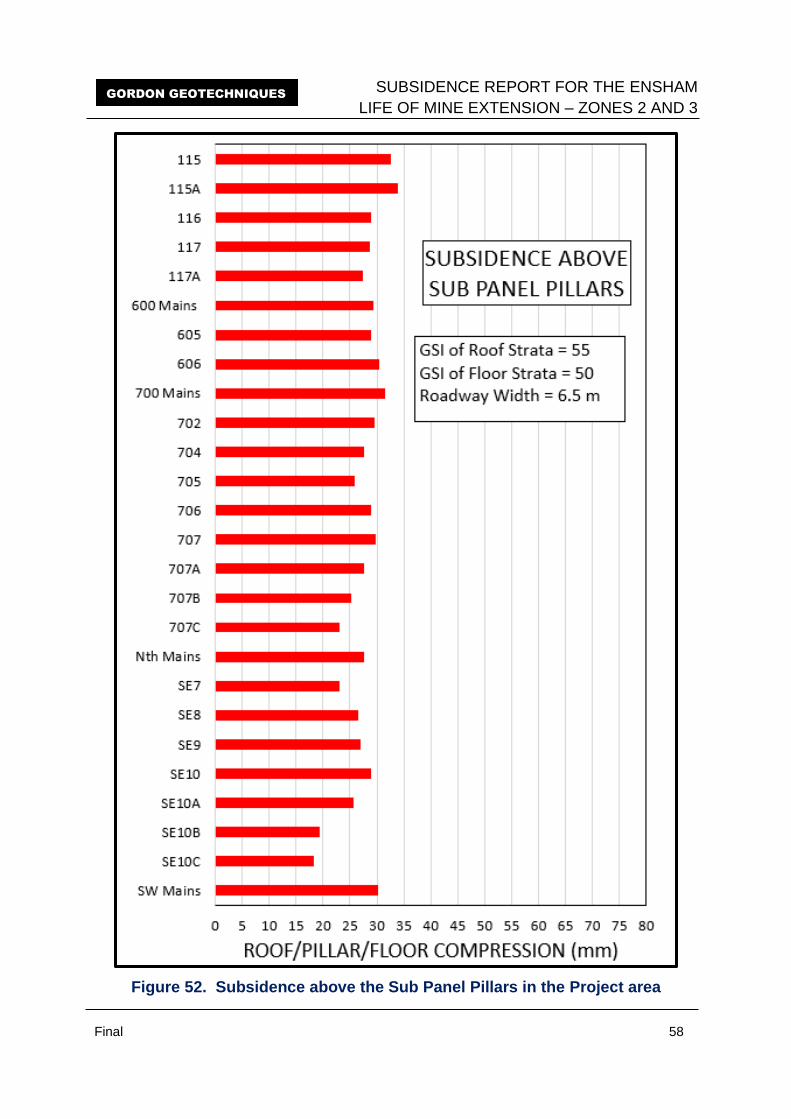
SUBSIDENCE REPORT FOR THE ENSHAM
LIFE OF MINE EXTENSION – ZONES 2 AND 3
Final 58
GORDON GEOTECHNIQUES
Figure 52. Subsidence above the Sub Panel Pillars in the Project area
SUBSIDENCE REPORT FOR THE ENSHAM
LIFE OF MINE EXTENSION – ZONES 2 AND 3
Final 59
GORDON GEOTECHNIQUES
Figure 53. Subsidence above the Bell Out Pillars in the Project area
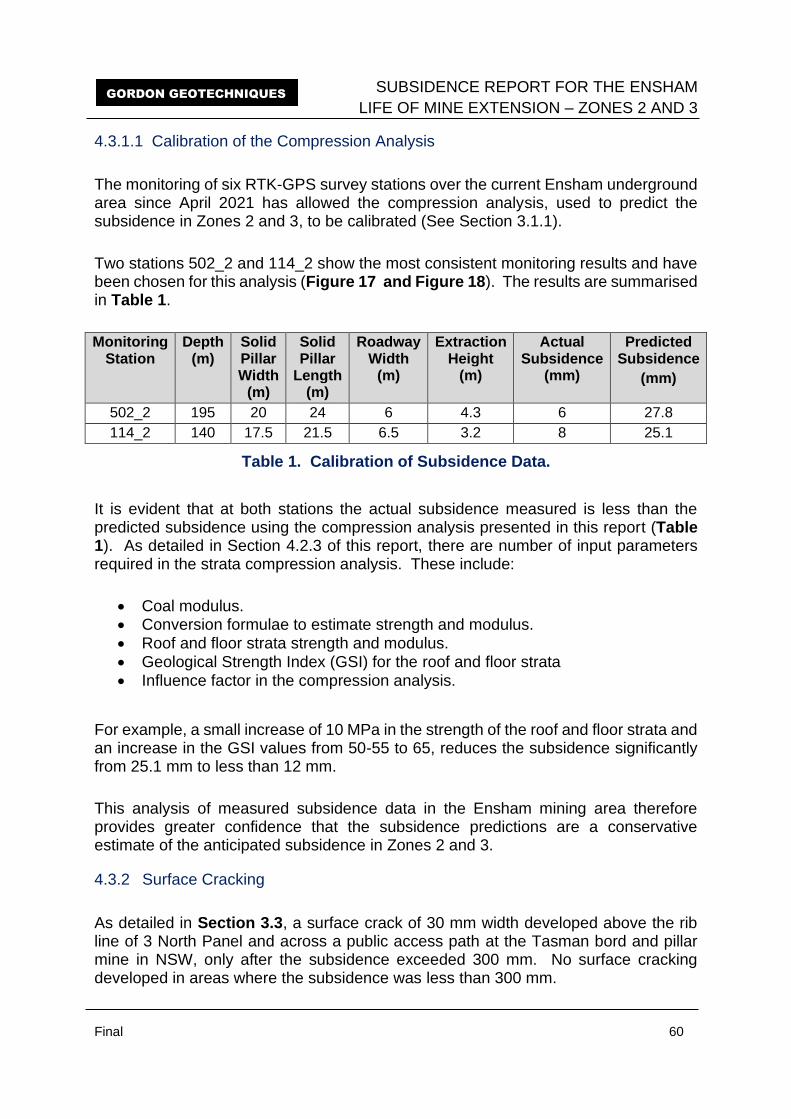
SUBSIDENCE REPORT FOR THE ENSHAM
LIFE OF MINE EXTENSION – ZONES 2 AND 3
Final 60
GORDON GEOTECHNIQUES
4.3.1.1 Calibration of the Compression Analysis
The monitoring of six RTK-GPS survey stations over the current Ensham underground area since April 2021 has allowed the compression analysis, used to predict the subsidence in Zones 2 and 3, to be calibrated (See Section 3.1.1).
Two stations 502_2 and 114_2 show the most consistent monitoring results and have been chosen for this analysis (Figure 17 and Figure 18). The results are summarised in Table 1.
Monitoring Station
Depth (m)
Solid Pillar Width
(m)
Solid Pillar
Length (m)
Roadway Width
(m)
Extraction Height
(m)
Actual Subsidence
(mm)
Predicted Subsidence
(mm)
502_2 195 20 24 6 4.3 6 27.8
114_2 140 17.5 21.5 6.5 3.2 8 25.1
Table 1. Calibration of Subsidence Data.
It is evident that at both stations the actual subsidence measured is less than the predicted subsidence using the compression analysis presented in this report (Table 1). As detailed in Section 4.2.3 of this report, there are number of input parameters required in the strata compression analysis. These include:
• Coal modulus. • Conversion formulae to estimate strength and modulus. • Roof and floor strata strength and modulus. • Geological Strength Index (GSI) for the roof and floor strata • Influence factor in the compression analysis.
For example, a small increase of 10 MPa in the strength of the roof and floor strata and an increase in the GSI values from 50-55 to 65, reduces the subsidence significantly from 25.1 mm to less than 12 mm.
This analysis of measured subsidence data in the Ensham mining area therefore provides greater confidence that the subsidence predictions are a conservative estimate of the anticipated subsidence in Zones 2 and 3.
4.3.2 Surface Cracking
As detailed in Section 3.3, a surface crack of 30 mm width developed above the rib line of 3 North Panel and across a public access path at the Tasman bord and pillar mine in NSW, only after the subsidence exceeded 300 mm. No surface cracking developed in areas where the subsidence was less than 300 mm.
SUBSIDENCE REPORT FOR THE ENSHAM
LIFE OF MINE EXTENSION – ZONES 2 AND 3
Final 61
GORDON GEOTECHNIQUES
Based on this observation from NSW, and GGPL’s experience at comparable Queensland bord and pillar mines, surface cracking is not predicted above the Project area due to the predicted low levels of maximum surface subsidence of less than 35 mm.
4.3.3 Sub-surface Cracking
The nature of the proposed mining method in the Project area indicates that the surface subsidence will be due to elastic compression of the strata (Section 4.2.3). The mining activities do not create areas of caving, which could result in fracturing of the overburden.
This is confirmed by experience in NSW at Clarence Mine, which uses partial extraction bord and pillar methods at the north western edge of the Blue Mountains Heritage Area (Section 3.2). As detailed by Hill and White (2017), there have been no exceedances of the 100 mm subsidence limit and interaction with the overlying perched groundwater system since partial extraction started in 2003.
4.3.4 Limitations of the Subsidence Predictions
Based on the available data for the Project area, there are no localised features or variations in the geology, geotechnical conditions or surface topography that are considered likely to result in any significant deviations from the subsidence predictions presented in this report.
There is a high degree of confidence in the subsidence predictions due to the amount of information from the existing bord and pillar mining at Ensham with similar mining heights, depth of cover and mining methodology. This information has allowed a robust calibration to be achieved and provided a sound basis to enable conservative subsidence predictions.
SUBSIDENCE REPORT FOR THE ENSHAM
LIFE OF MINE EXTENSION – ZONES 2 AND 3
Final 62
GORDON GEOTECHNIQUES
5 CONCLUSIONS The key conclusions from this report include:
1. Due to the nature of the bord and pillar mining method, low levels of subsidence, typically less than 35 mm, are predicted in the Project area as a result of elastic compression of the strata. Recent RTK-GPS monitoring at Ensham indicates subsidence levels of less than 10 mm above mined underground panels and confirms this prediction for the Project.
2. The magnitude of the predicted subsidence is less than the natural ground movements of up to 50 mm or more that can occur (DAWE, 2014 and 2015).
3. The subsidence assessment is based on the Project design Factor of Safety (FoS) and width: height ratios of the pillars, as well as the estimated critical level of overburden displacement. This assessment, using a minimum pillar FoS of 1.6 for areas beneath the floodplain, and 2.11 for access roadways beneath the Nogoa River to connect bord and pillar workings, and, for bord and pillar workings beneath the Nogoa River anabranch, has confirmed the long-term stability of the proposed mine layout.
4. The temporary increase in cover depth during 0.1% AEP (Q1000) flood events has been calculated below both the flood plain and Nogoa River and anabranch channels. Conservative maximum flood depth values of 16 m in the Nogoa River channel and 4 m across the flood plain have been used in the FoS calculations. The temporary increase in depth has been applied to the design figures to calculate the required mining height to satisfy the Project FoS during 0.1% AEP flood events.
5. The design criteria used to ensure long-term stability of the pillars has been peer reviewed by three industry recognised (RPEQ) geotechnical consultants Mine Advice (Dr Russell Frith), Byrnes Geotechnical (Dr Ross Seedsman), and BK Hebblewhite Consulting (Emeritus Professor Bruce Hebblewhite), who all concluded that the proposed bord and pillar layout is an appropriate and well developed geotechnical design.
6. As well as the factor of safety approach, the long-term life expectancy of pillars can be estimated using empirical studies from South Africa. Using this approach, the proposed 24 m x 28 m (centres) pillars in Zones 2 and 3 at 4.5 m high and 130 m depth of cover, are calculated to be stable for greater than 26,000 years.
7. After mining is completed and the workings flood with groundwater, the buoyancy effect of water will reduce the vertical load on the pillars by up to 40%. For a pillar below the Nogoa River anabranch designed with a FoS of 2.11, at 140 m depth of cover, reducing the vertical load on the pillar by a conservative
SUBSIDENCE REPORT FOR THE ENSHAM
LIFE OF MINE EXTENSION – ZONES 2 AND 3
Final 63
GORDON GEOTECHNIQUES
25%, to account for any potential strength loss in the coal and surrounding strata, increases the FoS to 2.82. This FoS has a probability of failure well in excess of 1 in 10,000,000.
8. The nature of the mining method generating only elastic compression of the strata indicates that sub-surface cracking above the Project area is not expected.
9. Due to the predicted low levels of subsidence and associated strains and tilts, no surface cracking is predicted above the Project area. This is consistent with operational experience in the current Ensham underground where surface cracking has not been observed above the bord and pillar mining areas and is supported by experience at other comparable bord and pillar mines in Queensland and NSW.
10. The expected low levels of subsidence are unlikely to result in the formation of significant depressions in the surface topography where ponding of the surface drainage may occur. This is also consistent with operational experience in NSW and Queensland where ponding has not been observed above previous similar bord and pillar mining areas.
11. Based on mining experience at shallow depths of cover in the current Ensham underground workings, as well as experience at other mining operations around the world, the risk of sinkhole subsidence occurring in the Project area, where the depth of cover is greater than 75 m, is considered to be negligible.
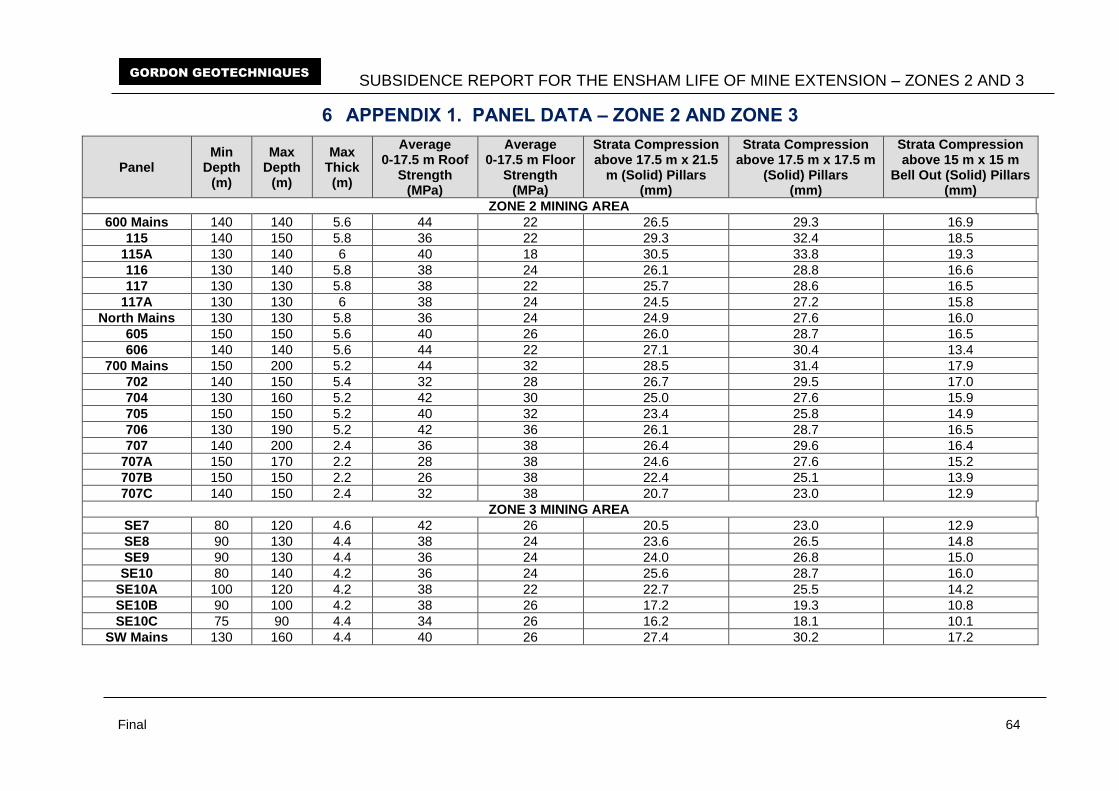
SUBSIDENCE REPORT FOR THE ENSHAM LIFE OF MINE EXTENSION – ZONES 2 AND 3
Final 64
GORDON GEOTECHNIQUES
6 APPENDIX 1. PANEL DATA – ZONE 2 AND ZONE 3
Panel Min
Depth (m)
Max Depth
(m)
Max Thick (m)
Average 0-17.5 m Roof
Strength (MPa)
Average 0-17.5 m Floor
Strength (MPa)
Strata Compression above 17.5 m x 21.5
m (Solid) Pillars (mm)
Strata Compression above 17.5 m x 17.5 m
(Solid) Pillars (mm)
Strata Compression above 15 m x 15 m
Bell Out (Solid) Pillars (mm)
ZONE 2 MINING AREA
600 Mains 140 140 5.6 44 22 26.5 29.3 16.9
115 140 150 5.8 36 22 29.3 32.4 18.5
115A 130 140 6 40 18 30.5 33.8 19.3
116 130 140 5.8 38 24 26.1 28.8 16.6
117 130 130 5.8 38 22 25.7 28.6 16.5
117A 130 130 6 38 24 24.5 27.2 15.8
North Mains 130 130 5.8 36 24 24.9 27.6 16.0
605 150 150 5.6 40 26 26.0 28.7 16.5
606 140 140 5.6 44 22 27.1 30.4 13.4
700 Mains 150 200 5.2 44 32 28.5 31.4 17.9
702 140 150 5.4 32 28 26.7 29.5 17.0
704 130 160 5.2 42 30 25.0 27.6 15.9
705 150 150 5.2 40 32 23.4 25.8 14.9
706 130 190 5.2 42 36 26.1 28.7 16.5
707 140 200 2.4 36 38 26.4 29.6 16.4
707A 150 170 2.2 28 38 24.6 27.6 15.2
707B 150 150 2.2 26 38 22.4 25.1 13.9
707C 140 150 2.4 32 38 20.7 23.0 12.9
ZONE 3 MINING AREA
SE7 80 120 4.6 42 26 20.5 23.0 12.9
SE8 90 130 4.4 38 24 23.6 26.5 14.8
SE9 90 130 4.4 36 24 24.0 26.8 15.0
SE10 80 140 4.2 36 24 25.6 28.7 16.0
SE10A 100 120 4.2 38 22 22.7 25.5 14.2
SE10B 90 100 4.2 38 26 17.2 19.3 10.8
SE10C 75 90 4.4 34 26 16.2 18.1 10.1
SW Mains 130 160 4.4 40 26 27.4 30.2 17.2

L\343884466.1
APPENDIX ESubsidence Management Plan
ENV
IRO
NM
ENTA
L M
AN
AG
EMEN
T SY
STEM
EIMP.06.00.06 SUBSIDENCE MANAGEMENT
PLAN ENVIRONMENTAL IMPACT MANAGEMENT
PLAN (EIMP)
EIMP. SUBSIDENCE MANAGEMENT PLAN
Document Uncontrolled when Printed. Refer to SHMS Intranet for Controlled Version. Page 2 of
35
Contents
Introduction ........................................................................................................................ 5
Scope .......................................................................................................................... 5
Ensham Mine Overview ...................................................................................................... 7
Mining Activities ......................................................................................................... 7
Topography and Drainage .......................................................................................... 7
Soils ............................................................................................................................. 7
Geology ..................................................................................................................... 12
Groundwater Regime ............................................................................................... 13
Land Use ................................................................................................................... 13
Predicted Subsidence ....................................................................................................... 15
Introduction .............................................................................................................. 15
Pillar Design .............................................................................................................. 15
Compression Analysis ............................................................................................... 16
Predicted Subsidence ............................................................................................... 17
Surface and Subsurface Cracking ............................................................................. 17
Subsidence Impacts .................................................................................................. 18
Subsidence Monitoring ..................................................................................................... 18
LIDAR Monitoring ..................................................................................................... 18
Real Time Monitoring ............................................................................................... 21
Monitoring Surveys .................................................................................................. 23
Underground Surveying ............................................................................................ 28
Surface Inspections ................................................................................................... 28
Groundwater Monitoring ......................................................................................... 28
Monitoring Schedule and Trigger Levels .................................................................. 30
Subsidence Management Measures ........................................................................ 30
Emergency Procedures ............................................................................................. 32
Legal Compliance and References .................................................................................... 33
Terms and Abbreviations .................................................................................................. 33
EIMP. SUBSIDENCE MANAGEMENT PLAN
Document Uncontrolled when Printed. Refer to SHMS Intranet for Controlled Version. Page 3 of
35
Abbreviation and Description ................................................................................... 33
Document Preparation ..................................................................................................... 34
Review History .................................................................................................................. 34
Roles and Responsibilities ................................................................................................ 34
Figures
Figure 1-1. Existing Operations and Proposed Mining Plan For Zones 2 And 3 ........................ 6
Figure 2-1. Surface Topography and drainage. ......................................................................... 8
Figure 2-2. Soil Types (Desktop And Field Mapping). ................................................................ 9
Figure 2-3. Conceptual Hydrogeological Model Cross Section (EIS Submission, 2021). ......... 13
Figure 2-4. Land Uses at Ensham Mine (2021) ........................................................................ 14
Figure 3-1. Maximum Mining Height for a FoS of 1.6. ............................................................ 16
Figure 4-1. LIDAR transect across an area of unmined Vertosol soil....................................... 19
Figure 4-2. LIDAR transect along an area of 502 panel with Vertosol soil mined during 2021
.................................................................................................................................................. 19
Figure 4-3. LIDAR transect along an area of 114 panel mined during 2021 ............................ 20
Figure 4-4. Expanded LIDAR transect along an area of 114 panel mined during 2021. .......... 21
Figure 4-5. Fixed Monitoring Station. ...................................................................................... 22
Figure 4-6. Location of Remote Subsidence Monitoring – Ensham Underground Area. ........ 23
Figure 4-7. Monitoring Data – 502_3 And 503_1 Stations. ..................................................... 24
Figure 4-8. Monitoring Data – 502_1 And 502_2 Stations. ..................................................... 25
Figure 4-9. Monitoring Data – 114 Panel Stations................................................................... 26
Figure 4-10. Groundwater Monitoring Bores. ......................................................................... 29
Tables
Table 2-1. Terrain Units and Soil Types. .................................................................................. 10
Table 2-2. Stratigraphy. ........................................................................................................... 12
Table 4-1. Monitoring Schedule. ............................................................................................. 30
Table 5-1. References. ............................................................................................................. 33
Table 6-1. Terms. ..................................................................................................................... 33
Table 8-1. Review History. ....................................................................................................... 34
EIMP. SUBSIDENCE MANAGEMENT PLAN
Document Uncontrolled when Printed. Refer to SHMS Intranet for Controlled Version. Page 4 of
35
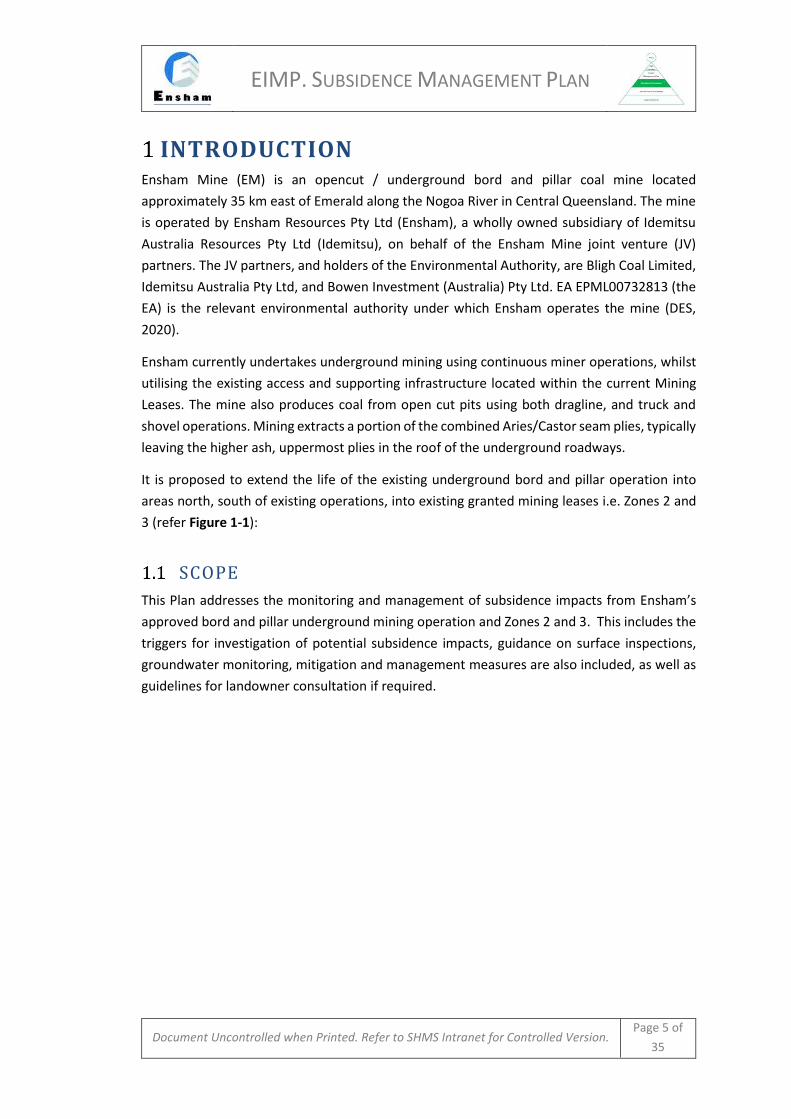
EIMP. SUBSIDENCE MANAGEMENT PLAN
Document Uncontrolled when Printed. Refer to SHMS Intranet for Controlled Version. Page 5 of
35
INTRODUCTION Ensham Mine (EM) is an opencut / underground bord and pillar coal mine located
approximately 35 km east of Emerald along the Nogoa River in Central Queensland. The mine
is operated by Ensham Resources Pty Ltd (Ensham), a wholly owned subsidiary of Idemitsu
Australia Resources Pty Ltd (Idemitsu), on behalf of the Ensham Mine joint venture (JV)
partners. The JV partners, and holders of the Environmental Authority, are Bligh Coal Limited,
Idemitsu Australia Pty Ltd, and Bowen Investment (Australia) Pty Ltd. EA EPML00732813 (the
EA) is the relevant environmental authority under which Ensham operates the mine (DES,
2020).
Ensham currently undertakes underground mining using continuous miner operations, whilst
utilising the existing access and supporting infrastructure located within the current Mining
Leases. The mine also produces coal from open cut pits using both dragline, and truck and
shovel operations. Mining extracts a portion of the combined Aries/Castor seam plies, typically
leaving the higher ash, uppermost plies in the roof of the underground roadways.
It is proposed to extend the life of the existing underground bord and pillar operation into
areas north, south of existing operations, into existing granted mining leases i.e. Zones 2 and
3 (refer Figure 1-1):
SCOPE
This Plan addresses the monitoring and management of subsidence impacts from Ensham’s
approved bord and pillar underground mining operation and Zones 2 and 3. This includes the
triggers for investigation of potential subsidence impacts, guidance on surface inspections,
groundwater monitoring, mitigation and management measures are also included, as well as
guidelines for landowner consultation if required.
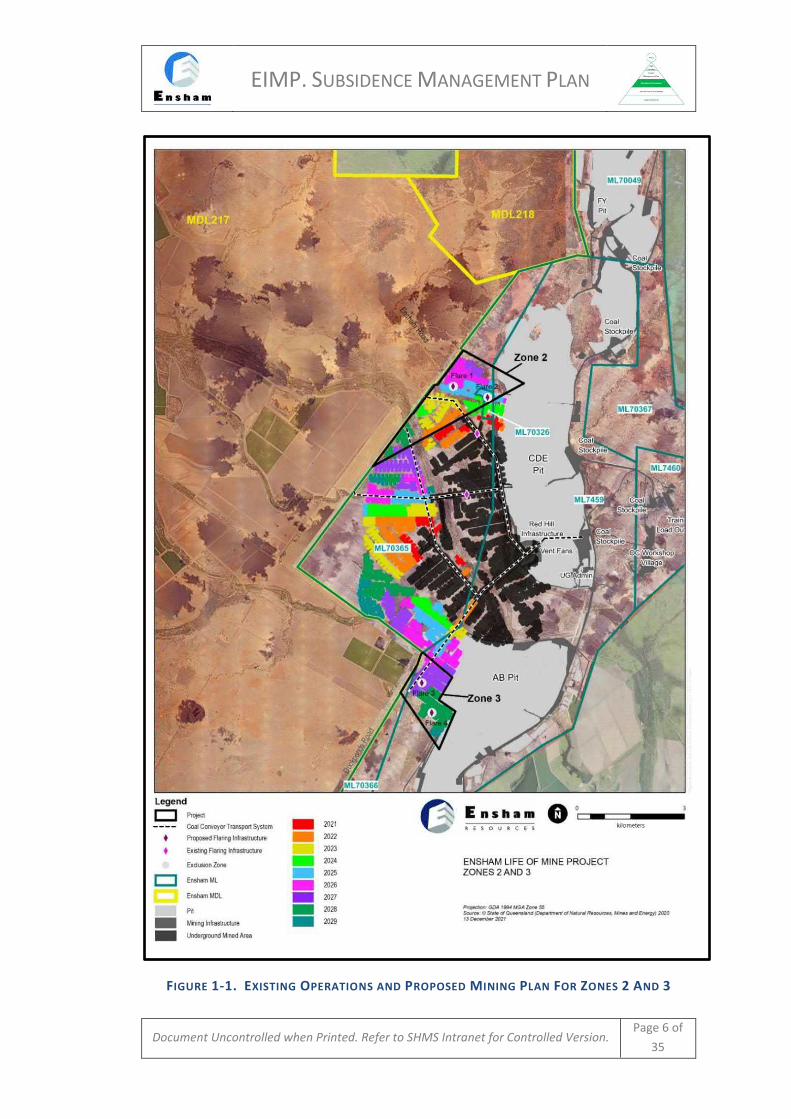
EIMP. SUBSIDENCE MANAGEMENT PLAN
Document Uncontrolled when Printed. Refer to SHMS Intranet for Controlled Version. Page 6 of
35
FIGURE 1-1. EXISTING OPERATIONS AND PROPOSED MINING PLAN FOR ZONES 2 AND 3
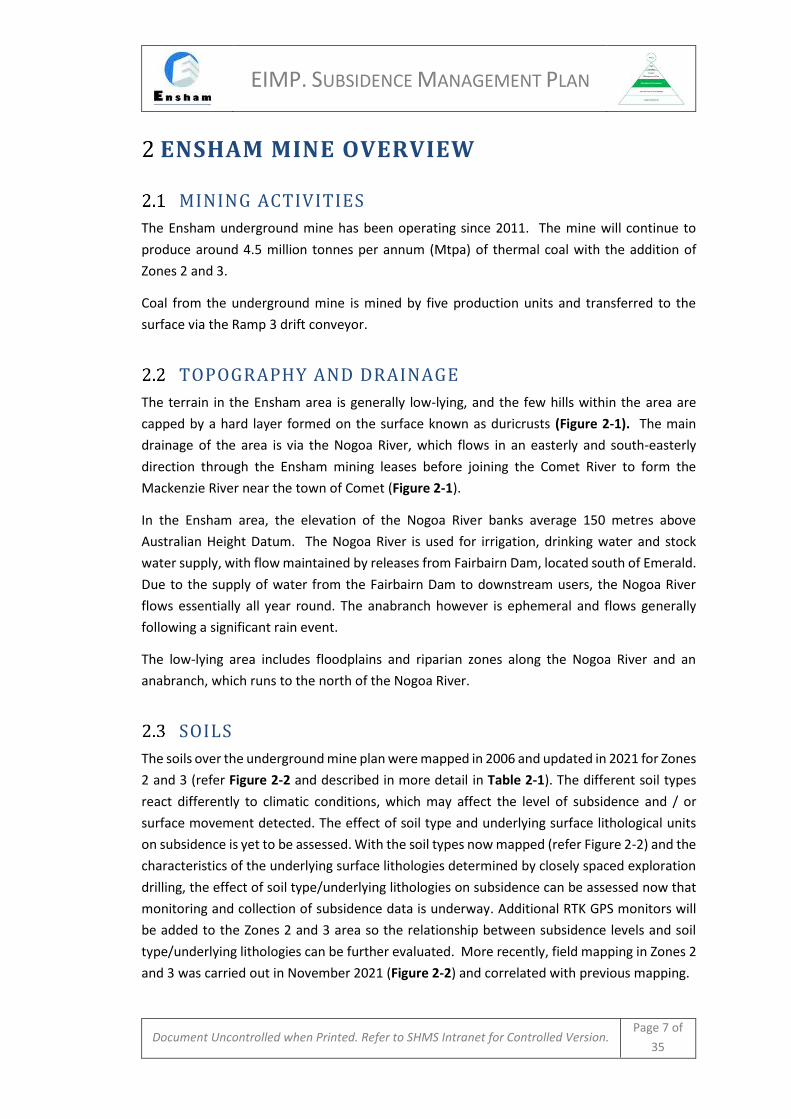
EIMP. SUBSIDENCE MANAGEMENT PLAN
Document Uncontrolled when Printed. Refer to SHMS Intranet for Controlled Version. Page 7 of
35
ENSHAM MINE OVERVIEW
MINING ACTIVITIES
The Ensham underground mine has been operating since 2011. The mine will continue to
produce around 4.5 million tonnes per annum (Mtpa) of thermal coal with the addition of
Zones 2 and 3.
Coal from the underground mine is mined by five production units and transferred to the
surface via the Ramp 3 drift conveyor.
TOPOGRAPHY AND DRAINAGE
The terrain in the Ensham area is generally low-lying, and the few hills within the area are
capped by a hard layer formed on the surface known as duricrusts (Figure 2-1). The main
drainage of the area is via the Nogoa River, which flows in an easterly and south-easterly
direction through the Ensham mining leases before joining the Comet River to form the
Mackenzie River near the town of Comet (Figure 2-1).
In the Ensham area, the elevation of the Nogoa River banks average 150 metres above
Australian Height Datum. The Nogoa River is used for irrigation, drinking water and stock
water supply, with flow maintained by releases from Fairbairn Dam, located south of Emerald.
Due to the supply of water from the Fairbairn Dam to downstream users, the Nogoa River
flows essentially all year round. The anabranch however is ephemeral and flows generally
following a significant rain event.
The low-lying area includes floodplains and riparian zones along the Nogoa River and an
anabranch, which runs to the north of the Nogoa River.
SOILS
The soils over the underground mine plan were mapped in 2006 and updated in 2021 for Zones
2 and 3 (refer Figure 2-2 and described in more detail in Table 2-1). The different soil types
react differently to climatic conditions, which may affect the level of subsidence and / or
surface movement detected. The effect of soil type and underlying surface lithological units
on subsidence is yet to be assessed. With the soil types now mapped (refer Figure 2-2) and the
characteristics of the underlying surface lithologies determined by closely spaced exploration
drilling, the effect of soil type/underlying lithologies on subsidence can be assessed now that
monitoring and collection of subsidence data is underway. Additional RTK GPS monitors will
be added to the Zones 2 and 3 area so the relationship between subsidence levels and soil
type/underlying lithologies can be further evaluated. More recently, field mapping in Zones 2
and 3 was carried out in November 2021 (Figure 2-2) and correlated with previous mapping.
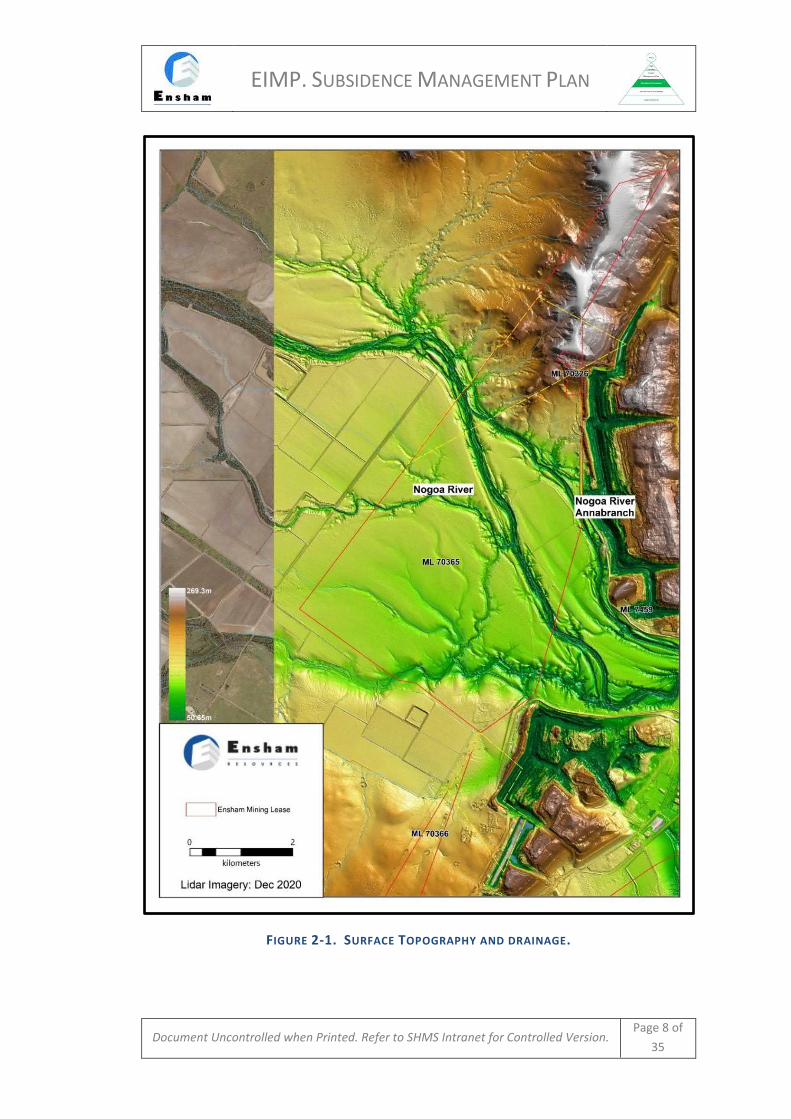
EIMP. SUBSIDENCE MANAGEMENT PLAN
Document Uncontrolled when Printed. Refer to SHMS Intranet for Controlled Version. Page 8 of
35
FIGURE 2-1. SURFACE TOPOGRAPHY AND DRAINAGE.
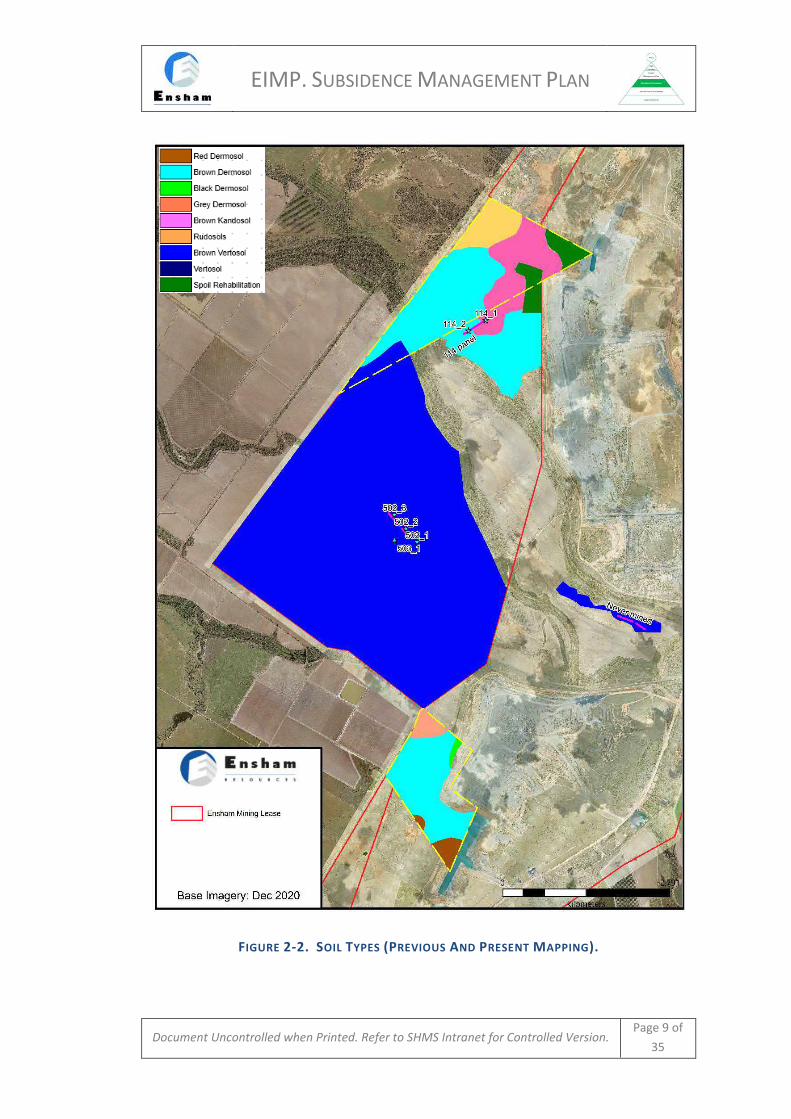
EIMP. SUBSIDENCE MANAGEMENT PLAN
Document Uncontrolled when Printed. Refer to SHMS Intranet for Controlled Version. Page 9 of
35
FIGURE 2-2. SOIL TYPES (PREVIOUS AND PRESENT MAPPING).
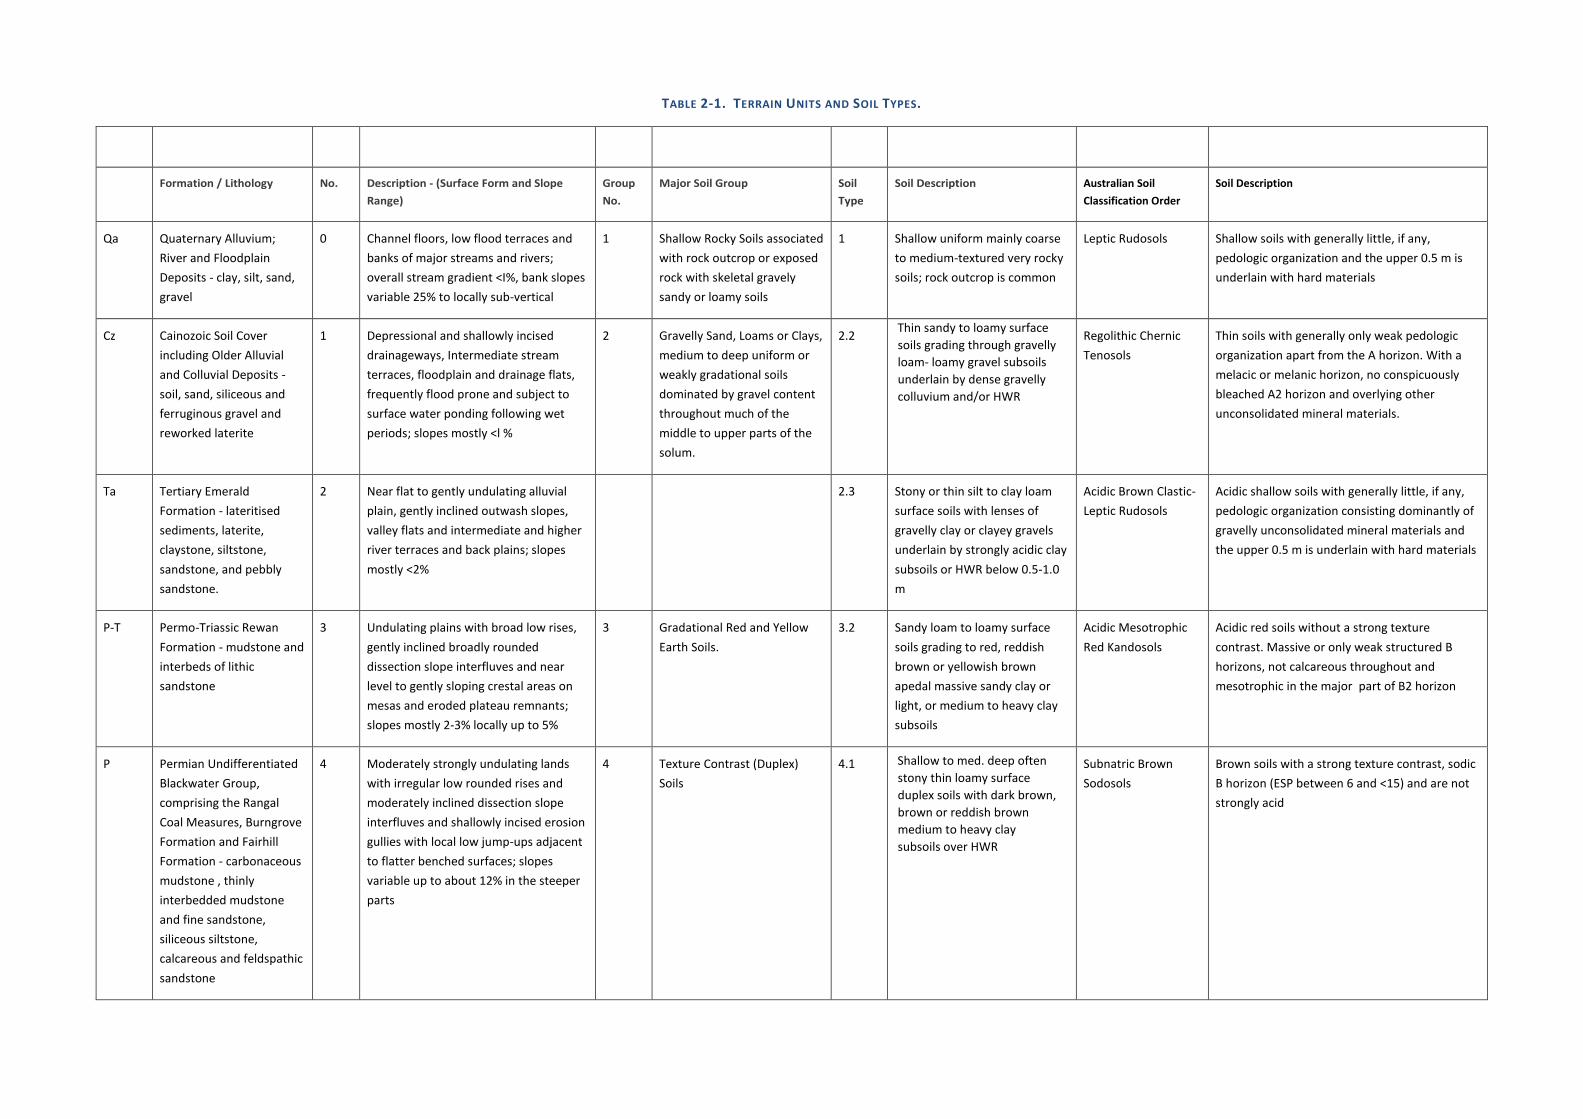
TABLE 2-1. TERRAIN UNITS AND SOIL TYPES.
Formation / Lithology No. Description - (Surface Form and Slope
Range) Group
No. Major Soil Group Soil
Type Soil Description Australian Soil
Classification Order Soil Description
Qa Quaternary Alluvium;
River and Floodplain
Deposits - clay, silt, sand,
gravel
0 Channel floors, low flood terraces and
banks of major streams and rivers;
overall stream gradient <I%, bank slopes
variable 25% to locally sub-vertical
1 Shallow Rocky Soils associated
with rock outcrop or exposed
rock with skeletal gravely
sandy or loamy soils
1 Shallow uniform mainly coarse
to medium-textured very rocky
soils; rock outcrop is common
Leptic Rudosols Shallow soils with generally little, if any,
pedologic organization and the upper 0.5 m is
underlain with hard materials
Cz Cainozoic Soil Cover
including Older Alluvial
and Colluvial Deposits -
soil, sand, siliceous and
ferruginous gravel and
reworked laterite
1 Depressional and shallowly incised
drainageways, Intermediate stream
terraces, floodplain and drainage flats,
frequently flood prone and subject to
surface water ponding following wet
periods; slopes mostly <l %
2 Gravelly Sand, Loams or Clays,
medium to deep uniform or
weakly gradational soils
dominated by gravel content
throughout much of the
middle to upper parts of the
solum.
2.2 Thin sandy to loamy surface
soils grading through gravelly
loam- loamy gravel subsoils
underlain by dense gravelly
colluvium and/or HWR
Regolithic Chernic
Tenosols
Thin soils with generally only weak pedologic
organization apart from the A horizon. With a
melacic or melanic horizon, no conspicuously
bleached A2 horizon and overlying other
unconsolidated mineral materials.
Ta Tertiary Emerald
Formation - lateritised
sediments, laterite,
claystone, siltstone,
sandstone, and pebbly
sandstone.
2 Near flat to gently undulating alluvial
plain, gently inclined outwash slopes,
valley flats and intermediate and higher
river terraces and back plains; slopes
mostly <2%
2.3 Stony or thin silt to clay loam
surface soils with lenses of
gravelly clay or clayey gravels
underlain by strongly acidic clay
subsoils or HWR below 0.5-1.0
m
Acidic Brown Clastic-
Leptic Rudosols
Acidic shallow soils with generally little, if any,
pedologic organization consisting dominantly of
gravelly unconsolidated mineral materials and
the upper 0.5 m is underlain with hard materials
P-T Permo-Triassic Rewan
Formation - mudstone and
interbeds of lithic
sandstone
3 Undulating plains with broad low rises,
gently inclined broadly rounded
dissection slope interfluves and near
level to gently sloping crestal areas on
mesas and eroded plateau remnants;
slopes mostly 2-3% locally up to 5%
3 Gradational Red and Yellow
Earth Soils.
3.2 Sandy loam to loamy surface
soils grading to red, reddish
brown or yellowish brown
apedal massive sandy clay or
light, or medium to heavy clay
subsoils
Acidic Mesotrophic
Red Kandosols
Acidic red soils without a strong texture
contrast. Massive or only weak structured B
horizons, not calcareous throughout and
mesotrophic in the major part of B2 horizon
P Permian Undifferentiated
Blackwater Group,
comprising the Rangal
Coal Measures, Burngrove
Formation and Fairhill
Formation - carbonaceous
mudstone , thinly
interbedded mudstone
and fine sandstone,
siliceous siltstone,
calcareous and feldspathic
sandstone
4 Moderately strongly undulating lands
with irregular low rounded rises and
moderately inclined dissection slope
interfluves and shallowly incised erosion
gullies with local low jump-ups adjacent
to flatter benched surfaces; slopes
variable up to about 12% in the steeper
parts
4 Texture Contrast (Duplex)
Soils
4.1 Shallow to med. deep often
stony thin loamy surface
duplex soils with dark brown,
brown or reddish brown
medium to heavy clay
subsoils over HWR
Subnatric Brown
Sodosols
Brown soils with a strong texture contrast, sodic
B horizon (ESP between 6 and <15) and are not
strongly acid
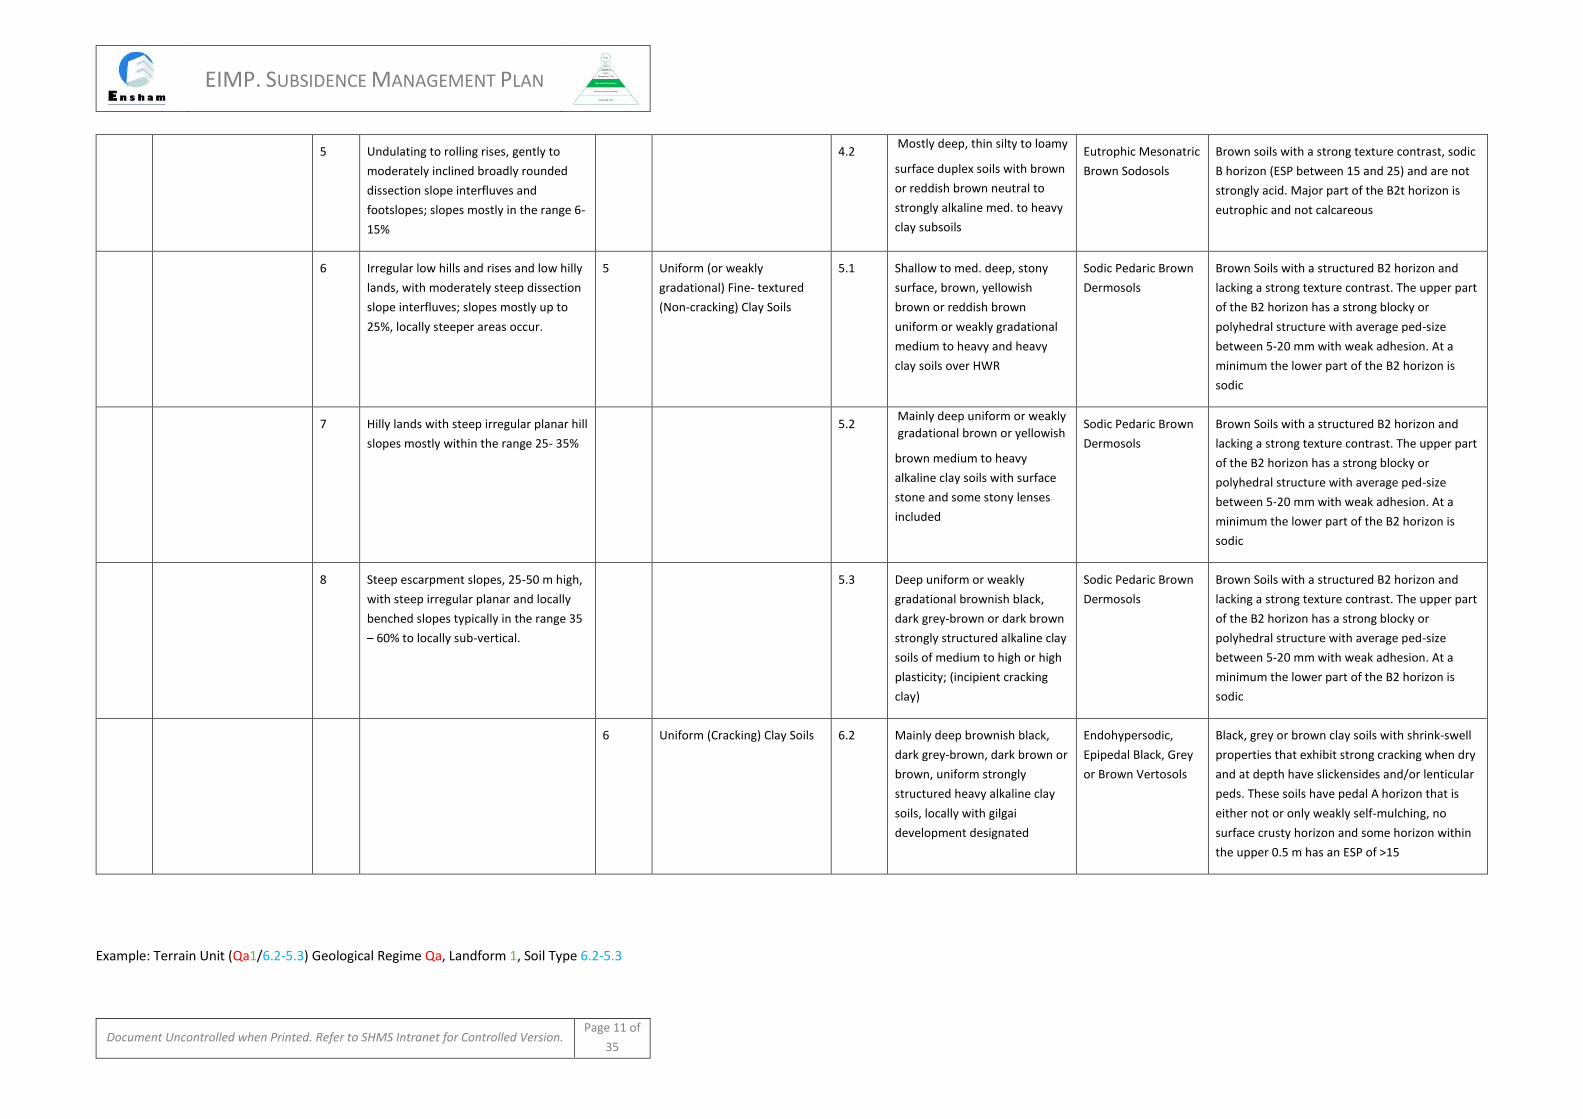
EIMP. SUBSIDENCE MANAGEMENT PLAN
Document Uncontrolled when Printed. Refer to SHMS Intranet for Controlled Version. Page 11 of
35
5 Undulating to rolling rises, gently to
moderately inclined broadly rounded
dissection slope interfluves and
footslopes; slopes mostly in the range 6-
15%
4.2 Mostly deep, thin silty to loamy
surface duplex soils with brown
or reddish brown neutral to
strongly alkaline med. to heavy
clay subsoils
Eutrophic Mesonatric
Brown Sodosols
Brown soils with a strong texture contrast, sodic
B horizon (ESP between 15 and 25) and are not
strongly acid. Major part of the B2t horizon is
eutrophic and not calcareous
6 Irregular low hills and rises and low hilly
lands, with moderately steep dissection
slope interfluves; slopes mostly up to
25%, locally steeper areas occur.
5 Uniform (or weakly
gradational) Fine- textured
(Non-cracking) Clay Soils
5.1 Shallow to med. deep, stony
surface, brown, yellowish
brown or reddish brown
uniform or weakly gradational
medium to heavy and heavy
clay soils over HWR
Sodic Pedaric Brown
Dermosols
Brown Soils with a structured B2 horizon and
lacking a strong texture contrast. The upper part
of the B2 horizon has a strong blocky or
polyhedral structure with average ped-size
between 5-20 mm with weak adhesion. At a
minimum the lower part of the B2 horizon is
sodic
7 Hilly lands with steep irregular planar hill
slopes mostly within the range 25- 35% 5.2
Mainly deep uniform or weakly
gradational brown or yellowish
brown medium to heavy
alkaline clay soils with surface
stone and some stony lenses
included
Sodic Pedaric Brown
Dermosols
Brown Soils with a structured B2 horizon and
lacking a strong texture contrast. The upper part
of the B2 horizon has a strong blocky or
polyhedral structure with average ped-size
between 5-20 mm with weak adhesion. At a
minimum the lower part of the B2 horizon is
sodic
8 Steep escarpment slopes, 25-50 m high,
with steep irregular planar and locally
benched slopes typically in the range 35
– 60% to locally sub-vertical.
5.3 Deep uniform or weakly
gradational brownish black,
dark grey-brown or dark brown
strongly structured alkaline clay
soils of medium to high or high
plasticity; (incipient cracking
clay)
Sodic Pedaric Brown
Dermosols
Brown Soils with a structured B2 horizon and
lacking a strong texture contrast. The upper part
of the B2 horizon has a strong blocky or
polyhedral structure with average ped-size
between 5-20 mm with weak adhesion. At a
minimum the lower part of the B2 horizon is
sodic
6 Uniform (Cracking) Clay Soils 6.2 Mainly deep brownish black,
dark grey-brown, dark brown or
brown, uniform strongly
structured heavy alkaline clay
soils, locally with gilgai
development designated
Endohypersodic,
Epipedal Black, Grey
or Brown Vertosols
Black, grey or brown clay soils with shrink-swell
properties that exhibit strong cracking when dry
and at depth have slickensides and/or lenticular
peds. These soils have pedal A horizon that is
either not or only weakly self-mulching, no
surface crusty horizon and some horizon within
the upper 0.5 m has an ESP of >15
Example: Terrain Unit (Qa1/6.2-5.3) Geological Regime Qa, Landform 1, Soil Type 6.2-5.3
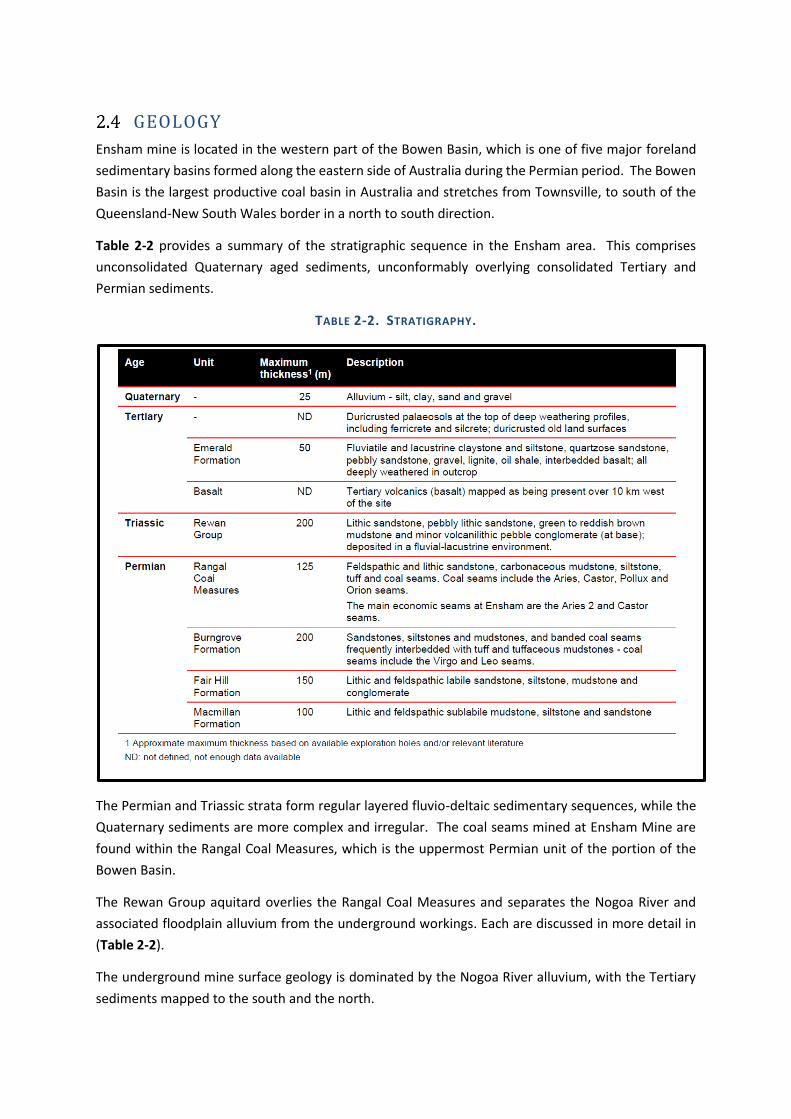
GEOLOGY
Ensham mine is located in the western part of the Bowen Basin, which is one of five major foreland
sedimentary basins formed along the eastern side of Australia during the Permian period. The Bowen
Basin is the largest productive coal basin in Australia and stretches from Townsville, to south of the
Queensland-New South Wales border in a north to south direction.
Table 2-2 provides a summary of the stratigraphic sequence in the Ensham area. This comprises
unconsolidated Quaternary aged sediments, unconformably overlying consolidated Tertiary and
Permian sediments.
TABLE 2-2. STRATIGRAPHY.
The Permian and Triassic strata form regular layered fluvio-deltaic sedimentary sequences, while the
Quaternary sediments are more complex and irregular. The coal seams mined at Ensham Mine are
found within the Rangal Coal Measures, which is the uppermost Permian unit of the portion of the
Bowen Basin.
The Rewan Group aquitard overlies the Rangal Coal Measures and separates the Nogoa River and
associated floodplain alluvium from the underground workings. Each are discussed in more detail in
(Table 2-2).
The underground mine surface geology is dominated by the Nogoa River alluvium, with the Tertiary
sediments mapped to the south and the north.
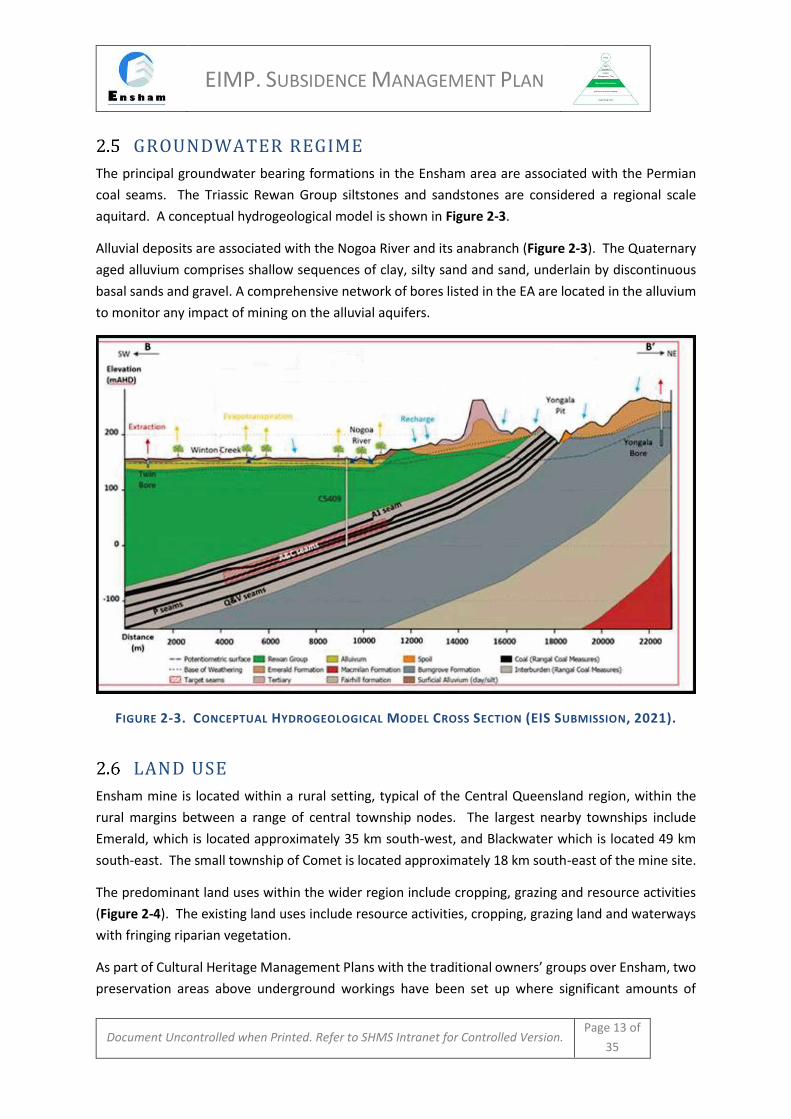
EIMP. SUBSIDENCE MANAGEMENT PLAN
Document Uncontrolled when Printed. Refer to SHMS Intranet for Controlled Version. Page 13 of
35
GROUNDWATER REGIME
The principal groundwater bearing formations in the Ensham area are associated with the Permian
coal seams. The Triassic Rewan Group siltstones and sandstones are considered a regional scale
aquitard. A conceptual hydrogeological model is shown in Figure 2-3.
Alluvial deposits are associated with the Nogoa River and its anabranch (Figure 2-3). The Quaternary
aged alluvium comprises shallow sequences of clay, silty sand and sand, underlain by discontinuous
basal sands and gravel. A comprehensive network of bores listed in the EA are located in the alluvium
to monitor any impact of mining on the alluvial aquifers.
FIGURE 2-3. CONCEPTUAL HYDROGEOLOGICAL MODEL CROSS SECTION (EIS SUBMISSION, 2021).
LAND USE
Ensham mine is located within a rural setting, typical of the Central Queensland region, within the
rural margins between a range of central township nodes. The largest nearby townships include
Emerald, which is located approximately 35 km south-west, and Blackwater which is located 49 km
south-east. The small township of Comet is located approximately 18 km south-east of the mine site.
The predominant land uses within the wider region include cropping, grazing and resource activities
(Figure 2-4). The existing land uses include resource activities, cropping, grazing land and waterways
with fringing riparian vegetation.
As part of Cultural Heritage Management Plans with the traditional owners’ groups over Ensham, two
preservation areas above underground workings have been set up where significant amounts of
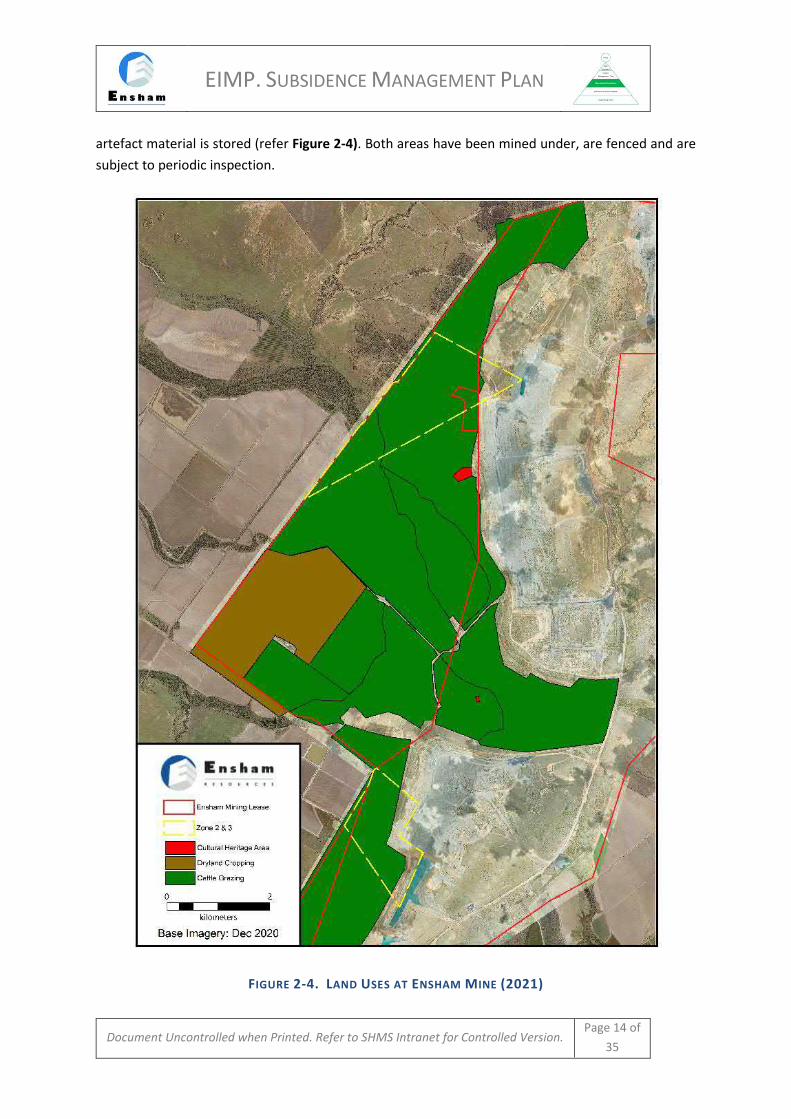
EIMP. SUBSIDENCE MANAGEMENT PLAN
Document Uncontrolled when Printed. Refer to SHMS Intranet for Controlled Version. Page 14 of
35
artefact material is stored (refer Figure 2-4). Both areas have been mined under, are fenced and are
subject to periodic inspection.
FIGURE 2-4. LAND USES AT ENSHAM MINE (2021)
EIMP. SUBSIDENCE MANAGEMENT PLAN
Document Uncontrolled when Printed. Refer to SHMS Intranet for Controlled Version. Page 15 of
35
PREDICTED SUBSIDENCE
INTRODUCTION
The bord and pillar mining layout at Ensham has been specifically designed to ensure that there will
be no caving of the roof or collapse of the pillars. The long-term stability of the underground workings
has been assessed using the design Factor of Safety (FoS), pillar dimensions (width to height ratio) and
stability of the overburden.
Unlike longwall mining, where the subsidence comprises two main components namely sag
subsidence and strata compression, in the Ensham mining area, the subsidence will be due to strata
compression alone. This results in low levels of surface lowering and minimal associated surface
effects due to the associated low tilts, curvatures and strains.
The underground workings are designed where practical to avoid geological structures that may be
associated with poorer mining conditions. Seismic surveying is used in future mining areas to
delineate these structures prior to mining, allowing the optimization of the underground
workings. For every panel that is mined, a hazard panel plan is produced that collates the available
geological information such as:
• Location of geological structures.
• Depth of cover.
• Seam thickness.
• Seam levels.
• Roof strength.
Furthermore, the maximum excavation heights to maintain the required minimum FoS, in both the
roadways and bell outs, are detailed on the Permit to Mine (PTM) for each mining area. The final
roadway and pillar profiles are surveyed to confirm compliance with the design excavation heights.
These checks are carried out by the Geotechnical Engineer and reported in the monthly geotechnical
inspection report.
PILLAR DESIGN
The stability of the coal pillars in the Ensham underground mine are assessed using the industry
accepted University of New South Wales Pillar Design Procedure to determine the design FoS as
follows (Galvin et al, 1998):
FoS = Strength of Pillar/Load on Pillar
The strength and load carried by the pillars in the Ensham Area are calculated using the UNSW Pillar
Design Power Strength Formulae and tributary area loading methodology respectively.
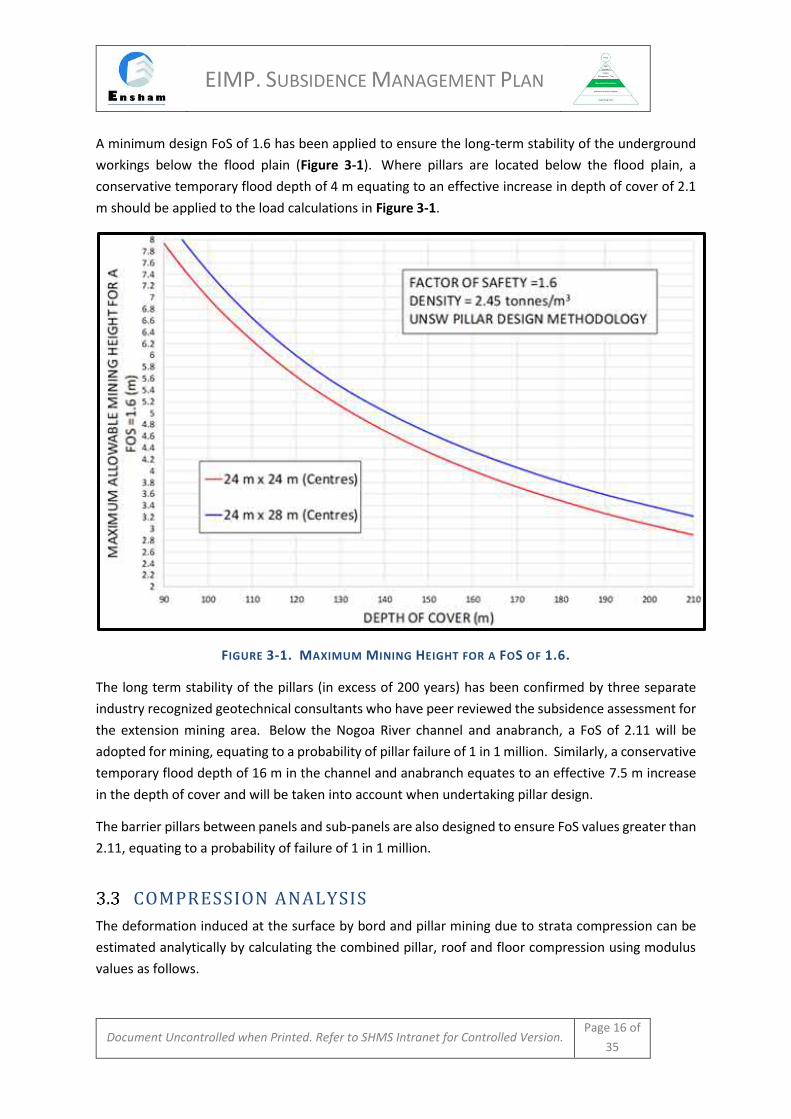
EIMP. SUBSIDENCE MANAGEMENT PLAN
Document Uncontrolled when Printed. Refer to SHMS Intranet for Controlled Version. Page 16 of
35
A minimum design FoS of 1.6 has been applied to ensure the long-term stability of the underground
workings below the flood plain (Figure 3-1). Where pillars are located below the flood plain, a
conservative temporary flood depth of 4 m equating to an effective increase in depth of cover of 2.1
m should be applied to the load calculations in Figure 3-1.
FIGURE 3-1. MAXIMUM MINING HEIGHT FOR A FOS OF 1.6.
The long term stability of the pillars (in excess of 200 years) has been confirmed by three separate
industry recognized geotechnical consultants who have peer reviewed the subsidence assessment for
the extension mining area. Below the Nogoa River channel and anabranch, a FoS of 2.11 will be
adopted for mining, equating to a probability of pillar failure of 1 in 1 million. Similarly, a conservative
temporary flood depth of 16 m in the channel and anabranch equates to an effective 7.5 m increase
in the depth of cover and will be taken into account when undertaking pillar design.
The barrier pillars between panels and sub-panels are also designed to ensure FoS values greater than
2.11, equating to a probability of failure of 1 in 1 million.
COMPRESSION ANALYSIS
The deformation induced at the surface by bord and pillar mining due to strata compression can be
estimated analytically by calculating the combined pillar, roof and floor compression using modulus
values as follows.
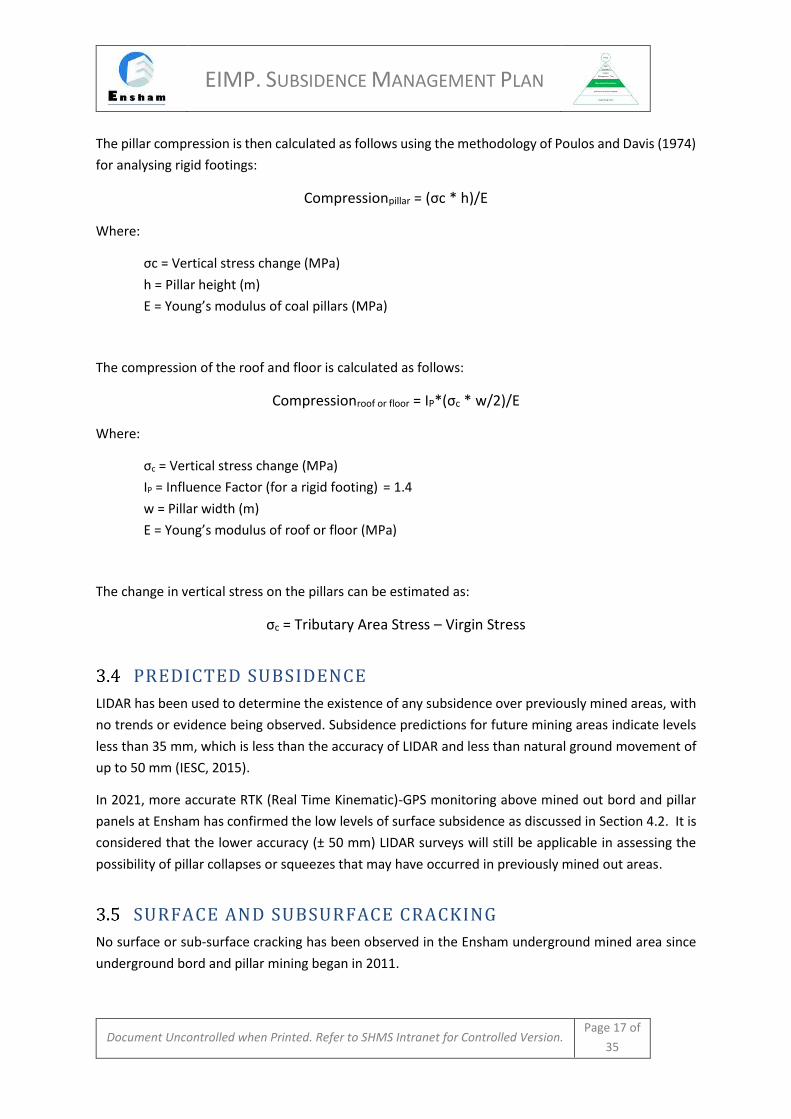
EIMP. SUBSIDENCE MANAGEMENT PLAN
Document Uncontrolled when Printed. Refer to SHMS Intranet for Controlled Version. Page 17 of
35
The pillar compression is then calculated as follows using the methodology of Poulos and Davis (1974)
for analysing rigid footings:
Compressionpillar = (σc * h)/E
Where:
σc = Vertical stress change (MPa)
h = Pillar height (m)
E = Young’s modulus of coal pillars (MPa)
The compression of the roof and floor is calculated as follows:
Compressionroof or floor = IP*(σc * w/2)/E
Where:
σc = Vertical stress change (MPa)
IP = Influence Factor (for a rigid footing) = 1.4
w = Pillar width (m)
E = Young’s modulus of roof or floor (MPa)
The change in vertical stress on the pillars can be estimated as:
σc = Tributary Area Stress – Virgin Stress
PREDICTED SUBSIDENCE
LIDAR has been used to determine the existence of any subsidence over previously mined areas, with
no trends or evidence being observed. Subsidence predictions for future mining areas indicate levels
less than 35 mm, which is less than the accuracy of LIDAR and less than natural ground movement of
up to 50 mm (IESC, 2015).
In 2021, more accurate RTK (Real Time Kinematic)-GPS monitoring above mined out bord and pillar
panels at Ensham has confirmed the low levels of surface subsidence as discussed in Section 4.2. It is
considered that the lower accuracy (± 50 mm) LIDAR surveys will still be applicable in assessing the
possibility of pillar collapses or squeezes that may have occurred in previously mined out areas.
SURFACE AND SUBSURFACE CRACKING
No surface or sub-surface cracking has been observed in the Ensham underground mined area since
underground bord and pillar mining began in 2011.
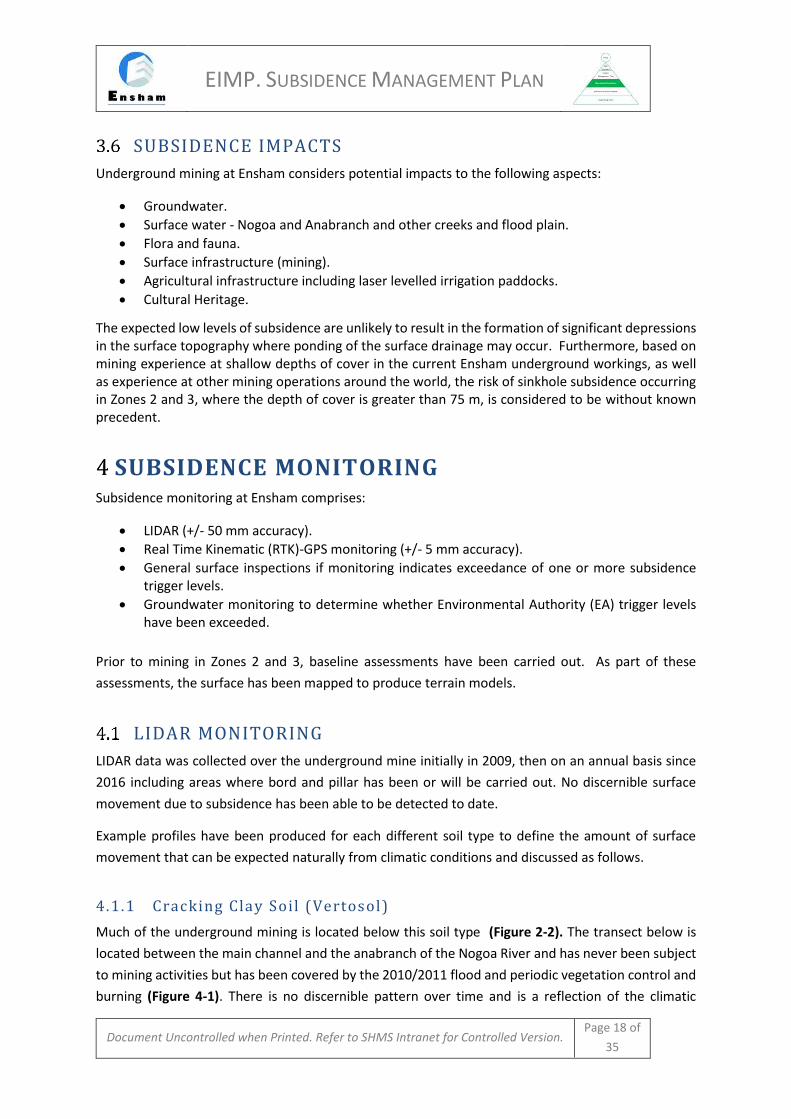
EIMP. SUBSIDENCE MANAGEMENT PLAN
Document Uncontrolled when Printed. Refer to SHMS Intranet for Controlled Version. Page 18 of
35
SUBSIDENCE IMPACTS
Underground mining at Ensham considers potential impacts to the following aspects:
• Groundwater.
• Surface water - Nogoa and Anabranch and other creeks and flood plain.
• Flora and fauna.
• Surface infrastructure (mining).
• Agricultural infrastructure including laser levelled irrigation paddocks.
• Cultural Heritage.
The expected low levels of subsidence are unlikely to result in the formation of significant depressions in the surface topography where ponding of the surface drainage may occur. Furthermore, based on mining experience at shallow depths of cover in the current Ensham underground workings, as well as experience at other mining operations around the world, the risk of sinkhole subsidence occurring in Zones 2 and 3, where the depth of cover is greater than 75 m, is considered to be without known precedent.
SUBSIDENCE MONITORING Subsidence monitoring at Ensham comprises:
• LIDAR (+/- 50 mm accuracy).
• Real Time Kinematic (RTK)-GPS monitoring (+/- 5 mm accuracy).
• General surface inspections if monitoring indicates exceedance of one or more subsidence trigger levels.
• Groundwater monitoring to determine whether Environmental Authority (EA) trigger levels have been exceeded.
Prior to mining in Zones 2 and 3, baseline assessments have been carried out. As part of these
assessments, the surface has been mapped to produce terrain models.
LIDAR MONITORING
LIDAR data was collected over the underground mine initially in 2009, then on an annual basis since
2016 including areas where bord and pillar has been or will be carried out. No discernible surface
movement due to subsidence has been able to be detected to date.
Example profiles have been produced for each different soil type to define the amount of surface
movement that can be expected naturally from climatic conditions and discussed as follows.
4.1.1 Cracking Clay Soil (Vertosol)
Much of the underground mining is located below this soil type (Figure 2-2). The transect below is
located between the main channel and the anabranch of the Nogoa River and has never been subject
to mining activities but has been covered by the 2010/2011 flood and periodic vegetation control and
burning (Figure 4-1). There is no discernible pattern over time and is a reflection of the climatic
EIMP. SUBSIDENCE MANAGEMENT PLAN
Document Uncontrolled when Printed. Refer to SHMS Intranet for Controlled Version. Page 19 of
35
conditions at the time of the survey. Similar, patterns have been measured in the same soil type over
the 502 Panel which was mined during 2021 (Figure 4-2). Considerable surface soil movement is
expected over time in this soil type.
FIGURE 4-1. LIDAR TRANSECT ACROSS AN AREA OF UNMINED VERTOSOL SOIL
FIGURE 4-2. LIDAR TRANSECT ALONG AN AREA OF 502 PANEL WITH VERTOSOL SOIL MINED DURING
2021
152
152.2
152.4
152.6
152.8
153
153.2
153.4
153.6
153.8
0 100 200 300 400 500 600
AH
D (
m)
Distance (m)
Unmined Vertosol
2009 (pre-mining UG) Mar-16 Feb-17
Jan-18 Dec-19 Dec-20
Dec-21
154
154.2
154.4
154.6
154.8
155
155.2
0 100 200 300 400 500 600
AH
D (
m)
Distance (m)
502 Panel
Jan-18 Dec-19 Dec-20 Dec-21
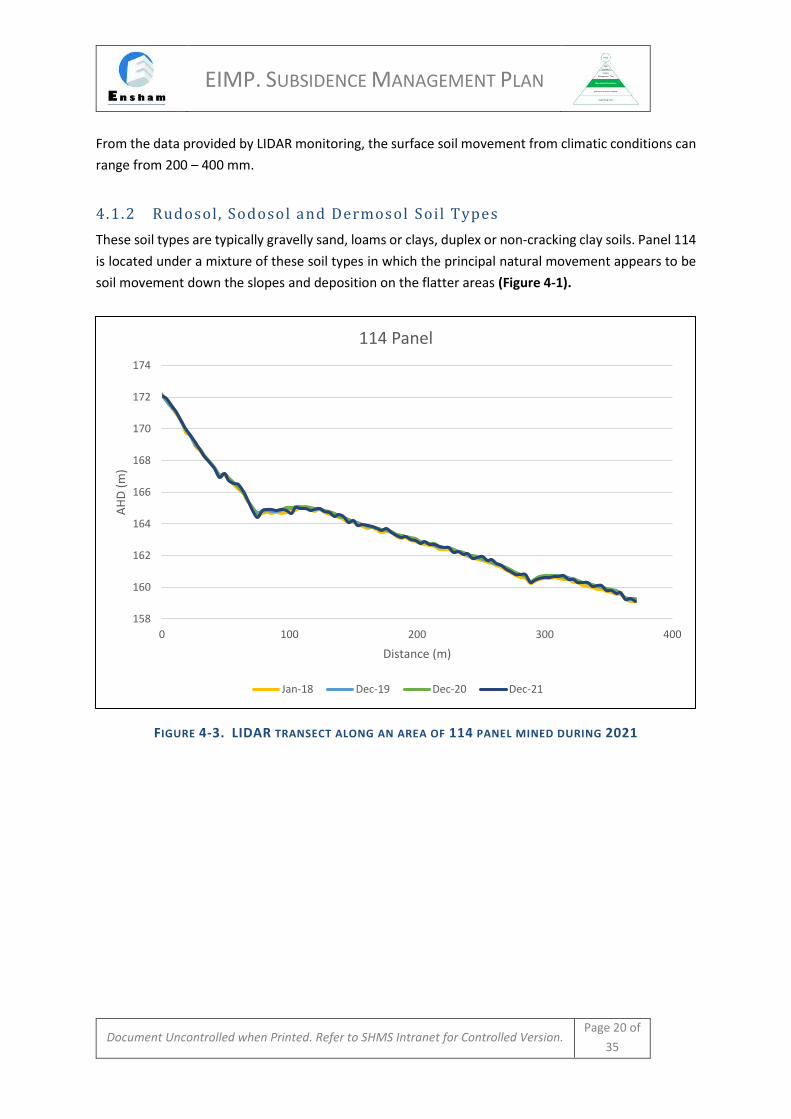
EIMP. SUBSIDENCE MANAGEMENT PLAN
Document Uncontrolled when Printed. Refer to SHMS Intranet for Controlled Version. Page 20 of
35
From the data provided by LIDAR monitoring, the surface soil movement from climatic conditions can
range from 200 – 400 mm.
4.1.2 Rudosol, Sodosol and Dermosol Soil Types
These soil types are typically gravelly sand, loams or clays, duplex or non-cracking clay soils. Panel 114
is located under a mixture of these soil types in which the principal natural movement appears to be
soil movement down the slopes and deposition on the flatter areas (Figure 4-1).
FIGURE 4-3. LIDAR TRANSECT ALONG AN AREA OF 114 PANEL MINED DURING 2021
158
160
162
164
166
168
170
172
174
0 100 200 300 400
AH
D (
m)
Distance (m)
114 Panel
Jan-18 Dec-19 Dec-20 Dec-21
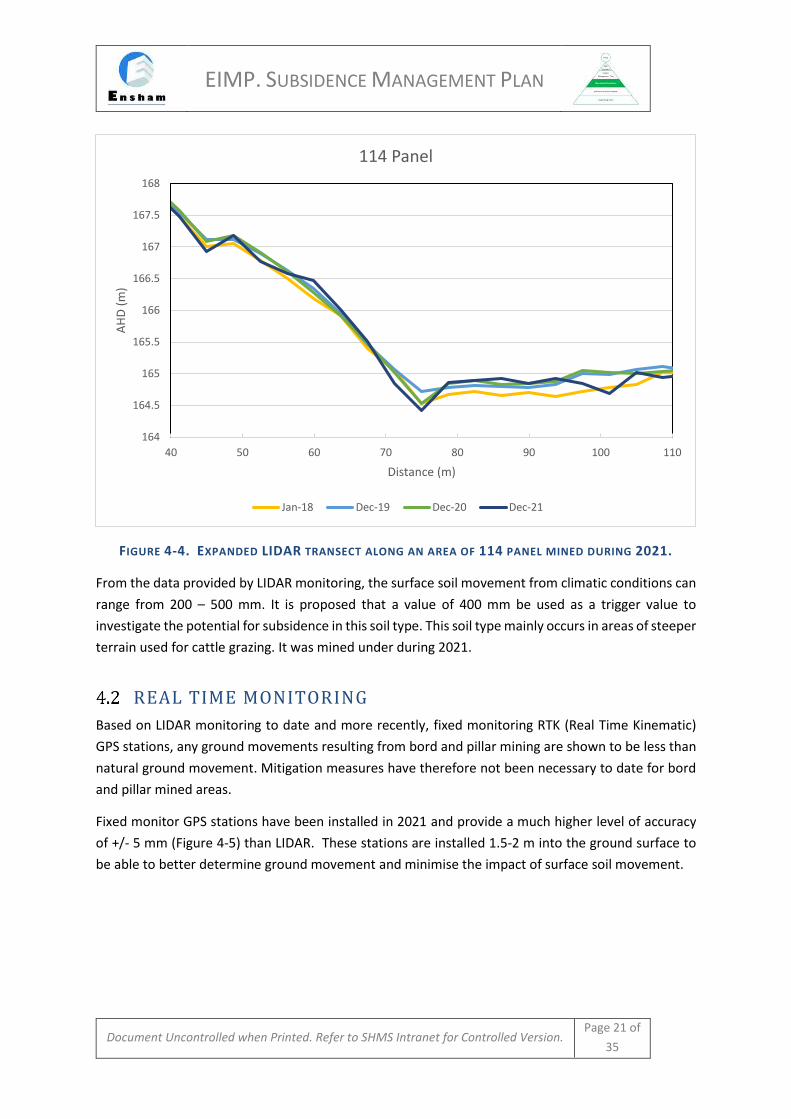
EIMP. SUBSIDENCE MANAGEMENT PLAN
Document Uncontrolled when Printed. Refer to SHMS Intranet for Controlled Version. Page 21 of
35
FIGURE 4-4. EXPANDED LIDAR TRANSECT ALONG AN AREA OF 114 PANEL MINED DURING 2021.
From the data provided by LIDAR monitoring, the surface soil movement from climatic conditions can
range from 200 – 500 mm. It is proposed that a value of 400 mm be used as a trigger value to
investigate the potential for subsidence in this soil type. This soil type mainly occurs in areas of steeper
terrain used for cattle grazing. It was mined under during 2021.
REAL TIME MONITORING
Based on LIDAR monitoring to date and more recently, fixed monitoring RTK (Real Time Kinematic)
GPS stations, any ground movements resulting from bord and pillar mining are shown to be less than
natural ground movement. Mitigation measures have therefore not been necessary to date for bord
and pillar mined areas.
Fixed monitor GPS stations have been installed in 2021 and provide a much higher level of accuracy
of +/- 5 mm (Figure 4-5) than LIDAR. These stations are installed 1.5-2 m into the ground surface to
be able to better determine ground movement and minimise the impact of surface soil movement.
164
164.5
165
165.5
166
166.5
167
167.5
168
40 50 60 70 80 90 100 110
AH
D (
m)
Distance (m)
114 Panel
Jan-18 Dec-19 Dec-20 Dec-21
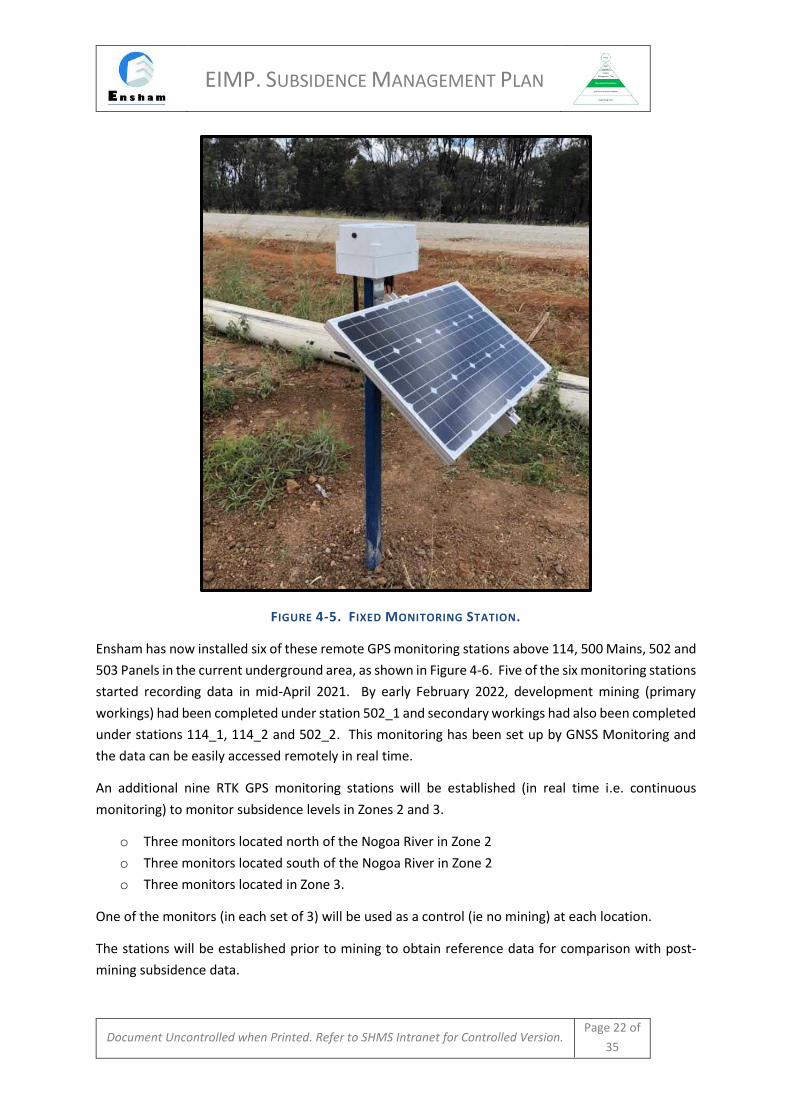
EIMP. SUBSIDENCE MANAGEMENT PLAN
Document Uncontrolled when Printed. Refer to SHMS Intranet for Controlled Version. Page 22 of
35
FIGURE 4-5. FIXED MONITORING STATION.
Ensham has now installed six of these remote GPS monitoring stations above 114, 500 Mains, 502 and
503 Panels in the current underground area, as shown in Figure 4-6. Five of the six monitoring stations
started recording data in mid-April 2021. By early February 2022, development mining (primary
workings) had been completed under station 502_1 and secondary workings had also been completed
under stations 114_1, 114_2 and 502_2. This monitoring has been set up by GNSS Monitoring and
the data can be easily accessed remotely in real time.
An additional nine RTK GPS monitoring stations will be established (in real time i.e. continuous
monitoring) to monitor subsidence levels in Zones 2 and 3.
o Three monitors located north of the Nogoa River in Zone 2
o Three monitors located south of the Nogoa River in Zone 2
o Three monitors located in Zone 3.
One of the monitors (in each set of 3) will be used as a control (ie no mining) at each location.
The stations will be established prior to mining to obtain reference data for comparison with post-
mining subsidence data.
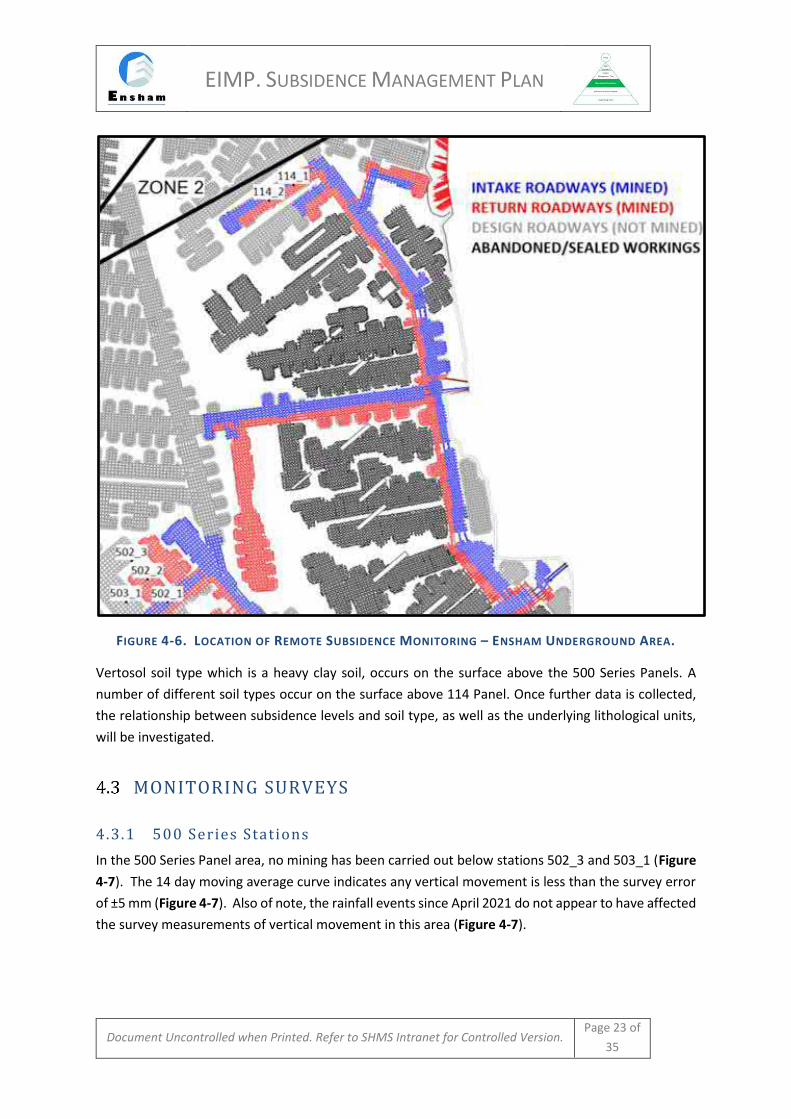
EIMP. SUBSIDENCE MANAGEMENT PLAN
Document Uncontrolled when Printed. Refer to SHMS Intranet for Controlled Version. Page 23 of
35
FIGURE 4-6. LOCATION OF REMOTE SUBSIDENCE MONITORING – ENSHAM UNDERGROUND AREA.
Vertosol soil type which is a heavy clay soil, occurs on the surface above the 500 Series Panels. A
number of different soil types occur on the surface above 114 Panel. Once further data is collected,
the relationship between subsidence levels and soil type, as well as the underlying lithological units,
will be investigated.
MONITORING SURVEYS
4.3.1 500 Series Stations
In the 500 Series Panel area, no mining has been carried out below stations 502_3 and 503_1 (Figure
4-7). The 14 day moving average curve indicates any vertical movement is less than the survey error
of ±5 mm (Figure 4-7). Also of note, the rainfall events since April 2021 do not appear to have affected
the survey measurements of vertical movement in this area (Figure 4-7).
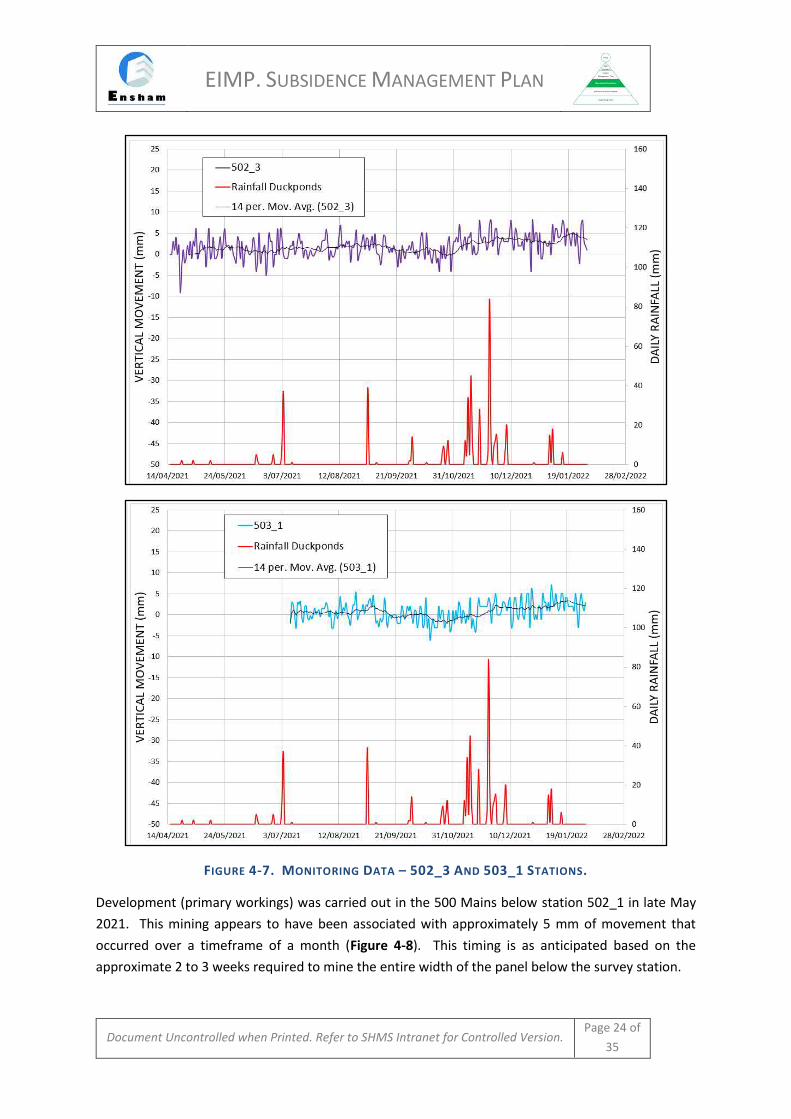
EIMP. SUBSIDENCE MANAGEMENT PLAN
Document Uncontrolled when Printed. Refer to SHMS Intranet for Controlled Version. Page 24 of
35
FIGURE 4-7. MONITORING DATA – 502_3 AND 503_1 STATIONS.
Development (primary workings) was carried out in the 500 Mains below station 502_1 in late May
2021. This mining appears to have been associated with approximately 5 mm of movement that
occurred over a timeframe of a month (Figure 4-8). This timing is as anticipated based on the
approximate 2 to 3 weeks required to mine the entire width of the panel below the survey station.
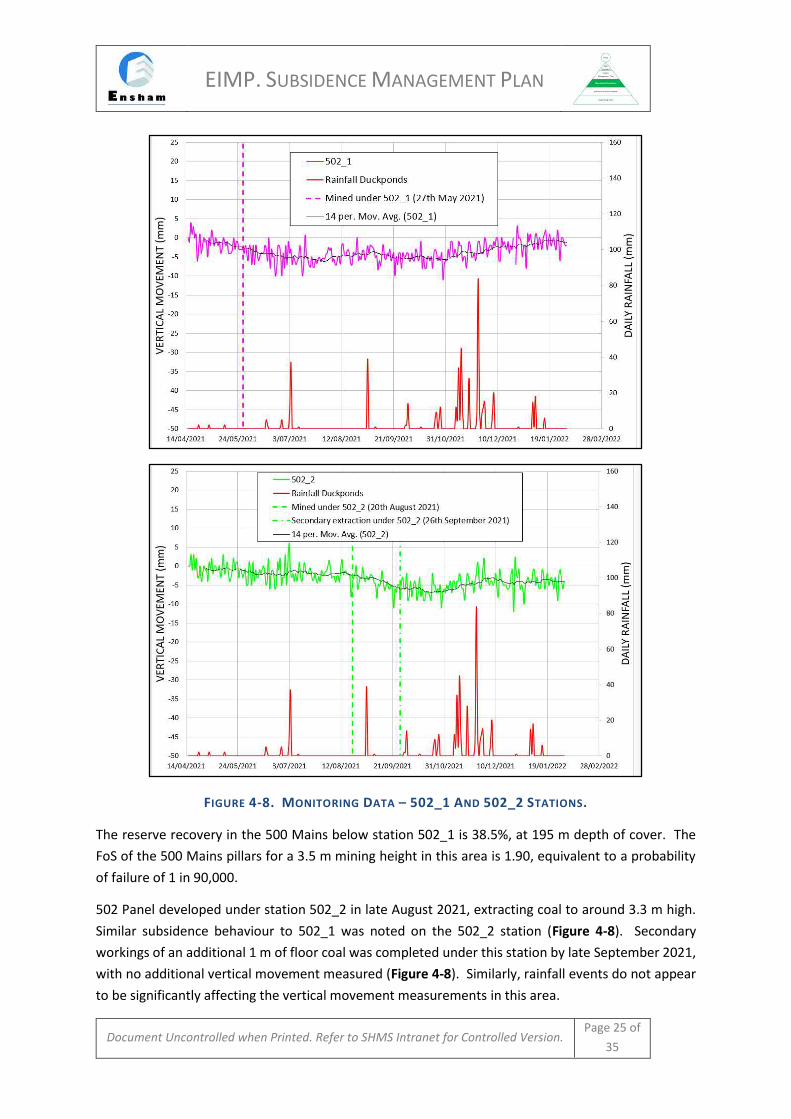
EIMP. SUBSIDENCE MANAGEMENT PLAN
Document Uncontrolled when Printed. Refer to SHMS Intranet for Controlled Version. Page 25 of
35
FIGURE 4-8. MONITORING DATA – 502_1 AND 502_2 STATIONS.
The reserve recovery in the 500 Mains below station 502_1 is 38.5%, at 195 m depth of cover. The
FoS of the 500 Mains pillars for a 3.5 m mining height in this area is 1.90, equivalent to a probability
of failure of 1 in 90,000.
502 Panel developed under station 502_2 in late August 2021, extracting coal to around 3.3 m high.
Similar subsidence behaviour to 502_1 was noted on the 502_2 station (Figure 4-8). Secondary
workings of an additional 1 m of floor coal was completed under this station by late September 2021,
with no additional vertical movement measured (Figure 4-8). Similarly, rainfall events do not appear
to be significantly affecting the vertical movement measurements in this area.
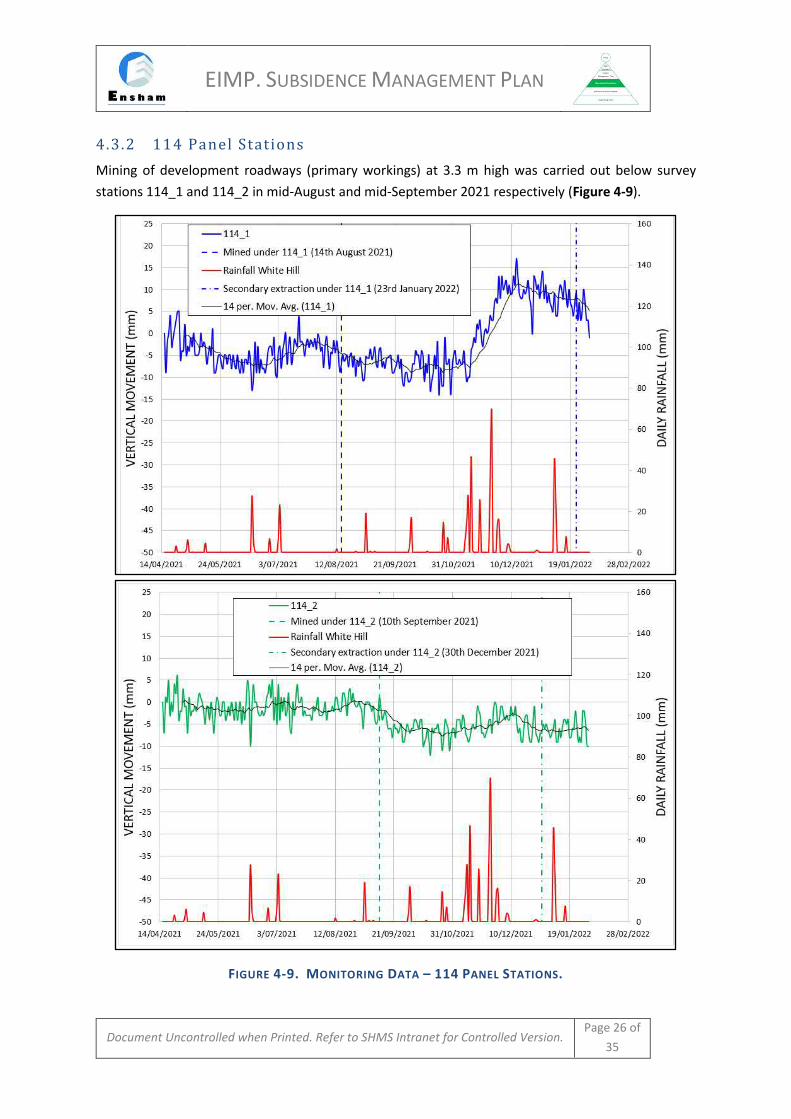
EIMP. SUBSIDENCE MANAGEMENT PLAN
Document Uncontrolled when Printed. Refer to SHMS Intranet for Controlled Version. Page 26 of
35
4.3.2 114 Panel Stations
Mining of development roadways (primary workings) at 3.3 m high was carried out below survey
stations 114_1 and 114_2 in mid-August and mid-September 2021 respectively (Figure 4-9).
FIGURE 4-9. MONITORING DATA – 114 PANEL STATIONS.

EIMP. SUBSIDENCE MANAGEMENT PLAN
Document Uncontrolled when Printed. Refer to SHMS Intranet for Controlled Version. Page 27 of
35
Prior to mining under station 114_1, a greater amount of scatter in the data was evident (Figure 4-9).
This station also appears more susceptible to changes during rainfall events, which can be attributed
to the type of material in which the station is anchored. The data from station 114_2 appears more
reliable and indicates around a two week period for the maximum 8 mm of subsidence to occur (Figure
4-9).
4.3.3 Summary
By February 2022, almost ten months of higher accuracy (± 5 mm) monitoring survey data has been
collected over the Ensham underground workings. This data indicates that underground mining has
been associated with surface movements less than 10 mm, which is within the accuracy of the survey
monitoring and validates subsidence predictions.
It is anticipated that prior to mining in Zones 2 and 3, more data of the natural surface movement will
allow interpretation to determine any subsidence movement component. This data will be reviewed
in conjunction with rainfall records and also the location of underground mining, to provide some
guidance on the proportion of movement due to both mining induced subsidence and also the
seasonal variation in ground levels due to changes in moisture content. The type of soil should also
be referenced and recorded when interpreting the measured subsidence. This will allow an
assessment of soil type and measured subsidence levels.
Nine monitoring stations will be installed in Zones 2 and 3. Three of the stations will be used as a
control and will be located within an area which will not be subject to mining as discussed in Section
4.2.
It is considered that LIDAR surveys will still be applicable in assessing ground movements over larger
areas above predicted subsidence levels.
This monitoring (LIDAR and RTK) should confirm the subsidence predictions and any significant
changes in subsidence will trigger a review of the relevant impact assessments and associated
mitigation and management measures as discussed further in Section 4.8.
This review will also provide additional calibration data for any future subsidence predictions and
assessments of subsidence effects.
A subsidence monitoring report will also be produced every two years and monitoring of subsidence
impacts will be continued after the completion of mining:
• For five years or
• Until the surrender of the mining lease, or
• A suitably qualified and experienced person produces a report confirming a lesser
monitoring period is appropriate.
EIMP. SUBSIDENCE MANAGEMENT PLAN
Document Uncontrolled when Printed. Refer to SHMS Intranet for Controlled Version. Page 28 of
35
UNDERGROUND SURVEYING
As well as the surface monitoring, underground surveying of the completed mined roadways and pillar
dimensions is carried out. The FoS and width: height ratio of the as-mined pillars can be calculated
and checked against the design values.
These values can be referenced when reviewing the subsidence predictions.
SURFACE INSPECTIONS
Detailed surface inspections will be carried out on areas that have been identified through Lidar or
fixed GPS monitoring as having triggered an investigation as discussed in Section 4.7.
Any underground crossings under the Nogoa river within Zone 2 will be subject to an annual inspection
of the bed and banks adjacent to the crossing to identify any visible subsidence as a result of mining
operations that may impede on fish passage.
GROUNDWATER MONITORING
Ensham Mine’s existing groundwater monitoring bore network is extensive and allows for the
compilation of groundwater data from the Quaternary (alluvium), Triassic age sediments, Rewan
Group, and Rangal Coal Measures (Figure 4-10). The existing groundwater monitoring plan for the
current Ensham includes baseline, operations and post closure.
Ensham Mine proposes to maintain the current monitoring network and frequency with new
monitoring bores to be added as proposed by the Groundwater Management and Monitoring
Program defined in EA Condition C47. The location of existing monitoring bores along with the trigger
levels in the EA are sufficient to require an investigation to be undertaken.
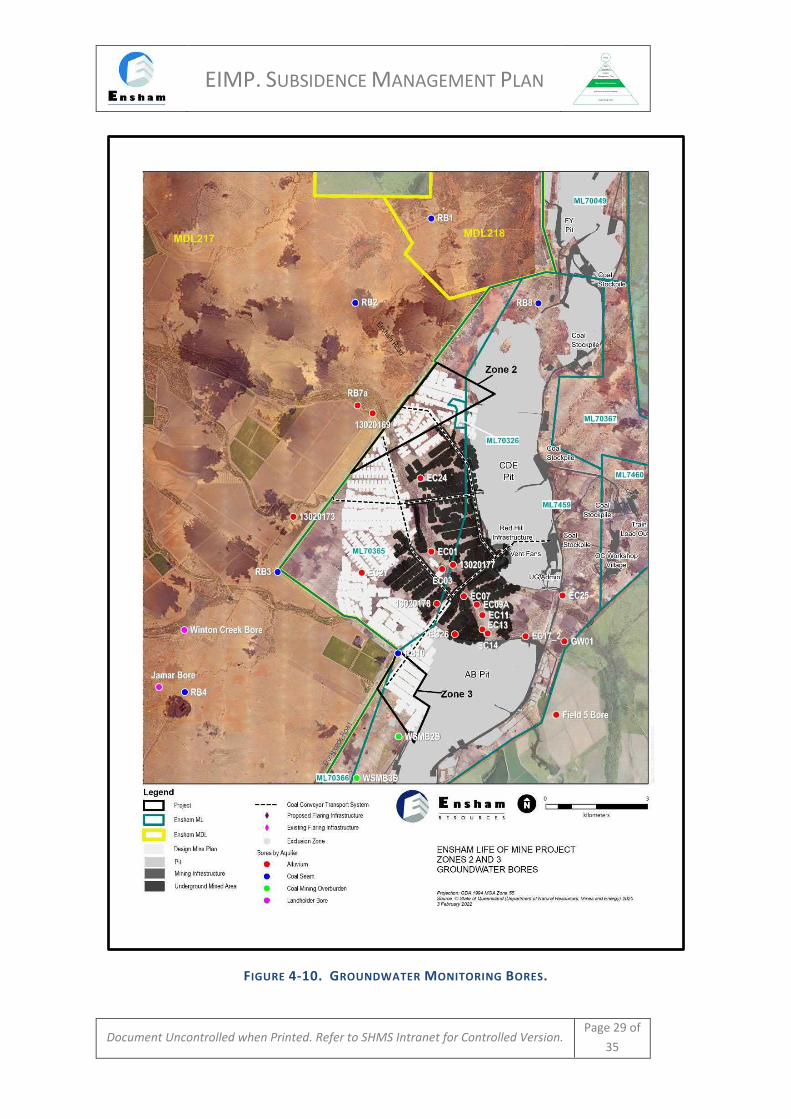
EIMP. SUBSIDENCE MANAGEMENT PLAN
Document Uncontrolled when Printed. Refer to SHMS Intranet for Controlled Version. Page 29 of
35
FIGURE 4-10. GROUNDWATER MONITORING BORES.
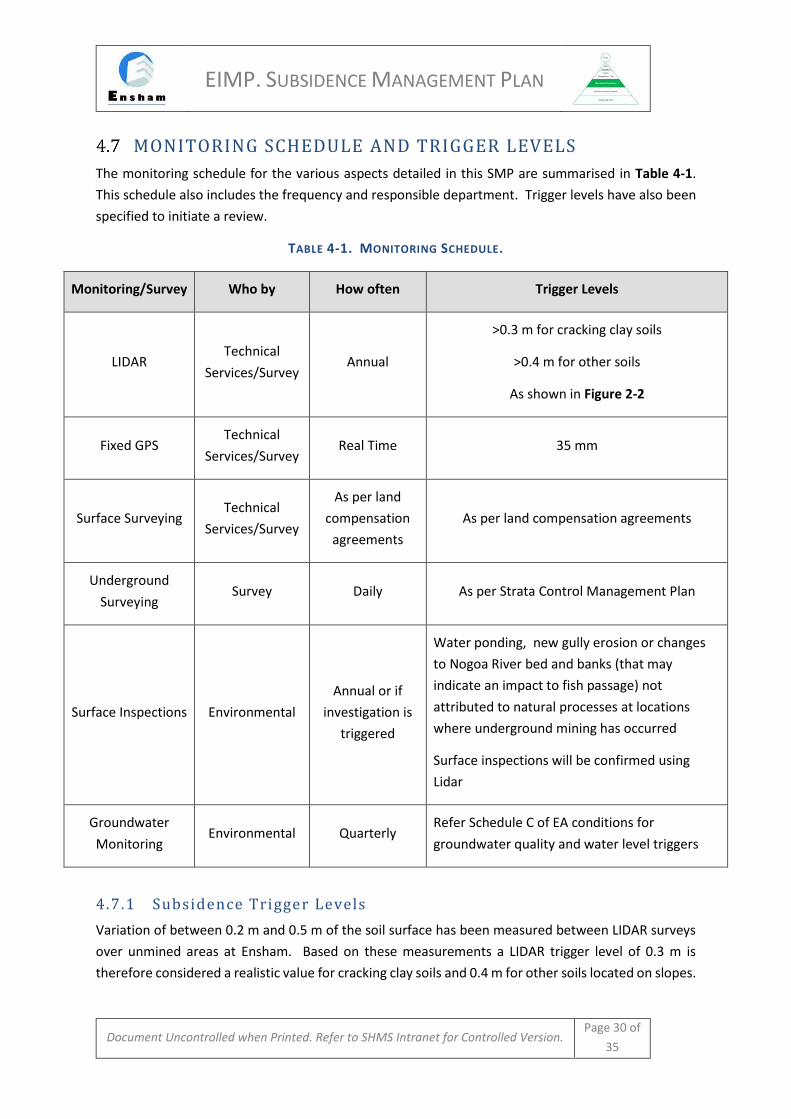
EIMP. SUBSIDENCE MANAGEMENT PLAN
Document Uncontrolled when Printed. Refer to SHMS Intranet for Controlled Version. Page 30 of
35
MONITORING SCHEDULE AND TRIGGER LEVELS
The monitoring schedule for the various aspects detailed in this SMP are summarised in Table 4-1.
This schedule also includes the frequency and responsible department. Trigger levels have also been
specified to initiate a review.
TABLE 4-1. MONITORING SCHEDULE.
Monitoring/Survey Who by How often Trigger Levels
LIDAR Technical
Services/Survey Annual
>0.3 m for cracking clay soils
>0.4 m for other soils
As shown in Figure 2-2
Fixed GPS Technical
Services/Survey Real Time 35 mm
Surface Surveying Technical
Services/Survey
As per land
compensation
agreements
As per land compensation agreements
Underground
Surveying Survey Daily As per Strata Control Management Plan
Surface Inspections Environmental
Annual or if
investigation is
triggered
Water ponding, new gully erosion or changes
to Nogoa River bed and banks (that may
indicate an impact to fish passage) not
attributed to natural processes at locations
where underground mining has occurred
Surface inspections will be confirmed using
Lidar
Groundwater
Monitoring Environmental Quarterly
Refer Schedule C of EA conditions for
groundwater quality and water level triggers
4.7.1 Subsidence Trigger Levels
Variation of between 0.2 m and 0.5 m of the soil surface has been measured between LIDAR surveys
over unmined areas at Ensham. Based on these measurements a LIDAR trigger level of 0.3 m is
therefore considered a realistic value for cracking clay soils and 0.4 m for other soils located on slopes.
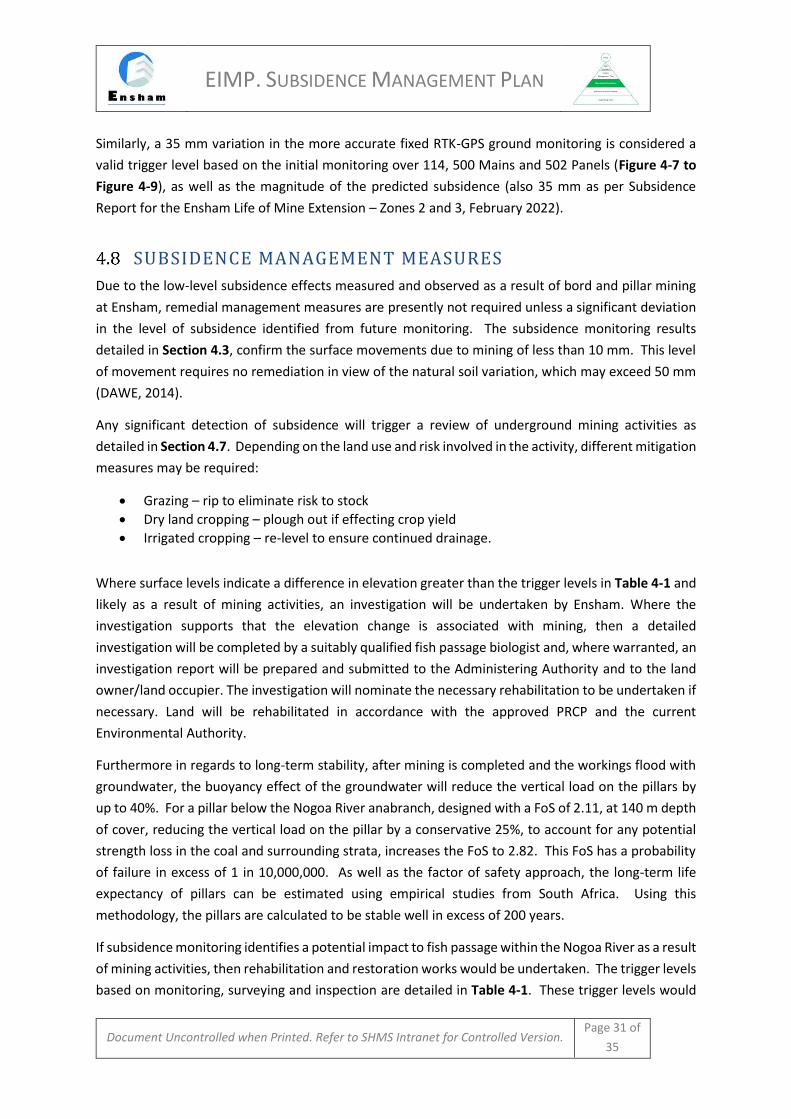
EIMP. SUBSIDENCE MANAGEMENT PLAN
Document Uncontrolled when Printed. Refer to SHMS Intranet for Controlled Version. Page 31 of
35
Similarly, a 35 mm variation in the more accurate fixed RTK-GPS ground monitoring is considered a
valid trigger level based on the initial monitoring over 114, 500 Mains and 502 Panels (Figure 4-7 to
Figure 4-9), as well as the magnitude of the predicted subsidence (also 35 mm as per Subsidence
Report for the Ensham Life of Mine Extension – Zones 2 and 3, February 2022).
SUBSIDENCE MANAGEMENT MEASURES
Due to the low-level subsidence effects measured and observed as a result of bord and pillar mining
at Ensham, remedial management measures are presently not required unless a significant deviation
in the level of subsidence identified from future monitoring. The subsidence monitoring results
detailed in Section 4.3, confirm the surface movements due to mining of less than 10 mm. This level
of movement requires no remediation in view of the natural soil variation, which may exceed 50 mm
(DAWE, 2014).
Any significant detection of subsidence will trigger a review of underground mining activities as
detailed in Section 4.7. Depending on the land use and risk involved in the activity, different mitigation
measures may be required:
• Grazing – rip to eliminate risk to stock
• Dry land cropping – plough out if effecting crop yield
• Irrigated cropping – re-level to ensure continued drainage.
Where surface levels indicate a difference in elevation greater than the trigger levels in Table 4-1 and
likely as a result of mining activities, an investigation will be undertaken by Ensham. Where the
investigation supports that the elevation change is associated with mining, then a detailed
investigation will be completed by a suitably qualified fish passage biologist and, where warranted, an
investigation report will be prepared and submitted to the Administering Authority and to the land
owner/land occupier. The investigation will nominate the necessary rehabilitation to be undertaken if
necessary. Land will be rehabilitated in accordance with the approved PRCP and the current
Environmental Authority.
Furthermore in regards to long-term stability, after mining is completed and the workings flood with
groundwater, the buoyancy effect of the groundwater will reduce the vertical load on the pillars by
up to 40%. For a pillar below the Nogoa River anabranch, designed with a FoS of 2.11, at 140 m depth
of cover, reducing the vertical load on the pillar by a conservative 25%, to account for any potential
strength loss in the coal and surrounding strata, increases the FoS to 2.82. This FoS has a probability
of failure in excess of 1 in 10,000,000. As well as the factor of safety approach, the long-term life
expectancy of pillars can be estimated using empirical studies from South Africa. Using this
methodology, the pillars are calculated to be stable well in excess of 200 years.
If subsidence monitoring identifies a potential impact to fish passage within the Nogoa River as a result
of mining activities, then rehabilitation and restoration works would be undertaken. The trigger levels
based on monitoring, surveying and inspection are detailed in Table 4-1. These trigger levels would
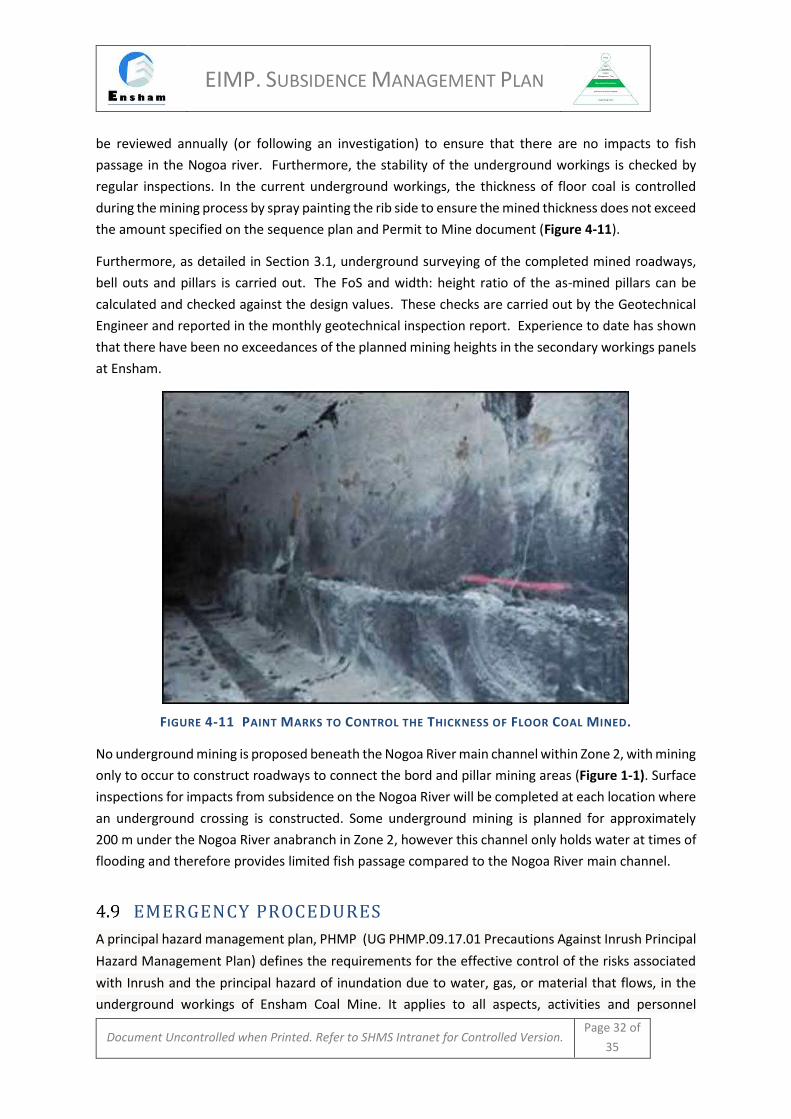
EIMP. SUBSIDENCE MANAGEMENT PLAN
Document Uncontrolled when Printed. Refer to SHMS Intranet for Controlled Version. Page 32 of
35
be reviewed annually (or following an investigation) to ensure that there are no impacts to fish
passage in the Nogoa river. Furthermore, the stability of the underground workings is checked by
regular inspections. In the current underground workings, the thickness of floor coal is controlled
during the mining process by spray painting the rib side to ensure the mined thickness does not exceed
the amount specified on the sequence plan and Permit to Mine document (Figure 4-11).
Furthermore, as detailed in Section 3.1, underground surveying of the completed mined roadways,
bell outs and pillars is carried out. The FoS and width: height ratio of the as-mined pillars can be
calculated and checked against the design values. These checks are carried out by the Geotechnical
Engineer and reported in the monthly geotechnical inspection report. Experience to date has shown
that there have been no exceedances of the planned mining heights in the secondary workings panels
at Ensham.
FIGURE 4-11 PAINT MARKS TO CONTROL THE THICKNESS OF FLOOR COAL MINED.
No underground mining is proposed beneath the Nogoa River main channel within Zone 2, with mining
only to occur to construct roadways to connect the bord and pillar mining areas (Figure 1-1). Surface
inspections for impacts from subsidence on the Nogoa River will be completed at each location where
an underground crossing is constructed. Some underground mining is planned for approximately
200 m under the Nogoa River anabranch in Zone 2, however this channel only holds water at times of
flooding and therefore provides limited fish passage compared to the Nogoa River main channel.
EMERGENCY PROCEDURES
A principal hazard management plan, PHMP (UG PHMP.09.17.01 Precautions Against Inrush Principal
Hazard Management Plan) defines the requirements for the effective control of the risks associated
with Inrush and the principal hazard of inundation due to water, gas, or material that flows, in the
underground workings of Ensham Coal Mine. It applies to all aspects, activities and personnel
EIMP. SUBSIDENCE MANAGEMENT PLAN
Document Uncontrolled when Printed. Refer to SHMS Intranet for Controlled Version. Page 33 of
35
associated with underground coal mining at Ensham Resources Pty Ltd. The objective is to identify
areas where Inrush or inundation could occur and to prevent such occurrences. It also provides for
the requirements of the Coal Mining Safety and Health Regulation 2017 (CMSHR) Sections 292, 293,
294, 295. The management plan is underpinned by Risk Assessment (RA.BT014 Inrush into
underground workings) and Trigger Action Response Plan, TARP (UG TARP.09.17.01-01 Potential for
Inrush Underground TARP).
LEGAL COMPLIANCE AND REFERENCES TABLE 5-1. REFERENCES.
Legislation /
Recognized
Standards
• Environmental Authority EPML00732813
• Environmental Protection Biodiversity Conservation Act 1999.
• Water Act 2000
TERMS AND ABBREVIATIONS
ABBREVIATION AND DESCRIPTION
TABLE 6-1. TERMS.
Abbreviation Description
EA Environmental Authority
EPBC Act Environment Protection and Biodiversity Protection Act 1999 (Commonwealth).
GM General Manager
GPS Global Positioning System
HSE Health, Safety and Environment
LIDAR Light Detection And Ranging
PHMP Principal Hazard Management Plan
RTK Real Time Kinematic
SSE Site Senior Executive
TARP Trigger Action Response Plan
EIMP. SUBSIDENCE MANAGEMENT PLAN
Document Uncontrolled when Printed. Refer to SHMS Intranet for Controlled Version. Page 34 of
35
DOCUMENT PREPARATION This SMP has been prepared by Gordon Geotechniques Pty Ltd (GGPL), in conjunction with Ensham
technical and environmental personnel, and peer reviewed by Mine Advice Pty Ltd. The SMP has been
based on the Subsidence Report prepared by Gordon Geotechniques in January 2022, and has been
peer reviewed by Mine Advice in January 2022.
REVIEW HISTORY
This Subsidence Monitoring Plan will be subject to review annually or under the following conditions
due to:
• Change to licence conditions and/or reporting requirements.
• Significant change to current mine plan/operations.
• An investigation report recommendation.
TABLE 8-1. REVIEW HISTORY.
Date of review Revision
Number
Trigger for review New revision
Number
8/2/2022 1 Requirement of EIS assessment report and EA
Amendment – Zones 2 and 3 subsidence technical
report
2
ROLES AND RESPONSIBILITIES Survey Section
• Carry out monitoring – fixed monitor and LIDAR.
• Prepare monitoring data.
• Ensure compliance of the dimensions of the underground pillars and roadways.
Environmental Section
• Surface inspections.
• Monitor creeks/rivers/groundwater.
• Liaise with landowners.
Technical Services Section
• Underground inspections.
• Plan subsidence monitoring requirements.
• Prepare subsidence monitoring report

EIMP. SUBSIDENCE MANAGEMENT PLAN
Document Uncontrolled when Printed. Refer to SHMS Intranet for Controlled Version. Page 35 of
35
• Review and reconcile subsidence monitoring data.
• Facilitate review if trigger levels are exceeded.
• Liaise with landowners.