Redalyc.Acoustic emission-based early fault detection in ...
7
Ingeniería e Investigación ISSN: 0120-5609 [email protected] Universidad Nacional de Colombia Colombia Usgame Sandoval, H. M.; Pedraza Ramirez, C. A.; Quiroga Méndez, J. E. Acoustic emission-based early fault detection in tapered roller bearings Ingeniería e Investigación, vol. 33, núm. 3, septiembre-diciembre, 2013, pp. 5-10 Universidad Nacional de Colombia Bogotá, Colombia Available in: http://www.redalyc.org/articulo.oa?id=64330695002 How to cite Complete issue More information about this article Journal's homepage in redalyc.org Scientific Information System Network of Scientific Journals from Latin America, the Caribbean, Spain and Portugal Non-profit academic project, developed under the open access initiative
-
Upload
khangminh22 -
Category
Documents
-
view
5 -
download
0
Transcript of Redalyc.Acoustic emission-based early fault detection in ...
Ingeniería e Investigación
ISSN: 0120-5609
Universidad Nacional de Colombia
Colombia
Usgame Sandoval, H. M.; Pedraza Ramirez, C. A.; Quiroga Méndez, J. E.
Acoustic emission-based early fault detection in tapered roller bearings
Ingeniería e Investigación, vol. 33, núm. 3, septiembre-diciembre, 2013, pp. 5-10
Universidad Nacional de Colombia
Bogotá, Colombia
Available in: http://www.redalyc.org/articulo.oa?id=64330695002
How to cite
Complete issue
More information about this article
Journal's homepage in redalyc.org
Scientific Information System
Network of Scientific Journals from Latin America, the Caribbean, Spain and Portugal
Non-profit academic project, developed under the open access initiative
INGENIERÍA E INVESTIGACIÓN VOL. 33 No. 3, DECEMBER - 2013 (5-10)
5
Acoustic emission-based early fault detection in tapered
roller bearings
Detección de fallas de rodamientos cónicos usando emisiones acústicas
H. M. Usgame Sandoval1, C. A. Pedraza Ramirez2 and J. E. Quiroga Méndez3
ABSTRACT
This paper proposes an acoustic emissions-based method for monitoring tapered roller bearings. This method monitors tracking time-
based fault indicators (i.e. RMS, peak value, ring-down count and kurtosis) obtained using the AE signal. Experiments were carried out
on a dedicated test bench for different levels of tapered roller bearing outer and inner race defect severity. Although the fault indi-
cators studied could not discriminate between outer and inner raceway defects, the experimental results highlighted the proposed
indicators’ tapered roller bearing fault detection and fault severity assessment ability (i.e. peak value, RMS and ring-down count).
Keywords: acoustic emission, bearing fault detection, bearing monitoring.
RESUMEN
En este artículo se propone el uso de las emisiones acústicas (EA) para el monitoreo de rodamientos cónicos. Este monitoreo se realiza
a través del seguimiento de los indicadores de falla: RMS, valor pico, ring-downcount y curtosis, los cuales son obtenidos a partir de
la caracterización de la señal de EA en dominio del tiempo. La experimentación se realiza en un banco dedicado para este tipo de
pruebas, en el cual, se experimenta con los rodamientos cónicos bajo distintos niveles de severidad de falla en la pista externa e
interna. Aunque no es posible distinguir claramente las fallas en la pista interna y externa usando los indicadores propuestos, algunos
resultados experimentales mostraron que el valor pico, el RMS y el conteo de picos de la señal de emisiones acústicas, permiten
detectar y estimar la severidad de la falla en rodamientos cónicos.
Palabras clave: emisiones acústicas, detección de fallas en rodamientos, monitoreo de rodamientos.
Received: February 29th 2012
Accepted: October 2th 2013
Introduction1 23
High operational reliability is expected in productive systems to
satisfy production requirements. Ideally, any machine’s abnormal
functioning must be detected during its early stages to successfully
avoid disturbances, failures, breakdowns and unplanned shut-
downs. Well-developed condition monitoring techniques enable
monitoring any system’s actual condition; they allow maintenance
resources to be prioritised and optimised for obtaining the maxi-
mum useful life for each physical asset before taking it out of ser-
vice. A condition monitoring system is usually able to determine a
system’s current state by using information processed online re-
garding vibration, stator currents, temperature, etc.
The trend towards increasing power, complexity and efficiency re-
garding rotating machinery has limited rolling element design and
early fault identification as requirements for ensuring reliable op-
eration. Mass imbalance, misalignment and overload are common
problems concerning rotating machinery, thereby reducing bear-
ing service life. Different methods have been used for detecting
1 Hector M. Usgame Sandoval. Mechanical Engineer, Universidad Industrial de San-
tander, Colombia. E-mail: [email protected] 2 Camilo A. Pedraza Ramírez. Mechanical Engineer, Universidad Industrial de Santan-
der, Colombia. E-mail: [email protected] 3 Jabid Quiroga. Mechanical Engineer, Universidad Industrial de Santander, Colom-
and diagnosing bearing defects; current techniques can be classified
as vibration or acoustic measurements. Vibration monitoring of
bearings is probably the most established diagnostic technique for
rotating machinery. Vibration is predominantly analysed in the fre-
quency domain; this provides enough information for estimating
fault location (i.e. inner race, outer race, rolling element and re-
tainer) but is not suitable for detecting incipient faults. Acoustic
emission (AE) is increasingly being used as a complementary tech-
nique in the time domain for bearing diagnosis; however, limita-
tions in processing, interpreting and classifying the acquired data
have limited its successful application and extensive use. The ad-
vantage of AE monitoring over vibration monitoring is that the
former can detect the growth of subsurface cracks, whereas the
latter can only detect defects when they appear on the surface.
Eftekharnejad et al., (2011) demonstrated that AE was more sen-
sitive in detecting incipient damage than vibration. It should be
noted that the energy released to the bearings by neighbouring
components is below 50 kHz vibrational frequency. This frequency
range often masks the vibrational energy released by a defective
rolling element bearing. Such frequency range does not affect AE
bia. MSc in Mechanical Engineering, Florida State University, USA. Affiliation: Uni-
versidad Industrial de Santander, Colombia. E-mail: [email protected] How to cite: Usgame, H. M.., Pedraza, C. A., Quiroga, J., Acoustic emission-
based early fault detection in tapered roller bearings., Ingeniería e Investigación,
Vol. 33, No. 3, December 2013, pp. 5 – 10.
ACOUSTIC EMISSION-BASED EARLY FAULT DETECTION IN TAPERED ROLLER BEARINGS
INGENIERÍA E INVESTIGACIÓN VOL. 33 No. 3, DECEMBER - 2013 (5-10) 6
monitoring because the AE frequency emitted by a faulty bearing
is in a higher frequency range (Tandon and Choudhury, 1999).
Tandon and Nakra (1996) presented a detailed review of vibration
and acoustic methods, such as vibration measurement in time and
frequency domains, sound measurements, the shock pulse method
and the AE technique for monitoring rolling bearing condition.
Several studies have investigated defective bearings’ AE response.
Bagnoli et al., (1988) and McFadden and Smith (1984) dealt with
AE monitoring of rolling bearing defects. Yoshioka and Fujiwara
(1982, 1984) have shown that AE parameters can detect defects
before they appear in the vibration acceleration range and can also
detect possible sources of AE generation during a thrust ball bear-
ing fatigue life test. Experiments have shown that analysis of acous-
tic emissions captured in bearings was able to detect defects in the form of a fine scratch on the inner race of angular contact ball
bearings axially loaded at low speeds (McFadden and Smith, 1984).
Tandon and Nakra (1990) have demonstrated the usefulness of
some AE parameters (such as peak amplitude and count) for de-
tecting defects in radially loaded ball bearings at low and normal
speeds. Abdullah M et al., (2006) have reported using AE for iden-
tifying the presence and size of a defect on a radially loaded bear-
ing. This paper showed that the fundamental source of AE in
seeded defect tests was due to material protruding above mean
surface roughness.
The present work used peak value, root mean square (RMS), kur-
tosis, ring-down count for detecting and evaluating the level of de-
fective bearing severity via AE signals. Experimental results showed that some of the aforementioned indicators provided in-
formation for the early detection of the onset of faults. The results
also indicated a direct relationship between signal features and de-
fect size, thereby providing a diagnostic tool which can be used for
effectively quantifying a detected defect.
Using AE for monitoring bearing condition
AE involves external stimuli (such as mechanical loading, defect
formation and irreversible failure) in structural materials under
mechanical or thermal stress producing transient elastic waves.
These waves are generated by the rapid release of energy within a solid material, impacts and/or friction. Crack generation and
propagation are the main source of AE. AE sources act as focal
sources and irradiate high frequency energy in spherical waves.
Most AE emitted energy is observed at 100 kHz to 1 MHz fre-
quency. AE instrumentation consists of a transducer (usually pie-
zoelectric type), a preamplifier and a signal processing unit. The
most commonly measured AE parameters in the time domain are
ring-down count, events, energy and peak amplitude. Ring-down
count is the number of times a burst signal crosses the detection
threshold within a fixed period of time. An event consists of a
group of ring-down counts and represents a transient wave. Figure
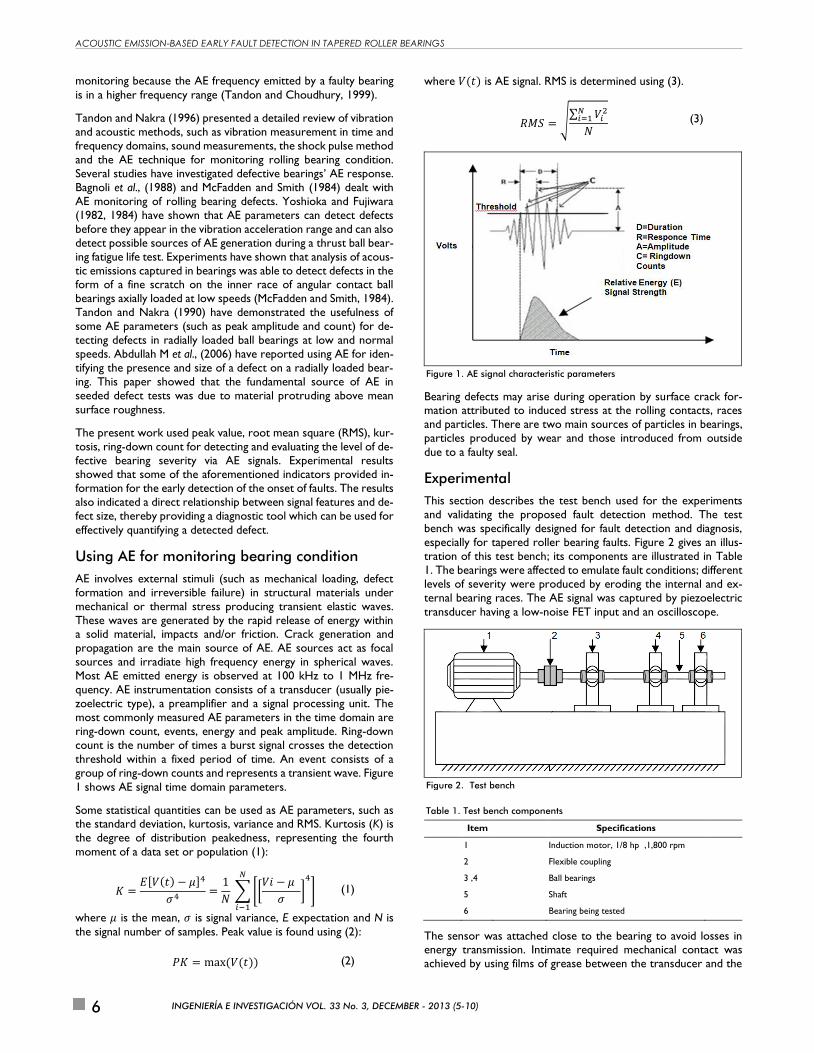
1 shows AE signal time domain parameters.
Some statistical quantities can be used as AE parameters, such as the standard deviation, kurtosis, variance and RMS. Kurtosis (K) is
the degree of distribution peakedness, representing the fourth
moment of a data set or population (1):
𝐾 =𝐸[𝑉(𝑡) − 𝜇]4
𝜎4 =1
𝑁 ∑ [[
𝑉𝑖 − 𝜇
𝜎]
4
]
𝑁
𝑖−1
(1)
where 𝜇 is the mean, 𝜎 is signal variance, E expectation and N is
the signal number of samples. Peak value is found using (2):
𝑃𝐾 = max (𝑉(𝑡)) (2)
where 𝑉(𝑡) is AE signal. RMS is determined using (3).
𝑅𝑀𝑆 = √∑ 𝑉𝑖
2𝑁𝑖=1
𝑁 (3)
Figure 1. AE signal characteristic parameters
Bearing defects may arise during operation by surface crack for-mation attributed to induced stress at the rolling contacts, races
and particles. There are two main sources of particles in bearings,
particles produced by wear and those introduced from outside
due to a faulty seal.
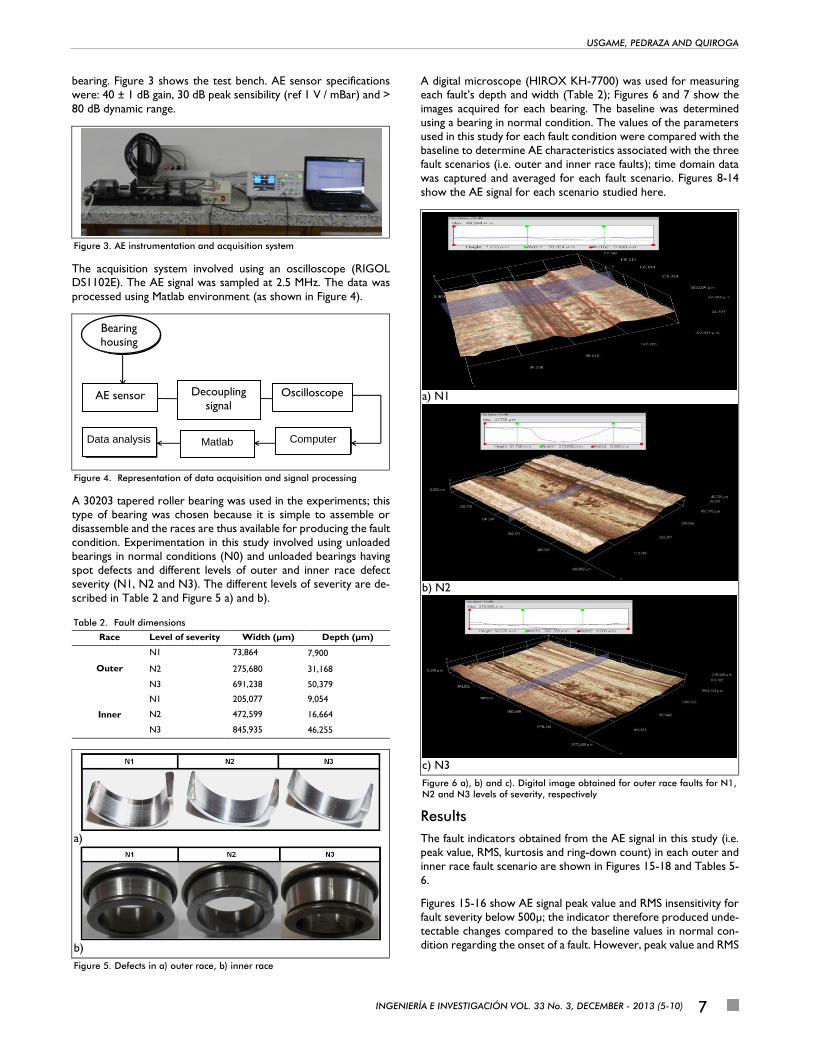
Experimental
This section describes the test bench used for the experiments
and validating the proposed fault detection method. The test
bench was specifically designed for fault detection and diagnosis,
especially for tapered roller bearing faults. Figure 2 gives an illus-
tration of this test bench; its components are illustrated in Table
1. The bearings were affected to emulate fault conditions; different
levels of severity were produced by eroding the internal and ex-
ternal bearing races. The AE signal was captured by piezoelectric
transducer having a low-noise FET input and an oscilloscope.
Figure 2. Test bench
Table 1. Test bench components
Item Specifications
1 Induction motor, 1/8 hp ,1,800 rpm
2 Flexible coupling
3 ,4 Ball bearings
5 Shaft
6 Bearing being tested
The sensor was attached close to the bearing to avoid losses in energy transmission. Intimate required mechanical contact was
achieved by using films of grease between the transducer and the
USGAME, PEDRAZA AND QUIROGA
INGENIERÍA E INVESTIGACIÓN VOL. 33 No. 3, DECEMBER - 2013 (5-10) 7
bearing. Figure 3 shows the test bench. AE sensor specifications
were: 40 ± 1 dB gain, 30 dB peak sensibility (ref 1 V / mBar) and >
80 dB dynamic range.
Figure 3. AE instrumentation and acquisition system
The acquisition system involved using an oscilloscope (RIGOL DS1102E). The AE signal was sampled at 2.5 MHz. The data was
processed using Matlab environment (as shown in Figure 4).
Figure 4. Representation of data acquisition and signal processing
A 30203 tapered roller bearing was used in the experiments; this type of bearing was chosen because it is simple to assemble or
disassemble and the races are thus available for producing the fault
condition. Experimentation in this study involved using unloaded
bearings in normal conditions (N0) and unloaded bearings having
spot defects and different levels of outer and inner race defect
severity (N1, N2 and N3). The different levels of severity are de-
scribed in Table 2 and Figure 5 a) and b).
Table 2. Fault dimensions
Race Level of severity Width (µm) Depth (µm)
Outer
N1 73,864 7,900
N2 275,680 31,168
N3 691,238 50,379
Inner
N1 205,077 9,054
N2 472,599 16,664
N3 845,935 46,255
a)
b)
Figure 5. Defects in a) outer race, b) inner race
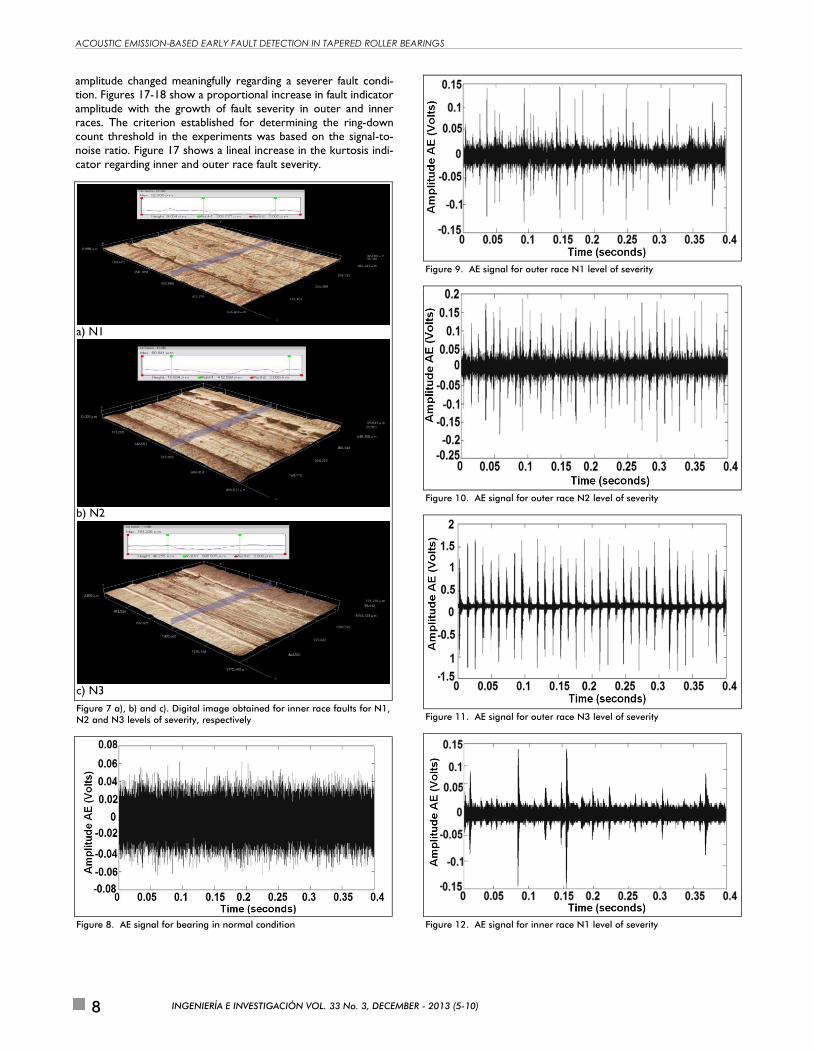
A digital microscope (HIROX KH-7700) was used for measuring each fault’s depth and width (Table 2); Figures 6 and 7 show the
images acquired for each bearing. The baseline was determined
using a bearing in normal condition. The values of the parameters
used in this study for each fault condition were compared with the
baseline to determine AE characteristics associated with the three
fault scenarios (i.e. outer and inner race faults); time domain data
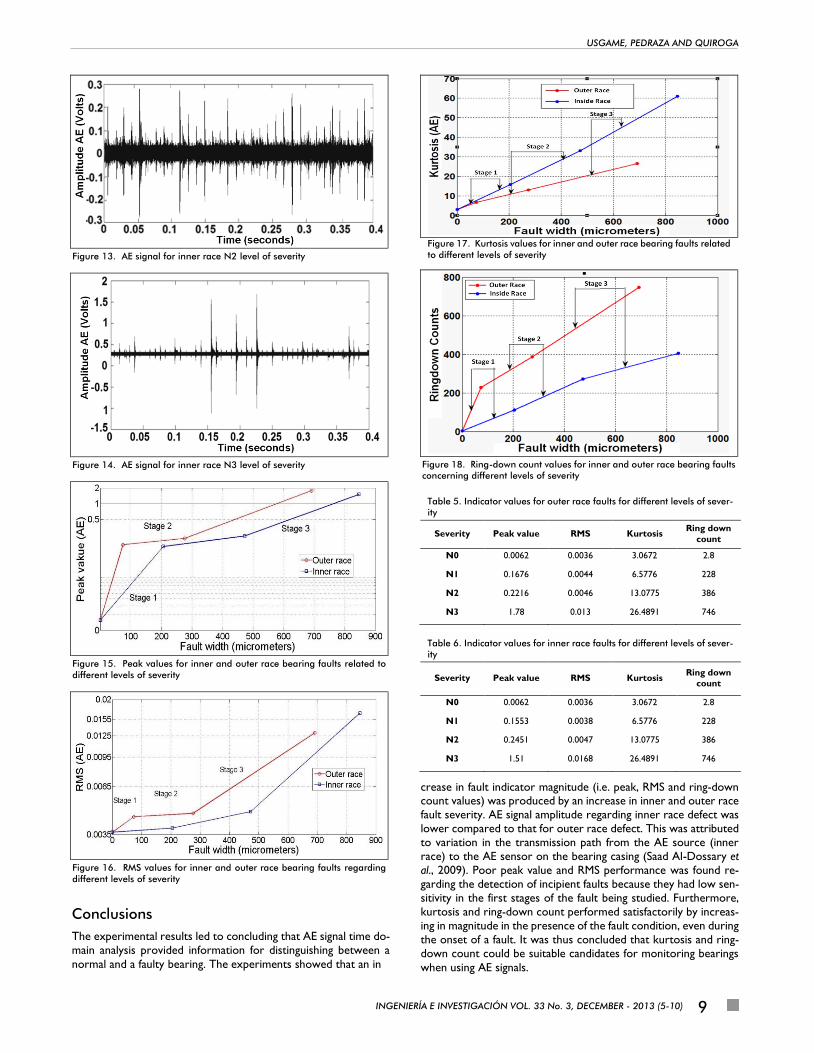
was captured and averaged for each fault scenario. Figures 8-14
show the AE signal for each scenario studied here.
a) N1
b) N2
c) N3
Figure 6 a), b) and c). Digital image obtained for outer race faults for N1, N2 and N3 levels of severity, respectively
Results
The fault indicators obtained from the AE signal in this study (i.e.
peak value, RMS, kurtosis and ring-down count) in each outer and
inner race fault scenario are shown in Figures 15-18 and Tables 5-
6.
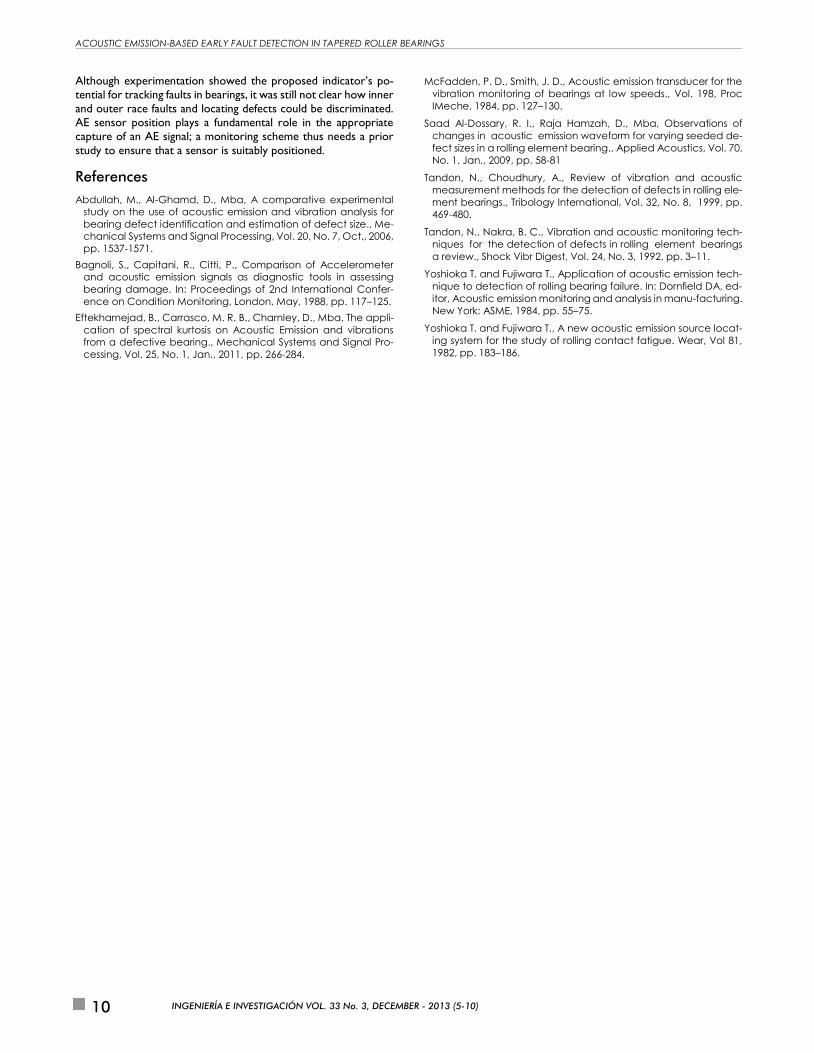
Figures 15-16 show AE signal peak value and RMS insensitivity for
fault severity below 500µ; the indicator therefore produced unde-
tectable changes compared to the baseline values in normal con-
dition regarding the onset of a fault. However, peak value and RMS
AE sensor Decoupling
signal Oscilloscope
Data analysis Matlab Computer
Bearing
housing
ACOUSTIC EMISSION-BASED EARLY FAULT DETECTION IN TAPERED ROLLER BEARINGS
INGENIERÍA E INVESTIGACIÓN VOL. 33 No. 3, DECEMBER - 2013 (5-10) 8
amplitude changed meaningfully regarding a severer fault condi-
tion. Figures 17-18 show a proportional increase in fault indicator
amplitude with the growth of fault severity in outer and inner
races. The criterion established for determining the ring-down
count threshold in the experiments was based on the signal-to-
noise ratio. Figure 17 shows a lineal increase in the kurtosis indi-
cator regarding inner and outer race fault severity.
a) N1
b) N2
c) N3
Figure 7 a), b) and c). Digital image obtained for inner race faults for N1, N2 and N3 levels of severity, respectively
Figure 8. AE signal for bearing in normal condition
Figure 9. AE signal for outer race N1 level of severity
Figure 10. AE signal for outer race N2 level of severity
Figure 11. AE signal for outer race N3 level of severity
Figure 12. AE signal for inner race N1 level of severity
USGAME, PEDRAZA AND QUIROGA
INGENIERÍA E INVESTIGACIÓN VOL. 33 No. 3, DECEMBER - 2013 (5-10) 9
Figure 13. AE signal for inner race N2 level of severity
Figure 14. AE signal for inner race N3 level of severity
Figure 15. Peak values for inner and outer race bearing faults related to different levels of severity
Figure 16. RMS values for inner and outer race bearing faults regarding different levels of severity
Conclusions
The experimental results led to concluding that AE signal time do-
main analysis provided information for distinguishing between a
normal and a faulty bearing. The experiments showed that an in
Figure 17. Kurtosis values for inner and outer race bearing faults related to different levels of severity
Figure 18. Ring-down count values for inner and outer race bearing faults concerning different levels of severity
Table 5. Indicator values for outer race faults for different levels of sever-ity
Severity Peak value RMS Kurtosis Ring down
count
N0 0.0062 0.0036 3.0672 2.8
N1 0.1676 0.0044 6.5776 228
N2 0.2216 0.0046 13.0775 386
N3 1.78 0.013 26.4891 746
Table 6. Indicator values for inner race faults for different levels of sever-ity
Severity Peak value RMS Kurtosis Ring down
count
N0 0.0062 0.0036 3.0672 2.8
N1 0.1553 0.0038 6.5776 228
N2 0.2451 0.0047 13.0775 386
N3 1.51 0.0168 26.4891 746
crease in fault indicator magnitude (i.e. peak, RMS and ring-down count values) was produced by an increase in inner and outer race
fault severity. AE signal amplitude regarding inner race defect was
lower compared to that for outer race defect. This was attributed
to variation in the transmission path from the AE source (inner
race) to the AE sensor on the bearing casing (Saad Al-Dossary et
al., 2009). Poor peak value and RMS performance was found re-
garding the detection of incipient faults because they had low sen-
sitivity in the first stages of the fault being studied. Furthermore,
kurtosis and ring-down count performed satisfactorily by increas-
ing in magnitude in the presence of the fault condition, even during
the onset of a fault. It was thus concluded that kurtosis and ring-
down count could be suitable candidates for monitoring bearings
when using AE signals.
ACOUSTIC EMISSION-BASED EARLY FAULT DETECTION IN TAPERED ROLLER BEARINGS
INGENIERÍA E INVESTIGACIÓN VOL. 33 No. 3, DECEMBER - 2013 (5-10) 10
Although experimentation showed the proposed indicator’s po-
tential for tracking faults in bearings, it was still not clear how inner
and outer race faults and locating defects could be discriminated.
AE sensor position plays a fundamental role in the appropriate
capture of an AE signal; a monitoring scheme thus needs a prior
study to ensure that a sensor is suitably positioned.
References
Abdullah, M., Al-Ghamd, D., Mba, A comparative experimental
study on the use of acoustic emission and vibration analysis for
bearing defect identification and estimation of defect size., Me-
chanical Systems and Signal Processing, Vol. 20, No. 7, Oct., 2006,
pp. 1537-1571.
Bagnoli, S., Capitani, R., Citti, P., Comparison of Accelerometer
and acoustic emission signals as diagnostic tools in assessing
bearing damage. In: Proceedings of 2nd International Confer-
ence on Condition Monitoring, London, May, 1988, pp. 117–125.
Eftekharnejad, B., Carrasco, M. R. B., Charnley, D., Mba, The appli-
cation of spectral kurtosis on Acoustic Emission and vibrations
from a defective bearing., Mechanical Systems and Signal Pro-
cessing, Vol. 25, No. 1, Jan., 2011, pp. 266-284.
McFadden, P. D., Smith, J. D., Acoustic emission transducer for the
vibration monitoring of bearings at low speeds., Vol. 198, Proc
IMeche, 1984, pp. 127–130.
Saad Al-Dossary, R. I., Raja Hamzah, D., Mba, Observations of
changes in acoustic emission waveform for varying seeded de-
fect sizes in a rolling element bearing., Applied Acoustics, Vol. 70,
No. 1, Jan., 2009, pp. 58-81
Tandon, N., Choudhury, A., Review of vibration and acoustic
measurement methods for the detection of defects in rolling ele-
ment bearings., Tribology International, Vol. 32, No. 8, 1999, pp.
469-480.
Tandon, N., Nakra, B. C., Vibration and acoustic monitoring tech-
niques for the detection of defects in rolling element bearings
a review., Shock Vibr Digest, Vol. 24, No. 3, 1992, pp. 3–11.
Yoshioka T. and Fujiwara T., Application of acoustic emission tech-
nique to detection of rolling bearing failure. In: Dornfield DA, ed-
itor, Acoustic emission monitoring and analysis in manu-facturing.
New York: ASME, 1984, pp. 55–75.
Yoshioka T. and Fujiwara T., A new acoustic emission source locat-
ing system for the study of rolling contact fatigue. Wear, Vol 81,
1982, pp. 183–186.