REDACTED TETRA TECH EM INC - Records Collections
175
D SDMS US EPA Region V Imagery Insert Form Document ID: Some images in this document may be illegible or unavailable in SDMS. Please see reason(s) indicated below: Illegible due to bad source documents. Image(s) in SDMS is equivalent to hard copy. Specify Type of Document(s) / Comments: » Includes __ COLOR or X RESOLUTION variations. Unless otherwise noted, these pages are available in monochrome. The source document page(s) is more legible than the images. The original document is available for viewing at the Superfund Records Center. __________________ Specify Type of Documents) / Comments:___________________ ( TABLES (G-6) - EXPOSURE POINT CONCENTRATIONS D BBB ^ B8BBB8i i Baai . JBBjaaB ^ BBMIB . MBS .^ BS j 8 ^ BaBHBjBBBHBBBaBBBMB0 ^ HI J| Confidential Business Information (CBI). This document contains highly sensitive information. Due to confidentiality, materials with such information are not available in SDMS. You may contact the EPA Superfund Records Manager if you wish to view this document. Specify Type of Document(s) / Comments: ___ Unscannable Material: Oversized ___ or ___ Format. Due to certain scanning equipment capability limitations, the document page(s) is not available in SDMS. The original document is available for viewing at the Superfund Records center. Specify Type of Documents) / Comments: Document is available at the Records Center. Specify Type of Documents) / Comments: J Rev. 07/10/02 Pagel
-
Upload
khangminh22 -
Category
Documents
-
view
4 -
download
0
Transcript of REDACTED TETRA TECH EM INC - Records Collections

D
SDMS US EPA Region VImagery Insert Form
Document ID:
Some images in this document may be illegible or unavailable inSDMS. Please see reason(s) indicated below:
Illegible due to bad source documents. Image(s) in SDMS is equivalent to hard copy.
Specify Type of Document(s) / Comments:
»Includes __ COLOR or X RESOLUTION variations.Unless otherwise noted, these pages are available in monochrome. The source document page(s) is more legible than theimages. The original document is available for viewing at the Superfund Records Center.
__________________ Specify Type of Documents) / Comments: ___________________
( TABLES (G-6) - EXPOSURE POINT CONCENTRATIONS DBBB^B8BBB8iiBaai.JBBjaaB^BBMIB.MBS. BSj8^BaBHBjBBBHBBBaBBBMB0^HIJ|
Confidential Business Information (CBI).This document contains highly sensitive information. Due to confidentiality, materials with such information are not availablein SDMS. You may contact the EPA Superfund Records Manager if you wish to view this document.
Specify Type of Document(s) / Comments: ___
Unscannable Material:Oversized ___ or ___ Format.Due to certain scanning equipment capability limitations, the document page(s) is not available in SDMS. The original
document is available for viewing at the Superfund Records center.
Specify Type of Documents) / Comments:
Document is available at the Records Center.
Specify Type of Documents) / Comments:
J
Rev. 07/10/02
Pagel

0000009______ kVOLUME2of5
UNITEDlSTATESENVIRONMENTAI/PROTECTIONfAGENCY
.TO PROTECT HUMAN HEALTH AND SAFEGUARD THE NATURAL ENVIRONMENT.!'
'•>(*!
, Prepared forU.S. Environmental Protection Agency
Region 5Chicago, IL
_ _ throughU.S. Environmellblp lttion Agency
Region 6" las TX
f

ATTACHMENT
MDEQ COMMENTS ON DRAFT HHRA DATED MAY 9,2001
(Nine Sheets)

,vFNOLER Governor
INTERNET www cwq »IIM ""
RUSSELL J. HARWNO,
May 9, 2001
ni s^sr.r UIVISK.N
Ms. Terese VanDonselUnited States Environmental Protection AgencyRegion V77 West Jackson BoulevardChicago, Illinois 60604
Dear Ms. VanDonsel.Thank you for the opportunity to review the April 2001 Rockwell International DraftHuman Health Risk Assessment by Tetra Tech. In addition to my own comments, Ihave included comments from Mr. Jeff Crum, one of the Environmental ResponseDivision lexicologists,If you have any questions regarding these comments, please do not hesitate to contact
me.
Sincerely,
Mary B. Schafer, Project ManagerSuperfund SectionEnvironmental Response Division517-373-9832
Attachment
cc. Mr. David Kline, MDEQMr. Matt Williams, MDEQRockwell Files

Rockwell International HHRA Comments 4/01
Cover page- The United States Environmental Protection Agency Chicago andMichigan are all part of Region V not Region 6. Please correct the error in the notationson the cover page and anywhere else it may exist.
Page G-2-4 Section 2.2.1 ftrst paragraphPart 201 includes criteria. Please utilize the applicable Michigan Department ofEnvironmental Quality (MDEQ) criteria where appropriate. Mr. Matt Williams. MDEQ,has provided tables to assist in this activity. The MDEQ may be able to come up withadditional criteria if needed; please inquire if it becomes difficult to determine appropriatecriteria
Page Q-2-4 Section 2.2.1 third paragraphDetections of contaminants at levels above* the health based screening levels (MBSLs)should not be considered outliers without additional sampling to verify the scarcity of thecontaminants on site.
Page Q-2-5 Section 2.2.2 first paragraphThis paragraph states that the soils screening criteria were used for the. LNAPL. This isnot acceptable. The LNAPL is on the water table and discharges to the KalamazooRiver. The proper screening criteria would be the groundwater/surface water interface(OSI) criteria.
Page G-2-6 Section 2.2.2 third paragraphThe practice of using specific gravity and density values to get the LNAPLconcentrations is not a well-known practice. Please reference the source of thisderivation and expand the discussion to include areas in which this is commonly done.
PageG-2-5 Section 2.2.3 flrtrt paragraphIf a part 201 criterion is not available, provide the MDEQ with a list often the criteria canbe generated for individual cases. Also see the table provided byMatt Williams.
Page G-2-6 Section 2.2.3 second paragraphPlease explain why the polynuclear aromatic hydrocarbons were excluded, even thoughthey were regularly detected in soil.
Page Q-2-S Section 2.2.3 fourth paragraphPlease explain why the mercury blanks were contaminated. Additional samples may benecessary for useable data. If a sample comes back as a non-detect, then one half thedetection limit is'generally used not one half of the contract required detection list.Please utilize the recently provided screening levels and recalculate the percentage ofunacceptable data blanks, then a determination can be made about the usefulness ofthis data.
Page G-2-7 Section 2.2.4 first paragraphAs discussed in our conference call, please use the QSI criteria where available andresidential drinking water after that etc. per our discussion and provided table.

Page G-2-7 Section 2.2.4 second paragraphSome of the contaminants discussed here are likely breakdown products ofpolychtorinated biphenyls, or possibly chemicals used on site but not previouslyidentified in samples. The recent sampling events have revealed a lot of contaminationthat we were not aware of before. It is not acceptable to screen out contaminants at thisstage with limited data for decision making. We need to at least wait until all of theEarthtech Information is available before making decisions.
Page Q-2-7 Section 2.2.8 second paragraphUtilization of sample quantitation limits above HBSLs is not acceptable. Please utilizeMDEQ Part 201 criteria Instead.
Pane Q-2-9 Section 2.3.1 fifth paragraphSome of the contaminants that were excluded as chemical of potential concerns werepreviously thought to be site contaminants. The step of screening to more conservativecriteria should not be done prior to the completion of a final and approved remedialinvestigation document and really ought to wait until the feasibility study stage since thepurpose of risk assessment (RA) is to scrutinize all the risks and determine hazards.
Page G-2-> and 10 Section 2.3.1 fifth paragraphThe'background* concentrations referred to here are not all acceptable data points.Please provide acceptable background criteria prior to performing any additionalscreening and reacreen the data properly. Also, please refer to Part 201 criteria for OSIas discussed previously. Several of me sediment and surface water chemical ofpotential concerns are inappropriately excluded in this section. Please correct this error.
Papa Q-2-12 Section 2.3.1 11th **1M> paragraphIt is not acceptable to exclude any contaminants detected above HBSLs. Particularlywhen they have been detected above HBSLs in more than one media. Please correctthis error.
Page G-2-14 Sectton 2.3.1 Eaaential nutrients paragraph*All of the recommended dietary allowances should be scaled to the child exposure to beprotective of the children in each exposure scenario. There may be something else tobe concerned about that is causing all of the nutrients to be elevated to significantly.This should be looked into. This portion of the human health risk assessment is not veryclear. One almost has to do the calculations to make sense of the information in thissection. Please present it in a format that is more easily understood.
PageG-3-4 Section 3.2,1 bulletsPlease include a bullet to include the significant amount of unknown contamination nowunderstood to extend under a large part of the manufacturing building. Also, please adda bullet to include the green fluids discovered in Earthtech's investigative work.
Page Q-3-10 Adult and olt-alte residentsPlease modify the off-site designation'when referring to the residents across NorthStreet. The National Priority List defines the site by extent of contamination. A lessconfusing designation might be "off-property".

Page Q-3-11 RccreatlonaliatsFish data "for the river near this site may be easily found in any of the six informationrepositories for the Kalamazoo River Superfund site. This may be a useful too! to utilize
Page 0-5-5 Section S.2.1 first paragraphThe C&O railroad tracks are referred to in the second sentence. Please refer to thisarea as the former C&O railroad bed, since the tracks are no longer there.
Page 0-5-14 Section 6.2.2.2The area under and north of the former West Manufacturing building has not beenadequately defined prior to these calculations being performed. Please incorporate alladditional data that is available prior to the issuance of the record of decision for thissite. Also, the off-site residential area (background soil) is not dear. The residencesacross North Street from the property are now "on-sKe" as defined in the NCP. We maywant to use a more palatable term for the residents, but referring to it as 'off-she* is notacceptable. Also if this section applies to the residences across North Street from theproperty, then the utilization of these samples for background is not appropriate.
Page G-S-27 Section 6.4 second paragraphTFeTNAPL most definitely extends beneath the building. Why is the LNAPL notaddressed in the indoor air segment of this document? Please explain this exemption.
Pane Q-S.28 Section 6.5.1 .Scenario of the groundwatar for use as a drinking water source must be addressed inthe RA There is not currently any ordinance or deed restriction placed on the aquifer.There is also potential for the nearby municipal well to be contaminated by the narrowgravel layer from which it draws its water one half mHe away from the site. The layeralso runs under this site and is contaminated. This needs further investigation and alsoneeds to be addressed in the RA.
Page Q-a-2 Section 6.1 fifth paragraphThe previous investigative work was not complete enough to justify assumptions of achemical not being a site-contaminant based on that. There is potential for hcxavalenlchrome contamination at the site. It is not appropriate to screen out this possibility priorto the completion of the RA. The additional data gap work being performed by the statedistrict staff includes hex chrome. Please withhold making opinion statements about ituntil the data is back from the lab.
Paaa G-6-3 Section 6.2 second paragraphThe assessment' of only the parking lot attendant for exposure in the parking lot missesthe children at the fairgrounds. It is very common for children to run around barefoot,wade in the river, and for people to stay back at tailgatlng parties after fairground events.This exposure scenario has not been adequately addressed.
Table Q-2 PageJPlease modify this table. These samples are not acceptable for backgroundcalculations.

Table G-3Please perform additional investigation as to what would cause the chemistry to shift insuch a way as to make more of the nutrients soluble/mobile in the site groundwaterThese are unusually high concentrations of parameters that are not normally consideredto be a problem unless the concentrations are extremely elevated. This could beindicative of a chemistry-altering problem associated with the site. Otherwise, thesenutrients are still above the Part 201 criteria and need to be addressed
Table Q-4This table is not very useful without the detection limits or at least number of sampleswith the parameter detected In it. Please modify this table to incorporate this necessaryinformation.
Table G-A-1Please revise the screening levels in this table and specify which health-based criteriaare used.
Table G-A-2In the review of this document it has become a problem that there are no maps showingthe locations of the samples referenced in the text and tables. Please provide figures orone oversized map to show sample locations.
Table Q-A-4Please revise this table and any other text or tables in the document to properlyreference the samples that were taken as background. Only two samples werepotentla»y acceptable as background samples, the others belong with the rest of thesamples taken as site data.
Table Q-B-1Please correct the reference to background concentrations as discussed in thescreening levels conference call. Whatever background criteria are utilized, the sourceneeds to be properly referenced in each table.
Figure G-C-1The numbers and key are all wrong, Please correct this figure.
Page G-C-24Please include an exposure assessment for nearby residents during the constructionphase. This area does not seem to be well characterized.

MICHIGAN DEPARTMENT OF ENVIRONMENTAL QUALITY
INTEROFFICE COMMUNICATION
May 9, 2001
TO: Mary Schafer. Superfund Section, Environmental Response Division (ERD)
FROM: Jeffrey A. Crum, Toxicology Specialist, Toxicology Unit, ERD
SUBJECT: Rockwell International Corporation: Review of Draft Human Health RiskAssessment (HHRA)
I have completed a review of the above document prepared by Tetra Tech EM Inc. (TT). Theinformation and calculations presented in the HHRA are enormous. Given my current prioritiesand workload I was unable to conduct an in-depth detailed review that this amount of materialrequires. As a result, it is difficult for me to judge the effect that my comments would have onthe reported risk estimates for the numerous exposure scenarios evaluated. On projects of thismagnitude, and for all Superfund HHRAs, it is the Environmental Protection Agency's (EPA)recommendation to involve the risk assessors and risk assessment reviewers throughout theprocess to facilitate development of a scientifically sound report and increase the timeliness ofpreparation and review of the report. Please consider this for future projects.
Still, TT provided a very organized and comprehensive report In summary, I have concern withcompletely ignoring past data that exists for the site, particularly that from the mid 90's;weakness in documenting (i.e., showing) the procedures used to derive exposure pointconcentrations (EPCs); and use of EPA or Michigan Department of Environmental Quality(MDEQ) guidance interpreted incorrectly or that is outdated (e.g., converting inhalation toxicityvalues to oral toxicRy values). My specific comments are listed below.
Pg. G-2-1 (Section 2.1 Data Collection)I cannot concur with TT's decision to use only data collected by them for conducting the HHRA.In accordance with EPA risk assessment guidance for Superfund sites (EPA, 1989) therationale for not evaluating and including past data, which is substantial for this site, must befully discussed in the HHRA. Justification for elimination of any data sets from the HHRA mustbe fully described in the report.
Pg. G-2-3 (Section 2.2 Data Evaluation)It is not appropriate to use subsurface soil moisture content data as a surrogate for surface soil.It is well documented that moisture content varies as a function of depth. This application canhave a significant effect on the transport modeling of contaminant volatile hazardoussubstances (HS) fmm surface soil to ambient air.
Pg. Q-2-4 (Section 2.2.1 Data Evaluation of Soil Sampling Results)Ptt. O-2-7 (Section 2.2.4 Data Evaluation of Surface Water Sampling Results)In the above section's a statement is made indicating that elevated sample quantitation limits(SQLs) above health-based screening levels (HBSLs) are unlikely to result in underestimation ofrisk. TT suggests that when SQLs were below HBSLs chemicals were not detected aboveHBSLs and therefore that for the cases where SQLs were above HBSLs it is unlikely thatconcentrations would be present above HBSLs. I am not confident of this reasoning given the
May 9. 2001
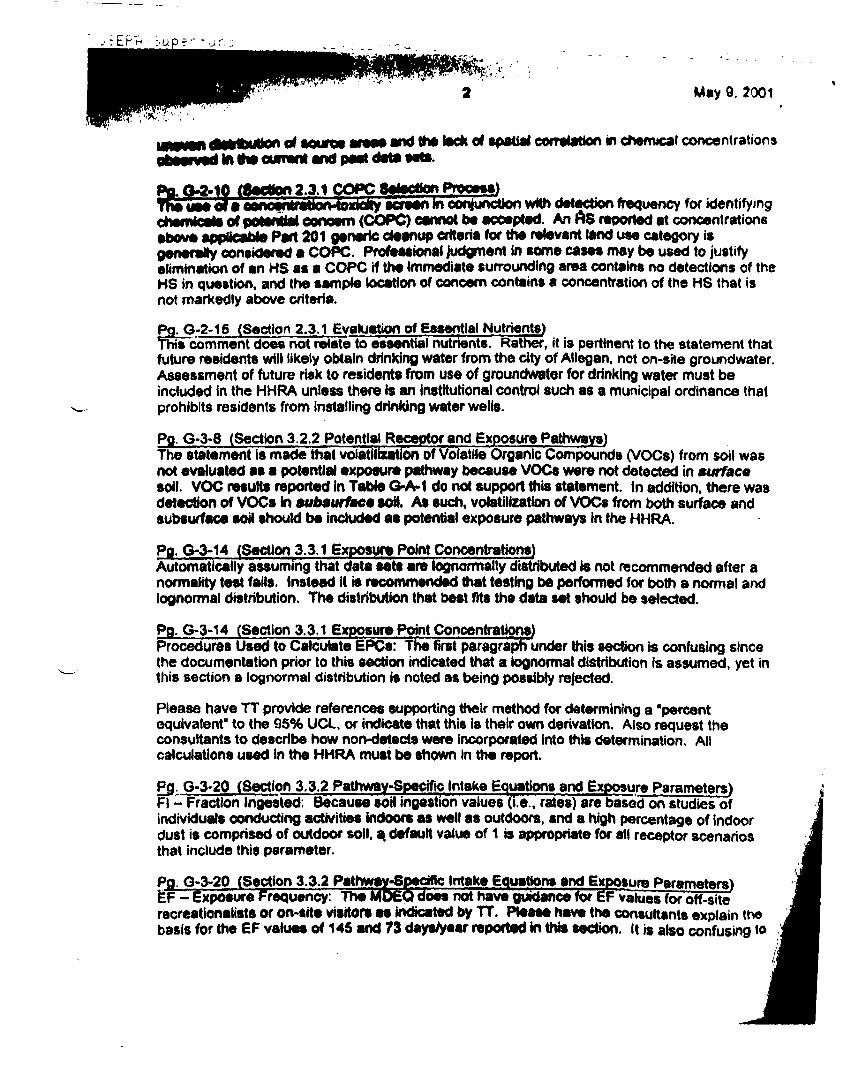
_ o< aourea afiat and the lack of spatial correlation in chemical concentrationsobeerved to the current and paet data M*.
Po. Q-2'10 (Section 2.3.1 COPC Selection Process)The uee of a^cono*f*ra*torvtoxk*y screen in conjunction with detection frequency for identifyingohemictBi of potential oonoam (COPC) cannot be accepted. An HS reported at concentrations•bove applicable Part 201 generic cleanup criteria for the relevant land use category isgenerally considered a COPC. Professional judgment in some cases may be used to justifyelimination of an HS as a COPC if the Immediate surrounding area contains no detections of theHS in question, and the sample location of concern contains a concentration of the HS that isnot markedly above criteria.
pg. Q-2-1S (Section 2.3.1 Evaluation of Essential Nutrients)ThJTcomment does not relate to essential nutrients. Rather, it is pertinent to the statement thatfuture residents will likely obtain drinking water from the city of Allegan, not on-srte groundwater.Assessment of future risk to residents from use of groundwater for drinking water must beincluded in the HHRA unless there is an institutional control such as a municipal ordinance thatprohibits residents from installing drinking water wells.
Pp. G-3-8 (Section 3.2.2 Potential Receptor and Exposure Pathways)The statement is made that volatilization of Volatile Organic Compounds (VOCs) from soil wasnot evaluated as a potential exposure pathway because VOCs were not detected in surfacesoil. VOC results reported in Table G-A-1 do not support this statement. In addition, there wasdetection of VOCs In subsurface soil, As such, volatilization of VOCs from both surface andsubsurface soil should be included aa potential exposure pathways in the HHRA.
Po. G-3-H (Section 3.3.1 Exposure Point Concentrations)Automatically assuming that data sets are lognormally distributed to not recommended after anormality test fails. Instead it is recommended that testing be performed for both a normal andlognormal distribution. The distribution that best fits the data set should be selected.
Pg. G-3-14 (Section 3.3.1 Exposure Point Concentrations)Procedures Used to Calculate EPCs: The first paragraph under this section is confusing sincethe documentation prior to this section indicated that a lognormal distribution is assumed, yet inthis section a lognormal distribution is noted as being possibly rejected.
Please have TT provide references supporting their method for determining a "percentequivalent" to the 95% UCL, or indicate that this is their own derivation. Also request theconsultants to describe how non-detects were incorporated into this determination. Allcalculations used in the HHRA must be shown in the report.
Pg. G-3-20 (Section 3.3.2 Pathway-Specific Intake equations and Exposure Parameters)Fl - Fraction Ingested: Because soil ingestion values (i.e., rates) are based on studies ofindividuals conducting activities indoors as well as outdoors, and a high percentage of indoordust is comprised of outdoor soil, a. default value of 1 is appropriate for all receptor scenariosthat include this parameter.
Pg G-3-20 (Section 3.3.2 Pathwav-Spedfk; Intake Equation* and Exposure Parameters)"EF - Exposure Frequency: The MDEQ does not have guidance for £F values for off-siterecreationalists or on-site visitors as indicated by TT. Please have the consultants explain thebasis for the EF values of 145 and 73 days/year reported in this section. It is also confusing to

Mary Schafer 3 May 9, 2001
use different names for the same receptor population - off-site recreationalists and on-sitevisitor. I recommend that there may be on-site and off-site recreationalists
Pg. G-3-21 (Section 3.3.2 Pathway-Specific Intake Equations and Exposutej^ararneterft)ED - Exposure" Duration: TT states that the ED tor the reasonable maximum exposurevalue isthe 90th percentile of thl% distribution (30 years for noncarcinogenic risk and 24 years forcarcinogenic risk) (ERA 1991 a)." The ERA guidance cited does not contain thisrecommendation. There is no basis for using a different ED for carcinogens andnoncarcinogens, since this parameter is simply based on the time spent at one residence.
Pg. G-3-23 (Section 3.3.2 Pathway-Specific Intake Equations and Exposure Parameters)ET - Exposure Time: Because Intake rates, such as soil ingestion and adherence factor, aredaily (24-hour) and event-specific measurements, it is not appropriate to include the parameterET in the risk calculations.
Pg. G-3-23 (Section 3.3.2 Pathway-Specific Intake Equations and Exposure p»r»metar»lIW- Ingestion Rate for Drinking Water A value of four ounces (0.12SL/day) /or ihis parameteris not a representative estimate for an on-site visitor who is characterized as partaking inactivities such as ball playing or other likely sporting activities. Sixteen ounces seems morereasonable for these activities.
PQ. G-4-2 (Section 4.1 Toxicity Values for Noncarcinooenic COPC)EPA no longer recommends conversion of inhalation toxicity values to oral-based toxicity valuesas shown in equations (G-15) and (6-16). Please direct TT to the appropriate equationspresented in EPA's 1996 "Soil Screening Guidance: Technical Background Document", whichsupersedes the equations presented In EPA's 1991 document titled "Risk AssessmentGuidance for Superfund (RAGS), Volume I. Human Health Evaluation Manual (HHEM), Part B."
Pg. G-6-1S (Section 5.2 Risk and Hazard Estimates)Please have the consultants explain why the risk estimates for inhalation of indoor air are notincluded in the table for the on-site worker.
PQ. G-5-1S (Section 5.2 Risk and Hazard Estimates)Again, please have the consultants explain why the risk estimates for inhalation of indoor air arenot included In the table for the adult on-site resident.
Appendix G-C (Calculation of Paniculate Emissions and Air Concentrations
Pg. G-C-2 (Section 1.0 Land4J»e and Source-Area Assumptions)Assuming that off-site residential property ia completely vegetated is not appropriate, noris assuming that future disturbances such as vehicle traffic will not occur. Is it alsoaccurate that vehicle traffic does not occur on-site under current use?
Pg. G-C-5 Future Recreational ScenarioThe listed "grass-covered" recreational uses such as ball fields and walking trailsare very likely to have areas that are not grass-covered. Please have theconsultants address this issue.
Park maintenance workers should be the receptor population to assess risk forparticuiate emission given the mowing and landscaping activities that will result inthe greatest emission of contaminants and the fact that the workers will frequentthe area to a greater extent than other subpopulations.
- : c." - -Mary
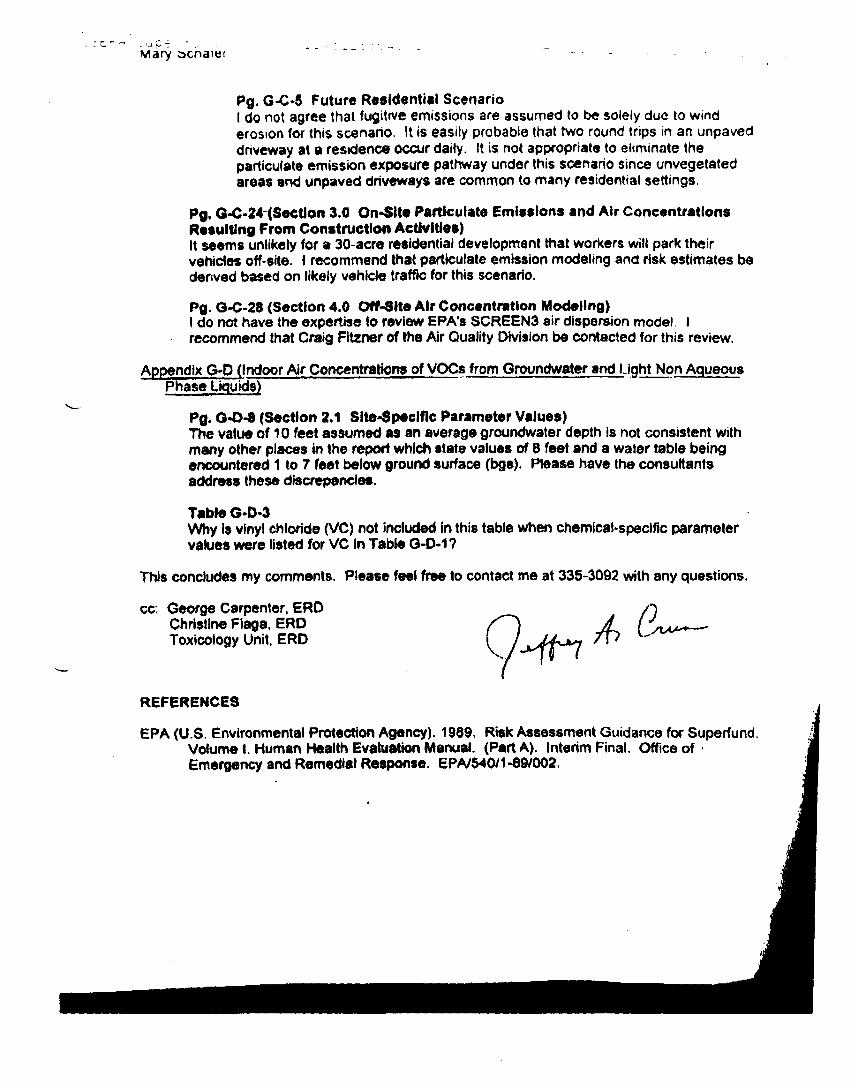
Pg. G-C-5 Future Residential ScenarioI do not agree thai fugitive emissions are assumed to b« solely due to winderosion for this scenario. It is easily probable that two round trips in an unpaveddriveway at a residence occur daily. It is not appropriate to eliminate thepaniculate emission exposure pathway under this scenario since unvegetatedareas and unpaved driveways are common to many residential settings.
Pg. G-C-24*(Sectlon 3.0 On-Slte Participate Emissions and Air ConcentrationsResulting From Construction Activities)It seems unlikely for a 30-acre residential development that workers will park theirvehicles off-site. I recommend that paniculate emission modeling and risk estimates bederived based on likely vehicle traffic for this scenario.
Pg. G-C-28 (Section 4.0 Off-Site Air Concentration Modeling)I do not have the expertise to review EPA's SCREENS air dispersion model Irecommend that Craig Fltzner of the Air Quality Division be contacted for this review.
Appendix G-D (Indoor Air Concentrations of VOCs from Groundwater and Light Non AqueousPhase Liquids)
Pg. G-D-8 (Section 2.1 Site-Specific Parameter Values)The value of 10 feet assumed as an average groundwater depth is not consistent withmany other places in the report which state values of 8 feet and a water table beingencountered 1 to 7 feet below ground surface (bgs). Please have the consultantsaddress these discrepancies.
Table G-D-3Why is vinyl chloride (VC) not included in this table when chemical-specific parametervalues were listed for VC in Table Q-D-1?
This concludes my comments. Please feel free to contact me at 335-3092 with any questions.
cc. George Carpenter, ERDChristine Ftaga. ERDToxicology Unit, ERD
REFERENCES
EPA (U.S. Environmental Protection Agency). 1989, Risk Assessment Guidance for Superfund,Volume I. Human Health Evaluation Manual. (Part A). Interim Final. Office of •Emergency and Remedial Response. EPA/540/1-89/002.

Attachment
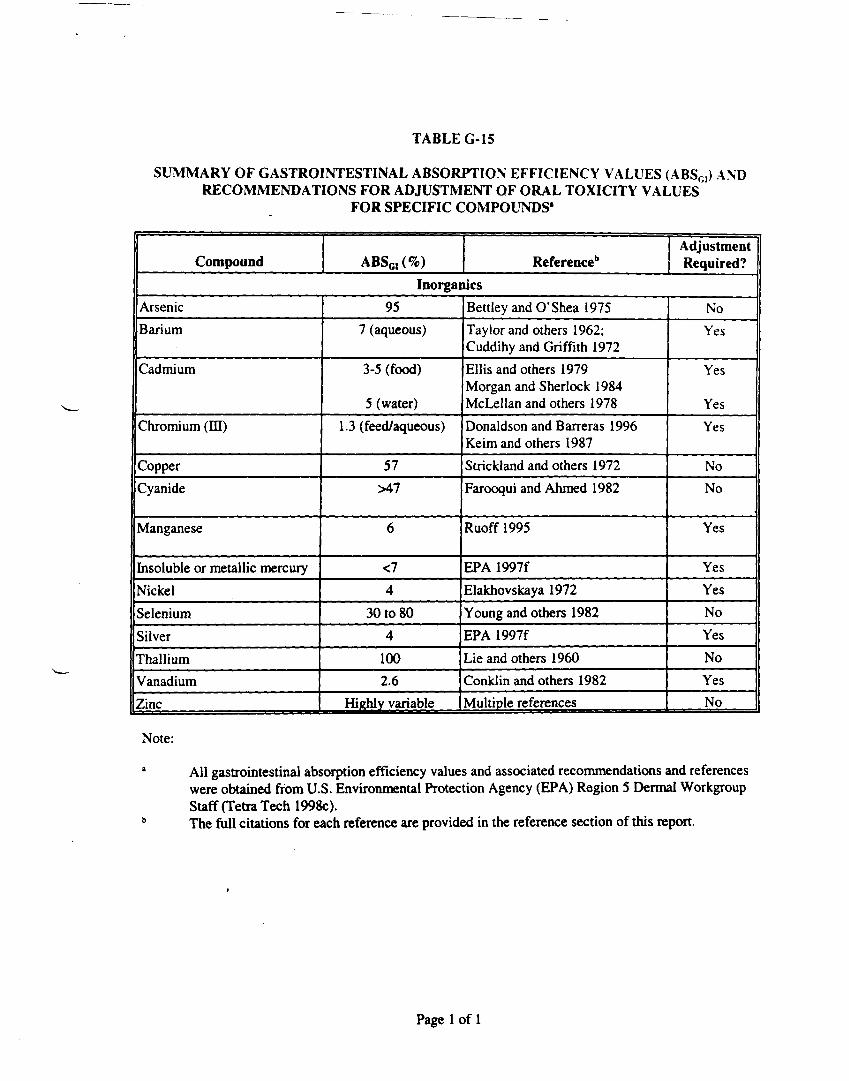
TABLE G-15
SUMMARY OF GASTROINTESTINAL ABSORPTION EFFICIENCY VALUES (ABSGI) ANDRECOMMENDATIONS FOR ADJUSTMENT OF ORAL TOXIC1TY VALUES
FOR SPECIFIC COMPOUNDS'
Compound ABSGl(%) Reference1*AdjustmentRequired?
InorganicsArsenicBarium
Cadmium
Chromium (HI)
CopperCyanide
Manganese
Insoluble or metallic mercuryNickelSeleniumSilverThalliumVanadiumZinc
957 (aqueous)
3-5 (food)
5 (water)1.3 (feed/aqueous)
57>47
6
<74
30 to 804
1002.6
Highly variable
Bettley and O1 Shea 1975Taylor and others 1962;Cuddihy and Griffith 1972Ellis and others 1979Morgan and Sherlock 1984McLellan and others 1978Donaldson and Ban-eras 1996Keim and others 1987Strickland and others 1972Farooqui and Ahmed 1982
Ruoff 1995
EPA 1997fElakhovskaya 1972Young and others 1982EPA 1997fLie and others 1960Conklin and others 1982Multiple references
NoYes
Yes
YesYes
NoNo
Yes
YesYesNoYesNoYesNo
Note:
All gastrointestinal absorption efficiency values and associated recommendations and referenceswere obtained from U.S. Environmental Protection Agency (EPA) Region 5 Dermal WorkgroupStaff (Tetra Tech 1998c).The full citations for each reference are provided in the reference section of this report.
Page 1 of 1

TABLE G-l
DATA GROUPINGS
Area of InterestBackground locations
Former SOS pond area
Former Rockwell WWTParea
Area DescriptionArea east of River Street
Former SOS pond
Former interim pond; holdingponds 1, 2, and 3; andequalization and former wasteoil tanks
MatrixSoilSediment - school pondSediment - KalamazooRiver
Surface water - schoolpondSurface water - KalamazooRiver
Soil
Sediment
Surface water
Soil
Sample NumberRW-BG04-0507
RW-SD 13-0000RW-SD1 1-0000RW-SD 12-0000
RW-SD28-0000
RW-SD3 1-0000
RW-SW 13-0000
RW-SW1 1-0000RW-SW12-0000
RW-SB25-0002RW-SB57-0002RW-SB57-1416RW-SB58-0002RW-SB58-0204RW-SB70-0002RW-SB70-1012RW-MB-011416RW-SD14-0000RW-SD1 5-0000RW-SD16-0000RW-SD17-0000RW-SW 14-0000RW-SW15-0000RW.-SB03-0406RW-SB05-0002RW-SB 10-0002RW-SB59-0002RW-SB59-0810RW-SB61-0002RW-SB61-1315RW-SB62-0002RW-SB62-1012RW-SB64-0002RW-SB64-0204RW-SB65-0002RW-SB66-0002RW-SB66-1214RW-SB67-0002RW-SB67-0406
Page Iof4

TABLE G-l (Continued)
DATA GROUPINGS
Area of InterestFormer railroad right-of-way(on-site)
Grassy area
Area under and north of theformer west manufacturingbuilding
Area DescriptionFormer oil flotation house;substation and quench oil tankarea; pumphouse and former10,000-gallon oil tanks; formerfuel tank; chip and oil recoverysystem; and chip loading facility
Area east of former railroadright-of-way
Machinery pits, floor drains.former backwater area underand north of building; and otherareas of known or suspectedliquid waste deposition
MatrixSoil
Soil
Soil
Sample NumberRW-SB29-0002RW-SB3 1-0002RW-SB35-0406RW-SB54-0002RW-SB54-0810RW-SB55-0002RW-SB55-0406RW-SB56-0002RW-SB56-0406RW-SB74-0002RW-SB74-0406
RW-SB45-0608RW-SB47-0002RW-SB50-0002RW-SB72-0002RW-SB72-0204RW-SB73-0002RW-SB73-0204RW-SB60-0002RW-SB60-1315RW-SB68-0002RW-SB68-0406RW-SB69-0002RW-SB69-0406RW-SB7 1-0002RW-SB7 1-0406RW-MB- 120406RW-MB-18C
Page 2 of 4

TABLE G-l (Continued)
DATA GROUPINGS
Area of InterestOn- site groundwater
Saturated zone beneathbrmer City of Allegan
landfill
Former railroad right of way(off-site)
-
Area DescriptionNot applicable
Saturated zone beneath formerCity of Allegan landfill
Includes the area south of theRockwell property line
MatrixGroundwater
LNAPL
Groundwater
Soil
Groundwater
LNAPL
Sample NumberRW-GW-MWlRW-GW-MW2BRW-GW-MW4CRW-GW-MW4BRW-GW-MW5BRW-GW-MW5ARW-GW-MW7RW-GW-MW11RW-GW-MWl 3RW-GW-MWl 8RW-GW-MWl 91RW-GW-MW19DRW-GW-MW20RW-GW-MW21RW-GW-MW22RW-GW-MW23SRW-GW-MW23IRW-GW-MW23DRW-GW-MW26RW-GW-MW27SRW-GW-MW27IRW-GW-MW27DRW-GW-MW28SRW-GW-MW29SRW-GW-MWlRW-GW-MW4ARW-GW-MW-10RW-GW-MW19SRW-GW-MW30SRW-GW-MW15RW-GW-MWl 6
RW-SB40-0406RW-SB43-0002RW-SB53-0002RW-SB53-0406RW-SB53-0810RW-GW-MW14RW-GW-MW24IRW-GW-MW24DRW-GW-MW25SRW-GW-MW25IRW-GW-MW25DRW-GW-MW-24S
Page 3 of 4
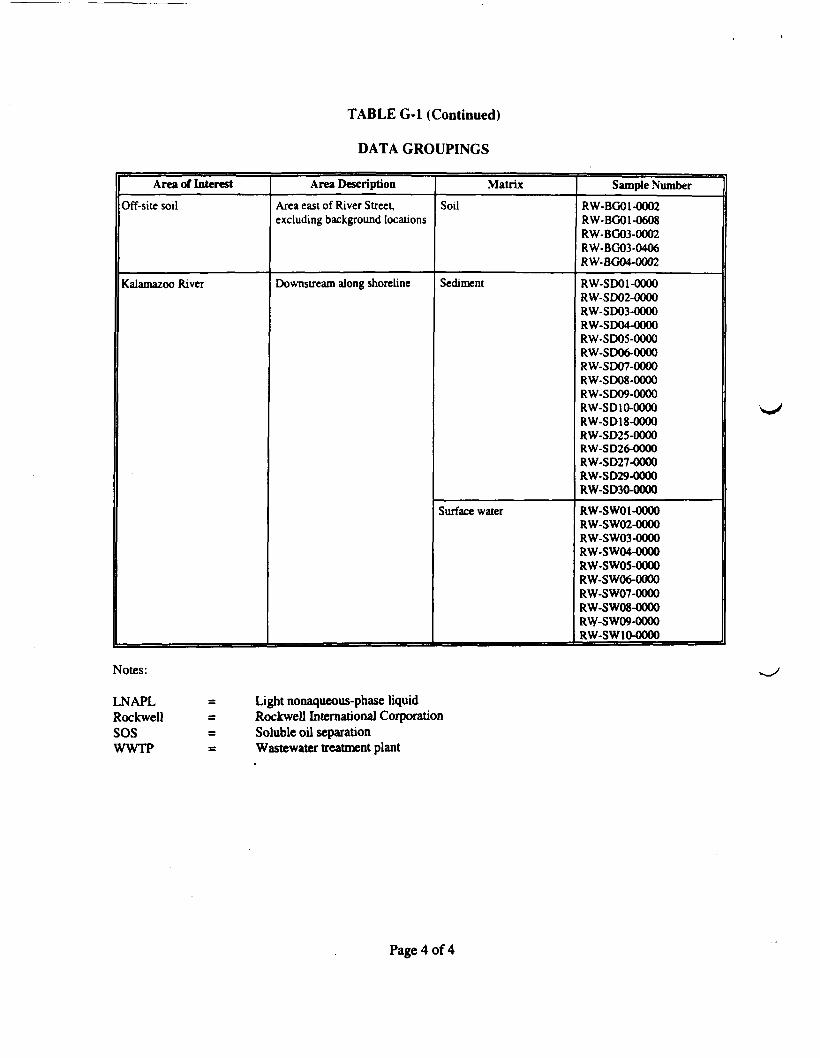
TABLE G-l (Continued)
DATA GROUPINGS
Area of InterestOff-site soil
Kalamazoo River
Area DescriptionArea east of River Street,excluding background locations
Downstream along shoreline
MatrixSoil
Sediment
Surface water
Sample NumberRW-BG01-0002RW-BG01-0608RW-BG03-0002RW-BG03-0406RW-BG04-0002
RW-SDO 1-0000RW-SD02-0000RW-SD03-0000RW-SD04-0000RW-SD05-0000RW-SD06-0000RW-SD07-0000RW-SD08-0000RW-SD09-0000RW-SD10-0000RW-SD18-0000RW-SD25-0000RW-SD26-0000RW-SD27-0000RW-SD29-0000RW-SD30-0000RW-SW01-0000RW-SW02-0000RW-SW03-0000RW-SW04-0000RW-SW05-0000RW-SW06-0000RW-SW07-0000RW-SW08-0000RW-SW09-0000RW-SWIO-OOOO
Notes:
LNAPLRockwellSOSWWTP
Light nonaqueous-phase liquidRockwell International CorporationSoluble oil separationWastewater treatment plant
Page 4 of4

TABLE G-2
CHEMICALS DETECTED IN AT LEAST ONE MEDIUM-SPECIFIC SAMPLE
VOCsAcetoneBromofonnBromo methane2-ButanoneCarbon disulfideChlorobenzenecis- 1 ,2-DichloroetheneCyclohexane1 ,2-Dichlorobcnzene1 ,4-DichlorobenzeneEthylbenzene2-HexanoneMethyl acetateMethylcyclohexane4-Methyl-2-pentanoneTetrachloroetheneTolueneTrichloroetheneXylenes (total)
SVOCsAcenaphtheneAcenaphthyleneBenzaldehydeBenzo(a)anthiaceneBenzo(a)pyreneBenzo(b)fluorantheneBenzo(g,h,i)peryleneBenzo(k)fluoranthencl,l'-Biphenylbis(2-Ethylhexyl)phthalateCarbazoleChryseneDibenzo(a,h)anthraceneDibenzofuranDiethylphthalateDime thylphthal ateDi-n-butylphthalateFluorantheneFluorene2-Methylnaphthalene2-Methylphcnol4-MethylphenolNaphthalenePhenanthrenePyrene
SoUMetals
AluminumAntimonyArsenicBariumBerylliumCadmiumCalciumChromiumCobaltCoppertonLeadMagnesiumManganeseMercuryNickelPotassiumSeleniumSilverSodiumThalliumVanadiumZincCyanide
PCBs and PesticidesAldrinbeta-BHCdelta-BHCgamma-BHCalpha-Chlordanegamma-Chlordane4,4'-DDD4,4'-DDE4,4'-DDTDieldrinEndosulfan IEndosulfan IIEndosulfan sulfateEndrinEndrin aldehydeEndrin ketoneHeptachlorHeptachlor epoxideMethoxychlorToxapheneAroclor 1248Aroclor 1254Aroclor 1260
Dioxins and Furans1.2,3.6.7,8-HxCDD1,2,3.7.8.9-HxCDD1,2.3.4,6,7,8,-HpCDDOCDD2,3,7,8-TCDF1,2,3.7,8-PeCDF2,3.4,7,8-PeCDF1,2.3,4,7,8-HxCDF1,2,3.6,7,8-HxCDF2,3. 4,6,7, 8-HxCDF1,2,3,4.6.7,8-HpCDF1,2,3.4,7,8.9-HpCDFOCDF
Light Nonaqueous-Phase LiquidVOCs
AcetoneBenzene2-ButanoneChlorobenzeneChlorome thane1,2-DichloroetheneEthylbenzene2-HexanoneMethylene chloride4-Methyl-2-pentanoneTetrachloroetheneTolueneTrichloroetheneXylenes (total)
SVOCsAcenaphtheneBenzo(a)pyreneBenzo(g,h,i)peryleneBenzo(k)fluoranthenebis(2-Ethylhexyl)phthalateChryseneDibenzo(a,h)anthraceneDibenzofuran1 ,2-Dichlorobenzene1 ,3-Dichlorobenzene1 ,4-DichlorobenzeneFluorantheneFluorene2-MethylnaphthaleneNaphthalene
MetalsAluminumAntimonyArsenicBariumCalciumChromiumCopperIronLeadMagnesiumManganeseNickelSodiumVanadiumZinc
PCBs and Pesticides4,4-DDD4,4-DDEEndosulfan IIEndrinEndrin aldehydeHeptachlor epoxideMethoxychlorAroclor 1254
Page 1 of 3

TABLE G-2 (Continued)
CHEMICALS DETECTED IN AT LEAST ONE MEDIUM-SPECIFIC SAMPLE
GroundwaterVOCs
AcetoneBenzene2-ButanoneChlorobenzeneChloroe thaneChloroformcis-1, 2- Dichloroethene1 ,2-Dichlorobenzene1 ,4-Dichlorobenzene1 , 1 -Dichoroethane1,2-DichloroetheneEthylbenzeneStyreneTetrachloroetheneToluenetrans-1, 2-DichloroetheneTrichloroethene1,1,1 -TrichloroethaneVinyl chlorideXylenes (total)
SVOCsNo detections
MetalsAluminumAntimonyArsenicBariumBerylliumCadmiumCalciumChromiumCobaltCopperIronLeadMagnesiumManganeseMercuryNickelPotassiumSeleniumSilverSodiumThalliumVanadiumZincCyanide
PCBs and Pesticidesgamma-Chlordane4,4'-DDD4.4-DDEDieldnnEndosulfan IIEndrinEndrin ketoneHeptachlorHeptachlor epoxideMethoxychlorAroclor 1248Aroclor 1254
Dioxins and FuransOCDD
VOCsAcetoneBenzeneCarbon disulfideChlorobenzeneCyclohexane1 ,2-DichlorobenzeneEthylbenzene2-HexanoneIsopropylbenzeneMethylcyclohexaneMethylene chlorideTolueneXylenes (total)
S.SVOCs
AcenaphtheneAcenaphthyleneAcetophenoneAnthraceneBenzaldehydeBenzo(a)anthraceneBenzo(a)pyreneBenzo(b)fluorantheneBenzo(g,h,i)peryleneBenzo(k)fluoranthene1,1-BiphenylCarbazoleChryseneDibenzo(aji)anthraceneDibenzofuranRuoranthenePyrene
HUmentMetals
AluminumArsenicBariumCadmiumCalciumChromiumCobaltCopperIronLeadMagnesiumManganeseMercuryNickelPotassiumSelenium
PCBs and Pesticidesdelta-BHCHeptachlorDieldnn4,4'-DDE4,4'-DDDAroclor 1242Aroclor 1248Aroclor 1254
Dioxins and Furans2,3,7.8-TCDD1,2,3,6,7,8-HxCDD1,2,3,7,8.9-HxCDD1,2,3,4,6,7,8,-HpCDDOCDD2,3.7,8-TCDF1.2.3,4,7,8-HxCDF1,2,3,6,7,8-HxCDF2,3,4,6,7,8-HxCDF1,2,3,4,6,7,8-HpCDFOCDF
Page 2 of 3

TABLE G-2 (Continued)
CHEMICALS DETECTED IN AT LEAST ONE MEDIUM-SPECIFIC SAMPLE
Surface WaterVOCs
AcetoneBenzeneBromodichlorome thaneCarbon disulfideChlorobenzeneChloroformCyclohexane1,1-DichloroetheneEthylbenzeneMethylcyclohexaneMethylene chlondeTetrachloroe thaneTolueneTrichloroetheneVinyl chlorideXylenes (total)
SVOCsNo detections
MetalsAluminumArsenicBariumCalciumChromiumCobaltCopperIronLeadMagnesiumManganeseNickelPotassiumSeleniumSilverSodiumVanadiumZincCyanide
PCBs and PesticidesHeptachlor
Dioxins and FuransNot analyzed
Notes:
HpCDD = Heptachlorodibenzo-p-dioxinHpCDF = HeptachlorodibenzoniranHxCDD = Hexachlorodibenzo-p-dioxinHxCDF = HexachlorodibenzofuranOCDD = Octachlorodibenzo-p-dioxinOCDF = OctachlorodibenzofuranPCB = Polychlorinated biphenylPeCDF = PentachlorodibenzofuranSVOC = Semivolaule organic compoundTCDD = TetrachlorodibenzodioxinTCDF = TetrachlorodibenzoruranVOC = Volatile organic compound
Page 3 of 3

TABLE G-3
COMPARISON OF ESTIMATED ON-SITE TOTAL DAILY INTAKESAND REFERENCE INTAKES FOR CALCIUM, MAGNESIUM, AND SODIUM
Chemical
MaximumDetected
Concentration(ing/kg or
mg/L)
ADP (mg/kg-day)
' ChildResident
AdultResident
On-Site TDIk (mg/day)
Child Resident AdultResident(TDI.)
ReferenceIntake
(mg/day)
On-SiteTDI,/
ReferenceIntake (%)
On-Site' TDI./
ReferenceIntake (%)
Soil
Calcium
Magnesium
158,800
35,000
2.03
0.45
0.063
0.014
30.45
6.71
4.42
0.97
800*800 to 1 ,200^500 to 1,000*30* (infant only)320 to 420*
6
2
0.88
0.26
Groundwater
Calcium
Magnesium
Sodium
2,000,000
600,000
2,980,000
159,817
47,945
200,000
65,753
19,720
100,000
2,397,260
719.178
4E+06
4,602,740
1,380,822
7E406
800*800101,200*500 to 1,000*30° (infant only)320 to 420*500'2,400'4,000 to 6,000"2,000 to 4,000«1,100 to 3,300"1,1 50 to 5,750'
4,795
1,943
8,000
9,205
3,732
14,000
Notes:
ADImg/day =mg/kgmg/kg-day =
Average daily intakeMilligram per dayMilligram per kilogramMilligram per kilogram per day
Page 1 of 2

TABLE G-3 (Continued)
COMPARISON OF ESTIMATED ON-SITE TOTAL DAILY INTAKESAND REFERENCE INTAKES FOR CALCIUM, MAGNESIUM, AND SODIUM
Notes: (Continued)
mg/L = Milligram per literTDI = Total daily intake.
1 ADIs were calculated based on incidental ingestion of soil. Appendix G-F presents the equation and input parameter values used.b TDIs were calculated as ADI x body weight.
Source: NAS 1998d Source: NAS 1997
Source: NAL2001f Source: USDA 1995
' Source: Healthtouch 1997
h Source: DCES 1998
1 Source: Salt Institute 1998
Pag. ^f 2

TABLE G-4
SITEWIDE (ON-SITE)MEDIUM-SPECIFIC COPCs
SoU
SVOCsNaphthalenePhenanthrene
Pesticides and PCBsDieldrinEndosulfan sulfateEndnn aldehydeEndrin ketoneAroclor 1254Aroclor 1260
MetalsAluminumArsenicBariumCadmiumChromiumCobaltCopperIronLeadManganeseMercuryNickelSeleniumSilverZincCyanide
LNAPL
VOCsBenzeneChlorobenzene1,2-DichloroetheneEthylbenzeneMethylene chlorideTetrachloroetheneTrichloroetheneXylenes
Pestiqdes and PCBs4,4'-DDD4,4'-DDEEndosulfan IIEndrinEndrin aldehydeHeptaclor epoxideAroclor 1254
SVOCsAcenaphtheneBenzo(a)pyreneDibenzo(a,h)anthraceneDibenzofuran1 ,2-Dichlorobenzene1 ,4-DichlorobenzeneFluorantheneFluoreneNaphthalenePhenanthrene
MetalsAluminumArsenicBariumChromiumIronLeadManganeseVanadiumZinc
Page Iof3

TABLE G-4 (Continued)
SITEWIDE (ON-SITE)MEDIUM-SPECIFIC COPCs
Groundwater
VOCscis- 1 ,2-Dichloroethene1,1-Dichloroethane1,2-DichlorocthcneTetrachloroetheneTrichloroetheneVinyl chloride
Pesticides and PCBs4,4'-DDD4,4'-DDEDieldhnEndosulfan IIEndrinAroclor 1254
MetalsAluminumArsenicBariumCadmiumChromiumCobaltCopperIronLeadManganeseMercuryNickelSeleniumSilverVanadiumZincCyanide
Sediment (Go-Site Poods)
SVOCsBenzo(b)fluoranthene
Note:Many SVOC detection limits for on-sitepond sediment samples were aboveproject-required quantitation limits.
Pesticides and PC]}}Endosulfan sulfateAroclor 1242Aroclor 1254
Dioxins and FuransTotal dioxins and furans
MetalsAluminumArsenicBariumCadmiumChromiumCobaltCopperIronLeadManganeseMercuryNickelSeleniumZinc
Page 2 of 3

TABLE G-4 (Continued)
SITEWIDE (ON-SITE)MEDIUM-SPECIFIC COPCs
Sediment (Off-Site)
SVOCsBenzo(a)anthraceneBenzo(a)pyreneBenzo(b)fluorantheneBenzo(k)fluorantheneDibenzo(a,h)anthraceneIndeno( 1 ,2,3-cd)pyrene
Pesticides and PCBsDieldrinAroclor 1242Aroclor 1248Aroclor 1254
Dioxins and FuransTotal dioxins and furans
MetalsAluminumArsenicBariumCadmiumChromiumCobaltCopperIronLeadManganeseMercuryNickelSeleniumSilverVanadiumZincCyanide
Surface Water (On-Site Ponds)
MetalsAluminum
ArsenicBarium
ChromiumCopper
Iron
LeadManganese
MercuryNickelZinc
Surface Water (Off-Site)
VOCsBenzeneTrichloroethene
MetalsAluminum
BariumIronLead
ManganeseMercury
ZincCyanide
Notes:
COPCLNAPLPCBSVOCVOC
Chemical of potential concernLight nonaqueous-phase liquidPolychlorinated biphenylSemivolatile organic compoundVolatile organic compound
Page 3 of 3

TABLE G-5
AREA- AND MEDIUM-SPECIFIC COPCs
Former SOS Pond Area - Soil
AluminumArsenicBarium
CadmiumChromium
CobaltCopper
lion
MetalsLead
ManganeseMercuryNickel
SeleniumZinc
Cyanide
Former Rockwell WWTP Area • Soil
Pesticides and PCBsEndosulfan sulfateEndrin aldehyde
Aroclor 1254Aroclor 1260
AluminumArsenicBarium
CadmiumChromium
CobaltCopper
MetalsIronLead
ManganeseMercuryNickel
SeleniumZinc
Former Rockwdl WWTP Area - Sediment (On-Site Ponds)
SVOCsBenzo(b)fluoranthene
Note:Many SVOC detection limits for on-sitepond sediment samples were aboveproject-required quantitation limits.
Pesticides j\nd. PC. B$Endosulfan sulfateAroclor -1242Aroclor -1254
Dioxins artf FuransTotal dioxins and furans
MetalsAluminumArsenicBariumCadmiumChromiumCobaltCopperIronLeadManganeseMercuryNickelSeleniumZinc
Page 1 of 5
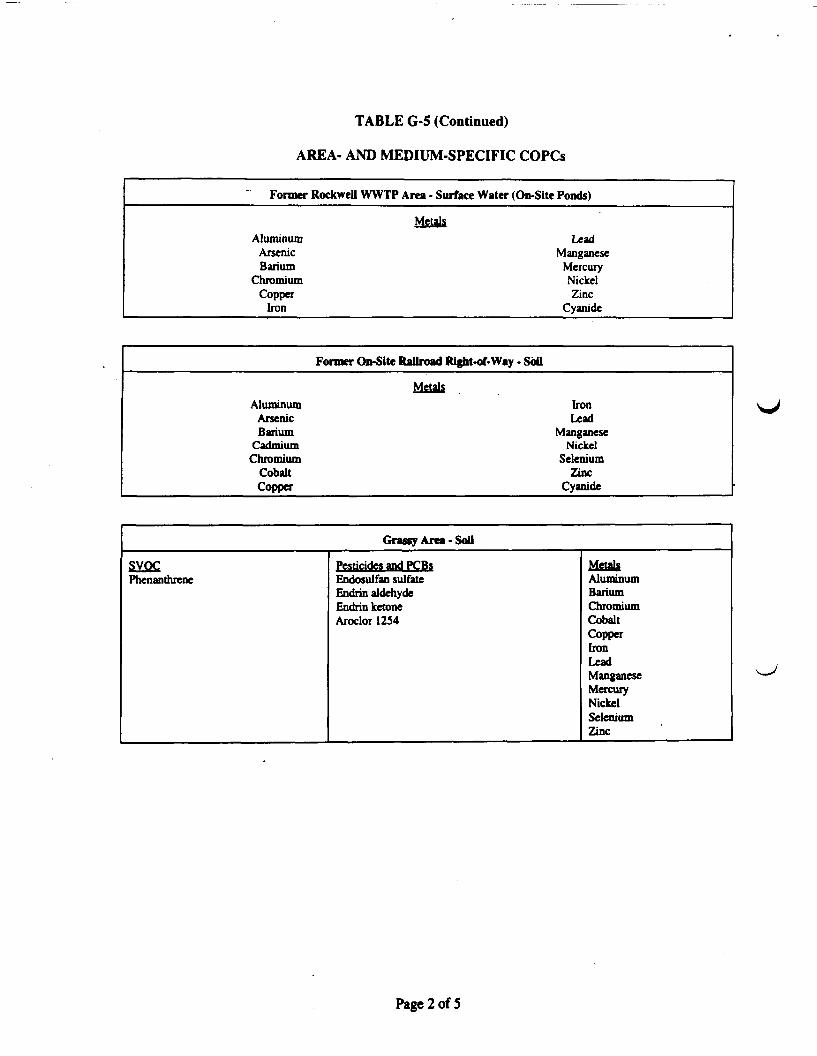
TABLE G-5 (Continued)
AREA- AND MEDIUM-SPECIFIC COPCs
Former Rockwell WWTP Area • Surface Water (On-Site Ponds)
MetalsAluminum
ArsenicBarium
ChromiumCopper
Iron
LeadManganese
MercuryNickelZinc
Cyanide
Former On-Site Railroad Right-of-Way - Soil
AluminumArsenicBarium
CadmiumChromium
CobaltCopper
MetalsIronLead
ManganeseNickel
SeleniumZinc
Cyanide
Grassy Area - Soil
SVOCPhenanthrene
Pesticides and PCBsEndosulfan sulfateEndrin aldehydeEndrin ketoneAroclor 1254
MetalsAluminumBariumChromiumCobaltCopperIronLeadManganeseMercuryNickelSeleniumZinc
Page 2 of5
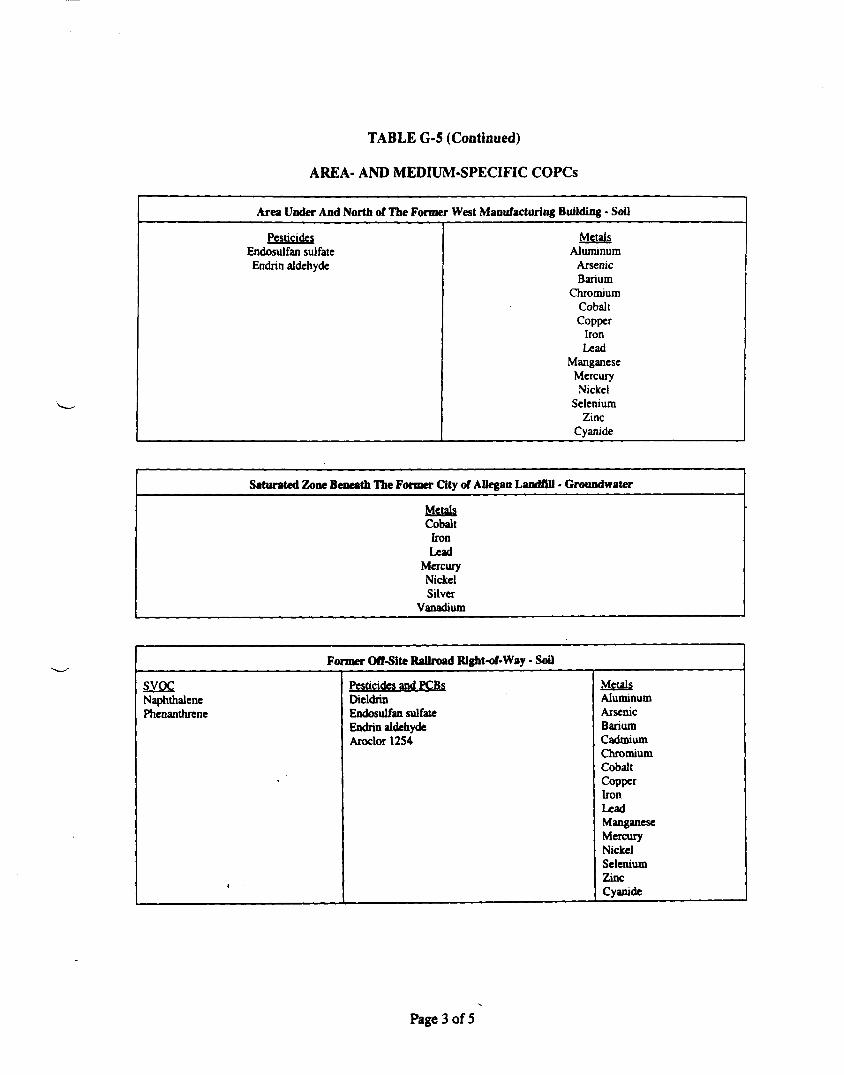
TABLE G-5 (Continued)
AREA- AND MEDIUM-SPECIFIC COPCs
Area Under And North of The Former West Manufacturing Building - Soil
PesticidesEndosulfan sulfateEndiin aldehyde
MetalsAluminum
ArsenicBarium
ChromiumCobaltCopper
IronLead
ManganeseMercuryNickel
SeleniumZinc
Cyanide
Saturated Zone Beneath The Former City of Allegan Landfill • Groundwater
MetalsCobalt
IronLead
MercuryNickelSilver
Vanadium
Former Off-Site Railroad Right-of-Way - Soil
svocNaphthalenePhenanthrene
i
Pesticides and PCBsDieldrinEndosulfan sulfateEndrin aldehydeAroclor 1254
MetalsAluminumArsenicBariumCadmiumChromiumCobaltCopperIronLeadManganeseMercuryNickelSeleniumZincCyanide
Page 3 of 5

TABLE G-5 (Continued)
AREA- AND MEDIUM-SPECIFIC COPCs
Former Off-Site Railroad Right-of-way - LNAPL
VOCsEthylbcnzene
TetrachloroetheneTrichloroethene
Xylenes
SVQCsAcenaphthene
Benzo(a)pyreneDibenzo(a.h)anthracene
Dibenzofuran1,2-Dichlorobenzene1,4-Dichlorobenzene
RuorantheneFluorene
NaphthalenePhenanthrene
Former Off-Site Railroad Right-of-Way - Groundwater
PesticidesDieldrin
Aroclor 1254
MetalsCobalt
IronLead
MercuryNickel
SeleniumVanadiumCyanide
Off-Site Residential Area (Background Soil) - Soil
MetalsAluminum
ArsenicBarium
ChromiumCobaltCopper
IronLead
ManganeseMercuryNickelZinc
Cyanide
Page 4 of 5

TABLE G-5 (Continued)
AREA- AND MEDIUM-SPECIFIC COPCs_____ _____________ .. ————— —— ——— ————Kalamazoo River- Sediment (ShorelineOnly) ______ —————— —————— 1
. ______ ————————— —————————— — —————————svocBenzo(a)anthraceneBenzo(a)pyreneBenzo(b)fluorantheneBenzo(k)fluorantheneDibenzo(a.h)anthraceneIndeno(l,2,3-cd)pyrene
—— ———————— —— ———————— '
______ ——— ——— ——— ———Pesticides and PCBsDieldrinAroclor 1242Aroclor 1248Aroclor 1254
Dioxigs, aj>4 FuransTotal dioxins and furans
————————— ——————— —————————
^__ ———— ———— ————MetalsAluminumArsenicBariumCadmiumChromiumCobaltCopperIronLeadManganeseMercuryNickelSeleniumSilverVanadiumZincCyanide ____
Kalamazoo River - Surface Water
vocBenzene
MetalsAluminum
BariumIronLead
ManganeseZinc
Notes:
COPC = Chemical of potential concernLNAPL = Light nonaqueous-phase liquidPCB = Polychlorinated biphenylSOS = Soluble oil separationSVOC = Semivolatile organic compoundVOC = Volatile organic compoundWWTP = Wastewater treatment plant
Page 5 of 5

TABLE G-6
EXPOSURE POINT CONCENTRATIONS
MaximumDetected
Concentration*
Surface andSubsurface Soil
Page 1 of 13

TABLE G-6 (Continued)
EXPOSURE POINT CONCENTRATIONS
MaximumDetected
Concentration*Sitewide (on-site)'continued)
Surface andSubsurface Soil(Continued)
Chlorobenzenecis-1,2-DichloroetheneEthylbenzenetlethylene chlorideretrachloroethenerrichloroethene
indrin aldehydefeptaclor epoxide
Aroclor 1254Benzo(a)pyrene,2-Dichlorobenzene,4-Dichlorobenzene
Phenanthrene
Page 2 of 13

TABLE G-6 (Continued)
EXPOSURE POINT CONCENTRATIONS
AreaSitewide (on-site)^continued)
GroundwaterMedium
c is-1,2-Dichloroethene
TetrachloroetheneTrichloroetheneVinyl chloride4,4'-DDD4,4'-DDEDieldrinEndosulfanEndrinAroclor 1254AluminumArsenicBarium
CadmiumChromium
Sediment (On-SitePonds)
COPC
1,1-Dichloroethane1,2-Dichloroethene
:obaltCopperion-eadvlagnesiumVfanganeseVlercuryNickelSeleniumSilverVanadiumZincCyanideBenzo(b)fluorantheneEndosulfan sulfateAroclor 1242Aroclor 1254Total dioxins and furans• •• ••• BB^ ^ " "" ^ " ™^ ™^™^™"
AluminumArsenicBariumCadmiumChromium
MaximumDetected
Concentration*
Page 3 of 13

TABLE G-6 (Continued)
EXPOSURE POINT CONCENTRATIONS
Area Medium
MaximumDetected
Concentration*Sitewide (on-site)[Continued)
Sediment (On-SitePonds) (Continued)
Surface Water (On-Site Ponds)
-ormer SOS Pond Surface andSubsurface Soil
Page 4 of 13
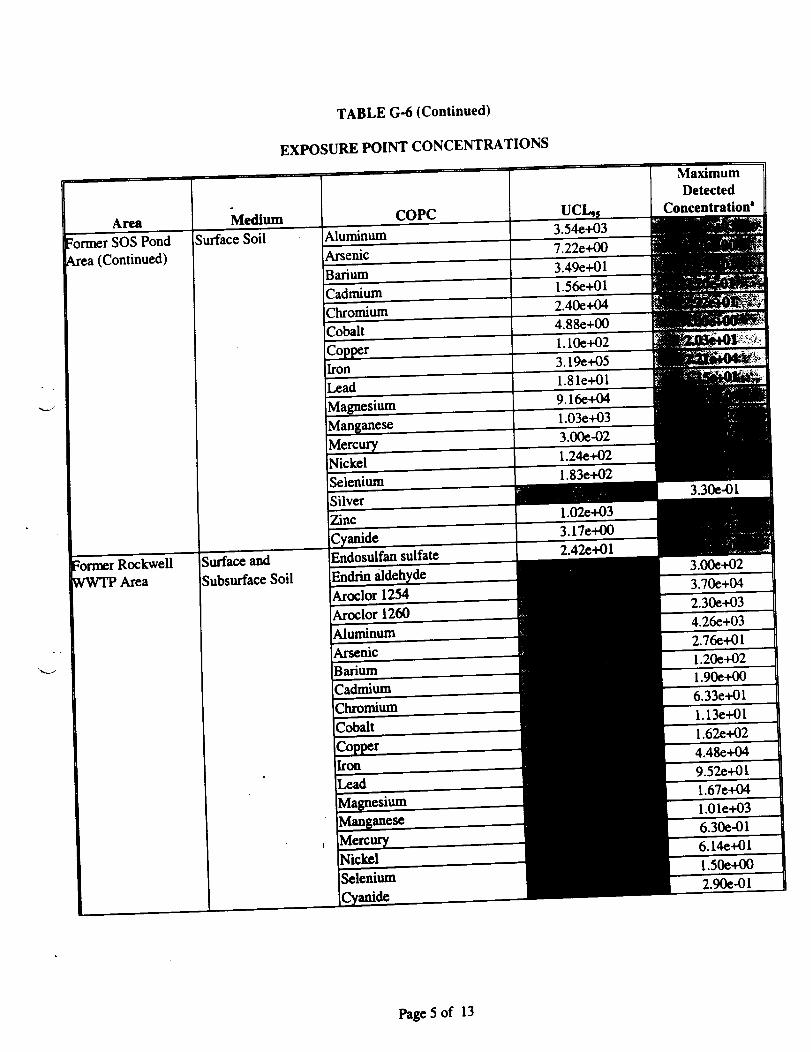
TABLE G-6 (Continued)
EXPOSURE POINT CONCENTRATIONS
AreaFormer SOS PondArea (Continued)
MediumSurface Soil
Former RockwellWWTPArea
Surface andSubsurface Soil
___ COPCAluminum^ArsenicBariumCadmiumChromiumCobaltCopperIronLeadMagnesiumManganeseMerci.NickelSeleniumSilverZincCyanide____Endosulfan sulfateEndrin aldehyde^Aroclor 1254Aroclor 1260AluminumArsenicBariumCadmiumChromiumCobalt_
srIronJ&AViagnesiumMangMerciNickelSelenium
UCI3.54e+037.22e+003.49e+011.56e+012.406+044.88e+001.10e+023.19e+051.81e+019.16e+041.03e+033.00e-021.24e+021.83e+02
1.02e+033.17e+002.42e+01
MaximumDetected
Concentration'
3.30e-0l
3.00e+023.70e+042.30e+034.26e+032.76e+01l.20e+021.90e+006.33e+011.13e+011.626+024.486+049.526+011.67e+04l.Ole+036.30e-016.146+011.50e+002.90e-01
Page 5 of 13

TABLE G-6 (Continued)
EXPOSURE POINT CONCENTRATIONS
7ormer RockwellWWTPAreaContinued)
Area MediumSurface Soil
Sediment (On-SitePonds)
MaximumDetected
Concentration*4.60e+01
Total dioxins and furans
Page 6 of 13

TABLE G-6 (Continued)
EXPOSURE POINT CONCENTRATIONS
MaximumDetected
Concentration*Surface Water"ormer Rockwell
tfWTPAreaContinued)
Surface andSubsurface Soil
7ormer On-Sitelailroad Right-ofVay
Page 7 of 13

TABLE G-6 (Continued)
EXPOSURE POINT CONCENTRATIONS
Area Medium COPC UCL95
MaximumDetected
Concentration*:ormer On-Sitelailroad Right-of-Way (Continued)
Surface Soil(Continued)
SeleniumZincCyanide
1.64e+018.10e+031.94e+01
Grassy Area Surface andSubsurface Soil
Surface Soil
PhenanthreneEndosulfan sulfateEndrin aldehydeEndrin ketoneAroclor 1254AluminumBariumChromiumCobaltCopperIron
vlagnesiumManganeseMercuryNickelSelenium
'henanthreneEndosulfan sulfateindrin aldehydeindrin ketone
AluminumiariumChromiumCobaltCopperIron-eadMagnesiumManganeseMercury
NickelSelenium7inc
4.51e+011.34e+024.51e+01
3.56e+032.89e+015.57e+002.75e+008.26e+007.18e+035.42e+015.32e+043.00e+029.71e+007.29e+009.00e-014.19e+014.15e+051.91e+018.89e+011.91e+01
NCNCNCNCNCNCNCNCNCNCNCNCNC
2.30e+03
1.00e+018.90e+01
Page 8 of 13

TABLE G-6 (Continued)
EXPOSURE POINT CONCENTRATIONS
MaximumDetected
Concentration\rea Under andSforth of the FormerWest ManufacturingBuilding
Surface andSubsurface Soil
Endosulfan sulfateEndrin aldehyde
Endrin aldehyde
Page 9 of 13

TABLE G-6 (Continued)
EXPOSURE POINT CONCENTRATIONS
Area Medium COPC
MaximumDetected
Concentration*Saturated ZoneBeneath the Former
ity of AlleganLandfill
Groundwater CobaltIronLeadMercuryNickelSilverVanadium
NCNCNCNCNCNCNC
Former Off-Siteailroad Right-of-
Way
Surface andSubsurface Soil
Surface Soil
NaphthalenePhenanthreneDieldrinEndosulfan sulfateEndrin aldehydeAroclor 1254AluminumArsenicJarium
CadmiumChromiumCobalt
Iron
SiagnesiumvlanganeseVlercuryVickelSelenium
Cyanide>ieldrinindosulfan sulfateEndrin aldehyde
Aroclor 1254AluminumArseniciariumCadmiumChromiumCobalt..opper
8.03e+052.30e+154.50e+151.59e+061.80e+161.04e+342.73e+046.35e+027.03e+046.35e+031.73e+021.79e+016.19e+064.91e+051.02e+162.10e+071.42e+041.16e+023.40e+023.05e+032.10e+073.45e+01
NCNCNCNCNCNCNCNCNCNCNC
Page 10 of 13

TABLE G-6 (Continued)
EXPOSURE POINT CONCENTRATIONS
Areabrmer Off-Site.ailroad Right-of-
Way (Continued)
MaximumDetected
Concentration*Surface Soil(Continued)
Dibenzo(a,h)anthracene
Page 11 of 13
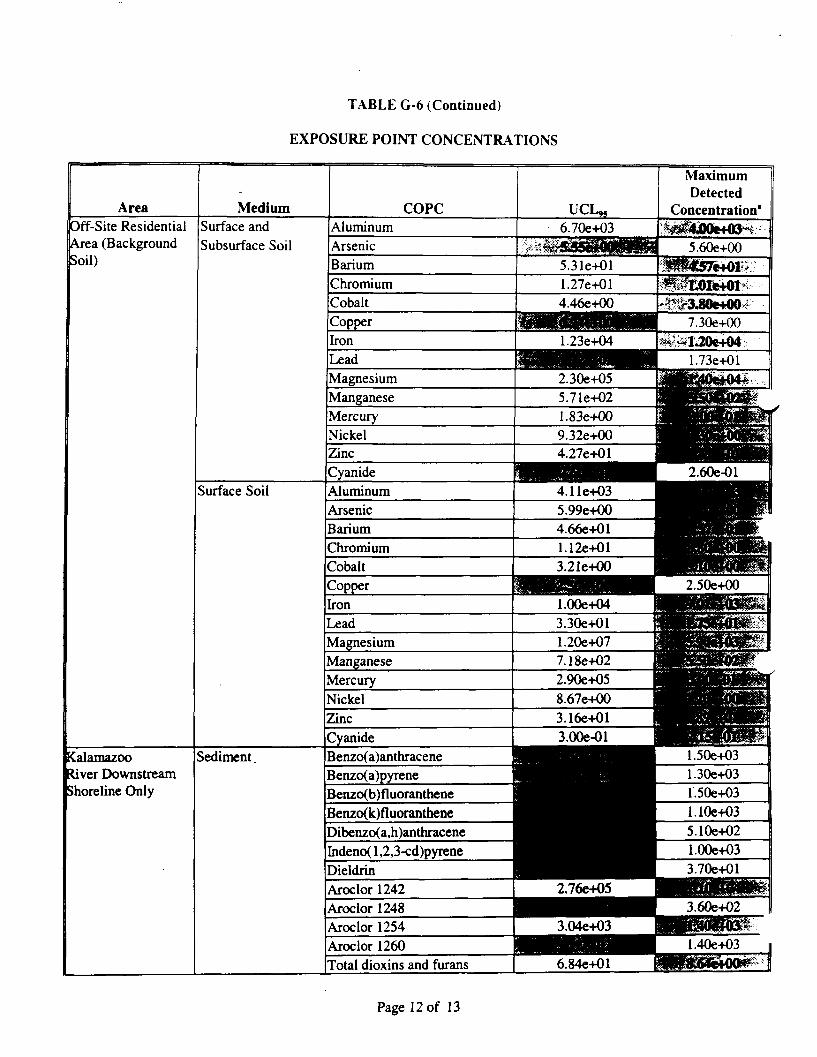
TABLE G-6 (Continued)
EXPOSURE POINT CONCENTRATIONS
MaximumDetected
ConcentrationOff-Site ResidentialArea (Background
BSoil)
Surface andSubsurface Soil
Jenzo(a)antnracenealamazooliver Downstreamhoreline Only
Jenzo(a)pyreneBenzo(b)tluorantheneBenzo(k)fluoranthene)ibenzo(a)h)anthracenendeno( 1,2,3-cd)pyrene
Aroclor 1242Aroclor 1248Aroclor 1254Aroclor 1260Total dioxins and furans
Page 12 of 13
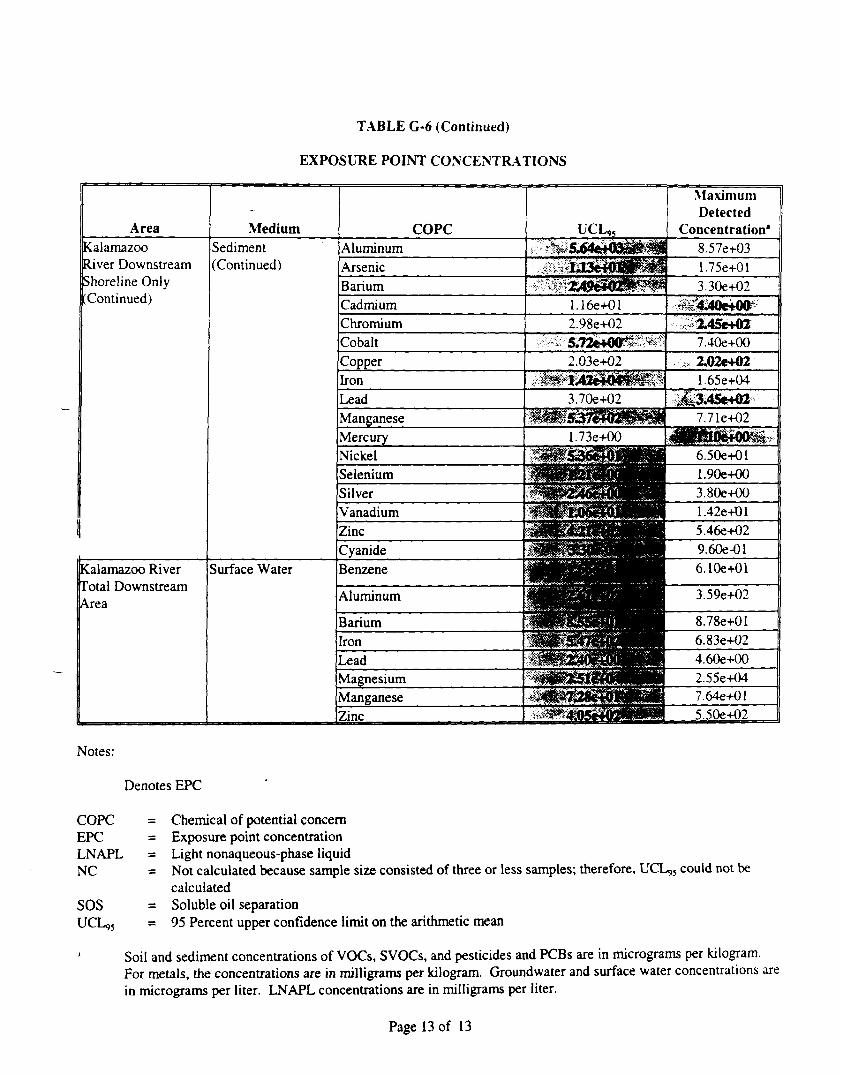
TABLE G-6 (Continued)
EXPOSURE POINT CONCENTRATIONS
MaximumDetected
Concentrationalamazooiver Downstreamhoreline OnlyContinued)
Sediment(Continued)
Calamazoo RiverPotal Downstream
Surface Water
Notes:
Denotes EPC
COPC = Chemical of potential concernEPC = Exposure point concentrationLNAPL = Light nonaqueous-phase liquidNC = Not calculated because sample size consisted of three or less samples; therefore, UCL*,, could not be
calculatedSOS = Soluble oil separationUCL,, = 95 Percent upper confidence limit on the arithmetic mean
Soil and sediment concentrations of VOCs, SVOCs, and pesticides and PCBs are in micrograms per kilogram.For metals, the concentrations are in milligrams per kilogram. Groundwater and surface water concentrations arein micrograms per liter. LNAPL concentrations are in milligrams per liter.
Page 13 of 13

TABLE G-7
CHEMICAL-SPECIFIC PLANT-SOIL BIOCONCENTRATION FACTORS
COPC.NaphthalenePhenanthreneDieldrinEndosulfan sulfateEndrin aldehydeEndrin ketoneAroclor 1254Aroclor 1260AluminumArsenicBariumCadmiumChromiumCobaltCopperIronLeadMagnesiumManganeseMercuryNickelSeleniumSilverZincCyanide
Brlt
0.4350.09080.03490.3770.05760.05760.010.01NA
0.006330.03220.125
0.00488NANANA
0.0136NANANA
0.009310.01950.1380.046NA
Brn»^n
8.231.4910.45.7512.612.614.214.2NA
0.0080.0150.0640.0045
NANANA
0.009NANANA
0.0080.0220.1
0.044NA
Notes:
Bra.
Br,roocveg
COPC =NA
Plant-soil bioconcentration factor for aboveground produce (unitless); source:Appendix A-3 of EPA 1998Plant-soil bioconcentration factor for belowground produce (unitless); source:Appendix A-3 of EPA 1998Chemical of potential concernNot available
Page 1 of 1

TABLE G-8
ABSORPTION FACTORS
CompoundAluminumArsenicBariumCadmiumChromiumCobaltCopperCyanideIronLeadMagnesiumManganeseMercuryNickelSeleniumSilverThalliumVanadiumZinc1,1-Dichloroethane1,2-DichloroetheneBenzeneChlorobenzenecis- 1 ,2-DichloroetheneEthyl benzeneMethylene chloride
Value0.010.030.0 10.010.010.010.010.010.010.010.010.010.010.010.010.010.010.010.010.10.10.10.10.10.10.1
Referenceb
b,cb
b,dbbbabbabbbbbbbbaaaaaaa
CompoundTetrachloroetheneTrichloroetheneVinyl chlorideXylenes4,4'-DDD4,4' -DDEAroclor 1254Aroclor 1260DieldrinEndosulfan nEndosulfan sulfateEndrinBndrin aldehydeEndrin ketonerieptachlor epoxide1 ,2-Dichlorobenzene1 ,4-DichlorobenzeneAcenaphthene3enzo(a)pyreneOibenzo(a,h)anthraceneOibenzofuranFluorenePluorantheneNaphthalenePhenanthrene
Value0.10.10.10.1
0.030.030.140.140.10.10.10.10.10.10.10.130.130.130.130.130.030.130.130.10.13
Referenceaaaaaf
ggeaaeeaeaaffffffef
Notes:
EPA Region 5 Dermal Workgroup staff (Tetra Tech 1998c)EPA 1998Wester and others 1993aWester and others 1992aEPA1992aWester and others 1990Wester and others 1993b
Page 1 of 1

TABLE G-9
DA_, CHEMICAL-SPECIFIC CONSTANTS
CompoundI>A M If
ET=1 PC
l>A,,,rt Values for Organic COPCsI .I liKhlornrlhane
t.? 1 tichlomcthene
Hrn/cnr
( Iiloii»ltcn7pne
nt I.J 1 >ichlnrnelheiK
Hliyl Htn7ene
Mcihylene Chloride
Ictnkhloroelhene
Tru'hloroelhene
Vinyl Chloride
Xylcnrs
4.4' 1)1)1)
44 |il)|
Aroc lor 1254
Arm lor 1260
Dirl.lrm
rniloMilfan II
l-mlostilfan sulfale
Fiulnn
l-.ndrin aldehyde
tlndnfi kctnne
llcpi;ichlor epoxide
1.2 Dichlnroheniene
1.4 Ou-hlomhenzene
Acennpihrne
Ilrn7<»(a)pyrene
1 )ihert7o( u,h)anthracene
1 )ihrn7ofuran
HimixMie
Hnrtunthene
Nupllulenf
I'hriiiiiithercne
OOISI5I936
0.009016341
0.15371767
0.076462292
0009016341
1726 II 3671
00071 11294
0970197313
0471461539
001036332
001380*909
2 161436204
1.828753316
7342762062
7.342762062
01876261 31
0
0
0.1876261 31
0.1876261 31
0 1876261 31
03589524770140052695
0 14234864
3.320729101
5.648294516
3.320729101
0.458650233
1 218667471
1 218667471
0. 13884304
0666747303
0.0089
0.0053
0.11
0041
00053
1
00045
3.70E-OI
2.30F.-OI
0.0073
0008
028
0.24
0.71
071
0.016
0.016
0.016
0.016
0.02852
0061
0.062
081
1.2
0.81
0.1 7220 J
036
0.36
0.069
0.23
Tail «• B'— .(hr)
035035
0.2
043
035
039
029
9.00E-OI
5.50E-01
021
0.39
7.8
7.6
14
14
18
181818
20.73484
069
069
2.2|
2.9^
2.2
0.928555
1.51.5
053
I I
084
0.84
0.63
1
0.84
1.3
0.69
4.3
1.30.51
1.437
3<66
«
94
94
94
94
100.1863.23.310
14
1C
5.5889257.3!7.3
2.2
56
00062
0003
0.013
0.0069
0003
0.14
0.0018
2.5
2.60E-02
0.0023
0.16
63
49
52C
S2C
3.6
3.6
3.636
10
024
0.2546
130
*31.584893
8.48.90.22.*
11111
11111
11
1111
1111
11
1111
11
1111
DA_"ET=2
>_.(hr)
0023997096
0014300489
0.262306022
O I I 7 I 8 I 3 3 I
0.014300489
2.725964912
001 1603208
1.371302515
0714165692
0.017646568
0.021754483
3.055031035
2.584808253
10.3784538910.378453890.265195731
<{
0.265195731
0.2651957310.265195731
0.507352914
0.1979541790.201 199329
4.693606245
7.983448697
4.693606245
0.6482683571.722496801
1.722496801
0.196244421
0.94239825}
2
2
2
2
2
2
2
2
2222
2222222222
22
22222
2
2
2
DA — "ET=.1.2S
t
(hr)DA._lfET.2.5
«.—(hr)
0.017363226
0.010337378
0.1808647580.086642052
0.0103373781.928779609
0.0082342721.0841098270.526816639
00121841320.0154302372.4152140982.04347014!
8.2048882258.2048882250.209655634
I(
0.2096556340.2096556340.2096556340.401097697
0.156496519
0.1590620363.710621544
6.311470367
3.710621544051250113613617532891.361753289
0.155144837
0745031236
1.25
1.25
1.25
1.25
1.25
1.25
1.25
1.251.251.251.251.251.251.251.251.251.251.251.251.25
1.251.251.251.251.25
1.251.251.251.251.251.251.25
0028419676
0.016942S62
0.316600197
0.137540850.016942562
3.164561404
0.013849166
1.5331628210.826251462
0.0212881930.0252027593.4156285342.88990348111.6034642111.603464210.296497841
((
0.2964978410.2964978410.2964978410.567237802
0.22131950.224947689
5.2476113128.925766991
5.2476113120.7247860571.925809969
1.925809969
0.24127
1.053633278
2.52.52.52.52.52.52.52.52.52.52.52.52.5
2.52.52.52.52.52.52.52.52.5
2.52.52.52.52.5
2.52.52.52.52.5
DA^lfET=0.01
t_(hr)
DAMlfET=0.12 (hr)
DAMlfET-0.2
0001454519
0.000866174
0013589484
0007426999
0.0009
0.1725152930.000669433
0.0969657310.0471199130000924119
0.0013801220.2160233160.1827735440.7338675130.7338675130.01875217
C(
0.01875217
0.018752170.01875217
0.0358752690.0139974740.01422694
0.331888080.56451507
0.33188808
0.045839495
0.1217989170121798917
00138765760.06663762
0.010.010.010.010.010.01
0.010.010.010.01
0.010.010.01
0.01
0.010.01
0.010.010.010.010.010.010.010.010.01
0.010.010.01
0.010.010.01
0.01
0.005038601
0.0030005150047075355
0.0257278!0.0030005
0.597610504
0.0023189820.335899145
0.1632281660.0032012410.004780884
0748326711
0.633146132.5421916362.5421916360.064959421
(
(0.06495942:0.0649594220.06495942:0.12427557*0.0484886730.0492835691.1496940351.95553757
I.I4969403S0.1587926690.4219238250.421923825
0.04806987
0.230839485
0.120.120.120.120.120.120.120.120.120.120.120.120.120.120.120.120.120.120.120.12
0.120.120.120.12
0.120.120.120.120.120.120.120.12
0.006504806
0.0038736480.0607740220.033214550.00387365
0.771511843
0.0029937930.4336439310.2107266560.0041327850.0061720950.9660856390.8173881393.281955293.28195529
0.083862254((
0.0838622540.0838622S40.083862254
0.160439079
0.0625986080.0636248141.4842486182.524588147
1.4842486180.2050004540.54470131
0.544701310.062057930.298012494
t tT1
(hr)
0.20.20.20.20.20.20.20.20.20.20.20.20.20.20.20.20.20.20.20.20.20.2
0.20.20.20.20.2
0.20.20.20.20.2
DA^^IfETM».27
0007558
00045007730.0706130320.03859182
0.0045010.89641575
0.0034784730.5038487170.24484224R
0.0048018620.0071713261.122490078
0.949719195
3.8132874543.8132874540.097439134
((
0.0974391340.0974391340.0974391340.186413364
0.07273300.0739253541724541052.933306354
1.724541050.238189004
0.632885730.632885730.072104804
03*6259228
<hr)
0.270.270.270.27
0.270.270.27
0.270.270.270.270.270.270.27
0.270.270.270.270.270.270.270.270.27
0.270.270.27
0.270.270.270.270.270.27
Page ' of 2

TABLE G-9 (Continued)
DA,,.., CHEMICAL-SPECIFIC CONSTANTS
( (impound °A.~, PC ««-<!»•) I>A~. «~«<l«r) DA^., t~-(hr) DA_ t~, <!•«•) DA_ t_(lir) DA^, t— («"•> DA_ t M (hr) DA — tM Our)DA „„, Values for Inorganic COPCsAluminum
Arsenic
H.iMiim
Cadmium
Chromium
Cobalt
Copper
Cyanide
Iron
Ijead
Magnesium
Manganese
Mercury
Nickel
Selenium
Silver
Thallium
Vanadium
Zinc
00010.001000100010001
000100010001
0.001000100010.0010.001
0.001
00010.0010.00100010.001
0.0010.0010.0010.0010.0010.0010.0010.0010.0010.0010.0010.001
0.0010.0010.0010.0010.0010.0010.001
1111111111111111111
0.0020.0020.002
0.0020.0020.0020.0020.0020.0020.0020.0020.0020.0020.0020.0020.0020.0020.0020.002
2222222222222222222
0.001250.001250.001250.001250.001250.001250.001250.001250.001250.001250.001250.001250.001250.001250.001250.001250.001250.00125000125
1.251.251.251.251.251.251.251.251.251.251.251.251.251.251.251.251.251.251 25
0.00250.00250.00250.00250.00250.00250.00250.00250.00250.00250.00250.00250.00250.00250.00250.00250.00250.002500025
2.52.52.52.52.52.52.52.52.52.52.52.52.52.52.52.52.52.525
0.000010.000010.000010.000010.000010.000010.000010.000010.000010.000010.000010.000010.000010.000010.000010.000010.000010.00001000001
0.010.010.010.010.010.010.010.010.010.010.010.010.010.010.010.010.010.01001
0.000120.000120.000120.000120.000120.000120.000120.000120.000120.000120.000120.000120.000120.000120.000120.000120.000120.00012000012
0.120.120.120.120.120.120.120.120.120.120.120.120.120.120.120.120.120.120 12
0.00020.00020.00020.00020.00020.00020.00020.00020.00020.00020.00020.00020.00020.00020.00020.00020.00020.000200002
0.20.20.20.20.20.20.20.20.20.20.20.20.20.20.20.20.20.202
0.000270.000270.000270.000270.000270.000270.000270.000270.000270.000270.000270.000270.000270.000270.000270.000270.000270.00027000027
0.270.270.270.270.270.270.270.270.270.270.270.270.270.270.270.270.270.270.27
Notes:
BCOPCDArvrn,ETPCt*Tan
Bunge cpnstant reflecting the partitioning properties of a compound (dimensionless)Chemical of potential concernDermally absorbed dose per event (in milligrams per square centimeter per event)Exposure time (hours)Dermal permeability coefficient (centimeters per hour)Time to steady state conditions (hours)Lag time (hours)
Page 2 of 2

TABLE G-10
SURROGATE CHEMICALS FOR COPCsWITHOUT REFERENCE DOSES
CompoundWithout RfD
Benzo(a)pyrene
Dibenzo(ah)anthracene
Acenaphthene
Endosulfan II
Endosulfan sulfate
Endrin aldehyde
Endrin ketone
Aroclor-1260
Phenanthrene
Benzo(a)anthracene
Benzo(b)fluoranthene
Benzo(k)fluoranthene
Indeno( 1 ,2,3-cd)pyrene
Aroclor-1242
Aroclor-1248
StructureFive 6-carbon ring cluster
Five 6-carbon ring chain
One 5- & two 6- carbonring clusterMultiple overlappingnon-aromatic rings
Multiple overlappingnon-aromatic rings
Multiple overlappingnon-aromatic rings
Multiple overlappingnon-aromatic rings
Two phenyl rings withassorted chlorines
Three 6-carbon ring chain
Four 6-carbon ring chain
One 5- & four 6- carbonring clusterOne 5- & four 6- carbonring clusterOne 5- & four 6- carbonring clusterTwo phenyl rings withassorted chlorines.
Two phenyl rings withassorted chlorines
Surrogate withRfD
Pyrene
Anthracene
Acenaphthylene
Endosulfan
Endosulfan
Endrin
Endrin
Aroclor-1254
Anthracene
Anthracene
Fluoranthene
Fluoranthene
Fluoranthene
Aroclor-1254
Aroclor-1254
OralRfD*(mg/kg-day)3.0E-02
3.0E-01
6.0E-02
6.0E-3
6.0E-3
3.0E^
3.0E-4
2.0E-05
3.0E-01
3.0E-01
4.0E-02
4.0E-02
4.0E-02
2.0E-05
2.0E-05
StructureFour 6-carbon ringclusterThree 6-carbon ringchainOne 5- & two 6-carbon ring clusterMultipleoverlapping non-aromatic ringsMultipleoverlapping non-aromatic ringsMultipleoverlapping non-aromatic ringsMultipleoverlapping non-aromatic ringsTwo phenyl ringswith assortedchlorinesThree 6-carbon ringchainThree 6-carbon ringchainOne 5- & two 6-carbon ring clusterOne 5- & two 6-carbon ring clusterOne 5- & two 6-carbon ring clusterTwo phenyl ringswith assortedchlorinesTwo phenyl ringswith assortedchlorines
Page Iof2

Notes:
COPC = Chemical of potential concernRfD = Reference dose1 U.S. Environmental Protection Agency's Integrated Risk Information System (IRIS). On-Line Address:
www.epa.gov/ngispgm3/iris/index.htmlb Most or all of the rings joined by 3 carbons.c Most or all of the rings joined by 2 carbons forming a chain or branched chain.
Page 2 of 2

TABLE G-ll
RECEPTOR-SPECIFIC EXPOSURE AND RISK RESULTSORAL REFERENCE DOSES
Chemical ofPotential ConcernAluminumArsenic
BariumCadmium (water)Cadmium (food)Chromium (HI)Cobalt
Copper
Cyanide (free)
ron
LeadMagnesium
ManganeseMercuryNickel (soluble salts)SeleniumSilverThallium
VanadiumZinc
1,1-Dichloroethane1,2-DichloroetheneJenzene
Chlorobenzenecis- 1 ,2-DichloroetheneEthylbenzenedethylene chloride
Tetrachloroethene
Trichloroethene
Vinyl chlorideCylenes
4,4'-DDD4,4'-DDEAroclor-1254
Aroclor-1260*
Oral RID(mg/kg-day)
l.OOE+003.00E-04
7.00E-02S.OE-04l.OE-03
1.5E+006.0E-02
3.7E-02
2.0E-02
3.0E-01
NANA
1.4E-01NA
2.0E-025.0E-035.0E-036.6E-OS
7.0E-033.0E-01
l.OE-019.0E-033.0E-03
2.0E-02l.OE-02
l.OOE-Ol6.0E-02l.OE-02
6.0E-3
3.0E-032.00E+00
NANA
2.0E-05
2.0E-05
Source(date accessed)
Region 9 (N)IRIS (2/6701)
IRIS (2/6701)IRIS (2/6701)IRIS (2/6701)IRIS (2/6701)
Region 9
Region 9
IRIS (2/6701)
Region 9
—-
IRIS (2/6701)—
IRIS (2/6701)IRIS (2/6701)IRIS (2/6701)Region 9 (I)
HEASTIRIS (2/6701)
HEASTHEAST
Region 9 (N)
IRIS (2/6/01)HEAST
IRIS (2/6701)IRIS (2/6701)IRIS (2/6/01)
Region 9 (X)
IKK (2/6/01)IRIS (2/6/01)
—_
IRIS (2/6701)
IRIS (2/6/01)
ConfidenceLevelLow
Medium
MediumHighHighLowLow
Low
Medium
Medium
----
Medium-
MediumHighLowLow
MediumMedium
LowLow
Medium
MediumLowLow
MediumMedium
Low
MediumMedium
—«
Medium
Medium
Critical Effect orSite of Critical Effect
Gastrointestinal disturbancesHyper pigmentation, ketosis, andpossible vascular complicationsNo adverse effectSignificant proteinuriaSignificant proteinuriaNo effects observedRespiratory dysfunction and skinsensitizationGastrointestinal irritation,vomiting, low blood pressureRespiratory arrest, death, livereffectsAcute toxicity causesgastrointestinal distress-—CNS effects--Decreased body and organ weightsClinical selenosisArgyriaGastrointestinal irritation and CNSdepressionRespiratory irritation
Decrease in erythrocytesuperoxide distribution (ESOD)ta effects observedjesions^eukemia, tumors, CNS
depressioniistopathological changes in liverDecrease hemoglobinjverand kidney damageJver toxicity
Hepatoxicity in mice and weightgain in ratsCNS depression, liver and kidneyeffectsLiver cell polymorphismHvperactivity, decreased bodyweight and increased mortality——Ocular exudate, inflamed andprominent meibamian glandsOcular exudate, inflamed andprominent meibamian glands
UF..3
3to10
100--
—
100
"
"--1
—30033~
1003
10001000
—
1000300010001001000
—
30100
"--
300
300
MF—1
111
10--
—
5
--
----1--I11
—
11
11"
11111
—
11
---1
1
Page 1 of 3

TABLE G-ll (Continued)
RECEPTOR-SPECIFIC EXPOSURE AND RISK RESULTSORAL REFERENCE DOSES
Chemical ofPotential ConcernDieldnn
Endosulfan II*
Endosulfan sulfate*
Endrin
Endhn aldehyde1"
Endrin ketone"
iepcacfalor epoxide
1 ,2-Dichlorobenzene1 ,4-DichlorobenzeneAcenaphtheneBenzo(a)pyieiKd
Dibenz(a4i)anthracenec
Xbenzofuran'luoranthene
Fluorene
Naphthalene
•henanthrene*Benzo(a)anthracene 'Benzo(b)fluoranthene '
lenzo(k)anthracene f
Indeno(l,2,3<d)pyrtne '
Aroclor-1242'
Aroclor-1248*
'otal dioxins and furans
OralRfD(mg/kg-day)
5.0E-05
6.0E-03
6.0E-03
3.0E-04
3.0E-04
3.0E-04
1.3E-05
9.0E-02NA
6.0E-023.0E-023.00E-013.00E-014.00E-02
4.00E-02
2.0E-02
3.00E-013.00E-014.00E-02
4.00E-02
3.00E-02
2.0E-OS
2.0E-05
NA
Source(date accessed)IRIS (2/6/01)
IRIS (2/6/01)
IRIS (2/6/01)
IRIS (2/6/01)
IRIS (2/6/01)
IRIS (2/6/01)
IRIS (2/6/01)
IRIS (2/6/01)-
IRIS (2/6/01)IRIS (2/6/01)IRIS (2/6/01)IRIS (2/6/01)IRIS (2/6/01)
IRIS (2/6/01)
IRIS (2/6/01)
IRIS (2/6/01)IRIS (2/6/01)IRIS (2/6/01)
IRIS (2/6/01)
IRIS (2/6701)
IRIS (2/6/01)
IRIS (2/6/01)
--
ConfidenceLevel
Medium
Medium
Medium
Medium
Medium
Medium
Low
Low
LowLowLowLowLow
Low
Low
LowLowLow
Low
Low
Medium
Medium
-
Critical Effect orSite of Critical Effect
Salivation, convulsions, and CNSeffectsReduced body weight gain inmales and females and progressiveglomemlonephrosisReduced body weight gain inmales and females and progressiveglomerulonephrosisMild histological lesions in liver,occasional convulsionsMild histological lesions in liver,occasional convulsionsMild histological lesions in liver,occasional convulsionsIncreased liver-to-body weightratioNo adverse effects observed-HepatotoxicityKidney EffectsNo observed effectsNo observed effectsNephropathy, increased liverweights, hematological alterationsDecreased red blood cell, packedcell volume, and hemoglobinDecreased mean terminal bodyweight in males (rats) and nausea,headache, and malaise in humans'•Jo observed effectsNo observed effectsNepropathy, increased liverweights, hematological alterations,and clinical effectsNepropathy, increased liverweights, hematological alterations,and clinical effectsNepropathy, increased liverweights, hematological alterations.and clinical effectsOcular exudate, inflamed andprominent meibamian glandsOcular exudate, inflamed andprominent meibamian glands-
UF100
100
100
100
100
100
1000
[WOO—
3,0003,0003.0003,0003,000
3,000
3.000
300030003000
30001
3000
300
300
--
MF1
1
1
1
1
1
1
1--
1
1
111
1
1
1
--
Page 2 of 3

Notes:
CNSHEAST
IRIS
Region 9
mg/kg-dayNAMFRfDUFNIX
TABLE G-ll (Continued)
RECEPTOR-SPECIFIC EXPOSURE AND RISK RESULTSORAL REFERENCE DOSES
Central nervous systemU.S. Environmental Protection Agency's (EPA) "Health Effects Assessment Summary Tables. FY1997 Update." Office of Solid Waste and Emergency Response (OSWER). EPA-540-R-97-036.July.EPA's Integrated Risk Information System. On-Line Address:http://www.epa.gov/ngispgni3/uis/index.htmlRegion 9 Preliminary Remediation Goals (PRGs). 2000 Edition. November 22. Accessed onMarch 20,2001. On-line address: http://www.epa.gov/region09/waste/sfund/prg/index.htmMilligram per kilogram-dayNot available in HEAST, IRIS, or in Region 9 tablesModifying factorReference doseUncertainty factorRegion 9 values referenced com NCEA valuesRegion 9 values referenced from IRIS valuesRegion 9 values withdrawnNot available
Based on the RfD for Endosulfan. See table G-10 for surrogate details.Based on the RfD for Endnn. See table G-10 for surrogate details.Based on the RfD for Anthracene. See table G-10 for surrogate details.Based on the RfD for Pyrene. See table G-10 for surrogate details.Based on the RfD for Aroclor-1254. See table G-10 for surrogate details.Based on the RfD for Fluoranthene. See table G-IO for surrogate details.
Page 3 of 3

TABLE G-12
RECEPTOR-SPECIFIC EXPOSURE AND RISK RESULTSINHALATION REFERENCE DOSES
Chemical ofPotential ConcernAluminumArsenicBariumCadmiumChromium (III)CobaltCopperCyanideIronLeadMagnesiumManganese
vlercury
NickelSeleniumSilverPhalli urn
Vanadium
Zinc1,1-Dichloroe thane1,2-DichloroetheneJenzene
Chlorobenzenecis- 1 ,2-Dichloroethene*EthylbenzeneMethylene chlorideTetrachloroethenerrichloroetheneVinyl chlorideXylenes4,4'-DDD4,4'-DDEAroclor-1254Aroclor-1260DieldrinEndosulfan 0"Endosulfan sulfatek
EndrinEndrin aldehyde*Endrin ketone*Heptachlor epoxide1 ,2-Dichlorobenzene1 ,4-Dichlorobenzene
InhalationRfD
(mg/kg-day)1.4E-03
NANANANANANANANANANA
1.4E-05
8.6E-05
NANANANANANA
l.OE-01NA
1.7E-03NA
l.OE-022.9E-018.6E-021. IE-016.0E-32.9E-022.0E-01
• NANANANA
5.0E-056.0E-036.0E-033.0E-043.0E-043.0E-041.3E-055.7E-022.3E-01
Source(date accessed)Region 9 (N)
---------------«
IRIS (2/6/01)
IRIS (2/6/01)
~-.«~——
HEAST—
Region 9 (N)—
Region 9 (R)IRIS (2/6/01)
HEASTRegion 9 (N)Region 9 (R)IRIS (2/6/01)Region 9 (X)
—~--
Region 9 (R)Region 9 (R)Region 9 (R)Region 9 (R)Region 9 (R)Region 9 (R)Region 9 (R)Region 9 (H)IRIS (2/6/01)
ConfidenceLevelLow
--•-----------------
Medium
Medium
-----------
Low-
Medium--
LowLow
MediumMedium
LowMediumMedium
--------
MediumMediumMediumMediumMediumMedium
LowLow
Medium
Critical Effect orSite of Critical Effect
Gastrointestinal disturbances------------------Impairment of neurobehavioralfunctionHand tremor, increases in memorydisturbances, autonomicdysfunction----------No effects observed-----Developmental toxicityLiver toxicity---Liver cell polymorphism---------------------Increased liver weights
UF----------——-----
1000
30
----------
1000--------
300100----30------------------------
100
MF—.------—--------1
1
-----------1--------11----1-----------------—----1
Page 1 of 2

TABLE G-12 (Continued)
RECEPTOR-SPECIFIC EXPOSURE AND RISK RESULTSINHALATION REFERENCE DOSES
Chemical ofPotential ConcernAcenaphtheneBenzo(a)pyreneDibenz(a,h)anthraceneDibenzofuranFluorantheneFluoreneNaphthalenePhenanthreneBenzo(a)anthraceneBenzo(b)fluorantheneBenzo(k)anthraceneIndeno( 1 ,2,3-cd)pyreneAroclor-1242Aroclor-1248Total dioxins and furans
InhalationRID
(nn/kf-day)NANANANANANA
8.6E-04NANANANANANANANA
Source(date accessed)
--------
IRIS (2/6/01)«-----------
ConfidenceLevel
------------
Low--------------
Critical Effect orSite of Critical Effect
-----------Nasal effects------------
UF-----------
3,000-----------
MF—------~--1--------•--
Notes:
CNSHEAST
IRIS
Region 9
mg/kg-dayNAMFRfDUFHRXN
Central nervous systemU.S. Environmental Protection Agency's (EPA) "Health Effects Assessment Summary Tables, FY1997 Update." Office of Solid Waste and Emergency Response (OSWER). EPA-540-R-97-036.July.EPA's Integrated Risk Information System. On-Line Address:http://www.epa.gov/ngispgm3/iris/index.htinlRegion 9 Preliminary Remediation Goals (PRGs). 2000 Edition. November 22. Accessed onMarch 20,2001. On-line address: http://www.epa.gov/region09/waste/sfund/prg/index.htmMilligram per kilogram-dayNot applicableModifying factorReference doseUncertainty factorRegion 9 values referenced from HEAST valuesRegion 9 values obtained by route extrapolationRegion 9 values withdrawnRegion 9 values referenced from NCEA values
Based on the RfD for cis- 1,2-DichloroethyleneBased on the RfD for EndosulfanBased on the RfD for EndrinThe inhalation RfD values were calculated from the IRIS values by multiplying the chemical specific RfC values by 20mVday and divided by 70 kg for the adult Region 9 values were obtained by this same calculation method.
Page 2 of 2

TABLE G-13
RECEPTOR-SPECIFIC EXPOSURE AND RISK RESULTSORAL SLOPE FACTORS
Chemical of Potential ConcernAluminumArsenicBariumCadmiumChromiumCobaltCopperCyanideIronLeadMagnesiumManganeseMercuryNickelSeleniumSilverThallliumVanadiumZinc1,1-Dichloroethane1,2-DichloroetheneBenzeneChlorobenzenecis- 1 ,2-DichloroetheneEthyl benzeneVlethylene chlorideTetrachloroetheneTrichloroetheneVinyl chlorideXylenes4,4'-DDD4,4'-DDEAroclor-1254Aroclor-1260, jDieldrinEndosulfan nEndosulfan sulfateEndrinEndrin aldehyde
OralSF(mg/kg-day)-1
NA1.5E+00
• NANANANANANANANANANANANANANANANANANANA
3.5E-02NANANA
7.5E-035.2E-021. IE-021.4E+00
NA2.4E-013.4E-012.0E+002.0E+001.6E+01
NANANANA
Source(date accessed)
—IRIS (3/20/01)
~———~—————~-——~———-
IRIS (3/20/01)~-~
IRIS (3/20/01)Region 9 (N)Region 9 (N)IRIS (3/20/01)
—IRIS (3/20/01)IRIS (3/20/01)IRIS (3/20/01) _jIRIS (3/20/01)IRIS (3/20/01)
—-—-
Weight ofEvidence*
—A—-—-—-—-——---~-----A~-—
B2C
C/B2A-
B2B2B2B2B2---—
Page 1 of 2

TABLE G-13 (Continued)
RECEPTOR-SPECIFIC EXPOSURE AND RISK RESULTSORAL SLOPE FACTORS
Chemical of Potential ConcernEndrin ketoneHeptachlor epoxide1 ,2-Dichlorobenzene1 ,4-DichlorobenzeneAcenaptheneBenzo(a)pyrene9ibenzo(a,h)anthraceneDibenzofuranFluorenerluroantheneNapthalenePhenantherene3enzo(a)anthraceneBenzo(b)fluoranthene)enzo(k)anthraceneIndemX l,2,3-cd)pyreneAroclor-1242Aroclor-1248Total dioxins and furans
Oral SF(mg/kg-day) '
NA9.1E+00
NA2.4E-02
NA7.3E+007.3E+00
NANANANANA
7.3E-017.3E-017.3E-027.3E-012.0E+002.0E+007.3E-01
Source(date accessed)
—IRIS (3/20/01)
—HEAST
—IRIS (3/20/01)IRIS (3/20/01)
—~~——
IRIS (3/20/01)IRIS (3/20/01)IRIS (3/20/01)IRIS (3/20/01)IRIS (3/20/01)IRIS (3/20/01)Region 9 (H)
Weight ofEvidence*
..B2—
B2~
B2B2~———-
B2B2B2B2B2B2B2
Notes:
HEAST
IRIS
Region 9
(mg/kg-day)'1NASFN
U.S. Environmental Protection Agency's (EPA) "Health Effects AssessmentSummary Tables, FY 1997 Update." Office of Solid Waste and EmergencyResponse (OSWER). EPA-540-R-97-036. July.EPA's Integrated Risk Information System. On-Line Address:http://www.epa.gov/ngispgm3/iris/index.htnilRegion 9 Preliminary Remediation Goals (PRGs). 2000 Edition. November 22.Accessed on March 20,2001. On-line address:http://www.epa.gov/region09/waste/sfund/prg/index.htni(milligram per kilogram-day)"1
Not applicableSlope factorRegion 9 value obtained from NCEA
The EPA's weight of evidence designation indicates the likelihood that a chemical iscarcinogenic to humans (see Section 4.2 of the main text for further explanation).Oral SFs for PAHs other than benzo(a)pyrene were calculated using EPA-derived toxicityequivalent factors (TEF) (see Appendix G-H).
Page 2 of 2

TABLE G-14
RECEPTOR-SPECIFIC EXPOSURE AND RISK RESULTSINHALATION SLOPE FACTORS
Chemical of Potential ConcernAluminumArsenicBariumCadmiumChromiumCobaltCopperCyanideIronLeadMagnesiumManganeseMercuryNickelSeleniumSilverThallium
VanadiumZinc. , 1 -Dichloroethane. ,2-Dichloroethenetenzene
Chlorobenzenecis- 1 ,2-DichloroetheneEthylbenzenedethylene chloride
Tetrachloroethenerrichloroethene
Vinyl chlorideXylenes4,4'-DDD4,4'-DDEAroclor-1254Aroclor-1260DieldrinEndosulfan nEndosulfan sulfateEndrinEndrin aldehyde
Inhalation SP(mg/kg-day)1
NA1.5E+00
NA6.3NANANANANANANANANANANANANANANANANA
1.8E-02NANANA
1.6E-035.2E-021. IE-023. IE-02
NA————
1.6E+01NANANANA
Source(date accessed)
—IRIS (3/20/01)
—IRIS (3/20/01)
——~————————~—————
IRIS (3/20/01)—-—
IRIS (3/20/01)Region 9 (N)Region 9 (N)IRIS (3/20/01)
-----
IRIS (3/20/01)--—-
Weight ofEvidence*
—A—
Bl———-——--—----—---A----
B2C
C/B2A-----
B2---—
Page 1 of 3
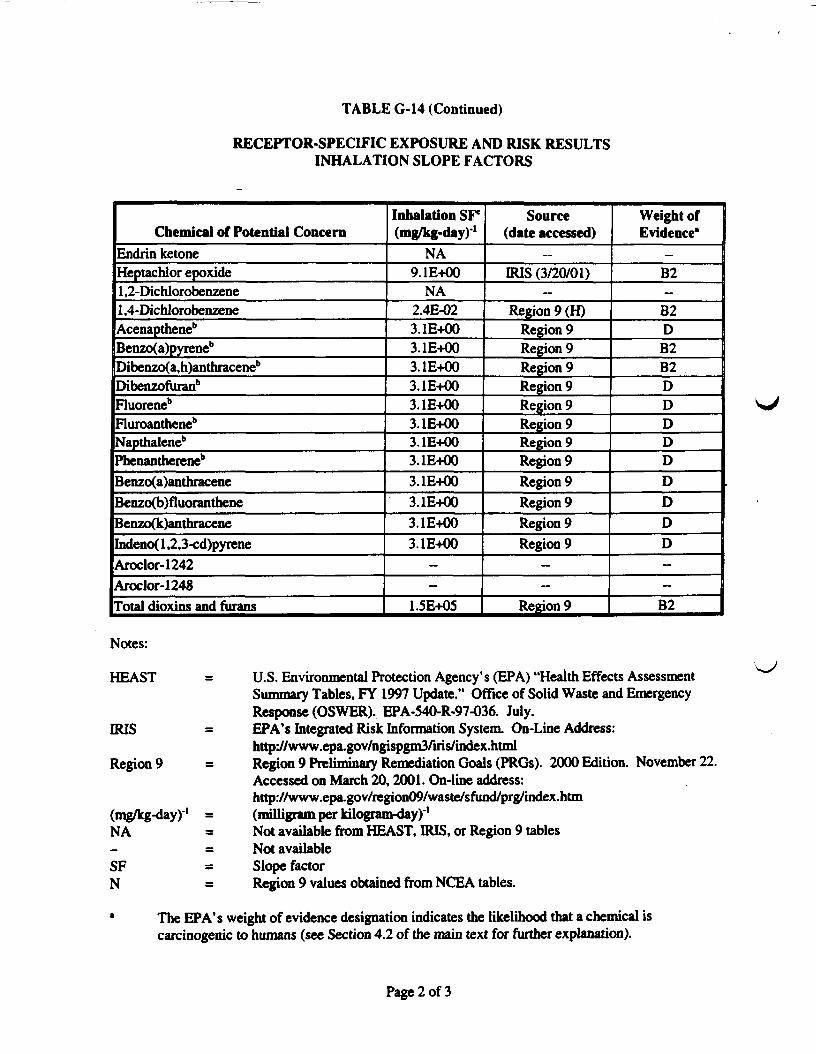
TABLE G-14 (Continued)
RECEPTOR-SPECIFIC EXPOSURE AND RISK RESULTSINHALATION SLOPE FACTORS
Chemical of Potential ConcernEndrin ketoneHeptachlor epoxide1 ,2-Dichlorobenzene1 ,4-DichlorobenzeneAcenaptheneb
Benzo(a)pyreneb
Dibenzo(a,h)anthraceneb
Dibenzofuranb
Fluoreneb
Fluroanthene6
Napthalene"Phenanthereneb
3enzo(a)anthracene3enzo(b)fluorantheneBenzo(k)anthraceneIndeno( 1 ,2,3-cd)pyreneAroclor-1242Aroclor-1248Total dioxins and furans
Inhalation SP(mg/kg-day)'1
NA9.1E+00
NA2.4E-023.1E+003.1E+003.1E+003.1E+003.1E+003.1E+003.1E+003.1E+003.1E+003.1E+003.1E+003.1E+00
—-
1.5E+05
Source(date accessed)
—IRIS (3/20/01)
—Region 9 (H)
Region 9Region 9Region 9Region 9Region 9Region 9Region 9Region 9Region 9Region 9Region 9Region 9
-—
Region 9
Weight ofEvidence*
—B2—
B2DB2B2DDDDDDDDD——
B2
Notes:
HEAST
IRIS
Region 9
(mg/kg-day)-'NA
SFN
U.S. Environmental Protection Agency's (EPA) "Health Effects AssessmentSummary Tables, FY 1997 Update." Office of Solid Waste and EmergencyResponse (OSWER). EPA-540-R-97-036. July.EPA's Integrated Risk Information System. On-Line Address:http://www.epa.gov/ngispgm3Aris/index.htmlRegion 9 Preliminary Remediation Goals (PRGs). 2000 Edition. November 22.Accessed on March 20,2001. On-line address:http://www.epa.gov/region09/waste/sfund/prg/index.htm(milligram per kilogram-day)'1Not available from HEAST, IRIS, or Region 9 tablesNot availableSlope factorRegion 9 values obtained from NCEA tables.
The EPA's weight of evidence designation indicates the likelihood that a chemical iscarcinogenic to humans (see Section 4.2 of the main text for further explanation).
Page 2 of 3

TABLE G-14 (Continued)
RECEPTOR-SPECIFIC EXPOSURE AND RISK RESULTSINHALATION SLOPE FACTORS
Oral SFs for PAHs other than benzo(a)pyrene were calculated using EPA-derived toxicityequivalent factors (TEF) (see Appendix G-H).
The inhalation SFs were obtained by multiplying the unit risk factor (URF) by 70 kg and dividingby 20 mVkg. Region 9 inhalation SFs were obtained using this formula.
Page 3 of 3

APPENDIX G
HUMAN HEALTH RISK ASSESSMENTROCKWELL INTERNATIONAL CORPORATION
ALLEGAN, MICHIGAN
(942 Pages)

CONTENTS
Section Page
Volume II
ACRONYMS, ABBREVIATIONS, AND SYMBOLS . . . . . . . . . . . . . . . . . . . . . . . . . . . . . . . . . . . . . G-v
1.0 INTRODUCTION . . . . . . . . . . . . . . . . . . . . . . . . . . . . . . . . . . . . . . . . . . . . . . . . . . . . . . . . . G-l-1
1.1 HHRA OBJECTIVE . . . . . . . . . . . . . . . . . . . . . . . . . . . . . . . . . . . . . . . . . . . . . . . . . G-l-21.2 HHRA TECHNICAL APPROACH . . . . . . . . . . . . . . . . . . . . . . . . . . . . . . . . . . . . . G-l-3
2.0 DATA EVALUATION AND IDENTIFICATION OF COPCs . . . . . . . . . . . . . . . . . . . . . . . G-2-l
2.1 DATA COLLECTION . . . . . . . . . . . . . . . . . . . . . . . . . . . . . . . . . . . . . . . . . . . . . . . G-2-l2.2 DATA EVALUATION . . . . . . . . . . . . . . . . . . . . . . . . . . . . . . . . . . . . . . . . . . . . . . . G-2-2
2.2. 1 Data Evaluation of Soil Sampling Results . . . . . . . . . . . . . . . . . . . . . . . . . . G-2-52.2.2 Data Evaluation of LNAPL Sampling Results . . . . . . . . . . . . . . . . . . . . . . . G-2-62.2.3 Data Evaluation of Groundwater Sampling Results . . . . . . . . . . . . . . . . . . . G-2-62.2.4 Data Evaluation of Surface Water Sampling Results . . . . . . . . . . . . . . . . . . G-2-72.2.5 Data Evaluation of Sediment Sampling Results . . . . . . . . . . . . . . . . . . . . . . G-2-82.2.6 Medium-Specific Data Sets . . . . . . . . . . . . . . . . . . . . . . . . . . . . . . . . . . . . . G-2-9
2.3 IDENTIFICATION OF COPCs . . . . . . . . . . . . . . . . . . . . . . . . . . . . . . . . . . . . . . . . G-2-10
2.3.1 COPC Selection Process . . . . . . . . . . . . . . . . . . . . . . . . . . . . . . . . . . . . . . . G-2-102.3.2 Medium-Specific COPCs . . . . . . . . . . . . . . . . . . . . . . . . . . . . . . . . . . . . . . G-2-16
2.4 MODELING ACTIVITIES . . . . . . . . . . . . . . . . . . . . . . . . . . . . . . . . . . . . . . . . . . . G-2-162.5 UNCERTAINTIES RELATED TO IDENTIFICATION OF COPCS . . . . . . . . . . G-2-17
2.5. 1 Assumption of Steady-State Conditions . . . . . . . . . . . . . . . . . . . . . . . . . . . G-2-172.5.2 Number and Type of Samples Collected . . . . . . . . . . . . . . . . . . . . . . . . . . G-2-172.5.3 Lack of Air Samples Collected . . . . . . . . . . . . . . . . . . . . . . . . . . . . . . . . . . G-2-182.5.4 Elevated Detection Limits . . . . . . . . . . . . . . . . . . . . . . . . . . . . . . . . . . . . . G-2-18
3.0 EXPOSURE ASSESSMENT . . . . . . . . . . . . . . . . . . . . . . . . . . . . . . . . . . . . . . . . . . . . . . . . . G-3-1
3.1 EXPOSURE SETTING CHARACTERIZATION . . . . . . . . . . . . . . . . . . . . . . . . . . G-3-1
3.1.1 Physical Setting . . . . . . . . . . . . . . . . . . . . . . . . . . . . . . . . . . . . . . . . . . . . . . G-3-13.1.2 Demographics . . . . . . . . . . . . . . . . . . . . . . . . . . . . . . . . . . . . . . . . . . . . . . . . G-3-3
3.2 CONCEPTUAL SITE MODEL .
3.2. 1 Contaminant Sources and Mechanisms of Release . . . . . . . . . . . . . . . . . . . G-3-43.2.2 Potential Receptors and Exposure Pathways . . . . . . . . . . . . . . . . . . . . . . . . G-3-73.2.3 Exposure Scenarios . . . . . . . . . . . . . . . . . . . . . . . . . . . . . . . . . . . . . . . . . . . . G-3-8
G-i

CONTENTS (Continued)
3.3 EXPOSURE QUANTIFICATION . . . . . . . . . . . . . . . . . . . . . . . . . . . . . . . . . . . . . G-3-12
3.3.1 Exposure Point Concentrations . . . . . . . . . . . . . . . . . . . . . . . . . . . . . . . . . G-3-133.3.2" Pathway-Specific Intake Equations and Exposure Parameters . . . . . . . . . . G-3-18
3.4 EXPOSURE ASSESSMENT UNCERTAINTIES . . . . . . . . . . . . . . . . . . . . . . . . . G-3-24
3.4.1 Environmental Chemical Concentrations . . . . . . . . . . . . . . . . . . . . . . . . . . G-3-253.4.2 Exposure Pathway Identification . . . . . . . . . . . . . . . . . . . . . . . . . . . . . . . . G-3-273.4.3 Exposure Parameters and Assumptions . . . . . . . . . . . . . . . . . . . . . . . . . . . G-3-273.4.4 Assumption of Steady-State Conditions . . . . . . . . . . . . . . . . . . . . . . . . . . . G-3-28
4.0 TOXICITY ASSESSMENT . . . . . . . . . . . . . . . . . . . . . . . . . . . . . . . . . . . . . . . . . . . . . . . . . . G-4-1
4. 1 TOXICITY VALUES FOR NONCARCINOGENIC COPCs . . . . . . . . . . . . . . . . . . G-4-14.2 TOXICITY VALUES FOR CARCINOGENIC COPCs . . . . . . . . . . . . . . . . . . . . . . G^-34.3 ESTIMATION OF TOXICITY VALUES FOR DERMAL EXPOSURE . . . . . . . . G-4-44.4 TOXICITY PROFILES . . . . . . . . . . . . . . . . . . . . . . . . . . . . . . . . . . . . . . . . . . . . . . . G-4-54.5 UNCERTAINTIES RELATED TO TOXICITY VALUES . . . . . . . . . . . . . . . . . .
4.5. 1 Extrapolation of Animal Data to Humans . . . . . . . . . . . . . . . . . . . . . . . . . . G-4-5 .4.5.2 Limited Availability of Chemical-Specific Data . . . . . . . . . . . . . . . . . . . . . G-4-64.5.3 Toxicity Value Extrapolation . . . . . . . . . . . . . . . . . . . . . . . . . . . . . . . . . . . . G-4-64.5.4 Modeling of SFs . . . . . . . . . . . . . . . . . . . . . . . . . . . . . . . . . . . . . . . . . . . . . . G4-64.5.5 Estimation of Toxicity Values for Dermal Exposure . . . . . . . . . . . . . . . . . . G-4-7
5.0 RISK AND HAZARD CHARACTERIZATION .................................. G-5-1
5.1 RISK AND HAZARD CHARACTERIZATION METHODOLOGY ........... G-5-1
5. 1. 1 Carcinogenic Risks . . . . . . . . . . . . . . . . . . . . . . . . . . . . . . . . . . . . . . . . . . . . G-5-15. 1.2 Noncarcinogenic Hazards . . . . . . . . . . . . . . . . . . . . . . . . . . . . . . . . . . . . . . . G-5-3
5.2 RISK AND HAZARD ESTIMATES . . . . . . . . . . . . . . . . . . . . . . . . . . . . . . . . . . . . G-5-4
5.2. 1 Sitewide (On-Site) Risk and Hazard Estimates . . . . . . . . . . . . . . . . . . . . . . G-5-5
5.2. 1. 1 Current Land-Use Scenario . . . . . . . . . . . . . . . . . . . . . . . . . . . . . . . G-5-65.2.1.2 Current and Future Land-Use Scenarios . . . . . . . . . . . . . . . . . . . . . G-5-65.2.1.3 Future Land-Use Scenario . . . . . . . . . . . . . . . . . . . . . . . . . . . . . . . . G-5-8
5.2.2 Area-Specific Risk and Hazard Estimates . . . . . . . . . . . . . . . . . . . . . . . . . G-5-1 1
5.2.2.1 Current Land-Use Scenario . . . . . . . . . . . . . . . . . . . . . . . . . . . . . . G-5-125.2.2.2 Current and Future Land-Use Scenarios . . . . . . . . . . . . . . . . . . . . G-5-135.2.2.3 Future Land-Use Scenario . . . . . . . . . . . . . . . . . . . . . . . . . . . . . . . G-5-21
G-ii

CONTENTS (Continued)
5.3 RISK AND HAZARD ESTIMATES - LEAD . . . . . . . . . . . . . . . . . . . . . . . . . . . . G-5-27
5.3.1 Child Methodology and Results . . . . . . . . . . . . . . . . . . . . . . . . . . G-5-27- 5.3.2 Adult Methodology and Results . . . . . . . . . . . . . . . . . . . . . . . . . . G-5-28
5.4 RISK AND HAZARD ESTIMATES - INDOOR AIR VOCS FROMGROUNDWATER . . . . . . . . . . . . . . . . . . . . . . . . . . . . . . . . . . . . . . . . . . . . . . . . . G-5-29
5.5 RISK AND HAZARD CHARACTERIZATION UNCERTAINTIES . . . . . . . . . . G-5-29
5.5.1 Assumption of Future Groundwater Use . . . . . . . . . . . . . . . . . . . . G-5-305.5.2 Use of Dermal Adherence Values . . . . . . . . . . . . . . . . . . . . . . . . . G-5-305.5.3 Other Sources of Uncertainty . . . . . . . . . . . . . . . . . . . . . . . . . . . . G-5-30
6.0 HHRA SUMMARY . . . . . . . . . . . . . . . . . . . . . . . . . . . . . . . . . . . . . . . . . . . . . . . . . . . . . . . . G-6-1
6.1 DATA EVALUATION AND COPC SELECTION . . . . . . . . . . . . . . . . . . . . . . . . . G-6-16.2 EXPOSURE ASSESSMENT . . . . . . . . . . . . . . . . . . . . . . . . . . . . . . . . . . . . . . . . . . G-6-36.3 TOXICITY ASSESSMENT . . . . . . . . . . . . . . . . . . . . . . . . . . . . . . . . . . . . . . . . . . . G-6-46.4 RISK AND HAZARD CHARACTERIZATION . . . . . . . . . . . . . . . . . . . . . . . . . . . G-6-5
6.4.1 Sitewide and Off-Property Risk and Hazard Summary . . . . . . . . . . G-6-5 .6.4.2 On-Site Area-Specific Risk and Hazard Summary . . . . . . . . . . . . . G-6-7
REFERENCES . . . . . . . . . . . . . . . . . . . . . . . . . . . . . . . . . . . . . . . . . . . . . . . . . . . . . . . . . . . . . . . . . . G-R-1
Attachment
MDEQ COMMENTS ON DRAFT HHRA DATED MAY 9,2001
FIGURES
G-l HHRA AREAS
G-2 CONCEPTUAL SITE MODELG-3 SITEWIDE AND OFF-PROPERTY RME RISK AND HAZARD SUMMARYG-4 SITEWIDE AND OFF-PROPERTY CT RISK AND HAZARD SUMMARY
G-iii
CONTENTS (Continued)
TABLES
G-l DATA GROUPINGS
G-2 CHEMICALS DETECTED IN AT LEAST ONE MEDIUM-SPECIFIC SAMPLEG-3 COMPARISON OF ESTIMATED ON-SITE TOTAL DAILY INTAKES AND REFERENCE
INTAKES FOR CALCIUM, MAGNESIUM, AND SODIUMG-4 SFTEWIDE (ON-SITE) MEDIUM-SPECIFIC COPCsG-5 AREA- AND MEDIUM-SPECIFIC COPCsG-6 EXPOSURE POINT CONCENTRATIONSG-7 CHEMICAL-SPECIFIC PLANT-SOIL BIOCONCENTRATION FACTORSG-8 ABSORPTION FACTORS
G-9 DAEVENT CHEMICAL-SPECfflC CONSTANTSG-10 SURROGATE CHEMICALS FOR COPCs WITHOUT REFERENCE DOSES
G-11 RECEPTOR-SPECIFIC EXPOSURE AND RISK RESULTS - ORAL REFERENCE DOSESG-12 RECEPTOR-SPECIFIC EXPOSURE AND RISK RESULTS - INHALATION REFERENCE
DOSESG-13 RECEPTOR-SPECIFIC EXPOSURE AND RISK RESULTS - ORAL SLOPE FACTORS
G-14 RECEPTOR-SPECIFIC EXPOSURE AND RISK RESULTS - INHALATION SLOPEFACTORS
G-15 SUMMARY OF GASTROINTESTINAL ABSORPTION EFFICIENCY VALUES (ABSGI)AND RECOMMENDATIONS FOR ADJUSTMENT OF ORAL TOXICITY VALUES FORSPECIFIC COMPOUNDS
Volume IIIAppendixG-A HHRA DATA TABLESG-B SUMMARY OFSTATISTICSG-C CALCULATION OF PARTICULATE EMISSIONS AND AIR CONCENTRATIONSG-D INDOOR AIR CONCENTRATIONS OF VOCS FROM GROUNDWATER AND LNAPL AND
CONSTRUCTION OR UTILITY WORKER TRENCH AIR CONCENTRATIONS OF VOCSFROM GROUNDWATER
G-E ESTIMATION OF RISKS ASSOCIATED WITH EXPOSURE TO LEAD
G-F EXPOSURE FACTOR TABLESG-G EXPOSURE AND RISK RESULTSG-H TOXICOLOGICAL PROFILES
G-iv

ACRONYMS, ABBREVIATIONS, AND SYMBOLS
ADA American Dietetic AssociationADD Average daily doseAF Adherence factorAI Adequate intakeAOI Area of interestARAR Applicable or relevant and appropriate requirementAware Aware, Inc.bgs Below ground surfaceCLP Contract Laboratory Programcm2 Square centimeterCOPC Chemical of potential concernCRDL Contract-required detection limitCSM Conceptual site modelCT Central tendencyDCES Delaware Cooperative Extension ServiceDRI Dietary reference intakeE&E Ecology and Environment, Inc.EAR Estimated average requirementECAO Environmental Criteria and Assessment OfficeELCR Excess lifetime cancer riskEPA U.S. Environmental Protection AgencyEPC Exposure point concentrationERD Environmental Response DivisionESC Environmental Strategies CorporationFR Federal RegisterFS Feasibility studyFSP Field sampling planG.I. GastrointestinalHBSL Health-b.ased screening levelHCV Human cancer valueHealthtouch Healthtouch OnlineHEAST Health Effects Assessment Summary TablesHHRA Human health risk assessmentHNV Human noncancer valueHQj Initial hazard quotienthr/day Hour per dayIEUBK "Integrated Exposure Uptake Biokinetic Model for Lead in Children"IRIS Integrated Risk Information System
G-v

ACRONYMS, ABBREVIATIONS, ANT) SYMBOLS (Continued)
kg KilogramLADD Lifetime average daily doseL/day Liter_per dayLNAPL Light nonaqueous-phase liquidLOAEL Lowest observed adverse effect levelMDEQ Michigan Department of Environmental QualityMDNR Michigan Department of Natural Resourcesmg/cnr Milligram per square centimetermg/day Milligram per daymg/kg Milligram per kilogrammg/kg-day Milligram per kilogram of body weight per daymg/L Milligram per litermg/m3 Milligram per cubic meterm3/hr Cubic meter per hourNAS National Academy of SciencesNCP National Oil and Hazardous Substances Pollution Contingency PlanNOAEL No observed adverse effect levelOERR Office of Emergency and Remedial ResponseORD Office of Research and DevelopmentOSWER Office of Solid Waste and Emergency ResponsePAH Polynuclear aromatic hydrocarbonPbB Blood lead concentrationPCB Polychlorinated biphenylPEF Paniculate emission factorPOTW Publicly owned treatment worksppm Pan per millionPRG Preliminary remediation goalQAPP Quality assurance project plan •RAGS "Risk Assessment Guidance for Superfund, Volume I: Human Health Evaluation Manual
(PartA)!'RBRG Risk-based remediation goalRDA Recommended dietary allowanceRfC Reference concentrationRfD Reference doseRI Remedial investigationRME Reasonable maximum exposureRMT Residual Management Technology, Inc.Rockwell Rockwell International CorporationSF Slope factor
G-vi

ACRONYMS, ABBREVIATIONS, AND SYMBOLS (Continued)
SOP Standard operating procedureSOS Soluble oil separationSQL Sample quantitation limitSVOC Semivolatile organic compoundsTCAPCOA Toxic Committee of the California Air Control Officers AssociationTDI Total daily intakeTetra Tech Tetra Tech EM Inc.UCL95 95th percentile upper confidence limitUIL Upper intake levelURF Unit risk factorUSDA U.S. Department of AgricultureVOC Volatile organic compoundWSDE Washington State Department of EcologyWWTP Wastewater treatment plant,ug/L Microgram per literjug/kg Microgram per kilogram
G-vii

1.0 INTRODUCTION
Tetra Tech EM Inc. (Tetra Tech) prepared this human health risk assessment (HHRA) for the RockwellInternational Corporation (Rockwell) site. This assessment is based on data obtained during the sitecharacterization and sampling activities discussed in the remedial investigation (RI) report prepared byTetra Tech.
As described in U.S. Environmental Protection Agency (EPA) guidance, an HHRA is typically conductedin the following four basic steps: (1) data evaluation and identification of chemicals of potential concern(COPC), (2) exposure assessment, (3) toxicity assessment, and (4) risk and hazard characterization(EPA 1989). These four steps and a risk assessment summary step are discussed as detailed below inSections 2.0 through 6.0 of this HHRA.
Section 2.0, Data Evaluation and Identification of COPCs: This section summarizesdata collection and evaluation activities, discusses modeling issues, and identifiesCOPCs.
Section 3.0, Exposure Assessment: This section characterizes the exposure setting,identifies potential human exposure pathways, estimates environmental concentrations ofCOPCs at points of potential exposure (exposure point concentrations [EPC]) and humanintake or dose, and discusses exposure assessment uncertainties.
Section 4.0, Toxicity Assessment: This section summarizes relevant toxicologicalinformation, including regulatory toxicity criteria for the COPCs.
Section 5.0, Risk and Hazard Characterization: This section discusses numericalestimates of carcinogenic risks and noncarcinogenic hazards, general conclusionsregarding potential risks and hazards associated with exposure to COPCs under bothcurrent and potential future land-use scenarios, the COPCs and exposure pathways thatcontribute most significantly to the overall risks and hazards, and major uncertaintiesassociated with these estimates.
Section'6.0, HHRA Summary: This section summarizes the HHRA process, majorassumptions, and significant conclusions and uncertainties related to the HHRA.
References, figures, and tables cited in this report are presented after Section 6.0. In addition, the reportalso includes eight appendixes that document data and methods used to perform the HHRA. These
appendixes are identified below.
• Appendix G-A: HHRA data tables, including sitewide and area-specific tables
G-l-1

Appendix G-B: Summary of statistics for soil, light nonaqueous-phase liquid (LNAPL).groundwater, surface water, and sediment COPCs
Appendix G-C: Discussion of the algorithms, assumptions, and input parameter valuesused to estimate source area- and land-use scenario-specific estimates of paniculateemissions and COPC-specific on-site and off-property air concentrations associated withparticulate emissions
Appendix G-D: Discussion of the algorithms, assumptions, and input parameter valuesused to estimate indoor air concentrations and volatilization of contaminants fromgroundwater to air in trenches
Appendix G-E: Discussion of the algorithms, assumptions, and input parameter valuesused to estimate receptor- and land-use scenario-specific risks associated with potentialexposure to lead in on-site soil
Appendix G-F: Exposure Factor Tables: Tables showing the equations and parametervalues used for each exposure pathway
Appendix G-G: Sitewide and area-specific exposure, risk, and hazard results underreasonable maximum exposure and central tendency conditions
Appendix G-H: Toxicological profiles for COPCs
The HHRA objective and technical approach are discussed below. This final HHRA addresses MichiganDepartment of Environmental Quality (MDEQ) comments, as appropriate, on the draft HHRA datedMay 9, 2001 (see attachment).
1.1 HHRA OBJECTIVE
The objective of this HHRA is to evaluate potential risks and hazards associated with human exposure toCOPCs associated with the Rockwell site under both current and potential future land-use scenarios.Specifically, the HHRA evaluates exposures, hazards, and risks to human health under the currentabandoned and industrial land-use scenarios and future residential, recreational, and industrial land-usescenarios at the site. The HHRA also evaluates site-related exposures, hazards, and risks to human healthfor off-property areas potentially impacted by releases from the site such as residences in the vicinity ofthe site and recreational uses of the adjacent Kalamazoo River. However, it should be noted that site-specific remediation goals will not be based on this HHRA. Applicable or relevant and appropriaterequirements (ARAR) providing the basis for site-specific remediation goals include MDEQ Part 201cleanup criteria and EPA Region DC preliminary remediation goals (PRO). Hazards and risks are
G-l-2

calculated for sitewide exposures to on-site soil and groundwater as well as for area-specific exposures inthe following areas:
• Forrner soluble oil separation (SOS) pond area• Former Rockwell wastewater treatment plant (WWTP) area• Former on-site railroad right-of-way• Grassy area• Area under and north of the former west manufacturing building• Saturated zone beneath the former City of Allegan landfill• Former off-property railroad right-of-way• Off-property residential area (background soil)
• Kalamazoo River downstream shoreline only
Area-specific hazards and risks were not evaluated for on-site groundwater because groundwater moves
readily between areas. The HHRA areas are identified in Figure G-l. These areas include all areas ofinterest (AOI) identified in the Rockwell RI report. In addition, several unique areas are included in the 'HHRA because exposure scenarios differed throughout portions of AOIs (such as the former railroadright-of-way, which is split into off-property and on-site areas, and the Kalamazoo River, downstreamshoreline only). An additional HHRA area was also created for residential areas where soil backgroundsamples were collected for the RI. These locations, except for RW-BG04-0507, were determined to beaffected by the site. The sampling area is identified as the HHRA off-property residential area
(background soil).
1.2 HHRA TECHNICAL APPROACH
The HHRA was prepared in accordance with EPA and MDEQ guidance. Some of the key guidancedocuments used to prepare the HHRA are listed below. This list is not comprehensive, and other EPAand MDEQ guidance documents as well as other documents are cited in the text as appropriate.
EPA Guidance Documents
1988. "Superfund Exposure Assessment Manual." Office of Emergency and RemedialResponse (OERR). Washington, DC. EPA/540/1-88/001. April.
G-l-3

1989. "Risk Assessment Guidance for Superfund. Volume 1: Human Health EvaluationManual (Part A)" (RAGS). OERR. Washington. DC. EPA/540/1-89/002. Interim Final.December.
1991. "RAGS, Volume I: Human Health Evaluation Manual, Supplemental Guidance:Standard Default Exposure Factors." Office of Solid Waste and Emergency Response(OSWER) Directive 9285.6-03. Interim Final. March 25.
1991. "RAGS, Volume 1: Human Health Evaluation Manual (Part B), Development ofRisk-Based Preliminary Remediation Goals." Interim. Publication 9285.7-0IB.December.
1992. "Dermal Exposure Assessment: Principles and Applications." Office of Healthand Environmental Assessment. Interim Report. EP A/600/8-91/01 IB. January.
1996. "Proposed Guidelines for Carcinogenic Risk Assessment." Federal Register(FR). 61 FR 7960. Volume 61. Number 79. April 23.
1996. "Soil Screening Guidance: Technical Background Document." OSWER.EPA/540/R-95/128. May.
1997. "Exposure Factors Handbook." Volumes 1 through 3. Office of Research andDevelopment. EPA/600/P-95/002Fa,-Fb, and-Fc. August.
MDEQ Guidance Documents
1998. "Part 201 Generic Soil Direct Contact Criteria: Technical Support Document."Environmental Response Division (ERD). August 31.
1998. "Part 201 Generic Drinking Water Criteria: Technical Support Document."ERD. August 31.
1998. "Part 201 Generic Soil Inhalation Criteria for Ambient Air: Technical SupportDocument." ERD. August 31.
1998. "Part 201 Generic Soil/Water Partitioning Criteria: Technical SupportDocument." ERD. August 31.
2000. "Part 201 Cleanup Criteria Changes for June 7, 2000." ERD Accessed on January18, 2001. On-Line Address: http://www.deq.state.mi.us/erd/critguide
The HHRA was conducted in accordance with the four basic steps discussed in Section 1.0. Thetechnical approach for each step is discussed in detail in Sections 2.0 through 6.0 of the HHRA.
G-l-4

2.0 DATA EVALUATION AND IDENTIFICATION OF COPCs
The primary purpose of this section is to discuss methods used to identify COPCs associated with the
Rockwell site. COPCs represent chemicals that may be site-related, are carried through the remainder ofthe HHRA and for which carcinogenic risks and noncarcinogenic hazards are estimated. The section isorganized as:
• Section 2.1, data collection• Section 2.2, data evaluation• Section 2.3, COPC identification process• Section 2.4, modeling activities conducted to fill data gaps• Section 2.5, uncertainties related to the identification of COPCs
2.1 DATA COLLECTION
Historical investigations that have been conducted at the Rockwell site include the following:
• Shilts & Graves oil seepage investigation (1975)
• Residual Management Technology, Inc. (RMT), surface and well evaluation (1984)
• Ecology and Environment, Inc. (E&E), preliminary site assessment (1994)
• Aware, Inc. (Aware), resampling and analysis (1985)
• Remcor; Environmental Strategies Corporation; McLaren/Hart, Inc.; and PTIEnvironmental Services Rl/feasibility study (FS) (1990, 1992, 1993, and 1996)
Tetra Tech has identified data gaps in previous investigations, and differences in the investigations makeusing and combining data from them difficult and, in some cases, inappropriate (EPA 1992b). Theobjectives of Tetra Tech's RI/FS include filling data gaps identified by Tetra Tech's conceptual sitemodel (CSM) and conducting an HHRA for soil, LNAPL, groundwater, sediment, and surface watermatrices associated with the site. Therefore, this HHRA is based solely on data collected by Tetra Techas part of the RI because these data represent the most complete and consistent set of data for the
Rockwell site. Also, the Tetra Tech RI provides adequate data to evaluate potential risks and hazards tohuman health at the Rockwell site. The RI report provides additional details on data collectionmethodologies.
G-2-1

MDEQ conducted several investigations at the Rockwell site after the Tetra Tech RI. Theseinvestigations are documented in the following reports:
• Earth Tech, Inc. (Earth Tech). 2001. 'Technical Memorandum, Former ManufacturingBuilding Investigation."
• Earth Tech. 2001. 'Technical Memorandum No. 2 - Addendum. Southern OutfallInvestigation."
These and other recent MDEQ investigations provide additional detail regarding the nature and extent ofcontamination at the site. However, the data collected during these investigations are not included in thisHHRA. The additional data does not alter the conclusion of this HHRA, which documents thatsignificant risk to human health exists at the Rockwell site.
2.2 DATA EVALUATION
EPA's "Guidance for Data Useability in Risk Assessment (Part A) Final" identifies five primary criteria -that ideally should be satisfied before data are used in a quantitative risk assessment (EPA 1992b). Thesecriteria are summarized below.
Reports should be available to risk assessors that include site descriptions and presentthe sampling program design, sampling locations, analytical methods, detection limits,sampling results, and sample quantitation limits (SQL).
Documentation should be available for review of sampling results as they relate togeographic locations (that is chain-of-custody documentation, standard operatingprocedures [SOP], and field and analytical records).
Sampling results should be available for each medium within an exposure area generatedusing a broad spectrum of analytical techniques as well as documentation of any fieldmeasurements needed to support fate and transport modeling.
Acceptable analytical methods should have been used with SQLs capable of detectingconcentrations of significant health concern.
Data validation review should have been performed including consideration of datacompleteness, comparability, representativeness, precision, and accuracy.
Data collected by Tetra Tech as part of the RI meet all five of these primary criteria as summarizedbelow.
G-2-2

Samples were collected and analyzed in accordance with the EPA-approved site-specific plans(Tetra Tech 2000a). As described in the RI quality assurance project plan (QAPP) and field samplingplan (FSP), samples were generally analyzed in accordance with EPA Contract Laboratory Program(CLP) procedures and protocols for volatile organic compounds (VOC), semivolatile organic compounds(SVOC), pesticides and polychlorinated biphenyls (PCB), and metals. The analytical methods wereselected in part to ensure to the degree possible that the method detection limits used were capable ofdetecting concentrations of significant health concern (Tetra Tech 2000a). However, many "screening"samples were collected during the RI that do not meet the level of data quality required for quantitativerisk assessment; therefore, only samples analyzed by approved CLP laboratories were included in theHHRA. RI analytical results analyzed by approved CLP laboratories include those analyzed by the EPARegion 5 CLP laboratory and Southwest Laboratories of Oklahoma. Documentation of all samplingprocedures, records, and results was available to the risk assessment team.
Documentation regarding data needed to support fate and transport modeling in the HHRA was alsoavailable to the risk assessment team except for silt and moisture content of surficial soil needed forpaniculate emissions modeling. However, subsurface soil silt and moisture content data were collectedduring RI field activities and used as a surrogate for surface soil silt and moisture content data.Appendix G-C provides methods for the evaluation and results of paniculate emission modelingcalculations.
RI data were all subject to a data validation review. Analytical results produced by the EPA CLPlaboratory were validated by EPA. EPA's validation reports were provided to Tetra Tech with each datapackage. Analytical results produced by all other laboratories were validated by Tetra Tech.Appendix D of the RI report presents Tetra Tech's data validation report. Only data determined by thedata validation procedures to be acceptable for use were considered in the quantitative HHRA. All datawere acceptable for use; however, several samples had concentrations less than five times the maximumblank-related concentrations. The concentrations in the samples associated with contaminated blankswere treated as nondetect, and the detection limits were adjusted to equal one half of the contract-required detection limit (CRDL) in accordance with EPA guidance (EPA 1989).
Tables G-A-1 through G-A-23 in Appendix G-A compare sitewide sample analytical results to health-based screening levels (HBSL) (or CRDLs when HBSLs were not available) and are color-codedaccording to specific data evaluation parameters and the results of these comparisons. Red indicates asample concentration that exceeds the HBSL for that analyte, yellow indicates a sample-specific
G-2-3

detection limit that exceeds the HBSL. green indicates a sample-specific detection limit significantlyhigher than that of other samples for the same analyte, and dark blue indicates a sample in a specific data
set with contamination in a blank used for that data set. Only samples with a concentration less than five
times the maximum blank-related concentration are presented in dark blue. Light blue indicates ananalyte that was not detected in any sample for a given medium. Pink indicates that a HBSL wasmodified to equal a soil background concentration (only applicable to metals). Tables G-A-24 throughG-A-84 in Appendix G-A compare area-specific analytical results to HBSLs. These data sets are subsetsof the sitewide analytical results.
As indicated in MDEQ's May 9,2001, comments on the HHRA, MDEQ provided EPA with alternateHBSLs for several contaminants. These alternate HBSLs are listed in Tables 7 through 11 of the RIreport. The alternate HBSLs differ from the HBSLs included in the HHRA as discussed below.
State-wide background values presented in MDEQ's Pan 201 criteria for soil were usedinstead of the site-specific background concentrations included in the HHRA foraluminum, chromium, cobalt, iron, manganese, and silver.
For lead, the HBSL proposed by MDEQ is based on direct contact with soil instead ofthe site-specific background concentration included in the HHRA.
For LNAPL, the HBSL proposed by MDEQ is based on groundwater screening criteriainstead of the soil-based criteria included in the HHRA.
With the exception of the alternate LNAPL criteria, all criteria proposed by MDEQ are higher thanHBSLs used in the HHRA. Higher HBSLs may result in the exclusion of several COPCs now includedin the HHRA. For LNAPL, alternate HBSLs are both higher and lower than HHRA HBSLs. However,risks and hazards significantly exceeding appropriate thresholds for LNAPL are identified in this HHRA.Therefore, use of the alternate HBSLs does not alter the conclusions of the HHRA and no alternateHBSLs are included in the final HHRA.
As discussed above, the first, second, third, and fifth of EPA's data evaluation criteria were all met fordata included in the HHRA. The remainder of Section 2.2, specifically Sections 2.2.1 through 2.2.5,focuses on the fourth of EPA's criteria - whether acceptable analytical methods were used with SQLscapable of detecting concentrations of potential health concern (HBSLs, as described above).
Section 2.2.6 summarizes medium-specific data sets used as the foundation of the HHRA.
G-2-4

2.2.1 Data Evaluation of Soil Sampling Results
Tables G-A-1 through G-A-5 in Appendix G-A compare sitewide soil sample analytical results to HBSLsfor VOCs, SVOCs, pestcides and PCBs, metals, and dioxins, respectively. For the purposes of the
HHRA, HBSLs for soil are defined as the lowest MDEQ Part 201 Residential and Commercial I soilcriterion (MDEQ 2000). If a Part 201 criterion was not available for a given chemical, the EPARegion DC PRO for residential soil was selected as the HBSL (EPA 2000). If a criterion was notavailable from MDEQ or EPA Region DC, the EPA CLP CRDL was used for that analyte. In accordance
with MDEQ criteria for certain metals, the highest background metal concentration was chosen as the
HBSL only when the background sample concentration exceeded the MDEQ criterion.
In most cases, SQLs were below HBSLs; however, several SQLs exceeded HBSLs in some or all soilsamples for a specific chemical. Chemicals for which all SQLs exceeded HBSLs include atrazine withan HBSL of 60 micrograms per kilogram C^g/kg) and a minimum SQL of 330 A/g/kg and
pentachlorophenol with an HBSL of 22 Mg/kg and a minimum SQL of 830 Mg/kg- Neither atrazine norpentachlorophenol were detected in any soil samples, and these chemicals are not known to be site-related. Also, several chemicals have some SQLs that exceed HBSLs; however, these chemicals werenot detected above HBSLs in the samples with SQLs below HBSLs. Therefore, although elevated SQLsexist, they are unlikely to result in an underestimation of risk for these contaminants.
Table G-A-1 and G-A-2 in Appendix G-A indicate that one sample concentration for cis-1,3-dichloropropene and one sample concentration for 1,1-biphenyl exceeded HBSLs. However, becausethese analytes were detected only once at concentrations not significantly above the HBSLs, the
concentrations were considered outliers and were not used in the HHRA.
Also, significantly elevated (in other words, at least an order of magnitude higher than other SQLs) SQLswere noted for SVOCs for the following samples: RW-SB40-0406, RW-SB47-0002, RW-SB58-0204,
RW-SB68-0002, and RW-SB68-0406, and for pesticides and PCBs for sample RW-SB40-0406.Significantly elevated detection limits may result in the over- or underestimation of risks in the HHRA.Risks may be overestimated because one-half of each sample detection limit for non-detect samples isused in 95th percentile upper confidence limit (UCL,,) calculations and in some cases one-half thedetection limit is higher than the highest detected concentration of a contaminant. Risks may beunderestimated because an undetected contaminant may be present at a concentration greater than an
HBSL but less than the elevated detection limit.
G-2-5

2.2.2 Data Evaluation of LNAPL Sampling Results
LNAPL was detected in five on-site groundwater monitoring wells and one off-property groundwatermonitoring well located in the former off-property railroad right-of-way area. Tables G-A-6 through G-A-9 in Appendix G-A compare LNAPL sample analytical results with their HBSLs for VOCs, SVOCs.pestcides and PCBs, and metals, respectively. For the purposes of the HHRA, HBSLs for LNAPL aredefined as the lowest MDEQ Part 201 Residential and Commercial I soil criterion (MDEQ 2000). If aPart 201 criterion was not available for a given chemical, the EPA Region DC PRG for residential soilwas selected as the HBSL (EPA 2000).
Because of the complex nature of the LNAPL matrix, most SQLs were significantly elevated comparedto soil SQLs. In many cases, these elevated SQLs exceeded HBSLs. Because elevated SQLs areassociated with site-related chemicals such as polynuclear aromatic hydrocarbons (PAH) and PCBs, riskassociated with exposure to LNAPL may be underestimated in the HHRA.
LNAPL concentrations were reported by the laboratory in /^g/kg because the density of the sourcematerial was unknown. These concentrations were converted to micrograms per liter (^g/L) using anaverage specific gravity of 0.927. This average was calculated based on a range of cutting oilformulations (Cornell University 2000).
2.2.3 Data Evaluation of Groundwater Sampling Results
Tables G-A-10 through G-A-14 in Appendix G-A compare groundwater sample analytical results to
HBSLs for VOCs, SVOCs, pestcides and PCBs, metals, and dioxins, respectively. For the purposes ofthe HHRA, HBSLs for groundwater are defined as the lowest MDEQ Part 201 Residential and Industrial-Commercial Groundwater criterion (MDEQ 2000). If a Part 201 criterion was not available for a givenchemical, the EPA CLP CRDL for drinking water or groundwater was selected as the HBSL.
In most cases, SQLs were below HBSLs; however, several SQLs exceeded HBSLs in some or allgroundwater samples for a specific chemical. Chemicals for which all SQLs exceeded HBSLs includebenzo(a)anthracene with an HBSL of 2.1 ^g/L and a minimum SQL of 5 Mg/L; benzo(b)fluoranthene andbis(2-chloroethyl)ether both with HBSLs of 2 Mg/L and minimum SQLs of 5 Mg/L; dibenzofuran with anHBSL of 4 Mg/L and a minimum SQL of 5 g/L; fluoranthene with an HBSL of 1.6 and a minimum SQLof 5 Mg/L; hexachlorobutadiene with an HBSL of 0.053 g/L and a minimum SQL of 5
G-2-6

nitrobenzene with an HBSL of 3.4 ^g/L and a minimum SQL of 5 ^g/L; pentachlorophenol with an
HBSL of 1 g/L and a minimum SQL of 20 /ug/L; toxaphene with an HBSL of 1 ug/L and a minimum
SQL of 2.5 Mg/L; 4,4-DOT and endrin aldehyde both with HBSLs of 0.02 ^g/L and minimum SQLs of
0.08 Mg/L; and PCBs-with HBSLs of 0.2 or 0.4 ^g/L and a minimum SQL of 1 ,ug/L. None of theseanalytes except Aroclor 1254 was detected in any groundwater samples. Also, with the exception ofhexachlorobutadiene and pentachlorophenol, SQLs were not significantly greater than HBSLs.Furthermore, hexachlorobutadiene and pentachlorophenol are not known to be site-related. Therefore.although elevated SQLs exist, they are unlikely to result in an underestimation of risk for thesecontaminants. However, underestimation of risk may result from the exclusion of PAHs, which wereregularly detected in soil.
The cis-l,2-dichloroethene concentrations in samples RW-GW-MW27S and RW-GW-MW22 and vinylchloride in sample RW-GW-MW22 exceeded instrument calibration ranges. Therefore, concentrationsfor these analytes may be underestimated.
Also, it is important to note that contaminated laboratory blanks were associated with several mercuryanalyses. The mercury sample concentrations were less than five times the blank concentrations.Therefore, these samples were treated as nondetect and their detection limits were changed to the CLPCRDL, which, in accordance with EPA HHRA guidance, were then each multiplied by one half(EPA 1989).
2.2.4 Data Evaluation of Surface Water Sampling Results
Tables G-A-15 through G-A-18 in Appendix G-A compare the surface water sample analytical results toHBSLs for VOCs, SVOCs, pestcides and PCBs, and metals, respectively. For the purposes of theHHRA, surface water HBSLs are defined as the most conservative MDEQ Rule 57 water qualitycriterion (MDEQ 2000b). Only human cancer values (HCV) and human noncancer values (HNV) wereused. If a Rule 57 Water Quality criterion was not available for a given a chemical, the EPA CLP CRDLfor water was selected as the HBSL.
In most cases, SQLs were below HBSLs; however, several SQLs exceeded HBSLs in some or all surfacewater samples for a specific chemical. Chemicals for which all SQLs exceeded HBSLs include atrazinewith an HBSL of 4.3 Mg/L and a minimum SQL of 10 //g/L; hexachlorobenzene with an HBSL of0.00045 Aig/L and a minimum SQL of 5 Mg/L; gamma-BHC with an HBSL of 0.025 ^g/L and a minimum
G-2-7

SQL of 0.04 Mg/L; 4.4'-DDT with an HBSL of 0.00015 ag/L and a minimum SQL of 0.08 .^g/L: dieldrin
with an HBSL of 0.0000065 ^g/L and a minimum SQL of 0.08 ug/L; toxaphene with an HBSL of0.000068 Mg/L and a minimum SQL of 2.5 Mg/L; and PCBs with an HBSL of 0.000026 /ug/L and aminimum SQL of 1 wg/L. None of these analytes was detected in any surface water samples and, withthe exception of PCBs and dieldrin, are not known to be site-related. Because SQLs are significantlyabove HBSLs, risks from PCBs and dieldrin may be underestimated in the HHRA. Also, severalchemicals have some SQLs above HBSLs; however, these chemicals were not detected above HBSLs inthe samples with SQLs below HBSLs. Therefore, although elevated SQLs exist, they are unlikely toresult in an underestimation of risks for these contaminants.
Also, it should be noted that copper, lead, zinc, and cyanide all had samples associated withcontaminated blanks, and their sample concentrations were less than five times the blank-relatedconcentrations. For the purposes of the HHRA, these samples, presented in dark blue in Table G-A-18,were assigned a value either equal to the highest sample-specific detection limit of another sample resultfor the same analyte or the corresponding CLP CRDL for that analyte. In accordance with EPAguidance, these samples were treated as nondetect and their detection limits were changed to the CRDLeach multiplied by one half.
2.2.5 Data Evaluation of Sediment Sampling Results
Tables G-A-19 through G-A-23 in Appendix G-A compare sediment sample analytical results to HBSLsfor VOCs, SVOCs, pesticides and PCBs, metals, and dioxins, respectively. For the purposes of theHHRA, HBSLs for sediment are defined as the EPA Region EX PRG for residential soil criteria. If a
PRG was not available for a given chemical, the EPA CLP CRDL for soil was selected as the HBSL.
Similar to LNAPL, because of the complex nature of the sediment matrix, many SQLs were significantlyelevated compared to soil SQLs. In many cases, these elevated SQLs were above HBSLs. Becauseelevated SQLs are associated with site-related chemicals such as PAHs and PCBs, risks associated withexposure to sediment may be underestimated in the HHRA. However, elevated detection limits may alsoresult in the overestimation of risk because one-half of each sample detection limit for non-detectsamples is used in UCL,5 calculations; therefore, elevated detection limits may result in elevated EPCs.
G-2-8
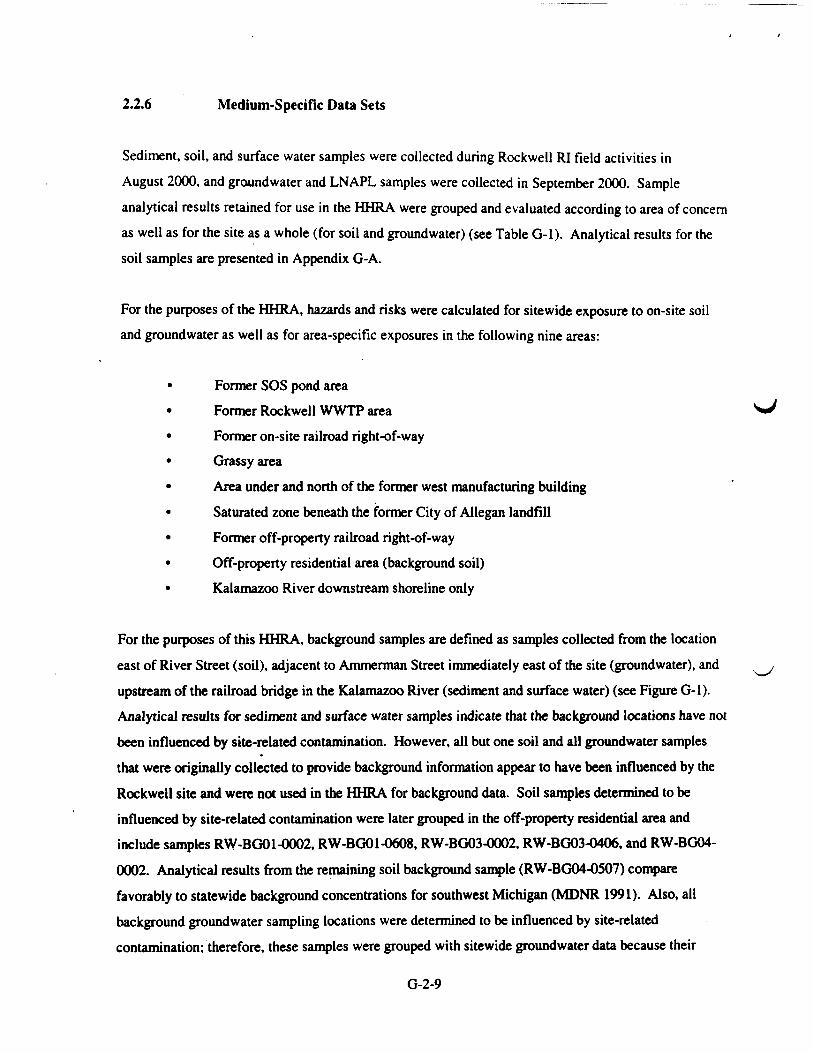
2.2.6 Medium-Specific Data Sets
Sediment, soil, and surface water samples were collected during Rockwell RI field activities inAugust 2000, and groundwater and LNAPL samples were collected in September 2000. Sampleanalytical results retained for use in the HHRA were grouped and evaluated according to area of concernas well as for the site as a whole (for soil and groundwater) (see Table G-l). Analytical results for thesoil samples are presented in Appendix G-A.
For the purposes of the HHRA, hazards and risks were calculated for sitewide exposure to on-site soiland groundwater as well as for area-specific exposures in the following nine areas:
• Former SOS pond areaFormer Rockwell WWTP area
• Former on-site railroad right-of-way• Grassy area• Area under and north of the former west manufacturing building• Saturated zone beneath the former City of Allegan landfill• Former off-property railroad right-of-way• Off-property residential area (background soil)• Kalamazoo River downstream shoreline only
For the purposes of this HHRA, background samples are defined as samples collected from the locationeast of River Street (soil), adjacent to Ammerman Street immediately east of the site (groundwater), andupstream of the railroad bridge in the Kalamazoo River (sediment and surface water) (see Figure G-l).Analytical results for sediment and surface water samples indicate that the background locations have notbeen influenced by site-related contamination. However, all but one soil and all groundwater samplesthat were originally collected to provide background information appear to have been influenced by theRockwell site and were not used in the HHRA for background data. Soil samples determined to beinfluenced by site-related contamination were later grouped in the off-property residential area andinclude samples RW-BGO1-0002, RW-BGO1-0608, RW-BG03-0002, RW-BG03-0406, and RW-BG04-0002. Analytical results from the remaining soil background sample (RW-BG04-0507) comparefavorably to statewide background concentrations for southwest Michigan (MDNR 1991). Also, allbackground groundwater sampling locations were determined to be influenced by site-relatedcontamination; therefore, these samples were grouped with sitewide groundwater data because their
G-2-9
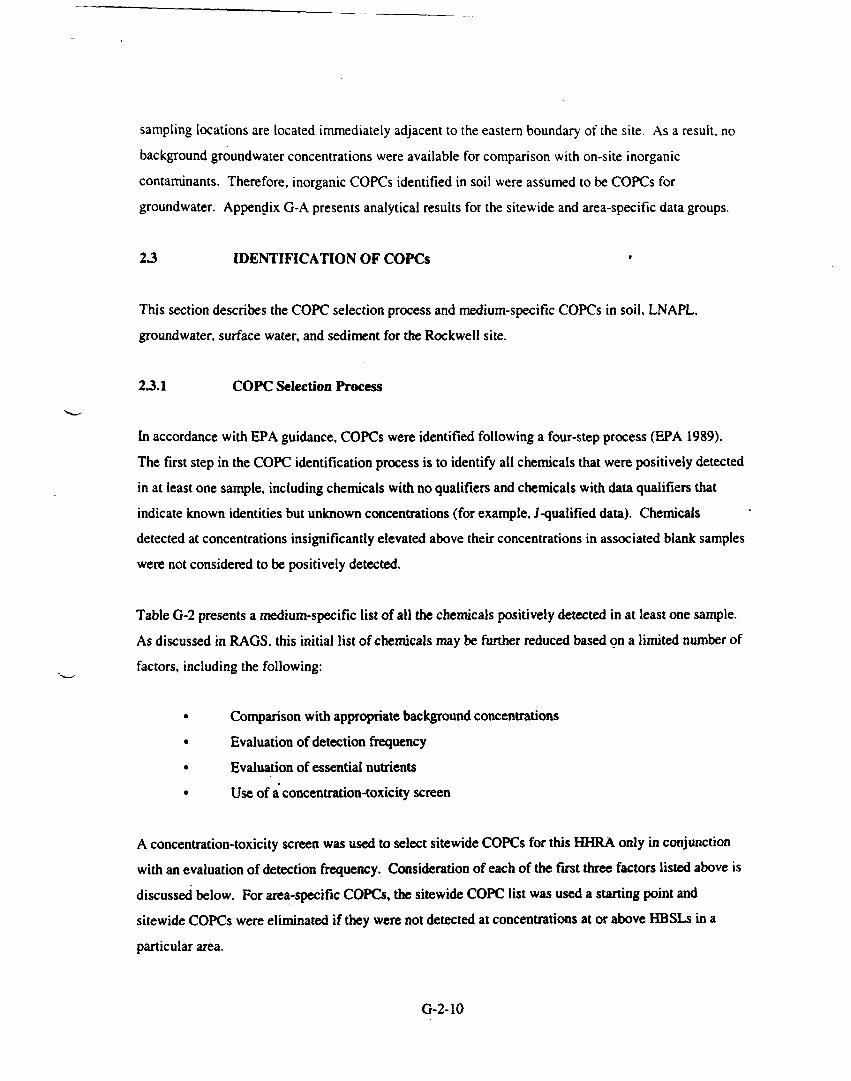
sampling locations are located immediately adjacent to the eastern boundary of the site. As a result, nobackground groundwater concentrations were available for comparison with on-site inorganic
contaminants. Therefore, inorganic COPCs identified in soil were assumed to be COPCs forgroundwater. Appendix G-A presents analytical results for the sitewide and area-specific data groups.
23 IDENTIFICATION OF COPCs
This section describes the COPC selection process and medium-specific COPCs in soil, LNAPL,groundwater, surface water, and sediment for the Rockwell site.
23.1 COPC Selection Process
In accordance with EPA guidance, COPCs were identified following a four-step process (EPA 1989).The first step in the COPC identification process is to identify all chemicals that were positively detectedin at least one sample, including chemicals with no qualifiers and chemicals with data qualifiers thatindicate known identities but unknown concentrations (for example, J-qualified data). Chemicalsdetected at concentrations insignificantly elevated above their concentrations in associated blank sampleswere not considered to be positively detected.
Table G-2 presents a medium-specific list of all the chemicals positively detected in at least one sample.As discussed in RAGS, this initial list of chemicals may be further reduced based on a limited number offactors, including the following:
• Comparison with appropriate background concentrations• Evaluation of detection frequency• Evaluation of essential nutrients• Use of a concentration-toxicity screen
A concentration-toxicity screen was used to select sitewide COPCs for this HHRA only in conjunctionwith an evaluation of detection frequency. Consideration of each of the first three factors listed above isdiscussed below. For area-specific COPCs, the sitewide COPC list was used a starting point andsitewide COPCs were eliminated if they were not detected at concentrations at or above HBSLs in a
particular area.
G-2-10

Comparison with Appropriate Background Concentrations
Comparison of on-site concentrations to background concentrations is generally appropriate only for
inorganic chemicals. .The majority of organic chemicals are not naturally occurring and are likely presentas a result of human activity (EPA 1989). Therefore, for the purposes of this HHRA, background
comparisons were conducted only for inorganic chemicals. As discussed in Section 2.2.6, backgroundsamples are defined as samples collected from the location east of River Street (soil), upstream of therailroad bridge in the Kalamazoo River (sediment and surface water), and sediment collected in theschool pond. No background groundwater concentrations were available. Therefore, inorganic COPCsidentified in soil were assumed to be COPCs for groundwater.
All but one background soil sample (RW-BG04-0507) appeared to be influenced by site-relatedcontamination. Because only one background sample was available, statistical comparisons could not beconducted. Therefore, the lower of the UCL,, or the maximum concentrations of inorganic contaminantsin sitewide and area-specific soil samples were compared to the inorganic concentrations in backgroundsoil sample RW-BG04-0507. Calculation of the UCL,, values is discussed in greater detail in
Section 3.3.1.
If the site-related inorganic concentrations exceeded background concentrations, the inorganiccontaminants were compared to HBSLs. This conservative approach resulted in the inclusion of mostinorganic contaminants as soil COPCs; only antimony, beryllium, thallium, and vanadium were excluded
as COPCs.
For Kalamazoo River sediment and surface water, the maximum concentrations of inorganic
contaminants in background sediment and surface water samples were compared to the lower of theUCLft or the maximum concentrations of downstream inorganic contaminants. If site-related inorganicconcentrations exceeded background concentrations, the inorganic contaminants were compared toHBSLs. If the lower of the UCL^ or the maximum concentration of downstream contaminants exceededthe HBSL, the contaminant was considered a COPC. For sediment, only antimony, beryllium, andthallium were excluded as COPCs based on this approach. For surface water, antimony, arsenic,beryllium, cadmium, chromium, cobalt, copper, mercury, nickel, selenium, silver, thallium, vanadium,
and cyanide were excluded as COPCs based on this approach.
G-2-11

For sediment in on-site ponds, the maximum concentration of inorganic contaminants in the school pond
located across River Street was compared to the lower of the UCL,, or the maximum concentration ofinorganic contaminants detected in on-site pond sediment. If the site-related inorganic concentrationsexceeded background.concentrations, the inorganic contaminants were compared to HBSLs. If the lowerof the UCL,5 or the maximum concentration of downstream contaminants exceeded HBSLs thecontaminant was considered a COPC for the site. Only antimony, beryllium, silver, thallium, vanadium,and cyanide were not included as on-site pond sediment COPCs based on this screening approach. Forsurface water in on-site ponds, inorganic contaminants were screened against HBSLs. Only contaminantconcentrations that exceeded HBSLs were retained as COPCs. Based on this approach, antimony,beryllium, cadmium, cobalt, selenium, and silver were excluded as COPCs for on-site pond surfacewater.
Evaluation of Detection Frequency
EPA's RAGS states the following:
"Chemicals that are infrequently detected may be artifacts in the data due to sampling,analytical, or other problems, and therefore may not be related to site operations ordisposal practices." (EPA 1989)
However, RAGS also cautions that evaluation of a chemical's detection frequency in one medium mustbe made considering the following other factors:
• A chemical's potential relation to site operations• A chemical's detection in other media• The concentration at which a chemical was detected in each medium
The data set representing soil, sediment, surface water, groundwater, and LNAPL COPC concentrationsassociated with the Rockwell site contains a total of 147 samples, which have the following matrix
distribution:• 63 soil samples• 29 sediment samples• 17 surface water samples• 32 groundwater samples• 6 LNAPL samples
G-2-12

These data sets were further broken down into smaller area-specific data sets (see Table G-l).Contaminants that were detected at least once above the HBSL at the site but infrequently (less than5 percent detection frequency) were eliminated as COPCs as discussed below.
For soil samples, one sample concentration for cis-l,3-dichloropropene; one concentration for1,1 -biphenyl; two concentrations for antimony; and one concentration for thallium exceeded the HBSL.However, because these analytes were detected only once or twice (less than 5 percent detectionfrequency) and at concentrations not significantly higher than their respective HBSLs or detection limits,they were not included as a COPCs.
For LNAPL, one sample concentration for antimony exceeded the HBSL. However, because this analytewas detected only once and at a concentration not significantly higher than its HBSL, it was not includedas a COPC.
No contaminants were eliminated as COPCs based on detection frequency for groundwater, surfacewater, and sediment samples.
Evaluation of Essential Nutrients
As discussed in EPA guidance, chemicals that are (1) essential human nutrients, (2) present at lowconcentrations, and (3) toxic only at very high doses may be eliminated as COPCs in a quantitativeHHRA. Such chemicals generally include iron, magnesium, calcium, potassium, and sodium(EPA 1989).
As shown in Table G-4, iron was retained as a COPC in all media. A toxicity factor for iron wasobtained from the EPA Region DC PRG tables, and hazard and risk calculations for iron exposure areincluded in the HHRA (EPA 2000). Calcium, magnesium, and potassium were detected in soil at the siteat elevated concentrations based on comparison to background concentrations. Also, calcium,magnesium, potassium, and sodium were detected in groundwater at the site at elevated concentrations.Therefore, dietary intake values were researched and identified only for calcium, magnesium, and
sodium. No recommended dietary intake values were found for potassium. Potassium was thereforeeliminated as a COPC. Calcium, magnesium, and sodium were evaluated further based on the identified
dietary intake values.
G-2-13
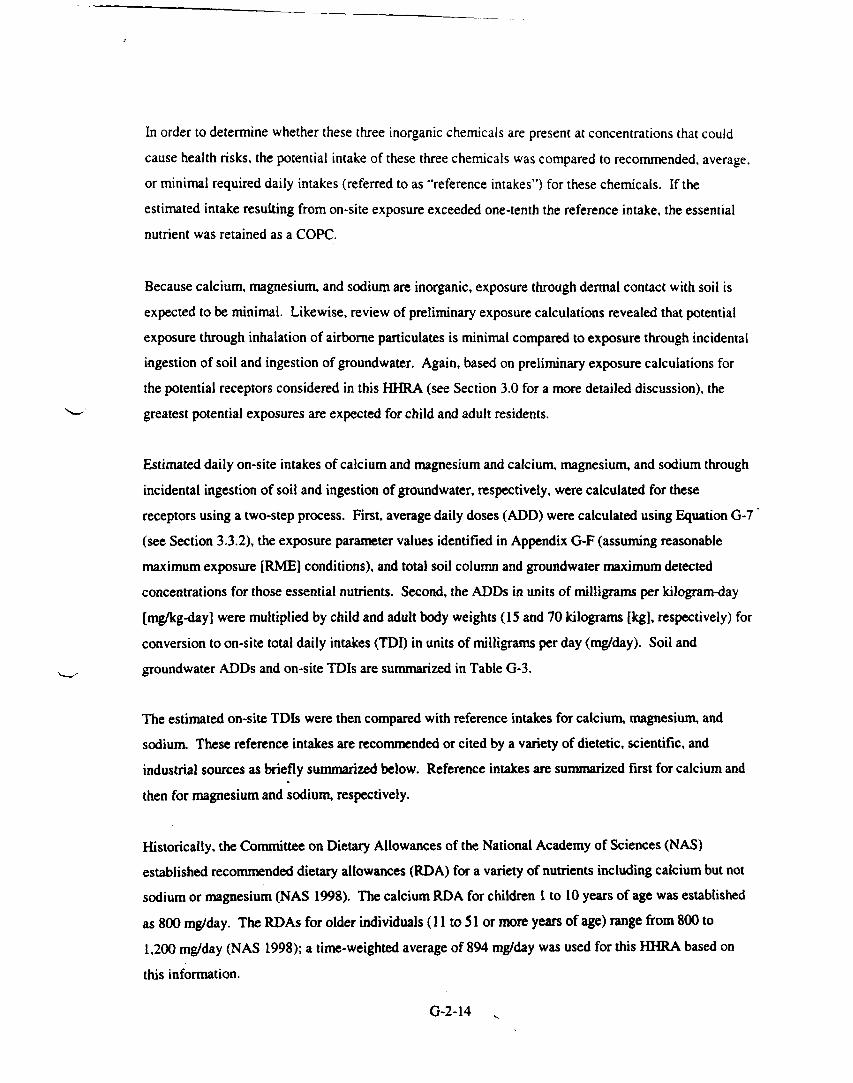
In order to determine whether these three inorganic chemicals are present at concentrations that couldcause health risks, the potential intake of these three chemicals was compared to recommended, average,or minimal required daily intakes (referred to as "reference intakes") for these chemicals. If the
estimated intake resulting from on-site exposure exceeded one-tenth the reference intake, the essentialnutrient was retained as a COPC.
Because calcium, magnesium, and sodium are inorganic, exposure through dermal contact with soil isexpected to be minimal. Likewise, review of preliminary exposure calculations revealed that potentialexposure through inhalation of airborne particulates is minimal compared to exposure through incidentalingestion of soil and ingestion of groundwater. Again, based on preliminary exposure calculations forthe potential receptors considered in this HHRA (see Section 3.0 for a more detailed discussion), thegreatest potential exposures are expected for child and adult residents.
Estimated daily on-site intakes of calcium and magnesium and calcium, magnesium, and sodium throughincidental ingestion of soil and ingestion of groundwater, respectively, were calculated for thesereceptors using a two-step process. First, average daily doses (ADD) were calculated using Equation G-7(see Section 3.3.2), the exposure parameter values identified in Appendix G-F (assuming reasonablemaximum exposure [RME] conditions), and total soil column and groundwater maximum detectedconcentrations for those essential nutrients. Second, the ADDs in units of milligrams per kilogram-day[mg/kg-day] were multiplied by child and adult body weights (IS and 70 kilograms [kg], respectively) forconversion to on-site total daily intakes (TDI) in units of milligrams per day (mg/day). Soil andgroundwater ADDs and on-site TDIs are summarized in Table G-3.
The estimated on-site TDIs were then compared with reference intakes for calcium, magnesium, andsodium. These reference intakes are recommended or cited by a variety of dietetic, scientific, andindustrial sources as briefly summarized below. Reference intakes are summarized first for calcium andthen for magnesium and sodium, respectively.
Historically, the Committee on Dietary Allowances of the National Academy of Sciences (NAS)established recommended dietary allowances (RDA) for a variety of nutrients including calcium but notsodium or magnesium (NAS 1998). The calcium RDA for children 1 to 10 years of age was establishedas 800 mg/day. The RDAs for older individuals (11 to 51 or more years of age) range from 800 to1,200 mg/day (NAS 1998); a time-weighted average of 894 mg/day was used for this HHRA based on
this information.
G-2-14 .
More recently, the Food and Nutrition Board of the American Dietetic Association has begun
establishing dietary reference intakes (DRI) that represent a new approach to providing "quantitativeestimates of nutritional intakes" and that are intended to expand on and replace historical RDAs (Yatesand others 1998). The DRIs consist of four reference intakes: (1) the RDA, (2) the tolerable upper intakelevel (UIL), (3) the estimated average requirement (EAR), and (4) the adequate intake (AI). No RDA,UIL, or EAR value is available for calcium. The AI represents a level judged by the experts establishing.the DRIs "to meet the needs of all individuals in a group, but which is based on much less data andsubstantially more judgment than used in establishing an EAR or subsequently the RDA" (Yates andothers 1998). The AI for calcium ranges from 500 mg/kg for children 1 to 3 years of age to 1,000 mg/kgfor adults 19 to 50 years of age (NAS 1997). In order to be conservative, a reference intake of500 mg/day (the AI for children 1 to 3 years of age) was selected to evaluate exposure of the childresident and a reference intake of 1,000 mg/day (the AI for adults 19 to 50 years of age) was selected toevaluate exposure of the adult resident.
The DRIs for magnesium recommended by NAS are 30 mg/day for infants, 410 mg/day for maleteenagers, 360 mg/day for female teenagers, 420 mg/day for men over 30, and 320 mg/day for womenover 30 (NAL 2001). For the purposes of this HHRA, a reference intake of 370 mg/day (the average ofthe DRI for men and women) was selected to evaluate exposure of the child and adult residents.
DRIs have not been established for sodium. However, several minimal necessary or average sodiumintake values or ranges of values were identified from a variety of sources. As part of its "Nutrition andYour Health: Dietary Guidelines for Americans," the U.S. Department of Agriculture (USDA) states that"the human body only needs about 500 milligrams of sodium per day." USDA also identifies a daily
value of 2,400 mg/day (USDA 1995). The American Dietetic Association (ADA) states that the "averageadult" consumes 4,000 to 6,000 mg/day of sodium (Healthtouch 1997). The ADA also cites the NationalResearch Council as recommending a daily sodium intake of 2,000 to 4,000 mg/day "for people who donot have high blood pressure" (Healthtouch 1997).
The Delaware Cooperative Extension Service (DCES) "Food and Nutrition Facts" cites the NAS asindicating that "the safe and adequate level for adults is approximately 1,100 to 3,300 mg of sodiumdaily" (DCES 1998). Finally, the Salt Institute cites NAS as stating that "Americans consume aminimum of 500 mg/day of sodium." The Salt Institute also refers to a "hygienic safety range" forsodium of 1,150 to 5,750 mg/day based on the work of a hypertension expert (Salt Institute 1998). As a
G-2-15

conservative measure, a reference intake of 500 mg/day was selected to evaluate exposure of both childand adult residents.
As can be seen in Table G-3, the calcium and magnesium on-site TDIs calculated for child and adultresidents are less than 10 percent of the reference intakes for these same inorganic chemicals in soil.Therefore, calcium and magnesium were eliminated as soil COPCs. For groundwater, the TDIs forcalcium, magnesium, and sodium were significantly greater than the reference intakes. This indicatesthat consumption of groundwater at the site .may pose a risk to human receptors. This is consistent withhazards and risks identified in Section 5 of the HHRA related to other COPCs as a result of groundwaterconsumption. However, it should be noted that residents in the vicinity of the site do not usegroundwater as drinking water. Drinking water is obtained from the City of Allegan. Furthermore, it islikely that future residents will also obtain drinking water from the City of Allegan and not on-sitegroundwater. Therefore, calcium, magnesium, and sodium were not retained as COPCs for groundwater.
2.3.2 Medium-Specific COPCs
As indicated in Section 2.3.1, medium-specific COPCs were identified following a four-step process(EPA 1989). COPCs remaining at the conclusion of this process were compared to the HBSLs identifiedin Section 2.2. Contaminants with any detections above HBSLs were retained as final sitewide (on-site)and area-specific COPCs. Sitewide (on-site) and area-specific COPCs are listed in Tables G-4 and G-5,respectively.
2.4 MODELING ACTIVITIES
Several types of modeling were conducted in support of the HHRA to supplement available medium-specific data sets. These modeling activities include the following:
• Particulate emission modeling for both on- and off-property locations to estimate theconcentrations of COPCs associated with paniculate emissions (see Appendix G-C)
• Indoor air concentration modeling to estimate potential risks to on- and off-property• residents and on-site workers from the migration of soil, LNAPL, and groundwater
COPCs to indoor air (see Appendix G-D)
• Modeling of volatilization of contaminants from groundwater to air in trenches for theconstruction and utility workers (see Appendix G-D)
G-2-16

• Blood lead modeling to estimate concentrations resulting from receptor-specificexposure to lead (see Appendix G-E)
2.5 UNCERTAINTIES RELATED TO IDENTIFICATION OF COPCS
Uncertainties associated with the selection of COPCs result from a variety of sources. This section
briefly discusses some of the more significant sources of uncertainty, including the assumption of steady-state conditions, the number and type of samples collected, the lack of air samples collected, and elevateddetection limits. These uncertainties may result in over- or underestimation of risks and hazards asdiscussed below.
2.5.1 Assumption of Steady-State Conditions
COPC identification is based on the assumption of steady-state conditions in site soil, sediment, surfacewater, LNAPL, and groundwater. This assumption ignores the potential degradation of chemicals. For
example, chemicals previously detected may have degraded. In general, the assumption of steady-stateconditions usually contributes to an overestimation of chemical concentrations and of resulting doses,risks, and hazard if no additional contamination enters a system. However, the assumption of steady-state conditions may also result in an underestimation of hazard and risk when degradation products(such as, vinyl chloride) are more toxic than source COPCs.
2.5.2 Number and Type of Samples Collected
The soil background samples were collected only from an area east of River Street thought to beuninfluenced by the Rockwell site. Only one sample's results were comparable to normal, publishedbackground data for the region; the remaining background samples appeared to have been influenced bythe Rockwell site and were excluded from the background data group for the purposes of the HHRA. Toreduce potential uncertainty, a conservative approach was employed which compared backgroundconcentrations to the UCL,$ or maximum detected on-site concentrations. This resulted in the inclusionof many inorganic COPCs, which may overestimate site-related hazards and risks. No backgroundgroundwater concentrations were available. Therefore, inorganic COPCs identified in soil were assumedto be COPCs for groundwater. Also, because most inorganic contaminants remained soil COPCs, the useof inorganic soil COPCs may overestimate site-related hazards and risks.
G-2-17

Also, speciation of chromium analytical results into trivalent and hexavalent forms was not conducted.According to MDEQ and EPA, no methods exist for calculating concentrations of trivalent and
hexavalent chromium from total chromium. Because hexavalent chromium is not stable in theenvironment and is net known to be a site-related contaminant, total chromium concentrations wereassumed to consist exclusively of trivalent chromium. This assumption may result in a significantunderestimation of risk because the toxicity of hexavalent chromium, if present at the site, is significantlygreater than trivalent chromium toxicity.
Only data collected during the Tetra Tech RI were evaluated in the HHRA. This data set providessufficient basis for evaluation of risk to human health and the environment. As indicated in Section 5,significant risk has been documented at the Rockwell site based on RI data. However, it should be notedthat additional historic and more recent data have been collected at the Rockwell site as listed inSection 2.1. Additional risks maybe identified based on the additional data.
2.5-3 Lack of Air Samples Collected
No air samples were collected during the RI field investigation because air sample collection was not inthe scope of work for this work assignment. Therefore, COPCs were not identified specifically for theair medium. However, on- and off-property air concentrations were estimated based on COPC-specificconcentrations in on-site soil. Soil COPCs were assumed to represent air COPCs. Therefore, the lack ofair samples is expected to have limited impact on uncertainty associated with selection of air COPCs.
2.5.4 Elevated Detection Limits
As discussed in Sections 2.2.1 through 2.2.5, the detection limits associated with the analytical methodsused to measure contaminant concentrations in soil, LNAPL, groundwater, sediment, and surface watersamples in some cases exceeded the medium-specific HBSLs. Therefore, it is possible that contaminantsmay be present that were not detected because of the elevated, medium-specific detection limits.Elevated detection limits may also introduce uncertainty into EPCs because one-half of the detectionlimit is included in the EPC calculation for contaminants not detected. However, in terms of theselection of medium-specific COPCs, elevated detection limits are not expected to contribute
significantly to uncertainty.
G-2-18

3.0 EXPOSURE ASSESSMENT
This section discusses methods used to estimate the types and magnitude of potential human exposure toCOPCs present at or migrating from the Rockwell site. Exposure is defined as human contact with achemical or physical agent (EPA 1989). This exposure assessment consists of three fundamental steps:(1) exposure setting characterization, (2) exposure pathway identification, and (3) exposurequantification. These steps are discussed below. Specifically, Section 3.1 characterizes the exposuresetting with respect to the general physical characteristics of the site and surrounding areas and the
characteristics of human receptors at or near the site. Section 3.2 discusses the conceptual site model(CSM) used to identify contaminant sources, mechanisms for release, potential receptors, and exposurepathways. Section 3.3 discusses the methods used to quantify exposure associated with each completeexposure pathway. Finally, Section 3.4 identifies and discusses uncertainties associated with theexposure assessment process as it applies to the site.
3.1 EXPOSURE SETTING CHARACTERIZATION
The exposure setting consists of the physical setting of the site and the characteristics of populationsliving near the site area. Section 3.1.1 describes the physical setting of the site and the surrounding area,including the climate, soil and geology, and groundwater. Section 3.1.2 discusses demographics in thesite area. These sections focus on the specific aspects of the site's current physical setting anddemographics considered relevant to the evaluation of exposures at or near the site currently and in thefuture.
3.1.1 Physical Setting
The Rockwell site is located at Glass Street in Allegan, Michigan (see Figure 1 of the Rockwell RIreport). The City of Allegan is located approximately 28 miles northwest of Kalamazoo, Michigan. TheRockwell site covers 30.4 acres in the northwestern section of the City of Allegan. The site is borderedon the east by River Street, on the south by North Street, on the west by the City of Allegan publiclyowned treatment works (POTW), and on the northwest and north by the Kalamazoo River. Land use inthe vicinity of the site is residential and industrial. The undeveloped area southwest of the facility islargely owned by Consumers Power. The nearest residential areas are located adjacent to the site alongRiver Street and across North Street. The North Ward Elementary School is located immediately east of
River Street from the site.
G-3-1

The Rockwell site is currently divided into an eastern section owned by the Allegan Metal FinishingCompany and a western section owned by the City of Allegan. C&O Railroad tracks roughly run alongthe dividing line between the east and west sections of the site. The eastern section includes a formerdrive-line assembly building and former heat-treat building. The western section includes a formermanufacturing building, former WWTP, and three former holding ponds.
Additional site features include an unused grassy area in the northeast comer, an aboveground storagetank and a shed in the northern area of the former heat-treat building, a pumphouse near the northeastcorner of the former manufacturing building, a parking lot near the southwest comer of the formermanufacturing building, parts storage areas, a backwater area, and a storm water drainage system. Thebackwater area borders the Kalamazoo River along the western and northern portions of the site. Thewestern portion was used by the City of Allegan for landftlling, and the northern portion was used forwastewater discharge. Wastewater effluent is discharged through three storm water drains (north, west,and east). The north drain runs from the northeast comer of the manufacturing building to holdingpond 2, the west drain runs from the storm water catch basin inside the former manufacturing buildingthrough the backwater area to the Kalamazoo River, and the east drain runs from the center of the sitesouth along the former C&O Railroad. Figure 2 of the Rockwell RI report and Figure G-l show the sitelayout.
Climate
Climate in the site area is continental and controlled largely by the movement of pressure systems acrossthe nation and by the proximity to Lake Michigan. The Great Lakes influence local climate by increasingcloudiness and windiness. The average daily high temperature is 58.8 °F, and the average daily lowtemperature is 37.7 °F. Precipitation is well distributed throughout the year and averages 38.33 inchesper year. The average snowfall is 85.4 inches per year. The non-snow season lasts from about May toOctober (MRCC 2001).
Soil and Geology
On-site surface soil consists of sand or sand and gravel to approximately 2 feet below ground surface(bgs). The surface soil is sparsely vegetated, with distressed vegetation and surface staining. Thesubsurface consists of four layers: fill, alluvial and glaciofluvial sediments, till, and bedrock. The fillmaterial underlying surface soil consists mainly of sand and gravel at the site. Below the fill are alluvial
G-3-2

and glaciofluvial sediments of clayey till to fine gravel characteristic of recent deposition by a mature
river system and an outwash depositional environment. The till layer below the alluvial and glaciofluvial
sediments consists of dark gray and clayey silt with a trace of fine gravel and fine- to coarse-grained
sand. The bedrock underlying the till is a light blue-gray shale of the Coldwater Formation. Bedrock
was encountered at approximately 85 to 151 feet bgs at the site (ESC 1997).
Groundwater
The Rockwell site is situated over an area of coarse sand and gravel outwash deposits. Soil boringsdrilled during the RI indicate that the sand and gravel fill under the site area is approximately 8 to 34 feetthick. The alluvial and glaciofluvial sediment layer is approximately 20 to 63 feet thick. The till isapproximately 113 feet thick. The water table in the sand and gravel aquifer is located at approximately1 to 7 feet bgs. The City of Allegan provides residents with an average of approximately 1.5 million to2 million gallons of water per day from two of four municipal wells located in the city. The citywellfield includes three wells located on Park Street approximately 0.5 mile upstream of the site andwithin the flood plain of the Kalamazoo River. A fourth (emergency) well is located in town behind theAllegan library at Hubbard and Chestnut. All of the wells are screened in recent alluvium deposits atdepths of approximately 80 feet bgs. Only two of the production wells are in service at any time,producing a combined average production rate of approximately 1,700 gallons per minute. A well surveyindicates that there are no potable private water wells within 0.5 mile of the site (ESC 1997;
Tetra Tech 2001).
3.1.2 Demographics
The total population of Allegan was 4,547 in 1990. The average household income is $31,219. An
average of 20 percent of the population has an income below the poverty level. Approximately65.1 percent of the housing units are owner-occupied, and 34.9 percent are renter-occupied (State ofMichigan 2001). The top three principal economic base employers include Perrigo; ThermotronIndustries; and Robertshaw Controls (MultiMag 2000).
The western portion of the Rockwell site is currently governmental-zoned land. The eastern portion of
the site is zoned for industrial use. A City of Allegan health services facility located south of the site isalso zoned for government use. Residential zoning areas are present northeast, east, and southeast of the
site (City of Allegan 2000).
G-3-3

3.2 CONCEPTUAL SITE MODEL
The HHRA evaluates potential exposures to COPCs associated with the Rockwell site. As discussed inSection 2.0, in addition to evaluation of sitewide hazards and risks, hazards and risks to potential on- andoff-property receptors were evaluated for nine areas (see Section 1.1). Also, as described in Section 2.0,site-related COPCs include PCBs, metals, SVOCs, dioxins, and VOCs.
Figure G-2 presents the CSM for the Rockwell site. The CSM links potential and actual releases topotential human exposures. Specifically, the CSM identifies (1) contaminant sources and mechanisms of
release, (2) potential receptors and exposure pathways, and (3) exposure scenarios. These three elementsare discussed below.
3.2.1 Contaminant Sources and Mechanisms of Release
As shown in Figure G-2, various contaminant sources related to former Rockwell site and former City ofAllegan landfill operations are present at the site and in the vicinity of the site. On-site source areasrelated to former Rockwell operations include the following:
WWTP ponds
• Tanks, structures, discharge pipes, and chip loading and coolant unloading facilityassociated with the railroad right-of-way
• The electric meter pad in the Grassy Area
• Former SOS pond
• Floor drains, sumps, machinery pits, and other areas of known or suspected previouswaste disposal under and north of the former west manufacturing building
• Other underground sources, including former waste oil storage tanks and sewers
• Other aboveground sources, including the WWTP building, equalization tanks, areas ofknown or suspected liquid waste deposition in the backwater areas along the west andnorth site boundaries, and an area of free product beneath the western portion of theformer west manufacturing building discovered by MDEQ in 2001
Off-property sources of contamination include the former City of Allegan landfill. EPA requested thatTetra Tech only evaluate the saturated zone beneath the landfill as part of the RI.
G-3-4

Key mechanisms involved in the migration of chemicals from source areas into environmental mediainclude the following:
• Fugitive emissions• Deposition
• Volatilization
• Surface water releases/overflow
• Leaching by percolation• Uptake through food webs• Ground water seep or discharge
The release and transport mechanisms determined to be both significant and part of a complete exposurepathway are incorporated into the quantitative exposure assessment. Each mechanism is brieflydiscussed below.
Fugitive Emissions
Fugitive emissions of soil particulates can result when physical forces (for example, wind erosion,construction activities, vehicular traffic, and so on) act on exposed and dry surface soil. Vegetationminimizes the potential for fugitive emissions. Currently, vegetation exists over many areas at the
Rockwell site. However, the vegetation is sparse in some areas and therefore does not effectively inhibit
paniculate migration. Based on visual observations, IS to 30 percent of the site is estimated to becurrently effectively covered by vegetation. For the future on-site resident exposure scenario, it wasassumed that SO percent of the Rockwell site would be effectively covered with vegetation. For the
future on-site parking lot and park scenario, it was assumed that 5 percent of the site would be effectivelycovered with vegetation. Also, particulates may be generated by construction and utility installation
activities during future on-site development.
Deposition
Deposition of particulates is a secondary release mechanism that results from fugitive emissions of on-
site soil. Deposition of particulates to on- or off-property soil and surface water and off-propertyhomegrown produce may occur under current or future exposure scenarios (see "Fugitive Emissions"
description above for additional detail).
G-3-5

Deposition of waste directly into the groundwater table is a primary release mechanism for the WWTPponds. Historic deposition of waste occurred during Rockwell operations.
Volatilization
Volatilization represents a potential release mechanism for chemicals detected in LNAPL, groundwater,and on-site surface water. This potential release mechanism is typically evaluated for chemicalsconsidered to be volatile as defined by a Henry's Law constant greater than 10"5 and a molecular weightless than 200 grams per mole. However, no volatile COPCs have been identified in soil, sediment, or off-property surface water; therefore, this release mechanism was not evaluated for these media.
Surface Water Releases/Overflow
Overflow of WWTP ponds to the Kalamazoo River has been documented. Also, contaminants may bereleased to underlying soil, LNAPL, and groundwater by precipitation (such as rain or melting snow).About 38.33 inches per year of precipitation is expected at the Rockwell site. Also, contaminants maymigrate laterally between HHRA areas or from surface soil to surface water.
Leaching by Percolation
Chemicals may migrate by leaching from soil to underlying LNAPL and groundwater. The potential forthis process to act as a release and transport mechanism was determined by evaluating (1) thecharacteristics of the soil column and (2) the physiochemical properties of the COPCs. Surface andsubsurface soil at the Rockwell site consists primarily of sand, and contaminants include VOCs andSVOCs. Therefore, COPCs may readily migrate through soil to underlying groundwater and the LNAPLlayer.
Uptake through Food Webs
Contaminants present in surface water and sediment may be taken up by fish and other organisms in theKalamazoo River. Once contaminants such as PCBs enter the food web, bioconcentration occurs asorganisms higher on the foodchain ingest smaller organisms (such as human ingestion of fish).Also, contaminants in soil may enter the foodchain through uptake of plants such as homegrown produce.
G-3-6
Ground water Seep or Discharge
Chemicals that have leached from soil may potentially impact groundwater. The potential forgroundwater to act as a transport medium was determined based on (1) the direction of groundwaterflow, (2) use of the affected aquifer, and (3) physiochemical properties. Contaminants in groundwaterwould be transported in a downgradient direction. At the Rockwell site, groundwater typically flowswest toward the Kalamazoo River; however, groundwater in the upper aquifer is affected by theKalamazoo River and may flow east during times of high river water levels.
3.2.2 Potential Receptors and Exposure Pathways
Identification and evaluation of current and future potential receptors and exposure routes for theRockwell site are based on the following:
• Physical site setting• Demographics, including zoning and land use• Presence of contaminant sources
Potential receptors and exposure pathways identified based on these factors are discussed below.
Potential Receptors
Under current conditions, exposure scenarios are expected to consist of child and teenaged trespassers;on-site workers; construction or utility workers; child and adult off-property residents; construction or
utility workers; child and adult off-property residents; and child, teenaged, and adult off-propertyrecreationalists. Under expected future conditions, exposure scenarios are expected to consist of on-siteworkers; construction or utility workers; child and adult off-property residents; construction or utilityworkers; child and adult off-property residents; child, teenaged, and adult off-property recreationalists;child and adult on-site residents, child and adult on-site visitors to a park; and an adult on-site parking
attendant
G-3-7

Exposure Pathways
Points of contact between potential receptors and site-related contaminants present in environmentalmedia represent potential exposure pathways at the Rockwell site. Exposure pathways includeinhalation, ingestion, and dermal contact (also referred to in text as direct contact). Media available forpotential contact include soil, subsurface soil, LNAPL, groundwater, on-site surface water and sediment,off-property surface water and sediment, and homegrown produce.
Migration of on-site soil particulates to on- and off-property air was modeled to determine potentialEPCs (see Appendix G-C). Volatilization of contaminants to air was evaluated for LNAPL,groundwater; and on-site surface water; however, volatilization was not evaluated for soil because VOCswere not detected above HBSLs in surface soil, subsurface soil, sediment, or off-property surface water.VOCs are present in on-site surface water; however, volatilization was not evaluated becausecontribution of this pathway to receptor exposure is likely to be insignificant.
3.2.3 Exposure Scenarios
Complete exposure pathways and scenarios exist when a point of contact exists between an affectedmedium and a receptor. For the Rockwell site, several complete exposure scenarios exist for thefollowing receptors:
• Child and teenaged trespassers (current only)• On-site workers (current and future)• Construction or utility worker (current and future)• Adult and child off-property residents (current and future)• Adult, teenaged, and child off-property recreationalist (current and future)• Adult and child on-site residents (future only)• Adult and child on-site visitor (future only)• Adult on-site parking attendant (future only)
Exposure scenarios for these receptors are discussed below.
G-3-8

Child and Teenaged Trespassers
Currently, the site is surrounded by a fence topped with barbed wire and access is restricted by a lockedgate along the southern border of the site. Because the site borders residential areas, it is assumed thatchildren and teenagers may periodically trespass on the site. During RI activities, children were notedtrespassing on the site. Trespassers may be exposed to surficial soil through ingestion, direct contact,and inhalation of paiticulates. Trespassers may also be exposed to on-site surface water and sediment inthe former Rockwell WWTP area through ingestion and dermal contact. Potential exposure oftrespassers to off-property surface water and sediment in the Kalamazoo River is evaluated as part of theoff-property recreationalist scenario.
On-Site Workers
Current on-site workers include those at the Allegan Metal Finishing Company and City of Allegan
POTW. The Allegan Metal Finishing Company is located in the eastern portion of the site in the formerRockwell drive-line assembly building. Operations are primarily conducted indoors; however, it isassumed that an individual may work outdoors or on a loading dock for up to 4 hours out of an 8-hourwork day. A portion of the City of Allegan POTW is located in the western portion of the site near theKalamazoo River. Again, it is assumed that POTW workers may spend up to half of an 8-hour work dayoutdoors. Under future conditions, it is assumed that current on-site industrial operations would remainunchanged and that industrial operations similar to current operations may occur in the area west of theformer on-site railroad right-of-way; therefore, on-site workers may be exposed to sitewide contaminants.
On-site workers will likely be exposed to contaminants in surficial soil through ingestion, dermal contact,and paniculate inhalation. Workers may also be exposed through inhalation to contaminants migratingfrom LNAPL and groundwater to indoor air.
Construction or Utility Workers
Under current and future conditions, it is expected that construction activities will occur, includingdemolition of the west manufacturing building, construction of a residential area including 30 homes, andconstruction of park features (for example, picnic areas, shelters, and grills) and site preparationactivities (such as earth moving and compaction). It is also likely that inspections or repairs to existingor newly installed underground utilities may require infrequent subsurface excavation. Construction and
G-3-9

utility workers may be exposed to surface and subsurface soil and on-site surface water and sedimentthrough ingestion, dermal contact, and inhalation of participates. Inhalation of contaminants fromsurface water was not evaluated because surface water COPCs do not include VOCs. These workersmay also be exposed to LNAPL and groundwater during excavation activities, primarily through dermalcontact and inhalation. Ingestion of LNAPL and groundwater may also occur but is likely to beinsignificant and is not quantitatively evaluated in the HHRA.
Adult and Child Off-Property Residents
The nearest residential areas are located adjacent to the site's eastern boundary along River Street andsouth across North Street. LNAPL has been detected in the residential area south of the site andsubsurface contaminants have migrated to an aboveground, low-lying area in a resident's backyard at
North Street. At this residence, a portion of the basement, which may be impacted by migration ofvolatile contaminants from LNAPL and groundwater to indoor air, is used as a bedroom. It is assumedthat adult and child residents may be exposed to fugitive dust generated on site and volatile contaminantsmigrating to indoor air. Residents may also be exposed to contaminated soil located in the low-lying area'through ingestion and dermal contact. Residents may be exposed in site-related soil and paniculatecontaminants taken up in and deposited on homegrown produce. Currently, groundwater is not used as asource of drinking water; however, these residences are located hydrogeologically downgradient of thesite, and it was assumed that the residents may be exposed to groundwater used as a drinking watersource in the future. In the future, it was also assumed that residents would be exposed to groundwaterthrough showering. LNAPL detected on the groundwater table off the property was not evaluated as adrinking water source or under the showering scenario because it was assumed that if LNAPL wasdetected in a residential well, use of that well would be discontinued. Also, exposure to KalamazooRiver surface water and sediments is evaluated under the off-property recreationalist scenario. However,it is assumed that residents may also be recreationalists.
Adult, Teen, and Child Off-Property Recreationalists
Under current and future conditions, off-property recreationalists consisting of children, teenagers, andadults are expected to be exposed to Kalamazoo River sediment and surface water while walking orwading along the shore or swimming. It is assumed that exposure would be the result of walking orwading along the shore 75 percent of the time and swimming 25 percent of the time. Children are knownto play along the river shore near the former off-property railroad right-of-way. Also, a park with a pier
G-3-10

is located across the Kalamazoo River from the former off-property railroad right-of-way (see Figure
G-l). Children, teenagers, and adults visiting the river are assumed to be exposed through ingestion anddermal contact of surface water and sediment. Inhalation of volatile contaminants from sediment andsurface water is expected to be insignificant. Off-property recreationalists may also be exposed to fishcaught in the river; however, this exposure scenario was not evaluated because (1) a fishing advisoryalready exists for this stretch of the Kalamazoo River for all fish based on PCBs, (2) no fish tissue datawere available, and (3) RI data for semi-permeable membrane devices are only usable for qualitativeevaluation of human health and ecological risks.
Adult and Child On-Site Residents
Based on discussions with EPA and MDEQ, it is assumed that a residential area may be built on the sitein the future. This is consistent with surrounding land use. Based on the site size of approximately ^^30 acres, it is assumed that current structures would be demolished and a residential area would beconstructed consisting of 30 residences. Exposure pathways for future adult and child on-site residentsare the same as those for off-property residents and include inhalation of fugitive dust generated on site, 'inhalation of volatile contaminants migrating from LNAPL and groundwater to indoor air, ingestion anddermal contact with soil, ingestion and dermal contact with groundwater, and ingestion of homegrownproduce.
On-Site Visitor
Based on discussions with MDEQ and the City of Allegan, under future conditions, it is assumed that a ,,park may be constructed across the entire site consisting of open fields covered by grass. It is also likelypicnic areas containing shelters, tables, and grilling areas will be present at the park. Activities that mayoccur at the park include ball playing, picnicking, walking, and other recreational activities. Adult andchild on-site visitors may be exposed to surface soil through ingestion, dermal contact, and inhalation ofparticulates. These on-site visitors may also be exposed to groundwater during ingestion of groundwater
from an on-site drinking water fountain. Exposure to groundwater through dermal contact is expected tobe insignificant because the only available groundwater point of contact would be a water fountain. On-site visitors may also come into contact with surface water and sediment in the adjacent KalamazooRiver, but these scenarios were not evaluated for this receptor because it was assumed that the exposurefrequency of the off-property recreationalist would be greater.
G-3-11

On-Site Parking Attendant
Based on discussions with MDEQ and the City of Allegan, in the future, the western portion of the sitemay be used as a parking lot for the Allegan County fairgrounds located across the Kalamazoo River.Under this scenario, a foot bridge would be built from the site across the river to the fairgrounds. Anadult attendant working at the parking lot is assumed to be exposed more than visitors using the parkinglot. Therefore, only the parking attendant was quantitatively evaluated under this scenario. An adultparking attendant may be exposed to surface soil through ingestion, dermal contact, and inhalation ofparticulates for the duration of the county fair (14 days), plus an additional 14 days under the RMEscenario assuming that the parking lot will be used for other miscellaneous civic events.
3.3 EXPOSURE QUANTIFICATION
Exposure is defined as the contact of an organism with a chemical or physical agent. The magnitude ofpotential chemical exposure, which is the amount of chemical available at human exchange boundaries(skin, lungs, and gut) during a specified time period, are quantitatively assessed for the human receptorsdiscussed in Section 3.2.3 above.
Exposure dose equations consider contact rate, receptor body weight, and frequency and duration ofexposure to estimate the intake or dose of each COPC for the receptor. Exposure doses were calculatedfor the RME case, which is the highest level of exposure reasonably expected to occur, and for thecentral tendency (CT) case, which is the most likely level of exposure expected to occur.
Exposure can occur over a period of time. The total exposure can be divided by the time period tocalculate an average exposure per unit of time. An average exposure can be expressed in terms of bodyweight. AH exposures quantified in this HHRA are normalized for time and body weight, presented inunits of milligrams of chemical per kilogram of body weight per day (mg/kg-day), and termed "intakes."Equation G-l is a generic equation for calculating chemical intake (EPA 1989).
I - C x CR x EF x ED
where
I = Intake: the amount of chemical at the exchange boundary (mg/kg-day); toevaluate exposure to noncarcinogenic chemicals, the intake is referred to as
G-3-12
average daily dose (ADD); to evaluate exposure to carcinogenic chemicals, theintake is referred to as lifetime average daily dose (LADD)
C = Chemical concentration: the average concentration (referred to as the EPC)contacted over the exposure period (for example, milligrams per kilogram[mg/kg] for soil and milligrams per liter [mg/L] for groundwater)
CR = Contact rate: the amount of contaminated medium contacted per unit of time orevent (for example, milligrams per day [mg/day] for soil and liters per day[L/day] for groundwater)
EF = Exposure frequency: how often the exposure occurs (days/year)
ED = Exposure duration: how long the exposure occurs (years)
B W = Body weight: the average body weight of the receptor over the exposure period(kilograms [kg])
AT = Averaging time: the period over which exposure is averaged (days); forcarcinogens, the averaging time is 25,550 days based on a lifetime exposure of70 years; for noncarcinogens, the averaging time is calculated as ED (years) x365 days/year
Variations of Equation G-l were used to calculate pathway-specific exposures to COPCs. The equationsand parameter values used for each exposure pathway are presented in Tables G-F-1 through G-F-61 inAppendix G-F.
Calculation of EPCs and pathway-specific intake equations and exposure parameters are discussedbelow.
33.1 Exposure Point Concentrations
The EPC is defined as the concentration of a COPC that a human receptor is exposed to at an exposurepoint. This section summarizes how EPCs were derived for soil, air, groundwater, LNAPL, surfacewater, and sediment samples collected during the field investigation. Medium-specific EPCs for eacharea, medium, and COPC are presented in Table G-6.
Data used in the HHRA were obtained from samples collected by Tetra Tech as part of the fieldinvestigation for the RI. The procedures used to identify data outliers and compare on-site data sets tothe background soil data are discussed in Section 2.2. 1 . Prior to calculation of EPCs, data were firstevaluated to determine their distribution. The data sets were tested for normal and lognormal
G-3-13

distributions. Specifically, the data were evaluated using normal probability plots and the W-test(appropriate for sample lots less than 50). For parameter-specific data sets with nondetect values(censored data), the W-test requires the substitution of one-half the detection limit for the censored data.The distribution of data sets with more than 50 percent censored data was not determined and assumed tobe lognormal.
The 95th percentile upper confidence limit (UCL,5) on the mean was determined for data sets with normalor lognormal distributions using the distribution-specific methods in EPA's "Supplemental Guidance toRAGS: Calculating the Concentration Term" (EPA 1992c). Procedures used to estimate EPCs arediscussed below.
Procedures Used to Calculate EPCs
For normal or lognormal distributions, the UCL^ was calculated as described in EPA's "SupplementalGuidance to RAGS: Calculating the Concentration Term" (EPA 1992c). If the normal and lognormaldistributions were rejected and a nonparametric distribution was assumed, a percentile equivalent to theUCL,, was calculated as the EPC (WSDE 1992 and 1993). This equivalent was calculated using the"Z factor" as described below. An equivalent percentile was determined for each data set based on thenumber of samples associated with the data set. With an exactly normal distribution, the UCL,5 is apercentile above the 50th percentile of the distribution as shown in Equation 2.
UCL = x + t / y s • (G-2)
wherex = Mean of sample chemical concentrationst = Student t-value (alpha = 0.05)n = Number of sampless = Standard deviation of sample chemical concentrations
Equation G-2 becomes the exact parameter calculated in Equation G-3 below.
UCL = u + (t/vflo (G-3)t
wherefj. = Mean of sample chemical concentration distribution
t = Student t-value
G-3-14

n = Number of. sampleso = Standard deviation of sample chemical concentration distribution
How much the percentile exceeds the 50th percentile is an inverse function of the number of samples.
The percentile can be calculated by calculating the factor [t(n.a.9j%)v/n]- This factor, normally called "Z"or the "standard normal variable," is entered into a table of the cumulative normal distribution todetermine an equivalent percentile. This equivalent or ideal percentile can be used as the RME pointconcentration for non-normal distributions when applied in nonparametric style (that is, with noassumptions regarding the type and shape of the distribution). The equivalent percentile for eachchemical set is calculated using the following nonparametric procedure (Gilbert 1987):
1. Order the sample data from minimum to maximum: x, s x-, z ... xk s ... x,,.
2. Calculate the kth value that corresponds to the quantile using k = q (n+1), whereq = percentile equivalent to UCL^ and n = number of samples.
3. If k is an integer, use the required concentration term xk.
4. If k is not an integer (for example, for a set of 10 samples, k = 7.92), select theconservative value, which is the next largest integer (in this example, k = 8). If there is alarge difference in the data values above and below a noninteger, use the more precisevalue of linear interpolation. For a k of 7.92, EPC = x7 + 0.92 (x, - x 7).
Alternate EPC calculation methods are required for air and homegrown produce exposures becausecontaminant fate and transport mechanisms must be estimated to determine EPCs for these exposurepathways. EPC calculation methods for air and homegrown produce exposure are presented below.
Air EPCs
On-site and off-property air contaminant concentrations were also determined using paniculate emissionfactors (PEF) and the SQIEEN3 model. PEFs were used to estimate on-site paniculate contaminant airconcentrations under both current and future land-use scenarios. PEFs were calculated using dispersionfactors; emission rates for wind, vehicle activity, and site preparation activities; and percentages ofvegetative cover. Separate PEFs were also calculated for each HHRA area. On-site contaminantconcentrations were calculated by dividing soil EPCs by the appropriate PEFs. The SCREENS modelwas used to estimate off-property air contaminant concentrations. Appendix G-C summarizes thealgorithms and assumptions used to (1) estimate paniculate emissions under a variety of scenarios and(2) estimate on-site and downwind (off-property) airborne paniculate contaminant concentrations.
G-3-15

EPCs were calculated for resident and worker exposure to indoor air concentrations using the Johnsonand Ettinger (1991) model. This model is recommended for use by EPA and MDEQ. The modelestimates diffusive and convective transport of contaminant vapors emanating from soil and groundwaterinto indoor spaces. Appendix G-D discusses the algorithms, assumptions, and input parameter values
used to estimate indoor air concentrations.
EPCs were also calculated for construction or utility worker exposure to VOCs migrating fromcontaminated groundwater to air present in trenches. These EPCs were calculated by estimating the(1) flow rate of contaminated groundwater into a trench excavated by construction or utility workers,(2) amount of VOCs that will volatilize into air present within the trench and, (3) air flow rate within thetrench. Appendix G-D discusses the algorithms, assumptions, and input parameter values used toestimate air EPCs in construction or utility trenches.
Homegrown Produce EPCs
Concentrations of COPCs in residential homegrown produce were also calculated using EPA Region 6methodologies (EPA 1998). The total concentration of COPCs in the leafy, fruit, and tuber portions ofthe plant were calculated. Aboveground and below ground produce concentrations resulting from rootuptake (see Equations G-4 and G-5) were included in the calculations. Concentrations of COPCs inaboveground produce were calculated as follows:
Prlg = Cs x Br^ (G-4)
where
PrM = Concentration of COPC in aboveground produce resulting from root uptake(mg COPC/kg dry weight)
Cs = Average soil concentration over exposure duration (mg COPC/kg soil) (seeTable G-6)
BrM = Plant-soil bioconcentration factor for aboveground produce (unitless) (seeTable G-7)
G-3-16

Concentrations of COPCs in below ground produce resulting from root uptake were calculated asfollows:
where
Pr
Cs
x Brroo|veg x (G.5)
Concentration of COPC in below ground produce resulting from root uptake(mg COPC/kg dry weight)
Average soil concentration over exposure duration (mg COPC/kg soil) (seeTable G-6)
Plant-soil bioconcentration factor for below ground produce (unitless) (seeTable G-7)
Empirical correction factor for below ground product (unitless) (conservativelyassumed to be 1)
Daily intakes of COPCs for child and adult residents from aboveground and below ground produce werecalculated as follows:
l =
where
CRU =
CRag> CRpp> CRbg>]
Daily intake of COPC from produce (mg/kg-day dry weight)
Aboveground exposed and protected produce concentration due to root uptake(mg/kg) (calculated using Equation G-4)
Consumption rate of exposed aboveground produce (kg/kg-day dry weight)(0.00042 for the child resident and 0.0003 for the adult resident) (EPA 1998)
Consumption rate of protected aboveground produce (kg/kg-day dry weight)(0.00077 for the child resident and 0.00057 for the adult resident) (EPA 1998)
Below ground produce concentration resulting from root uptake (mg/kg)(calculated using Equation G-5) (EPA 1998)
Consumption rate of below ground produce (kg/kg-day dry weight) (0.00022 forthe child resident and 0.00014 for the adult resident) (EPA 1998)
Fraction of produce that is contaminated (unitless) (0.25 for child and adultresidents) (EPA 1998)
G-3-17

Concentrations of COPCs in homegrown produce from air-to-plant migration of COPCs was notevaluated because VOCs are not COPCs in surface soil. Also, homegrown produce COPCconcentrations from paniculate deposition were not evaluated because this migration pathway isexpected to be insignificant; PCBs and metals, the primary soil paniculate COPCs, are unlikely to bedesorbed from soil particulates and migrate through plant membranes.
3.3.2 Pathway-Specific Intake Equations and Exposure Parameters
The equations and parameter values used to estimate exposures under RME and CT exposure conditionsfor each exposure pathway are summarized in Tables G-F-1 through G-F-61 in Appendix G-F. Thissection discusses the calculation algorithms that were used to quantify intake (or dose) for each COPC.A description of the value used for each exposure parameter is also provided. For both the RME and CTevaluations, estimates of the LADDs and ADDs are quantified. The LADD defines a dose level that isdistributed (averaged) over an entire lifetime rather than a specific incremental exposure period. Unlikethe LADD, the ADD is not averaged over an entire lifetime. The RME LADDs and ADDs will be usedto calculate upper-bound estimates of the increased potential carcinogenic risks and noncarcinogenichazards, respectively, and the CT LADDs and ADDs will be used to estimate the average carcinogenicrisks and noncarcinogenic hazards, respectively.
The equations used for quantifying exposure to COPCs in site media and the rationale for each pointestimate value to be used for both the RME and CT evaluations are discussed below. In general,exposure values were taken from established EPA guidance documents, including RAGS (EPA 1989),"Exposure Factors Handbook" (EPA 1997a), "Human Health Evaluation Manual, SupplementalGuidance: Standard Default Exposure Factors" (EPA 199la), and "Dermal Exposure Assessment:Principles and Applications" (EPA 1992a). These documents were used along with site-specificinformation and information from peer-reviewed scientific literature to identify appropriate RME and CTexposure parameters.
Potentially exposed populations associated with the site and surrounding area include trespassers,residents, recreationalists, on-site workers, construction or utility workers, and on-site parking attendants.Tables G-F-1 through G-F-61 in Appendix G-F present the proposed exposure parameter values for thesepopulations. Exposure parameters are presented for the potential exposure routes (for example,ingestion, inhalation, and dermal contact) and points of contact (for example, soil and groundwater).
G-3-18

Equations used to calculate the LADD and ADD are presented below.
Exposure Through Soil and Sediment Ingestion:
T Ar»r» / Arvr» C x IS x FI x CF x EF x EDLADD / ADD = ————————————————— (G-7)BW x AT ( '
Exposure Through Dermal Contact with Soil and Sediment:T Arvr» / A™ C x AF x ABS x SA x CF x EF x EDLADD / ADD = —————————————————————— (G-8)
BW x AT ( '
Exposure Through Inhalation of Particulates:T Ar»r» / Ar»rk C x INR X EF X ED X ET X CFLADD / ADD = ——————————————————— (G-9)
BW x AT l '
Exposure Through Ingestion of Ground water and Surface Water: ,
LADD / ADD = C x IW x EF x EDBW x AT l '
Exposure Through Dermal Contact with Groundwater and Surface Water:C x DA . x SA x CF x EF x ED
LADD / ADD = ————^S————————————— (G-ll)BW x AT
Exposure parameters and values for these equations are discussed below.
LADD-Lifetime Average Daily Dose (mg/kg-day): This term represents the dose averaged over a70-year lifetime used to evaluate potential carcinogenic effects.
ADD-Average Daily Dose (mg/kg-day): This term represents the dose averaged over the exposureduration used to evaluate potential noncarcinogenic effects.
C-Concentration of Chemical in Medium (in medium-specific units): Concentrations are represented
by the lower of the UCL^ or maximum concentrations for RME and CT evaluations. For soil (seeEquations G-7 and G-8), the concentration term is expressed as mg/kg. For air (see Equation G-9), it ismilligrams per cubic meter (mg/m3). For water (see Equations G-10 and G-ll), it is mg/L.
IS-Ingestion Rate for SoU and Sediment (nig/day): EPA recommends a soil ingestion rate of100 mg/day for adults based primarily on Hawley's 1985 published estimate of 65 mg/day. Thisingestion rate was also used as the RME value for teenagers. Activity patterns of children and
G-3-19

construction or utility workers result in increased ingestion rates. A 200-mg/day ingestion rate will be
used for the RME value for these receptors. CT values are one-half of the RME ingestion rates for all ofthe receptors discussed (EPA 199 la). For the on-site worker, a 50-mg/day soil ingestion rate was usedfor RME and CT evaluations (EPA 199 la). All soil ingestion rates were also applied to sedimentingestion rates.
FI-Fraction Ingested (unitless): This term accounts for the fraction of soil (including sediment) or dustingested that is presumed to be contaminated. National studies indicate that children, teenagers, andadults spend an average of 4, 5, and 1.5 hours per day, respectively, at outdoor recreation (EPA 1997b).Therefore, for the teenage trespasser RME value, the fraction ingested is calculated as 2 hours on site outof 5 hours spent in outdoor activity. For child recreationalists and on-site visitors, the RME value iscalculated as 2 hours on site out of 4 hours spent in outdoor activity. For adult recreationalists and on-site visitors, the RME value is 1 because the adult is also assumed to spend 2 hours on site. CT valuesare assumed to be one-half of the RME values. All workers are conservatively assumed to spend theentire day at the site, and 100 percent of the fraction of soil ingested is assumed to be contaminated.Therefore, the fraction ingested is 1 for all workers.
CF-Conversion Factor (in route- and medium-specific units): Conversion factors are used in some ofthe dose equations when the parameter units are not directly comparable. For example, in Equations G-7and G-8, a conversion factor of 10"* kg/mg was used. In Equation G-l 1, a conversion factor of 1 liter per1,000 cubic centimeters was used.
EF-Exposure Frequency (days/year): This term represents the amount of time an individual may spendpotentially exposed to site-related chemicals. For the trespasser, an RME value for an exposurefrequency of 54 days/year was obtained from discussions with EPA (Tetra Tech I998a and 1999). TheCT value was assumed to be one-half of the RME value. For the on-site worker, the exposure frequencyof 128 days/year was based on the value of 112 days/year recommended by MDEQ for dermal contactwith soil (MDEQ 1998b). However, on-site workers were assumed to be exposed to particulates anadditional 16 days/year, which includes every non-winter and non-rain day that the worker is present onsite. For the construction or utility worker, an exposure frequency of 20 days/year was used for CT andRME evaluation of soil ingestion and dermal contact, and 200 days/year was used for the CT evaluations
of paniculate inhalation and exposure to groundwater. For the off-property recreationalist and on-sitevisitors, exposure frequency values of 145 (RME) and 73 (CT) days/year were based on the assumptionthat individuals will be involved in recreational activities two days per week, except for 120 days of
G-3-20

Michigan winter (MDEQ 1998b), one rainy day per non-winter week (MDEQ 1998b), and one week ofnon-winter vacation. The EPA default value of 350 days/year was used for the RME residentialevaluation, and 206 days/year will be used for the CT residential evaluation. This value accounts fortime spent at home and allows for an absence of 2 weeks per year (EPA 199la). For on-site parkingattendants, exposure frequency values of 28 and 14 days per year are based on the duration of the countyfair (14 days for the CT evaluation) plus 14 additional days for miscellaneous civic events (28 days forthe RME evaluation).
ED-Exposure Duration (years): The exposure duration is the amount of time an individual may beexposed to site-related chemicals. Typically, this term describes the number of years spanning thereceptor group (for example, children and teenagers), occupational tenure or length of constructionactivity for industrial scenarios, or residency time for residential scenarios. For on-site workers, thisparameter describes the number of years that an individual will spend performing work-related activitiesat the site. Available data indicate that average occupational tenure is 6.6 years, which was used for theCT value, and an appropriate upper-bound estimate of 25 years was used for the RME value(EPA 199 la). Construction or utility workers were assumed to spend 1 year on the site performingconstruction activities.
For residential scenarios, the exposure duration parameter is the fraction of a lifetime an individualspends at his or her home. National data were used for both the RME and CT evaluations. The exposureduration for the CT will be the 50th percentile of the residential tenure distributions of owner-occupiedhousing in the United States (9 years for noncarcinogenic risk). The exposure duration for the RMEvalue is the 90th percentile of this distribution (30 years for noncarcinogenic risk) (EPA 199 la). For theadult off-property recreationalist, on-site visitors, and on-site parking attendant, resident exposuredurations were used to represent these receptors because nearby residents were assumed to be engaged inthese activities.
BW-Body Weight (kg): Standard EPA and MDEQ default body weights were used for exposurescenarios for both the RME and CT evaluations. A body weight of 70 kg were used for adults (EPA199la; MDEQ 1998b). Child and teenager body weights of 15 and 58.1 kilograms, respectively, weretaken from recent EPA guidance (EPA 1997b). An older child body weight of 33 kilograms was also
taken from recent EPA guidance (EPA 1997b).
G-3-21

AT-Averaging Time (days): The average lifetime for humans is assumed to be 70 years (EPA 1989) forthe LADD calculations. For the ADD calculations, the averaging time was set equal to the exposureduration.
AF-Soil Adherence Factor (milligrams per square centimeter [mg/cm2]): EPA has determined that arange of values from 0.2 to 1.5 mg/cm2 appears to be plausible for this term (EPA 1992a). EPA believesthat the lower end of the range may be the best value to represent an average overall soil adherence factor(EPA 1992a). Therefore, the value of 0.2 mg/cm2 was used for the RME estimates for trespassers,construction or utility workers, and child residents. These estimates are consistent with the currentvalues presented in revisions to the dermal exposure assessment and MDEQ guidance (TetraTech 1998d). This is also the soil adherence factor presented by EPA Region DC (EPA 2000). For theconstruction or utility worker, 0.2 mg/cm2 was also used for CT estimates. For other the CT estimates,soil adherence factors were calculated from EPA guidance (EPA 1997). For the trespasser, child on-sitevisitor, and child resident, a CT adherence factor of 0.03 mg/cm2 was calculated from EPA guidance(EPA 1997b) based on loadings to hands, arms, and legs for outdoor soccer activities (EPA 1997b). Forthe adult resident, adult on-site visitor, on-site parking attendant, and on-site worker, RME and CTestimates were calculated from EPA guidance based on "landscape and rockery" activities (EPA 1997b).
ABS - Dermal Absorption Factor (unitiess): This term is used to determine the amount of a chemicalabsorbed through the skin from soil. ABS terms have been experimentally determined for only a fewchemicals (EPA 1992a; Tetra Tech 1998b). In addition to available guidance, EPA Region 5 staff fromthe dermal work group provided absorption factors that are to be included in the revised dermal exposureassessment guidance currently being prepared by EPA (Tetra Tech 1998b). In the absence ofexperimental data, ABS values of 0.25,0.1, and 0.01 are proposed for VOCs, SVOCs, and inorganics,respectively. Chemical-specific ABS values are summarized in Table G-8 for all COPCs.
SA-Skin Surface Area (square centimeter [cm1] or cmVday): EPA guidance states that 10 to25 percent of the total skin surface area is available for contact with soil throughout the year(EPA 1992a). Therefore, a value of 25 percent of the average total skin surface area was used for mostRME and CT evaluations. However, exposed skin surface area for workers is likely less than for otherreceptors; therefore, 10 percent of the total skin surface area was used for the CT value for this receptor.
The average total skin surface area for the teenager (ages 12 through 17) is 15,800 cm2 (EPA 1997b).The upper-bound total skin surface area for adult men and women, 20,000 cm2, was obtained from
G-3-22

MDEQ and is in agreement with available EPA guidance (MDEQ 1998b; EPA I992a; Tetra
Tech 1998d). The average adult skin surface area. 18.000 cnr, was obtained from EPA (EPA 1997b).The average total skin surface area for the child is 7,213 cnr (ages 0 to 6) or 1 1336 cm2 (ages 7 to 12)(EPA 1997b). Skin surface area exposed to groundwater will be evaluated on a scenario-by-scenariobasis.
INR-Inhalation Rate (cubic meters per hour [mVhr]): Inhalation rates are based on national studiesand represent average rates for resident receptors. For the child and adult, inhalation rates of 0.31 and0.55 nrVhr, respectively, were used for both the RME and CT evaluations. For all other receptors,inhalation rates were calculated on a scenario-by-scenario basis from EPA guidance based on the types ofactivities conducted by each receptor (EPA I997b).
ET-Exposure Time (hours per day [hr/day] or hr/event): The exposure time is the amount of time anindividual may be exposed to site-related chemicals each day. Trespassers, on-site visitors, and off-property recreationalists were assumed to spend 2 hr/day (RME) or 1 hr/day (CT) engaged in scenario-specific activities. For on-site and construction or utility worker exposure to groundwater, exposuretimes were assumed to be 0.25 (RME) and 0. 17 (CT) hr/event and 2 (RME) and 1 (CT) hr/event,respectively (EPA 1997). A standard worker exposure time for all other scenarios is 8 hr/day and isapplicable to both the RME and CT scenarios. However, on-site workers were estimated to spend anaverage of 4 hours outdoors and construction or utility workers are assumed to spend 8 hr/day outdoors.Residential exposure times are conservatively assumed to be 24 hr/day. On-site parking attendantexposure times were assumed to be 12 (RME) and 8 (CT) hr/day based on the likely duration of a typical
work day.
IW-Ingestion Rate for Drinking Water (L/day): Future on-site visitors may ingest groundwater froman on-site drinking water fountain. Based on professional judgment, the child was conservativelyassumed to ingest approximately 4 ounces of groundwater (about 0. 125 L/day) and the adult wasassumed to ingest 8 ounces of groundwater (about 0.25 L/day) for the RME evaluation. CT values areassumed to be one-half of the RME values. EPA-recommended ingestion rates will be used for the on-site worker (1 L/day for RME and CT evaluations) and residents (2.4 and 1.5 L/day for the RME and CTestimates, respectively) (EPA 199 la and 1997c).
Absorbed Dose per Event (in mg/cm1 per event): For organics, a nonsteady-stateapproach was used for estimating the dermally absorbed dose from water. EPA recommends this
G-3-23

approach because the method more accurately reflects normal human exposure conditions and accountsfor the dose that can occur after the actual exposure event resulting from absorption of contaminantsstored in skin lipids. However, this nonsteady-state approach was developed for application to organicsthat exhibit octanol-water partitioning. Thus, it is not applicable to inorganics (EPA I992a). Thefollowing equations were used to calculate
Organics:
If ET <t*, then DA^ = 2PC x EPC x CF x (6Tau x ET/xyX).5 (G-12)
If ET >t*. then DAeveM = PC x EPC x CF x {[ET/(1+B)1 + 2ra«[(l+3B/(l+B)]} (G-13)
Inorganics:DA^ =PCxEPCxCFxET (G-14)
wherePC = Permeability coefficient (centimeters per hour); used to determine the dose of an
,» inorganic chemical absorbed through the skin from water; chemical-specificvalues for PC available in EPA's "Dermal Exposure Assessment: Principles andApplications" (EPA 1992a)
t* = Time to steady state conditions (hr)
Tau = Lag time (hours)
B = Bunge constant reflecting the partitioning properties of a compound(dimensionless)
Chemical-specific constants, including PC, B, Tau, and t* values, are summarized in Table G-9.
3.4 EXPOSURE ASSESSMENT UNCERTAINTIES
Uncertainty and variability are associated with all aspects of the exposure assessment process. Often,these two terms are used interchangeably; however, the two terms are not equivalent. Variability refers
t
to the natural variation associated with specific processes or terms that are measured or represented withestimated values. Variability cannot be reduced by further measurements or more data collection.However, additional data or greater data analysis may allow the variability to be better characterized.
G-3-24
Uncertainties, on the other hand, generally refer to gaps in knowledge. Defined this way. furthermeasurements or more data collection may reduce uncertainty.
For the purposes of this HHRA, the term "uncertainties" is used to refer to both variability anduncertainty as defined above. For the most part, the results of the exposure assessment are impactedmore by uncertainties, or gaps in knowledge, than by variability. For the specific uncertainties discussedbelow, the discussion addresses both gaps in knowledge and natural variability. The followingdiscussion is not intended to be all-inclusive. The intention is to identify and discuss the uncertaintiesthat most significantly impact the results of the exposure assessment so that the exposure assessmentresults and the overall HHRA results can be interpreted in the proper context.
The major areas of uncertainty discussed below involve (1) environmental chemical concentrations,including modeling and calculation of EPCs; (2) exposure pathway identification; (3) exposureparameters and assumptions; and (4) assumption of steady-state conditions.
3.4.1 Environmental Chemical Concentrations
Significant uncertainties are associated with the modeled concentrations as well as with the use ofmedium-specific analytical results that are often limited. The medium- and chemical-specific airconcentrations and EPCs used in the HHRA were based on fate and transport modeling rather than onanalytical results. Uncertainties are also associated with soil, LNAPL, groundwater, surface water, andsediment analytical results used in the HHRA. Uncertainties associated with medium-specificconcentrations are discussed below.
Air Concentrations
Estimates of air concentrations are based entirely on modeling. Significant uncertainty is associated withthe modeling itself. The model used to estimate paniculate emissions and on-site and off-property airconcentrations requires values for a large number of input parameters, as well as knowledge regardingthe nature, frequency, and duration of fugitive dust-generating activities that may occur on site underboth current and potential future land-use scenarios. In reality, measured values are available for only ahandful of the necessary input parameters, and activities that may occur on-site in the future cannot beknown with certainty. Therefore, both the required input parameter values and the nature of siteactivities must be assumed. Each of these assumptions introduces uncertainty into the estimates of on-
G-3-25

and off-property COPC-specific air concentrations. Unless air testing is conducted, it is impossible to
determine whether the emissions estimates, including the particle size distributions, are accurate.Specific sources of uncertainty include the (1) use of default dispersion factors; (2) uncertaintiesassociated with estimating respirable paniculate (particles with diameters less than or equal to10 microns) emissions from wind erosion, vehicle traffic, and site preparation; (3) use of soil EPCs; and(4) the use of the SCREENS model to estimate off-property air concentrations. A more detaileddiscussion of uncertainties associated with estimating air concentrations is presented in Appendix G-D.
Semi-Permeable Membrane Device Concentrations
In general, contaminant data obtained from the use of semi-permeable membrane devices (SPMD) aretypically used for qualitative evaluation purposes such as (1) detecting contaminants that are present atsuch low levels that they are undetectable in grab samples of surface water, (2) determining pollutantsources, and (3) evaluating relative contaminant levels at different locations. Although semi-permeablemembrane devices may mimic the bioconcentration of lipophilic contaminants, such as PCBs, PAHs, anddioxins and furans, in fatty tissues of organisms such as fish, the data was not included in the HHRAbecause semi-permeable membrane devices are stationary and do not reflect activity patterns of fish.Also, numerous chromatograms of semi-permeable membrane device extracts show greater quantities ofnonpolar low Kow chemicals (such as PCBs) sequestered in semi-permeable membrane devices relative tocaged fish because biota more readily metabolize or depurate most low Kow chemicals (USGS 1999).Furthermore, fish ingestion was not evaluated in the HHRA because (1) a fishing advisory already existsfor the stretch of the Kalamazoo River adjacent to the site for all fish based on PCBs, (2) no fish tissuedata were available, and (3) RI data for semi-permeable membrane devices are only usable for qualitativeevaluation purposes as noted above. The use and results of the SPMDs deployed at the Rockwell site are
discussed in the Ecological Risk Assessment (see Appendix H of the RI).
Soil, LNAPL, Groundwater, Surface Water, and Sediment Concentrations
Based on the available information, the uncertainty associated with chemical concentrations in soil,LNAPL, groundwater, surface water, and sediment is limited. Systematic or random errors in thechemical analyses may yield erroneous data and result in over- or underestimated risks.
G-3-26

3.4.2 Exposure Pathway Identification
Exposure pathways for this HHRA were identified based on observed and assumed activity patterns ofcurrent and future receptors at or near the site. The magnitude of uncertainty associated with currentexposure pathways is low; however, for future exposure scenarios the magnitude of uncertainty is high.For example, future residents at the site are assumed to use groundwater for drinking water; however,current residents in the area obtain drinking water from the City of Allegan. It is likely that any futureresidents will also obtain drinking water from the City of Allegan and not from the aquifer beneath thesite. Therefore, the assumption that groundwater at and in the vicinity of the site will be used fordrinking water introduces significant uncertainty to the HHRA. To the extent that assumed activitypatterns are inaccurate, uncertainty is introduced into the identification of exposure pathways.
3.4.3 Exposure Parameters and Assumptions
Standard exposure parameter assumptions made for population characteristics, such as body weight, bodysurface area, life expectancy, and period of exposure, as well as assumptions made for exposurecharacteristics, such as exposure frequency, exposure duration, contact rate, and degree of absorption orsoil adherence, may not represent actual exposure conditions.
The impact of population characteristic differences is probably insignificant when the entire potentiallyexposed population is considered because population characteristics used in the HHRA are based onnational averages of large sample populations. However, the characteristics used may not accuratelyrepresent individuals who may be exposed at or near the site; therefore, actual exposures may be over- orunderestimated. Use of upper-bound contaminant concentrations to represent EPCs may also result in an
overestimation of risk.
The drinking water ingestion rate for the on-site visitor was assumed to be 4 ounces based onprofessional judgment. Actual drinking water ingestion rates may be higher during strenuous physicalactivity (such as ball playing). Therefore, risks may be underestimated. However, risks and hazards foringestion of drinking water by on-site visitors significantly exceed acceptable ranges based on an intakerate of 4 ounces.
For recreationalists and on-site visitors, the fraction of soil and sediment ingested was based on nationalstudies on time spent in outdoor recreation (EPA 1997b). This does not account for indoor dust
G-3-27

comprised of outdoor soil and sediment. Therefore, actual amounts of outdoor soil and sediment may beslightly higher. Higher fractions of contaminated soil and sediment ingested by receptors may result insome additional risk.
3.4.4 Assumption of Steady-State Conditions
Analytical data collected in 2000 during the field investigations were used to estimate EPCs forexposures assumed to take place 30 or more years in the future. The inherent assumption is that futureon- and off-property chemical concentrations will not change. This assumption ignores the effects ofvarious fate and transport mechanisms that will alter the composition and distribution of chemicals in thevarious media over time.
The concentrations of metals and PCBs in soil are not expected to be significantly impacted by fate andtransport mechanisms. In general, assumption of steady-state conditions usually results in overestimationof chemical concentrations and of resulting exposure doses and risks.
G-3-28

4.0 TOXICITY ASSESSMENT
This section identifies the toxicity values for quantifying potential adverse effects on human healthassociated with exposure to COPCs at the Rockwell site. These toxicity values include reference doses(RfD) for noncarcinogenic COPCs and slope factors (SF) for carcinogenic COPCs. The toxicity valuesfor assessing the effects of noncarcinogenic COPCs are discussed in Section 4.1. The toxicity values forassessing the effects of carcinogenic COPCs are discussed in Section 4.2. Section 4.3 discusses theapproach used to estimate toxicity values for evaluating dermal exposure. Section 4.4 discusses thetoxicity profiles for COPCs at the site. Section 4.5 discusses uncertainties related to the identification oftoxicity values.
4.1 TOXICITY VALUES FOR NONCARCINOGENIC COPCs
Standard risk assessment models assume that noncarcinogenic effects, unlike carcinogenic effects,exhibit a threshold; that is, a level of exposure exists below which no adverse effects are observed. Thepotential for noncarcinogenic health effects resulting from potential exposure to a COPC is assessed bycomparing an estimated intake to an RfD. The RfD represents an estimated daily intake rate for anoncarcinogenic COPC that is believed to pose no appreciable risk of deleterious effects on humanhealth, including the health of sensitive populations, during a lifetime. Similarly, a referenceconcentration (RfC) is a chemical-specific air concentration that is believed to pose no appreciable riskof deleterious effects on human health, including the health of sensitive populations, during a lifetime.
An RfD is specific to a chemical and a route of exposure, such as ingestion or inhalation. In addition,chronic and subchronic RfDs are developed for different periods of exposure. Chronic RfDs are used toevaluate exposures occurring over periods of more than 7 years, and subchronic RfDs are used toevaluate exposures occurring over periods of 2 weeks to 7 years. For this HHRA, chronic RfDs for theoral and inhalation routes of exposure were used; these RfDs were obtained from the Integrated RiskInformation System (IRIS) (EPA 2000 and 200la) and Health Effects Assessment Summary Tables(HEAST) (EPA 1997b). In some cases, for COPCs without RfDs, surrogate chemicals with similarchemical structures were identified and the surrogate RfDs were included for those COPCs. Table G-10presents these surrogate chemicals and RfDs.
To derive an RfD, EPA work groups review all human and animal studies relevant to a chemical andselect the study or studies pertinent to the derivation of the RfD. RfDs are often derived from a measured
G-4-1

or estimated no observed adverse effect level (NOAEL). The NOAEL corresponds to the dose, in
mg/kg-day, that can be administered over the exposure period without inducing observable adverseeffects. If a NOAEL cannot be determined, the lowest observed adverse effect level (LOAEL) is used.The LOAEL corresponds to the lowest daily dose administered over the exposure period that induces anobservable adverse effect. The toxic effect characterized by the LOAEL is referred to as the "criticaleffect."
To derive an RfD, the NOAEL or LOAEL is divided by an uncertainty factor to ensure that the RfD willbe protective of human health. Uncertainty factors usually occur in multiples of 10, and each factorrepresents a specific area of uncertainty inherent in the extrapolation from available data. Uncertaintyfactors account for (1) variations in the general population to protect sensitive human populations such aschild and elderly receptors, (2) extrapolation of data from animals to humans (interspecies extrapolation),(3) derivation of a chronic RfD based on a subchronic rather than a chronic study, and (4) derivation ofan RfD based on a LOAEL instead of a NOAEL. Modifying factors may be applied to the data to reflectadditional uncertainties associated with the data. Modifying factors range from 0 to 10. Tables G-11 andG-12 present the oral and inhalation RfDs used in this HHRA and summarize the source, route ofadministration (basis), critical effect, uncertainty factor, and modifying factor for each COPC identifiedat the site. Inhalation RfDs were calculated from RfCs using an average adult inhalation rate and bodyweight as shown in the following equation:
Inhalation RfD = RfC x 20 m3/day70 kg
Inhalation RfDs are used in the HHRA to calculate hazards to receptors exposed to air contaminantsthrough inhalation of particulates and VOCs in indoor and outdoor air.
Toxicity factors are not available for lead. The potential for human health effects as a result of exposureto lead is typically estimated on the basis of blood-lead concentrations. EPA guidance recommends theuse of separate models for assessing risks associated with exposure to lead by children and adults.Specifically, EPA recommends using the "Integrated Exposure Uptake Biokinetic Model for Lead inChildren" (IEUBK) model. Version 0.99d, to assess lead exposure of children 0 to 7 years (84 months) ofage (EPA 1994a and 1994b). To assess the risks associated with lead exposure of adults, EPArecommends using the "Recommendations of the Technical Review Workgroup for Lead for an InterimApproach to Assessing Risks Associated with Adult Exposures to Lead" (EPA 1996c). Both models are
G-4-2

run to assess risks associated with exposure to lead (that is, the probability of receptor-specific blood-lead concentrations exceeding 10 micrograms per deciliter). Appendix G-E provides the riskmethodologies used to evaluate lead exposures for child and adult receptors.
4.2 TOXICITY VALUES FOR CARCINOGENIC COPCs
The potential for exposure to a given chemical to result in carcinogenic effects is evaluated differentlythan for noncarcinogenic effects. The upper-bound excess lifetime cancer risk (ELCR) associated with agiven dose is calculated by multiplying the dose from a given route of exposure by an SF. An SF is anupper-bound estimate of the probability of a carcinogenic response per unit dose of a chemical over alifetime. SFs are derived through use of mathematical models based on a high-to-low dose extrapolationand assume that no threshold exists for initiation of cancer. Because of the use of the nonthresholdassumption and the UCL^ of the slope of the dose-response curve, use of SFs provides a conservative,upper-bound estimate of potential cancer risks. The actual response to a given dose of a chemical is
therefore probably less than the predicted response (EPA 1989).
EPA assigns weight-of-evidence designations to indicate the likelihood that a chemical agent is acarcinogen in humans. These designations are defined below (EPA 1989).
• "A" indicates that a chemical is considered to be a proven carcinogen in humans.
• "B" indicates that a chemical is considered to be a probable human carcinogen. "B1"indicates that suggestive but inconclusive evidence of carcinogenicity in humans isassociated with the chemical, and "B2" indicates that conclusive evidence of achemical's carcinogenicity is documented in repeated animal studies but that evidence ofcarcinogenicity in humans is inconclusive.
• "C" indicates that a chemical is a possible human carcinogen either because a single,high-quality animal study demonstrates carcinogenicity or because several low-qualityanimal studies indicate carcinogenicity.
• "D" indicates that evidence of a chemical's carcinogenicity in animals or humans isinconclusive.
• "E" indicates that no evidence of a chemical's carcinogenicity is available from adequatehuman or animal studies.
G-4-3

SFs are specific to a chemical and route of exposure and are generally available for both the oral(ingestion or gavage) and inhalation routes. Sources of SFs include, in order of preference, IRIS,HEAST, and the National Center for Environmental Assessment (NCEA). Tables G-13 and G-14summarize the oral (ingestion or gavage) and inhalation SFs used in this HHRA and summarize thesource, route of administration (basis), target organ, and weight-of-evidence for each COPC identified atthe site.
Inhalation SFs were calculated from unit risk factors (URF) using an average adult inhalation rate andbody weight as shown in the following equation:
-I
20 m3Inhalation SF(mg/kg-day)'' = URF -^M x 1 day x 70 kg x Conversion Factor (1,000 Mg/mg) (G-16)3 3
Inhalation SFs are used in the HHRA to calculate risks to receptors exposed to air contaminants throughinhalation of particulates and VOCs in indoor and outdoor air.
43 ESTIMATION OF TOXICTTY VALUES FOR DERMAL EXPOSURE
RtDs and SFs are not available for the dermal exposure pathway. In many cases, noncarcinogenic andcarcinogenic risks associated with the dermal exposure pathway can be evaluated using an oral RfD orSF (EPA 1989). Most oral RfDs and SFs are expressed as the amount of substance administered per unittime and unit body weight, or the administered dose. However, exposure estimates developed for dermalexposure to COPCs in soil or water are expressed as the amount of substance absorbed or the absorbeddose. Adjustments are sometimes required to ensure that the exposure estimate and the toxicity value areboth expressed as absorbed doses or are both expressed as administered doses.
To ensure that the exposure estimate and toxicity value are comparable, the toxicity value (RfD or SF),which is generally based on an administered dose, is adjusted to reflect an absorbed dose. Specifically,the oral RfD or SF for a COPC is adjusted using the gastrointestinal (G.I.) absorption efficiency for thatCOPC (EPA 1989). For noncarcinogens, the absorbed dose RfD is the product of the oral administereddose RfD and the G.I. absorption efficiency. For carcinogens, the absorbed dose SF is the quotient of theoral administered dose SF and the G.I. absorption efficiency. However, if the toxicity value derived byEPA is expressed as an absorbed dose, no adjustment is required.
G-4-4

G.I. absorption efficiencies and associated references are summarized in Table G-15. Values for G.I.absorption efficiency and adjustment recommendations were obtained from EPA Region 5 DermalWorkshop staff (Tetra Tech 1998a). When no adjustment is recommended, absorption was assumed tobe complete and 100 percent was used as the G.I. absorption efficiency.
4.4 TOXICITY PROFILES
A brief description of the toxic effects of each COPC is presented in the toxicological profiles inAppendix G-H of this report. The profiles focus on the effects most likely to be observed at theenvironmental exposure levels that form the basis for the toxicity values. Toxic effects other than thecarcinogenic and noncarcinogenic effects quantitatively assessed include reproductive, teratogenic, andmutagenic effects. One of the contaminants known to cause reproductive effects is lead, and theseeffects are discussed in its toxicity profile. The toxicity values, critical effects, and any uncertaintyfactors used in calculation of toxicity values are also summarized in the toxicological profiles and belowin Section 4.5.
4.5 UNCERTAINTIES RELATED TO TOXICITY VALUES
Uncertainties exist in the toxicity assessment as a result of difficulties encountered in identifying thetoxicological effects of COPCs and in the methodologies used to derive toxicity values (SFs and RfDs)associated with the toxicological effects. In some instances, these uncertainties may result inoverestimation of risks and hazards, and in others, risks and hazards may be underestimated. Sources ofuncertainty include (1) extrapolation of animal data to humans, (2) limited availability of chemical-specific data, (3) toxicity value extrapolation, (4) modeling of SFs, and (5) estimation of toxicity valuesfor dermal exposure. Each of these sources of uncertainty are discussed below.
4 J.I Extrapolation of Animal Data to Humans
To develop a toxicity value, EPA makes several assumptions that may overestimate the actual hazard orrisk to human health resulting from exposure to a COPC. One assumption involves use of animal studydata to extrapolate high doses administered to laboratory animals to much lower doses expected to beexperienced by humans. The dose-response relationship may not be the same at these lower doses, andtheir extrapolation may therefore result in overestimation of risk. EPA acknowledges the limitationsassociated with current evaluation procedures and proposes to revise the procedures for determining the
G-4-5

carcinogenic effects of chemicals. EPA proposes to evaluate a broader range of health effects than isaddressed by the current procedures, which are based on observance of tumors in animals exposed tolarge doses of chemicals in laboratory experiments. The additional health effects to be evaluated arethose on human cells and genetic material.
4.5.2 Limited Availability of Chemical-Specific Data
Overestimation of risks and hazards may also result from the use of safety factors to derive RfDs whenresults from animal studies are used to predict adverse health effects in humans. The limited availabilityof toxicity information on some chemicals affects the use of uncertainty and modifying factors indevelopment of the RfDs. In some cases, only limited data are available; in others, a greater volume ofdata is available but is to some degree contradictory.
4.5 J Toxicity Value Extrapolation
In some cases, data from a study of adverse health effects resulting from exposure through a particularroute (ingestion, inhalation, or dermal contact) are used to predict adverse health effects resulting fromexposure through a different route. This extrapolation introduces uncertainty that may result in under- orOverestimation of adverse health effects.
As discussed in Sections 4.1 and 4.2, some RfCs and URFs are based on extrapolation from oral RfDsand SFs, respectively. Because these RfCs and URFs were artificially derived in the first place and donot allow receptor-specific exposures to be accounted for, the HHRA simply reversed the initialderivation to restore the original oral RfDs and SFs and used these toxicity factors in conjunction withintakes calculated using standard exposure equations. Uncertainty results from the fact that the oraltoxicity values are based on a different route of exposure. However, this same uncertainty would haveresulted if the oral-based RfCs and URFs had been used. No additional uncertainty is created, and themethodology used allows receptor-specific exposures to be evaluated.
4.5.4 Modeling of SFsi
To develop an SF, an upper confidence limit on the dose-response relationship is calculated and used asthe final toxicity value. Use of this mathematical model results in a conservative estimate of the potential
G-4-6

carcinogenic response and may overestimate the true health effects associated with exposure to a givenchemical.
4.5.5 Estimation of Toxicity Values for Dermal Exposure
Toxicity values based on oral exposure were adjusted based on chemical-specific estimates of G.I.absorption efficiency. To the extent that the absorption efficiency estimates are incorrect, uncenainty isintroduced. However, the degree of uncertainty associated with estimates of G.I. absorption efficiencyand the resulting dermal toxicity values is assumed to be less than the uncertainty introduced by usingoral exposure-based toxicity factors to characterize risks and hazards associated with dermal intakescalculated as absorbed doses. Specifically, the risks and hazards estimated using the dermal toxicityvalues are higher and therefore more conservative than the risks and hazards that would be estimatedusing oral exposure-based toxicity factors.
G-4-7

5.0 RISK AND HAZARD CHARACTERIZATION
This section characterizes the carcinogenic risks and noncarcinogenic hazards associated with theexposure pathways identified in Section 3.0. Risks and hazards are characterized for individual COPCs.for multiple COPCs within each exposure pathway, and for exposures attributable to multiple exposurepathways, as appropriate. Carcinogenic risk estimates are derived based on LADDs, andnoncarcinogenic hazard estimates are derived based on ADDs.
Section 5.1 discusses the methodology used to characterize carcinogenic risks and noncarcinogenichazards. Section 5.2 characterizes significant risks and hazards. Section 5.3 summarizes the risk andhazard estimates associated with exposure to lead. Section 5.4 discusses the risk estimates associatedwith exposure to VOCs in indoor air from groundwater. Finally, Section 5.5 discusses uncertaintiesassociated with the risk and hazard characterization process.
5.1 RISK AND HAZARD CHARACTERIZATION METHODOLOGY
The methodologies used to quantify carcinogenic risks and noncarcinogenic hazards are discussed below.
5.1.1 Carcinogenic Risks
For carcinogenic COPCs, a risk estimate represents the incremental probability that an individual willdevelop cancer over a lifetime as a result of exposure to the COPCs (EPA 1989). These ELCRs arecalculated as follows:
Upper-Bound ELCR (Risk) = LADDxSF (G-17)
where
LADD = Lifetime average daily intake (mg/kg-day)
SF = Slope factor (mg/kg-dayy1
Risk is expressed as a probability. For example, a risk of 1 x 10"* translates to one additional case ofcancer in an exposed population of 1 million. The SF in almost all cases represents a UCL^ of theprobability of a carcinogenic response based on experimental data used in a multistage model. The
G-5-1

resulting risk estimate therefore represents an upper-bound estimate of the carcinogenic risk. The actualrisk will probably not exceed the estimate and is likely to be less.
According to the revised National Oil and Hazardous Substances Pollution Contingency Plan (NCP)(EPA 1990), EPA has established an "acceptable" range for carcinogenic risk from exposure at aSuperfund site of 1 x 10"6 to 1 x 10"4 (one case of cancer in an exposed population of 10,000). In general,a potential upper-bound risk of 1 x 10'6 is used by EPA as a point of departure for determiningremediation goals.
Within a given exposure pathway, a receptor may be exposed to more than one chemical. The totalupper-bound risk associated with exposure to all chemicals through a single exposure pathway isestimated as follows:
, = Ris^ + Risk2 + . . . + Riskj (G-18)
where
Risk^gp) = Total risk for a given exposure pathway
Risk, = Risk estimate for the ith COPC
At particular exposure points, receptors may be exposed through a number of exposure pathways. Ateach exposure point, the total exposure for a receptor equals the sum of the exposures through the variousexposure pathways to which the receptor is exposed. Under each exposure case, exposure pathwaycombinations were developed for each receptor. The total risk posed to a receptor through a combination
of exposure pathways was calculated as follows:
Total Risk = Risk (EP,) + Risk (EP2) + ... + Risk (EPj) (G-19)
where
Total Risk = Risk resulting from multiple exposure pathways
Risk (EPj) = Risk resulting from the jth exposure pathway
This approach is consistent with the widely held belief that the total carcinogenic risk from exposure tomultiple carcinogenic COPCs can be estimated as the sum of the carcinogenic risks posed by individualCOPCs (EPA 1986).
G-5-2

5.1.2 Noncarcinogenic Hazards
For noncarcinogenic COPCs, the potential for receptors to develop noncancerous health effects is
characterized by comparing an intake for a specific exposure period (the ADD) to an RfD developed fora similar exposure period. When performed for a single chemical, this comparison yields a ratio knownas the HQ, which is calculated as follows:
HQ = ADD/RfD (G-20)
where
ADD = Average daily intake (mg/kg-day)
RfD = Reference dose (mg/kg-day)
Generally, an HQ of less than or equal to 1 is considered to be health-protective. An HQ exceeding 1indicates a potential for adverse noncarcinogenic health effects (EPA 1989). For the purposes of thisHHRA, chronic RfDs are used to characterize noncarcinogenic hazards for all receptor-exposure pathway •combinations.
As with carcinogenic COPCs within a given exposure pathway, a receptor may be exposed to multiplesubstances associated with noncarcinogenic health effects. To estimate the total noncarcinogenic hazardsfor each exposure pathway, this HHRA uses the procedures outlined in "Guidelines for the Health RiskAssessment of Chemical Mixtures" (EPA 1986) and RAGS (EPA 1989). The total noncarcinogenichazard attributable to exposure to all COPCs through a single pathway is calculated as follows:
(G-21)
where
Total HI for a given exposure pathway
Hazard quotient for the ith COPC
This summation methodology assumes that the effects of the various COPCs to which a receptor is
exposed are additive.
G-5-3
As discussed above for carcinogenic COPCs. exposure pathway combinations are developed for
receptors under both RME and CT conditions. The total noncarcinogenic hazards posed to a receptorthrough a combination of exposure pathways is calculated as follows:
Total ffl = ffl(EP1) + HI(EP2) + ... + HI(EPJ) (G-22)
where
HI (EPj) = HI resulting from the jth exposure pathway
In accordance with EPA guidance, all total His equal to or exceeding 1 were further evaluated (EPA1989). The total HI for an exposure pathway can exceed 1 as a result of the presence of either (1) asingle COPC with an HQ exceeding 1, (2) several COPCs whose HQ sum exceeds 1, or (3) severalpathway-specific His whose sum exceeds 1. In the second and third cases, a detailed analysis is requiredto determine whether the potential for noncarcinogenic health effects is accurately estimated by the totalHI because the toxicological effects associated with exposure to multiple COPCs may not be additive;therefore, the HI may overestimate the potential for noncarcinogenic health effects. To address thisissue, the primary contributors to the total HI were grouped according to target organ or effect, and the
»
total segregated HI for each group was derived. This process is referred to as the segregation of the HI.
Typically, target organs and systems affected by each COPCs are identified from (1) effects (termed"critical effects" by EPA) that occur at levels of exposure corresponding to LOAEL or (2) effects at doselevels slightly exceeding LOAELs, as appropriate. References that identify target organs and systems
include EPA (1997c), EPA (1998c), EPA (1998d), Amdur and others (1991), and TCAPCOA (1993).
5.2 RISK AND HAZARD ESTIMATES
Appendix G-G presents receptor-specific exposure and risk results for sitewide (onsite) and area-specificexposures, including EPCs, ADDs, LADDs, RfDs, SFs, His, and risks for each COPC within eachexposure scenario. Appendix G-E presents methodologies used to characterize risks to child and adultreceptors associated with exposure to lead. Section 5.3 summarizes risk and hazard estimates forexposure to lead. Section 5.4 summarizes risk and hazard estimates for exposure to VOCs in indoor airfrom groundwater. Figures G-3 and G-4 summarize sitewide and offsite risk and hazard estimates forRME and CT exposure, respectively, by receptor and exposure pathway and also present total risk and
hazard estimates.
G-5-4

The remainder of this section discusses significant risks and hazards only. For the purposes of this
HHRA, risks equal to or greater than 1 x 1(X* are considered significant because this approach is
consistent with EPA policy that identifies a risk level of 1 x 10⁶ as the low end of EPA's "acceptable"
risk range (EPA 199Q). Risks less than 1 x 10'6 are considered insignificant. Similarly, His equal to or
greater than 1 are also considered significant because such His indicate a potential for adverse health
effects as a result of exposure. His less than 1 are considered insignificant. Insignificant exposurepathways for sitewide or area-specific risks and hazards that are not discussed elsewhere in Section 5.2include:
All complete exposure pathways for the teenaged trespassers (except total ELCR for allpathways)
All complete exposure pathways for the on-site parking attendant
Results are presented below separately for sitewide (on-site) (Section 5.2.1) and area-specific (Section5.2.2) exposure scenarios. For the sitewide and area-specific exposure scenarios, results are presentedfor the current land-use scenario (Sections 5.2.1.1 and 5.2.2.1), the current and future land-use scenarios(Section 5.2.1.2 and 5.2.2.2), and the future land-use scenario (Section 5,2.1.3 and 5.2.2.3). Within eachsection, the land-use scenario(s) is briefly summarized and the receptors evaluated are identified. Foreach receptor, risks for the RME and CT exposure scenarios are discussed first, followed by discussionof hazards. The COPCs contributing significantly to potentially significant risks and hazards are also
identified.
5.2.1 Sitewide (On-Site) Risk and Hazard Estimates
The Rockwell site is currently divided into an eastern section owned by the Allegan Metal FinishingCompany and a western section owned by the City of Allegan (see Figure G-l). The C&O Railroad bedroughly runs along the dividing line between the eastern and western sections of the site. The easternsection includes the current Allegan Metal Finishing Company operation, former heat-treat building, andan open grassy area. The western section includes an abandoned former Rockwell manufacturingbuilding, former WWTP, and three former holding ponds. Sitewide (on-site) receptors include child andteenaged trespassers expected to be present only under current conditions (see Section 5.2.1.1); adult on-site workers and adult construction or utility workers expected to be present under current and futureconditions (see Section 5.2.1.2); and child and adult on-site residents, child and adult on-site visitors, and
adult on-site parking attendants expected to be present only under future conditions (see Section 5.2.1.3).
G-5-5

5.2.1.1 Current Land-Use Scenario
It is assumed that the child and teenaged trespassers are present only under the current land-use scenario.
Tables G-G-1 through G-G-7 and G-G-23 through G-G-29 provide exposure and risk results under RMEand CT conditions, respectively. Significant risks or hazards result from child and teenaged trespasserexposure to contaminants through the following:
• Ingestion of sediment in on-site ponds under RME conditions (child trespasser only)
Child Trespasser
The pathway-specific ELCR for ingestion of sediment in on-site ponds under RME (1.3 x 10"6) exceeds1 x 10*. The RME ingestion ELCR is driven by arsenic (7.3 x 10⁷), Aroclor 1242 (3.5 x 10⁷), andAroclor 1254 (2.3 x 10⁷)
The total RME ELCR for all pathways (2.8 x 10* is the only significant total ELCR or HI for the childtrespasser receptor.
5.2.1.2 Current and Future Land-Use Scenarios
Adult on-site workers and adult construction or utility workers are expected to be present during currentand future conditions. Tables G-G-8 through G-G-14 and G-G-30 through G-G-36 present exposure andrisk results under RME and CT conditions, respectively. Significant risks or hazards result from on-siteworker or construction or utility workers exposure to contaminants through the following:
On-Site Worker• Inhalation of indoor air (LNAPL only)• Direct contact with surface soil (ELCR only)• Ingestion of surface soil (ELCR only)
Construction or Utility Worker• Direct contact with groundwater• Direct contact with LNAPL• Direct contact with surface and subsurface soil (ELCR and HI under RME conditions)
G-5-6

On-Site Worker
The pathway-specific-lotal ELCR for inhalation of indoor air for LNAPL under RME and CT conditions(2.3 x 10'5 and 4.7 x 10*, respectively). The RME and CT indoor air ELCRs are driven bytrichloroethene (1.1 x 10'5 and 2.2 x 10*. respectively).
The pathway-specific total ELCR for direct contact with surface soil under RME conditions (8.9 x 10⁶)exceeds 1 x 10*. The RME direct contact ELCR is driven by arsenic (7.4 x 10*).
The pathway-specific total ELCR for ingestion of surface soil under RME conditions (1.2 x 10"6) exceed1 x 10*. The RME direct contact ELCR is driven by arsenic (1.0 x 10*).
The total on-site worker RME and CT ELCRs for all pathways (3.3 x 10'5 and 5.4 x 10"6, respectively)exceeds 1 x 10*. The total RME HI for all pathways (1.5) exceeds 1.
Construction or Utility Worker
The pathway-specific total ELCRs for direct contact with groundwater under RME and CT conditions(1.0 x 10s and 2.6 x 10*, respectively) exceed 1 x 10*. The RME direct contact ELCR is driven byAroclor 1254 (6.9 x 10*) and arsenic (2.9 x 10*). The CT direct contact ELCR is driven byAroclor 1254 (1.5 x 10*). The pathway-specific total His for direct contact with groundwater underRME and CT conditions (18 and 3.6, respectively) exceed 1. The RME and CT direct contact His aredriven by Aroclor 1254 (15 and 3.2, respectively).
The pathway-specific total ELCRs for direct contact with LNAPL under RME and CT conditions(1.9 and 5.8 x 10"', respectively) exceed 1 x 10*. The RME and CT direct contact ELCRs are driven byAroclor 1254 (1.9 and 5.7 x 10"1, respectively). The pathway-specific total His for direct contact withgroundwater under RME and CT conditions (4.1 x 10** and 1.2 x 10**, respectively) exceed 1. The RMEand CT direct contact His are driven by Aroclor 1254 (4.1 x 10** and 1.2 x 10**, respectively). However,the immediate health and safety danger related to potential explosivity of LNAPL significantly decreases
the likelihood of exposure to LNAPL.
G-5-7

The pathway-specific total ELCR for direct contact with surface and subsurface soil under RME
conditions (1.1 x lO"6) exceeds 1 x 10'6. The RME direct contact ELCR is driven by arsenic (1.1 x 10⁶).The pathway-specific total HI for direct contact with surface and subsurface soil under RME conditions
(2.5) exceeds 1. Thedirect contact HI is driven by iron (0.48), Aroclor 1254 (0.49), and arsenic (0.22).
The total RME and CT ELCRs and His significantly exceed 1 x 10"6 or 1, respectively; based onconstruction or utility worker direct contact with LNAPL.
5.2.13 Future Land-Use Scenario
Child and adult on-site residents, child and adult on-site visitors, and adult on-site parking attendants areexpected to be present only during future conditions. Tables G-G-15 through G-G-22 and G-G-37through G-G-44 present exposure and risk results under RME and CT conditions, respectively.Significant risks or hazards result from on-site resident, on-site visitor, and on-site parking attendant
exposure to contaminants through the following:
Child and Adult On-Site Residents• Direct contact with groundwater• Ingestion of groundwater• Direct contact with soil (ELCR under RME conditions only)• Ingestion of soil (ELCR under RME conditions only)• Ingestion of homegrown produce• Inhalation of indoor air
Child and Adult Qn-Site Visitors• Ingestion of groundwater• Ingestion of soil
Child On-Site Residents
The pathway-specific total ELCRs for direct contact with groundwater under RME and CT conditions(1.5 x 10° and 3.6 x ias, respectively) exceed 1 x 10*. The RME and CT direct contact ELCRs aredriven by arsenic (3.8 x lO^and 1.1 x 10'5, respectively) and Aroclor 1254 (1 x 10"Jand 2.3 x 10³,respectively). The pathway-specific total His for direct contact with groundwater under RME and CT
G-5-8

conditions (130 and 29, respectively) exceed 1. The RME direct contact HI is driven by Aroclor 1254
(76), manganese (12), and vanadium (15). The CT direct contact HI is driven by Aroclor 1254 (20).
The pathway-specificjotal ELCRs for ingestion of groundwater under RME and CT conditions
(6.2 x lO'1 and 3.9 x 10'3, respectively) exceed 1 x 10"6. The RME and CT ingestion ELCRs are driven byarsenic (6.2 x 10'1 and 3.9 x 10"3, respectively). The pathway-specific total His for ingestion ofgroundwater under RME and CT conditions (4.9 x 10* and 4.9 x 10², respectively) exceed 1. The RMEand CT ingestion His are driven by arsenic (1.6 x 10⁴ and 1 x 10²-, respectively) and iron (2.2 x 10⁴ and1.4 x 102', respectively).
The pathway-specific total ELCR for direct contact with soil under RME conditions (4.6 x 10 ) exceeds1 x 10-*. The direct contact ELCR is driven by arsenic (2.1 x 10'6) and Aroclor 1254 (2 x IQ-6).
The pathway-specific total ELCR for ingestion of soil under RME conditions (4.9 x 10"*) exceeds1 x lO"6. The ingestion ELCR is driven by arsenic (3.8 x lO'6).
The pathway-specific total RME and CT ELCRs for ingestion of homegrown produce (8.9 x 10"5 and3.0 x 10'5, respectively) exceed 1 x 10*. The RME and CT ingestion ELCRs are driven by Aroclor 1254(7.0 x 10'5 and 2.3 x 10"', respectively). The pathway -specific total RME and CT His for ingestion ofproduce (22) exceed 1. The RME and CT ingestion His are driven by Aroclor 1254 (20).
The pathway-specific total RME and CT ELCRs for inhalation of indoor air (8.8 x 10"5 and 1.7 x 10⁵,respectively) exceed 1 x 10"6. The RME and CT inhalation ELCRs are driven by tetrachloroethene(3.8 x 10'5 and 7.4 x lO*, respectively) and methylene chloride (3.5 x 10'5 and 6.9 x 10"6, respectively).The pathway -specific total RME and CT His for inhalation of indoor air (9.4 and 5.5, respectively)exceed 1. The RME and CT inhalation His are driven by methylene chloride (3 and 1.8, respectively),benzene (3 and 1.8, respectively), and cis-l,2-dichloroethene (2 and 1.2, respectively).
Adult On-Site Residents
The pathway-specific total ELCRs for direct contact with groundwater under RME and CT conditions(1.6 x 10³ and 1.1 x 10A respectively) exceed 1 x 10"6. The RME and CT direct contact ELCRs aredriven by arsenic (6.2 x lO-'and 3.2 x lO"6, respectively) and Aroclor 1254 (8.6 x lO^and 6.7 x 10s,respectively). The pathway-specific total His for direct contact with groundwater under RME and CT
G-5-9

conditions (110 and 25, respectively) exceed 1. The RME direct contact HI is driven by Aroclor 1254(62), manganese (10), and vanadium (13). The CT direct contact HI is driven by Aroclor 1254 (17).
The pathway-specific- total ELCRs for ingestion of groundwater under RME and CT conditions (1 and1.8 x 10'1, respectively) exceed 1 x 10*. The RME and CT ingestion ELCRs are driven by arsenic (1 and1.8 x 10'1, respectively). The pathway-specific total His for ingestion of groundwater under RME andCT conditions (2 x 10*and 1.2 x 10², respectively) exceed 1. The RME and CT ingestion His are driven
by arsenic (6.6 x 10³ and 4.1 x 10³-, respectively) and iron (9.2 x 10³ and 5.7 x 10³, respectively).
The pathway-specific total ELCR for direct contact with soil under RME conditions (1.4 x 10⁵) exceeds1 x 10"*. The direct contact ELCR is driven by arsenic (6.2 x 10*)and Aroclor 1254 (5.9 x 10*).
The pathway-specific total ELCR for ingestion of soil under RME conditions (1.2 x 10"5) exceeds1 x 10*. The ingestion ELCR is driven by arsenic (9.6 x 10*).
The pathway-specific total RME and CT ELCRs for ingestion of homegrown produce (2.2 x 10"* and6.6 x 10'5, respectively) exceed 1 x 10*. The RME and CT ingestion ELCRs are driven by Aroclor 1254(1.7 x 10"* and 5.2 x 10'5, respectively). The pathway -specific total RME and CT His for ingestion ofproduce (11) exceed 1. The RME and CT ingestion His are driven by Aroclor 1254 (10).
The pathway-specific total RME and CT ELCRs for inhalation of indoor air (1.3 x 10"* and 2.3 x 10s,respectively) exceed 1 x 10*. The RME and CT inhalation ELCRs are driven by tetrachloroethene(5.7 x 10⁵ and 9.9 x 10*, respectively) and methylene chloride (5.3 x 10⁵ and 9.2 x 10*, respectively).The pathway-specific total RME and CT His for inhalation of indoor air (3.6 and 2.1, respectively)exceed 1. The RME and CT inhalation His are driven by methylene chloride (1.1 and 0.67, respectively)and benzene (1.1 and 0.68, respectively).
Child and Adult Oil-Site Residents
RME ELCRs are based on an exposure duration of 30 years, which was divided as 6 child years and 24
adult years in one residence. Therefore, it is appropriate to sum the child and adult RME ELCRs to
obtain total RME ELCRs for on-site residents as listed below.
G-5-10

Total RME ELCRs
Direct contact with groundwater = 3.1 x 10°Ingestion of groundwater = 8.0 x 10'Direct contact with soil = 1.9 x 10'5Ingeslion of soil = 1.7 x 10"5
Ingestion of homegrown produce = 3.1 x 10"*Inhalation of indoor air = 2.2 x 10"*
Child On-Site Visitor
The pathway-specific total ELCRs for ingestion of groundwater under RME and CT conditions
(2.6 x 10² and 2.1 x 10°, respectively) exceed 1 x 10*. The RME and CT ingestion ELCRs are driven byarsenic (2.6 x 10² and 2.1 x 10'3, respectively). The pathway-specific total His for ingestion ofgroundwater under RME and CT conditions (2 x 10³ and 5.1 x 10², respectively) exceed 1. The RME andCT ingestion His are driven by arsenic (6.6 x 10² and 1.7 x 10²-, respectively) and iron (9.2 x 10² and2.3 x 102-, respectively).
The pathway-specific total ELCR for ingestion of soil under RME conditions (3.5 x 10*) exceeds1 x 10*. The ingestion ELCR is driven by arsenic (2.9 x 10*).
Adult On-Site Visitor
The pathway-specific total ELCRs for ingestion of groundwater under RME and CT conditions(4.4 x 10² and 3.2 x 10³, respectively) exceed 1 x 10*. The RME and CT ingestion ELCRs are driven by
arsenic (4.4 x 10² and 3.2 x 10'3, respectively). The pathway-specific total His for ingestion ofgroundwater under RME and CT conditions (8.6 x 10²and 2.2 x 10², respectively) exceed 1. The RMEand CT ingestion His are driven by arsenic (2.8 x 10² and 7.1 x 10', respectively) and iron (3.9 x 10² and9.9 x 101, respectively)..
The pathway-specific total ELCR for ingestion of soil under RME conditions (1.5 x 10"*) exceeds
1 x 10*. The ingestion ELCR is driven by arsenic (1.2 x 10*).
5.2.2 Area-Specific Risk and Hazard Estimates
Hazards and risks were calculated for area-specific exposures in the following areas:
G-5-11

• Former SOS pond area
• Former Rockwell WWTP area• Former on-site railroad right-of-way
• Grassy area• Area under and north of the former west manufacturing building• Saturated zone beneath the former City of Allegan landfill• Former off-property railroad right-of-way• Off-property residential area (background soil)• Kalamazoo River (downstream shoreline only)
Area-specific hazards and risks were not evaluated for groundwater because groundwater moves readilybetween areas. Hazards and risks for groundwater were evaluated for sitewide scenarios (see Section5.2.1). It should be noted that all on-site area-specific receptors may also be exposed to contaminants ingroundwater and LNAPL in each area. The HHRA areas are identified in Figure G-l. Receptors for theon-site areas are identical to the sitewide (on-site) receptors identified in Section 5.2.1. Off-propertyreceptors include child and adult off-property residents; off-property construction or utility workers; andchild, teenaged, and adult off-property recreationalists expected to be present during current and futureconditions (see Section 5.2.2.2). Section 5.2.2.1 summarizes significant area-specific risks and hazardsfor receptors expected to be present under the current land-use scenario only. Section 5.2.2.2summarizes area-specific significant risks and hazards for receptors expected to be present during thecurrent and future land-use scenarios. Section 5.2.2.3 summarizes area-specific significant risks andhazards for receptors expected to be present during the future land-use scenario only.
5.2.2.1 Current Land-Use Scenario
As stated in Section 5.2.1.1, it is assumed that the on-site child and teenaged trespassers are expected tobe present only under the current land-use scenario. Area-specific significant risks or hazards result fromchild and teenaged trespasser exposure to on-site contaminants through the following:
Former WWTP Area
• Ingestion of sediment in on-site ponds
G-5-12

Former On-Site Railroad Right-of-Way
• Ingestion of surface soil (child trespasser only)
The significant risks and hazards listed above are summarized below by receptor to facilitateidentification of appropriate remediation goals by risk managers because remediation goals are typicallybased on receptor-specific exposure pathways. Area-specific significant risks and hazards are identifiedfor each receptor and are summarized in tabular format. The risk and hazard summary tables belowidentify risk and hazard result tables presented in Appendix G-G, significant RME and CT risks andhazards, and risk and hazard drivers for each exposure pathway.
Child Trespasser
Significant area-specific risks for the on-site child trespasser are summarized below.
Child TrespasserTable Exposure Pathway Risk Risk Driver
Former WWTP AreaG-G-73,G-G-87
Ingestion of sediment in on-siteponds
RME: 1.3 x 1O*CT: Insignificant
Aroclor 1242 (3.5 x 10 7)
Former On-Site Railroad Right-of-WayG-G-99G-G- 110
Ingestion of surface soil RME: 1. 3x10-*CT: insignificant
Arsenic is the only COPC with an SF.
5.2.2.2 Current and Future Land-Use Scenarios
Adult on-site workers; adult on- and off-property construction or utility workers; child and adult off-property residents; and child, teenaged, and adult off-property recreationalists are expected to be presentunder current and future land-use conditions. Area-specific significant risks or hazards result fromreceptor exposure to contaminants through the following:
Former SOS Pond Area
• On-site worker inhalation of indoor air - LNAPL• On-site worker direct contact with surface soil
G-5-13

• On-site construction or utility worker direct contact with surface soil• On-site construction or utility worker ingestion of surface soil
Former WWTP Area
• On-stte worker inhalation of indoor air - LNAPL• On-site worker direct contact with soil• On-site worker ingestion of soil• On-site construction or utility worker direct contact with soil• On-site construction or utility worker ingestion of soil
Former Qn-Site Railroad Right-of-Wav
• On-site worker inhalation of indoor air - LNAPL• On-site worker direct contact with soil• On-site worker ingestion of soil• On-site construction or utility worker direct contact with soil
Grassy Area
• On-site worker inhalation of indoor air
Area Under and North of the Former West Manufacturing Building
• On-site worker inhalation of indoor air - LNAPL• On-site worker direct contact with soil
Former Off-Propertv Railroad Right-of-Wav
• Off-property resident inhalation of indoor air - LNAPL• Off-property resident direct contact with groundwater while showering• Off-property resident ingestion of groundwater• Off-property resident direct contact with soil• Off-property resident ingestion of soil• Off-property resident ingestion of homegrown produce• Off-property construction or utility worker direct contact with groundwater• Off-property construction or utility worker direct contact with LNAPL• Off-property construction or utility worker direct contact with soil• Off-property construction or utility worker ingestion of soil
Off-Property Residential Area (Background Soil)
• Off-property resident ingestion of soil
Kalamazoo River Downstream Shoreline Only
• Off-property recreationalist direct contact with sediment• Off-property recreationalist ingestion of sediment
G-5-14

The significant risks and hazards listed above are summarized below by receptor to facilitateidentification of appropriate remediation goals by risk managers because remediation goals are typically
based on receptor-specific exposure pathways. Area-specific significant risks and hazards are identified
for each receptor and^re summarized in tabular format. The risk and hazard summary tables belowidentify risk and hazard result tables presented in Appendix G-G, significant RME and CT risks andhazards, and risk and hazard drivers for each exposure pathway.
On-Site Worker
Significant area-specific risks for the on-site worker are summarized below.
On-Site WorkerTable Exposure Pathway Risk Risk Driver
Former SOS Pond AreaG-G-50,G-G-61
Direct contact with surface soil
Former WWTP AreaG-G-76,G-G-91
G-G-77,G-G-92
Direct contact with soil
Ingestion of soil
RME: 5.3 x 10*CT: Insignificant
Arsenic is the only COPC with an SF.
RME: 1.1 x 10 5
CT: 1.3 x 10"*
RME: 3.9 x 10*CT: insignificant
RME: Arsenic (5.7 x lO"*) and Aroclor1254 (2.8 x 10'6)CT: Aroclor 1254 (9.8 x 10'7) andArsenic (2.6 x 10'7)Arsenic (7.7 x 10'7) and Aroclor 1254(3.0 x 10⁻⁶)
Former On-Site Railroad Right-of-WayG-G-102,G-G- 1 13G-G- 103,G-G- 114
Direct contact with soil
Ingestion of soil
RME: 2.0 x 10 5
CT: InsignificantRME: 2.7 x 10*CT: Insignificant
Arsenic is the only COPC with an SF.
Arsenic is the only COPC with an SF.
Area Under and North of the Former West Manufacturing BuildingG-G- 146,G-G-157
Direct contact with soil RME: 6.5 x 10 6
CT: InsignificantArsenic is the only COPC with an SF.
G-5-15

Significant area-specific hazards for the on-site worker are summarized below.
On-Site WorkerTable Exposure Pathway HI Hazard Driver
Former On-Site Railroad Right-of-wayG-G-102,G-G-113
Direct contact with soil RME: 3.2CT: insignificant
Barium (1.1)
Construction or Utility Worker
Significant area-specific risks for the construction or utility worker are summarized below.
Construction or Utility WorkerTable Exposure Pathway Risk Risk Driver
Former SOS Pond AreaG-G-50G-G-61G-G-51G-G-62
Direct contact with soil
Ingestion of soil
RME: 5.9 x 10*CT: 2.1x10-*RME: 1.1 x 10*CT: insignificant
Arsenic is the only COPC with an SF.
Arsenic is the only COPC with an SF.
Former WWTP AreaG-G-76G-G-91
G-G-77G-G-92
Direct contact with soil
Ingestion of soil
RME: 5.4 x 10*CT: 1.9 x IV6
RME: 1.1 x 10-*CT: insignificant
RME: Aroclor 1254 (3.5 x 10*) andArsenic (1.8 x 10*)CT: Aroclor 1254 (1.2 xlO*)Aroclor 1254 (6.9 x la7) and Arsenic(3.5 x 10-')
Former On-Site Railroad Right-of-Way
G-G-102G-G-113
Direct contact with soil RME: 2.6 x 10*CT: Insignificant
Arsenic is the only COPC with an SF.
Former Off-Property Railroad Right-of-wayG-G-177G-G-187
G-G-179G-G-189
G-G-182G-G-192
G-G-183G-G-193
Direct contact withgroundwaterDirect contact with LNAPL
Direct contact with soil
Ingestion of soil
RME: 5.3 x 10"5
CT: Insignificant
RME: 35CT: 11
RME: 2.0 x 10*CT: InsignificantRME: 3.4 x 10"*CT: 1.7 x 10'*
RME: Aroclor 1254 (1.1 x 10°)
RME: Benzo(a)pyrene (21) anddibenzo(a,h)anthracene (14)CT: Benzo(a)pyrene (6.3) anddibenzo(a,h)anthracene (4.3)Aroclor 1254 (1.7x10'')
RME: Aroclor 1254 (2.5 x 10*)CT: Aroclor 1254 (1.2 xlO*)
G-5-16

Significant area-specific hazards for the construction or utility worker are summarized below.
Construction or Utility WorkerTable Exposure Pathway HI Hazard Driver
Former SOS Pond AreaG-G-50G-G-61
Direct contact with surfacesoil
RME: 14CT:5
RME: Nickel (4.7), Manganese (3.6),Cadmium (3.4), and Arsenic (1.2)CT: Nickel (1.7), Manganese (1.3), andCadmium (1.2)
Former WWTP AreaG-G-76G-G-91
Direct contact with soil RME: 1 1CT: 3.9
RME: Aroclor 1254(7.6)CT: Aroclor 1254 (2.7)
Former On-Site Railroad Right-of-WayG-G-102G-G-113
Direct contact with soil RME: 16CT: 5.9
RME: Barium (5.5). Iron (3.2), Nickel (2.8)CT: Barium (2.0), Iron (1.2)
Former Off-Property Railroad Right-of-WayG-G-177G-G-187
G-G-179G-G-189
G-G-182G-G-192
G-G-183G-G-193
Direct contact withgroundwaterDirect contact with LNAPL
Direct contact with soil
Ingestion of soil
RME: 110CT:34RME: 1 x 1<TS
CT: 3 x KT4
RME: 3.8CT: 1.4RME: 5.7CT: 2.8
RME: Aroclor 1254 (110)CT: Aroclor 1254 (34)RME: Naphthalene (1.9 x 10*4),Fluoranthene (1.7 x 10**), fluorene(1.7 x 10*4)CT: Naphthalene (5.6 x 10*3), Fluoranthene(5.2 x 10*3), fluorene (5.2 x 10*3)RME: Aroclor 1254 (3.8)CT: Aroclor 1254 (1.4)
RME: Aroclor 1254 (5.4)CT: Aroclor 1254 (2.7)
Adult Off-Property Resident
Significant area-specific risks for the adult off-property resident are summarized below.
Adult Off-Property ResidentTable Exposure Pathway Risk Risk Driver
Former Off-Property Railroad Right-of-WayG-G-175G-G-185
G-G-177G-G-187G-G-178G-G-188
Inhalation of indoor air•
Direct contact withgroundwater while showeringIngestion of groundwater
RME: 1.0x10^CT: 1.7 x 10'5
RME: 1.8x10'CT:RME: 2.0 x 10^CT: 2.2 x 10 5
RME: Tetrachloroethene (6.8 x 10'5)CT: Tetrachloroethene (1.2 x 10 5)RME: Aroclor 1254 (1.7 x Itf1)CT:RME: Aroclor 1254 (1.0 x 10"*)CT: Aroclor 1254 (1.1 x 10'5)
G-5-17

TableG-G-182G-G-192G-G-183G-G-193G-G-184G-G-194
Adult Off-Property ResidentExposure Pathway
Direct contact with soil
Ingestion of soil
Ingestion of homegrownproduce
RiskRME: 1.9x 10s
CT: InsignificantRME: 2.2 x 10 5
CT: 1.6x 10 6
RME: 2.2 x 10 4
CT: 6.6 x 10 5
Risk DriverRME: Aroclor 1254 (1.8 x 10s)
RME: Aroclor 1254 (1.9 x 10s)CT: Aroclor 1254 (1.4 x 10⁶)RME: Aroclor 1254 (1.7 x 10⁴)CT: Aroclor 1254 (5.2 x 10"s)
Off-Property Residential Area (Background Soil)G-G-198G-G-202
Ingestion of soil RME: 1.1 x 10 6
CT: InsignificantArsenic is the only COPC with a SF.
Significant area-specific hazards for the adult off-property resident are summarized below.
Adult Off-Property ResidentTable Exposure Pathway HI Hazard Driver
Former Off-Property Railroad Right-of-WayG-G-175G-G-185G-G-177G-G-187
G-G-178G-G-188
G-G-182G-G-192
G-G-183G-G-193G-G-184G-G-194
Inhalation of indoor air
Direct contact withgroundwater while showeringIngestion of groundwater
Direct contact with soil
Ingestion of soil
Ingestion of homegrownproduce
RME: 2.4CT: 1.4RME: 1.3 x 10^CT:3RME: 36
'CT:13
RME: 1.4CT: InsignificantRME: 1.4CT: InsignificantRME: 11CTtl l
RME: Benzene (1.5)CT: Benzene (0.91)RME: Aroclor 1254 (1.3 x 10*4)CT: Aroclor (3)RME: Iron (18), Selenium (9.2), andAroclor 1254 (7.6)CT: Iron (6.6), Selenium (3.4) andAroclor 1254 (2.8)RME: Aroclor 1254 (1.3)
RME: Aroclor 1254 (1.4)
RME: Aroclor 1254 (10)CT: Aroclor 1254 (10)
Child Off-Property Resident
Significant area-specific risks for the child off-property resident are summarized below.
Child Off-Property ResidentTable Exposure Pathway Risk Risk Driver
Former Off-Property Railroad Right-of-wayG-G-175G-G-185
Inhalation of indoor air RME: 6.7 x Itf 5
CT: 1.3 x 10sRME: Tetrachloroethene (4.5 x 10s)CT: Tetrachloroethene (8.8 x 10*)
G-5-18

Child Off-Property ResidentTable
G-G-177G-G-187
G-G-178G-G-188
G-G-182G-G-192
G-G-183G-G-193G-G-184G-G-194
Exposure PathwayDirect contact withgroundwater while showeringIngestion of groundwater
Direct contact with soil
Ingestion of soil
Ingestion of homegrownproduce
RiskRME: l . l x 10 3
CT: 2.2 x 10 5
RME: 1.2x 10 4
CT: 1.1 x 10s
RME: 4.0 x 10 5
CT: 1.2x lO'6
RMErl .SxlO- 4
CT: 8.7 x 10⁶
RME: 8.9 x Itf5
CT: 3.0 x 10 5
Risk DriverRME: Aroclor 1254 (1.1 x 10°)CT: Aroclor 1254(1.1 x 10')
RME: Aroclor 1254 (6.4 x 10s) andDieldrin (5.9 x 10'5)CT: Aroclor 1254 (5.5 x 10") andDieldrin (5.1 x 10⁶)RME: Aroclor 1254 (3.8 x 10s)CT: Aroclor 1254 ( l . l x 10'6)RME: Aroclor 1254 (1.5 x 10")CT: Aroclor 1254 (7.3 x 10'')
RME: Aroclor 1254 (7.0 x 10'5)CT: Aroclor 1254 (2.3 x 10⁵)
Off-Property Residential Area (Background Soil)G-G-198G-G-203
Ingestion of soil RME: 8.5 x 10s
CT: InsignificantArsenic is the only COPC with an SF.
Significant area-specific hazards for the child off-property resident are summarized below.
Child Off-Property ResidentsTable Exposure Pathway HI Hazard Driver
Former Off-Property Railroad Right-of-WayG-G-175G-G-185
G-G-177G-G-187
G-G-178G-G-188
G-G-182G-G-192
G-G-183G-G-193G-G-184G-G-194
Inhalation of indoor air
Direct contact with groundwaterwhile showeringIngestion of groundwater
Direct contact with soil
Ingestion of soil
Ingestion of homegrownproduce
RME: 6.3CT: 3.7
RME: 310CT: 16
RME: 88CT:23
RME: 11CT: InsignificantRME: 46CT:6.7RME: 22CT:22
RME: Benzene (4.1) and trichloroethene(2.0)CT: Benzene (2.4)RME: Aroclor 1254 (310)CT: Aroclor 1254 (16)RME: Iron (44), Selenium (22), andAroclor 1254 (19)CT: Iron (1 1), Selenium (5.8) andAroclor 1254 (4.8)RME: Aroclor 1254 (11)
RME: Aroclor 1254 (44)CT: Aroclor 1254 (6.4)RME: Aroclor 1254 (20)CT: Aroclor 1254 (20)
G-5-19
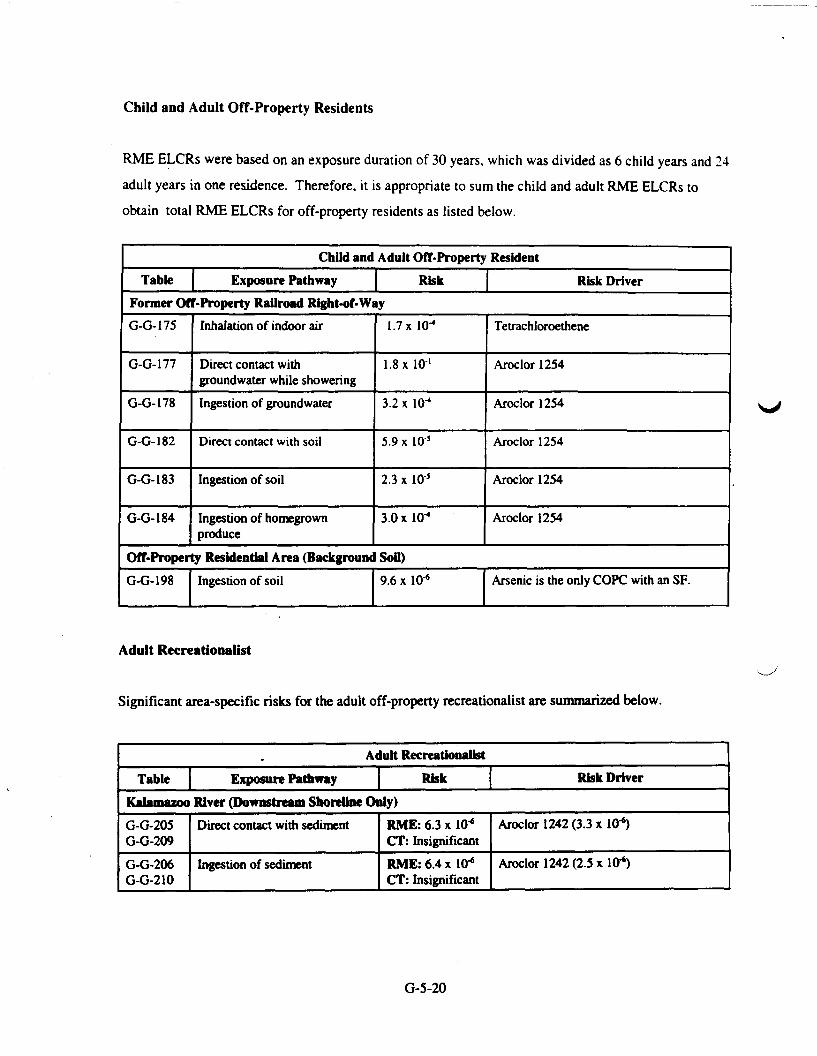
Child and Adult Off-Property Residents
RME ELCRs were based on an exposure duration of 30 years, which was divided as 6 child years and 24adult years in one residence. Therefore, it is appropriate to sum the child and adult RME ELCRs toobtain total RME ELCRs for off-property residents as listed below.
Child and Adult Off-Property ResidentTable Exposure Pathway | Risk Risk Driver
Former Off-Property Railroad Right-of-WayG-G-175
G-G-177
G-G-178
G-G-182
G-G-183
G-G-184
Inhalation of indoor air
Direct contact withgroundwater while showeringIngestion of groundwater
Direct contact with soil
Ingestion of soil
Ingestion of homegrownproduce
1.7 x ID"4
1.8 xlO' 1
3.2 x 10⁴
5.9 x 10 5
2.3 x 10s
3.0x10^
Tetrachloroethene
Aroclor 1254
Aroclor 1254
Aroclor 1254
Aroclor 1254
Aroclor 1254
Off-Property Residential Area (Background Soil)G-G-198 Ingestion of soil 9.6 x 10* Arsenic is the only COPC with an SF.
Adult Recreationalist
Significant area-specific risks for the adult off-property recreationalist are summarized below.
Adult RecreationalistTable Exposure Pathway Risk Risk Driver
Kalamazoo River (Downstream Shoreline Only)G-G-205G-G-209G-G-206G-G-210
Direct contact with sediment
Ingestion of sediment
RME: 6.3 x 10*CT: InsignificantRME: 6.4 x 10"*CT: Insignificant
Aroclor 1242 (3.3 x 10"*)
Aroclor 1242 (2.5 x 10*)
G-5-20

Teenaged Recreationalist
Significant area-specific risks for the teenaged recreationalist are summarized below.
Teenaged RecreationalistTable Exposure Pathway Risk Risk Driver
Kalamazoo River (Downstream Shoreline Only)G-G-205G-G-209
Direct contact with sediment RME: 1.2x10-*CT: Insignificant
Aroclor 1242(6.1 x 10 7), benzo(a)pyrene(1.4 x 10⁻⁷), and arsenic (1.1 x 10'7)
Child Recreationalist
Significant area-specific risks for the child recreationalist are summarized below.
Child RecreationalistTable Exposure Pathway Risk Risk Driver
Kalamazoo River (Downstream Shoreline Only)G-G-205G-G-209
G-G-206G-G-210
Direct contact with sediment
Ingestion of sediment
RME: 2.5 x 10'*CT: Insignificant
RME: 5.8 x 10'6CT: Insignificant
Aroclor 1242(1. 3 x 10⁶)
Aroclor 1242 (2.3 x 10'6)
5.2.2.3 Future Land-Use Scenario
Adult on-site and child on-site residents, adult and child on-site visitors, and adult on-site parking
attendants are expected to be present only during future conditions. Area-specific significant risks orhazards result from on-site resident, on-site visitor, and on-site parking attendant exposure to
contaminants through the following:
Former SOS Pond Area
• On-site resident inhalation of indoor air - LNAPL• On-site resident direct contact with soil• On-site resident ingestion of soil• On-site visitor ingestion of soil (child visitor only)
G-5-21

Former WWTP Area
• On-site resident direct contact with soil
• On-site resident ingestion of soil• On-site visitor ingestion of soil
Former On-Site Railroad Right-of-Way
• On-site resident direct contact with soil• On-site resident ingestion of soil• On-site visitor ingestion of soil
Area Under and North of the Former West Manufacturing Building
• On-site resident direct contact with soil• On-site resident ingestion of soil• On-site visitor ingestion of soil
The significant risks and hazards listed above are summarized below by receptor to facilitateidentification of appropriate remediation goals by risk managers because remediation goals are typicallybased on receptor-specific exposure pathways. Area-specific significant risks and hazards are identifiedfor each receptor and are summarized in tabular format. The risk and hazard summary tables belowidentify risk and hazard result tables presented in Appendix G-G, significant RME and CT risks andhazards, and risk and hazard drivers for each exposure pathway.
Adult On-Site Resident
Significant area-specific risks for the adult on-site resident are summarized below.
Adult On-Site ResidentTable Exposure Pathway
Former SOS Pond AreaG-G-54,G-G-65
Direct contact with soil
Risk
RME: 3.4 x 10 5
CT: insignificant
Risk Driver
Arsenic is the only COPC with an SF.
G-5-22

Adult On-Site ResidentTable
G-G-55,G-G-66
Exposure PathwayIngestion of soil
RiskRME: 5.0 x 10 5
CT: insignificant
Risk DriverArsenic is the only COPC with an SF.
Former WWTP AreaG-G-80,G-G-95
G-G-81,G-G-96
Direct contact with soil
Ingestion of soil
RME: 1.1 x 10 4
CT: insignificantRME: 4.7 x 10 5
CT: insignificant
Aroclor 1254 (9.2 x 10 5) and arsenic( l .Ox 10's)
Aroclor 1254 (3.1 x 10 5) and arsenic(1.5x 10s)
Former On-Site Railroad Right-of-WayG-G-106,G-G-117
G-G-107,G-G-118
Direct contact with soil
Ingestion of soil
RME: 1.5 x 10!
CT: insignificantRME: 2.2 x 10 $
CT: insignificant
Arsenic is the only COPC with an SF.
Arsenic is the only COPC with an SF.
Area Under and North of the Former West Manufacturing BuildingG-G-150,G-G-161G-G-151,G-G-162
Direct contact with soil
Ingestion of soil
RME:5.1x 10 6
CT: insignificantRME: 7.5 x 10*CT: insignificant
Arsenic is the only COPC with an SF.
Arsenic is the only COPC with an SF.
Significant area-specific hazards for the adult on-site resident are summarized below.
Adult On-Site ResidentTabk | Exposure Pathway HI Hazard Driver
Former WWTP AreaG-G-80,G-G-95
Direct contact with soil RME: 5.7CT: insignificant
Aroclor 1254 (5.4)
Child On-Site Resident
Significant area-specific risks for the child on-site resident are summarized below.
Child On-Site Resident
Tabk Exposure Pathway Risk Risk Driver
Former SOS Pond AreaG-G-54,G-G-65
Direct contact with soil RME: 1.1 x 10"5
CT: insignificantArsenic is the only COPC with an SF.
G-5-23

TableG-G-55,G-G-66
Child On-Site ResidentExposure Pathway
Ingestion of soilRisk
RME: 2.0 x 10⁵
CT: insignificant
Risk DriverArsenic is the only COPC with an SF.
Former WWTP AreaG-G-80,G-G-95
G-G-81,G-G-96
Direct contact with soil
Ingestion of soil
RME: 3.5 x 10'5CT: 1.2x10-'
RME: 1.9x10*CT: insignificant
RME: Aroclor 1254 (3.1 x 10s) andarsenic (3.3 x 10*)CT: Aroclor 1254 (1.0 x 10')Aroclor 1254 (1.2 x 10'5) and arsenic(6.1 x 10 6)
Former On-Site Railroad Right-of-wayG-G-106,G-G-117
G-G-107,G-G-118
Direct contact with soil
Ingestion of soil
RME: 4.9 x 10*CT: insignificantRME: 8.7 x 10*CT: insignificant
Arsenic is the only COPC with an SF.
Arsenic is the only COPC with an SF.
Area Under and North of the Former West Manufacturing BuildingG-G-150,G-G-161
G-G-151,G-G-162
Direct contact with soil
Ingestion of soil
RME: 1.7 x 10*CT: insignificantRME: 3.0 x 10"*CT: insignificant
Arsenic is the only COPC with an SF.
Arsenic is the only COPC with an SF.
Significant area-specific hazards for the child on-site resident are summarized below.
Child On-Site ResidentTable Exposure Pathway HI Hazard Driver
Former SOS Pond AreaG-G-54,G-G-65
G-G-55,G-G-66
Direct contact with soil
Ingestion of soil
RME: 1.4CT: insignificantRME: 1.1CT: insignificant
Arsenic (0.30), nickel (0.40), andmanganese (0.31)Arsenic (0.52) and iron (0.29)
Former WWTP AreaG-G-80,G-G-95
G-G-81,G-G-96
Direct contact with soil
Ingestion of soil
RME: 9.6CT: insignificantRME: 4.3CT: insignificant
Aroclor 1254 (9.0)
Aroclor 1254 (3.6)
Former On-Site Railroad Right-of- WayG-G-106,G-G-117
G-G-107,G-G-118
Direct contact with soil
Ingestion of soil
RME: 1.5CT: insignificant
RME: 2.5CT: insignificant
Barium (0.47). iron (0.28), nickel (0.24),and manganese (0.15)
Iron (1.5)
G-5-24

Child and Adult On-Site Residents
RME ELCRs were based on an exposure duration of 30 years, which was divided as 6 child years and24 adult years in one residence. Therefore, it is appropriate to sum the child and adult RME ELCRs toobtain total RME ELCRs for on-site residents as listed below.
Child and Adult On-Site ResidentTable Exposure Pathway Risk Risk Driver
Former SOS Pond AreaG-G-54
G-G-55
Direct contact with soil
Ingestion of soil
4.5 x lO'5
7.0 x 10 5
Arsenic is the only COPC with an SF.
Arsenic is the only COPC with an SF.
Former WWTP AreaG-G-80
G-G-81
Direct contact with soil
Ingestion of soil
1.5 xlO"4
6.6 x 10 5
Aroclor 1254 and arsenic
Aroclor 1254 and arsenic
Former On-Site Railroad Right-of-WayG-G-106
G-G-107
Direct contact with soil
Ingestion of soil
2.0 x 10s
3.0 x IQ>
Arsenic is the only COPC with an SF.
Arsenic is the only COPC with an SF.
Area Under and North of the Former West Manufacturing BuildingG-G-150
G-G-151,G-G-162
Direct contact with soil
Ingestion of soil
6.8 x 10-*
1.5 x 10 5
Arsenic is the only COPC with an SF.
Arsenic is the only COPC with an SF.
Adult On-Site Visitor
Significant area-specific "risks for the adult on-site visitor are summarized below.
Adult On-Site VisitorTable Exposure Pathway Risk Risk Driver
Former WWTP AreaG-G-80,G-G-95
G-G-81,G-G-%
Direct contact with soil
Ingestion of soil
RME: 1.1x10*CT: insignificantRME: 1.4 x 10*CT: insignificant
Aroclor 1254 (5.0 x 10⁷), Aroclor 1260(4.4 x 10⁻⁷), and Arsenic (2.1 x 10'7)Arsenic (9.6 x 10⁻⁷)
G-5-25

Adult On-Site VisitorTable Exposure Pathway Risk Risk Driver
Former On-Site Railroad Right-of-WayG-G-107,G-G-118
Ingestion of soil RME: 3.3 x 10'6CT: insignificant
Arsenic is the only COPC with an SF.
Area Under and North of the Former West Manufacturing BuildingG-G-151,G-G-162
Ingestion of soil RME: 1.1 x 10 6
CT: insignificantArsenic is the only COPC with an SF.
No significant area-specific hazards were identified for the adult on-site visitor
Child On-Site Visitor
Significant area-specific risks for the child on-site visitor are summarized below.
Child On-Site VisitorTable Exposure Pathway Risk Risk Driver
Former SOS Pond AreaG-G-55,G-G-66
Ingestion of soil RME:2.1xlO"«CT: insignificant
Arsenic is the only COPC with an SF.
Former WWTP AreaG-G-80,G-G-95
G-G-81,G-G-96
Direct contact with soil
Ingestion of soil
RME: 1.4 x 10*CT: insignificantRME: 3.3 x lO*CT: insignificant
Aroclor 1254 (5.9 x Itf7), Aroclor 1260(5.3 x lO"7), and Arsenic (2.5 x 10 7)
Arsenic (2.2 x lO"*)
Former On-Site Railroad RIght-of-WayG-G-107,G-G-118
Ingestion of soil RME: 7.7 x 10 'CT: insignificant
Arsenic is the only COPC with an SF.
Area Under and North of the Former West Manufacturing BuildingG-G-151,G-G-162
Ingestion of soil RME: 2.6 x 10"*CT: insignificant
Arsenic is the only COPC with an SF.
G-5-26
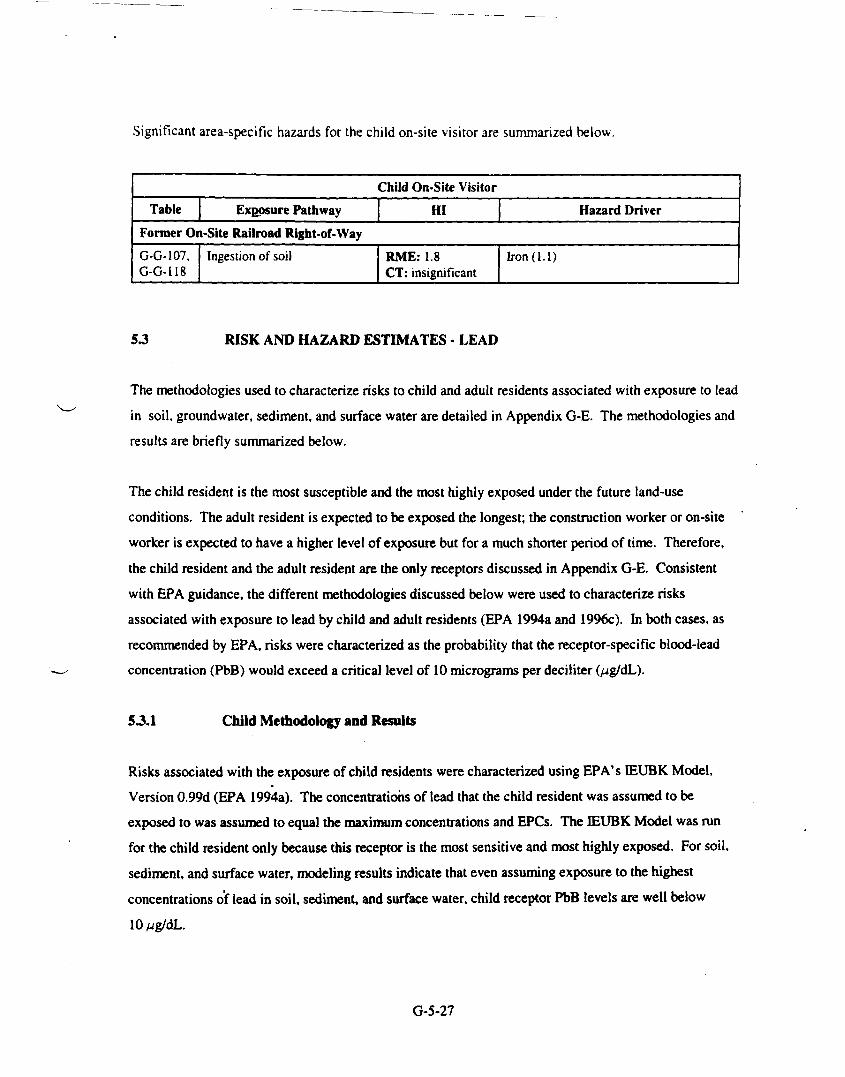
Significant area-specific hazards for the child on-site visitor are summarized below.
Child On-Site VisitorTable Exposure Pathway HI Hazard Driver
Former On-Site Railroad Right-of-wayG-G-107,G-G-118
Ingestion of soil RME: 1.8CT: insignificant
Iron (1.1)
5.3 RISK AND HAZARD ESTIMATES - LEAD
The methodologies used to characterize risks to child and adult residents associated with exposure to leadin soil, groundwater, sediment, and surface water are detailed in Appendix G-E. The methodologies andresults are briefly summarized below.
The child resident is the most susceptible and the most highly exposed under the future land-useconditions. The adult resident is expected to be exposed the longest; the construction worker or on-siteworker is expected to have a higher level of exposure but for a much shorter period of time. Therefore,the child resident and the adult resident are the only receptors discussed in Appendix G-E. Consistentwith EPA guidance, the different methodologies discussed below were used to characterize risksassociated with exposure to lead by child and adult residents (EPA 1994a and 1996c). In both cases, asrecommended by EPA, risks were characterized as the probability that the receptor-specific blood-leadconcentration (PbB) would exceed a critical level of 10 micrograms per deciliter (pig/dL).
53.1 Child Methodology and Results
Risks associated with the exposure of child residents were characterized using EPA's DEUBK Model,Version 0.99d (EPA 1994a). The concentrations of lead that the child resident was assumed to beexposed to was assumed to equal the maximum concentrations and EPCs. The IEUBK Model was runfor the child resident only because this receptor is the most sensitive and most highly exposed. For soil,sediment, and surface water, modeling results indicate that even assuming exposure to the highestconcentrations of lead in soil, sediment, and surface water, child receptor PbB levels are well below
G-5-27

For groundwater, most PbB concentrations based on measured concentrations of lead in groundwater.
surface water, and sediment were below the limit of 10 ug/dL. However, the model indicates that any
groundwater lead concentration above 130 mg/L would result in a PbB exceeding 10 ^g/dL. The
maximum on-site groundwater lead concentration was 186 mg/L. The groundwater lead level exceeded
130 mg/L at monitoring wells MW-28S, MW-22, MW-20. and MW-07. MW-07 and MW-28S are
located just northeast of the former landfill and west of the former manufacturing building. MW-22 and
MW-20 are located along the Kalamazoo River north of the former manufacturing building. Any well
used for drinking water in these areas could therefore potentially cause health risks.
The groundwater lead concentration in the former landfill area at MW-15 was 589 mg/L. The PbB level
associated with this concentration exceeded the 10- g/dL limit. Any well used for drinking water in this
area could therefore cause health risks. However, future residential use of the former landfill is unlikely
because this property is not zoned for residential use and deed restrictions will likely remain associatedwith the property.
5.3.2 Adult Methodology and Results
EPA's "Recommendations of the Technical Review Workgroup for Lead for an Interim Approach to
Assessing Risks Associated with Adult Exposures to Lead" was used to characterize risks associatedwith exposure of adult receptors to lead in on-site soil (EPA 1996c). The adult receptor was assumed to
be a woman of child-bearing age. The methodology focuses on estimating the concentration of lead in
fetal blood (PbBfctlll) in women exposed to lead-contaminated soil. Unlike EPA's EUBK Model(EPA 1994a), this methodology allows the user to select the typical PbB in an adult woman of child-
bearing age in the absence of site-related exposures. The methodology then estimates the extent to which
this initial PbB is increased as a result of site-related exposures. Therefore, the concentration of lead in
on-site soil is considered directly and not as part of a weighted average. The estimated PbBfeul valuesrange from 2.02 ng/dL for the average surface soil concentration to 2.45 /ig/dL for the highest surface
soil concentration. The probability that PbBfeul exceeds 10 Mg/dL is less than 5 percent, therecommended EPA cut-off value, for the adult resident over the entire site. The EPC surface soil lead
concentration yields a 1.54 percent probability and the highest surface soil lead concentration yields a2.87 percent probability that PbBfeal exceeds 10 /zg/dL. These results indicate that potential exposure to
lead in on-site soil does not pose significant risks to human health.
G-5-28

5.4 RISK AND HAZARD ESTIMATES - INDOOR AIR VOCS FROMGROUNDWATER
The methodologies used to characterize risks to on-site residents associated with exposure to VOCs in
groundwater are detailed in Appendix G-D. The methodologies and results are briefly summarizedbelow.
The JEM was used to estimate risk to on-site residents from inhalation of vinyl chloride in indoor air
(EPA 200 Ib). EPA uses the JEM to estimate the transport of contaminant vapors emanating from on-sitegroundwater into indoor spaces. No VOCs were detected in off-property groundwater. The JEM was
used to estimate risks to on-site residents from VOCs in indoor air. Consistent with the approachoutlined in Section 2.0 of the HHRA, on-site groundwater VOC EPCs were compared to HBSLsconsisting of MDEQ residential and commercial indoor air criteria for groundwater. Concentrations ofall VOCs except vinyl chloride were at least two orders of magnitude below MDEQ criteria. Therefore,the risks to on-site residents from indoor air concentrations of vinyl chloride only were estimated usingthe JEM. Based on the site-specific parameters of contaminant concentration, groundwater depth, andsoil type, the incremental cancer risk associated with exposure of on-site residents to vinyl chloride fromgroundwater migrating to indoor air is 1.7 x 10"6, which is within the acceptable risk range of 1 x 10^ to 1x 10~*. This risk value is included in the HHRA evaluation of risks to on-site residents..
5£ RISK AND HAZARD CHARACTERIZATION UNCERTAINTIES
The risk and hazard estimates in this HHRA are subject to various degrees of uncertainty from a varietyof sources. The uncertainties discussed in other sections of this report related to data evaluation,exposure assessment, and toxicity assessment contribute to the overall uncertainty associated with risk
and hazard characterization results.
The most significant site-specific uncertainties are related to (1) the assumption that groundwater beneathand downgradient of the Rockwell site will be used as a drinking water source under the future on- andoff-property residential and on-site visitor land-use scenarios and (2) the use of dermal adherence values.These areas of uncertainty are discussed below, followed by a discussion of other general but significant
sources of uncertainty.
G-5-29

5.5.1 Assumption of Future Groundwater Use
For completeness, risks and hazards associated with the future use of groundwater as a drinking water
source by residents and on-site visitors were evaluated in the HHRA. However, current residents in thevicinity of the site do not use groundwater as a source of drinking water. Drinking water for all residentsin the vicinity of the site is provided by the City of Allegan from wells located approximately 0.5 milesouth of the site and within the flood plain of the Kalamazoo River. Because groundwater is notcurrently used as a drinking water source and because of the presence of high concentrations ofcontaminants in groundwater that likely render the groundwater unpalatable, the use of groundwater as asource of drinking water is unlikely based on current conditions. Therefore, resident and on-site visitorrisks and hazards calculated in the HHRA are likely to be overestimated.
5.5.2 Use of Dermal Adherence Values
As described in Section 5.2, many of the significant ELCRs identified under the current and future land-use scenarios are associated with dermal contact. The calculation of intakes associated with dermalexposure to COPCs in soil requires the use of an adherence factor (AF). The AF parameter is an estimateof the amount of soil that adheres to a receptor's skin per unit of skin surface area. Based on discussionswith an EPA Region 5 member of the Dermal Workgroup (Tetra Tech 1998a), the HHRA uses AF valuesrecommended by EPA's "Dermal Exposure Assessment" (EPA 1992a) and used by MDEQ in developingPart 201 criterion (MDEQ 1998b). It should be noted that EPA's "Exposure Factors Handbook"recommends using body part- and activity-specific AF values that are almost one order of magnitudelower than the RME AF value (1 mg/cm2) used in the HHRA (EPA 1997b). EPA's update to the 1992"Dermal Exposure Assessment" document incorporates and recommends values similar to these revisedand lower AF values (Tetra Tech 1998c). Dermal exposure to arsenic and Aroclors in soil drives themany of the significant risks identified in the HHRA. Based on the discussion above, as calculated in theHHRA, these dermal risks may overestimate actual dermal risks by as much as one order of magnitude.
5.53 Other Potential Sources of Uncertainty
Other general but potentially significant sources of uncertainty are associated with the exposure andtoxicity assessments (see Sections 3 and 4, respectively). These uncertainties were addressed byselecting conservative values for these assessments. For example, EPA guidance states that theconcentration term in exposure equations should be the arithmetic average concentration based on
G-5-30

sampling results; however, because of uncertainties associated with estimating the true average
concentration, the UCL,5 of the arithmetic average or the maximum detected concentration, whicheverwas lower, was used to estimate the concentration (EPA 1992b). By definition, only a 5 percent chanceexists that the UCL,5 of the arithmetic average underestimates the true arithmetic average. Similarly,several other variables in the exposure intake equations are set at values at or near the 95th percentile ofthe distribution of potential values. Examples of these variables include on-site worker exposurefrequency and exposure duration values.
Both RfDs and SFs were developed to be as conservative as possible. RfDs were developed byincorporating several order-of-magnitude uncertainty factors as well as additional, smaller modifyingfactors. SFs were calculated as the UCL,5 on the dose response relationship estimated using thelinearized multistage model for cancer development. Again, only a 5 percent chance exists that anestimated SF underestimates a chemical's true SF.
Multiplying exposure and toxicity variables, many of which are set at conservative values, results in anELCR or HI estimate that is even more conservative. One study demonstrates that when values for twoor more exposure variables based on the 95th percentile are multiplied, the estimated exposuresoverestimate the true 95th percentile. In fact, the estimated exposures are located at about the99th percentile (Cullen 1994). When overestimated exposure results are multiplied again byconservative RfDs and SFs, the resulting ELCR and HI estimates are overestimated to an even greaterextent.
The RME ELCR and HI estimates calculated may also significantly overestimate true 95th percentileresults. It is important to consider the CT results as well; however, even a CT result may overestimatethe true 95th percentile of the distribution of potential values because most CT results incorporate at leasttwo variables, the EPC and the RfD or SF, which are set at the 95th percentile or greater. Even so, CTELCR and HI characterization results overestimate the true 95th percentile to a lesser extent than RMEresults. Therefore, CT ELCR and HI characterization results more accurately represent true risks andhazards than results calculated under the RME case.
Additional ELCR and HI characterization uncertainties largely depend on the assumption of additivity.ELCRs and noncarcinogenic His for individual COPCs were added together to determine exposurepathway-specific ELCRs and His. Exposure pathway-specific ELCRs and His were in turn added to
G-5-31
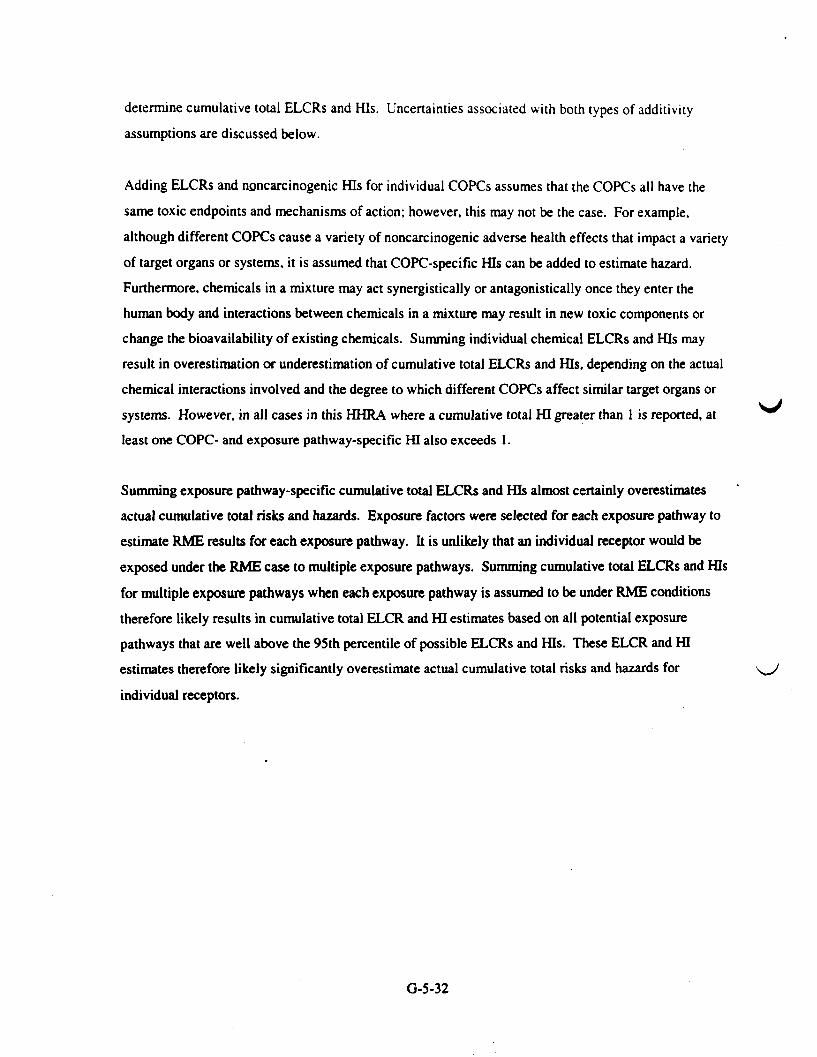
determine cumulative total ELCRs and His. Uncertainties associated with both types of additivityassumptions are discussed below.
Adding ELCRs and noncarcinogenic His for individual COPCs assumes that the COPCs all have thesame toxic endpoints and mechanisms of action; however, this may not be the case. For example,although different COPCs cause a variety of noncarcinogenic adverse health effects that impact a varietyof target organs or systems, it is assumed that COPC-specific His can be added to estimate hazard.Furthermore, chemicals in a mixture may act synergistically or antagonistically once they enter thehuman body and interactions between chemicals in a mixture may result in new toxic components orchange the bioavailability of existing chemicals. Summing individual chemical ELCRs and His may
result in overestimation or underestimation of cumulative total ELCRs and His, depending on the actualchemical interactions involved and the degree to which different COPCs affect similar target organs orsystems. However, in all cases in this HHRA where a cumulative total HI greater than 1 is reported, atleast one COPC- and exposure pathway-specific HI also exceeds 1.
Summing exposure pathway-specific cumulative total ELCRs and His almost certainly overestimatesactual cumulative total risks and hazards. Exposure factors were selected for each exposure pathway toestimate RME results for each exposure pathway. It is unlikely that an individual receptor would beexposed under the RME case to multiple exposure pathways. Summing cumulative total ELCRs and Hisfor multiple exposure pathways when each exposure pathway is assumed to be under RME conditionstherefore likely results in cumulative total ELCR and HI estimates based on all potential exposurepathways that are well above the 95th percentile of possible ELCRs and His. These ELCR and HIestimates therefore likely significantly overestimate actual cumulative total risks and hazards for
individual receptors.
G-5-32

6.0 HHRA SUMMARY
The primary objective of the HHRA for the Rockwell site was to evaluate potential exposures to site-
related contamination and to characterize risks and hazards associated with these exposures. Exposures
were evaluated and risks and hazards were characterized for a variety of human receptors under both
RME and CT exposure conditions and under the current, current and future, and future land-use
scenarios. This section summarizes the HHRA process, major assumptions, and significant conclusionsand uncertainties related to the HHRA. Specifically, Section 6.1 summarizes the data evaluation andCOPC selection processes. Section 6.2 summarizes the exposure assessment. Section 6.3 summarizesthe toxicity assessment. Finally, Section 6.4 summarizes the risk and hazard characterization.
6.1 DATA EVALUATION AND COPC SELECTION
Several historic sampling investigations have been conducted at the Rockwell site. However, Tetra Techhas identified data gaps in the previous investigations, and differences in the investigations that makeusing and combining data from them difficult and, in some cases, inappropriate. The objectives of TetraTech's RI include filling data gaps identified in Tetra Tech's CSM and conducting an HHRA for soil,LNAPL, groundwater, sediment, and surface water matrices associated with the site. Therefore, thisHHRA is based solely on data collected by Tetra Tech as part of the RI because these data represent themost complete and consistent set of data for the Rockwell site.
Soil, LNAPL, groundwater, sediment, and surface water samples were collected as part of Tetra Tech'sRI and analyzed for VOCs, SVOCs, pesticides and PCBs, metals, and dioxins. As indicated inSection 2.3.1, medium-specific COPCs were identified following a four-step process (EPA 1989).COPCs remaining at the conclusion of this process were compared to the HBSLs identified inSection 2.2. Contaminants detected at concentrations above HBSLs were retained as final sitewide(on-site) and area-specific COPCs. Sitewide (on-site) and area-specific COPCs are listed in Tables G-4
and G-5, respectively.
As indicated in MDEQ's May 9, 2001, comments on the HHRA, MDEQ provided EPA with alternateHBSLs for several contaminants. These alternate HBSLs are listed in Tables 7 through 11 of the RIreport. The alternate HBSLs differ from the HBSLs included in the HHRA as discussed below.
G-6-1

State-wide background values presented in MDEQ's Part 201 criteria for soil were usedinstead of the site-specific background concentrations included in the HHRA foraluminum, chromium, cobalt, iron, manganese, and silver.
For lead, the HBSL proposed by MDEQ is based on direct contact with soil instead ofthe site-specific background concentration included in the HHRA.
For LNAPL, the HBSL proposed by MDEQ is based on groundwater screening criteriainstead of the soil-based criteria included in the HHRA.
With the exception of the alternate LNAPL criteria, all criteria proposed by MDEQ are higher than.HBSLs used in the HHRA. Higher HBSLs may result in the exclusion of several COPCs now includedin the HHRA. For LNAPL, alternate HBSLs are both higher and lower than HHRA HBSLs. However,
risks and hazards significantly exceeding appropriate thresholds for LNAPL are identified in this HHRA.Therefore, use of the alternate HBSLs does not alter the conclusions of the HHRA and no alternate
HBSLs are included in the final HHRA.
For inorganic contaminants, analytical results were also compared to background concentrations. Areview of background data collected during the RI indicated that all groundwater samples and all but onesoil sample were likely impacted by the site. As a result, statistical comparisons of on-site sample resultsto background sample results could not be conducted. Therefore, the lower of the UCLg or themaximum concentrations of inorganic contaminants in sitewide and area-specific soil samples werecompared to the inorganic concentrations in background soil sample RW-BG04-0507. Groundwater
inorganic COPCs were assumed to be the same as the soil COPCs because no background data wereavailable for comparison. The lack of background data creates uncertainty; however, because mostinorganics remained as soil COPCs, the use of inorganic soil COPCs for groundwater COPCs mayoverestimate site-related risks and hazards.
Elevated levels (based on a comparison to background concentrations or other sitewide samples) ofessential nutrients, including calcium, magnesium, potassium, and sodium, are present in soil andgroundwater. Based on a comparison of site-related concentrations to RDAs, DRIs, and other health-based levels, no health risk is associated with ingestion of soil but ingestion of groundwater may pose ahealth risk. This is consistent with the hazards and risks identified in Section 5.0 of the HHRA related toother COPCs. However, because groundwater use in the vicinity of the site is unlikely, essential
nutrients were not retained as COPCs.
G-6-2
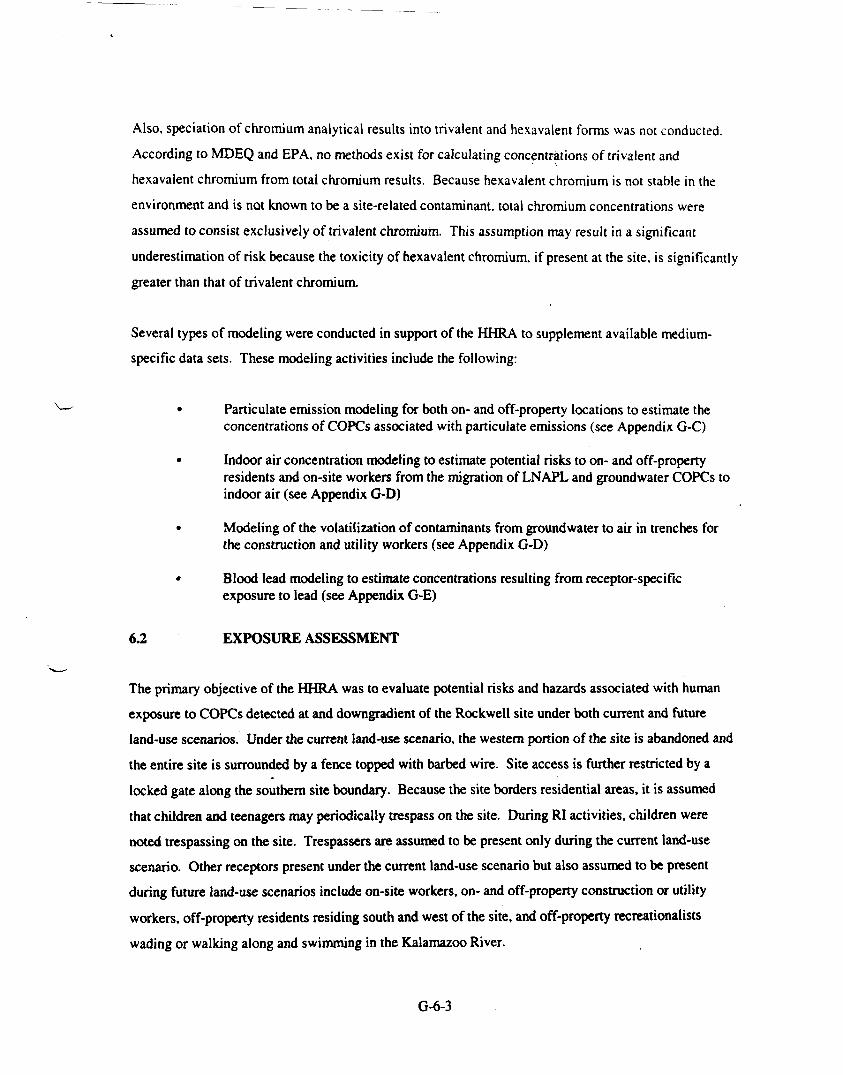
Also, speciation of chromium analytical results into trivalent and hexavalent forms was not conducted.
According to MDEQ and EPA, no methods exist for calculating concentrations of trivalent andhexavalent chromium from total chromium results. Because hexavalent chromium is not stable in the
environment and is not known to be a site-related contaminant, total chromium concentrations were
assumed to consist exclusively of trivalent chromium. This assumption may result in a significant
underestimation of risk because the toxicity of hexavalent chromium, if present at the site, is significantlygreater than that of trivalent chromium.
Several types of modeling were conducted in support of the HHRA to supplement available medium-specific data sets. These modeling activities include the following:
• Paniculate emission modeling for both on- and off-property locations to estimate theconcentrations of COPCs associated with paniculate emissions (see Appendix G-C)
• Indoor air concentration modeling to estimate potential risks to on- and off-propertyresidents and on-site workers from the migration of LNAPL and groundwater COPCs toindoor air (see Appendix G-D)
• Modeling of the volatilization of contaminants from groundwater to air in trenches forthe construction and utility workers (see Appendix G-D)
• Blood lead modeling to estimate concentrations resulting from receptor-specificexposure to lead (see Appendix G-E)
6.2 EXPOSURE ASSESSMENT
The primary objective of the HHRA was to evaluate potential risks and hazards associated with humanexposure to COPCs detected at and downgradient of the Rockwell site under both current and futureland-use scenarios. Under the current land-use scenario, the western portion of the site is abandoned andthe entire site is surrounded by a fence topped with barbed wire. Site access is further restricted by alocked gate along the southern site boundary. Because the site borders residential areas, it is assumedthat children and teenagers may periodically trespass on the site. During RI activities, children werenoted trespassing on the site. Trespassers are assumed to be present only during the current land-usescenario. Other receptors present under the current land-use scenario but also assumed to be presentduring future land-use scenarios include on-site workers, on- and off-property construction or utilityworkers, off-property residents residing south and west of the site, and off-property recreationalistswading or walking along and swimming in the Kalamazoo River.
G-6-3

Receptors expected to be present only under the future land-use scenario include on-site residents, on-site
visitors, and on-site parking attendants. On-site visitors are assumed to participate in ball playing,picnicking, walking, and other recreational activities at a park that may be constructed across the entire
site consisting of open fields covered by grass. It is also assumed that picnic areas containing shelters,tables, and grilling areas will be present at the park. On-site parking attendants are assumed to work inthe western portion of the site, which was assumed to be used as an unpaved parking lot for the AlleganCounty fairgrounds in the future. An adult attendant working at the parking lot is assumed to be exposedmore than visitors using the parking lot because the parking lot attendant receptor is assumed to beexposed for the entire duration of the fair (unlike fair visitors who may be present only for a limited time)and is likely to be in close proximity to activities likely to produce the most dust (such as vehicle traffic).For children present in the parking lot, current parking attendant risk and hazard estimates would be
decreased by a lower body weight, lower body surface area (increase of body parts such as bare feetexposed would be offset by greater adult body surface area), and lower exposure duration. Ingestion ofsoil by children may be greater (100 mg/day vs. 50 for adult); however, the decrease in exposure duration(7 days or less vs. 14 days for the parking attendant) would offset the increase in soil ingestion. Childrenwading in the river are addressed under the off-property recreationalist scenario. Therefore, only theparking attendant was quantitatively evaluated under this scenario.
Selection and development of the land-use scenarios involved several assumptions and introducedsignificant uncertainty, especially with regard to future conditions. Current land-use conditions are fairlywell defined. However, future site development and use cannot be known with certainty. Potential
future land-use scenarios for the Rockwell site were based on discussions with EPA, MDEQ, andofficials from the City of Allegan, Michigan. One of the most significant assumptions made is theexpectation that groundwater will be used as a drinking water source under the future resident and on-sitevisitor land-use scenarios. The City of Allegan receives drinking water from a series of public wellslocated 0.5 mile upstream of the site and within the flood plain of the Kalamazoo River. Therefore, it isunlikely that groundwater on or downgradient of the site will ever be used as a drinking water source.
Under all land-use scenarios, receptor-specific exposures were evaluated using standard exposureequations. Values for individual parameters required by these equations were identified based on EPAand MDEQ guidance and professional judgement. The medium-specific EPCs required in each exposure
equation were calculated in accordance with EPA guidance. Appendix G-C presents the methodologiesused to estimate COPC-specific on- and off-property air concentrations from paniculate emissions.

Appendix G-D presents the methodologies used to calculate indoor air concentrations of V'OCs from
groundwater and LNAPL and construction or utility trench air concentrations of VOCs from
groundwater. Appendix G-E presents the methodologies used to calculate risks associated with exposureto lead.
6.3 TOXICITY ASSESSMENT
Consistent with EPA and MDEQ guidance, the HHRA used COPC-specific toxicity values from EPA'son-line IRIS database and hard copy HEAST report. As discussed in Section 4.0 and documented
throughout the literature, these toxicity values were developed in a conservative fashion and are unlikelyto underestimate a COPC's potential to cause carcinogenic or noncarcinogenic health effects.
In addition to the uncertainty associated with the use of conservative toxicity factors, uncertainty alsoresults from using oral toxicity factors adjusted for oral absorption to characterize risks and hazardsassociated with dermal exposure. Although consistent with EPA guidance, the use of adjusted oraltoxicity factors introduces significant uncertainty. The uncertainty is greatest for COPCs such ascarcinogenic PAHs, which are known to be carcinogenic at the point of exposure and not as a result ofcontaminant absorption. Because of a lack of viable options, the carcinogenic potential of these contactcarcinogens was evaluated in the same manner as other potential carcinogens. However, because ofsignificant differences in carcinogenic mechanisms, this approach introduces significant uncertainty. It isnot known whether this approach under- or overestimates the actual carcinogenic potential of COPCs
such as PAHs (EPA 1989).
It is important to note that inhalation-based toxicity factors are standardized for an adult exposed on adaily basis. Several of the receptors evaluated in the HHRA are not adults (and therefore have differentventilation rates) and are exposed on a less frequent basis. Toxicity factors standardized to daily adultexposures are, therefore, overly conservative for these receptors.
6.4 RISK AND HAZARD CHARACTERIZATION
Section 6.4.1 summarizes sitewide and off-property risks and hazards and Section 6.4.2 summarizes on-site area-specific risks and hazards. All risks and hazards are presented in more detail in Section 5.0 and
Appendix G-G.
G-6-5
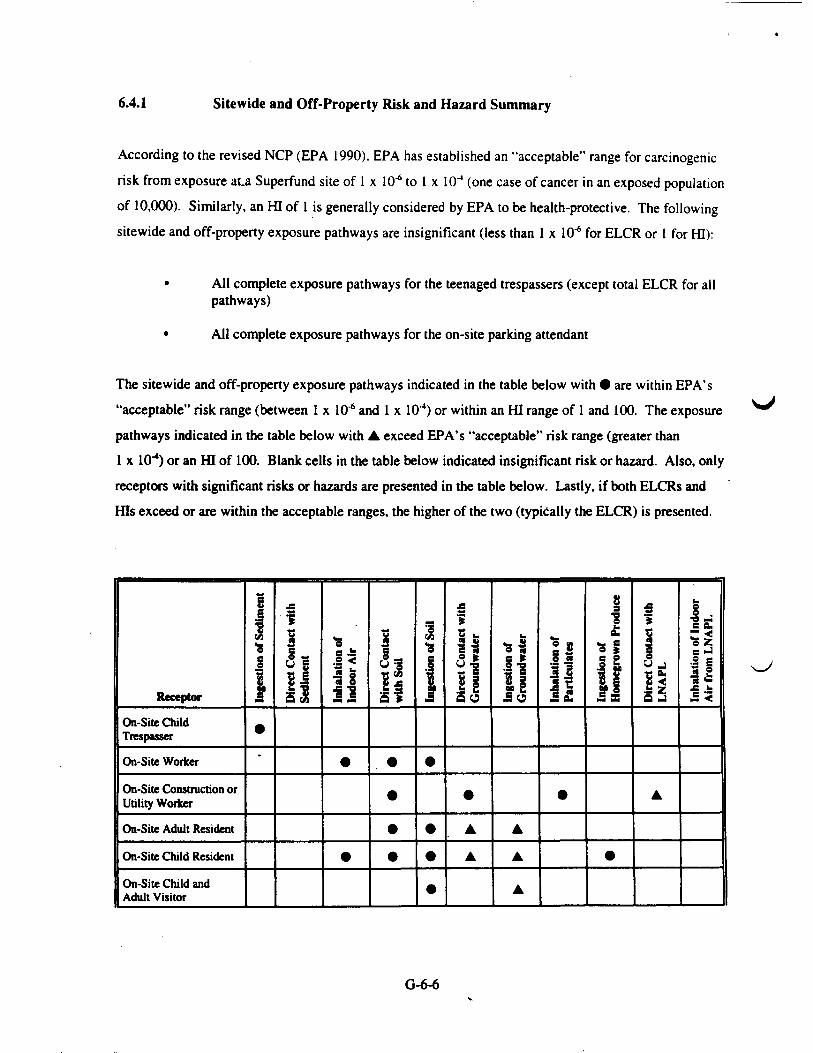
6.4.1 Sitewide and Off-Property Risk and Hazard Summary
According to the revised NCP (EPA 1990). EPA has established an "acceptable" range for carcinogenic
risk from exposure aLa Superfund site of 1 x 10^ to 1 x 10"4 (one case of cancer in an exposed population
of 10,000). Similarly, an HI of 1 is generally considered by EPA to be health-protective. The following
sitewide and off-property exposure pathways are insignificant (less than 1 x 10^ for ELCR or 1 for HI):
All complete exposure pathways for the teenaged trespassers (except total ELCR for allpathways)
All complete exposure pathways for the on-site parking attendant
The sitewide and off-property exposure pathways indicated in the table below with • are within EPA's
"acceptable" risk range (between 1 x 10"* and 1 x 10"4) or within an HI range of 1 and 100. The exposurepathways indicated in the table below with A exceed EPA's "acceptable" risk range (greater than
1 x 10"*) or an HI of 100. Blank cells in the table below indicated insignificant risk or hazard. Also, onlyreceptors with significant risks or hazards are presented in the table below. Lastly, if both ELCRs andHis exceed or are within the acceptable ranges, the higher of the two (typically the ELCR) is presented.
Receptor
On-Site ChildTrespasser
On-Site Worker
On-Site Construction orUtility Worker
On-Site Adult Resident
On-Site Child Resident
On-Site Child andAdult Visitor
1I
•s
•
*
<5 g
Inha
latio
n of
Indo
or A
ir
•
•
j]. •
•
•
-
•s
•
•
•
*
Dire
ct C
ontac
tG
roun
dwat
er
A
A
Inge
stion
ofG
roun
dwat
er
A
A
A
Inha
latio
n of
Par
ticip
ates
•
8
|
1 *
•
>
Dire
ct C
ontac
tLN
APL
A
u
•1 _:e a.
Inha
latio
n of
IA
ir fro
m L
NA
G-6-6

Receptor
Off-PropertyConstruction or UtilityWorker
Off-Property AdultResident
Off-Property ChildResident
Off-Property Child andAdult Recreationalist
Off-Property TeenagedRecreationalist
e
Inge
stion
of S
edii
•
Dire
ct C
onta
ct w
Sedi
men
t
_
Inha
latio
n of
Indo
or A
ir•
Dire
ct C
onta
ctwi
th S
oil
•
A
A
Inge
stio
n of
Soi
l
•
A
A
Dire
ct C
onta
ct w
Gro
undw
aler
•
Inge
stion
of
Gro
undw
ater
A
A
Inha
latio
n of
Part
icula
les
a
Inge
slion
of
llom
egro
wn
Proc
•
Dire
ct C
onta
ct w
iLN
APL
s
Inha
latio
n of
Indi
Air
from
I.N
AIM
.
A
A
Sitewide and off-property exposure pathways exceeding or within EPA's "acceptable" risk range(between 1 x 10"* and 1 x 10"*) or exceeding or within an HI range of 1 and 100 have the following risk orhazard drivers:
• LNAPL and groundwater - PCBs and arsenic
• Soil - PCBs, arsenic, and iron
• Sediment - PCBs
• Homegrown produce - PCBs
• Indoor air from LNAPL - tetrachloroethene, trichloroethene, methylene chloride, andbenzene
Sitewide and area-specific risks and hazards are presented in more detail in Section 5.2.1 and Figures G-3and G-4.
6.4.2 On-site Area-Specific Risk and Hazard Summary
The following on-site area-specific pathways are insignificant (less than 1 x 10"6 for ELCR or 1 for
hazard):
G-6-7

• All complete exposure pathways for the teenaged trespassers (except total ELCR for allpathways)
• All complete exposure pathways for the on-site parking attendant
The sitewide and off-property exposure pathways indicated in the table below with • are within EPA's"acceptable" risk range (between 1 x 10* and 1 x 10"*) or within an HI range of 1 and 100. Blank cells inthe table below indicated insignificant risk or hazard. Also, only receptors with significant risks orhazards are presented in the table below.
ReceptorIngestion ofSediment
Direct Contactwith SoU
Ingestion ofSoil
Former SOS Pond Area
On-site Worker
On-site Construction or UtilityWorker
On-Site Child and Adult Resident
On-Site Child Resident
On-Site Child Visitor
•
•
•
• .
•
•
•
•
Former WWTP Area
On-Site Child Trespasser
On-Site Worker
On-Site Construction or Utility Worker
On-Site Adult Resident
On-Site Child Resident
On-Site Child and Adult Visitor
•
•
•
•
•
•
•
•
•
•
•
Former On-Site Railroad Right-of-Way
On-Site Child Trespasser
On-Site Worker
On-Site Construction or Utility Worker
On-Site Child and Adult Residents
On-Site Child and Adult Visitor
•
•
•
•
•
•
•
G-6-8

ReceptorIngestion ofSediment
Direct Contactwith Soil
Ingestion ofSoil
Area Under and North of the Former West Manufacturing Building
On-Site Worker •
No on-site area-specific exposure pathways exceeded EPA's "acceptable" risk range (greater than1 x 10"4) or an HI of 100. However, exposures resulting from ingestion and direct contact withgroundwater, direct contact with LNAPL, and inhalation of indoor air are summarized in Section 6.4.1
because on-site area-specific EPCs for groundwater and LNAPL were not calculated. Nonetheless, all
area-specific on-site receptors may also be exposed to contaminants in groundwater and LNAPL in each
on-site area.
On-site area-specific exposure pathways exceeding or within EPA's "acceptable" risk range (between 1 x10"* and 1 x 10"4) or exceeding or within an HI range of 1 and 100 have the following risk or hazard
drivers:
• Soil - PCBs, arsenic, and iron• Sediment - PCBs
Sitewide and area-specific risks and hazards are presented in more detail in Section 5.2.2.
G-6-9

REFERENCES
Amdur, M.O., J. Doull. and CD. Klaassen, Editors. 1991. Casarett and Doull's Toxicology: The BasicScience of Poisons. Fourth Edition. Pergaman Press. New York, New York.
Bettley, F.R. and J.A. O'Shea. 1975. 'The Absorption of Arsenic and its Relation to Carcinoma."British Journal of Dermatology. Volume 92. Pages 563 through 568.
City of Allegan. 2000. "City of Allegan, Allegan County, Michigan, Zoning Map". November 15.
Conklin, A.W., and others. 1982. Toxicology Letters. Volume 11, Pages 199 through 203.
Cornell University. 2001. "Material Safety Data Sheets." Accessed on March 14. On-Line Address:http://msds.pdc.comell.edu.
Cuddihy, R.G., and W.C. Griffith. 1972. "A Biological Model Describing Tissue Distribution andWhole-Body Retention of Barium and Lanthanum in Beagle Dogs after Inhalation and Gavage."Health Physics. Volume 23, Pages 621 through 633.
Cullen, Alison. 1994. "Measures of Compounding Conservatism in Probabilistic Risk Assessment."Risk Analysis. Volume 14, Number 4. August.
Delaware Cooperative Extension Service (DCES). 1998. "Food and Nutrition Facts - Sodium."Accessed on October 20. On-Line Address: http://blucehen.ags.udel.edu/deces/fuf/fnf-22.html
Donaldson, R.M., and R.F. Barreras. 1996. "Intestinal Absorption of Trace Quantities of Chromium."The Journal of Laboratory and Clinical Medicine. Volume 68, Pages 484 through 493.
Earth Tech, Inc. (Earth Tech). 200la. 'Technical Memorandum, Former Manufacturing BuildingInvestigation, Former Rockwell International Site, Allegan, Michigan." June.
Earth Tech. 200Ib. "Technical Memorandum No. 2 - Addendum, Southern Outfall Investigation,Former Rockwell International Site, Allegan, Michigan." June
Elakhovskaya, N.P. 1972. 'The Metabolism of Nickel Entering the Organism with Water." RussianTranslation. Gigiena i Sanitariya [Hygiene and Sanitation]. Volume 6, Pages 20 through 22.
Ellis, K.J., and others. 1979. "In Vivo Measurement in Smokers and Nonsmokers." Science.Volume 205, Pages 323 through 325.
Environmental Strategies Corporation (ESC). 1997. "Draft Remedial Investigation Report, FormerRockwell International Corporation, Allegan, Michigan Site."
ESC; McLaren/Hart, Inc.; and PTI Environmental Services. 1998. "Remedial Investigation Report,Former Rockwell International Corporation, Allegan, Michigan Site." Prepared for MeritorAutomotive, Inc.
Farooqui, M.Y.H., and A.E. Ahmed. 1982. "Molecular Interaction of Acrylonitrile and PotassiumCyanide with Rat Blood." Chemicobiological Interactions. Volume 38, Pages 145 through 159.
G-R-1

Gilbert, R.O. 1987. Statistical Methods for Environmental Pollution Monitoring. Van NostrandReinhold. New York, New York.
Healthtouch Online (Healthtouch). 1997. "Sodium." Accessed on October 20. 1998. On-Line Address:http://www.healthtouch.com/levell/leaflets/diet/diet060.html
Keim, K.S., C.L. Holloway, and M. Hebsted. 1987. "Absorption of Chromium as Affected by WheatBran." Cereal Chemistry. Volume 64, Pages 352 through 355.
Lie, R., R.G. Thomas, and J.K. Scot. 1960. "The Distribution and Excretion of Thallium204 in the RatSuggested MFCs and a Bioassay Procedure." Health Physics. Volume 2, Pages 334 through340.
McLellan, J.S., and others. 1978. "Measurement of Dietary Cadmium Absorption in Humans." Journalof Toxicology and Environmental Health. Volume 4, Pages 131 through 138.
Michigan Department of Environmental Quality (MDEQ). 1998b. "Part 201 Generic Soil Direct ContactCriteria: Technical Support Document." Environmental Response Division (ERD). August 31.
MDEQ. 1998c. "Part 201 Generic Drinking Water Criteria: Technical Support Document." ERD.August 31.
MDEQ. 1998d. "Part 201 Generic Soil Inhalation Criteria for Ambient Air: Technical SupportDocument." ERD. August 31.
MDEQ. 1998e. "Part 201 Generic Soil/Water Partitioning Criteria: Technical Support Document."ERD. August 31.
MDEQ. 2000. "Part 201 Cleanup Criteria Changes for June 7, 2000." ERD. Accessed on January 18,2001. Qn-Line Address: http://www.deq.state.mi.us/erd/critguide
Michigan Department of Natural Resources (MDNR). 1991. "Michigan Background Soil Survey."Condensed Version. Waste Management Division, Geotechnical Sampling and Support Unit.April.
Morgan, H., and D.I. Sherlock. 1984. "Cadmium Intake and Cadmium in the Human Kidney." FoodAdditives and Contaminants. Volume 1, Pages 45 through 51.
Midwest Regional Climate Center (MRCC). 2001. Meteorological Data for Allegan, Michigan.Accessed on February 2,2001. On-Line Address: http://mcc.sws.uiuc.edu/Summary/Data/
MultiMag. 2000. "County Profile - Allegan, Michigan." Accessed on December 18, 2000. On-LineAddress: hhtp://www.multimag.com/county/mi/allegan/demo.html.
National Agriculture Library (NAL). 2001. "Dietary Reference Intakes (DRI) and RecommendedDietary Allowances (RDA)." Food and Nutrition Information Center. Accessed on February 28,2001. On-Line Address: http://www.nal.usda.gov/fnic/etext/000105.html
G-R-2
National Academy of Sciences (NAS). 1997. "Directory Reference Intakes for Calcium, Phosphorus.Magnesium, Vitamin D, and Fluoride." Institute of Medicine News. Prepublication Abstract.National Academy Press. Accessed on October 20, 1998. On-Line Address:hhtp://www2.nas.edu/whatsnew/276a.html
NAS. 1998. "Recommended Dietary Allowances (RDA)." Accessed on October 20. On-Line Address:http ://nal. usda.gov/fnic/Dietary/rda. html
Ruoff, W. 1995. "Relative Bioavailability of Manganese Ingested in Food or Water." Proceedings -Workshop on the Bioavailability and Oral Toxicity of Manganese. Cincinnati, Ohio.U.S. Environmental Protection Agency (EPA), Environmental Criteria and Assessment Office(ECAO).
Salt Institute. 1998. "Medical Questions Regarding Dietary Salt." Accessed on October 20. On-LineAddress: http://www.saltinstitute.org/28.html
State of Michigan. 2001. "Allegan City Population and Housing." Accessed on February 5. On-LineAddress: http://www.state.mi.us/webapp/dmb/mic/census
Strickland, G.T., W.M. Beckner, and M.L. Leu. 1972. Clinical Science. Volume 43, Pages 617through 625.
Taylor, D.M., P.H. Bligh, and M.H. Duggan. 1962. 'The Absorption of Calcium, Strontium, Barium,and Radium from the Gastrointestinal Tract of the Rat." The Biochemical Journal. Volume 83,Pages 25 through 29.
Tetra Tech EM Inc. (Tetra Tech). 1998a. Various Teleconferences and E-mail CorrespondenceRegarding Dermal Adherence Factors and Gastrointestinal Absorption Efficiencies. BetweenEric Morton and Kris Kruk, Environmental Scientists, and Mark Johnson, Risk Assessor, EPARegion 5.
Tetra Tech. 1998b. Various Conversations Regarding Receptor-Specific Body Weights and SkinSurface Area. Between Eric Morton, Environmental Scientist, and Andrew Podowski, RiskAssessor, EPA Region 5.
Tetra Tech. 1999. Various Conversations Regarding Characterization of Risks Associated with LeadExposures and Recommended Trespasser Exposure Frequencies. Between Eric Morton,Environmental Scientist, and Patricia van Llewyn, Toxicologist, EPA Region 5.
Tetra Tech. 2001. Record of Telephone Conversation Regarding Groundwater Information for Allegan.Between Saba Fatima, Environmental Scientist, and Jerry Wilson, Water and Sewer District ofAllegan. Februarys.
Toxic Committee of the. California Air Control Officers Association (TCAPCOA). 1993. "Air ToxicsHot Spots Program, Revised 1992 Risk Assessment Guidelines." October.
U.S. Department of Agriculture (USDA). 1995. "Choose a Diet Moderate in Salt and Sodium."Nutrition and Your Health: Dietary Guidelines for Americans. Fourth Edition. Home andGarden Bulletin No. 232. Accessed on October 20,1998. On-Line Address:http://www.nalusda.gov/fhic/dga/dguide95.html
G-R-3

U.S. Environmental Protection Agency (EPA). 1986. "Guidelines for the Health Risk Assessment ofChemical Mixtures." Federal Register. Volume 51, No. 185. Pages 34014 through 34025.
EPA. 1988. "Superfund Exposure Assessment Manual." Office of Emergency and Remedial Response(OERR). Washington, DC. EPA/540/1-88/001. April.
EPA. 1989. "Risk Assessment Guidance for Superfund, Volume I: Human Health Evaluation Manual(Part A)" (RAGS). OERR. EPA 540/1-89/002. Interim Final. December.
EPA. 1990. "National Oil and Hazardous Substances Pollution Contingency Plan." Federal Register.Volume 55, No. 46. April 9.
EPA. 199la. "RAGS, Volume 1: Human Health Evaluation Manual, Supplemental Guidance: StandardDefault Exposure Factors." Office of Solid Waste and Emergency Response (OSWER)Directive 9285.6-03. Interim Final. March 25.
EPA. 199 Ib. "RAGS, Volume 1: Human Health Evaluation Manual (Part B), Development of Risk-Based Preliminary Remediation Goals." Interim. Publication 9285.7-0IB. December.
EPA. 1992a. "Dermal Exposure Assessment: Principles and Applications." Office of Health andEnvironmental Assessment. Interim Report. EPA/600/8-91/00IB. January.
EPA. 1992b. "Guidance for Data Useability in Risk Assessment (Part A) Final." OERR. Publication .9285.7-09A. April.
EPA. 1992c. "Supplemental Guidance to RAGS: Calculating the Concentration Term." OSWER.Publication 9285-7-081. May.
EPA. 1994a. "Integrated Exposure Uptake Biokinetic Model for Lead in Children" (EUBK Model).Version 0.99d. OERR. Washington, DC.
EPA. 1994b. "Guidance Manual for the EEUBK Model." OERR. Washington, DC. EPA/540/R-93/08 I.February.
EPA. 1995. 'Technical Support Document for Hazardous Waste Identification Rule (HWIR): RiskAssessment for Human and Ecological Receptors." Office of Solid Waste. Washington, DC.
EPA. 1996a. "Proposed Guidelines for Carcinogenic Risk Assessment." Federal Register. Volume 61,Number 79, Part.60. April 23.
EPA. 1996b. "Soil Screening Guidance: Technical Background Document." OSWER.EPA/540/R-95/128. May.
EPA. 1996c. "Recommendations of the Technical Review Workgroup for Lead for an Interim Approachto Assessing Risks Associated with Adult Exposures to Lead." Technical Review Workgroupfor Lead. December.
EPA. 1997a. "Health Effects Assessment Summary Tables, FY 1997 Update." OSWER. EPA-540-R-97-036. July.
G-R-4

EPA. 1997b. "Exposure Factors Handbook." Volumes I through III. Office of Research andDevelopment (ORD). EPA/6000/P-95/002Fa. Fb. and Fc. August.
EPA. 2000a. "Region DC Preliminary Remediation Goals (PRO) 2000." Region IX. November 22.
EPA. 2000b. "Integrated Risk Information System Online Database" Office of Health andEnvironmental Assessment. Accessed on October 5. On-Line Address:http://www.epa.gov/iris/subst-fl.html
EPA. 2001a. "Subsurface Vapor Intrusion into Buildings." Accessed on February 26. On-LineAddress: http://www.epa.gov/oerrpage/superfund/programs/risk/airmodel/johnson_ettinger.htm
EPA. 2001b. "Integrated Risk Information System Online Database" Office of Health andEnvironmental Assessment. Accessed on February 6 and March 20. On-Line Address:http://www.epa.gov/iris/subst-fl.html
Washington State Department of Ecology (WSDE). 1992. "Statistical Guidance for Ecology SiteManagers." Olympia, Washington. August.
WSDE. 1993. "Supplement S-6, Analyzing Site Background Data with Below-Detection Limit orBelow-PQL Values (Censored Data Sets)." Olympia, Washington. August.
Wester, R.C., and others. 1993a. "In Vivo and In Vitro Percutaneous Absorption and SkinDecontamination of Arsenic from Water and Soil." Fundamentals of Applied Toxicology.Volume 20, Pages 336 through 340.
Wester, R.C., and others. 1993b. "Percutaneous Absorption of PCBs from Soil: In Vivo RhesusMonkey, In Vitro Human Skin, and Binding to Powered Human Stratum Comeum." Journal ofToxicology and Environmental Health. Volume 39, Pages 375 through 382.
Wester, R.C., and others. 1992. "In Vitro Percutaneous Absorption of Cadmium from Water and Soilinto Human Skin." Fundamentals of Applied Toxicology. Volume 19, Pages 1 through 5.
Wester, R.C., and others. 1990. "Percutaneous Absorption of [14C] DDT and [14C] Benzo(a)pyrenefrom Soil." Fundamentals of Applied Toxicology. Volume 15, Pages 510 through 516.
Yates, A.A., S.A. Schlicker, and C.W. Suitor. 1998. "Dietary Reference Intakes: The New Basis forRecommendations for Calcium and Related Nutrients, B Vitamins, and Chlorine." Journal of theAmerican Dietetic Association. June. Abstract. On-Line Address:http://www.eatright.org/joumal/j0698a7.html
Young, V.R., A. Nahapetian, and M. Janghorbani. 1982. "Selenium Bioavailability with Reference toHuman Nutrition." The American Journal of Clinical Nutrition. Volume 35, Pages 1076 through1088.
G-R-5

APPROXIMATE SITEBOUNDARY/PROPERTY LINE
SURFACE WATER BOUNDARY
STRUCTURE
FORMER STRUCTURE OR UNIT (NO LONGER PRESENT)
FENCELINE
FORMER RAILROAD
ROADWAY
PIT
OUTFALL
AREA BOUNDARY
GRASSY AREA
FORMER ON-SITERAILROAD RIGHT-OF-WAY
SOURCE: MODIFIED FROM ESC AND OTHERS 1998
TWO 12.000-GAU.ONEQUALIZATION VAULTS
ALLECANCOUNTY
FAIRGROUNDS
FIRE PROTECTIONTANK AND SHED0 110 220
SCALE IN FEET
FORMERROCKWELL
HEAT-TREAT
eunowG
ALLEGANMETAL
FMSMNC(FORMER
ROCKWELLDRIVE-LINEASSEMBLYBUILDING)
FORMER WESTMANUFACTURING
CHIP LOADINGAND COOLANTUNLOADINGFACILITY
FORMERcrrr OFALLEGANLANDFILL CITY OF
ALLEGAN _}HEALTH
SERVICES
ROCKWELL INTERNATIONAL CORPORATION SITEALLECAN. MICHIGAN
QTetra Tech EM Inc
AREA UNDER AND NORTHOF THE FORMER WESTMANUFACTURING BUILDING
FORMER ROCKWELLWWTP AREA
FORMER SOSPOND AREA
FORMER OFF-PROPERTYRAILROAD RIGHT-OF-WAY
OFF-PROPERTY RESIDENTIALAREA (BACKGROUNDSOIL)
EXTENT OF FORMERCITY OF ALLEGAN LANDFILL(SATURATED ZONE BENEATHTHE FORMER CITY OF ALLECANLANDFILL)

n«i™, i~ _ ii~ _nn i ***e exposure pathway . nrianed tor quanula.rv. analysis
• Walking or wading along "vers edge1C inromploto exposure pathway
Do Mimmis exposure pathway
' - The current on-site trespasser exposure scenario includes children and teenagers who may occasionally trespass on the siteThe future on-aite visitor exposure scenario includes children and adults who may visil a future park.
D , S . -K( contaminants have migrated through subsurface soil and grogndwaler to a low-lving area in an off-property residenfs backyard.C = The ""P08*" routes »"d scenarios are the same as those listed above under the "Sediment and Surface Water in Kalamazoo Rivaf exposure points." = The «*P08ure routes and scenarios are the same as those listed above under the "Groundwater Downgradient of Site" exposure points.* = Tr» exposure routes and scenarios are the sarrw as mcse list above uixjer tr« "On-site Groundwater" exposure points.
ROCKWELL INTERNATIONALCORPORATION SITEALLEGAN. MICHIGAN
FIGURE G-2CONCEPTUAL SITE MODEL
Tetra Tech EM Inc.

1
10 '
10 •'
10 '
£0£ 10 ''UJu< 10 ''
10'
10"
10"
10'°
10000,000
1.000.000
100,000
< w.ooo
o 1000
8 100
o 10
« ,.'102
10'
10"
10s
——— ft ""*•"" ...
k ' , :•C/M TJ (17|
A" 'f ""Or- if i'nOn SiteChild
Trespasser
• (53E-01)
fioli(20E02I
On-SiteChild
Trespasser
0I33E-05)
(1 IE 07)
A!' IE 08)
A<* OF 10)O (2 If. 10)
On Site On-SiteTeenaged WorkerTrespasser
f (15E-00)
. (30E-01) O(59E-01)W(l -IE 01)3? Al7 1E-°2>S?(60E02)
JJ(26E-02>
(1 3E-02)
O <? HE 05)
On-SHe On-SteTeenaged WorkerTrespasser
Key: A INHALATION OF PARTICULATESO DIRECT CONTACT WITH SOIL
INGESTION OF SOIL3 INGESTION OF HOMEGROWN PRODUCEO DIRECT CONTACT WITH SURFACE WATER IN ON-SITE PONDSO INGESTION OF SURFACE WATER IN ON-SITE PONDS
' ~ rt'.t'l)l| ——————————————————————— ~ ——
ii 9F "mi
• USE on{1 8E01)
-(16E03)9(1 IE-03)
CIE-O-n
otsx-05, , §£££;0 (1 OE-05) ©(1 9E-05)
fyMEOfii Of^OE-ORI
•ft AVC'nE-07) 0(1 IE 07)
Al32E08)lJ A(21E-08)C
4> (9 3E 09)*i(7 1E OS)
On-Ste Off-Property Off-Property Off-PropertyConstruction or Construction or Adult . Child ,UMityWorker Utility Worked Residenr11 Residerr
• (.1 1E»Of,l(4 1E»06)
• (IOE'05)(1 OE*05)
• (1 4E«04)(1 4E*04)
• (• 06-02)O (8 3E>02)
Q (2«E«2> W
*:'":i;;:0(18E-01) ¥d IE-Oil ft(t IE-01)
6 v2 I 3 8 E - 0 0 ) r - , • ' ' • • ' •
A(54E-01)'
OU'E-02)
0,,BE01, Ol"E01,
Off-Property Off-Property Ol-Property Off-PropertyConslructionor Construction or AduR ChildUlityWorker utityWorkei3 Resident" Resident
$3 INGESTION OF SEDIMENT IN ON-SITE PONDS ftV INHALATION OF INDOOR AIR frft INGESTION OF GROUNDWATER <Z0 INHALATION OF GROUNDWATER FROM SHOWERING ft0 DIRECT CONTACT WITH GROUNDWATER 2>i DIRECT CONTACT WITH SEDIMENT IN ON-SITE PONDS O
Notes:Exposure pathways and contaminants not evaluated In the HHRA m- \presentattheRockwellsrt* ° =
rl = Under future conditions, the cancer risk is 1 .2E-09 and the noncarc _/nic hazard is 2.3E-01 " =1 = Under future conditions, the cancer risk is 3.2E-08 and the noncarcinogenic hazard is 2. IE-01
•)(13E-05)n(6 IE 061
(6 IE Ofi) (| 8E«)
W
ft,12E-0«. W " '
ft I24E-09)
Off-Property Off-PropertyAduR Teenaged
Recreatonalist RecreatonalistRECEPTORS
&S4342"!! SILl*!«illITl| S(14E-OI,
ft(34E<M) ft|33E-04)
Off-Property OtVPropertyAdul Teenaged
Recreationalist RecreationalistRECEPTORS
^ll OE'OOl
^(62E Oil
•
0(16£-03) 0('5E-°31
• (S4E-06I ' ' !!»«!QI58E06) A(4 7E-OB)I>I25E Ofit •if <r
OI53E-07) C
A<«5E«I A
.. A (1 IE 09) *ft'36^09' 0(2 IE 09.
Off-Property On-Site On-Ste On-SHe (Chid Adult Child AduR
Recreatkmafct Resident Resident Visitor
A,l IIMII,
^'ioE-O^i •<4«E-04>
0(1 IE-021 0(V3E<<>2)
(J(, ,E.o,, at22E-01|V
m (1 SE-00) V
*S,(97E-OI| O50EX11I §!f3E" !!^^<S IE-Oil ^* "
*,, ; in,
Al45E-°2' . A128E-02)g II i > ' ' All 2E-02) «3(25E-02)
0(8 IE-011
ft (4 IE-04) V '
Off-Property On-Ste On-Ste On-SteChild AduR ChM AduR
Recreatonalst Residenl Resident Visitor
DIRECT CONTACT WITH LIGHT NONAOUEOUS-PHASE LIQUID • TOTAL RISK OR HAZARDINGESTION OF KALAMAZOO RIVER SURFACE WATERINGESTION OF KALAMAZOO RIVER SEDIMENTDIRECT CONTACT WITH KALAMAZOO RIVER SURFACE WATERDIRECT CONTACT WITH KALAMAZOO RIVER SEDIMENTINHALATION OF GROUNDWATER
Under '--tgre conditions, the cancer risk is 2.1E-08 and the noncarcinogenic hazard is 5.4E-01Off-p V construction or utility worker and resident receptors shown on this figure are those exposedto cor.._. inants of potential concern in the former off-property railroad right-of-way area

futurfutur
i
llf
s&i
!
i
: 5 J
?i:a mIs
n!
n o » o>z 9 z z 5 }
5 o Q c ^z g z z go s a o ? s* S * -" 3 $S Q g g G j?s"s*S i § S n|1| Q§n > TI
ill|3n
r^ z
8?6 a01 S
S S S S S;qq||q
! 1 I « * 1
NONCARCINOGENIC HAZARD CANCER RISK
o c o o o s
III*s
i!«
m
9a
n
co o»IS ^SS = 3*
S S Ǥ * S
* "><?s I a5 ^ ~
^
1
o |>5 Si? SI
o >Cs S S3 - 6
^ fl?^S S»a 30
2^ CM Q
I ^
? ?<1 S =
o d>
^ "jl
s s s
s x ;
1 S ;.
O >a Si-
o * »1? ~. wKsi - nit
0 •
S ** ""l" i!
» 0 •
1 1 i?
°. *_s = i3 £ 2
'•*-? *S" n!; *= . *
.
1
•si
»I
: «o *
II 1-
" 1 *"II i
isi:
3
1
On &
tenstrtjcfc
bitty
Wak
\ *
Ki
ill
i > OO t»
^ *f^
CO * O
> o1 5
>o pa<=, - k"~3 i =
> 0
1 ?
l> a
p a (^S - i
! a5
o > Pi * is
t* o O1
i i I
> o *•= i
> o *s i
CO »Cw »J
ii 1
3
>• O
J
:i3 *? 9i ':• S
PI
• 8
i * S* ?S
••:«•*
-te
1
i
•
•s
,I *
%SS
»1,5
o o o o o o o o o o o