Signature redacted for privacy. 2), - CiteSeerX
290
proved: r for the degree of Doctor of Philosophy in Rangeland Resources presented on May 4, 1990. Title: Physiological Ecolociy of Western Juniper (Juniperus ook. subsp. occidentalis). Signature redacted for privacy. Lee E. Eddleman ems and costs of root/shoot allocations, response tions of above and below-ground tissue and to zation with nitrate and ainmonium, and seasonal s of physiological processes were measured on ile, small-adult, and large-adult Juniperus dentalis growing in the field under ambient ironmental conditions in eastern Oregon. Adult foliage had the highest heat of combustion, itrogen concentrations, and construction cost. Allocation patterns indicated a larger investment in resources to above than below-ground tissue. J. occidentaljs allocated larger proportions of dry mass to foliage, to maximize photosynthetic capacity, and to roots, to optimize water and nutrient acquisition; this was ,2 rn. 2), Patricia N. Mille occidentalis H Abstract ap to reduc fertili course juven occi env n Patt AN ABSTRACT OF THE THESIS OF
-
Upload
khangminh22 -
Category
Documents
-
view
0 -
download
0
Transcript of Signature redacted for privacy. 2), - CiteSeerX
proved:
r for the degree of Doctor of Philosophy in
Rangeland Resources presented on May 4, 1990.
Title: Physiological Ecolociy of Western Juniper (Juniperus
ook. subsp. occidentalis).
Signature redacted for privacy.Lee E. Eddleman
ems and costs of root/shoot allocations, response
tions of above and below-ground tissue and to
zation with nitrate and ainmonium, and seasonal
s of physiological processes were measured on
ile, small-adult, and large-adult Juniperus
dentalis growing in the field under ambient
ironmental conditions in eastern Oregon.
Adult foliage had the highest heat of combustion,
itrogen concentrations, and construction cost. Allocation
patterns indicated a larger investment in resources to above
than below-ground tissue.
J. occidentaljs allocated larger proportions of dry
mass to foliage, to maximize photosynthetic capacity, and to
roots, to optimize water and nutrient acquisition; this was
,2 rn.2),
Patricia N. Mille
occidentalis H
Abstract ap
to reduc
fertili
course
juven
occi
env
n
Patt
AN ABSTRACT OF THE THESIS OF
accomplished through reduction of allocation to branches and
trunk.
Removing -50% of the foliage increased rates of CO2
assimilation but did not increase growth, improve water
status, or increase nitrogen concentration of remaining
foliage. Cutting lateral roots reduced physiological
processes and quantum-use-efficiencies and water-use-
efficiencies.
Fertilization increased foliar nitrogen concentrations
and reduced CO2 assimilation, leaf conductance, and
transpiration. Juniperus occidentalis appears to be adapted
to the low, ambient levels of soil nitrate and does not
preferentially utilize ammonium.
Highest daily total assimilation occurred during July
and August. Juveniles had significantly higher assimilation
and transpiration per gram foliage than did small or large-
adults. Juveniles had the tightest control over water
loss, but were not more water-use-efficient than small-
adults or large-adults. Soil drought affected conductance
independent of plant water potentials or vapor pressure
deficits. Branchiet elongation was greatest in June and
July. Juveniles were more responsive to the changing
environment that were small-adults or large adults.

PHYSIOLOGICAL ECOLOGY OF WESTERN JUNIPER(JtJNIPERUS OCCIDENTALIS HOOK. SUBSP. OCCIDENTALIS)
by
Patricia M. Miller
A THESIS
submitted to
Oregon State University
in partial fulfillment ofthe requirements for the
degree of
Doctor of Philosophy
Completed May 4, 1990
Commencement June 1990

APPROVED:
Sig nature redacted for privacy.Ass.ciate Professor of Rangeland Resources in charge 0major
Signature redacted for privacy.
Head of Department 7 Ranqeland Resources
Signature redacted for privacy.Dean of Grrate c1fol
Date thesis is presented May 4, 1990
Typed by Patricia Miller for Patricia M. Miller
ACKNOWLEDGEMENTS
I wish to thank Jeffrey Miller, Margi B'dhm, and Susanna
Kramer for their assistance in carrying out the field work
necessary to complete the research reported here. Jeffrey
Miller and Christopher Miller also provided valuable and
timely computer support. The research was supported in part
by the Agricultural Experiment Station, Oregon State
University. Dr. E. M. Romney and the University of
California, Los Angles, Biomedical Laboratory provided
assistance for sample analysis. The L S Ranches and Bureau
of Land Management allowed use of the research sites. Dr.
G. W. Cox's prompt reviews of manuscripts was appreciated.
I wish to thank Dr. L. E. Eddleman for being my major
professor.
This dissertation is dedicated to Dr. Philip C. Miller,
who would have been surprised and pleased.

TABLE OF CONTENTS
INTRODUCTION 1
ALLOCATION PATTERNS OF CARBON AND MINERALS IN
JUVENILE AND SMALL-ADULT JUNIPERUS OCCIDENTALIS 14
Abstract 15
Introduction 17
Methods 19
Results 23
Discussion 36
Acknowledgements 45
THE RESPONSE OF WESTERN JUNIPER (JUNIPERUS
OCCIDENTALIS) TO REDUCTIONS IN ABOVE- AND
BELOW-GROUND TISSUE 46
Abstract 47
Introduction 49
Methods 51
Results 56
Discussion 91
Conclusions 102
Acknowledgements 104
THE RESPONSE OF JUVENILE AND SMALL-ADULT
WESTERN JUNIPER (JUNIPERUS OCCIDENTALIS) TO
NITRATE AND ANMONIUM FERTILIZATION 105
Abstract 106
Introduction 108
Methods 111
Results 116
Discussion 141
Conclusions 148
Acknowledgements 149
SEASONAL PATTERNS OF PHYSIOLOGICAL PROCESSES IN
WESTERN JUNIPER (JUNIPERUS OCCIDENTALIS) 149a
Abstract 150
Introduction 152
Methods 156
Results 163
Discussion 206
Conclusions 222
Acknowledgements 224
SUNJIY 225
BIBLIOGRAPHY 236
APPENDIX A - DATA REDUCTION PROGRAM 255
111.4
111.5
111.6
Iv. 3
LIST OF FIGURES
Page
Concentration of macro- and micronutrients 29elements, relative to biomass, for juvenileand small-adult J. occidentalis tissue.
Diurnal course of intensive measurements made 59on July 10, 1988.
Pre-dawn, mean minimum, and absolute minimum 66xylem pressure potentials.
Probable upper limit of carbon dioxideassimilation with measured PPFD and leaftemperatures and probable upper limit ofconductance with measured xylem pressurepotentials and vapor pressure deficits.
Envelopes enclosing the data for therelationships between maximum carbon dioxideassimilation and foliar nitrogenconcentrations.
Log concentrations, as a percent ofconcentrations in control tissue, of macro-and micro-nutrient elements in new and oldfoliage.
Potential maximum response of quantum-use and 84water-use efficiencies in April/May andAugust.
Diurnal courses of intensive measurements on 123July 19, 1988.
Pre-dawn, mean minimum, and absolute minimum 131xylem pressure potentials for juvenile andsmall-adult J. occidentaljs from control,nitrate, and ammonium treatments.
Potential maximum response of carbon dioxide 134assimilation versus photon flux density andleaf temperature and of conductance versusvapor pressure deficit and xylem pressurepotential.
70
75
79
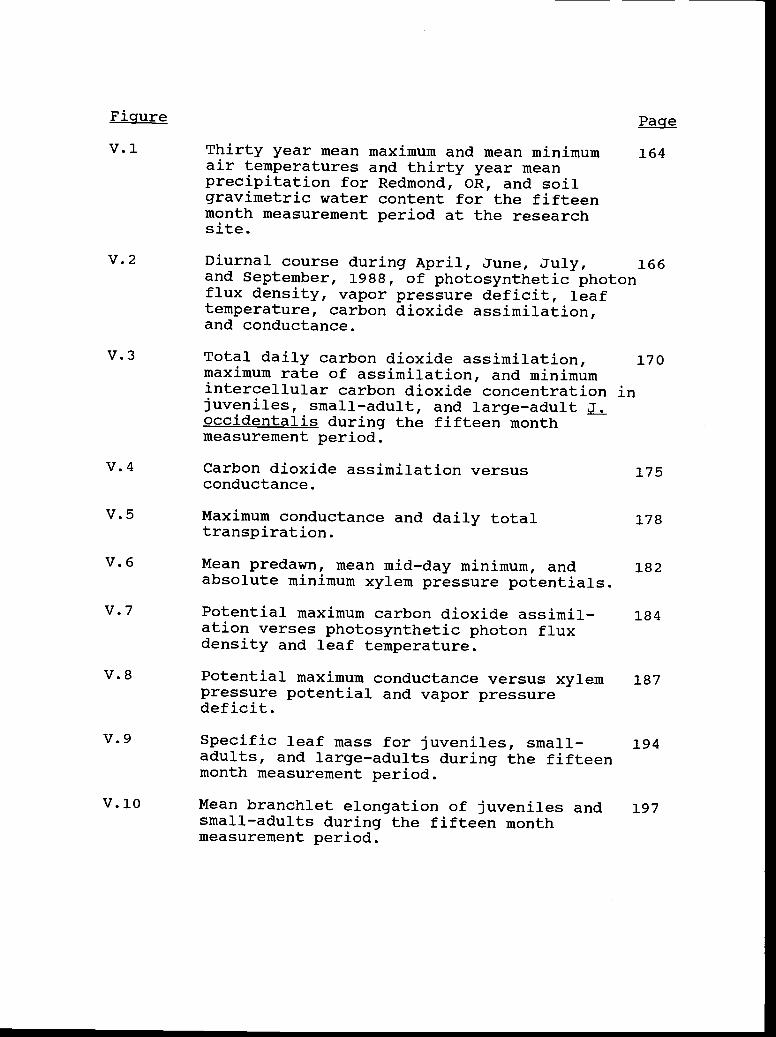
Figure Page
V.1 Thirty year mean maximum and mean minimum 164air temperatures and thirty year meanprecipitation for Redmond, OR, and soilgravimetric water content for the fifteenmonth measurement period at the researchsite.
V.2 Diurnal course during April, June, July, 166and September, 1988, of photosynthetic photonflux density, vapor pressure deficit, leaftemperature, carbon dioxide assimilation,and conductance.
V.3 Total daily carbon dioxide assimilation, 170maximum rate of assimilation, and minimumintercellular carbon dioxide concentration injuveniles, small-adult, and large-adultoccidentalis during the fifteen monthmeasurement period.
V.4 Carbon dioxide assimilation versus 175conductance.
V.5 Maximum conductance and daily total 178transpiration.
V.6 Mean predawn, mean mid-day minimum, and 182absolute minimum xylem pressure potentials.
V.7 Potential maximum carbon dioxide assimil- 184ation verses photosynthetic photon fluxdensity and leaf temperature.
V.8 Potential maximum conductance versus xylem 187pressure potential and vapor pressuredeficit.
V.9 Specific leaf mass for juveniles, small- 194adults, and large-adults during the fifteenmonth measurement period.
V.10 Mean branchiet elongation of juveniles and 197small-adults during the fifteen monthmeasurement period.

Figure Page
V.11 Potential maximum quantum-use efficiency 200and water-use efficiency during April,June, July, and September, 1988.
V.12 Daily total quantum-use efficiency, water- 202use efficiency, and potential photosyntheticnitrogen-use efficiency for juvenile, small-adult, and large-adult J. occidentalis duringthe fifteen month measurement period.
LIST OF TABLES
Table Page
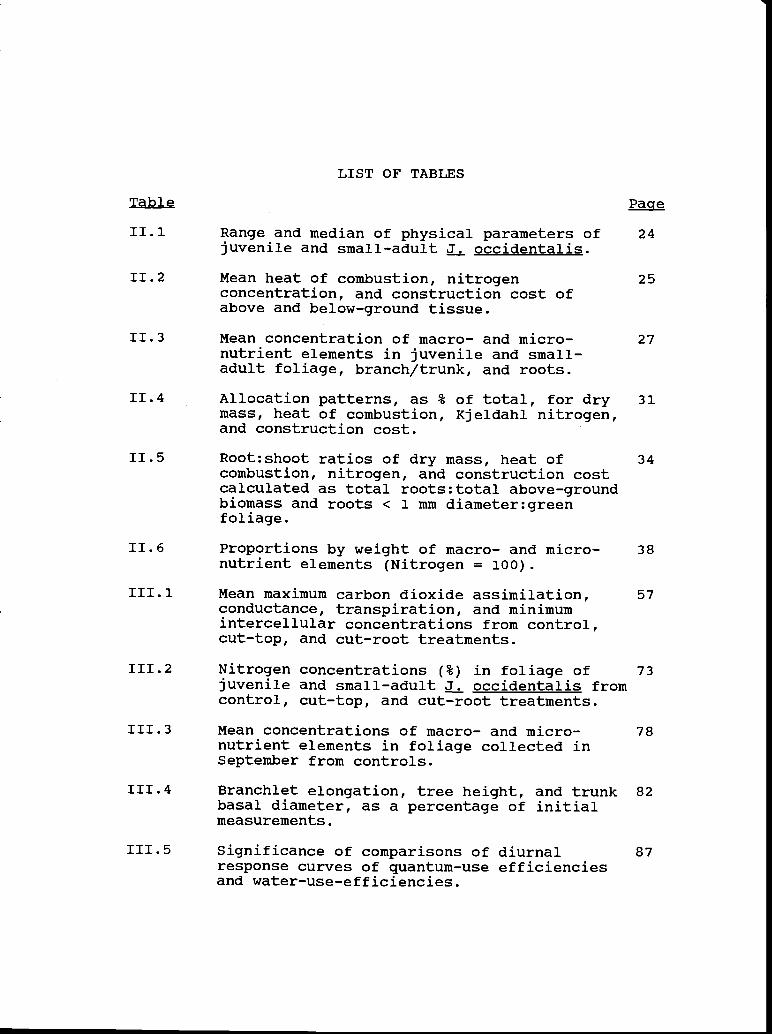
11.1 Range and median of physical parameters of 24juvenile and small-adult J. occidentalis.
11.2 Mean heat of combustion, nitrogen 25concentration, and construction cost ofabove and below-ground tissue.
II. 3
II. 4
Mean concentration of macro- and micro- 27nutrient elements in juvenile and small-adult foliage, branch/trunk, and roots.
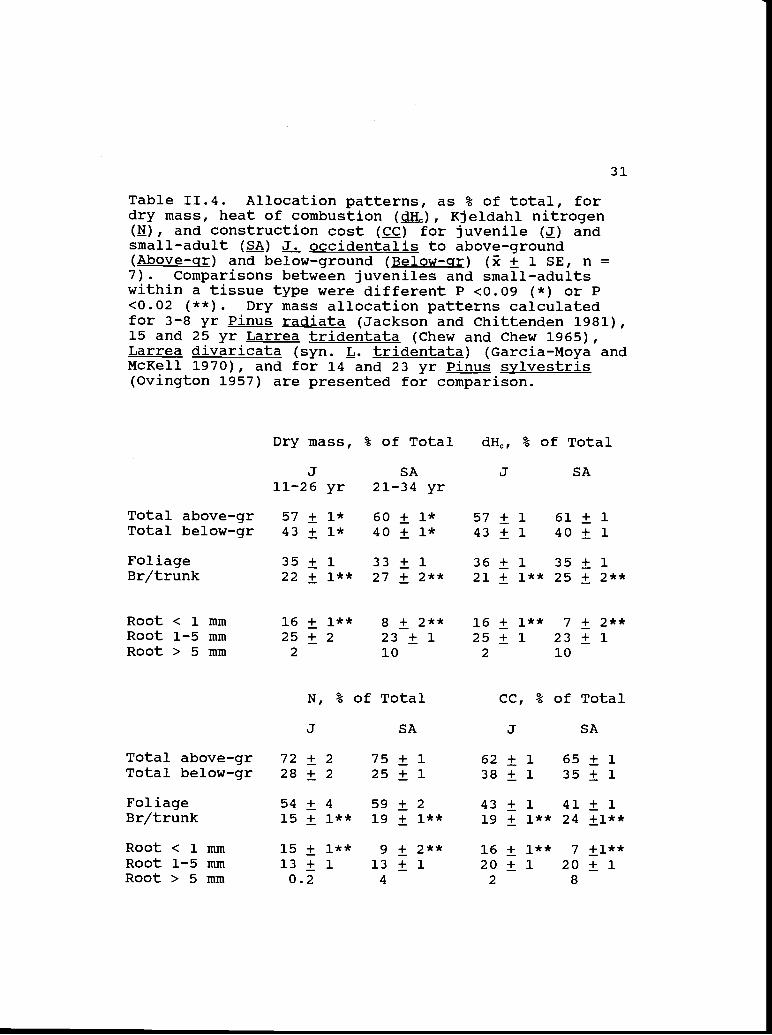
Allocation patterns, as % of total, for dry 31mass, heat of combustion, Kjeldahl nitrogen,and construction cost.
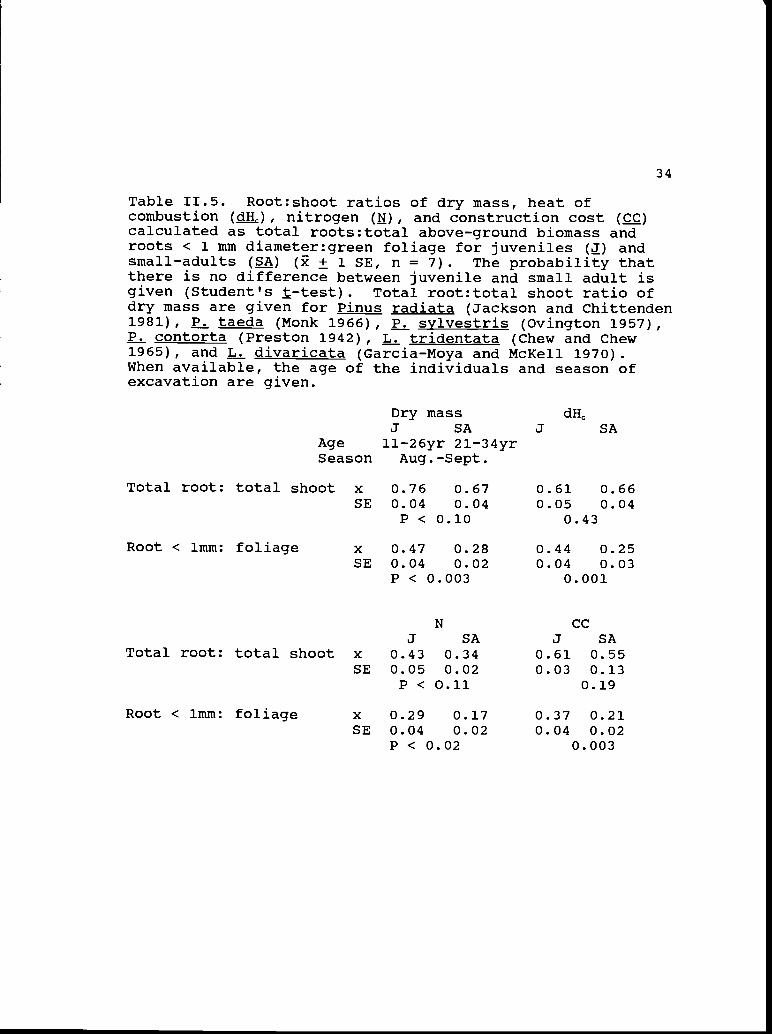
11.5 Root:shoot ratios of dry mass, heat of 34combustion, nitrogen, and construction costcalculated as total roots:total above-groundbiomass and roots < 1 mm diameter:greenfoliage.
11.6 Proportions by weight of macro- and micro- 38nutrient elements (Nitrogen = 100).
111.1 Mean maximum carbon dioxide assimilation, 57conductance, transpiration, and minimumintercellular concentrations from control,cut-top, and cut-root treatments.
111.2 Nitrogen concentrations (%) in foliage of 73juvenile and small-adult occidentalis fromcontrol, cut-top, and cut-root treatments.
III. 3
111.4
111.5
Mean concentrations of macro- and micro- 78nutrient elements in foliage collected inSeptember from controls.
Branchlet elongation, tree height, and trunk 82basal diameter, as a percentage of initialmeasurements.
Significance of comparisons of diurnal 87response curves of quantum-use efficienciesand water-use-efficiencies.
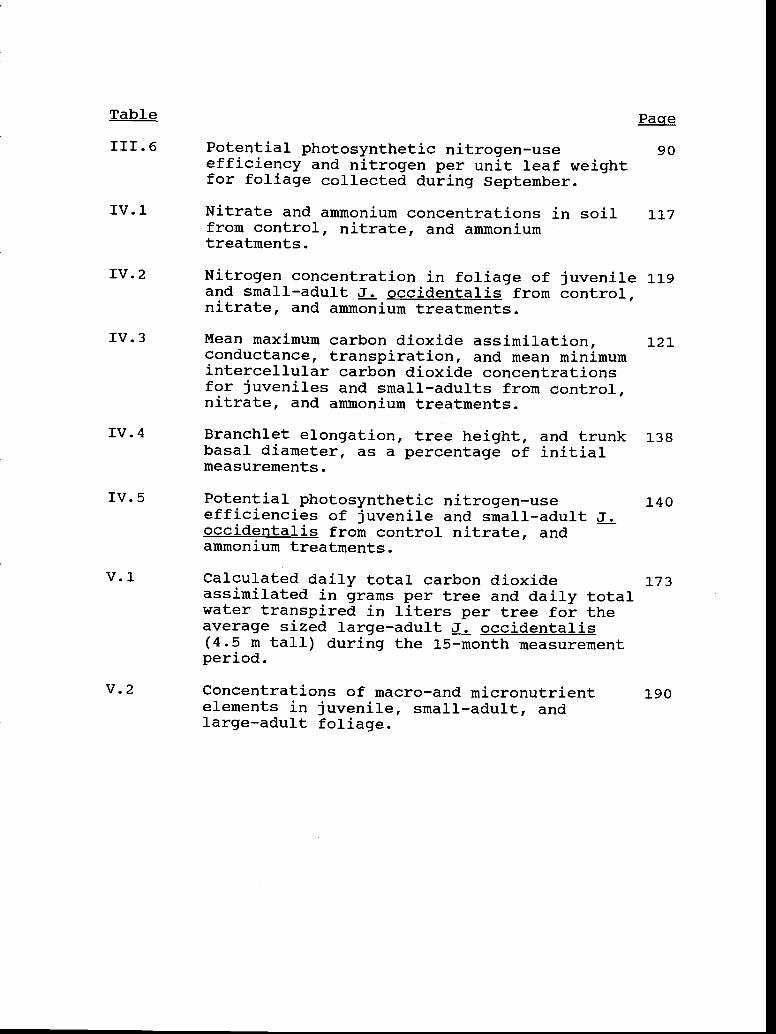
Table Page
111.6 Potential photosynthetic nitrogen-use 90efficiency and nitrogen per unit leaf weightfor foliage collected during September.
IV.l Nitrate and anunonium concentrations in soil 117from control, nitrate, and ammoniumtreatments.
IV. 2
IV. 3
4
IV.5
1
Nitrogen concentration in foliage of juvenile 119and small-adult J. occidentalis from control,nitrate, and ammonium treatments.
Mean maximum carbon dioxide assimilation,conductance, transpiration, and mean minimumintercellular carbon dioxide concentrationsfor juveniles and small-adults from control,nitrate, and ammonium treatments.
Branchlet elongation, tree height, and trunk 138basal diameter, as a percentage of initialmeasurements.
Potential photosynthetic nitrogen-useefficiencies of juvenile and small-adultoccidentalis from control nitrate, andammonium treatments.
Calculated daily total carbon dioxide 173assimilated in grams per tree and daily totalwater transpired in liters per tree for theaverage sized large-adult J. occidentalis(4.5 m tall) during the 15-month measurementperiod.
121
140
V.2 Concentrations of macro-and micronutrient 190elements in juvenile, small-adult, andlarge-adult foliage.
PHYSIOLOGICAL ECOLOGY OF WESTERN JUNIPER(JUNIPERUs OCCIDENTALIS HOOK.
SUBSP. OCCIDENTALIS)
I. INTRODUCTION
Juniperus occidentalis Hook. was first collected by
David Douglas in 1826 along the Columbia River. Since then
herbarium specimens of J. californica, J. osteosperma, and
J. occidentalis have been erroneously filed together under
all three specific names (Vasek 1966). Vasek (1966)
proposed dividing J. occidentalis into two subspecies, a
northern subspecies, occidentalis, as originally described
by Douglas, and a southern subspecies, J. occidentalis Hook.
subsp. australis Vasek, which occurs from Lassen County,
California, south through the Sierra Nevada to the San
Bernardino Mountains.
Juniperus occidentalis Hook. subsp. occidentalis
(hereafter referred to as J. occidentalis) is a single
stemmed, lancelolate-shaped tree that reaches a maximum
height of about 12 in and a maximum stem circumference of
1.8 m at 1.5 in above ground. It has brown bark and can be
dioecious or monoecious (Vasek 1966). Juvenile leaves are
awl-like and adult leaves are scale-like and have a
2
prominent gland on the dorsal surface (Hitchcock and
Cronquist 1987). Juniierus occidentalis and J. osteosperma
have a mixture of characteristics where their distributions
overlap; the two species probably hybridize (Vasek 1966).
Juniperus occidentalis is found in northeastern
California, northwestern Nevada, central and eastern Oregon,
southwestern Idaho, and southeastern Washington. It forms
the northwestern extension of the woodlands of the central
Great Basin (Vasek 1966). Juniperus occideritalis woodlands
merge with Pinus Ponderosa stands on moister sites and grade
into Artemisia tridentata communities as soil moisture
declines on adjacent shrub-steppes (Gholz 1980).
In central Oregon, J. occidentalis communities cover
1,145,670 ha and occur on all exposures and slopes at
elevations from about 500 to 2000 meters. Juniper
communities occupy the driest tree-dominated zone in the
Pacific Northwest where the climate is continental, modified
by Pacific marine air. Winters in the juniper zone are cold
and summers are hot and dry; precipitation varies from 25 to
51 cm, most of which falls during the winter as snow and as
rain during the spring and fall. Summer precipitation is
often low and erratic. Soils of juniper communities are
3
derived from a variety of parent materials of sedimentary,
igneous, and metamorphic origin (Dealey et al. 1978).
Expansion of J. occidentalis in western rangelands
during the past 100 years has been well documented
(Burkhardt and Tisdale 1969, Adams 1975, Carahar 1978, Young
and Evans 1981) and is attributed to altered fire frequency,
overgrazing by domestic livestock, and climatic changes
(Johnsen 1962, Burkhart and Tisdale 1976, Dealy et al.
1978). In the Great Basin the oldest J. osteosperina were at
intermediate elevations; younger trees invaded both up slope
and down slope (Tausch et al. 1981). Movement of juniper
seed is facilitated by the feeding habits of the Townsend's
solitaire (Mvades townsendi); juniper berries were the sole
constituent of its winter diet near Eagle Lake in north-
eastern California (Lederer 1977, Poddar and Lederer 1982).
Potential water use by J. occidentalis is high, due to
its large leaf biomass. The amount of water removed by
occidentalis transpiration may impact forage resources and
instream flow (Miller, Angell, Eddleman 1987). Plant
species associations, soil pH, base saturation, nutrient
cycling, and water availability are altered by the presence
of J. occidentalis canopies (Burkhardt and Tisdale 1969).
With the removal of J. occidentalis, forage production has
4
the potential to increase from 50 to 300 percent (Bedell and
Bunch 1978), but undesirable introduced annuals can also
increase if they were present in the community before
juniper removal (Evans and Young 1985).
Successful establishment and rapid growth of
occidentalis in sagebrush-grasslands has made western
juniper the visually dominate species on > 1 million ha in
eastern Oregon (Vasek 1966, Dealy et al. 1978). Fire kills
young J. occidentalis, but the herbaceous biomass needed to
sustain fire is often lacking in degraded rangelands.
Suppression of fire, its ineffectiveness with reduced fuel
loads, and the elimination of herbicide use on public lands
have reduced the options available to managers for dealing
with increasing populations of J. occidentalis.
Germination, initial establishment, and the juvenile
growth period are vulnerable stages in the life cycle of
occidentaljs. Based on field observations, it appears that
preferred germination and establishment sites of
occidentalis are under the canopy of Arteinisia tridentata
(Eddleman 1987). The pattern of J. occidentalis germination
and establishment under nurse plants may not have been
altered by range degradation. However, survival and growth
rate may have been enhanced by the elimination of
5
competition from perennial bunch grasses. Juniperus
occidentalis is slow to invade well established, non-
degraded grasslands where the perennial grass component is
intact (L. E. Eddleman, pers. comm.).
Juvenility in J. occidentaljs is not defined by the age
of the individual, but by the dominant leaf type present;
juvenile trees have primary leaves which are awl-like in
shape (Hayes 1960), while mature plants have small scale-
like leaves (Miller and Schultz 1987). Juvenile
occidentalis are often overlooked or ignored in reclamation
projects; this could be a serious oversight because resource
requirements of juveniles may be significantly larger than
their small stature implies.
Juniperus occidentalis has characteristics associated
with stress-tolerant, competitive species (Grime 1983).
Individual J. occidentalis survive for hundreds of years in
harsh, semi-arid environments and tolerate conditions where
resources are limited, but J. occidentalis also has the
competitive ability to invade established, good condition
sagebrush communities and effectively compete for limited
resources.
Information on the physiological ecology of
occidentalis can play a role in understanding how juniper

6
dominated ecosystems function, because physiological ecology
attempts to understand the processes by which organisms
interact with their environment. Rates of processes such as
carbon dioxide assimilation, water uptake and loss, nutrient
acquisition, and growth are sensitive to environmental
stress. Changes in rates of physiological processes can
indicate the fitness of individuals and may be the first
signals of instability in the ecosystem (Billings 1985).
The majority of ecophysiological studies of montane
conifers in western North America have focused on Pinus
Ponderosa (ponderosa pine), P. contorta (lodgepole pine),
Picea engelmannii (Englemann spruce), or Pseudotsuga
menziesii (Douglas-fir) (Smith 1985). Work on pinyon-
juniper communities has focused on community level dynamics,
water relations, or containerized seedLling studies (see
Everett 1987). Research on Great Basin cold desert species
has mostly considered the dominant shrub species Artemisia
tridentata, Atriplex confertifoija, and Ceratoides lanata
(Caidwell 1985)
Most of the data on the physiological ecology of
evergreen perennials in semi-arid environments is based on
research on scierophyllous trees and shrubs of the
mediterranean-climate regions of the world (Miller 1981,
7
Margaris and Mooney 1981, Mooney and Miller 1985, Specht
1988). Few data are available on conifers native to semi-
arid regions of western North America.
Ecophysiological measurements have been made on
Juniperus virginiana growing in the understory of mature
oak-hickory forests in central Missouri (Lassoie et al.
1983) and in old fields in southern Illinois (Ormsbee et al.
1976). Data were also available on carbon dioxide
assimilation of J. osteosperma on the east slope of the
Sierra Nevada (DeLucia et al. 1988). Water use by large-
adult J. occidentalis had been documented (Miller, Angell,
Eddleman 1987, Miller and Shultz 1987), but other
physiological processes characteristic of this successful
native perennial had not been studied.
Differences in physiological processes in juvenile and
mature foliage may contribute to the ability of
occidentalis to maximize resource capture as a juvenile and
conserve resources as a mature individual. Because
allocation is based on the concept that different structures
or activities are alternatives and that a gain in one is
offset by a loss in another (Harper 1977), allocation to
roots instead of shoots represents a cost that reduces the
photosynthetic capacity of the plant (Schulze et al. 1983).
8
Reduction of above-ground tissue in favor of below-
ground tissue may require maximum efficiency of above-ground
plant parts. Identification of conditions that reduce
efficiency of above-ground tissue may facilitate
understanding abiotic and biotic factors that reduce
survival of J. occidentalis during the juvenile growth
stage.
Documenting construction costs of root/shoot allocation
and physiological processes in juveniles, small-adults, and
large-adults should provide a basic understanding of the
functioning of juvenile and mature J. occidentalis and
insight into mechanisms that allow the persistence of
observed allocation patterns and the continued success of Loccidentalis in western rangelands.
Research on juvenile, small-adult, and large-adult
occidentalis was undertaken to document (1) patterns and
costs of root/shoot allocations, (2) the response to
reductions of above and below-ground tissue, (3) the
response to fertilization with two forms of nitrogen, and
(4) the seasonal course of physiological processes.
The study of allocation patterns was based on
laboratory analysis of J. occidentalis tissue collected by
Susanna Kramer as part of her masters progran in the

9
Department of Rangeland Resources at Oregon State
University. Tissue reduction and fertilization studies were
conducted in the field under ambient environmental
conditions as experimental manipulations on naturally
growing J. occidentalis. The site of this research was an
abandoned agricultural field on private property southeast
of Prineville, OR. Seasonal courses of physiological
processes were also measured on naturally growing trees
under ambient environmental conditions at a second research
site on Bureau of Land Management land southwest of Redmond,
OR.
The central hypotheses of the research were: (1) the
success of juvenile 3. occidentalis as an invader is related
to its allocation patterns, which promote initial root
growth at the expense of shoot growth, and to physiological
processes that enhance resource acquisition, and (2) the
success of mature J. occidentalis is related to its
conservative use of resources. The central hypotheses were
tested by a number of working hypotheses:
(1) Juniperus occidentalis can support a large below-
ground biomass because roots have a lower per gram energy
cost of production and lower concentrations of essential

10
macro- and micronutrient elements than does above-ground
tissue.
(2) Different allocation patterns exist between
juvenile and small-adult J. occidentalis depending on the
currency used to calculate the cost of allocation (energy or
nitrogen) (Abrahamson and Caswell 1982).
(3) On an energy basis, costs of producing above-
ground tissue are lower in juvenile J. occidentalis than in
small-adults; energy costs of roots are similar in the two
morphotypes.
On a nitrogen basis, costs of above-ground tissue
are higher in juveniles than small-adults; nitrogen costs of
roots are similar in the two morphotypes.
Juvenile J. occidentalis compensate for foliage
removal by increasing photosynthetic rates of remaining
tissues; photosynthetic rates of small-adults do not change
with foliage removal.
Lateral roots contribute more to nutrient and water
uptake than do roots located directly under the crown.
Growth and tissue nutrient concentrations are lower in
occidentalis with severed lateral roots than in control
trees with intact root systems.

11
When lateral roots are severed, predawn xylem
pressure potentials are more negative in small-adults than
in juveniles.
Roots within the 3 x radius of the projected crown
area of small-adult J. occidentalis can not support
transpirational demands of the tree during the summer stress
period.
Juvenile J. occidentalis utilize ammonium more than
nitrate; therefore, physiological processes of juveniles
respond more positively to ammonium addition than to
nitrate.
The ability of J. occidentalis to utilize ammonium
diminishes with age; therefore, small-adults show more
positive responses to nitrate addition than to ammonium.
Carbon dioxide assimilation and conductance are
higher in juvenile than mature foliage.
Large-adult J. occidentalis close their stomata at
-2.0 to -2.5 MPA, thus reducing the length of time they are
photosynthetically active; poor stomatal control in
juveniles lengthens their photosynthetic period.
Stomata of large-adult J. occidentalis close in
response to vapor pressure deficit rather than as a response
to the internal water status of the individual.

12
Stomata of juvenile 3. occidentalis are less
responsive to vapor pressure deficits than are stomata of
large-adults.
Leaf conductance in juveniles responds more to
soil water availability than to vapor pressure deficits.
Leaf temperatures of both juveniles and large-
adults are consistently within 2°C of air temperature; leaf
temperature does not influence stomatal behavior.
Nitrogen concentrations are higher in juvenile
than mature foliage.
High rates of carbon dioxide assimilation in
juveniles are correlated with higher nitrogen
concentrations.
Water-use-efficiency is higher in large-adults
when soil moisture is limited than when water is abundant.
Water-use-efficiency is higher in large-adults
than in juvenile 3. occidentalis. Tight stoinatal control in
mature foliage reduces water loss, but restricts carbon
dioxide uptake.
The conventional probability threshold, P 0.05, was
set as the statistical level of significance (Zar 1984);
actual probability levels are reported. Probability levels
as low as P < 0.25 are also included in the text to allow

13
subjective evaluation of differences between treatments and
controls where P > 0.05.
The dissertation has been divided into seven chapters.
The first chapter is the introduction. The following four
chapters detail the experimental research conducted on: (1)
allocation patterns of juvenile and small-adult
occidentalis (Chapter 2); (2) response of juvenile and
small-adult J. occidentaljs to reductions in above- and
below-ground tissue (Chapter 3); (3) response of juvenile
and small-adult J. occidentalis to nitrate and amiuonium
fertilization (Chapter 4); and (4) the seasonal course of
physiological processes in juvenile, small-adult, and large-
adult J. occidentalis (Chapter 5). The major results of the
research are summarized (Chapter 6) followed by the
bibliography (Chapter 7). The computer program written to
reduce the data collected with the Analytical Development
Corporation infrared gas analyzer system is included as
Appendix A.

II. ALLOCATION PATTERNS OF CARBON AND MINERALS
IN JUVENILE AND SMALL-ADULT
JtJNIPERtJS OCCIDENTALIS
14
15
ABS TRACT
Allocation patterns in juvenile and small-adult western
juniper (Juniperus occidentalis Hook. subsp. occidentalis)
were studied to understand how a successful, invasive,
native species balances the allocation of resources between
above-ground tissue to optimize photosynthetic capacity, and
below-ground tissue to maintain itself in a semi-arid
environment. Above and below-ground biomass, gross heat of
combustion, concentrations of macro-and micronutrient
elements, and construction costs were measured on 7 trees
with 100% juvenile foliage (juveniles) and 7 with both
juvenile and adult foliage (small-adults) from a site in
central Oregon. Adult foliage had the highest heat of
combustion, nitrogen concentrations, and construction cost.
Allocation patterns indicated a larger investment in
resources to above-ground than below-ground tissue in both
juvenile and small-adult J. occidentalis. The proportions
by weight of nutrient elements in juniper foliage were 1.3
to 29 times higher that the optimal proportions required for
maximum growth of Pinus sylvestris. The relatively high
nutrient status of J. occidentalis may indicate that
additional root biomass is not required to balance the
activity and relative growth rate of above-ground tissue.
16
Assuming that unrecovered fine roots were a similar
percentage of total root dry mass and that sampling errors
were similar between studies, J. occidentalis had high
root:shoot ratios when compared with other conifer species
from more mesic habitats and Larrea tridentata from more
xeric habitats. Compared with similar-aged individuals of
other species for which data are available, juvenile and
small-adult J. occidentaljs allocate larger proportions of
dry mass to foliage, to optimize photosynthetic capacity,
and to roots, to optimize water and nutrient acquisition;
the larger allocation to foliage and roots was accomplished
through reduction of allocation to branch/trunk.
17
INTRODUCTION
Evergreen perennial shrubs and trees growing in semi-
arid environments may invest resources in roots at the
expense of photosynthetic tissues to ensure long-term
survival (Monk 1966, Kuinmerow et al. 1981). Allocation of
resources to photosynthetic tissue compounds the initial
investment (Monsi 1960, Mooney and Chiariello 1984), while
allocation to roots minimizes the risk of desiccation and
death (Cowan 1986). An optimal allocation pattern should
balance resource acquisition so that no one resource is more
limiting than others (Schuize et al. 1983, Bloom et al.
1985, Pearcy et al. 1987).
Information concerning root:shoot ratios of native
species is needed to calculate allocation patterns of carbon
and essential elements and to estimate the balance and
tissue cost of above-ground photosynthetic tissue and below-
ground nutrient and water acquisition tissue. This
information will provide data to test models of optimal
allocation and will increase our understanding of how
allocation patterns influence plant survival and competitive
ability.
Pinyon-juniper woodlands occupy over 178 million ha in
the western United States (Forest-Range Task Force 1972).
18
Junipers are perennial evergreens that have extensive root
systems (Foxx and Tierney 1987, Tiedemann 1987). As a
consequence of overgrazing, fire suppression, and possible
climatic shifts, juniper species have increased in density
and extended their range in the Great Basin during the last
100 yr (Blackburn and Tueller 1970, Burkhardt and Tisdale
1969, 1976, Adams 1975, Young and Evans 1981, West 1984,
Davis 1987). Western juniper (Juniperus occidentalis Hook.
subsp. occidentalis) (Vasek 1966) successfully invades
Artemisia tridentata communities; competing shrub vegetation
has little or no effect on seedling establishment (Burkhardt
and Tisdale 1976, Eddleman 1987).
To understand how a successful, invasive, native
species balances the allocation of resources between above-
ground tissue, to optimize photosynthetic capacity, and
below-ground tissue, to maintain itself in a semi-arid
environment, we studied allocation patterns of carbon and
minerals in juvenile and small-adult J. occidentalis.

19
METHODS
During Aug./Sept., 1987, 14 J. occidentalis were
collected along Barr Road in central Oregon (44°l5'N, 1210
22'30"W). The collection site was in a J. occidentalis/
Artemisia tridentata subsp. vaseyana community at 1050 in
elevation on the west side of dine Buttes. The site was
similar to the Juniperus occidentalis/Artemisia
tridentata/Aqropyron spicatum-Chaenactis douglasii
Association described by Driscoll (1964). The nearest
standard weather station, Redmond, OR, receives an average,
annual precipitation of 213 mm (NOAA 1982). The sandy loam
soil at the research site is Mazama volcanic ash over tuff
and is classified as a skeletal, loamy, mixed, mesic aridic
Haploxeroll. The soil is well drained and has a uniform
texture to a restrictive layer of unweathered tuff at 1 in.
Seven trees with 100% juvenile foliage (juveniles) and
7 with both juvenile and adult foliage (small-adults) were
used for this study. Each J. occidentalis was carefully
excavated using hand tools to recover the tap root and
extensive lateral root system (Kramer 1990). Roots < 0.5 mm
diameter were recovered by hand excavation. Roots were
washed in a basin and divided into 3 diameter size classes,
< 1 mm, 1-5 mm, and > 5 mm. Only 1 juvenile J. occidentalis

20
had roots in the > 5 nun diameter size class. No ecto-
mycorrhizal hyphae were observed in association with the
juniper roots. The above-ground portion of each tree was
divided into juvenile foliage, adult foliage, and non-green
branch/trunk. Because of the awl-like and scale-like
morphology of juvenile and adult J. occidentalis leaves, no
attempt was made to separate leaves from green stems. All
tissue was oven dried at 85°C, weighed, and ground in a
Wiley mill using a 0.5 nun screen.
Foliage area was calculated for 7 juvenile and 7 adult
branchlets used in August, 1987, for carbon dioxide
assimilation measurements with a ADC portable infrared gas
analyzer system (Chapter 5). Area was calculated by
assuming juvenile leaves were 2 sided triangles attached to
a photosynthetically active cylinder. The number of leaves
per cm of length was counted and the total length and
diameter of each sample measured. Adult foliage was
considered to be cylindrical in shape; leaf area was
calculated from measurements of diameter and length.
The diameter and length of all of roots in the > 5 mm
size class were measured, and root surface area calculated.
After the weight of the roots < 1 mm and 1-5 nun dia. of an
individual tree was recorded, roots of similar size classes
21
were pooled. Root area was calculated by weighing ten
randomly chosen 10 cm long sub-samples of each of the two
pooled root diameter classes. Area was calculated assuming
the roots were cylindrical in shape. The surface area of
the < 1 mm and 1-5 mm root diameter classes was calculated
by multiplying the area of a subsample of a known weight by
the weight of that root size class of each tree (Kummerow et
al. 1978). Trees were aged by counting rings from sanded
trunk sections.
Gross heat of combustion was measured on duplicate
pellets made from each tissue type using a Parr 1241
adiabatic calorimeter and standard procedures (Parr
Instrument Co. 1975).
Seven samples of each tissue type were ashed in a
muffle furnace at 800 °C for 8 h. Seven additional samples
were digested in a Tecator block digester and analyzed for
total Kjeldahl nitrogen using an Altkem rapid flow auto-
analyzer at the Forest Sciences Dept., Oregon State
University.
Macro- and micronutrient elements were measured by
plasma emission spectroscopy at the U.C.L.A. Biomedical
Laboratory. Five replicates of above-ground and 2 of below-
ground tissues were measured.
Construction cost (CC) of each tissue type was
calculated using the equation:
= ((0.06968 * dH - 0.065) (1 - A) + kN * 180.15) * 1
14.0067 24 E9
where j is the heat of combustion in kJ/g, is the ash
content in g ash/g dry mass, kN the total Kjeldahl nitrogen
of the tissue in g/gdm, 180.15/24 is a correction for the
organic sulfur content of tissue, and the growth
efficiency (Williams et al. 1987). The deviation of from
100% represents the reductant that is not incorporated into
biomass but is used to gererate ATP through oxidative
phosphorylation (Williams et al. 1987). A value of 0.87,
which includes an estimate of membrane transport costs of
ATP, was used as an estimate of growth efficiency (Penning
de Vries et al. 1974). Uncorrected values for heat of
combustion were used to calculate tissue construction cost.
The significance of differences among the means of
tissue analysis from juvenile and small-adult
occidentalis were determined using ANOVA and Tukey tests.
Comparisons between two means used the Student's fl-test (Zar
1984)
22
23
RESULTS
The juvenile and small-adult J. occidentalis used in
this study formed two distinct groups, which had little
overlap in physical parameters (Table 11.1). Only one
juvenile was older or taller than a small-adult. The dry
mass of the largest juvenile was 50% of the dry mass of the
smallest small-adult; and trunk basal diameter and lateral
root spread in the largest juvenile were only 71 and 82%,
respectively, of the diameter and spread measured for the
smallest small-adult.
Of the tissue analyzed, adult foliage had the highest
heat of combustion, 20.9 kJ/g, significantly higher than
juvenile foliage on the same individual or juvenile foliage
on juvenile J. occidentalis (P <0.025) (Table 11.2). Heat
of combustion of juvenile and small-adult branch/trunk and
roots were similar and significantly lower than either
foliage type (P <0.025). Above-ground and below-ground
tissue contained 17-23% ash; ash contents of juvenile and
small-adult tissue were not significantly different (Table
11.2)
Adult foliage had the highest construction cost, 2.09 g
glucose/g dry mass, significantly higher than the cost of
producing juvenile foliage on small-adults or juveniles

Table 11.1. Range and median of physical parameters ofjuvenile and small-adult J. occidentalis.
Root surface area, m2 0.020-0.178 0.055
Foliage area, m2 0.015-0.086 0.037
Root surface area, m2 0.189-0.759 0.245
Foliage area, m2 0.122-0.417 0.188
24
Parameter
Small-adult(n = 7)
Range Median
Age, yr 21-34 26
Height, cm 41-75 60
Total dry mass, g 70-339 124
Trunk basal dia., mm 7-16 10
Lateral root spread, cm 306-570 380
Parameter
Juvenile(n = 7)
Range Median
Age, yr 11-26 15
Height, cm 21-41.5 28
Total dry mass, g 6-35 13
Trunk basal dia., mm 2-5 4
Lateral root spread, cm 80-250 185

25
Table 11.2. Mean heat of combustion (j), percent ash(Ash), and construction cost (CC) of above and below-ground tissue of juvenile (J) and small-adult ()occidentalis foliage (F), branch/trunk (B/T), and root() ( ± 1 SE, n = 7). Values within a column withdifferent letters are significantly different (TukeyTest, P < 0.025).
dH (kJ/g) Ash (%) CC (g glu/gdm)
J Juvenile F 20.0 ± 0.2a 22 ± la 1.90 ± 0.12a
SA Juvenile F 20.1 ± 0.2a 18 ± 2a 1.94 ± 0.loa
SA Adult F 20.9 ± 0.2b 17 ± 2a 2.09 ± 0.09b
J B/T 18.0 ± 0.2c 23 ± 2a 1.33 ± 0.06c
SA B/T 18.3 ± 0.8c 17 ± la 1.45 ± O.06c
JR 18.8 ± 0.lc 27 ± 2a 1.39 ± 0.02c
SAR 19.0 ± 0.6c 22 ± 2a 1.50 ± 0.05c

26
(P < 0.025) (Table 11.2). One grain of branch/trunk or
root tissue cost 28% less to produce than did foliage.
Adult foliage had significantly higher nitrogen
concentrations, 1.23% ± 0.04, than did juvenile foliage
on small-adults or on juveniles, 1.10% ± 0.05 and 1.14%
± 0.07, respectively (P <0.02) (Table 11.3). Nitrogen
concentrations in branch/trunk and root tissue were
similar, 0.47-0.49%, and less than half of the
concentration measured in foliar tissue. Nitrogen
concentration decrease as root diameter increases;
concentration in roots > 5 mm diameter was 0.25%.
Phosphorus concentrations in juvenile and adult
foliage were similar, 0.21-0.26%; concentrations in
roots < 1 mm diameter were 3-4 times higher than foliar
phosphorus concentrations (Table 11.3). Potassium
concentration in juvenile foliage from juvenile
occidentalis was significantly higher than potassium
concentrations in juvenile or adult foliage on small-
adults (P <0.01) (Table 11.3).
Concentrations of macro-nutrient elements relative
to biomass indicated that nitrogen, potassium, calcium,
and magnesium were concentrated in metabolically active
27
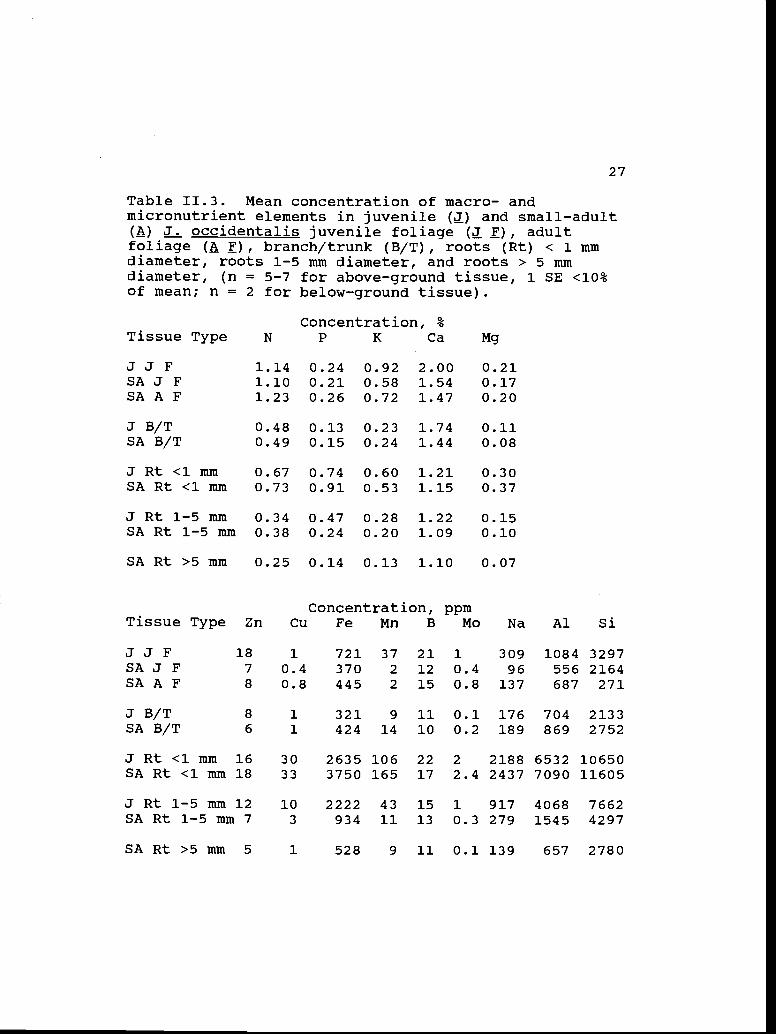
Table 11.3. Mean concentration of macro- andmicronutrient elements in juvenile () and small-adult(A) J. occidentalis juvenile foliage (! ), adultfoliage ( F), branch/trunk (B/T), roots (Rt) < 1 mmdiameter, roots 1-5 mm diameter, and roots > 5 mmdiameter, (n = 5-7 for above-ground tissue, 1 SE <10%of mean; n = 2 for below-ground tissue).
Tissue TypeConcentration, %
N P K Ca Mg
JJ F 1.14 0.24 0.92 2.00 0.21SA J F 1.10 0.21 0.58 1.54 0.17SA A F 1.23 0.26 0.72 1.47 0.20
J B/T 0.48 0.13 0.23 1.74 0.11SA B/T 0.49 0.15 0.24 1.44 0.08
J Rt <1 mm 0.67 0.74 0.60 1.21 0.30SA Rt <1 mm 0.73 0.91 0.53 1.15 0.37
J Rt 1-5 mm 0.34 0.47 0.28 1.22 0.15SA Rt 1-5 mm 0.38 0.24 0.20 1.09 0.10
SA Rt >5 mm 0.25 0.14 0.13 1.10 0.07
Concentration, ppmTissue Type Zn Cu Fe Mn B Mo Na Al Si
JJF 18 1 721 37 21 1 309 1084 3297SAJF 7 0.4 370 2 12 0.4 96 556 2164SAAF 8 0.8 445 2 15 0.8 137 687 271
JB/T 8 1 321 9 11 0.1 176 704 2133SAB/T 6 1 424 14 10 0.2 189 869 2752
J Rt <1 mm 16 30 2635 106 22 2 2188 6532 10650SA Rt <1 nun 18 33 3750 165 17 2.4 2437 7090 11605
J Rt 1-5 mm 12 10 2222 43 15 1 917 4068 7662SA Rt 1-5 mm 7 3 934 11 13 0.3 279 1545 4297
SARt>5mm 5 1 528 9 11 0.1 139 657 2780

28
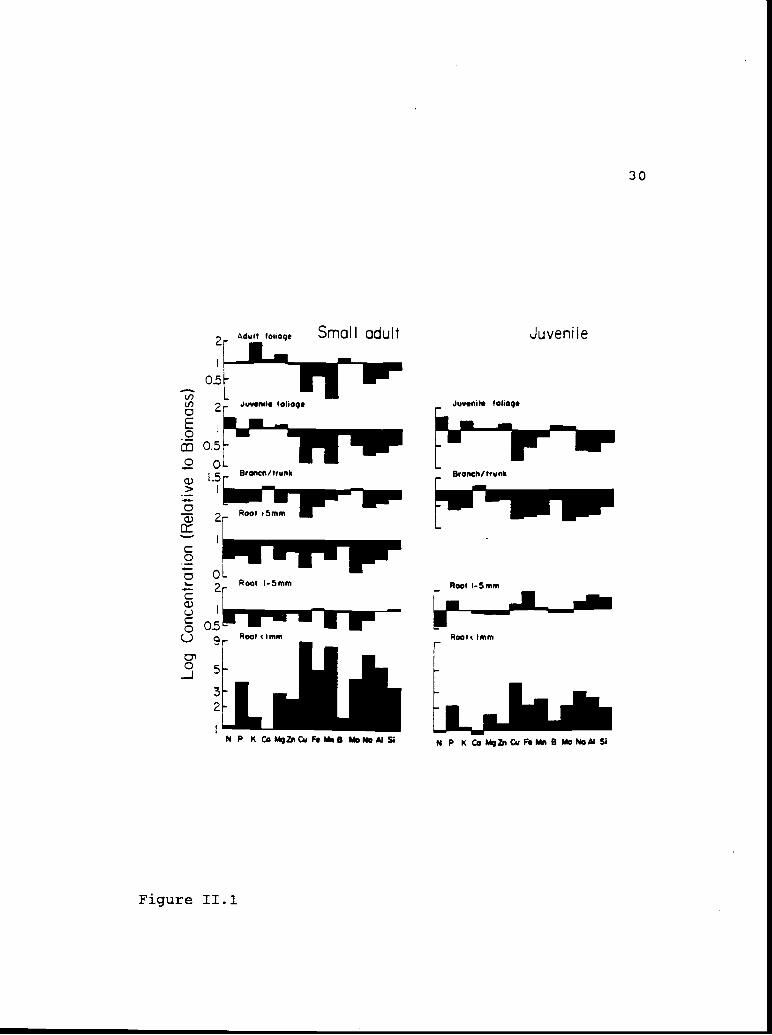
leaf tissue (Figure 11.1). Phosphorus was over-
represented relative to biomass in adult foliage, but
was under-represented in juvenile foliage from juvenile
and small-adult J. occidentalis. Most of the
inicronutrient elements were under-represented in all
tissue types except roots < 1 mm diameter.
Juveniles allocated less dry mass to above-ground
biomass than did small-adults, 57 vs. 60% (P <0.09)
(Table 11.4). Allocation to foliage was similar in
both plant types, but small-adults allocated more dry
mass to branches/trunk. Juveniles allocated a higher
percentage of dry mass to roots < 1 mm diameter than
did small-adults; over half of the total below-ground
dry mass of both plant types was in the 1-5 nun diameter
root class.
Above-ground bioinass contained 72-75% of the
total plant nitrogen (Table 11.4). Foliage which
constituted 35 and 33% of the total biomass in
juveniles and small-adults, respectively, contained 54
and 59% of the total plant nitrogen. Significantly
less nitrogen was allocated to branch/trunk in
juveniles than small-adults (P <0.02). Roots < 1 mm
diameter were allocated significantly more nitrogen in
29
Figure 11.1. Concentration of macro- and inicronutrientelements, relative to bioxnass, for juvenile and small-adult J. occidentalis tissue. A value of 1 indicatesallocation of the element to the tissue type is thesame as biomass allocation; values > 1 indicateconcentration and values < j. dilution of the element.
05
Figure 11.1
adult foliage Smaf I adult
.hzveniIe foliage
Brancti/trunk
Root 5mm
2
Root -5mm
Root Imnt
N P KCaMgZsiCuF.k,B M0NsAISI
Juvenile foliage
Branch/trunk
Root -5mm
Root 1mm
Juvenile
N P K Ca MqZn Cu F. i B Mo N0AI Si
30
2a)00
0'0532
31
Table 11.4. Allocation patterns, as % of total, fordry mass, heat of combustion (Jfj, Kjeldahl nitrogen(N), and construction cost (CC) for juvenile () andsmall-adult (SA) J. occidentalis to above-ground(Above-gr) and below-ground (Below-gr)
( ± 1 SE, n =7). Comparisons between juveniles and small-adultswithin a tissue type were different p <0.09 (*) or P<0.02 (**). Dry mass allocation patterns calculatedfor 3-8 yr Pinus radiata (Jackson and Chittenden 1981),15 and 25 yr Larrea tridentata (Chew and Chew 1965),Larrea divaricata (syn. L. tridentata) (Garcia-Moya andMcKell 1970), and for 14 and 23 yr Pinus sylvestris(Ovington 1957) are presented for comparison.
Total above-grTotal below-gr
Foliage
Dry mass,
J11-26 yr
57 ± 1*43 ± 1*
35±1
% of Total
SA21-34 yr
60±1*40 ± 1*
33±1
dH, % of Total
J SA
57±1 61±143 ± 1 40 ± 1
36 ± 1 35 ± 1Br/trunk 22 ± l** 27 ± 2** 21 ± l** 25 ± 2**
Root < 1 mm 16 ± 1** 8 ± 2** 16±1** 7±2**Root 1-5 mm 25 ± 2 23 ± 1 25 ± 1 23 ± 1Root > 5 mm 2 10 2 10
N, % of Total CC, % of Total
J SA J SA
Total above-gr 72 ± 2 75 ± 1 62±1 65±1Total below-gr 28 ± 2 25 ± 1 38±1 35±1Foliage 54±4 59±2 43 ± 1 41 ± 1Br/trunk 15±l** l9±l** 19 ± 1** 24 ±1**
Root < 1 mm 15 ± 9 ± 2** 16 ± l** 7 ±1**Root 1-5 mm 13±1 13±1 20±1 20±1Root > 5 mm 0.2 4 2 8

32
L. divaricatano age
P. sylvestris14 yr 23 yr
Total above-gr 78 69 69Total below-gr 22 31 31
Foliage 22 20 6Br/trunk 53 49 64
Root < 1 mmRoot 1-5 mm 22 19 9Root > 5 mm 12 21
Table 11.4 cont.Dry mass,
P. radiata% of TotalL. tridentata
3-8 yr 15 yr 25 yr
Total above-gr 80 77 80Total below-gr 20 23 20
Foliage 14 23 12Br/trunk 65 54 68
Root<lmm 6Root 1-5 mm 2 23 20Root>5mm 13

33
juveniles than were roots of the same diameter in
small-adults (P <0.02). Allocation of nitrogen to
larger root diameter classes was similar in juveniles
and small-adults.
Sixty-two to 65% of the total plant construction
cost was in above-ground tissue for both juvenile and
small-adult J. occidentalis (Table 11.4). The
percentage of construction cost of juvenile
branch/trunk was significantly lower and of root < 1 mm
significantly higher than were percentages of the
equivalent tissues from small-adults (P <0.02).
When total root dry mass was compared to total
above-ground dry mass, root:shoot ratios ranged from
0.55-0.76 for dry mass, heat of combustion, and
construction cost in juveniles and small-adults (Table
11.5). Root:shoot ratios for nitrogen were lower, 0.43
and 0.34; none of the ratios for juveniles and small-
adults were significantly different. Ratios of roots <
1 inn diameter to green foliage were 0.29-0.47 for
juveniles and 0.17-0.28 for small-adults (Table 11.5);
all ratios for juveniles were significantly higher than
ratios calculated for small-adults (P <0.02 - 0.001).
34
Table 11.5. Root:shoot ratios of dry mass, heat ofcombustion (dH.), nitrogen (N), and construction cost (Q)calculated as total roots:total above-ground biomass androots < 1 mm diameter:green foliage for juveniles () andsmall-adults (A) ( ± 1 SE, n = 7). The probability thatthere is no difference between juvenile and small adult isgiven (Student's fl-test). Total root:total shoot ratio ofdry mass are given for Pinus radiata (Jackson and Chittenden1981), P. taeda (Monk 1966), P. sylvestris (Ovington 1957),
contorta (Preston 1942), L. tridentata (Chew and Chew1965), and L. divaricata (Garcia-Moya and McKell 1970).When available, the age of the individuals and season ofexcavation are given.
Dry mass dHJ SA J SA
Age ll-26yr 2l-34yrSeason Aug.-Sept.
Total root: total shoot x 0.76 0.67 0.61 0.66SE 0.04 0.04 0.05 0.04
P < 0.10 0.43
Root < 1mm: foliage x 0.47 0.28 0.44 0.25SE 0.04 0.02 0.04 0.03
P < 0.003 0.001
N CCJ SA J SA
Total root: total shoot x 0.43 0.34 0.61 0.55SE 0.05 0.02 0.03 0.13
P < 0.11 0.19
Root < 1mm: foliage x 0.29 0.17 0.37 0.21SE 0.04 0.02 0.04 0.02
P < 0.02 0.003
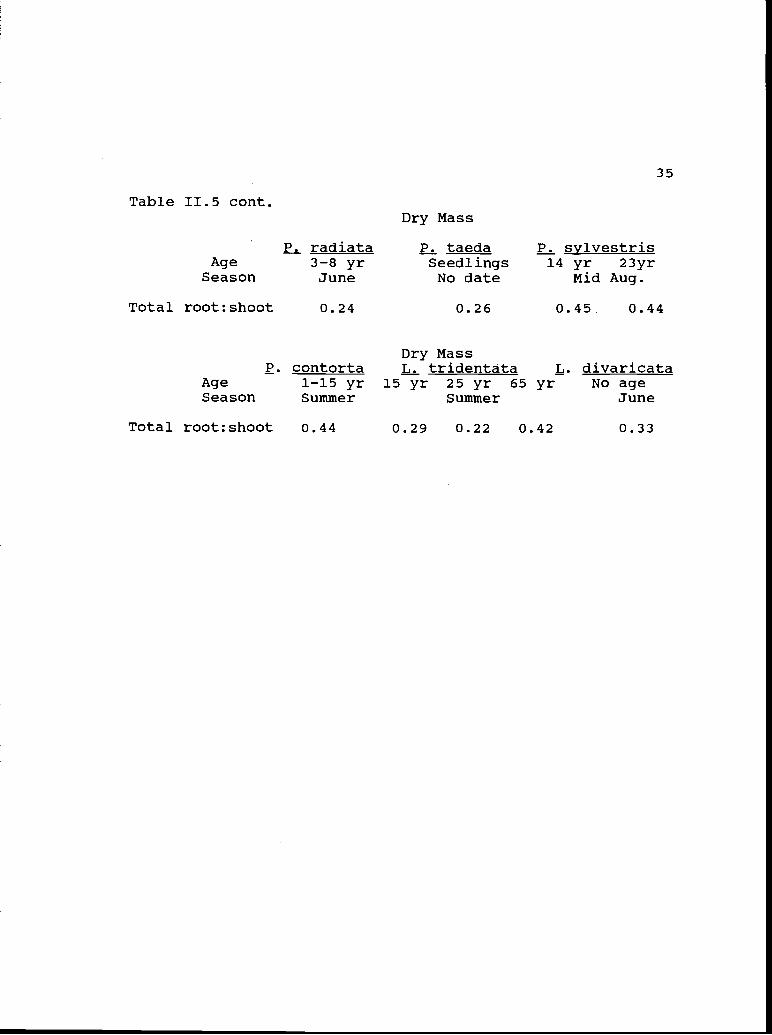
Table 11.5 cont.Dry Mass
P. radiata P. taeda P. sylvestrisAge 3-8 yr seedlings 14 yr 23yrSeason June No date Mid Aug.
Total root:shoot 0.24 0.26 0.45 0.44
Dry MassP. contorta L. tridentata L. divaricata
Age 1-15 yr 15 yr 25 yr 65 yr No ageSeason Summer Summer June
Total root:shoot 0.44 0.29 0.22 0.42 0.33
35
36
DISCUSSION
Allocation patterns within juvenile and small-adult
occidentalis indicate a larger investment in resources to
above-ground than below-ground tissue. Foliage of
occidentalis is expensive in terms of k Joules and
nutrients. The heat of combustion of J. occidentalis
foliage (20.0 to 20.9 kJ/g) was higher than the average
value for foliage of 57 species, 17.71 kJ/g, (Golley 1961),
but was similar to the 19.68 kJ/g measured for Larrea
tridentata shoots (Walters and Freeman 1983). Values for
occidentalis roots were within the 17.17-19.76 kJ/g reported
for roots of other species (Golley 1961, Barbour et al.
1977, Walters and Freeman 1983). The high k Joule content
of J. occidentalis foliage may be related to the chemical
composition of its volatile oils (Rudloff et al. 1980) which
may be a defense against herbivory (Schwartz et al. 1980).
Concentrations of essential nutrient elements in
foliage of J. occidentalis were higher than concentrations
reported for J. osteosperma (Wallace and Romney 1972,
Bunderson and Weber 1986). Nitrogen concentrations in
juvenile and adult 3. occidentalis foliage measured in this
study were 13-18% higher than concentrations of
osteosperma juvenile and adult foliage collected in
37
September and October but were lower than nitrogen
concentrations reported for Pseudotsuga menziesii (1.5%) and
Pinus sylvestris (1.3%) (Bunderson and Weber 1986).
Concentrations of phosphorus in adult J. occidentalis
foliage (Table 11.3) were -50% higher than concentrations
reported for J. osteosperina adult foliage in Utah and Nevada
(Wallace and Romney 1972, Bunderson and Weber 1986), but
lower than concentrations of phosphorus in summer foliage of
J. scopulorum in Colorado (Dietz et al. 1962).
The proportions by weight of nutrient elements, in both
juvenile and adult J. occidentalis foliage, were 1.3 to 29
times higher than the optimal proportions required for
maximum growth of P. sylvestris (Ingestad 1979, 1987); they
were also higher than proportions calculated using data for
juvenile and adult J. osteosperma (Bunderson and Weber 1986)
(Table 11.6). The relatively high nutrient status of Loccidentalis may indicate that additional root biomass is
not required to balance the activity and relative growth
rate of above-ground tissue (Troughton 1980).
Concentrations of iron, manganese, sodium, aluminum,
and silica were 3-82 times higher in J. occidentalis fine
root tissue than in foliage (Table 11.3). Because of the
techniques used in this study, we could not distinguish

38
Table 11.6. Proportions by weight of macro- andmicronutrient elements (Nitrogen = 100) in juvenile () andsmall-adult (SA) 3. occidentalis foliage and juvenile ()and adult (A) J. osteosperma foliage (Bunderson and Weber1986) compared to proportions considered optimal for maximumgrowth of P. sylvestris (Ingestad 1979, 1987).
P K Ca Mg Fe
3 3. occidentalis 21 78 175 18 0.06 0.03
SA 3. occidentalis 21 59 120 16 0.04 0.01
3 3. osteosperma 12 60 144 21 0.02 0.003
A 3. osteosperina 12 46 174 22 0.01 0.004
P. sylvestris 14 45 6 6 0.03 0.003

39
between elements within root tissue and those concentrated
outside the exoderinis. However, the differences in
concentrations indicate a build-up of these elements in the
root/rhizosphere compared with foliage. Fine roots may
either sequester or selectively exclude elements to reduce
their potentially harmful effects on foliage.
The cost of producing juvenile and small-adult
occidentalis foliage (Table 11.2) was higher than the 1.3,
1.6, or 1.7-1.8 g glu/g dry mass (gdm) calculated for
tussock tundra species, 2 pine species, and chaparral leaf
tissue (Miller and Stoner 1979, Chung and Barnes 1977,
Merino et al. 1982). The cost of branch/trunk and root
tissue in small-adult J. occidentalis was similar to the 1.5
g glu/gdm for Pinus elliottii tissue (Chung and Barnes
1977). Not only was foliage of J. occidentalis costly to
produce, but juvenile and small-adult J. occidentalis had
1.5-5.7 times as much foliage dry mass as similar aged Pinus
species or L. tridentata (Table 11.4). The high proportion
of dry mass in 3. occidentalis foliage was balanced by a
reduction in branch/trunk; 3. occidentalis had less than
half the allocation to branch/trunk dry mass measured in
Pinus and Larrea (Table 11.4).
40
Compared to young Pinus and Larrea, J. occidentalis
allocated a larger portion of total dry mass to roots (Table
11.4). As discussed previously, increased root biomass may
not be needed for the nutrient balance of J. occidentalis
shoots, but may be required to support transpirational loss
of water (Cowan 1986). If precipitation is low or
seasonally unavailable, plants may allocate more biomass to
below-ground tissue as part of their water relations
strategy (Kuminerow 1980). Root:shoot ratios of perennial
arid land plants, however, are highly variable (Barbour
1973, Kummerow 1980). Root/shoot ratios of 6.7 and 11 were
reported for Atriplex confertifolia and Ceratoides lanata
dominated communities in Utah (Caidwell 1975).
In semi-arid environments, a precipitation event must
yield 15 mm of moisture to produce a shrub response (Charley
1972). Two summers of conductance data for juvenile and
small-adult J. occidentaljs at the Barr Road research site
indicated mid-morning stoinatal closure, with no afternoon
recovery, only in early October 1988, after a 4-month period
without a 15 mm precipitation event (Chapter 5).
Based on the 30-yr precipitation record for Redmond, OR
(NOAA 1982), which is the closest reporting station to the
research site, the probability of a 4-month summer period
41
without a 15 mm precipitation event is 35% (Chow 1976).
During 2 out of 3 years, juvenile and small-adult root
systems seem to be adequate to support daily conductance
without mid-morning stomatal closure.
The total investment in the below-ground system may be
much larger than the 0.4-0.43 fraction estimated in this
study (Table 11.4). Because of potential incomplete
recovery of fine roots, our data may underestimate below-
ground biomass of J. occidentalis. Data are not available
on the cost of growth and maintenance respiration, seasonal
turnover, annual replacement, or exudations from
occidentalis roots. Costs of maintaining root systems of
established perennial plants may be higher than the cost of
biomass present at any point in time (Caidwell 1979). In a
P. sylvestris plantation, where roots were 20% of the total
biomass, annual root production was 60% of total production;
it was estimated that the fine root system was replaced 6
times during the year (Agren et al. 1980, Persson 1983).
Root:shoot ratios are important in assessing carbon
allocation above and below-ground, but incomplete recovery
of fine roots and lack of information on seasonal root
turnover make comparisons between communities difficult
(Kuinmerow 1980). Assuming that unrecovered fine roots were
42
a similar percentage of total root dry mass and that
sampling errors were similar between studies,
occidentalis had high root:shoot ratios compared to other
conifer species from more inesic habitats and L. tridentata
from more xeric habitats. Juvenile J. occidentalis with a
median age of 15-yr and small-adults with a median age of 26
yr had root:shoot ratios 1.5-3.5 times higher than 4 Pinus
species and L. tridentata of similar ages (Table 11.5).
However, root:shoot ratios of 0.6-1.1 have been reported for
Larrea (Wallace et al. 1974, Ludwig et al. 1975, Ludwig
1977). The large range of root:shoot ratios for J.
tridentata may be age dependent (Ludwig 1977), related to
the varied water relations of desert plants, or because
selection for specific root:shoot ratios is weak in desert
xerophytes (Orians and Solbrig 1977).
The ratio of absorbing root surface to
photosynthetically active leaf area may be more important
than total root:shoot ratios to resource acquisition
(Kummerow 1980). In September when our measurements were
made, calculated ratios of root < 1 mm diameter surface
area:leaf area were 1.68 ± 0.014 and 1.58 ± 0.17 ( ± 1 SE,
n = 7) for juvenile and small-adult J. occidentalis,
respectively. The larger root surface area than foliage
43
area may indicate that for J. occidentalis in central Oregon
water is more limiting than carbon. The above-ground/below-
ground ratios of resource gathering tissue of
occidentalis were more balanced and smaller than ratios of
4.7-14.5 calculated for 1.5 yr old chaparral shrubs grown in
root boxes under varying water regimes (Kummerow 1980).
Differences in the ages of the plants and techniques
probably account for much of the variation in root
surface:leaf area ratios calculated in these two studies.
Factors other than water stress may influence the
carbon and nutrient allocations in arid systems (Kummerow
1980). If competing roots are present, allocation to roots
may increase in order to obtain the same quantity of
resource that are available in a non-competitive situation;
additional roots may be produced to increase competitive
effectiveness (Caidwell 1987). The large investment in
roots by J. occidentalis, compared to similar-aged plants of
other species, may be more than is required to procure water
and nutrients and may serve primarily to increase its
competitive effectiveness.
The ability of J. occidentalis to invade shrub
communities in semi-arid environments may be enhanced by its
allocation patterns. Compared to similar-aged species for

44
which data are available, juvenile and small-adult
occidentalis used in this study allocate larger proportions
of dry mass to foliage, to maximize photosynthetic capacity,
and to roots, to maximize water and nutrient acquisition;
the larger allocation to foliage and roots was accomplished
by reducing the allocation to branch/trunk.

45
ACKNOWLEDGEMENTS
The research was supported in part by the Agricultural
Experiment Station, Oregon State University. I want to
thank E. M. Romney and the University of California, Los
Angeles, Biomedical Laboratory for the sample analysis and
A. R. Tiedemann, J. Kummerow, G. w. Cox, R. L. Pendleton,
and one anonymous reviewer for reviewing drafts of the
manuscript. J. M. Miller assisted with the calorimeter
measurements.
This paper is Technical Paper 8876, Oregon Agricultural
Experiment Station.
III. THE RESPONSE OF WESTERN JUNIPER (JUNIPERUS
OCCIDENTALIS) TO REDUCTIONS IN ABOVE-
AND BELOW-GROUND TISSUE
46
47
ABSTRACT
Plants are balanced systems that integrate processes of
carbon fixation and uptake of water and nutrients to
optimize resource acquisition. Response of Juniperus
occidentalis to reductions in above and below-ground tissue
was measured to determine effects on carbon dioxide
assimilation, leaf conductance, intercellular carbon
dioxide, xylem pressure potential, foliar nutrient
concentration, above-ground growth, and quantum (QUE), water
(WUE), and potential photosynthetic nitrogen-use (PPNUE)
efficiencies. Removing approximately 50% of the foliage
increased rates of carbon dioxide assimilation and PPNUE but
did not improve water status as measured by xylem pressure
potentials, increase growth, or increase nitrogen
concentrations of remaining foliage. Cutting lateral roots
reduced assimilation, conductance, foliage nitrogen
concentration, branchlet elongation, OUE, and PPNUE.
By late August, juvenile and small-adult J. occidentalis in
the cut-top treatment had compensated for foliage removal by
reestablishing patterns of quantum and water efficiencies
similar to efficiencies measured in controls, which may
indicate that an overall metabolic control was functioning
to regulate the balance between carbon dioxide assimilation
and water loss. Cutting lateral roots had a more lasting
effect on efficiencies, which by late August were still
significantly lower in the cut-root treatment than in
controls.
48

49
INTRODUCTION
Plants are considered to be balanced systems that
integrate processes of carbon fixation by shoots and uptake
of water and nutrients by roots to optimize resource
acquisition (Schuize et al. 1983, Bloom et al. 1985, Pearcy
et al. 1987). Reduction of above or below-ground tissue
(e.g. by herbivory or chemical defoliation) may alter this
balance. Responses to tissue removal can provide
information on the significance of compensatory, short-term,
physiological responses and of longer term growth
adjustments to disturbing the balance of resource
acquisition tissue (Mooney and Chiariello 1984); these
responses may function to reestablish optimization.
Western juniper (Juniperus occidentalis Hook. subsp.
occidentalis) (Vasek 1966) is an invasive, native evergreen
tree that is distributed over 1,145,670 ha in central Oregon
(Dealy et al. 1978). As a consequence of overgrazing, fire
suppression, and possible climatic shifts, J. occidentalis
has increased in density and extended its range in central
Oregon during the last 100 yr (Young and Evans 1981).
Responses of J. occidentalis to reductions in above and
below-ground tissue were measured to determine effects on
carbon dioxide assimilation, leaf conductance, above-ground
growth, and light, water, and nitrogen-use efficiencies.
Objectives of this study were to measure compensatory
response of physiological processes to removal of
approximately 50% of the foliage and to measure
contributions of lateral roots to physiological processes
and above-ground growth.
50
51
METHODS
The research site, an abandoned agricultural field last
cultivated about 1975, was located 8 km southeast of
Prineville in central Oregon (44°l5tN, 120°45'W). The site
is a gentle northwest-facing slope at 1270 m elevation below
a 1560 m mesa; seasonal springs in the area indicated some
subsurface water flow. The soil is a well drained Frigid
Pachic Argixeroll derived from basaltic parent material,
with a uniform texture down to a layer of fractured basalt
at 50 cm. The abandoned field was dominated by
Chrysothamnus nauseosus Nutt. and Bromus tectorum L. Small
Juniperus occidentalis were scattered throughout the field.
The tallest J. occidentalis was 122 cm in height, only a few
cm taller than neighboring C. nauseosus.
Annual precipitation at Redmond (35 km west, elevation
1025 m) averages 217 mm, 89% of which occurs from October to
June (NOAA 1982). During April-September 1988, monthly
precipitation at Redmond was 29.1, 9.7, 24.6, 0, 8.1, and 0
mm, for a total of 71.5 mm. The 30 yr average monthly
precipitation for the 6 month period at Redmond is 11.7,
22.9, 21.1, 7.4, 12.3, and 9.4 mm, for a total of 84.8 mm
(NOAA 1982).

52
Twenty-one J. occidentalis with 100% juvenile foliage
(juveniles) and 21 with predominately adult foliage (small-
adults) (de Laubenfels 1953) were used in this research.
Seven sets of trees were selected each containing three
juveniles and three small-adults. One of three treatments,
control, cut-top, or cut-root, was randomly assigned to one
juvenile and one small-adult in each set, using Monte Carlo
methods.
On April 5-6, 1988, approximately 50% of the foliage
was removed from lateral branches beginning with the oldest
foliage on a branch (cut-top treatment). The pattern of
foliage removal mimicked that of chemical defoliants.
Lateral roots were severed at the canopy edge to a depth of
36 cm using a sharp-shooter shovel (cut-root treatment). To
remove regrowth from the severed lateral roots, roots were
recut at the edge of the canopy on May 17, June 10, and July
20, 1988.
Diurnal measurements of physiological processes were
made April 18, May 10-11, July 9-10, 15, and August 26-27-
28, 1988. During 1 day of the measurement period, one
juvenile and one small-adult from each of the three
treatments were measured to establish a detailed diurnal
course of physiological parameters (intensive measurements).
53
Plants used in the intensive measurements were measured 18
times during the day in April/May and 12 times per day in
both July and August. During each of the other 2 days, a
similar suite of measurements was made on three juveniles
and three small-adults from each treatment (extensive
measurements); measurements on each tree were repeated twice
in the morning and twice in the afternoon. Different sets
of individuals were used for the intensive measurements
during April, July, and August.
Carbon dioxide assimilation and relative humidity were
measured using an Analytical Development Corp. LCA-2
portable infrared gas analyzer system. Leaf conductance,
transpiration, and intercellular carbon dioxide
concentrations were calculated. Photon flux density (400-
700 nm) was measured with a LiCor 190 SB quantum sensor;
leaf and air temperatures were measured with fine gauge
copper/constantan thermocouples and a Campbell Scientific CR
10 data logger, Xylem pressure potentials were measured
with a PMS Instruments pressure chamber. Data were analyzed
using a BASIC program based on equations from Wexler (1976,
1977) , Nobel (1983), Campbell (1986), and Ball (1987)
Leaf area was calculated for tissue used in carbon
assimilation measurements by assuming that juvenile leaves

54
resembled two-sided triangles attached to a
photosynthetically active cylinder. The number of leaves
per cm of length was counted and total length and diameter
of each sample measured. Adult tissue was considered to be
cylindrical in shape; leaf area was calculated from
measurements of diameter and length. Area measurements were
used to calculate specific leaf mass. Carbon dioxide
assimilation was reported per gram foliage dry mass,
becasuse measurements of dry mass were considered more
reliable than leaf area measurements.
Foliar tissue was collected for nutrient analysis in
May, July, and September. Due to the awl-like and scale-
like morphology of juvenile and adult occidentalis
leaves, no attempt was made to separate leaves from green
stems. During September, foliage from juveniles and small-
adults was separated into old tissue, grown prior to
treatment application, and new foliage, grown after the
foliage reduction and cut-root treatments were applied in
April. All tissue was dried, weighed, and ground in a Wiley
mill using a size 40 screen. Subsamples were analyzed for
total Kjeldahl nitrogen using an Altkem rapid flow auto-
analyzer at the Forest Sciences Department Oregon State
University. Concentrations of macro- and micronutrient
55
elements and 13C/12C ratios were measured at the U.C.L.A.
Biomedical Laboratory on tissue collected during September.
Ratios of '3C/2C were measured on one composite sample of old
or new foliage from each treatment.
Elongation growth of five lateral branchlets per tree
was measured on May 3, July 5, and September 7-8; tree
height from the ground surface and trunk basal diameter in
two directions were measured on May 6 and August 25. Soil
moisture was measured gravimetrically on May 13, July 20,
and August 25 (Hillel 1971). On July 20 a composite soil
sample was collected from 0-30 cm depth in an interspace
area between trees and analyzed for nutrients at the Soil
Testing Laboratory, Oregon State University.
The significance of differences between control and
treatment means were determined using Student's t-test (Zar
1984). Two-tailed Mann-Whitney test was used to compare
response curves of physiological processes (Potvin and
Lechowicz 1988). Correlation and regression analysis were
conducted using StatgraphicsR (STSC Inc. 1987).
56
RESULTS
Carbon dioxide assimilation
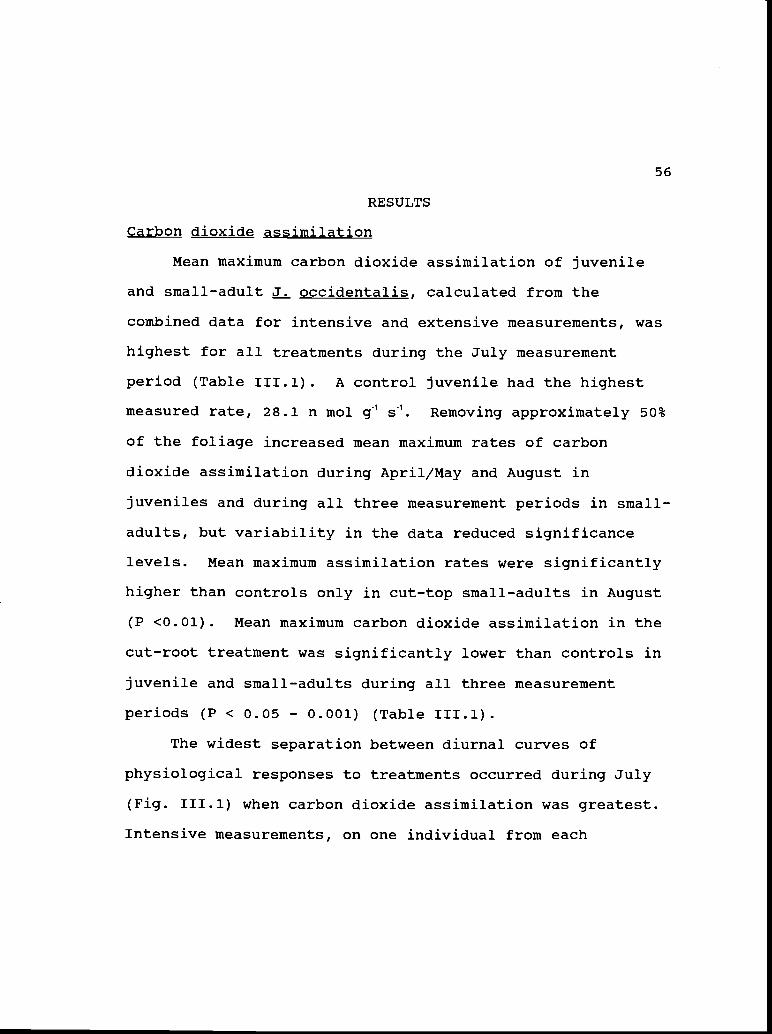
Mean maximum carbon dioxide assimilation of juvenile
and small-adult J. occidentalis, calculated from the
combined data for intensive and extensive measurements, was
highest for all treatments during the July measurement
period (Table 111.1). A control juvenile had the highest
measured rate, 28.1 n mol g s1. Removing approximately 50%
of the foliage increased mean maximum rates of carbon
dioxide assimilation during April/May and August in
juveniles and during all three measurement periods in small-
adults, but variability in the data reduced significance
levels. Mean maximum assimilation rates were significantly
higher than controls only in cut-top small-adults in August
(P <0.01). Mean maximum carbon dioxide assimilation in the
cut-root treatment was significantly lower than controls in
juvenile and small-adults during all three measurement
periods (P < 0.05 - 0.001) (Table 111.1).
The widest separation between diurnal curves of
physiological responses to treatments occurred during July
(Fig. 111.1) when carbon dioxide assimilation was greatest.
Intensive measurements, on one individual from each
Cut-root 8.7 ± 1.5P < 0.05
Small-adultControl 10.6 ± 1.4
Cut-root 6.2 ± 0.9P < 0.001
JuvenileControl 481 ± 26
Cut-top 545 ± 48
Cut-root 278 ± 30P < 0.001
Small-adultControl 350 ± 36
Cut-root 213 ± 17P < 0.001
10.7 ± 2P < 0.001
Cut-top 11.0 ± 1.3 16.0 ± 1.6
8.1 ± 0.9P < 0.001
Conductance, ji mol g1 s
Cut-top 368 ± 29 317 ± 26
13.7 ± 1.0 9.9 ± 0.4
431 ± 26 166 ± 17
419±37 178±22
207 ± 27 ill ± 15P < 0.001 P < 0.03
288 ± 31 165 ± 15
5.8 ± 1.4P < 0.01
12.9 ± 0.8P < 0.01
6.3 ± 0.6P < 0.001
207 ± 14P < 0.07
57
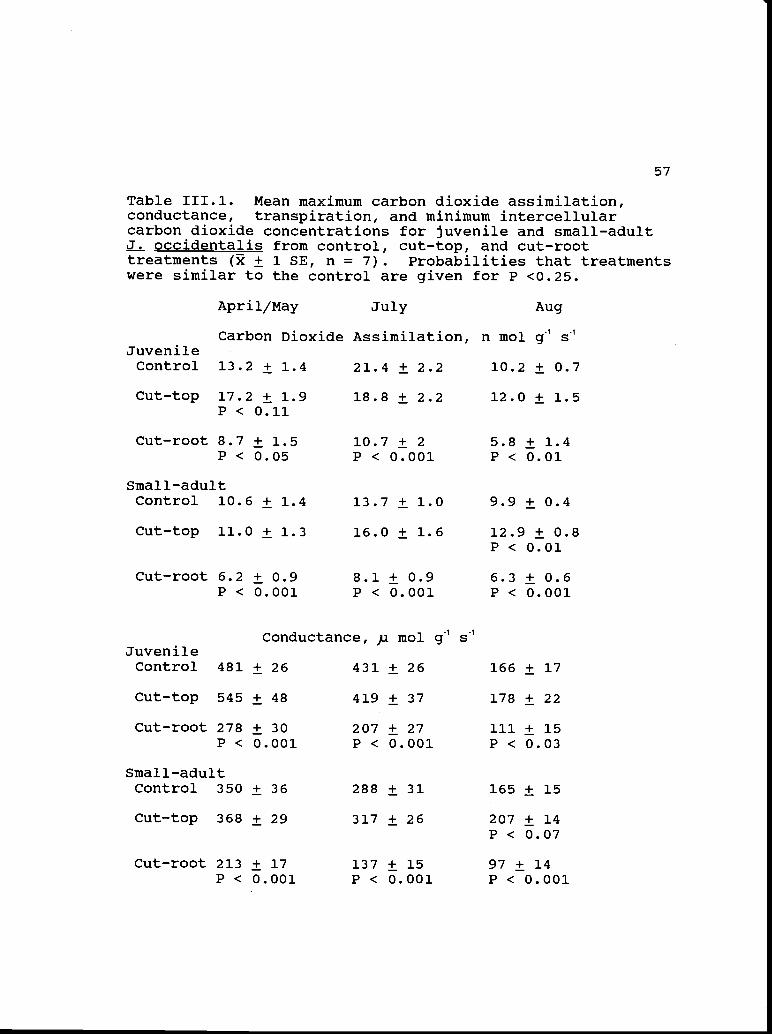
Table 111.1. Mean maximum carbon dioxide assimilation,conductance, transpiration, and minimum intercellularcarbon dioxide concentrations for juvenile and small-adultJ. occidentalis from control, cut-top, and cut-roottreatments (i ± 1 SE, n = 7). Probabilities that treatmentswere similar to the control are given for P <0.25.
Apri 1/May July Aug
Carbon Dioxide Assimilation, n mol g1 sJuvenileControl 13.2 ± 1.4 21.4 ± 2.2 10.2 ± 0.7
Cut-top 17.2 ± 1.9 18.8 ± 2.2 12.0 ± 1.5P < 0.11
137 ± 15 97 ± 14P < 0.001 P < 0.001
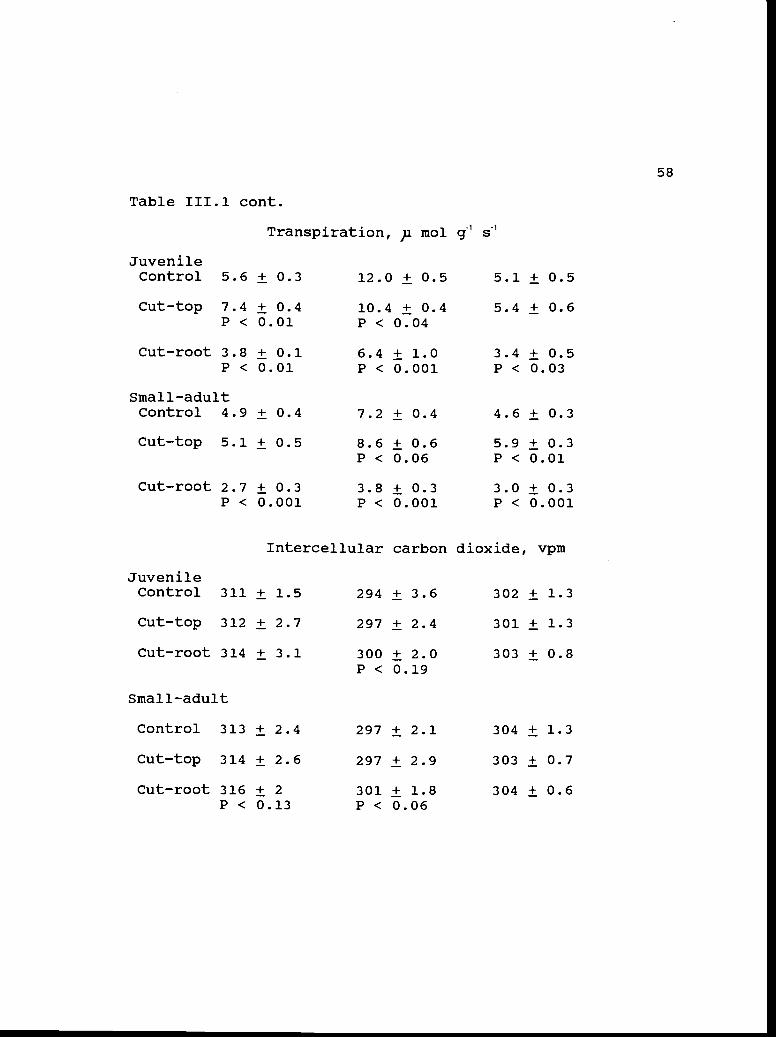
Table 111.1 cont.
58
Cut-root 2.7 ± 0.3 3.8 ± 0.3 3.0 ± 0.3P < 0.001 P < 0.001 P < 0.001
Intercellular carbon dioxide, vpm
JuvenileControl 311 ± 1.5 294 ± 3.6 302 ± 1.3
Cut-top 312 ± 2.7 297 ± 2.4 301 ± 1.3
Cut-root 314 ± 3.1 300 ± 2.0 303 ± 0.8P < 0.19
Small-adult
Control 313 ± 2.4 297 ± 2.1 304 ± 1.3
Cut-top 314 ± 2.6 297 ± 2.9 303 ± 0.7
Cut-root 316 ± 2 301 ± 1.8 304 ± 0.6P < 0.13 P < 0.06
Juvenile
Transpiration, p mol g1 s
Control 5.6 ± 0.3 12.0 ± 0.5 5.1 ± 0.5
Cut-top 7.4 ± 0.4 10.4 ± 0.4 5.4 ± 0.6P < 0.01 P < 0.04
Cut-root 3.8 ± 0.1 6.4 ± 1.0 3.4 ± 0.5P < 0.01 P < 0.001 P < 0.03
Small-adultControl 4.9 ± 0.4 7.2 ± 0.4 4.6 ± 0.3
Cut-top 5.1 ± 0.5 8.6 ± 0.6 5.9 ± 0.3P < 0.06 P < 0.01
59
Figure 111.1. Diurnal course of intensive measurements madeon July 10, 1988 of (a) PPFD, vapor pressure deficit, leaftemperature, (b) carbon dioxide assimilation, (C)conductance and (d) intercellular carbon dioxide injuvenile
( ) and small-adult (S) occidentalis fromcontrol ( ), cut-top (_ _), and cut-root (. -)treatments.

H
Inte
rcel
lula
r C
arbo
n D
,oxi
de, v
pm
CO
2 A
ssim
ilatio
n. n
moP
g' s
1-
10 4I
II
I
10
Pho
ton
Flu
x D
ensi
ty (
400-
700n
m),
,m
ol m
a -I
0
Vap
or P
ress
ure
II
Def
icit.
kPo
0
Lea
f T
WIp
erat
ufe,
C £
Con
duct
once
.r m
ol g
s'
0g II
I
61
treatment on July 10, followed the typical measured pattern
of higher assimilation rates for juveniles than small-adults
in control, cut-top, and cut-root treatments (Fig. III.lb).
Juveniles from all three treatments had highest assimilation
rates in the morning, followed by a mid-day depression and
late afternoon recovery. Control and cut-top small-adults
had a broad diurnal pattern of carbon dioxide assimilation.
Rates in cut-root small-adults were initially similar to
those of control and cut-top small-adults but declined and
remained low throughout the day (Fig. III.lb).
Diurnal response curves of carbon dioxide assimilation
were compared using a 2-tailed, nonparametric Mann-Whitney
test on the intensive and extensive measurements for each of
the three measurement periods (Potvin and Lechowicz 1988).
The diurnal course of assimilation in the cut-top treatment
was significantly higher than controls in juveniles during
April/May and small-adults in August (P <0.05). Compared to
controls, the cut-root treatment significantly reduced
assimilation in juveniles and small-adults during all three
measurement periods (P <0.05). The results of the Mann-
Whitney test substantiated the pattern of significant
differences between treatments found when only the mean

62
maximum values were compared using the Student's fl-test
(Table 111.1).
Leaf conductance and transpiration
Mean maximum leaf conductance of water vapor was
highest in all treatments during the April/May measurements,
213-545 )i mol g1 s1; by August conductance was reduced by
about 67% in juveniles and by about 50% in small-adults
(Table 111.1). The trend was toward higher conductance in
the cut-top treatment, but comparisons with controls
approached the p <0.05 significant level only for small-
adults during August (Student's fl-test, p <0.07). Mean
maximum conductance in juveniles and small-adults from the
cut-root treatment was significantly lower than controls
during all three measurement periods (p <0.03 - 0.001).
The diurnal pattern of intensive measurements of
conductance on July 10 indicated highest conductance during
the early morning in juveniles and small-adults from all
treatments (Fig. III. lc). Conductance declined throughout
the day with some afternoon recovery in control and cut-top
juveniles.
Diurnal response curves for conductance from the
intensive and extensive measurements were significantly
higher than controls in cut-top juveniles in April/May and

63
in cut-top small adults in August (Mann-Whitney 2-tailed
test, P <0.05). Compared to controls, the cut-root
treatment significantly reduced the diurnal course of
conductance in juveniles and small-adults during all three
measurement periods (P <0.05). Mann-Whitney comparisons of
the diurnal course of conductance were able to discriminate
between treatment and control responses (Potvin and
Lechowicz 1988). However, differences between mean maximum
conductance of control and cut-top juveniles in April/May
were not significant using Student's i-tests (Table 111.1).
Although conductance was highest during April/May, mean
maximum transpiration was highest during July due to lower
vapor pressure deficits during July (Table 111.1). The cut-
top treatment significantly increased transpiration compared
to controls in juveniles during April/May (P <0.01) and in
small-adults during July and August (P <0.06 and 0.04).
However, cut-top juvenile transpiration was significantly
lower than controls in July (P <0.04). The cut-root
treatment consistently reduced transpiration in both
juveniles and small-adults compared to controls (P < 0.03 -
0.001) (Table 111.1).
Data to accurately assess stomatal limitation of carbon
assimilation (Farquhar and Starkey 1982) are not available
64
for this study; however, stomatal limitation is indicated by
a linear relationship between carbon dioxide assimilation
and conductance (Field and Mooney 1983). Combined data for
all three measurement periods indicated that carbon dioxide
assimilation and leaf conductance were significantly
correlated in juvenile and small-adult J. occidentalis from
control, cut-top, and cut-root treatments (for juveniles r =
0.60, 0.60, 0.73, respectively, P <0.001, n = 112; for
small-adults r = 0.63, 0.53, 0.75, respectively, p <0.001, n
= 112, respectively).
Intercellular carbon dioxide
Calculated mean minimum intercellular carbon dioxide
concentrations () were 86-92% of ambient reference carbon
dioxide concentrations (340 volume per million, vpm) for
juvenile and small-adult J. occidentalis in all treatments
during the three measurement periods (Table 111.1).
Intercellular carbon dioxide was higher than controls in
cut-root juveniles during July (P <0.10) and in cut-root
small-adults during April/May (P <0.13) and July (P <0.06).
The lowest , 292 vpm, was measured in a cut-top juvenile
J. occidentalis during July.
The diurnal pattern of on July 10 indicated some
differences between treatments within the narrow range of

65
calculated values, 292 to 320 vpm (Fig. III.ld). The
lowest g, values were in juveniles from the control and cut-
top treatments, the highest values were in small-adults from
the cut-top and cut-root treatments.
The small range and large number of equal values
reduced the ability of the Mann-Whitney test to discriminate
between g from control, cut-top, and cut-root treatments.
Within a monthly measurement period, none of the diurnal
response curves was significantly different than controls.
Xylem pressure potential
Pre-dawn and mid-day xylem pressure potentials declined
during the summer season; the most negative potentials, -5.5
to -6.5 MPa, were measured in control and cut-root juveniles
during August (Fig 111.2). The treatments did not produce
significant differences in xylem pressure potentials in
April/May; however, in July mid-day xylem pressure
potentials of cut-top small-adult and cut-root juvenile and
small-adult J. occidentalis were significantly more negative
than controls (P <0.02). By August, variability in juvenile
xylem pressure potentials masked treatment effects, and only
the cut-root small-adult treatment was more negative than
controls (P <0.06).

66
Figure 111.2. Pre-dawn, mean minimum, and absolute minimumxylem pressure potentials (MPa) of juvenile (J) and small-adult (SA) J. occidentalis from control (C), cut-top (CT),and cut-root (CR) treatments during April/May, July, andAugust. Treatments were different than controls during July(P < 0.02, ) and August (P < 0.06, A).
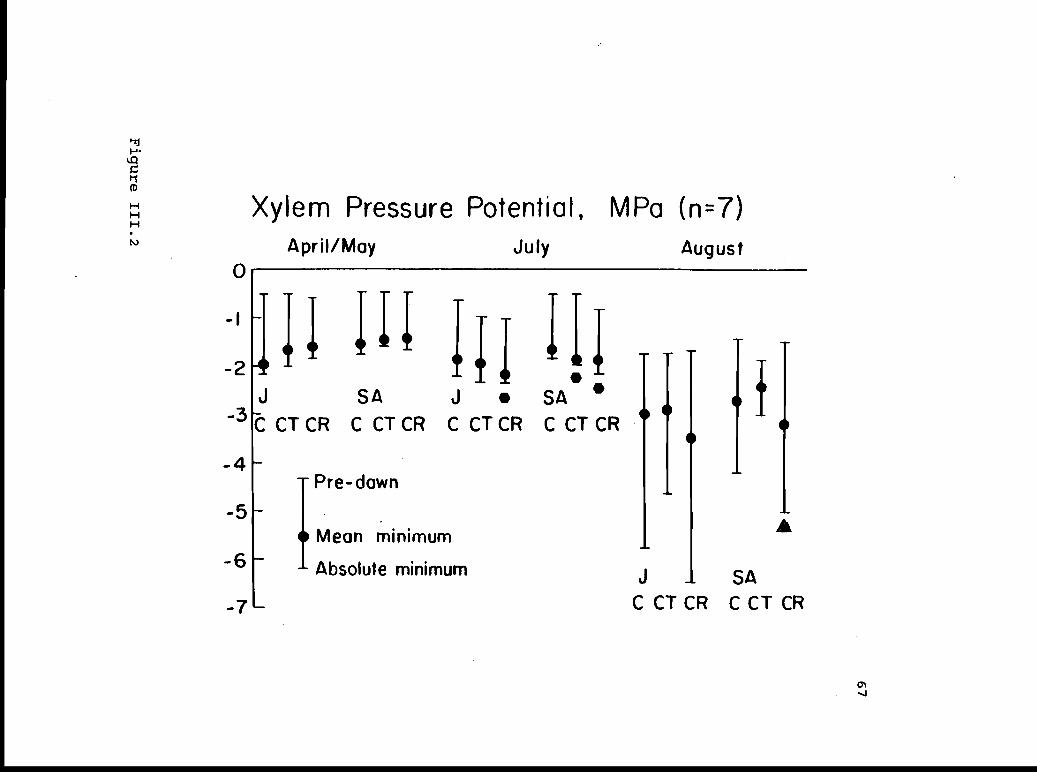
Xylem Pressure Potential, MPa (n=7)April/May Juiy August
0
-2!"J SA J S4
CTCR C CTCR C CTCR C CTCR
-4Pre- down
-5Mean minimum A
-6 Absolute minimum J SA
-7 CCTCR CCTCR

68
13C/12C ratios
Carbon isotope ratios were similar for juveniles and
small-adults, based on composite samples of similar aged
foliage collected during August from controls. Old foliage
6 13C values were -25.7 and -25.5 0/00 for control juveniles
and small-adults; new foliage values were -23.4 and -23.4
0/00 respectively. Juvenile old foliage fron the cut-top
and cut-root treatments had 613C values similar to control
old foliage, -25.0 and -25.7 0/00. Old foliage of cut-top
small-adults was less negative than controls, -23.2 0/00; 6
13C of old foliage from cut-root small-adults was similar to
control values, -25.3 0/00 6 3C values of new foliage of
cut-top juveniles and small-adults were -27.9 and -25.0
°/oo; new foliage of cut-root juveniles and small-adults had
613C values of -24.4 and -23.0 0/00
Potential maximum response
The probable upper limit of observations based on all
the data from all three measurement periods, i.e. potential
maximum responses (Jarvis 1976), indicate that, for
juveniles and small-adults, carbon dioxide assimilation in
the cut-top treatment was higher and in the cut-root
treatment lower than in the controls at similar
photosynthetically active photon flux densities (PPFD) (Fig.
69
III.3a). Except for control juveniles at PPFD below 400
mol m2 s1, response to PPFD was consistently higher in
juveniles than in small-adults in all three treatments.
Control and cut-top juvenile J. occidentalis did not appear
to be light saturated at levels of PPFD measured in the
field in central Oregon.
Juvenile and small-adult J. occidentalis had broad
potential maximum carbon assimilation response curves with
changes in leaf temperature (Fig. III.3b). Treatments did
not consistently alter the shape of the response curve.
Carbon assimilation rates were 90% of mean maximum (Table
111.1) with leaf temperatures from 12-33 °C in all
treatments except control juveniles and cut-top small
adults, where rates were 90% of mean maximum from 20-33 °C.
In all treatments except the small-adult control, maximum
carbon dioxide assimilation occurred between leaf
temperatures of 25-30 °C and declined sharply with
temperatures above 33 °C.
Data from all three measurement periods indicated that
decreasing xylem pressure potentials had the greatest effect
on potential maximum response of conductance in juveniles
from the cut-top treatment; conductance declined rapidly as
xylem pressure potentials decreased from -1 to -3 MPa (Fig.
Figure 111.3. Probable upper limits (potential maximumresponse) of carbon dioxide assimilation with (a) measuredPPFD and (b) leaf temperatures and of conductance with (c)measured xylem pressure potentials and (d) vapor pressuredeficits for juvenile ( A) and small-adult ( )occidentalis. Upper boundary curves, drawn by hand, bounddata from intensive and extensive measurements for all threemeasurement periods.
70
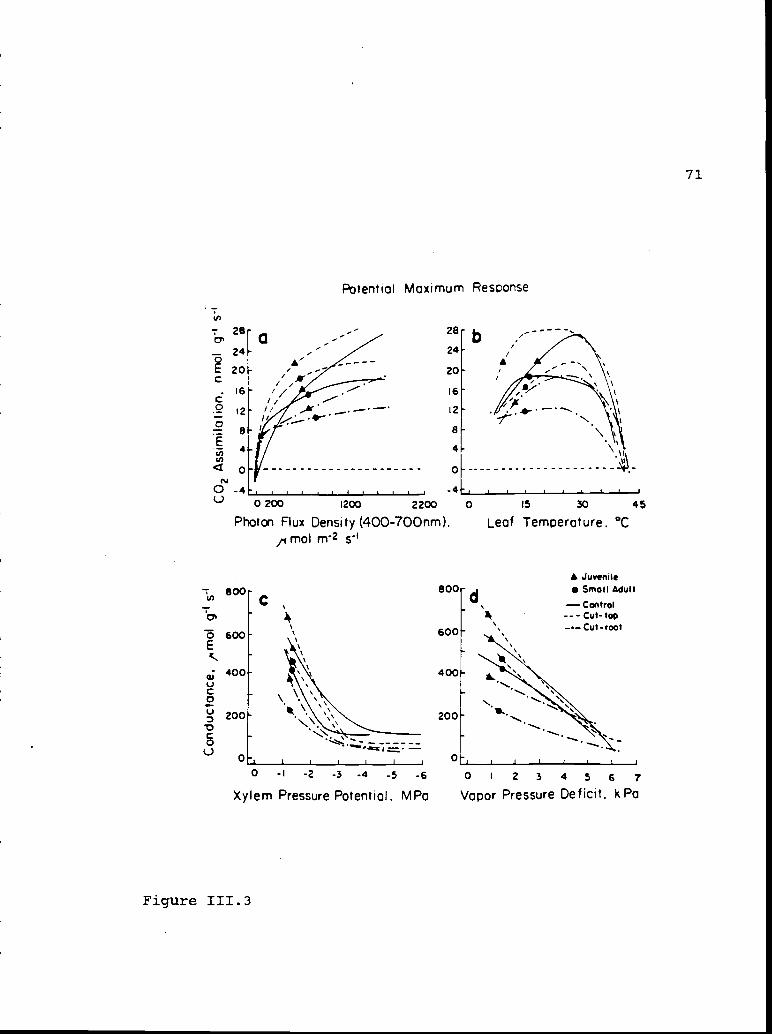
-800al
600E
400UC0
200
C0U
0
Figure 111.3
C'-
0 -1
Potential Moxirrtun'i Response
28- -- 28-al C- 24- -- 24-2 2O- ' 20C.16 I' 6
C.2 I2- I' .- 2
8- 8
EIn -
- 4'I,
c 0
0 -4 I
0 200 1200 2200 0
Photon Flux Density (400-700nm).p mol rn2
I
-2 -3 -4 -5 -6
eood
it'
15 30 45
Leaf Temperature. °C
£ JuvenileSmoli Adult
Control-. - Cut- top
Cut-root
I
0 I 23 45 6 7
Xylem Pressure Potential. MPo Vapor Pressure Deficit. kPo
71
600
400
N200
-I I 0 -

72
III.3c). Conductance in controls leveled of f at about 150 u
inol g1 s and did not decrease further as xylem pressure
potentials declined from -4 to -6 MPa in juveniles and from
-2.5 to -4 MPa in small-adults. Low conductance in the cut-
root treatment, < 100 mol g1 s1, was maintained as xylem
pressure potentials declined from -2.5 to -6 MPa.
Conductance of cut-top juveniles and small-adults was
higher than controls with vapor pressure deficits of 1 - 2.5
kPa (Fig. III.3d). Increasing vapor pressure deficits from
2.5 - 6 kPa affected conductance similarly in control and
cut-top juveniles and small-adults. Low conductance in the
cut-root treatments responded least to increasing vapor
pressure deficits; however, the highest conductance at vapor
pressure deficits lower than 5.5 kPa was measured in cut-
root juveniles.
Foliar nutrients
Highest nitrogen concentration, 1.44%, was measured in
cut-top small-adult foliage in May (Table 111.2). Nitrogen
concentrations in cut-top juvenile and small-adult
occidentalis were similar to controls during all measurement
periods. The cut-root treatment significantly reduced
nitrogen concentrations in both juvenile and small-adult
foliage in July and September (P <0.03 - 0.001). By
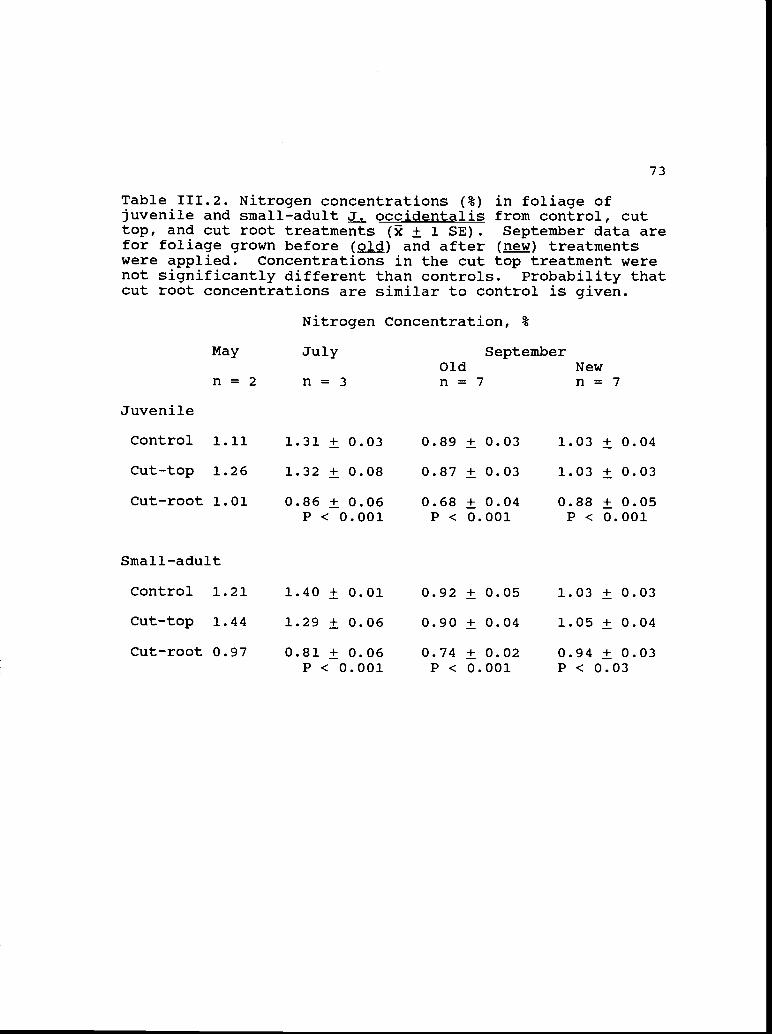
73
Table 111.2. Nitrogen concentrations (%) in foliage ofjuvenile and small-adult J. occidentalis from control, cuttop, and cut root treatments
( ± 1 SE). September data arefor foliage grown before () and after () treatmentswere applied. Concentrations in the cut top treatment werenot significantly different than controls. Probability thatcut root concentrations are similar to control is given.
May
n=2Juvenile
Nitrogen Concentration, %
July SeptemberOld New
n=3 n=7 n=7
Control 1.11 1.31 ± 0.03 0.89 ± 0.03 1.03 ± 0.04
Cut-top 1.26 1.32 ± 0.08 0.87 ± 0.03 1.03 ± 0.03
Cut-root 1.01 0.86 ± 0.06 0.68 ± 0.04 0.88 ± 0.05P < 0.001 P < 0.001 P < 0.001
Smal 1-adult
Control 1.21 1.40 ± 0.01 0.92 ± 0.05 1.03 ± 0.03
Cut-top 1.44 1.29 ± 0.06 0.90 ± 0.04 1.05 ± 0.04
Cut-root 0.97 0.81 ± 0.06 0.74 ± 0.02 0.94 ± 0.03P < 0.001 P < 0.001 P < 0.03
74
September, more nitrogen may have been translocated from old
foliage to new foliage in juveniles than in small-adults
from the cut-root treatments; juvenile old foliage, grown
prior to treatment application, had lower nitrogen
concentrations than old small-adult tissue.
Maximum carbon dioxide assimilation, during all three
measurement periods, was positively correlated with foliage
nitrogen concentration in control and cut-top juveniles (r =
0.77 and 0.77, p <o.00i, n = 21) and in control and cut-top
small-adults (r = 0.65, p <o.00i, n = 21 and r = 0.49, p <
0.05, n = 21). Correlations were not significant in either
the juvenile or small-adult cut-root treatment (r = 0.42 and
0.14). An envelope enclosing the data indicated that the
relationship between maximum assimilation rates and nitrogen
concentration was more variable for juveniles from all three
treatments than it was for small-adults (Fig. 111.4). Both
assimilation and nitrogen concentration were reduced by the
cut-root treatment; distribution of values in the cut-root
treatment was disjunct from the other two treatments (Fig.
111.4).
Concentrations of most macro-and micronutrient elements
were similar in both old and new foliage from control
juvenile and small-adult J. occidentalis (Table 111.3).
Figure 111.4. Envelopes enclosing the data for therelationships between maximum carbon dioxide assimilationand foliar nitrogen concentration for juvenile
( A ) andsmall-adult
( ) J. occidentalis during all threemeasurement periods from control
( ), cut-top (-and cut-root ( -) treatments.
75
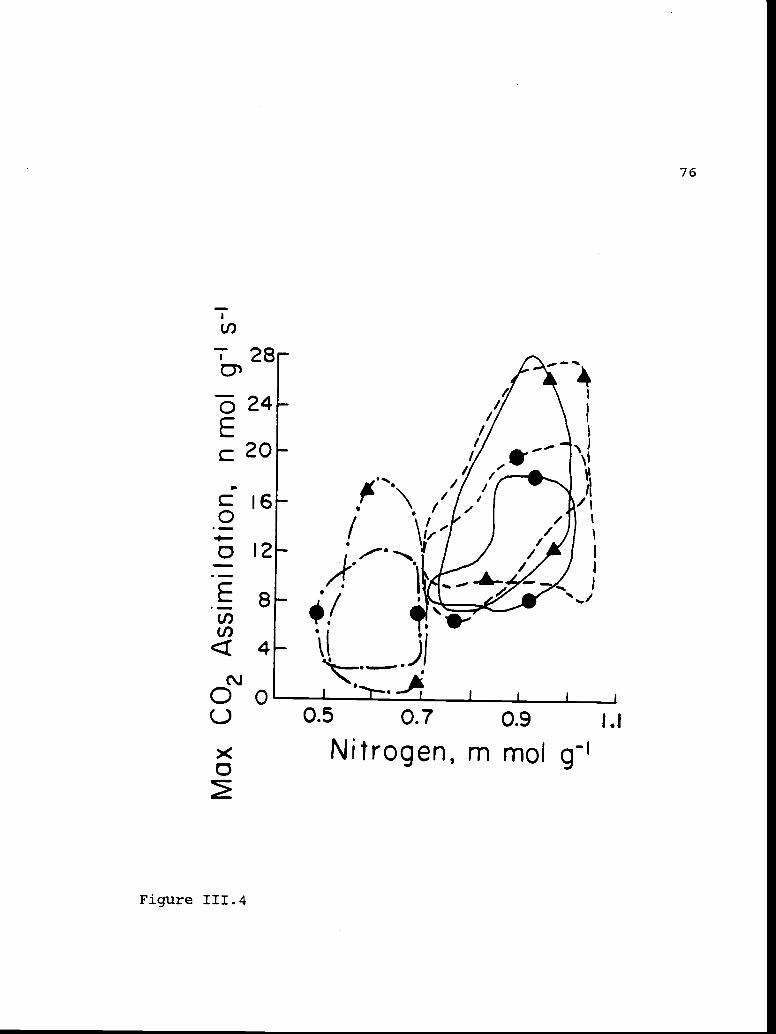
- ///
/ _./ S/ I,/ / 4I / /
/ /'If
,
'Ao 12-I- I,
U)
I I00 I
0 0.5 0.7 0.9
Nitrogen, m mol gH0
(I)
T2824
E20
Figure 111.4
76
77
Concentrations of sodium, aluminum, and silicon were,
respectively, 2.2-2.9, 1.7-1.8, and 1.3-1.5 times higher in
old foliage of juveniles and small-adults than in their new
foliage (Table 111.3). Relative to the controls, cut-top
new foliage of juveniles and small-adults had no elements
concentrated by > 10% (Fig. 111.5). Foliage of cut-root
juveniles had ten elements concentrated by > 25% in new
tissue grown after treatment application; small-adult new
foliage from the cut-root treatment had five of the ten
elements concentrated by > 10% (Fig. 111.5).
Specific leaf mass
During the 1988 summer, mean specific leaf mass (J)
of foliage from control juvenile and small-adults had a
seasonal pattern of decline from April to July with some
increase in August, i.e. from 208, 114, to 115 g m2 in
juveniles and from 297, 224, to 250 g m2 in small-adults.
Compared to controls, the cut-top treatment significantly
increased sri in juvenile foliage during July (Student's -
test, p <0.04). The cut-root treatment increased in
juveniles during July (P <0.06) and August (P <0.001) and in
small-adult foliage during all three measurement periods (P
<0.06, <0.001, <0.09).
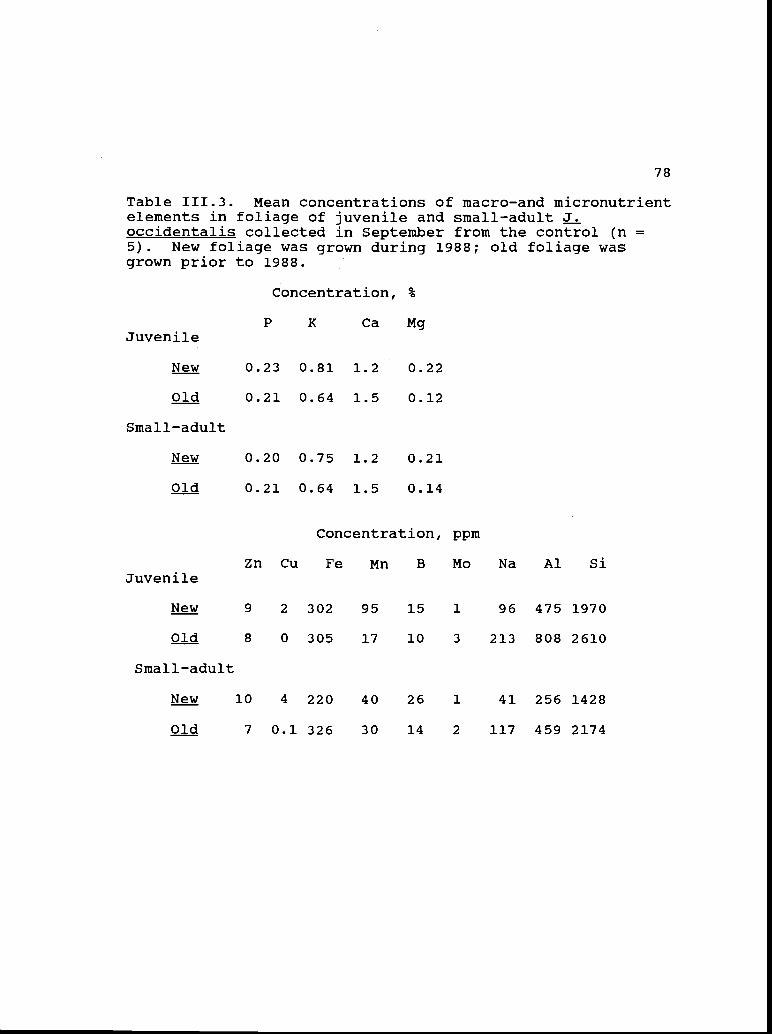
78
Table 111.3. Mean concentrations of macro-and micronutrientelements in foliage of juvenile and small-adultoccidentalis collected in September from the control (n =5). New foliage was grown during 1988; old foliage wasgrown prior to 1988.
Concentration, %
P K Ca MgJuvenile
New 0.23 0.81 1.2 0.22
Old 0.21 0.64 1.5 0.12
Small-adult
New 0.20 0.75 1.2 0.21
Old 0.21 0.64 1.5 0.14
Concentration, ppm
Zn Cu Fe Mn B Mo Na Al SiJuvenile
9 2 302 95 15 1 96 475 1970
Old 8 0 305 17 10 3 213 808 2610
Small-adult
New 10 4 220 40 26 1 41 256 1428
Old 7 0.1 326 30 14 2 117 459 2174

79
Figure 111.5. Log concentrations, as a percent ofconcentration in control tissue, of macro and micro-nutrientelements in new and old foliage of juvenile and small-adultJ. occidentalis from cut-top and cut-root treatments.
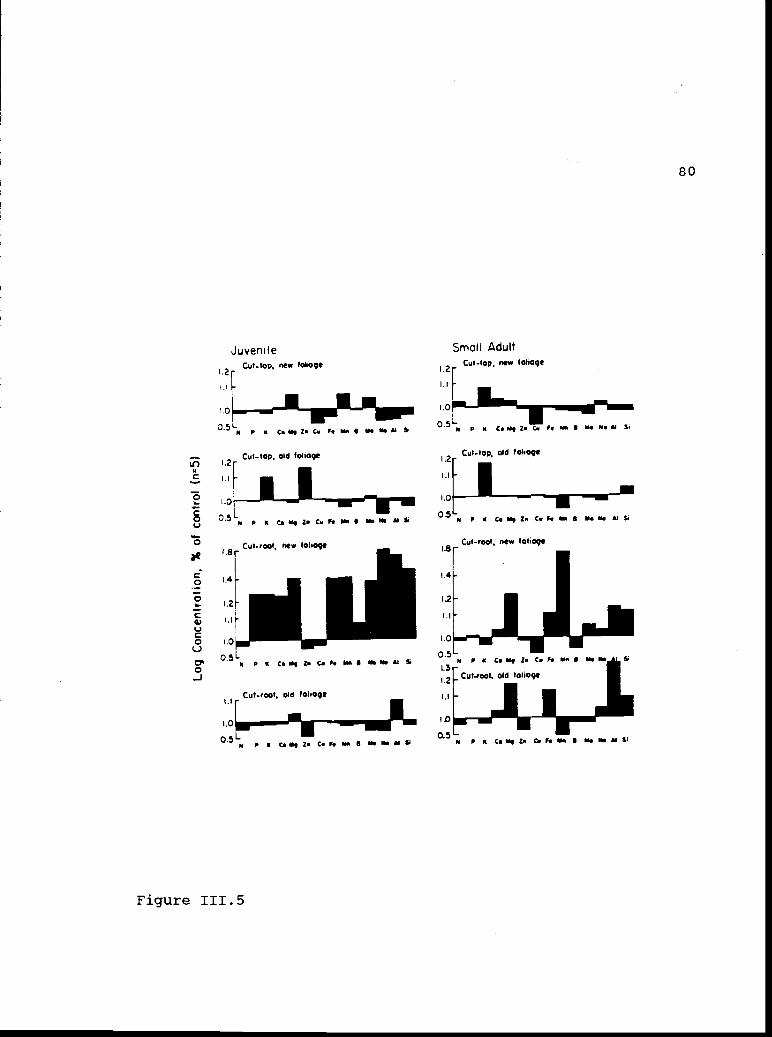
u)
0
S'I0
C00C4,UC0U00-j
0.5
Figure 111.5
Cut-root new fot.oqe(.8
.4
LI
05L 0.5-N P K Cs Mg Zs C.. F, Ms I MS Mo Li Si N P K Ca Mg 2'. C.. F'. Ms S Ms No
.3
.2Cut-root, old foliage
Cut-root, old foliage 1.1jr
05,N P K CI Mg V. C.. Fi MS S MO Ms Li S.
.2
(.0
La
rid.1.0
0.5'-N P K Cs Mg V. C.. F, Ms S MS MS Li $i N P K Cs Mg 2'. 0. Ps M. S MS MS Si SI
80
0.5-a pK C1Mq Z. CVFS MS S MO Mo Li S.
Cut-root, new foliage
Juvenile Small adult
2-Cut-tOp, new too9e .2- Cut-top, new foliage
I. -
LO .0
N P K Cs Mg V. C. F, MS Ms Li $.
I.2rC t00, 0ld foliage 2
Cut-tOP, old foliage
I I____ :
81
Growth
During the period from May 3 to September 7-8, mean
branchlet elongation was 174 ± 36 mm (x ± 1 SE) on lateral
branchlets from control juvenile J. occidentalis.
Elongation on cut-top and cut-root juveniles was 151 ± 39
and 31 ± 13 mm. Small-adult branchlet elongation was 339 ±
66, 328 ± 33, and 58 ± 8 mm on control, cut-top, and cut-
root trees. When lateral branchlet elongation, tree height,
and trunk basal diameter were expressed as a function of the
initial measurements, i.e. an average of final measurement
divided by initial measurement, growth was similar in the
control and cut-top treatments for juveniles and small-
adults (Table 111.4). The cut-root treatment significantly
reduced branchlet elongation and height growth in juveniles
and small adults (P <0.02 - 0.001). Relative to the
controls, trunk basal diameter of juveniles and small-adult
3. occidentalis was also reduced in the cut-root treatment
(P <0.13 - 0.07).
Soil moisture and soil nutrients
From May 13 to August 25, gravimetric water content in
the 0-5 cm soil horizon declined from 17.2% to 1.8%; during
the same period water content of the 25-30 cm horizon
declined from 25.8% to 12.2%. The composite soil sample

82
Table 111.4. Branchlet elongation, tree height, and trunkbasal diameter, as a function of initial measurements, i.e.average of final measurements divided by initialmeasurements, in juvenile and small-adult J. occidentalisfrom control, cut top, and cut root treatments, 3E ± 1 SE, n= 7. Cut top growth was not significantly different thancontrol. Probability that cut root growth was similar tothe control and cut top treatment is given.
Percent of Initial Measurement
Branch Elongation Height DiameterMay 3-Sept 8 May 6- Au 25 May 6-Au 25
Juvenile
Control 452 ± 80 140 ± 10 110 ± 2
Cut-top 489 ± 80 130 ± 10 110 ± 1
Cut-root 161 ± 20 110 ± 3 100 ± 1P < 0.01 P < 0.001 P < 0.13
Small-adult
Control 687 ± 100 130 ± 10 120 ± 2
Cut-top 690 ± 90 120 ± 4 110 ± 10
Cut-root 219 ± 20 110 ± 2 110 ± 3
P < 0.001 P < 0.02 P < 0.07
83
contained 1.6 mg kg1 axnmonium, 0.8 mg kg1 nitrate, 15 mg kg1
phosphorus, 573 mg kg1 potassium and 11.5, 5.3, and
O.l3meq/lOO grams of calcium, magnesium, and sodium,
respectively.
Quantum, water, and nitrogen-use efficiencies
During the April/May measurement period, potential
maximum quantum-use efficiencies (the upper boundary of
simultaneous values of carbon dioxide assimilation versus
photosynthetically active photon flux density, QUE) had a
bimodal diurnal pattern; peaks occurred between 0700-1000
and 1700-2000 hr (Fig. III.6a). Juvenile J. occidentalis
consistently had lower maximum OUE than small-adults. Cut-
top and cut-root juveniles and small-adults had higher OUE
than controls in the late afternoon. Late afternoon OUE
were high due to low PPFD caused by low sun angle and shade
cast by tall J. occidentalis on the west side of the site.
By August, potential maximum OUE had declined about 50%
(Fig. III.6b). The early morning peak in QUE was more
pronounced in small adults from all three treatments than in
juveniles. Except for the early morning peak, individuals
from the cut-top treatment consistently had the highest OUE.
Efficiencies were lowest in the cut-root treatment.
84
Figure 111.6. Probable upper limits (potential maximumresponse) of quantum-use and water-use efficiencies inApril/May and August in juvenile ( A) and small-adult (
J. occidentalis from control ( ), cut-top (- - -), andcut-root (, -_-_) treatments.

Figure 111.6
>. a-a ApnI/Moy
4',
S0Q2
N0o-,0600
Potential Maximum Response
Quantum Use Efficiency Water Use Efficiency
I
I
6
.20a.-
U,c20a.-
N00
c
85
I I
1200
Hour
I I I
1800 2200 0600 1200
Hour00 2200

86
Diurnal response curves of OUE, using all the data from
the intensive and extensive measurements during April/May,
were not significantly different than controls in cut-top
and cut-root juveniles and cut-root small-adults; cut-top
small-adults had significantly higher diurnal QUE than
controls (P <0.05) (Table 111.5). In July diurnal curves of
OUE in cut-top juveniles were significantly higher than and
of cut-root juveniles and small-adults significantly lower
than controls (P <0.05). By August OUE curves of cut-top
juveniles and small-adults were not significantly different
than controls, but diurnal curves of cut-root juveniles and
small-adults were significantly lower than controls (P
<0.05).
Potential maximum water-use efficiencies (upper
boundary of data for carbon dioxide assimilation/
transpiration, WUE) occurred between 0800-1100 hr during the
April/May measurement period (Fig. III.6c). Cut-root small
adult J. occidentalis had the highest . Diurnal patterns
were similar for all treatments, but maximum efficiencies
were consistently lower in juveniles than in small-adults.
In both juveniles and small-adults from all three
treatments, transpiration continued after sunset, resulting
in negative WUE.

Juvenile
Cut-top
Cut-root
Small-adult
Cut-top
Cut-root
n. s.
n. s.
n. S.
n.S.
n.s. n.s.
<
<
<
<
n. S.
<
87
Table 111.5. Significance of comparisons of diurnalresponse curves of OUE and WUE between control and cut-topor cut-root treatments for juvenile and small-adultoccidentalis. Differences are not significant (n.s.),significantly greater than ( >) or less than controls (<), P<0.05, 2-tailed Mann-Whitney test (Zar 1984).
Quantum Use Efficiency
April/May July August
Juvenile
Cut-top n. s. > n.s.
Cut-root n. s. < <
Small-adult
Cut-top > n.s. n.s.
Cut-root n. s. <
Water Use Efficiency
April/May July August

88
By August potential maximum WUE was reduced about 50%,
but the diurnal pattern for juveniles and small-adults from
all treatments remained similar (Fig. III.6d). Control
juveniles had the highest maximum WUE until a late afternoon
increase in cut-top juveniles. WUE was reduced in cut-root
juveniles compared to controls, but maximum in small-
adult J. occidentalis from the cut-root treatment was
similar to controls.
Comparisons of diurnal response curves using all the
WUE data in April/May indicated that the cut-top and cut-
root treatments did not significantly affect WUE in either
juveniles or small-adults (Table 111.5). During July, WUE
curves of cut-top small-adults and cut-root juveniles and
small-adults were significantly lower than controls (P
<0.05). By August diurnal curves of of cut-top
juveniles and small-adults were similar to controls, but
curves of cut-root juveniles and small-adults were
significantly lower than controls (P <0.05).
During August, potential photosynthetic nitrogen-use
efficiencies (maximum carbon dioxide assimilation/nitrogen
concentration, PPNUE) (Field and Mooney 1983) in cut-top
juveniles and small-adults were higher than controls, but
due to variability in the data only small-adult PPNUE was

89
significantly different (P <0.003) (Table 111.6). PPNUE was
significantly lower than controls in cut-root juveniles (P
<0.02) and small-adults (P <0.002). Nitrogen per unit leaf
mass was significantly lower than controls in cut-root
juveniles (P <0.05) and small-adults (P <0.10). During
August, the only significant correlation between PPNUE and
foliage nitrogen concentration was in cut-top small-adults
(P <0.05).
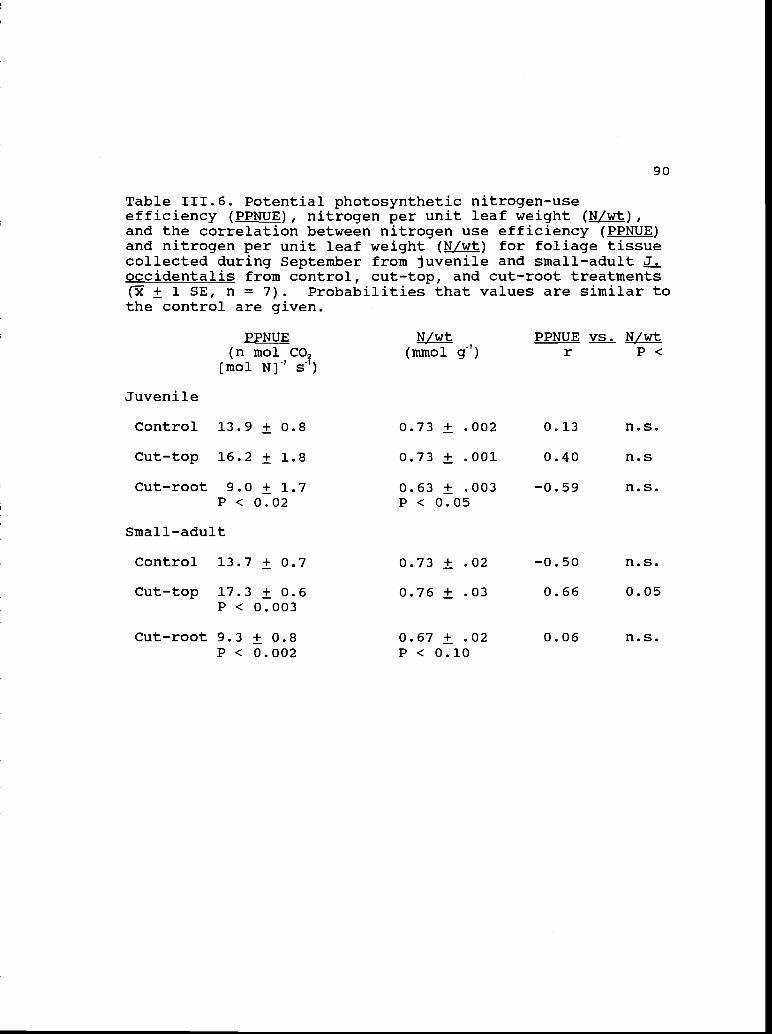
90
Table 111.6. Potential photosynthetic nitrogen-useefficiency (PPNUE), nitrogen per unit leaf weight (N/wt),and the correlation between nitrogen use efficiency (PPNUE)and nitrogen per unit leaf weight (N/wt) for foliage tissuecollected during September from juvenile and small-adultoccidentalis from control, cut-top, and cut-root treatments( ± 1 SE, n = 7). Probabilities that values are similar tothe control are given.
PPNUE N/wt PPNUE vs. N/wt(n mol CO2
[mol N]1 s1)
Juvenile
(inmol g1) r P <
Control 13.9 ± 0.8 0.73 ± .002 0.13 n. S.
Cut-top 16.2 ± 1.8 0.73 ± .001 0.40 n. s
Cut-root 9.0 ± 1.7 0.63 ± .003 -0.59 n. s.
P < 0.02 P < 0.05
Small-adult
Control 13.7 ± 0.7 0.73 ± .02 -0.50 n. s.
Cut-top 17.3 ± 0.6 0.76 ± .03 0.66 0.05P < 0.003
Cut-root 9.3 ± 0.8 0.67 ± .02 0.06 n.s.P < 0.002 P < 0.10

91
DISCUSSION
Carbon dioxide assimilation
Carbon dioxide assimilation in control juvenile and
small-adult J. occidentalis was similar to values reported
for J. osteosperma on the east slope of the Sierra Nevada
(DeLucia et al. 1988), 3. virqiniana in central Missouri
(Lassoie et al. 1983), and Pinus ponderosa in central
California (Helms 1970, Green and Wright 1977). The lack of
light saturation of carbon dioxide assimilation in juvenile
Juniperus species was also reported for Juniperus virginiana
(Ormsbee et al. 1976).
The increased response of carbon dioxide assimilation
to photosynthetically active photon flux density in juvenile
and small-adult J. occidentalis from the cut-top treatment
(Fig. 111.1) supports the suggestion that assimilation
enhancement may be a common response in perennial species
subject to foliage loss (Hodgkinson 1974, Ericsson et al.
1980, Caldwell et al. 1981). Enhanced carbon dioxide
assimilation following defoliation has also been measured in
two deciduous trees (Heichel and Turner 1983). Removing 50%
of the foliage from juveniles and small-adult
occidentalis increased rates of carbon dioxide assimilation
(Table 111.1), but increased assimilation did not result in

92
significant compensatory growth in remaining tissue compared
to controls (Table 111.4).
Data for 3. occidentalis do not support the suggestion
that removal of foliage increases photosynthesis by
increasing water availability to remaining tissue (Detling
et al. 1979) or by increasing the supply of nitrogen to
remaining leaves (Mooney and Chiariello 1984). Plant water
status, as measured by xylem pressure potentials (Fig.
111.2), and foliar nitrogen concentrations (Table 111.2)
were not improved, relative to controls, by foliage removal
in juvenile or small-adult 3. occidentalis. However,
potential photosynthetic nitrogen-use efficiency (PPNUE)
increased in juveniles and small-adult 3. occidentalis from
the cut-top treatment (Table 111.6). Partial defoliation
increases RUBISCO (ribulose bisphosphate caboxylase) (von
Caemmerer and Farquhar 1984), which in turn improves PPNUE
(Pearcy et al. 1987).
Intercellular carbon dioxide
The small range of variation in intercellular carbon
dioxide concentration measured in this study could either be
the result of stoinatal limitation (Farquhar and Sharkey
1982) or low carboxylation efficiency (Wong et al. 1979).
Strong correlations between carbon dioxide assimilation and

93
conductance indicate stomatal limitation (Field and Mooney
1983), the correlation was increased by the cut-root
treatment. In all treatments, concentrations most
similar to ambient carbon dioxide levels co-occurred with
the highest conductance fluxes early in the morning and late
in the day when photosynthetically active photon flux
density dropped below compensation levels.
Levels of calculated for J. occidentalis were much
higher than the 220-260 vpm considered normal for C3 species
(Pearcy and Ehleringer 1984). On July 10, high assimilation
rates by control and cut-top juveniles were associated with
the lowest measured concentrations, indicating that
stoivatal aperture limited the availability of carbon dioxide
and that the supply of carbon dioxide could not meet the
demand (Fig 111.1). In comparison, , was higher in the
cut-top small-adults and the cut-root juveniles and small-
adults where lower assimilation rates did not deplete the
available supply of carbon dioxide. Reduced nitrogen
availability in the cut-root treatments may have reduced
carboxylation efficiency.
High measured in all treatments may indicate that
carbon dioxide assimilation is limited by RuBP regeneration
(Farquhar and Sharkey 1982) or that high photorespiration
94
successfully competes for available RTJBISCO (von Caemnierer
and Farquhar 1981). Allocation of available nitrogen to
non-photosynthetic compounds, such as defense compounds, may
reduce the amount of nitrogen available for carboxylation
enzymes.
Xylem pressure potentials
During May and July, xylem pressure potentials were
similar to those measured for large, mature J. occidentalis
(4-6 in in height and 82-123 years old) growing at Squaw
Butte in central Oregon (Miller and Shultz 1987). In
August, the most negative xylem pressure potentials measured
at Squaw Butte were -2.8 MPa; control juveniles and small-
adults at our site reached xylem pressure potentials of -6.5
and -5 MPa, respectively, in August.
Using the combined data from all measurement periods,
linear regressions of carbon dioxide assimilation vs. xylem
pressure potentials in juveniles and small-adult
occidentalis from all three treatments had significant
negative slopes (r = -0.42 - -0.46; P <o.oi-<o.00i, n = 112
and r = -0.25 - -0.45; p <0.Ol-<O.00l, n = 112,
respectively). However, xylem pressure potentials explained
only 6-21% of the variance (r2) in assimilation across all
treatments, 18 and 20% (r2) in cut-root juveniles and small-

95
adults. Whole plant water status declined seasonally as
soil moisture was depleted, but plant water status was no
more important in explaining the variation in carbon dioxide
assimilation in the cut-top and cut-root treatments than it
was in the controls.
Lateral roots of J. occidentalis, which extend beyond
the edge of the canopy, make a significant contribution to
the support of carbon dioxide assimilation, conductance,
transpiration, and nitrogen uptake. Reductions in these
processes occurred during the April/May measurements when
plant water status, as measured by xylem pressure
potentials, was not affected by the cut-root treatment
(Table 111.1 and Fig. 111.2). These early season changes in
physiological processes in the cut-root treatment may
indicate hormonal effects on stomatal function and
photosynthetic processes (Incoll and Jewer 1987, Raschke
1987)
13C/12C ratios
Carbon isotope ratios can be used to estimate
integrated, long-term WIlE by plants; high E are associated
with less negative 6 13C values (Ehieringer 1988). Although
vapor pressure deficits do affect 6 13C values, data for the
composite samples indicated that values of 6 13C for old
96
foliage of juvenile and small-adult J. occidentalis were
similar to the -25.8 0/00 reported for control Artemisia
tridentata growing in Utah (Toft et al. in review). Values
for new J. occidentalis foliage from control trees (-23.4
0/00) were much less negative, indicating that the new
foliage of 3. occidentalis had a higher E than did
tridentata.
The more negative 6 13C value for new foliage of cut-top
juvenile 3. occidentalis (-27.9 °/oo) was similar to values
reported for medium and short-lived, opportunistic species
in wash microhabitats in Arizona (Ehieringer 1988) and
indicated a reduction in WtJE in the cut-top juveniles
compared to controls.
Relationships between 6 13C values and ratios of
internal:ambient carbon dioxide concentration for 3.
occidentalis were at the high end of the liner relation of
other C3 species, peanut and barley, for which data were
available (Farquhar et al. 1989).
Foliar nutrients
The ratio of maximum carbon dioxide assimilation to
nitrogen concentration in J. occidentalis (Fig. 111.4) was
at the low end of values reported by Field and Mooney (1983)
for evergreen shrubs and trees but was similar to values for

97
J. osteosperma (DeLucia et al. 1988). The lowest nitrogen
concentrations, in foliage from the cut-root treatment, were
just above 0.5 nunol N g1, the nitrogen content suggested as
minimal for photosynthetic competence (Field and Mooney
1983)
To maintain a positive carbon balance, species with low
photosynthetic capacity must retain foliage tissue until
construction costs are recaptured (Miller and Stoner 1979);
recovery of carbon investments is truncated by herbivory
(Gulmon and Mooney 1983). Low maximum carbon assimilation
rates measured in J. occidentalis were similar to rates of
sclerophylls that allocate less nitrogen to photosynthesis
and more to defensive and structural compounds than do
nonscierophylls (Field and Mooney 1983, Gulmon and Mooney
1983). Juniperus occidentalis foliage has a high volatile
oil content (Rudloff et al. 1980), which may be a defense
against herbivory (Schwartz et al. 1980).
The reduction of carbon dioxide assimilation in the
cut-root treatment may indicate that in J. occidentalis
carbon gain has a lower priority than chemical defense. The
presence of secondary compounds may divert nitrogen from
carboxylating enzymes and reduce assimilation (Mooney and
Gulmon 1982) . However, additional data are needed to

98
determine if oil content was also affected by severing
lateral roots and if limiting nitrogen resources favored
defensive compounds over carboxylating enzyme production.
Lateral roots of juvenile 3. occidentalis that extend
beyond the edge of the canopy may be more important for
nitrogen acquisition than for uptake of other macro-and
micronutrient elements. The cut-root treatment
significantly reduced nitrogen concentrations in juvenile
occidentalis foliage, while concentrating 10 elements by >
25% in foliage grown after the lateral roots were severed
(Fig. 111.5). Soils at the research site had nitrate and
ammonium concentrations similar to concentrations measured
between trees in a pinyon-juniper stand near Sedona, Arizona
(DeBano et al. 1987). Calcium was lower but phosphorus,
potassium, and magnesium similar to concentrations in soils
at a nearby research site in central Oregon (Doescher et al.
1987). Reductions in transpiration measured in cut-root
juveniles and small-adults may have affected nitrogen uptake
more than uptake of other macro- and micro-nutrient
elements.
Specific leaf mass
The significant increase in specific leaf mass ()
coupled with the significant decrease in nitrogen
99
concentration in cut-root juveniles and small adults
supports the suggestion that nitrogen-poor plants produce
leaves with high (Gulmon and Chu 1981). Maximum carbon
dioxide assimilation was negatively correlated with in
J. occidentalis from all treatments; a similar negative
correlation was noted for California evergreen trees and
shrubs (Field et al. 1983). The pattern of high low
nitrogen concentrations, and the negative correlation
between SLM and maximum assimilation in cut-root J.
occidentalis suggests that a decline in RuBP carboxylase
activity, following the reduction in nitrogen acquisition
capacity by severing the lateral roots at the edge of the
canopy, reduced carbon dioxide assimilation (Wong 1979,
Longstreth and Nobel 1980). Additional data on the ratio of
mesophyll cell surface to leaf surface are needed to
eliminate the possibility that the reduction in carbon
dioxide assimilation was due to inhibition of carbon dioxide
diffusion by additional cell walls (Radin and Parker 1979)
or by reduction in foliage surface area (Gulmon and Chu
1981)
Growth
Growth efficiency (mm branchlet elongation per nunol
nitrogen per day) was similar in controls and cut-top

100
juveniles and small-adults but was significantly lower than
controls in both cut-root treatments (P <0.001). During the
128 d period from May 3 to September 8, growth efficiency in
control, cut-top, and cut-root juveniles was 1.83 ± 0.3 ( ±
1 SE), 1.7 ± 0.5, and 0.43 ± 0.2 mm nunol1 N d1,
respectively. In small adults the corresponding values were
3.6 ± 0.7, 3.5 ± 0.4, and 0.7 ± 0.1 mm mmol1 N d1. Because
of the higher growth of small-adults, growth efficiencies of
small-adult J. occidentalis were about twice those of
juveniles in all three treatments.
Reduction of branchlet elongation per inmol nitrogen in
the cut-root treatments may indicate that photosynthate was
allocated to replace lost below-ground tissue or that
foliage cell elongation was reduced due to limited water
resources (Hsiao 1973).
Ouantum, water, and nitrogen-use efficiency
Maximum rates of carbon dioxide assimilation increased
following the cut-top treatments (Table 111.1), but that
increase did not translate into improved OUE. Removing 50%
of the foliage of juvenile and small-adult J. occidentalis
did not consistently alter WUE compared to controls (Table
111.5). The presence of an extensive root system to support
101
a diminished volume of foliage increased both carbon dioxide
assimilation and conductance but did not affect
The WUE of J. occidentalis were similar to those
calculated for Atriplex confertifolia and Ceratoides lanata
in Utah (Caidwell 1985) and for green house grown seedlings
of Pinus monophylla, ponderosa, and P. jeffreyi (DeLucia
et al. 1989), but were at the low range of E values
considered normal for C3 plants (Nobel 1985).
A positive relationship between and nitrogen
concentration suggests a potential trade-off between and
PPNUE. Under controlled experimental conditions, E
decreased as , increased in four California evergreens
(Field et al. 1983). During measurement periods associated
with maximum rates of carbon assimilation in J.
occidentalis, correlations between WUE and PPNUE were non-
significant in all treatments except control small-adults,
where WUE and PPNUE were positively correlated (r = 0.55, P
<0.01, n = 21). The presence of a positive, instead of the
predicted negative, correlation between WUE and PPNUE in
occidentalis indicates that PPNUE may have components poorly
explained by the variation in or nitrogen concentration
(Field et al. 1983).

102
CONCLTJS IONS
Altering the balance of resource acquisition tissue by
removing 50% of the foliage and cutting lateral roots of
juvenile and small-adult J. occidentalis affected processes
of carbon assimilation, conductance, and nitrogen uptake.
Availability of photosynthate, water, and nitrogen for
growth was altered. In this study, juveniles and small-
adults in the cut-top treatment compensated by maintaining a
balance of physiological processes. By August, patterns of
quantum, water, and nitrogen-use efficiencies were similar
to efficiencies measured in controls (Table 111.5, Fig.
111.4, Fig. 111.6). Similarities in efficiencies with 50%
foliage removal may indicate that an overall metabolic
control was functioning to regulate the balance between
carbon dioxide assimilation and water loss (Tenhunen et al.
1987)
Negative effects of the cut-root treatment on carbon
dioxide assimilation, conductance, transpiration, xylem
pressure potentials, and foliage nitrogen concentrations
were still present in late August. After lateral roots were
repeatedly cut at the edge of the canopy, juvenile and
small-adult J. occidentalis were not able to regain a
balance of these physiological process by late August.
103
Quantum use efficiency, WUE, and PPNUE were more strongly
affected by the cut-root than the cut-top treatment.
The strong correlation between carbon dioxide
assimilation and conductance in cut-root juvenile and small
adult J. occidentalis indicates stomatal control over water
loss. However, the significant decrease in WUE in the cut-
root treatments during July and August suggests that
stomatal control was not adequate to prevent uncompensated
water loss when assimilation was reduced.

104
ACKNOWLEDGEMENTS
The research was supported in part by the Agricultural
Experiment Station, Oregon State University. I want to
thank the L S Ranches for use of the research site and G. W.
Cox, W. Krueger, R. F. Miller, and W. K. Smith for reviewing
a draft of the manuscript. J. Miller, S. Krmer, and M.
Bhm assisted with the field measurements. This paper is
Technical Paper 8977, Oregon Agricultural Experiment
Station.

IV. THE RESPONSE OF JUVENILE AND SMALL-ADULT WESTERN
JUNIPER (JUNIPERUS OCCIDENTALIS) TO NITRATE AND
AMMONIUN FERTILIZATION
105

106
ABSTRACT
Effects of ammonium-N and nitrate-N fertilization on
carbon dioxide assimilation, conductance, transpiration,
intercellular carbon dioxide, xylem pressure potentials,
foliar nitrogen concentrations, specific leaf mass, and
growth were measured on naturally established juvenile and
small-adult Juniperus occidentalis growing in central
Oregon. Concentrations of nitrate-N in ambient soils were
lower than concentrations of ammonium-N throughout the
summer. Fertilization with the two forms of nitrogen
significantly increased foliage nitrogen concentrations in
juveniles and small-adults in May; concentrations in small-
adult foliage were still significantly higher than controls
in September. Juvenile J. occidentalis do not appear to
utilize ammonium more than nitrate; both types of nitrogen
reduced carbon dioxide assimilation. Small-adults did not
show a more positive response to nitrate than ammonium;
assimilation was not increased compared to controls with
additions of either form of nitrogen. Potential
photosynthetic nitrogen-use efficiencies were lower in
fertilized juveniles and small-adults than in controls.
Stomatal regulation of water loss was tighter in fertilized
trees. Both forms of nitrogen reduced conductance and
107
transpiration, thus increasing water-use efficiency.
Branchiet elongation was increased but variability reduced
significance levels in juveniles and small-adults.
Juniperus occidentalis appears to be adapted to the low,
ambient levels of nitrate in the soil and does not
preferentially utilize ammonium, even though ammonium is
more abundant in the soil during the summer.
108
INTRODUCTION
Plant growth in natural environments is often limitedby nitrogen (Lee et al. 1982). Amino acids are directlyutilized by some species (Kielland 1988); however, most non-nodulated, higher plants depend on nitrate and aitunonium ionsas major sources of available nitrogen (Runge 1983).
Availability of nitrate-N and ammonium-N variesseasonally and by soil type (Runge 1983); therefore plantsmay be principally or seasonally adapted to utilize only onenitrogen form (Lee et al. 1982, Bloom 1985). Much of the
research on nitrogen source preference has been conducted onagricultural crops (Christensen and Meints 1982, see Barber1984 and Clarkson 1985), but some data is available fornative species (van den Driessche 1971, Krajina et al. 1973,Nelson and Selby 1974, Ingestad 1979, Bloom 1985, Haynes
1986). Although growth of most plant species responds
favorably to a mixture of nitrate-N and axnmonium-N, the
optimum ratio varies by species and plant age. Trees can
utilize either nitrate-N or ainmonium-N (Johnson et al.1982). Some conifers, grasses, and ericoid shrubs growingon acid soils prefer ammonium-N (Haynes 1986). Plants
preferring calcareous, high pH soils mainly utilize nitrate-N (Marschner 1986).

109
Ammonium is the dominant form of available soil
nitrogen in many undisturbed, natural ecosystems (Haynes and
Goh 1978, Stevenson 1986). Many soils under climax
vegetation in oak-pine forest, savanna, and tall-grass
prairie communities are low in nitrate-N because species in
the community inhibit nitrification (Haynes and Goh 1978).
Micro-organisms prefer ammonium-N to nitrate-N; ammonium-N
is considered to be the major pathway of biological turnover
in soil (Jansson 1971).
Juniper species in the western United States occur on
soils that are slightly acid to moderately alkaline
(Burkhart and Tisdale 1976, Doescher et al. 1984, Eddleman
1987, Leonard et al. 1987). Higher concentrations of
ammonium-N than nitrate-N have been reported for many soils
occupied by pinyon-juniper woodlands (Charley and West 1977,
Barth 1980, Klopatek 1987).
Western juniper (Juniperus occidentalis Hook. subsp.
occidentalis) (Vasek 1966) is an invasive, native evergreen
tree distributed over 1,145,670 ha in central Oregon (Dealy
et al. 1978). Initially, J. occidentalis have juvenile,
needle-like leaves which are followed by adult, scale-like
leaves as the plant matures (de Laubenfels 1953). Juvenile
J. occidentalis may be more responsive to ammonium-N in the
110
soil than are small-adults. The ability of juvenile
occidentaljs to utilize ainmonium-N could enhance its
establishment in shrub communities where ammoniuin-N may be
more available than nitrate-N.
The following study was designed to evaluate
differences in nitrogen nutrition between juvenile and
small-adult J. occidentalis. The hypotheses were: 1)
juveniles J. occidentalis utilize ammonium more than
nitrate; therefore, physiological processes of juveniles
would respond more positively to ammonium addition than to
nitrate and 2) ability of J. occidentalis to utilize
ammonium diminishes with age; therefore, small-adults should
show more positive response to nitrate than ammonium. The
specific objectives were to determine effects of ammonium-N
and nitrate-N on carbon dioxide assimilation, conductance,
transpiration, intercellular carbon dioxide, xylem pressure
potentials, foliar nitrogen concentrations, specific leaf
mass, and growth in naturally established juvenile and
small-adult J. occidentalis in central Oregon.

111
METHODS
The research site, an abandoned agricultural field last
cultivated about 1975, was located 8 km southeast of
Prineville in central Oregon (44°15'N, l20°45'W). The site
was a gentle northwest-facing slope at 1270 in elevation
below a 1560 in mesa; seasonal springs in the area indicated
some subsurface water flow. The soil was a well drained
Frigid Pachic Argixeroll derived from basalt with a uniform
texture down to a layer of fractured basalt at 50 cm.
Annual precipitation at Prineville (elevation 868 in)
averages 254 mm, 89% of which occurs between October and
June (NOAA 1982). The abandoned field was dominated by
Chrysothainnus nauseosus and Bromus tectorum. Juniperus
occidentalis were scattered throughout the field. The
tallest J. occidentalis were only a few cm taller than the
neighboring C. nauseosus.
Twenty-one J. occidentalis with 100% juvenile foliage
(juveniles) and 21 with predominately adult foliage (small-
adults) (de Laubenfels 1953) were used in this research.
Seven replicate sets of trees each containing three
juveniles and three small-adults were selected. Three
treatments, control, nitrate addition (+NO3), or ammonium
112
addition (+NH4), were randomly assigned to juveniles and
small-adults in each set using Monte Carlo methods.
On April 13 - 14, 1988, 9 g N m2 as calcium nitrate or
9 g N m2 as ammonium + DCD (dicyandiarnide) were added as dry
granules to a circular area 3 x the diameter of the
projected crown of two juveniles and two small-adults in
each set. The nitrification inhibitor DCD was used to
retard the conversion of ammonium to nitrate (Am. Soc. of
Agron. 1980). The third juvenile and small-adult in each
set served as controls. All trees were watered with 50 1
H20 m2, equilavent to 50 mm precipitation, within an area 3
x the crown diameter. The area received an additional 34 mm
of precipitation in May before measurements began, 27 mm in
June, and 8 mm in August.
Physiological processes were measured during three
periods, on May 12, 15, 19, July 17, 18, 19, and August 30,
31, September 1, 1988. On one day during each measurement
period, one set containing one juvenile and one small-adult
from each of three treatments was measured repeatedly to
establish a detailed diurnal course of physiological
parameters (intensive measurements). Measurements were
repeated 15 times on May 12, 11 times on July 19, and 12
times on August 30. On each of the other two days of each

113
period, three sets juveniles and small-adults were measured
twice in the morning and twice in the afternoon (extensive
measurements). Different sets of trees were used for the
intensive measurements during May, July, and
August/September to disperse the impact of destructive
sampling for xylem pressure potential measurements.
Carbon dioxide assimilation and relative humidity were
measured using an Analytical Development Corp. LCA-2
portable infrared gas analyzer system. Conductance,
transpiration, and intercellular carbon dioxide
concentrations were calculated. Photon flux density was
measured with a LiCor 190 SB quantum sensor; leaf and air
temperatures were measured with fine gauge copper/constantan
thermocouples and a Campbell Scientific CR 10 data logger.
Xylem pressure potentials were measured with a PMS
Instruments pressure chamber. The data were reduced using a
BASIC program based on equations from Wexler (1976, 1977),
Nobel (1983), Campbell (1986), and Ball (1987). Daily
totals of carbon dioxide assimilation, transpiration, and
photon flux density were calculated by integrating under
measured diurnal curves.
Leaf area was calculated for tissue used in carbon
assimilation measurements by assuming that juvenile leaves
114
were two-sided triangles attached to a photosynthetically
active cylinder. Length and basal width of leaves were
measured, number of leaves per cm of length was counted, and
the total length and diameter of each sample measured.
Adult tissue was considered to be cylindrical in shape; leaf
area was calculated from measurements of branchiet diameter
and length. Area measurements were used to calculate
specific leaf mass and quantum use efficiencies. Carbon
dioxide assimilation, conductance, and transpiration data
were presented on a dry mass basis because measurements of
dry mass were considered more reliable than leaf area
measurements.
Fo].iar tissue used in carbon dioxide assimilation and
xylem pressure potential measurements in Nay and July was
retained for nitrogen analysis. Due to the awl-like and
scale-like morphology of juvenile and adult J. occidentalis
leaves, no attempt was made to separate leaves from green
stems. After the August/september measurement period,
randomly collected foliage samples from juveniles and small-
adults were separated into old tissue, grown prior to
treatment application, and new foliage, grown after the
nutrient treatments were applied in April. All tissue was
dried, weighed, and ground in a Wiley mill using a 0.5 mm
115
screen. Subsamples were analyzed for total Kjeldahl
nitrogen using an Altkem rapid flow auto-analyzer at the
Forest Sciences Department Oregon State University.
Elongation growth of five lateral branchiets per tree
was measured on April 7, July 5, and September 6; tree
height from the ground surface and trunk basal diameter in
two directions were measured on May 5 and August 25.
Soil moisture was measured gravimetrically on May 17,
July 20, and September 2. Soil from the 5 - 10 cm depth was
collected from within the 3 x projected crown diameter area
of three small-adults from each of the three treatments on
May 18, July 20, and September 2 and analyzed for nitrate
and ammonium using a 2M KCL extraction. On July 20, a
composite soil sample was collected from 0 - 30 cm depth in
an interspace area between trees and analyzed for phosphorus
and extractable bases. All soil analysis was done at the
Soil Testing Laboratory, Oregon State University.
Significant differences between control and each
treatment mean were determined using Student's t-test (Zar
1984). Each measurement period was analyzed separately.
Statistical analysis of response curves used a 1-tailed
Mann-Whitney test (Zar 1984, Potvin and Lechowicz 1988).
116
RESULTS
Soil nutrients and soil moistureConcentrations of nitrate in soil from 5 - 10 cm depth
in control plots were lower than concentrations of ammonium
throughout the summer (Table IV.l). Soil from controlscontained 0.5 ± 0 ing kg1 nitrate and 4.4 ± 0.3 mg kg1aitunonium in May (i ± 1 SE, n = 3). By July, control soilnitrate concentrations increased 70%, but by September soilnitrate returned to May levels. Ammonium in control soils
decreased to 36% of the May concentration in July butreturned to 64% of the May value by September. Nitrate insoil from plots receiving nitrate was 19.7 ± 8.2 ing kgt inMay; by July only 14% of the initial nitrate remained in thesoil and by September only 7% (Table IV.l). During the
summer, ammonium in soil from the nitrate treatments was
similar to ainmonium measured in controls. Ammonium
concentrations in soil from ainmonium treatments were highly
variable, but concentrations remained significantly higherthan the controls through the summer (Student's -test, P<0.05, <0.03, <0.17). From May to September, nitrate in theplots receiving anunonium was significantly higher than wereconcentrations of nitrate measured in soil from controls (P<0.001, <0.15, <0.02, Table IV.l).
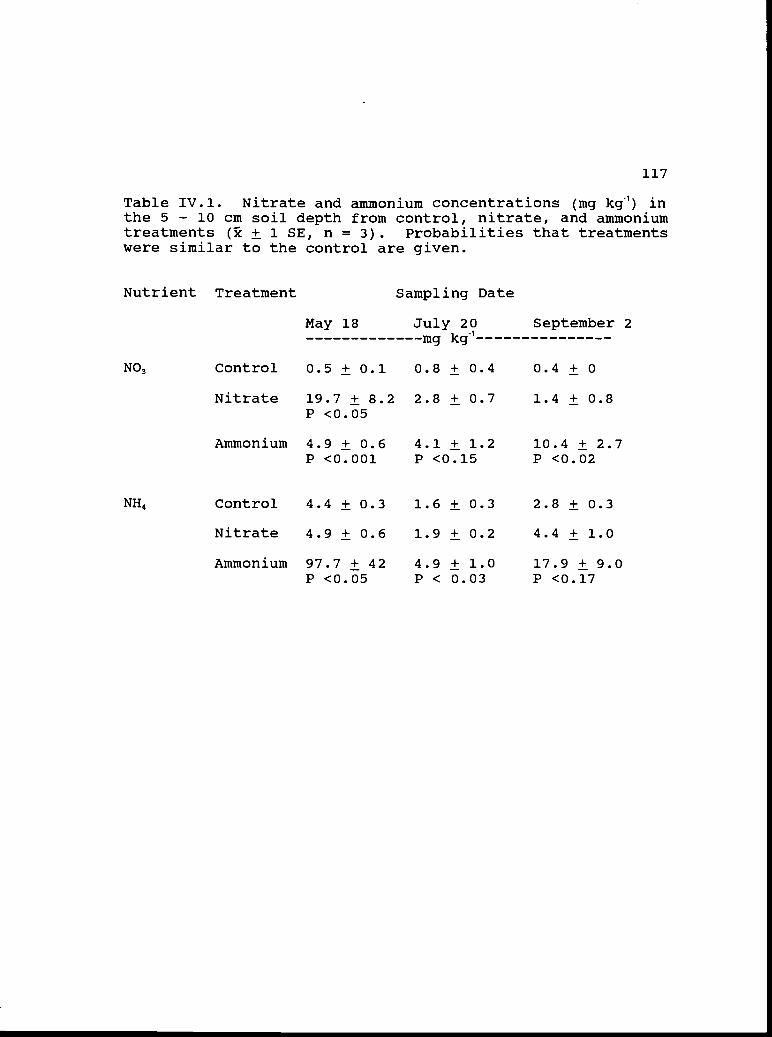
117
Table IV.l. Nitrate and ammonium concentrations (ing kg1) inthe 5 - 10 cm soil depth from control, nitrate, and ammoniumtreatments ( ± 1 SE, n = 3). Probabilities that treatmentswere similar to the control are given.
Nutrient Treatment Sampling Date
NO3 Control 0.5 ± 0.1 0.8 ± 0.4 0.4 ± 0
Nitrate 19.7 ± 8.2 2.8 ± 0.7 1.4 ± 0.8P <0.05
Ammonium 4.9 ± 0.6 4.1 ± 1.2 10.4 ± 2.7P <0.001 p <0.15 P <0.02
NH4 Control 4.4 ± 0.3 1.6 ± 0.3 2.8 ± 0.3
Nitrate 4.9 ± 0.6 1.9 ± 0.2 4.4 ± 1.0
Ammonium 97.7 ± 42 4.9 ± 1.0 17.9 ± 9.0P <0.05 P < 0.03 P <0.17
May 18 July 20 September 2mg kg1

118
composite soil sample from 0 - 30 cm depth contained 5 mg
kg1 phosphorus, 402 mg kg1 potassium, and 10.9, 8.3, and 0.8
meg/100 grams of calcium, magnesium, and sodium,
respectively. The pH of the composite soil sample was 7.7.
From May 17 to September 2, gravimetric water content
in the 0 - 5 cm soil horizon declined from 16.1% to 2.6%.
During the same period, water content in the 25 - 30 and 45
- 50 cm horizons decreased from 22.9% to 10.4% and from
30.2% to 11.4%, respectively.
Foliar nitrogen
Both fertilizer treatments significantly increased
foliar nitrogen concentration in juveniles and small-adults
in May (Table IV.2). The highest nitrogen concentrations,
1.44% and 1.53%, were measured in +NO3 juveniles in May and
+NO3 small-adults in July, respectively. Foliar nitrogen
concentrations of small-adults responded more positively to
both fertilizer treatments than did concentrations in
juvenile foliage. By September, nitrogen concentrations in
old and new juvenile foliage from both nitrogen treatments
were similar to controls; however, concentrations in old and
new small-adult foliage from both nitrogen treatments were
still significantly higher than controls.
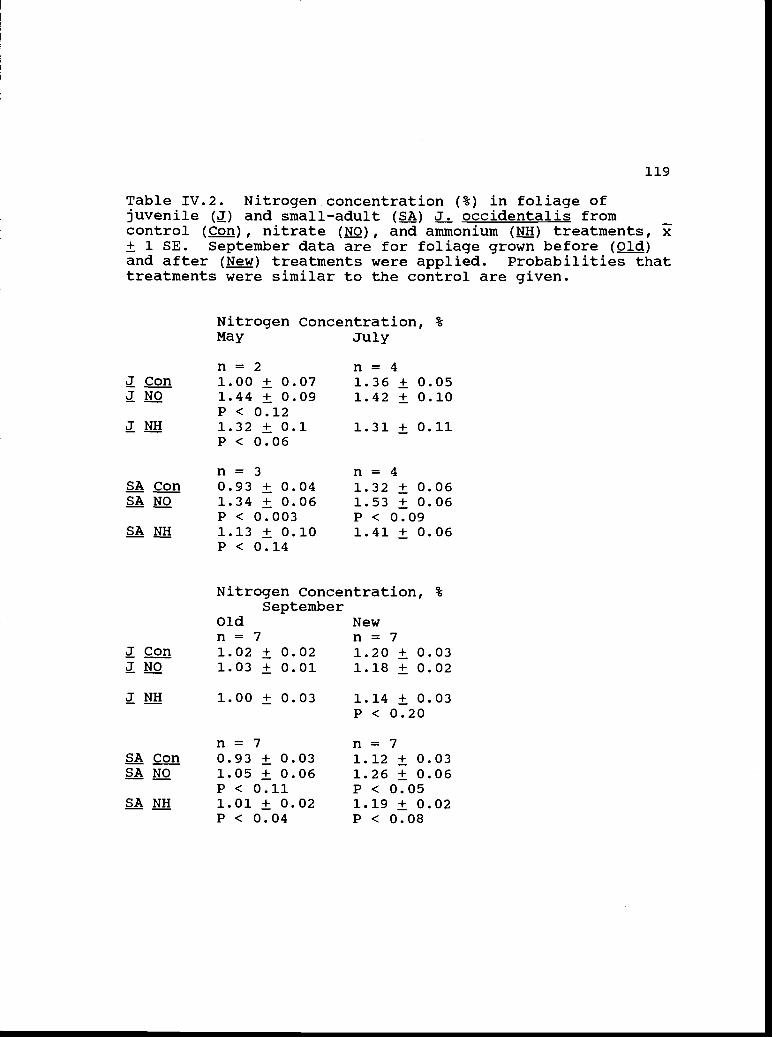
n= 2QQII 1.00 ± 0.07
1.44 ± 0.09P < 0.121.32±0.1P < 0.06
n= 3SA Con 0.93 + 0.04
1.34 ± 0.06P < 0.0031.13 ± 0.10P < 0.14
n= 41.36 ± 0.051.42 ± 0.10
1.31 ± 0.11
n= 41.32 ± 0.061.53 ± 0.06P < 0.091.41 ± 0.06
119
Table IV.2. Nitrogen concentration (%) in foliage ofjuvenile () and small-adult () J. occidentalis fromcontrol (Con), nitrate (jQ), and aininonium (ffl) treatments, x± 1 SE. September data are for foliage grown before ()and after (New) treatments were applied. Probabilities thattreatments were similar to the control are given.
Nitrogen Concentration, %May July
Nitrogen Concentration, %September
Old Newn=7 n=7J Con 1.02 ± 0.02 1.20 ± 0.03J NO 1.03 ± 0.01 1.18 ± 0.02
J NH 1.00 ± 0.03 1.14 ± 0.03P < 0.20
n=7 n=7SA Con 0.93 ± 0.03 1.12 ± 0.03SA NO 1.05 ± 0.06 1.26 ± 0.06
P < 0.11 P < 0.05SA NH 1.01 ± 0.02 1.19 ± 0.02
P < 0.04 P < 0.08
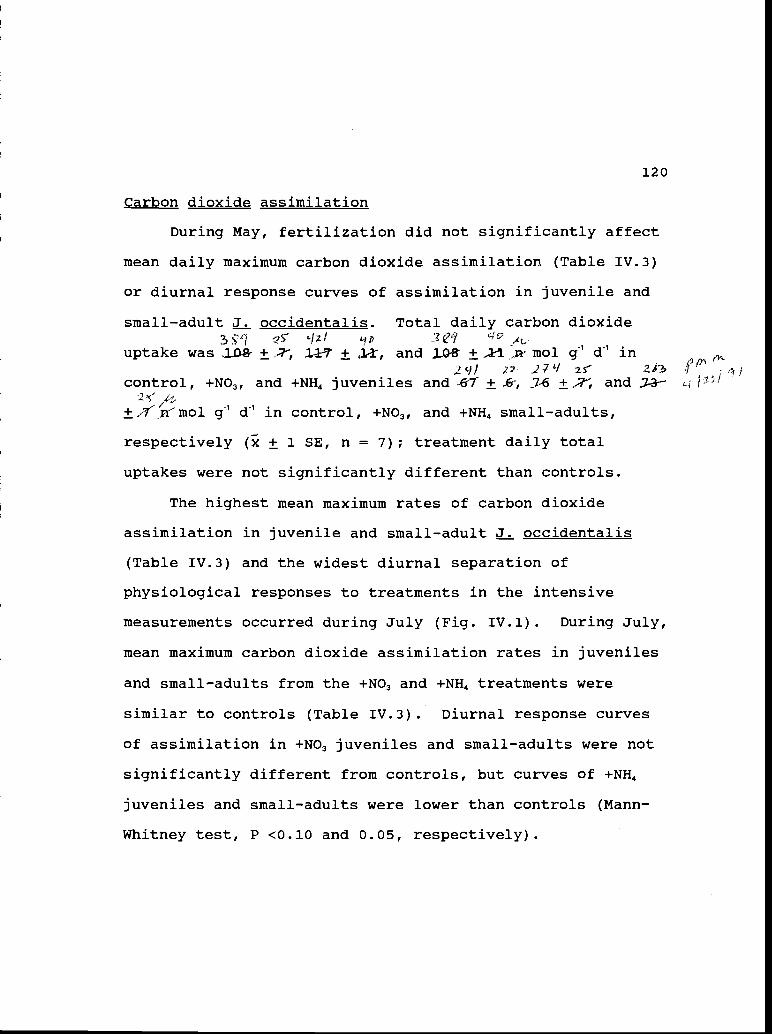
120
Carbon dioxide assimilation
During May, fertilization did not significantly affect
mean daily maximum carbon dioxide assimilation (Table IV.3)
or diurnal response curves of assimilation in juvenile and
small-adult J. occidentalis. Total daily carbon dioxide3/ -7S &1zI ip
uptake was J0-8- ±, Jd ± J, and JJ ±'mol g1 d1 in2 J L/ is 2 é
control, +NO3, and +NH4 juveniles and -61 ± &, J6 ±-?1 and J---
±'7rmol g1 d1 in control, +NO3, and +NH4 small-adults,
respectively ( ± 1 SE, n = 7); treatment daily total
uptakes were not significantly different than controls.
The highest mean maximum rates of carbon dioxide
assimilation in juvenile and small-adult J. occidentalis
(Table IV.3) and the widest diurnal separation of
physiological responses to treatments in the intensive
measurements occurred during July (Fig. IV.l). During July,
mean maximum carbon dioxide assimilation rates in juveniles
and small-adults from the +NO3 and -I-NH4 treatments were
similar to controls (Table IV.3). Diurnal response curves
of assimilation in +NO3 juveniles and small-adults were not
significantly different from controls, but curves of +NH4
juveniles and small-adults were lower than controls (Mann-
Whitney test, P <0.10 and 0.05, respectively).
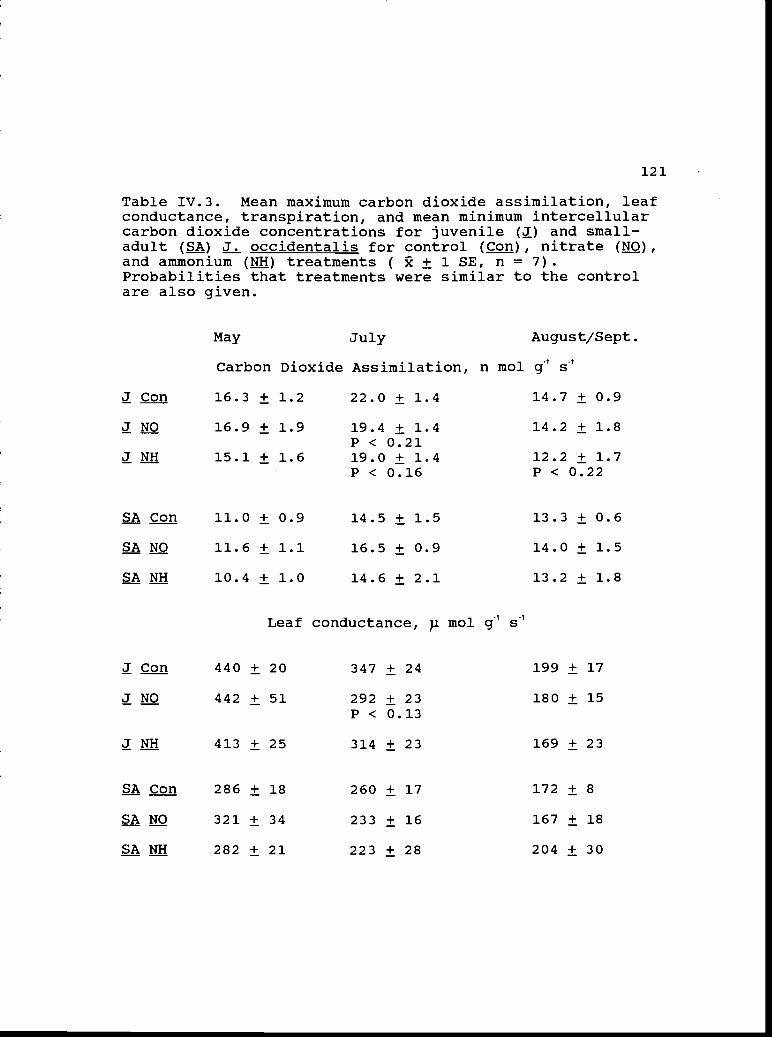
121
Table IV.3. Mean maximum carbon dioxide assimilation, leafconductance, transpiration, and mean minimum intercellularcarbon dioxide concentrations for juvenile () and small-adult (SA) J. occidentalis for control (Con), nitrate (EQ),and ainmonium (NH) treatments ( ic ± 1 SE, n = 7).Probabilities that treatments were similar to the controlare also given.
J Con
May July
Carbon Dioxide Assimilation, n mol
16.3 ± 1.2 22.0 ± 1.4
16.9 ± 1.9 19.4 ± 1.4P < 0.21
15.1 ± 1.6 19.0 ± 1.4
August/Sept.
g1 s
14.7 ± 0.9
14.2 ± 1.8
12.2 ± 1.7
J NO
J NHP < 0.16 P < 0.22
SA Con 11.0 ± 0.9 14.5 ± 1.5 13.3 ± 0.6
SA NO 11.6 ± 1.1 16.5 ± 0.9 14.0 ± 1.5
SA NH 10.4 ± 1.0 14.6 ± 2.1 13.2 ± 1.8
Leaf conductance, i mol g1 s
J Con 440 ± 20 347 ± 24 199 ± 17
J NO 442 ± 51 292 ± 23 180 ± 15P < 0.13
J NH 413 ± 25 314 ± 23 169 ± 23
SA Con 286 ± 18 260 ± 17 172 ± 8
SA NO 321 ± 34 233 ± 16 167 ± 18
SA NH 282 ± 21 223 ± 28 204 ± 30
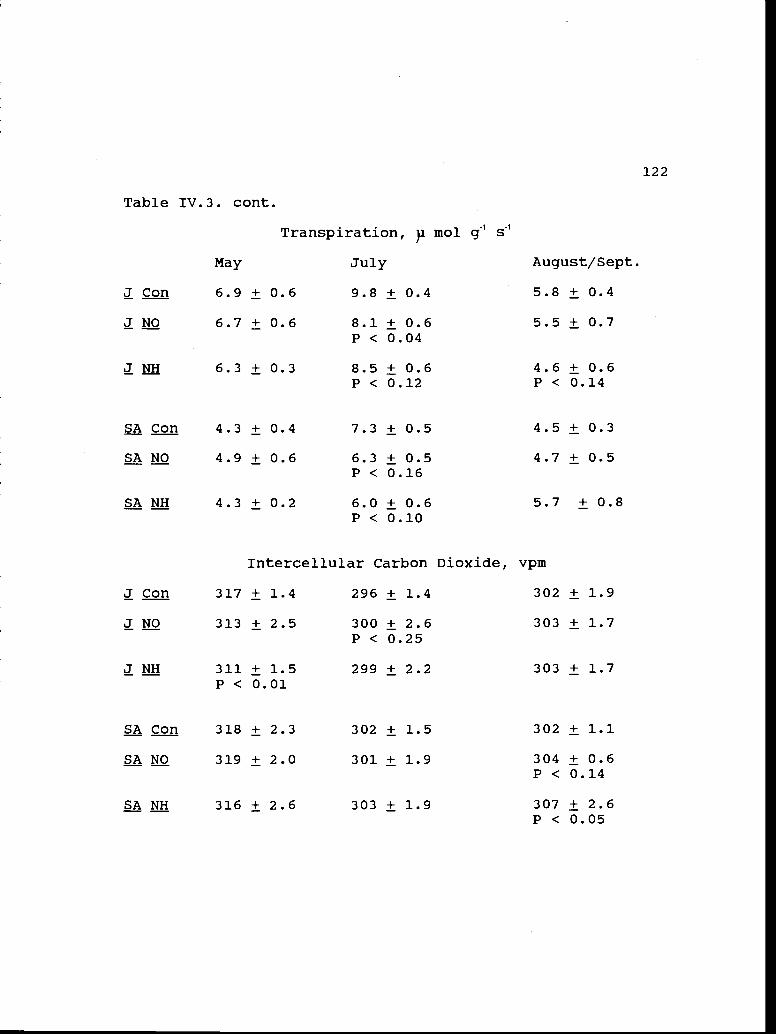
122
Table IV.3. cont.
Transpiration, )1 mol g1 S1
May July August/S ept.
J Con 6.9 ± 0.6 9.8 ± 0.4 5.8 ± 0.4
J NO 6.7 ± 0.6 8.1 ± 0.6 5.5 ± 0.7P < 0.04
J NH 6.3 ± 0.3 8.5 ± 0.6 4.6 ± 0.6P < 0.12 P < 0.14
SA Con 4.3 ± 0.4 7.3 ± 0.5 4.5 ± 0.3
SA NO 4.9 ± 0.6 6.3 ± 0.5 4.7 ± 0.5P < 0.16
SA NH 4.3 ± 0.2 6.0 ± 0.6 5.7 ± 0.8P < 0.10
J Con 317
Intercellular Carbon Dioxide, vpm
± 1.4 296 ± 1.4 302 ± 1.9
J NO 313 ± 2.5 300 ± 2.6 303 ± 1.7P < 0.25
J NH 311 ± 1.5 299 ± 2.2 303 ± 1.7P < 0.01
SA Con 318 ± 2.3 302 ± 1.5 302 ± 1.1
SA NO 319 ± 2.0 301 ± 1.9 304 ± 0.6P < 0.14
SA NH 316 ± 2.6 303 ± 1.9 307 ± 2.6P < 0.05

Figure IV.1. Diurnal courses of intensive measurements onJuly 19, 1988, of photon flux density, vapor pressuredeficit, and leaf temperature (a), conductance (b), carbondioxide assimilation (c), and intercellular carbon dioxide(d) for juvenile (A) and small-adult () J. occidentalisfrom control ( ), nitrate (- - -), and ammonium (.
treatments.
123

8
CO
, Ass
imila
t,on,
n m
ol g
' s'
.-.
J_..
ft_
.J._
,._
o0'
"e
Inte
rcel
lula
r C
arbo
n D
ioxi
de, v
pmC
ondu
ctan
ce, ,
mol
g' s
NN
(1(.
1*0
00
-N
A-
NN
o?u,
0U
'0
0U
'00
00
00
8-I
II
II
I
0
Pho
ton
Flu
x D
ensi
ty (
400-
700n
m).
mol
m2
s'-
N°'
80
00
00
0
§-
N
0
0 0
00
§
ILe
af T
empe
rotu
re, C
£A
0*0
U'
0* V
apor
Pre
ssur
eD
efci
I, iP
a
0
8 0
0O
NN
UI
A
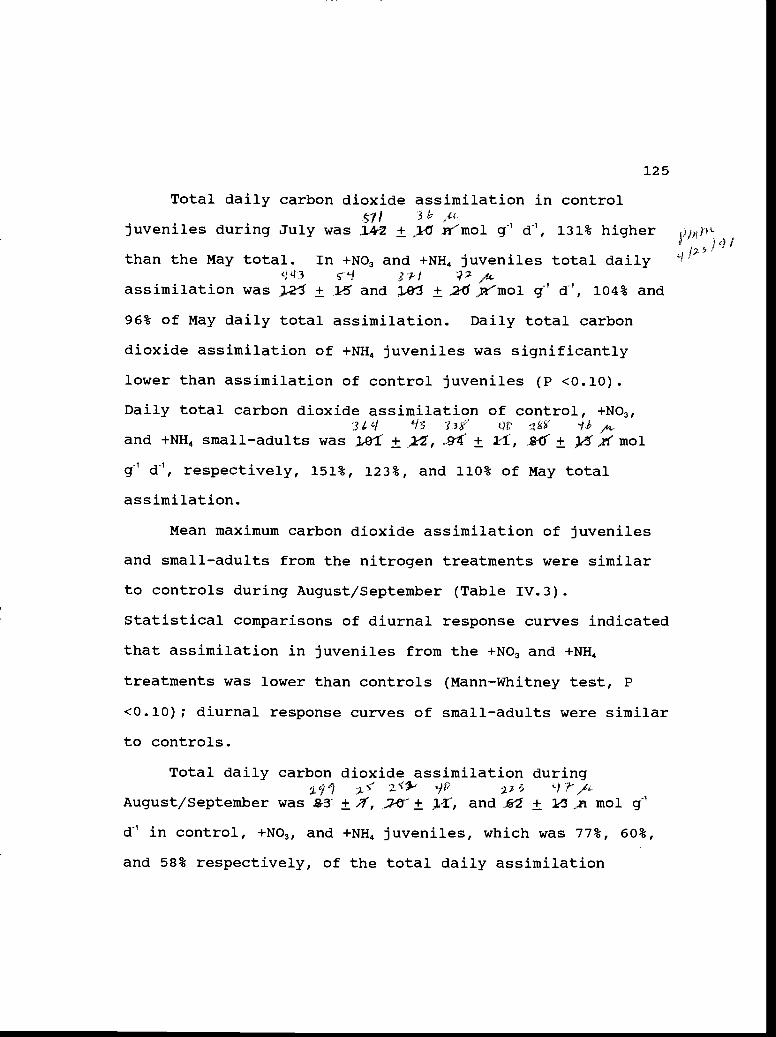
125
Total daily carbon dioxide assimilation in controlcil
juveniles during July was JA-2 ±L- Wmol g1 d1, 131% higher ji
than the May total. In +NO3 and +NH4 juveniles total daily43 31-I 3
assimilation was 2-1 ± * and L.e ±2Xmol g1 d1, 104% and
96% of May daily total assimilation. Daily total carbon
dioxide assimilation of +NH4 juveniles was significantly
lower than assimilation of control juveniles (P <0.10).
Daily total carbon dioxide assimilation of control, +NO3,3 4 R ?i '
and +NH4 small-adults was O1 ± ), ± 1, .S1 ± y( mol
g1 d1, respectively, 151%, 123%, and 110% of May total
assimilation.
Mean maximum carbon dioxide assimilation of juveniles
and small-adults from the nitrogen treatments were similar
to controls during August/September (Table IV.3).
Statistical comparisons of diurnal response curves indicated
that assimilation in juveniles from the +NO3 and +NH4
treatments was lower than controls (Mann-Whitney test, P
<0.10); diurnal response curves of small-adults were similar
to controls.
Total daily carbon dioxide assimilation duringL1 '- 9I2
August/September was &3±X, ± 31, and ± Wzi mol g1
d1 in control, +NO3, and +NH4 juveniles, which was 77%, 60%,
and 58% respectively, of the total daily assimilation

126
measured in May. During August/September, total daily
assimilation in control, +NO3, and +NH4 small-adults wasV' 2W II /4_
similar, 67 ± , 4 ± and 69 ± 17 yi' mol g1 d'
respectively, and was 99%, 91%, and 95% of May totals.
Based on data from all three measurement periods,
maximum carbon dioxide assimilation was not significantly
correlated with foliage nitrogen concentration in control
juveniles (r = 0.47, n.s., n = 21) but was positively
correlated with foliage nitrogen concentration in +NO3 and
NH4 juveniles (r= 0.64, P<0.05, n= 21 andr= 0.88, P
<0.001, n = 21 respectively). In small-adults the
correlation was significant in the controls (r = 0.59, p
<0.05, n = 21), but not in the +NO3 or +NH4 treatments (r =
0.45 and 0.34, n.s., n = 21).
Conductance and transpiration
Mean maximum conductance of water vapor was highest in
all treatments during the May measurements, 413 - 442 p mol
g1 in juveniles and 282 - 321 mol g1 s1 in small-adults
(Table IV.3). The highest rates were measured in +NO3
juveniles and small-adults, 721 and 437 p niol g1 s1,
respectively. Mean maximum conductance and diurnal response
curves of conductance in the nitrogen treatments were not

127
significantly different than controls in either juveniles or
small-adults during May.
Data from the intensive measurements on July 19
indicated that conductance of juveniles and small-adults
from the nitrogen treatments were lower than controls (Fig.
IV.lb); the lowest fluxes of conductance were measured in
the +NH4 treatments. During July, mean maximum conductance
was lower than controls in +NO3 juveniles, and diurnal
curves of conductance were significantly lower than controls
in both nitrogen treatments in juvenile and small-adult
occidentalis (Mann-Whitney test, +NH4 juveniles p <o.io, all
others p <0.05).
The seasonal decline in conductance was more pronounced
in juvenile J. occidentalis than in small-adults. By
September, conductances in juveniles and small-adults were
41 - 45% and 52 - 72%, respectively, of the flux densities
measured in May. By August/September mean maximum
conductance (Table IV.3) and diurnal response curves of
conductance in juvenile and small-adult J. occidentalis from
the nitrogen treatments were similar to controls.
Mean maximum rates of transpiration in juvenile and
small-adult J. occidentalis were not significantly affected
by either fertilizer treatment during May (Table IV.3).

128-i
23
Total daily transpiration in May was .54 ± if, 5 ± £, and .4
I-±Vmo1 g1 d1 for control, +NO3, and +NH4 juveniles,
2- / p 1- i!respectively, and a ± 4, ± ,, 34 ± .2 inol g d1 for
control, +1103, and +NH4 small-adults (x ± 1 SE, n = 7).
Although conductance was highest during May, transpiration
was highest during July due to low vapor pressure deficits.
During July, the +NO3 and +NH4 treatments reduced mean
maximum transpiration in juveniles and small-adults compared
to controls (Table IV.3).
During the July measurements, total daily transpiration2 / 23 '1 lit "1 ,-
increased toJ- ± K, ft ±A-, and fr ±Amol g1 d1 in
control, +NO3, and +NH4 juveniles, or 144%, 120% and 136% of
May total transpiration. For control, +NO3, and +NH4 small-70..
adults, total daily transpiration was 59 ± B ± :1:O, andI.1-
±5'r'nol g1 d1, or 174%, 146%, and 134% of the May
values. The nitrate and ammonium treatments reduced total
daily transpiration in juvenile J. occidentalis compared to
controls during July (P <0.03 and <0.07, respectively).
By August/September only mean maximum transpiration in
+NH4 juveniles was lower than controls (P <0.14) (Table
IV.3). Total daily transpiration in control, +NO3, and +NH4, ,i';/
juveniles was4- ± 3, 3-6 ± ,B, and ± $ inol g1 d1, 80%,
71%, and 67%, respectively, of the May totals. Totals of
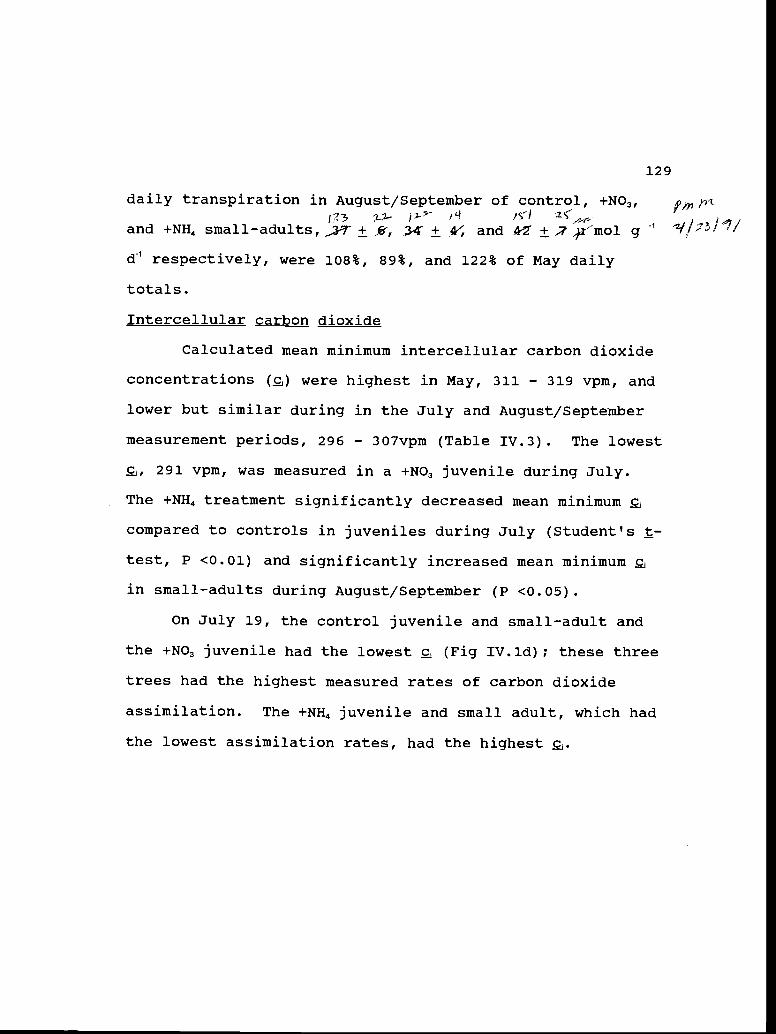
129
daily transpiration in August/September of control, +NO3,,13 U2- ,) 4-i'- I
and +NH4 small-adults, ...3-T ± ,6-, 34 ± 4' and fr2 ± )? rnol g -2/3i
d1 respectively, were 108%, 89%, and 122% of May daily
totals.
Intercellular carbon dioxide
Calculated mean minimum intercellular carbon dioxide
concentrations () were highest in May, 311 - 319 vpm, and
lower but similar during in the July and August/september
measurement periods, 296 - 3O7vpm (Table IV.3). The lowest
, 291 vpm, was measured in a +NO3 juvenile during July.
The +NH4 treatment significantly decreased mean minimum
compared to controls in juveniles during July (Student's -
test, P <0.01) and significantly increased mean minimum
in small-adults during August/september (P <0.05).
On July 19, the control juvenile and small-adult and
the +NO3 juvenile had the lowest ç, (Fig IV.ld); these three
trees had the highest measured rates of carbon dioxide
assimilation. The +NH4 juvenile and small adult, which had
the lowest assimilation rates, had the highest .
130
Xylem pressure potentials
Pre-dawn xylem pressure potentials declined during the
summer from -0.4 - -0.9 MPa in May, to -0.7 - -1.35 MPa in
July, and -12 - -1.64 MPa in August/September (Fig. IV.2).
During May, the nitrogen treatments selectively improved
plant water status, as measured by xylem pressure
potentials. Compared to controls, mid-day, mean minimum
xylem pressure potentials were less negative in +NO3
juveniles (Student's fl-test, P <0.12), +NH4 juveniles (P
<0.01), and +NO3 small-adults (P <0.08).
During the July and August/September measurements,
potentials in the nitrogen treatments were not significantly
different than controls except in the +NO3 small-adults
where potentials were more negative than controls (P <0.08).
The most negative xylem pressure potentials were measured
during August/September in +NH4 juveniles and small-
adults, -6 and -5 MPa, respectively.
Potential maximum response
Plots of the upper limit of the observations using data
from all three measurement periods, i.e. potential maximum
responses (Jarvis 1976), indicate that carbon dioxide
assimilation in control juvenile J. occidentalis was higher
than rates in either nitrogen treatment at similar
Figure IV.2. Pre-dawn, mean minimum, and absolute minimumxylem pressure potentials for juvenile (J) and small-adult(SA) J. occideritalis from control (C), nitrate (NO), andammonjum (NH) treatments during May, July, andAugust/September.
131
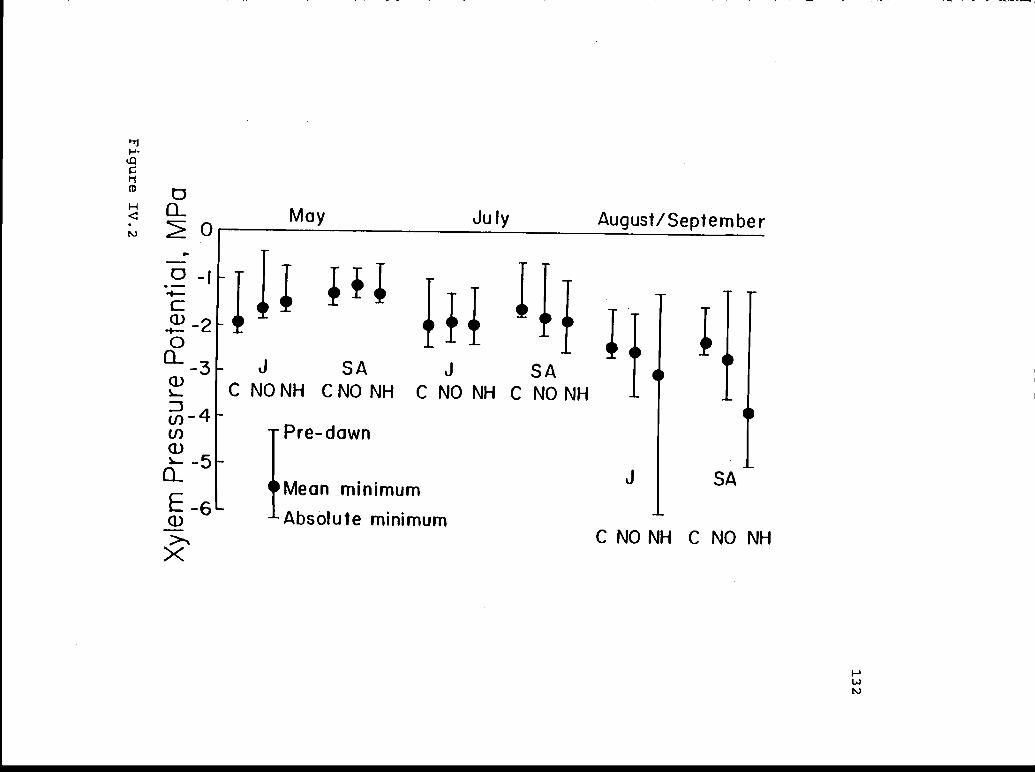
May July August/September
;
C NO NH C NO NH C NO NH C NO NH
Pre- dawn
Mean minimum
1Absolute minimum
J SA
CNONH CNONH
133
photosynthetically active photon flux densities (PPFD)
(Fig. IV.3a). The control juveniles did not appear to be
light saturated at levels of PPFD measured in the field in
central Oregon; juveniles from the nitrate and ammonium
treatments were light saturated. The maximum response of
assimilation to PPFD was consistently higher in juveniles
than in small-adults in all three treatments. Maximum
carbon dioxide assimilation in control small-adults was
usually lower than rates measured for trees from the two
nitrogen treatments.
Carbon dioxide assimilation rates were 90% of maximum
with leaf temperatures of 20 - 33 °C in control juveniles
and temperatures of 15 - 33 °C in +NO3 and +NH4 juveniles and
control small-adults (Fig. IV.3b). The treatments did not
consistently alter the shape of their response curves. The
relationship between maximum carbon dioxide assimilation and
leaf temperature in small-adults was altered by the nitrate
and ammoniuni treatments; maximum assimilation rates of
small-adults declined steeply with leaf temperatures above
28°C in both nitrogen treatments (Fig. IV.3b).
Upper boundary curves using data from all three
measurement periods indicated that maximum conductance in
control juveniles was higher with decreasing vapor pressure

134
Figure IV. 3. Potential maximum response of carbon dioxideassimilation verses photon flux density (a) and leaftemperature (b) and of conductance verses vapor pressuredeficit (c) and xylem pressure potential (d) for juvenile (A) and small-adult () J. occidentalis from control (
nitrate (- - -), and ammonjum (. -) treatments.

600
In500
400
300UC2 200U
00U
0
Figure IV.3
Potential Maximum Response° b
C
\
0 I 2 3 45 6 7
i 721600- 4d500-
400
00 -1
A JuvenileSmall Adult
Control---Nitrate-. Ammonajm
a -
-2 -3 -4 -5 -6
Vapor Pressure Deficit, kPa Xylem Pressure Potential, MPa
135
10 20 30 4045Leaf Temperature, °C
0 1000 2000Photon Flux Density (400-700n m).
mol m S'

136
deficits than was conductance from either nitrogen treatment
(Fig. IV.3c). Maximum conductance in control small-adults
was lower than conductance in the nitrogen treatments with
vapor pressure deficits above 3 kPa. Vapor pressure
deficits from 3 - 7 kPa reduced maximum conductance in +NO3
and +NH4 small-adults more than in the controls (Fig.
IV.3c).
The relationship between conductance and xylem pressure
potentials can be best represented by boundaries enclosing
all the data for the three measurement periods (Fig. IV.3d).
Conductance in control juvenile and small-adult
occidentalis varied from 513 - 54 and 370 - 48 p mol g1 S1,
respectively, as xylem pressure potentials declined from -
0.9 to -2.7 MPa. In +NO3 juvenile and small-adults
conductance varied from 721 - 31 and 437 - 24 y.i mol g1 s1,
respectively, as xylem pressure potential declined from -0.9
to -3.7 MPa. In NH4 juveniles and small-adults the range in
conductance was 509 - 41 and 339 - 18 p mol g1 s1,
respectively, with xylem pressure potentials of -0.7 to -6
MPa (Fig. IV.3d).
Specific leaf mass
Nitrogen fertilization did not significantly affect
mean specific leaf mass (SLM) of foliage from either

137
juvenile or small-adult J. occidentalis during any
measurement period. From May to September of juveniles
declined 70%, 58%, and 64%, from 191, 184 and 211 g m2 to
134, 106, and 135 g m2 in control, +NO3 and +NH4 treatments,
respectively. During the same period, SLAM in small-adults
declined 69%, 75%, and 70%, from 327, 306, and 309 g m2 to
224, 229, and 216 g m2 in control, +NO3, and +NH4 treatments.
Growth
Mean branchlet elongation from April 7-September 6,
expressed as a percentage of the initial measurement, was
310% in control juveniles and 355% in control small-adults.
Mean branchiet elongation was higher with both fertilization
treatments in juvenile and small-adult J. occidentalis, but
variability reduced significance levels (Table IV.4).
Height and trunk basal diameter were not significantly
affected by the nitrogen treatments.
Ouantum, water, and nitrogen-use efficiencies
Potential maximum quantum-use efficiencies (upper
boundary curves of carbon dioxide assimilation!
photosynthetically active photon flux density, CUE) had
diurnal bimodal peaks throughout the summer. The highest
CUE occurred between 0800 and 1000 h in all treatments; a
second lower peak occurred in the late afternoon. Diurnal

138
Table IV.4. Branchiet elongation, tree height, and trunkbasal diameter, as a percentage of initial measurements, injuvenile () and small-adult (SA) J. occidentalis fromcontrol (Con), nitrate (NO), and ammonium (NH) treatments, x± 1 SE, n = 7.
Percentage of Initial Measurements
BranchietElongation Height Diameter
April 7 - Sept 6 May 5 - Aug 25 May 5 - Aug 25
355 ± 66 119 ± 2 115 ± 2
463± 96 115 ± 3 116 ± 3
445 ± 76 115 ± 3 115 ± 3
JCon 310±49 121±3 116±4
377 ± 75 125 ± 4 124 ± 5
JNH 356±31 126±3 113±5

139
response curves of OUE of +NO3 juveniles were higher than
controls during May (Mann-Whitney test, P <0.10); response
curves of +NH4 small-adult J. occidentalis were lower than
controls during July (P <0.10).
The +NO3 treatment increased potential maximum water-
use efficiency (upper boundary curves of carbon dioxide
assimilation/transpiration, j) in juveniles during May
(Mann-Whitney test, P <0.10) and July (P <0.05). During
July, E increased in +NO3 small-adults (P <0.10). By
August/September maximum WIJE were similar in all treatments
in both juvenile and small-adult J. occidentalis.
During May, potential photosynthetic nitrogen-use
efficiencies (maximum carbon dioxide assimilation/nitrogen
concentration, PPNTJE) (Field and Mooney 1983) of juvenile
and small-adult J. occidentalis were lower in the +NO3 and
+N}j4 treatments than were PPNTJE in controls (Student's t-.
test P <0.001-0.05) (Table IV.5). In July only PPNUE in
+M03 and +NH4 juveniles was significantly lower than controls
(P <0.01 and 0.04, respectively); by August/September the
nitrogen treatments did not significantly affect PPNUE in
either juveniles or small-adults.
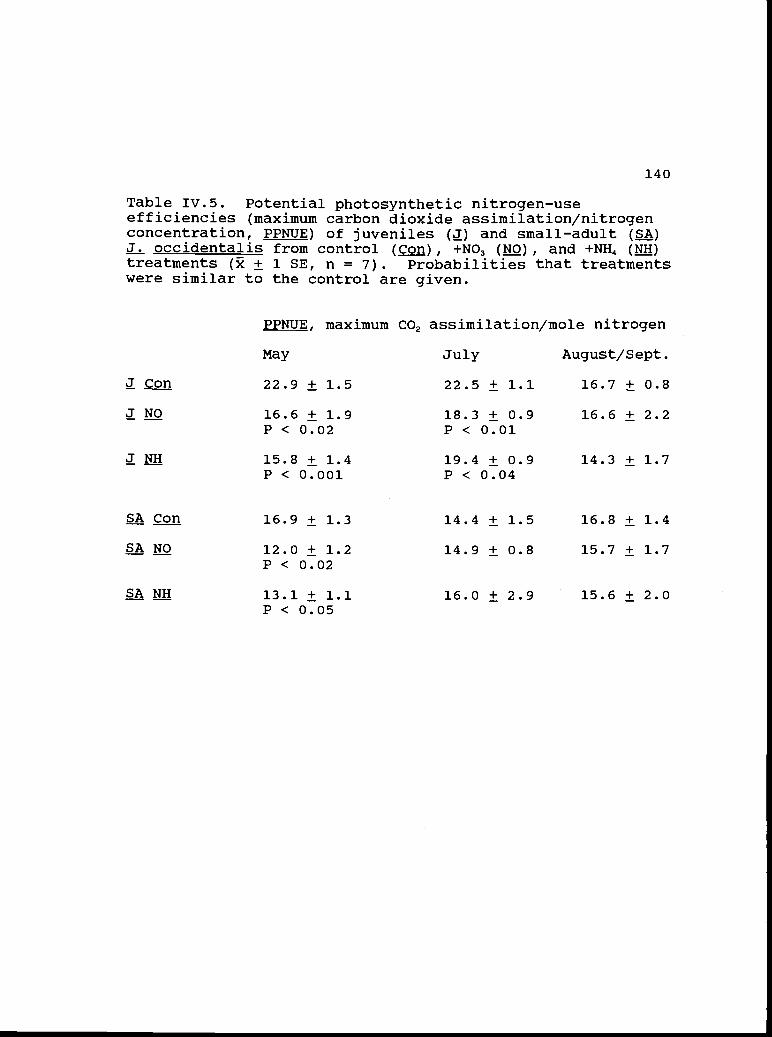
140
Table IV.5. Potential photosynthetic nitrogen-useefficiencies (maximum carbon dioxide assimilation/nitrogenconcentration, PPNUE) of juveniles (J) and small-adult (A)J. occidentalis from control (Con), +NO3 (NO), and +NH4 (NH)treatments ( ± 1 SE, n = 7). Probabilities that treatmentswere similar to the control are given.
PPNUE, maximum CO2 assimilation/mole nitrogen
May July August/Sept.
J Con 22.9 ± 1.5 22.5 ± 1.1 16.7 ± 0.8
J NO 16.6 ± 1.9 18.3 ± 0.9 16.6 ± 2.2P < 0.02 P < 0.01
J NH 15.8 ± 1.4 19.4 ± 0.9 14.3 ± 1.7P < 0.001 P < 0.04
SA Con 16.9 ± 1.3 14.4 ± 1.5 16.8 ± 1.4
SA NO 12.0 ± 1.2 14.9 ± 0.8 15.7 ± 1.7P < 0.02
SA NH 13.1 ± 1.1 16.0 ± 2.9 15.6 ± 2.0P < 0.05

DISCUSSION
Soil nutrients
Ambient concentrations of nitrate and ammonium at the
research site were at levels considered to be low to very low and
marginal for plant growth (Preston 1942, Barth 1980). However,
ambient nitrate and ammonjum concentrations were similar to
concentrations measured between trees in a pinyon-juniper stand
near Sedona, Arizona (DeBano et al. 1987) and concentrations of
phosphorus, potassium, calcium, and magnesium were higher and
concentrations of sodium lower than the mean mineral composition
of soil from 17 pinyon-juniper sites in Utah (Bunderson et al.
1985)
Fertilization increased nitrate and anunonium in the soil
throughout the summer research period (Table IV.l). The
increased nitrate in the +NH4 plots may not have been readily
available for uptake by juvenile and small-adult J. occidentalis.
The uptake of nitrate is considerably reduced by the presence of
ammonium (Haynes and Goh 1978, Runge 1983).
Foliar nitrogen
Foliar nitrogen concentrations in control juvenile and
small-adult J. occideritaljs were similar to mean nitrogen
concentrations reported for J. osteosperma from 17 sites in Utah
(Bunderson and Weber 1986). Foliar nitrogen increased within one
141
142
month of the treatment application (Table IV.2); however,
additional nitrogen in the foliage of juveniles and small-adults
from the nitrogen treatments did not improve the photosynthetic
capacity of J. occidentalis. Fertilization with ammonium nitrate
at 200 or 400 lb N/acre did not increase photosynthetic rates of
20-year-old Douglas-fir compared to controls (Brix and Ebell
1969); however a later study reported increases in photosynthesis
of 30-year-old Douglas-fir with antmonium nitrate additions of 224
and 448 kg N/ha (Brix 1981). Photosynthetic rates of Pinus
elliottii seedlings were lower than controls with ammonium or
nitrate fertilization applied at the rate of 250 lb N/acre.
Nitrate depressed photosynthesis more than did the ammonium
treatment (van den Driessche 1972).
The ability of J. occidentalis to produce additional
carboxylating enzymes may be constrained by its adaptation to an
environment characterized by low nitrogen availability (Barth
1980); investing more resources in enzyme production would be
non-adaptive (Mooney and Gulman 1979). The apparent limited
investment of additional nitrogen in carboxylating enzymes may
indicate that an alternative investment of nitrogen in other
structures or functions may yield greater returns or that carbon
dioxide assimilation in J. occidentalis is limited by non-
nitrogenous components (Chapin et al. 1987).

143
The adaptation of J. occidentalis to soils with low nitrogen
availability may predispose it to root reduction of nitrate
(Marschner 1986). The availability of additional nitrate may
have increased foliar nitrogen concentrations because the root
capacity for nitrate reduction was exceeded. Nitrate would then
be translocated to the shoots where, stored in vacuoles, it would
be unavailable for nitrogen metabolism (Marschner 1986). If this
scenario occurred in J. occidentalis, it would help explain the
higher concentrations of nitrogen in foliage of -4-NO3 juveniles
and small-adults (Table IV.2), the absence of a positive effect
on carbon dioxide assimilation (Table IV.3), and lowered PPNUE
(Table 5). The addition of ammonium nitrate also reduced carbon
dioxide assimilation in Pinus radiata while increasing foliar
concentrations of nitrogen (Sheriff et al. 1986).
Carbon dioxide assimilation
Carbon dioxide assimilation in control juvenile and small-
adult J. occidentalis was similar to values reported for
osteosperma on the east slope of the Sierra Nevada (DeLucia et
al. 1988). Fertilization with nitrate and ammonium did not
increase carbon dioxide assimilation in juvenile or small-adult
J. occidentalis. Assimilation in juveniles appeared to be more
sensitive than was assimilation in small-adults to the negative
effects of nitrogen addition. Reductions in assimilation in both

144
juveniles and small-adults were more pronounced in the ammonium
treatment than in the nitrate treatment.
Conductance and transpiration
During July when the maximum rates of carbon dioxide
assimilation were measured, the reduction of conductance and
transpiration in juveniles and small-adults from the -4-NO3 and
+NH4 treatments (Table IV.3), the increase in WtJE in the +NO3
treatment, and a strong correlation between carbon dioxide
assimilation and conductance indicated tighter stomatal
regulation of water loss with nitrogen fertilization. Reductions
in the transpiration stream may have been possible because the
availability of nitrogen was improved with fertilization. In
tomatoes, transpiration was reduced with ammonium fertilization
but not when nitrate was used in the solution culture (Haynes
1986).
Xylem pressure potentials
Ammonium fertilization lowers xylem pressure potentials; the
mechanism that causes more negative potentials is unknown, but
plant water uptake appears to decrease (Haynes 1986). During
August/September the most negative xylem pressure potentials,
i.e. below -3.5 MPa, were measured in +NH4 juveniles and small-
adults (Fig. IV.2). The lowered xylem pressure potentials in the
ammonium treatment reduced conductance and transpiration more in

145
juveniles than small-adults. During August/september,
conductance and transpiration of +NH4 juveniles were 85% and 79%
of controls, respectively, while those of +NH4 small-adults were
119% and 127% of controls (Table IV.3).
Potential maximum response
Lack of light saturation of potential maximum carbon dioxide
assimilation in juvenile Juniperus species was also reported for
J. virginiana (Ormsbee et al. 1976) and other juvenile
occidentalis growing nearby (Chapter III). Light saturation of
juvenile J. occidentalis from the nitrate and ainmonium
treatments, while juveniles from the controls remained
unsaturated (Fig. IV. 3a), and reduced PPNUE in +NO3 and +NH4
juveniles during May and July (Table IV.5) may also indicate that
additional nitrogen in the foliage of juveniles from the
fertilizer treatments was not allocated to carboxylation
enzymes.
Increased sensitivity of potential maximum carbon dioxide
assimilation to leaf temperatures above 28°C in +NO3 and +NH4
small-adult J. occidentalis (Fig. IV.3b) may be due to reduced
transpirational cooling (Table IV.3).
Growth
The response of conifer growth to the form of nitrogen
fertilization differs by species (van den Driessche 1971, Krajina
146
et al. 1973, Nelson and Selby 1974). In this study, branchiet
elongation of juvenile and small-adult J. occidentalis responded
equally to nitrate and ammonium (Table IV.4). Increased
available nitrogen may be allocated to growth rather than
assimilation. Nitrogen fertilization increased the leaf area
index of Pinus sylvestris but did not increase assimilation rate
(Linder and Axeisson 1982).
Measured increases in above-ground growth in J. occidentalis
with nitrate and ainmonium fertilization could have been at the
expense of below-ground growth. Carbon allocated to roots may
have been used to support the higher demand for and turnover of
carbon skeletons needed for NH4 assimilation, thus reducing the
availability of carbon for root growth. More carbon is needed in
the roots due to increased root respiration with NH4
fertilization (Haynes 1986).
During August/September when soil moisture became more
limiting, the limited water uptake ability of J. occidentalis due
to reduced root growth could have produced the more negative
xylem pressure potentials measured in the +NH4 treatment (Fig.
IV.3). Ammonium fertilization has been shown to reduce root
growth in a number of different species (Haynes and Goh 1978).

147
Ouantum and water-use efficiencies
For the J. occidentalis used in this study, reductions of
water loss with nitrogen addition were greater than were the
negative effects of fertilization on carbon gain. During July,
water-use efficiency in +NO3 juveniles and small adults was
increased by reducing water loss, rather than by increasing rates
of carbon dioxide assimilation (Table IV.3). Compared to
controls, OUE was not changed as WUE was improved. Increased
in P. radiata was also attributed to the more negative effect of
nitrogen addition on conductance than on carbon dioxide
assimilation (Sheriff et al. 1986).

148
CONCLUS IONS
Throughout the summer research period, concentrations of
nitrate-N in ambient soils were lower than concentrations of
anuuonjum-N. Fertilization with nitrate and ammonium
significantly increased foliage concentrations of nitrogen in
juveniles and small-adults during May; concentrations in small-
adult foliage were still significantly higher than controls in
September. Juvenile J. occidentalis do not appear to utilize
ammonium more than nitrate; both types of nitrogen reduced carbon
dioxide assimilation. Small-adults did not show a more positive
response to nitrate than ammonium; assimilation was not increased
with additions of either form of nitrogen. Potential
photosynthetic nitrogen-use efficiencies were lower in fertilized
juveniles and small-adults than in control plants. Stomatal
regulation of water loss was tighter with nitrogen fertilization.
Both forms of nitrogen reduced conductance and transpiration,
thus increasing water-use efficiency. Branchiet elongation was
increased but variability reduced significance levels. Juniperus
occidentalis appears to be adapted to the low, ambient levels of
nitrate in the soil and does not preferentially utilize ammonium
even though ammonium is more abundant in the soil during the
summer.

149
ACKNOWLEDGEMENTS
The research was supported in part by the Agricultural
Experiment Station, Oregon State university. I want to thank the
L S Ranches for use of the research site and L. F. DeBano, J. M.
Kiopatch, A. R. Tiedeman, and W. Krueger for reviewing a draft of
the manuscript. J. Miller, S. Krmer, and M. Bhm assisted with
the field measurements. This paper is Technical Paper 9206,
Oregon Argicultural Experiment Station.

V. SEASONAL COURSE OF PHYSIOLOGICAL PROCESSES IN
JUNI PERUS OCCIDENTALIS
149a
150
ABSTRACT
The seasonal course of carbon dioxide assimilation,
conductance, transpiration, leaf temperature, xylem pressure
potentials, growth, foliage macro- and micronutrient element
concentrations, and quantum, water, and nitrogen-use
efficiencies were measured in juvenile, small-adult, and
large-adult western juniper (Juniperus occidentalis) growing
under ambient field conditions in eastern Oregon, to explore
the timing of and seasonal limitations on those processes.
Highest daily total assimilation occurred during July and
August; over the 15 month period juveniles had significantly
higher daily total assimilation and transpiration per gram
foliage than small-adults or large-adults. As soil water
became limiting, total daily assimilation by juveniles and
small-adults declined to levels similar to those of large-
adults. Juveniles had the highest conductance flux
densities in all except three measurement periods, when
conductances in all three morphotypes were equally low.
Juveniles had the tightest stomatal control over water loss,
but none of the junipers measured were water-use efficient.
During periods of low soil water, juveniles had the most
negative xylem pressure potentials. Soil drought affected
conductance independent of plant water potentials or vapor
151
pressure deficits. Juveniles had the capacity for higher
carbon dioxide assimilation over a broader range of stomatal
resistances and xylem pressure potentials than small or
large-adults. Foliar nitrogen concentrations were usually
highest in small-adults and large-adults. High rates of
transpiration may be required to acquire an adequate supply
of nitrogen, but nitrogen did not appear to be allocated
preferentially to photosynthetic compounds. Potential
photosynthetic nitrogen-use efficiencies of J. occidentalis
were very low compared to other growth forms. Branchlet
elongation was greatest in June and July. Juveniles were
more responsive to the changing environment than were small-
adults; large-adults had the least seasonal variation in
measured processes.

152
INTRODUCTION
In central Oregon 1,145,670 ha are covered by
vegetation dominated by western juniper (Juniperus
occidentalis Hook. subsp. occidentalis) (Vasek 1966, Dealy
et al. 1978). The spread and increased density of
occidentalis during the last 100 yr have been attributed to
overgrazing, fire suppression, and possible climatic shifts
(Young and Evans 1981). Patterns in pinyon-juniper
communities, i.e. the observable traits of a system and
their configuration (Cale et al. 1989), have been studied
extensively (Everett 1987). Relationships between patterns
and processes are often inferred, but different processes
can result in similar patterns; therefore, understanding and
predictions should be derived from analysis of fundamental
processes rather than patterns (Cale et al. 1989).
Analysis of photosynthetic performance, water
relations, tissue nutrient concentrations, and growth of
major plant species in a community coupled with
environmental data allows estimation of the amounts of
carbon dioxide fixed, water lost, and nutrients taken up.
Environmental effects on physiological processes and
partitioning of resources within and between plants can also
be estimated. However, generalizing about the contribution

153
of physiological processes to community patterns is
difficult because potential maximum rates of physiological
processes are reduced by enviromnental constraints at the
whole plant and community levels of organization (Lange et
al. 1987).
Simulation models are often used as a bridge between
data on physiological processes and community patterns
(Miller 1981, Miller et al. 1984). Models are often limited
by the lack of physiological data for important species in
the community of interest (West and Van Pelt 1987). When
the community contains evergreen species, parameter values
throughout the year are needed to develop and apply
physiologically based mechanistic models.
Defining appropriate management strategies for juniper
communities is a topic of on-going concern (Everett 1987).
In the past, juniper invasion into degraded rangelands and
sites in high ecological condition has been considered as
part of the management problem (Burkhardt and Tisdale 1976).
Mechanical and chemical interventions to halt or reverse
the spread of juniper species are no longer cost effective
and have been challenged because of their drastic
environmental effects (Tidwell 1987). Recently, multiple-

154
use values of juniper woodlands have been recognized
(Buckinan and Wolters 1987).
Data on fundamental physiological process of major
species in juniper communities under ambient conditions can
provide a basis to understand community patterns. Artemisia
tridentata has been studied extensively (DePuit and Caidwell
1973, Campbell and Harris 1977) and data are available for
Chrysothamnus nauseosus (Davis et al. 1985.) and Aqropyron
siDicatuin (Caidwell et al. 1981, Richards and Caidwell 1985),
but information for 3. occidentalis was limiteed to data on
water relations and leaf morphology (Miller and Shultz
1987). Data are needed on 3. occidentalis to parameterize
simulation models which in turn can be used to explore
effects of management practices or anthropogenic climatic
change on this wide-spread community type.
The research reported here was undertaken to provide an
annual data base on physiological processes of carbon
dioxide assimilation, conductance, transpiration, leaf
temperatures, xylem pressure potentials, growth, foliage
macro- and micronutrient element concentrations, and
quantum, water and nitrogen-use efficiencies for
occidentalis growing under ambient field conditions in
eastern Oregon and to explore the timing of and seasonal

limitations on those processes. This study is a step
toward acquiring the data base needed to simulate
interactions of major species in the community and impacts
of human interventions on juniper communities.
155
156
METHODS
The research site was located 12.8 km west of Redmond
in central Oregon (440 16'N, 121°20'W) along Barr Road. The
site was a gentle, west-facing slope at 1050 m elevation.The soil is a well drained loamy-skeletal, mixed, mesic,Aridic Haploxeroll derived from Mazama volcanic ash over
tuff, with a uniform silty loam texture down to a hardpan atabout 70 cm. Annual precipitation at Redmond averages 217
mm, 89% of which occurs from October to June (NOAA 1982).
The plant community at the research site was similar tothe JuniPerus/Artemisja/Aqrqpyron-chaenactjs association
(Driscoll 1964); principal plant species were Juniperusoccidentalis, Arteinjsja tridentata (Nutt.) ssp. vaseyana,Purshia tridentata (Pursh) DC, Chrysothaninus nauseosus
(Pall.) Britt., C. viscidjflorus (Hook.) Nutt., Tetradymiacanescens DC, Festuca idahoensis Elmer, Agrppyron spicatuin
(Pursh) Scribn. and Smith, Sitanion hystrix (Nutt.) Smith,and Poa sandbergii Vasey.
Twelve sets of diurnal measurements of physiologicalprocesses were collected during the 15-month period fromJuly, 1987, to October, 1988. Measurements were collected
on July 29, August 10, October 24, and November 21 during
1987 and on January 2, April 2 and 16, May 8 - 9, June 11 -
157
12, July 6 -7, August 2 - 3, September 4 - 5, and September
30 - October 1 during 1988. Due to instrument problems,
measurements were not collected during September, 1987; also
measurements were not collected during the months of
December, 1987, and February and March, 1988. The data set
for each measurement period is referred to by the name of
the month in which the measurements were made.
Initially, J. occidentalis has needle-like juvenile
leaves that give way to scale-like adult leaves as the plant
matures (de Laubenfels 1953). Trees with 100% juvenile
foliage may be 26 yrs old (Chapter II) and 0.92 in tall. On
other individuals (small-adults), scale-like leaves
predominate on trees < 1 m tall, before the tree is
reproductive. Juvenile J. occidentalis used in this
research had 100% juvenile foliage and averaged 0.37 in in
height; small-adults had predominately adult foliage and an
average height of 1.25 m; large-adults were mature trees
with adult foliage and an estimated height of 4.5 in.
During July, 1987, physiological processes of 5 juveniles
and 5 large-adults were measured; 2 juveniles and 2 large-
adults were measured in August, 1987. In October, 2
juveniles and 2 small-adults were measured. Data from
July, August, and October 1987, indicated substantial

158
differences between rates of physiological processes between
juvenile, small-adult, and large-adult j. occidentalis, so
all three morphotypes were studied beginning in November,
1987, when 2 trees of each morphotype were measured.
During January, 1988, only 1 individual of each plant type
was measured. From April to October, 1988, 4 juveniles, 4
small-adults, and 4 large-adults were measured during each
sampling period. Different individuals within the research
area were used for physiological measurements during each
sampling period because destructive xylem pressure potential
measurements precluded the possibility of resampling
juvenile trees. During each sampling period, juveniles
large enough to support diurnal sampling were located first;
then small-adults and large-adults growing nearby were
selected based on proximity and the requirement that the
south side of the tree be in full sun through the day.
Branchlets used for physiological measurements during each
of the 12 measurement periods were always on the south side
of the tree and 5 cm to 1.5 in abpve the ground surface.
Carbon dioxide assimilation and relative humidity were
measured using an Analytical Development Corporation LCA-2
portable infrared gas analyzer system. Conductance,
transpiration, and intercellular carbon dioxide
159
concentrations were calculated. Photon flux density was
measured with a LiCor 190 SB quantum sensor; leaf and air
temperatures were measured with fine gauge copper/constantan
thermocouples and a Campbell Scientific CR 10 data logger.
Xylem pressure potentials were measured with a PMS
Instruments pressure chamber. Data were reduced using a
BASIC program based on equations from Wexler (1976, 1977),
Nobel (1983), Campbell (1986), and Ball (1987). Daily
totals of carbon dioxide assimilation, transpiration, and
photon flux density were calculated by integrating measured
diurnal curves.
Leaf area was calculated for tissue used in carbon
assimilation measurements by assuming that juvenile leaves
resembled two-sided triangles attached to a
photosynthetically active cylinder. For each sample, length
and basal width of leaves were measured, number of leaves
per cm of branchlet length was counted, and total length and
diameter of each branchiet measured. Adult tissue was
considered to be cylindrical in shape; leaf area was
calculated from measurements of branchiet length and
diameter. Area measurements were used to calculate specific
leaf mass and quantum use efficiencies, because
photosynthetically active photon flux density is expressed

160
on an area basis. Carbon dioxide assimilation, conductance,
and transpiration data were presented on a dry mass basis
because measurements of dry mass were considered more
reliable than leaf area measurements.
Daily whole plant carbon dioxide assimilation and
transpiration for the average-sized large-adult
occidentalis used in this research, 4.5 in tall with a basal
circumference 66 ± 4 cm, were calculated for daylight hours
during each measurement period using measured diurnal curves
of assimilation and transpiration and a regression of basal
circumference to predict whole tree dry foliage mass. The
regression equation, Y = - 5.381 + 0.352 (basal
circumference in cm) (r = 0.976 ± 3.6), was developed by
harvesting 19 large-adult J. occidentalis growing in eastern
Oregon (Miller, Eddleman, Angell 1987). Due to the open
canopy structure of J. occidentalis, all leaves were
weighted equally in defining average assimilation and
transpiration (Jarvis and McNaughton 1986).
Foliar tissue was randomly collected for nutrient
analysis from trees used in carbon dioxide assimilation
measurements during eight measurement periods from July,
1987, to June, 1988. Additional samples were collected
during July and August, 1988, for nitrogen analysis. Due to
161
the awl-like and scale-like morphology of juvenile and adult
J. occidentalis leaves, no attempt was made to separate
leaves from underlying green stems. All tissue was dried,
weighed, and ground in a Wiley mill using a 0.5 mm screen.
Subsamples were analyzed for total Kjeldahl nitrogen using
an Altkeiu rapid flow auto-analyzer at the Forest Sciences
Department, Oregon State University. Concentrations of
macro- and micronutrient elements were measured by plasma
emission spectroscopy at the U.C.L.A. Biomedical Laboratory.
Elongation growth of five lateral branchiets was
measured on five juveniles and five small-adults during nine
measurement periods from August, 1987, to September, 1988.
Initial lengths of the branchlets chosen for growth
measurements were similar. The trees reserved for growth
measurements were not used for carbon dioxide assimilation
or xylem pressure potential measurements due to the
destructive nature of the physiological measurements.
Soil moisture was measured gravimetrically from the 0 -
5, 10 - 15, 25 - 30, and 45 - 50 cm depths during each
measurement period (Hillel 1971). On July 20, 1988, a
composite soil sample was collected from 0-30 cm depth in an
area between trees and analyzed for nutrients at the Soils
Testing Laboratory, Oregon State University.

162
Quantum-use efficiencies (carbon dioxide assimilation
nmol mT2 s1/photosynthetically active photon flux density
imo1 xi2 s1), water-use efficiencies (carbon dioxide
assimilation nmnol g1 s1/transpiration pmol g1 s1), and
potential photosynthetic nitrogen-use efficiencies (carbon
dioxide assimilation nmnol g1/nitrogen concentration mol g1)
were calculated.
Significance of differences between a single
observation and a sample mean was determined using a special
case of the Student's t-test (Sokal and Rohlf 1981).
Diurnal response curves of physiological processes were
compared using Mann-Whitney tests for two-sample or Kruskal-
Wallis and Tukey tests for three-sample comparisons (Zar
1984, Potvin and Lechowicz 1988).

RESULTS
Climate and soil moisture
Air temperatures during the 15-month measurement period
were similar to long term records (Fig. V.1A) (NOAA 1982).
Precipitation was within ± 1 SD of the 30-yr record for
Redmond for all months except July, 1987, and April 1988,
when precipitation was higher (P < 0.001 and <0.15,
respectively) than the long term average (Fig. V.1B).
Soil gravimetric water content in the 0 - 5 cm horizon
was highly variable, ranging from 35% during January, 1988,
to less than 2% from late August to late October, 1987, and
from July to October, 1988 (Fig. V. lC). At 10 - 50 cm
depth soil moisture was recharged by the heavy rains during
July, 1987, but dropped to -7% by October, 1987. Soil water
content at 10 - 50 cm was 7% or lower from August, 1988,
until the final measurement in October, 1988.
Four sampling periods, April 2 and 16, June 11 - 12,
July 6 - 7, and September 4 - 5, 1988, were chosen to
illustrate the measured seasonal variation in micro-
meteorological and physiological processes (Fig. V.2).
Photosynthetic photon flux density (PPFD), vapor pressure
density (VPD), and leaf temperature, measured concurrently
with carbon dioxide assimilation, did not differ
163
164
Figure V.1. A - 30-year (1951 - 1980) monthly mean maximumand mean minimum air temperatures (.-_), 1 SD of the mean(_ __.), and the mean air temperatures at Redmond, OR, duringthe 15-month measurement period ( A ). B - 30-year meanprecipitation, 1 SD of the mean, and precipitation duringthe 15-month measurement period (A ) for Redmond, OR. C -Soil gravimetric water content at 0 - 5 cm (
), 10 - 15 cm( y ), 25 - 30 cm
( A ), 45 - 50 cm () depths.
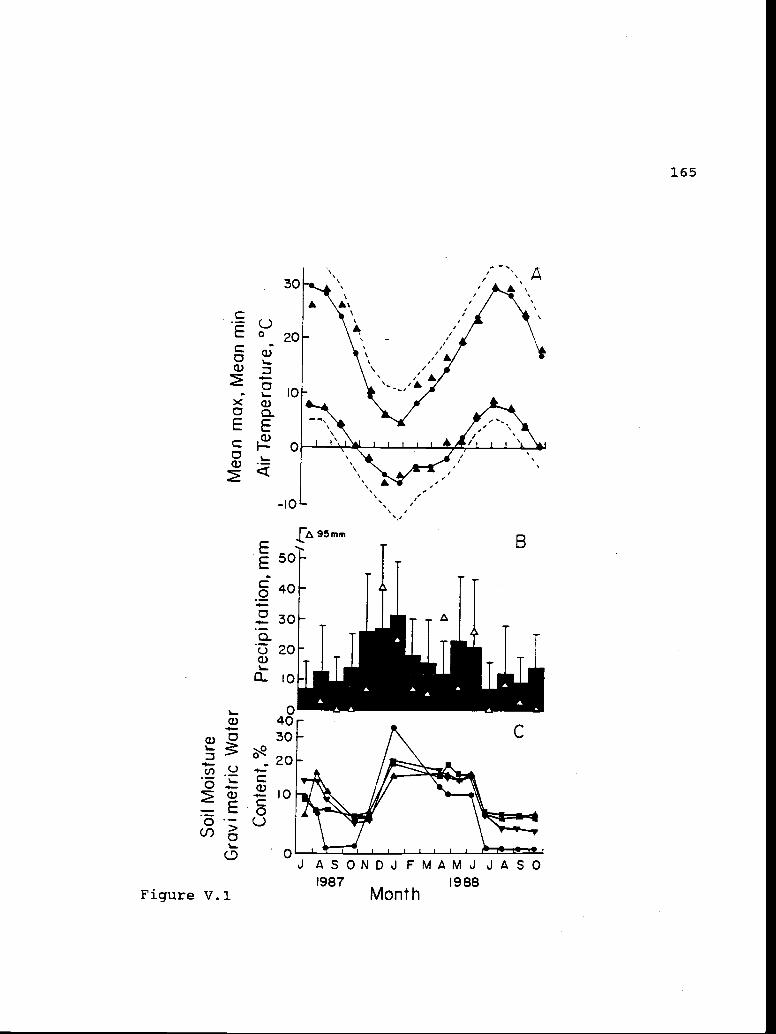
IS
oil M
oist
ure
HG
ravi
mef
ric W
ater
Mea
n m
ax, M
ean
m'n
Con
tent
, %P
reci
pita
tion,
mm
Air
Tem
pera
ture
, °C
166
Figure V.2. Mean diurnal course (n = 2) on April 16, June11, July 6, and September 4, 1988, of: A - Photosyntheticphoton flux density (PPFD,
),umol m2 s1, vapor pressure
deficit (3Lp,-A-) kPa, and leaf tei9erature (Teaf,y) °C; B- carbon dioxide assimilation ninol g s1; and C -conductance pmol g1 s1 of juveniles ( -), small-adult(.._), and large-adult (.__-) J. occidentalis.

- 2000- A Ipril(I) VPD. kPo
l4OO7('5
800-3
'200 I
U 2 II III;_ °°C
U(f)700-0ci
Tho 500-kD E 300-"---'-o ioo-
6 12 18 6 12 18 6Hour
12 18 6
September
12
-J
50.U
30 °
- Juvenile- --Small-adult
Larqe- adult
18
168
significantly among juveniles, small-adults and large-adults
measured each month. Maximum PPFD were 1800, 2000, 2050,
and 1250 ,imol m2 s1 for April, June, July, and September,
respectively (Fig. V.2A). The highest measured vapor
pressure deficits were 2.2, 3.4, 4.4, and 6.7 kPa from April
through September. Maximum leaf temperatures increased
during the summer from 27°C in April to 43°C in September.
The lowest leaf temperatures, 1°C, were measured during July
(Fig. V.2A).
Carbon dioxide assimilation and intercellular carbon dioxide
Highest rates of carbon dioxide assimilation measured
during April, June, July, and September, 1988, were 18.5
nmol g1 s1 for juveniles in June, 14.8 nmol g' s for small-
adults in July, and 11.4 nmol g1 s for large-adults in
April (Fig. V.2B). During April and June, mean diurnal
curves of carbon dioxide assimilation in the. two juvenile
occidentalis were significantly higher than were the mean
curves of two small-adults and two large-adults (Kruskal-
Wallis and Tukey tests, P <0.05) (Fig. V.2B). In July,
diurnal curves of juveniles and small-adults were similar,
and both were significantly higher than the mean
assimilation curve of the large-adults (P <0.05) (Fig.
V.2B). By September diurnal cures of carbon dioxide

169
assimilation of juveniles and small-adults had decreased to
match that of the large-adults; curves of the three plant
types were not significantly different (Fig. V.2B).
In April and June, daily curves of carbon dioxide
assimilation tracked PPFD. In July, assimilation peaked at
7.5 - 14.8 ninol g1 s1 by 1100 hr; during September, peak
assimilation of 7.8 - 9 nmol g' s occurred before 0900 hr
(Fig. V.2B).
During the 15-month measurement period, the highest
daily total carbon dioxide assimilation per gram foliage in
juveniles (1&3- ymol g1 d1) and small-adults (-l4 rmol g1 d1) / 3/ 1 /
occurred during July, 1987, and July, 1988, respectively
(Fig. V.3A). Small-adults were not measured during July,
1987. Large-adult J. occidentalis had the highest measured7
total daily assimilation (9.O'nmol g1 d1) during August,
1987.
During periods when gravimetric soil water content was
10 - 15% at 10 - 50 cm depth (Fig. V.1C), juveniles had
higher daily total carbon assimilation per gram foliage than
did small-adults or large-adults (Fig. V.3A). However,
this pattern was not present during the January, 1988,
measurements when assimilation of all three morphotypes was
very low (Fig. V.3A). In October, 1987, and July, 1988, the
170
Figure V.3. A - Total daily carbon dioxide assimilationzxmol g1 day1 July, 1987 - October, 1988,, B - maximum rateof carbon dioxide assimilation, and C - minimumintercellular carbon dioxide concentration for juvenile,small-adult, and large-adult J. occidentalis during the 15-month measurement period. During a month, the probabilitythat responses were similar between morphotypes was p <0.05(a/b).
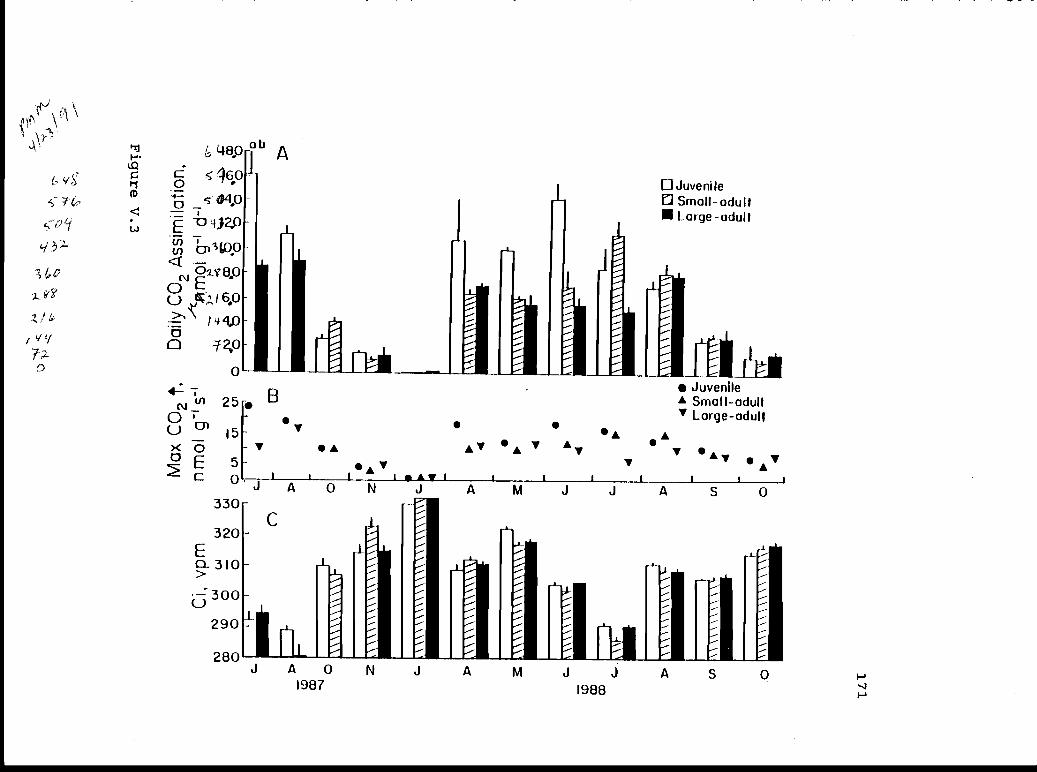
qqo1
z40
E j2,Q
2 hoozs8Q
o ,l600o 2b0
0
C
330-
320Eci 310>
300-
290
280
C
A
I I
A 0 N J
J A 01987
o JuvenileO Small-adult
Large-adult
E11Juvenile
£ Small-adult' Large-adult
Q
B.
V A
A M
172
first measurement periods when soil gravixnetric water
content was below 7% (Fig. V.1C), small-adults had higher
daily total carbon dioxide assimilation than juvenile
occidentalis (Fig. V.3A). As soil water became more
limiting, total daily assimilation of juveniles and small-
adults declined to levels similar to those measured in
large-adults.
For the 15-month measurement period, daily total carbon
dioxide assimilation per gram foliage in juvenile L
occidentalis was higher than daily total assimilation in
small-adults and large-adults, which were similar (Kruskal-
Wallis and Tukey tests, P < 0.05). Maximum rates of carbon
dioxide assimilation were higher in juveniles than small-
adults or large-adults during all sampling months except
November, 1987, January, August, and October, 1988 (Fig.
V.3B).
Calculated daily carbon dioxide assimilation for the
average large-adult J. occjdentalis used in this study.2
C
ranged from 281 g d1 tree1 on August 10, 1987, to 9 g d1
tree1 on January 2, 1988 (Table V.1).
The lowest calculated intercellular carbon dioxide
concentrations for juveniles, small-adults, and large-
adults, 274, 263, and 269 vpm, occurred during July, 1988.
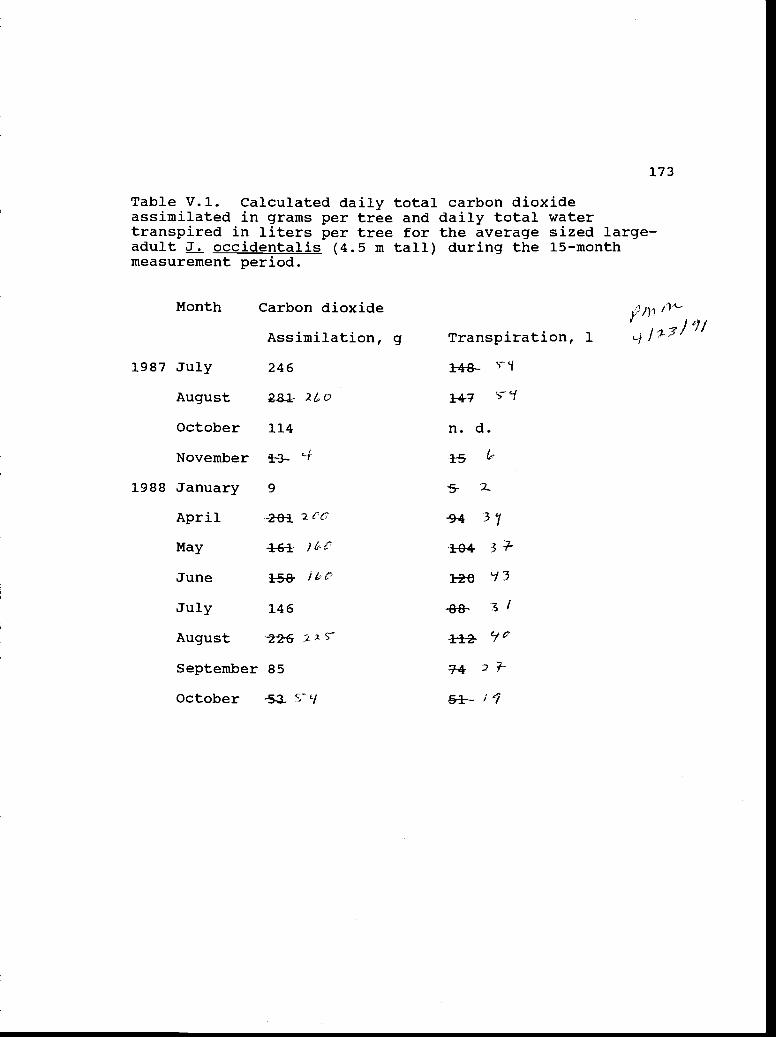
173
Table V.1. Calculated daily total carbon dioxideassimilated in grams per tree and daily total watertranspired in liters per tree for the average sized large-adult J. occidentalis (4.5 in tall) during the 15-monthmeasurement period.
Month Carbon dioxide
Assimilation, g
1987 July 246
j?)71Transpiration, 1
H-B- 'I
August 2.Z 2L0 14-7
October 114 n. d.
November LI
1988 January 9 5- 2.
'-9-4 3 7April 2 CC201
May 4-6-1 )L-C 164 3
June 15-8- /e 126
July 146 '
August '-26 -1±2- "
September 85 7-4 '
October -53- V/ 51 Ii

174
During the 15-month measurement period, mean intercellular
carbon dioxide concentrations for all three plant types were
lowest during July and August, 1987, and July, 1988, which
were periods of high carbon dioxide assimilation (Fig. V.3).
Intercellular carbon dioxide concentrations did not differ
significantly among juvenile, small-adult, and large-adult
J. occidentalis during any diurnal sampling period.
Conductance and transpiration
Diurnal conductance curves of juvenile J. occidentalis
were significantly higher than those of small-adults and
large-adults during April and June, 1988 (P <0.05) (Fig.
V.2C). In July, 1988, juvenile and small-adult conductance
curves were similar and significantly higher than the large-
adult curve (P <0.05) (Fig. V.2C). By September conductance
had decreased to less than 140 Jlmol g1 s1 throughout the day
and all three diurnal curves were similar (Fig. V.2C).
In April the diurnal course of carbon dioxide
assimilation plotted against the diurnal course of
conductance showed hysteresis with lower conductance,
indicating more closed stomata in the afternoon than in the
morning at similar levels of assimilation (Fig. V.4). The
diurnal course of assimilation versus conductance in
juvenile J. occidentaljs followed a different pattern than
175
Figure V.4. Plots of carbon dioxide assimilation (nmol g1s1) versus conductance (imo1 g1 s') during April, June,July, and September, 1988, for juveniles in the morning (Q)and afternoon (3), small-adults in the morning (A) andafternoon (A), and large-adults in the morning (7) andafternoon (y). Hand drawn curves indicate the direction ofthe diurnal course of measurements.
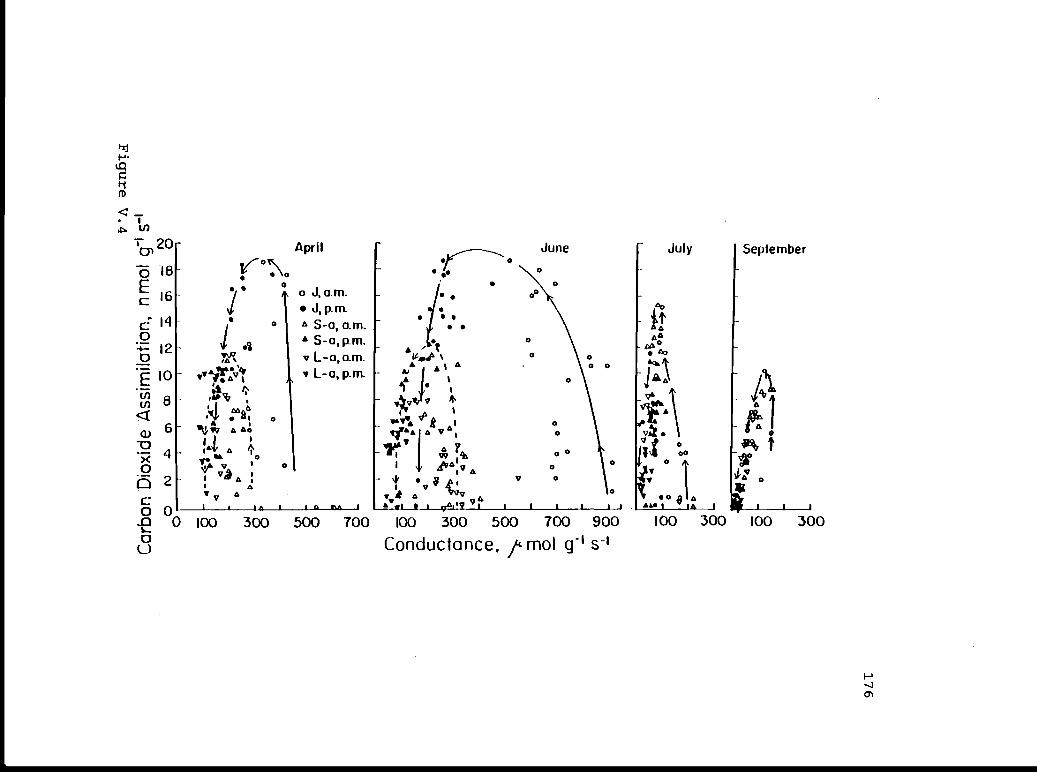
'1
.t,. 11)
120-ö 18
l6
012
-9:E'o
¶1:6 AAO
:9 I'1A 4
0
.2 I
02 I A1I A
'V
April
o J.am.J,p.rn.
A S-a, am.£ S-o,p.m.
L-o,a.m.L-o,p.m.
r-
t1IA V $
,IlII 4Aq
'ifI V
A
V
00
July September
r0
1
"0 00
SO 8 A
0*
June
0
0
0 0000
00
00
100 300 100 300300 500 700 100 300 500 700 900
Conductance, tmoI g' s100

177
patterns of small-adults and large-adults, which were
similar.
During June the morning increase in conductance at
similar levels of carbon dioxide assimilation in juvenile
occidentalis increased the hysteresis in juveniles compared
to that of small-adults and large-adults (Fig. V.4). The
range of morning values for conductance was broader than the
range measured during the afternoon. Differences between
April and June were due to the increase in morning
conductance; patterns of afternoon assimilation versus
conductance were similar in both months (Fig. V.4).
In July and September, hysteresis was reduced as were
differences between juveniles, small-adults, and large-
adults (Fig. V.4). By September, afternoon values of
assimilation and conductance were restricted to a narrow
range of low values.
During the 15-month measurement period, highest
conductance flux densities were 909 imol g1 s1 for juveniles
in June, 1988, 616 )nnol g1 s1 for small-adults in April,
1988, and 346 )lmol g1 s for large-adults in June, 1988
(Fig. V.5A). Juveniles had the highest conductance during
all measurement periods except January, September,

178
Figure V.5. A - Maximum conductance () pmol g1s1 and B -daily total transpiration imol g1 day1 for juveniles, small-adult, and large-adult 3. occidentalis. During a month, theprobability that responses were similar was p <0.05 (a/b).
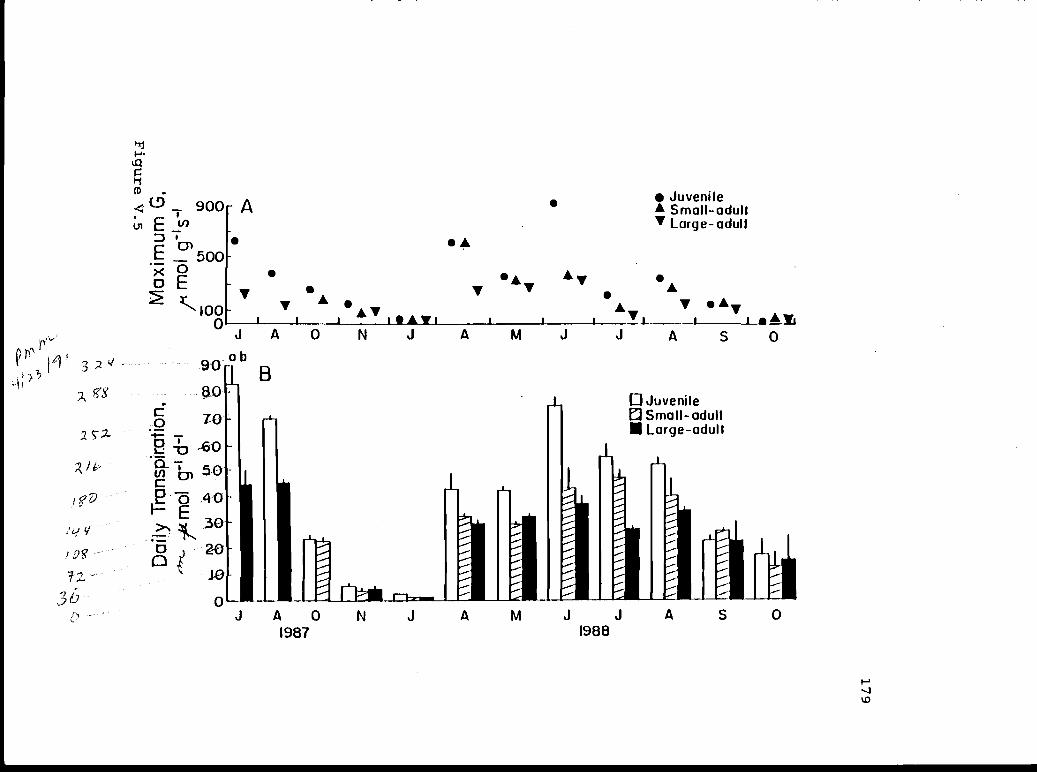
o 7-0
jS0ci -t3°E'o 4o
20
J A 01987
1N
Iii
O JuvenileSmall- adulta Large-adult
J A M J J A S 01988
CD
900 A . JuvenileA Small-adult' Large-adult
rG . .4C - 500
V.
VA
VA
A
0
A.AVI.AyI A V A.,
J A 0 N J A M J J A S 090ob
B
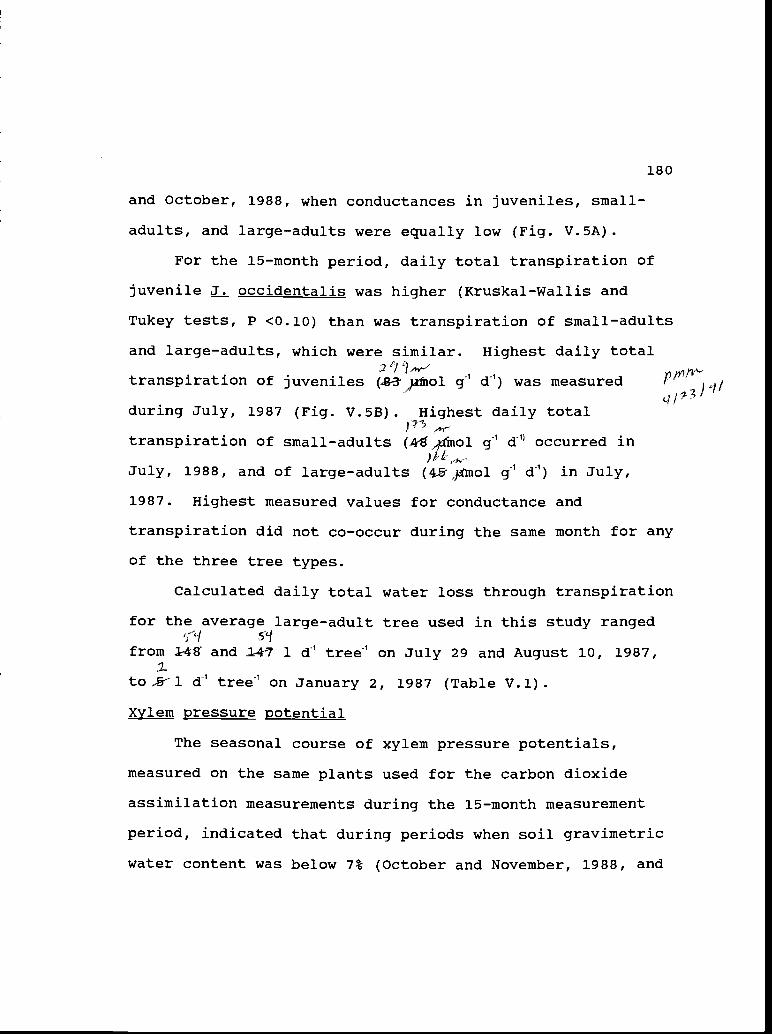
180
and October, 1988, when conductances in juveniles, small-
adults, and large-adults were equally low (Fig. V.5A).
For the 15-month period, daily total transpiration of
juvenile J. occidentalis was higher (Kruskal-Wallis and
Tukey tests, P <0.10) than was transpiration of small-adults
and large-adults, which were similar. Highest daily total
transpiration of juveniles (8-3j1ol g1 d1) was measured 1") /
during July, 1987 (Fig. V.5B). Highest daily total
transpiration of small-adults (k,no1 g1 d" occurred inii L-
July, 1988, and of large-adults (45jflnol g d1) in July,
1987. Highest measured values for conductance and
transpiration did not co-occur during the same month for any
of the three tree types.
Calculated daily total water loss through transpiration
for the average large-adult tree used in this study ranged5'I
from 1-48 and JA-7 1 d1 tree1 on July 29 and August 10, 1987,Itol d1 tree1 on January 2, 1987 (Table V.1).
Xylem pressure potential
The seasonal course of xylem pressure potentials,
measured on the same plants used for the carbon dioxide
assimilation measurements during the 15-month measurement
period, indicated that during periods when soil gravimetric
water content was below 7% (October and November, 1988, and
I

181
July, August, September, and October, 1988, Fig. V.lC),
juvenile J. occidentalis had more negative mean pre-dawn and
mid-day potentials than did small-adults or large-adults
(Fig. V.6). The most negative pre-dawn and mid-day xylem
pressure potentials for juveniles (-3.8 and -5 MPa), small-
adults (-3.2 and -4.9 MPa), and large-adults (-3.1 and -4.2
MPa) were measured during September and October, 1988, after
soil moisture at the 10 - 50 cm depth had been below 7%
gravimetric water content for 3 - 4 months (Fig. V.1C).
Comparisons of the daily course of xylem pressure
potentials indicated that juvenile J. occidentalis had
significantly more negative potentials than small-adults or
large-adults during October and November, 1987, and June,
August, September, and October, 1988 (P <0.05).
Potential maximum response
Graphs with a hand-drawn boundary of the probable upper
limit of observations using intensive and extensive
measurements for April, June, July, and September, 1988,
i.e. potential maximum response (Jarvis 1976), indicate that
during April and June, 1988, carbon dioxide assimilation in
juvenile J. occidentalis was 170 - 280% higher than
assimilation in small-adults and 160 - 270% higher than
assimilation in large-adults at similar PPFD (Fig. V.7A).

182
Figure V.6. Mean predawn, mean midday minimum and absoluteminimum xylem pressure potentials, - MPa, for juvenile( ), small-adult (A), and large-adult ( )
occidentalis during the 15-month measurement period.
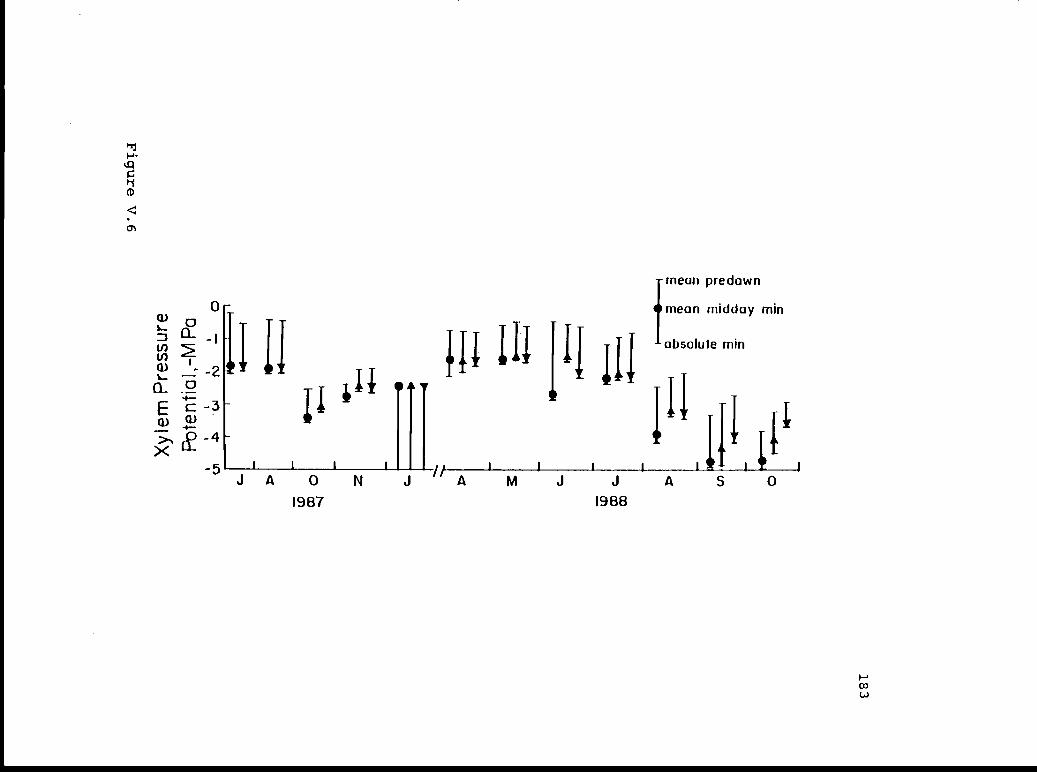
mean predawn
0- fmeon midday mmcu0 T
U'absolule mm
-a)
IJJ,,><5 1 1 I I
J A 0 N J A M J J A S 01987 1988

184
Figure V.7. A - Potential maximum carbon dioxideassimilation, ,umol g1 s, versus photosynthetic photon fluxdensity (PPFD), ,uinol m2 s1), and B versus leaf temperature,°C, for juveniles ( ), small-adult (--- -), and large-adult (.-) J. occidentalis during April, June, July, andSeptember, 1988.

C',
o -2E20
o 14
C
EC')U,C
c..j -2
82014
Figure V.7
20 . April 20
14 4
2
-2
'I2,
'4-
2
June
July
September
-2 I t I
0 400 1200 2000PPFD, ,'c. mol m2s
8
2
-220
14
8
2
-2
14
- - Juvenile8: ,7 'N - - - Small-adult 8
- Large-adult
2
B April
September
-2 I I I I I
0 10 20 30 40
Leaf Temperature, °C
185
186
Assimilation of small-adults did not appear to be light
saturated during the June measurements. In July,
assimilation in small-adults was higher than assimilation of
juveniles at similar PPFD, but juveniles did not appear to
be light saturated. By September carbon dioxide
assimilation decreased in all three plant types with PPFD
above 400 pmol m2 s1.
Carbon dioxide assimilation was 80% of maximum over the
broadest range of leaf temperatures during June, 12 - 31°C,
17 - 33°C, and 14 - 33°C for juveniles, small-adults, and
large-adults, respectively (Fig. V.7B). The relationship
between assimilation and leaf temperature showed little
seasonal adjustment. In April the minimum leaf temperatures
for 80% carbon assimilation was 12 - 15°C in the three plant
types; in September leaf temperatures above 27°C in
juveniles and above 33°C in small-adults and large-adults
reduced assimilation below 80% of maximum.
During April, June, and July, and September, 1988,
juvenile J. occidentalis, with similar or lower xylem
pressure potentials than small-adults or large-adults,
consistently had the highest measured conductance (Fig.
V.8A). Decreasing xylem pressure potentials had the largest
effect on conductance during June; by September conductance
187
Figure V.8. Potential maximum conductance umol g1verses: A -xylem pressure potential ( t' )
MPa, and B - vaporpressure deficit (3) kPa for juvenile ( ), small-adult(__ _), and large-adult ( ) J. occidentalis during April,June, July, and September, 1988.
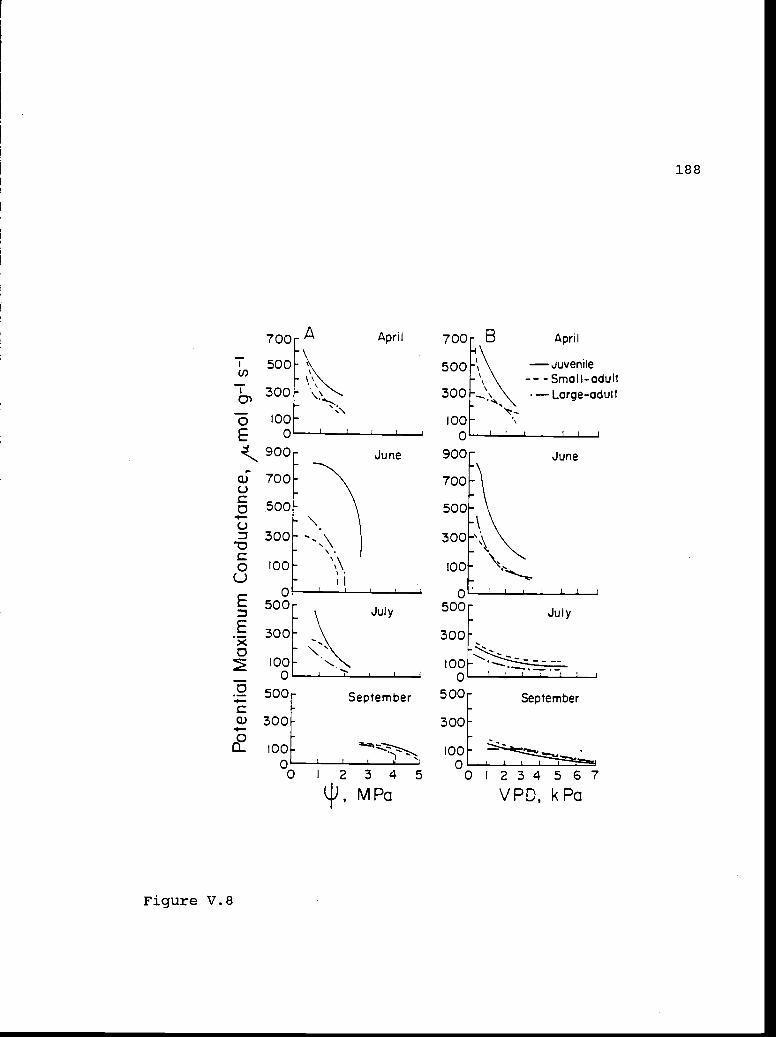
188
Figure V.8
'I)
0E
Q)0CD0
C0UE
E>(0
04-Ca.)
700- April
500-
300-
100-0
300
100
0500-
300
100-0
500
300:
00
July
September
MPa
700
500
300
000
900- June 900
700
500- 500
300
100
:"\
500-
300
000
500
- Juvenile-- - Small-adult
Large-adult
June
July
September
300
too -0
0 1234567VPD, kPa

189
in juveniles, small-adults, and large-adults was equally low
as xylem pressure potentials declined from -3 to -4.8 MPa.
The steepest decreases in conductance relative to
increasing vapor pressure deficits in juvenile, small-adult,
and large-adult J. occidentalis were measured in April and
June (Fig. V.8B). During July and September when vapor
pressure deficits increased to 4 - 7 kPa, the low
conductance of all three plant types remained relative
constant.
Foliar nutrients
Nitrogen concentrations in juvenile foliage were
highest during July, 1987, 1.30% (Table V.2). Small-adults,
which were not sampled in July, 1987, had the highest
measured foliage nitrogen in August, 1987. Large-adult
foliage nitrogen concentrations were 1.24% in July, 1987 and
1.25% in October, 1987, and February, 1988. The lowest
foliage nitrogen concentrations in juveniles, small-adults,
and large-adults, 0.90%, 0.83%, and 0.94%, respectively,
were measured in May, 1988. Nitrogen concentrations in
juvenile foliage were significantly lower than nitrogen in
small-adult foliage in August, 1987 (P <0.05), and in June
and July, 1988 (P <0.10). In August 1988, large-adult
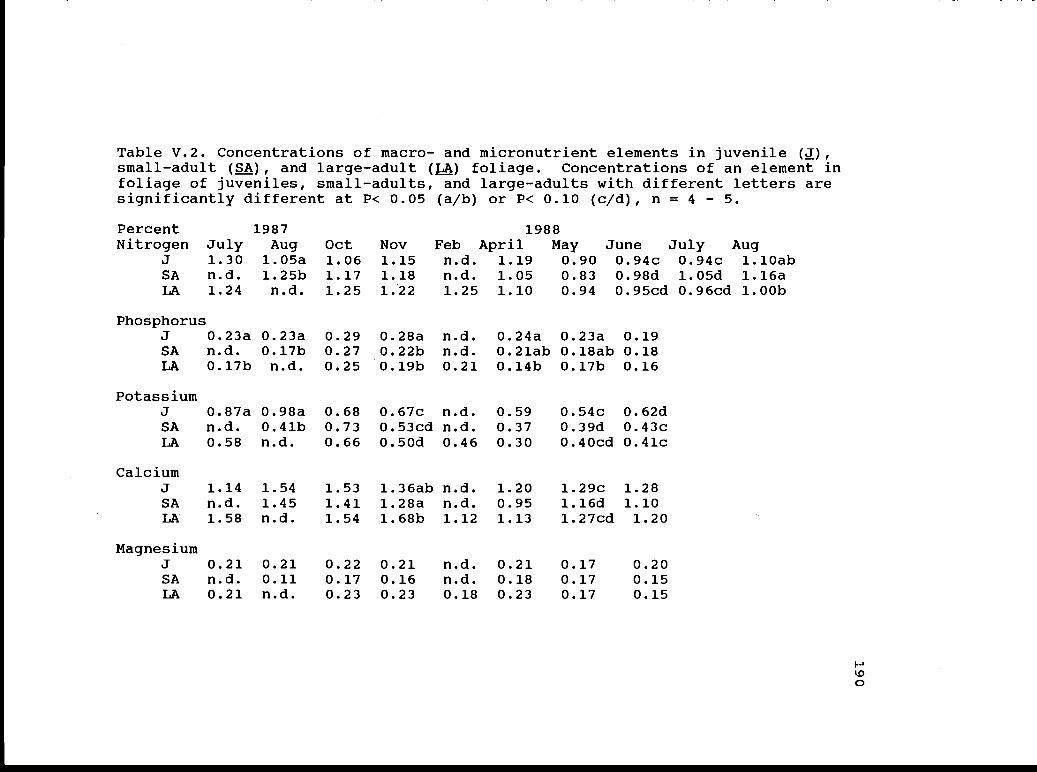
Table V.2. Concentrations of macro- and micronutrient elements in juvenile (i),small-adult (SA), and large-adult (j) foliage. Concentrations of an element infoliage of juveniles, small-adults, and large-adults with different letters aresignificantly different at P< 0.05 (a/b) or P< 0.10 (c/d), n = 4 - 5.
Percent 1987 1988Nitrogen July Aug Oct Nov Feb April May June July Aug
J 1.30 l.05a 1.06 1.15 n.d. 1.19 0.90 0.94c 0.94c 1.lOabSA n.d. 1.25b 1.17 1.18 n.d. 1.05 0.83 0.98d 1.05d 1.l6aLA 1.24 n.d. 1.25 1.22 1.25 1.10 0.94 0.95cd 0.96cd 1.00b
PhosphorusJ 0.23a 0.23a 0.29 0.28a n.d. 0.24a 0.23a 0.19SA n.d. O.17b 0.27 0.22b n.d. 0.21ab 0.l8ab 0.18LA 0.17b n.d. 0.25 0.19b 0.21 0.14b 0.17b 0.16
PotassiumJ 0.87a 0.98a 0.68 0.67c n.d. 0.59 0.54c 0.62dSA n.d. 0.4lb 0.73 0.53cd n.d. 0.37 0.39d 0.43cLA 0.58 n.d. 0.66 0.50d 0.46 0.30 0.4Ocd 0.41c
CalciumJ 1.14 1.54 1.53 l.36ab n.d. 1.20 1.29c 1.28SA n.d. 1.45 1.41 1.28a n.d. 0.95 1.16d 1.10LA 1.58 n.d. 1.54 1.68b 1.12 1.13 1.27cd 1.20
MagnesiumJ 0.21 0.21 0.22 0.21 n.d. 0.21 0.17 0.20SA n.d. 0.11 0.17 0.16 n.d. 0.18 0.17 0.15LA 0.21 n.d. 0.23 0.23 0.18 0.23 0.17 0. 15
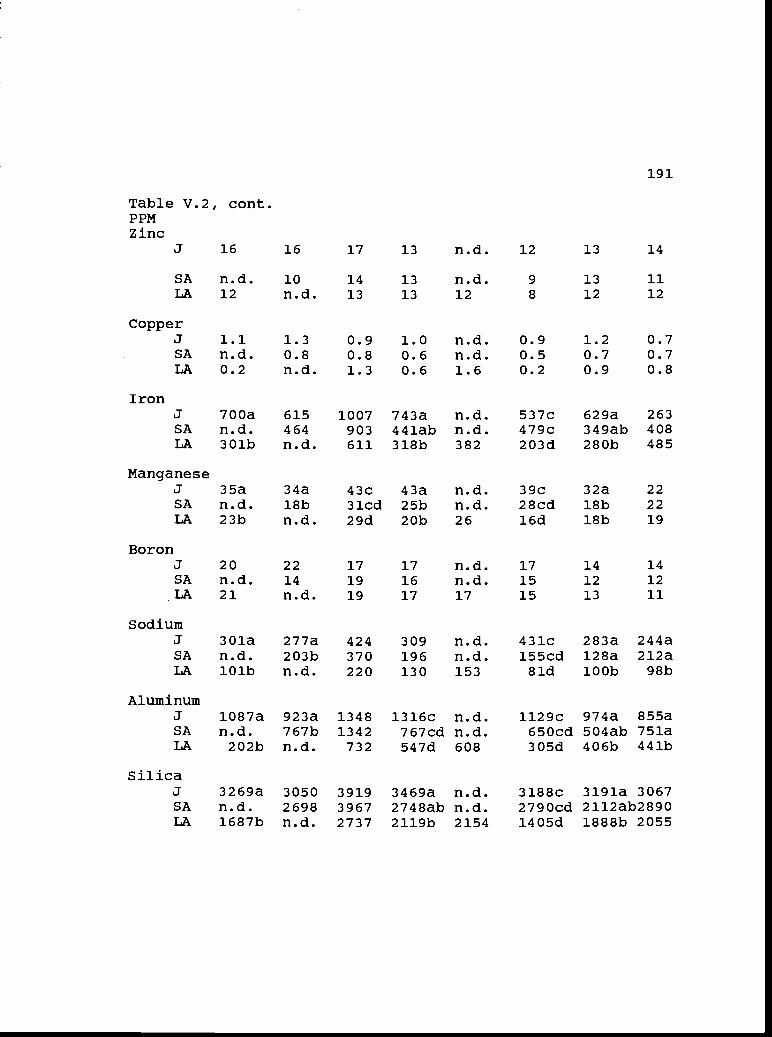
Table V.2,PPMZinc
cont.
191
J 16 16 17 13 n.d. 12 13 14
SA n.d. 10 14 13 n.d. 9 13 11LA 12 n.d. 13 13 12 8 12 12
CopperJ 1.1 1.3 0.9 1.0 n.d. 0.9 1.2 0.7SA n.d. 0.8 0.8 0.6 n.d. 0.5 0.7 0.7LA 0.2 n.d. 1.3 0.6 1.6 0.2 0.9 0.8
IronJ 700a 615 1007 743a n.d. 537c 629a 263SA n.d. 464 903 441ab n.d. 479c 349ab 408LA 30 lb n.d. 611 3l8b 382 203d 280b 485
ManganeseJ 35a 34a 43c 43a n.d. 39c 32a 22SA n.d. l8b 3lcd 25b n.d. 28 cd l8b 22LA 23b n.d. 29d 20b 26 l6d l8b 19
BoronJ 20 22 17 17 n.d. 17 14 14SA n.d. 14 19 16 n.d. 15 12 12LA 21 n.d. 19 17 17 15 13 11
SodiumJ 30 la 277a 424 309 n.d. 43lc 283a 244aSA n.d. 203b 370 196 n.d. 155cd 128a 212aLA 10 lb n.d. 220 130 153 81d lOOb 98b
AluminumJ 1087a 923a 1348 1316c n.d. 1129c 974a 855aSA n.d. 767b 1342 767cd n.d. 650cd 504ab 751aLA 202b n.d. 732 547d 608 305d 406b 441b
SilicaJ 3269a 3050 3919 3469a n.d. 3l88c 3191a 3067SA n.d. 2698 3967 2748ab n.d. 2790cd 21l2ab2890LA l687b n.d. 2737 21l9b 2154 1405d 1888b 2055
192
foliage had significantly lower nitrogen than small-adult
foliage (P <0.05) (Table V.2).
During the eight measurement periods for which data
were available, concentrations of phosphorus and potassium
in juvenile J. occidentalis foliage were 0.19% to 0.29% and
0.54% to 0.98%, respectively, significantly higher than
concentrations in small-adult and/or large-adult foliage (P
<0.05 - 0.10) during five of the eight periods (Table V.2).
Calcium concentrations in small-adult foliage were
significantly lower than concentrations in large-adult
foliage in November, 1987, (P <0.05) and lower than
concentrations in juvenile foliage in May, 1988 (P <0.10)
(Table V.2).
Juvenile foliage had significantly higher (P <0.05)
concentrations of manganese, sodium, and aluminum than
small-adult foliage during August, 1987 (Table V.2).
Juvenile foliage also had significantly higher (P <0.05)
concentrations of iron, manganese, sodium, aluminum, and
silica than did large-adult foliage for 3-4 months during
the 15-month measurement period. Concentrations of
magnesium, zinc, copper and boron did not differ
significantly among the three plant types.
193
Soil analysis
The composite soil sample from 0 - 30 cm depth from the
inter space between trees contained 3.1 mg kg1 ammonium, 0.7
mg kg1 nitrate, 10 mg kg1 phosphorus, 620 mg kg1 potassium,
and 6.6, 2.9, 0.10, and 0.27 meaJlOO grams of calcium,
magnesium, solidum and boron, respectively. Soil pH ranged
from 6.4 at 0-3 cm to 7.6 at 35 cm.
Specific leaf mass
Specific leaf mass of juvenile, small-adult, and large-
adult J. occidentalis foliage ranged from 106 - 256, 215 -
370, and 213 - 352 g m2, respectively, during the 15-month
measurement period (Fig. V.9). Juvenile specific leaf mass
was significantly lower (P <0.05) than the specific leaf
mass of small-adults and large-adults during all measurement
periods except January, April and Nay, 1988.
Branchlet elongation
From August, 1987, to September, 1988, the combined
elongation growth of all branchlet segments increased mean
branchlet length of juveniles 2.8 ± 0.3 times the initial
measurements and of small-adults 4.7 ± 0.8 times (± SE, n
= 5 for juveniles and n = 4 for small-adults). Relative
branchiet elongation was minimal on five juveniles and four
194
Figure V.9. Specific leaf mass, g m2, for juvenile, small-adult, and large-adult J. occidentalis during the 15-monthmeasurement period. During a month, the probability thatresponses were similar was p <0.05 (a/b).
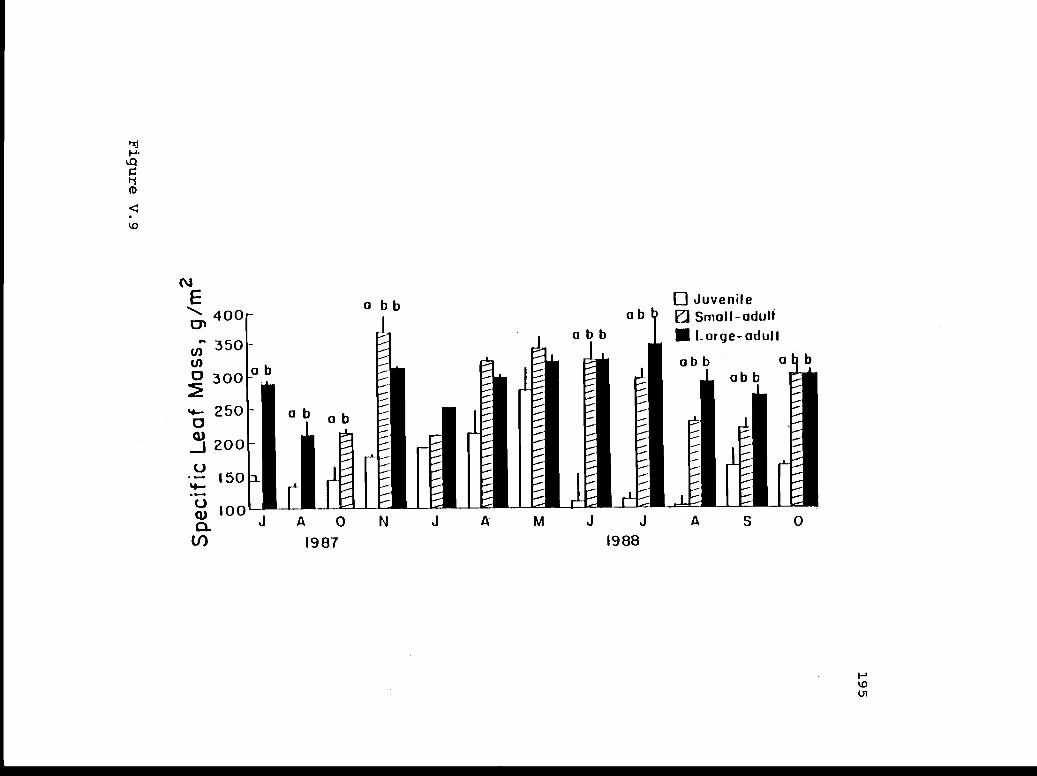
(\1
E400
350
300 ab
250 oba)j 200U 50.Uw tOO0U) 1987
a bb o JuvenileD Small-adult
Large-adult
abbab b
M J J S 01988

196
small-adults J. occidentalis from August, 1987 until May,
1988 (Fig. V.10). Between May and June the relative
elongation of juveniles was higher than that of small-
adults; however, from June to July small-adult branchlets
grew at a higher rate than juveniles. After July, relative
elongation in juveniles declined to below rates measured
during May while growth of small-adults increased. Relative
branchiet elongation from July to August was significantly
higher in small-adults than in juveniles (P <0.04). No
additional elongation was measured on juvenile or small-
adult branchiets from August to September, 1988.
Branchlet elongation of five internal replicated
branchiets on the fifth small-adult J. occidentalis was
consistently higher than 1 SD of the mean of the other four
small-adults and was plotted as an outlier (Fig. V.10).
From August, 1987, to September, 1988, branchiet elongation
on the fifth small-adult was 17.4 ± 2.3 (x ± SE, fl = 5)
times the initial measurements.
Quantum-, water-, and nitrogen-use-efficiencies
During April and July, diurnal curves of potential
maximum quantum-use-efficiencies (the hand-drawn probable
upper boundary of carbon dioxide assimilation in nmol m2s'
/photosynthetically active photon flux density in imol

197
Figure V.10. Mean branchlet elongation (± 1 SD) relative toinitial measurement (where initial conditions = 1) forjuvenile ( , n = 5) and small-adult ( A ,n = 4) Loccidentalis during the 15-month measurement period. Onesmall-adult with elongation > 1 SD of the mean is plotted asan outlier ( A ). Elongation of juveniles and small-adultswas significantly different in August (P< 0.05).

861
(D
-4
BranchJet
Elongation,
relative to
inifial m
easurement
N)
(J -
(7 0)
OV
A
eInbTI I
199
it2s1, OUE) had a bimodal diurnal pattern with peaks in the
early morning and late afternoon (Fig. V.11A). Reduced PPFD
in the morning during the June measurements increased OUE
until 1130 hr; during September, only QUE of juvenile Loccidentalis showed some recovery from the mid-day
depression.
During the 15-month measurement period, calculated
daily total OUE (daily total carbon dioxide
assimilation/daily total photosynthetically active photon
flux density) of juvenile J. occidentalis was consistently
lower than daily total OUE of small-adults and large-adults
and significantly lower in October and November, 1987, and
July, 1988 (P <0.05) (Fig. V.l2A); however, for the 15-month
period OUE of the three plant types was not significantly
different (Kruskal-Wallis test). The high daily total OUE
calculated for all three morphotypes in November, 1987, was
the result of low PPFD rather than high carbon assimilation.
Diurnal curves of potential maximum water use
efficiency (the hand drawn probable upper boundary of carbon
dioxide assimilation nmol g1 s1/transpiration ,umol g1
) for April and June, 1988, indicated that juvenile,
small-adult, and large-adult maximum WtJE remained high and
relatively constant throughout the day (Fig. V.11B). In

Figure V.11. A - Potential maximum quantum use efficiency(OUE) and B - potential maximum water use efficiency ()of juvenile ( ), small-adult (......
), and large-adult(._) J. occidentalis during April, June, July, andSeptember, 1988.
200

'U-)c
E0E=
LL
a. 0a.
'(I)
0ECC0C
EC,,C')C
c'J0U
w0
0E
E5.)<C
C
a)
3
00600
Figure V.11
April
JuI y
1200
September
4
T3
EJuvenile
- - - Small-adult- Large-adult
April
201
02000 0800
Hour20001200 1600
202
Figure V.12. A - daily total quantum use efficiency (OUE),B- water use efficiency (WtJE), and C - potentialphotosynthetic nitrogen use efficiency (PPNUE) for juvenile,small-adult, and large-adult J. occidentalis during the 15-month measurement period. During a month, the probabilitythat responses were similar was p <0.05 (a/b) and p <o.10(c/d).

co
w
-4
PPNU
E, tm
o C
O2(m
oiN)S
r C
C
0
-
'unfluflw
iunflu"
C.
WU
E,
n m
ol C
O2
(tmot
H2O
Y'
g' d
C
C.
"flu" "nun"
U",
'fl'*u'fl"
Lull"'"
Th
n
TA
einbi
QU
E,
nrnol C
O2
(tmo
PP
FD
Y'
m2d (.J
(J0 -

204
July, juvenile and large-adult E declined after 1030 hr
and had only a small recovery after 1700 hr; small-adults
had higher WUE for most of the day and a more pronounced
late afternoon recovery. In September of all three
plant types before 0900 hr was similar to E measured
during April, June, and July, but in September E declined
steeply during the remainder of the day, with no measured
late afternoon recovery.
During the 15-month measurement period, daily total ¶
(daily total carbon dioxide assimilation/daily total
transpiration) of juvenile J. occidentalis was significantly
lower than WUE of small-adults during July and August, 1988,
(P <0.07) and lower than WUE of large-adults in August, 1987
(P <0.05) (Fig. V.12B). However, over the 15-month period
WUE of the three plant types was not significantly
different.
Potential photosynthetic nitrogen-use efficiencies
(maximum carbon dioxide assimilation in nmol g7nitrogen
concentration in mol g1, PPNUE) (Field and Mooney 1986) of
juvenile J. occidentalis were significantly higher than
PPNTJE of large-adults in July (P <0.02) and of small-adults
in November, 1987 (P <0.07); higher than PPNUE of small-
adults and large-adults in May and June, 1988 (P <0.05); and

205
higher than PPNTJE of large-adults in July, 1988 (P <0.05)
(Fig. V. 12 C). When PPNIJE was coipared over the 15-month
measurement period, juveniles had a higher efficiency than
both small-adults (P <0.05) and large-adults (P <0.15).
206
DISCUSSION
Carbon dioxide assimilation
Diurnal curves of carbon dioxide assimilation of
juvenile, small-adult, and large-adult J. occidentalis for
April and June, 1988, (Fig. V.2B) support the hypothesis
that periods of minimal soil water stress and relatively low
atmospheric stress allow single-peaked diurnal assimilation
responses. During these periods, daily total assimilation
is limited by irradiance and temperature (Tenhunen et al.
1984)
Unusually high precipitation (95 nun, p <0.001) during
July, 1987 (Fig. V.lB) and the presence of young foliage
during July (Fig. V.10) produced a combination of
environmental and phenological factors that resulted in the
highest measured daily carbon dioxide assimilation per gram
foliage in juvenile J. occidentalis and the second highest
in large-adults (Fig. V.3A). Highest daily assimilation in
large-adults was measured during the following month,
perhaps because of later foliage growth (Fig. V.10) or lag
time in the response of larger trees. Foliar nitrogen
concentrations were also high during July, 1987 (Table V.2),
when high soil moisture and warm soils may have stimulated
microbial activity, root growth, and nitrogen absorption.
207
High daily assimilation measured during July, 1987, was not
repeated in July, 1988, when gravimetric water content of
the soil was 7% (Fig. V.lC) and tissue nitrogen
concentrations in juvenile and large-adult foliage were 72%
and 77% of those measured in July, 1987 (Table V.2). Soil
water availability and its effect on foliar nitrogen
concentrations appeared to be more important than the
presence of young foliage in determining total daily
assimilation.
Total daily carbon dioxide assimilation of juvenile
occidentalis responded more rapidly to changes in available
soil moisture than did large-adult daily assimilation. As
gravimetric water content in the 10 - 50 cm horizon
decreased between June and July, l88 (Fig. VlC), total
daily assimilation per gram juvenile foliage declined 40%
while daily assimilation in large-adults declined only 9%
(Fig. V.3A). During the same period daily total
transpiration declined 35% in juveniles and 27% in large-
adults (Fig. V.5B). Declines in assimilation and
transpiration paralleled each other in juveniles. In large-
adults, assimilation declined less rapidly with declining
soil water than did transpiration; as a result, E of
juveniles declined 29% while E of large-adults increased
208
by 27% between the June and July, 1988, measurements (Fig.
V.l2B). During periods of declining soil water
availability, large-adults were more efficient users of
water resources than were juvenile J. occidentalis.
Responses of small-adult j. occidentalis during these
two summers with differing soil water availability can not
be evaluated, because small-adults were not measured during
July and August, 1987. However, the response of daily
assimilation in small-adults appears to follow a different
pattern than that measured in juveniles and large-adults.
Highest total daily carbon dioxide assimilation of small-
adults was measured during July, 1988, an increase of 62%
over June, 1988 (Fig. V.3A), as soil water content at 10 -
50 cm declined from >15% to -7% (Fig V.1C).
High rates of carbon dioxide assimilation over a broad
range of environmental conditions may be advantageous for
juvenile J. occidentalis establishment in Arteinisia
communities. Juvenile J. occidentalis appear to have the
capacity for higher carbon assimilation over a broader range
of stomatal resistances, as measured by conductance (55 -
603 ).lmol g1 s1), and plant water status, as measured by
xylem pressure potentials (-1.4 to -4.3 MPa), than do small-
adults or large-adults, where the range of associated
209
conductance was 51 - 208 Jlmol g1 s1 and the range of
associated xylem pressure potentials was -1.1 to -3.5 MPa.
Higher assimilation of juveniles was not consistently
related to their higher tissue nitrogen concentrations;
concentration of nitrogen were higher in juvenile foliage
than in foliage of small-adults and large-adults only during
July, 1987, and April, 1988 (Table V.2).
Rates of carbon dioxide assimilation and conductance
need to be measured on juvenile and adult foliage on the
same tree and on adjacent juveniles and large-adults to
determine if tissue type or tree type is the more important
factor affecting physiological processes.
The highest daily total carbon dioxide assimilation per
gram foliage in juvenile, small-adult, and large-adult
occidentalis measured in this study (Fig. V.3A) was only
81%, 59%, and 36% of the net photosynthesis per day measured
during the summer in 4-yr, 40-yr. and 75-yr Pinus ponderosa
growing at 1300 m elevation in the Sierra Nevada of
California (Helms 1970). Daily net photosynthesis of the
most productive tissue was higher in older P. ponderosa than
in younger trees; carbon dioxide assimilation decreased in
older J. occidentalis compared to small-adult or juveniles.
Reductions in assimilation in older J. occidentalis may be a

210
phenotypic response to limited resources in the environment
or a genotypic constraint to resource acquisition.
Conductance and transpiration
Effects of vapor pressure deficits and plant water
status on stomatal closure and conductance have been
discussed at length (Jarvis and McNaughton 1986, Schulze
1986). In some plant species, leaf water potential was
correlated with reduced conductance (Roy and Mooney 1982);
other studies indicated that vapor pressure deficit
(Tenhunen, Pearcy, and Lange 1987) or soil water status
(Turner et al. 1985, Gollan et al. 1985) were the most
important factors affecting stomatal closure and reducing
conductance. Changes in xylem pressure potentials and vapor
pressure deficit were not strongly related to seasonal
changes in conductance in J. occidentalis (Fig. V.8). Soil
water appears to be the more important variable. As soil
gravimetric water content decreased from June to July, 1988,
(Fig. V.1C), maximum conductance decreased 47%, 40%, 66% in
juveniles, small-adults, and large-adults, respectively,
with little change in xylem pressure potentials or vapor
pressure deficit (Fig. V.8). During June, high conductance
in juveniles resulted in more negative mid-day xylem
pressure potentials than were measured in July when soil
211
water content was low (Fig. V.6). By July, increasing vapor
pressure deficits from 1 - 4.8 kPa had little effect on
conductance (Fig. V.8B). Data for J. occidentalis support
the hypothesis that soil drought affects conductance
independent of plant water potential or vapor pressure
deficit (Schulze 1986).
Field measurements of Eucalyptus cilobulus in Portugal
during spring and summer indicated that carbon dioxide
assimilation and leaf conductance were linearly related
during the time of day when assimilation was maximal
(Pereira et al. 1987). A similar pattern was measured in
juvenile J. occidentalis (r = 0.43, P <0.03) but there was
no seasonal correlation between maximum assimilation and
conductance in small-adults or large-adults (r = 0.22 and
0.25, respectively). Juveniles may have tighter stomatal
control over water loss than do large-adults.
In juvenile, small-adult, and large-adult Loccidentalis stomata were more open than necessary to
produce maximum rates of carbon dioxide assimilation during
April and June (Fig. V.2C). Maximum carbon assimilation was
measured with conductance fluxes 1/3 to 1/2 of maximum.
During July, the diurnal variation in stomatal aperture, as
measured by conductance, was only about 1/3 of the range

212
measured in June, but maximum carbon dioxide assimilation in
small-adults was higher than in June. Juniperus
occidentalis can achieve rates of carbon dioxide
assimilation -80% of maximum with stomates open only -30% of
maximum when young tissue is present.
During periods of adequate soil water availability,
occidentalis did not reduce stomatal conductance to match
its photosynthetic capacity. The carboxylating capacity of
the foliage, i.e., the amount of carboxylating enzyme
present (RUBISCO, ribulose-1, 5-bisphosphate carboxylase-
oxygenase) or regeneration of the carbon dioxide acceptor
(RuBP, ribulose-1, 5-bisphosphate), rather than stomatal
restriction of carbon dioxide transport may limit
assimilation in J. occidentalis during periods when
temperature and soil water were adequate (Field and Mooney
1986). Low carboxylation capacity and/or low acceptor
regeneration may not allow J. occidentalis to increase
carbon dioxide assimilation to take advantage of seasonally
available soil water. Water was lost from stomata that were
open more than needed for the adequate uptake of carbon
dioxide because of the low photosynthetic capacity of
occidentalis.

213
During most years, soil water may not limit daily
conductance for J. occidentalis in the research area. In
semi-arid environments, a precipitation event must yield 15
mm of moisture to produce a shrub response (Charley 1972).
Based on the 30-yr precipitation record for Redmond, OR
(NOOA 1982), the probability of a 4-month summer period
without a 15-nun precipitation event is 35% (Chow 1976).
During 2 out of 3 years, juvenile and small-adult root
systems appear to be adequate to support daily conductance
without mid-morning stomatal closure (Chapter II).
Both RUBISCO carboxylase-oxygenase and compounds
involved in regenerating RUBISCO are "expensive" in terms of
nitrogen (Harley et al. 1986). Carboxylation capacity may
be modulated to match limited nitrogen availability rather
than seasonally limited soil water availability. Due to low
soil nitrogen availability, nitrogen may remain limited even
during periods of high soil water availability. Inefficient
water loss by high transpiration may be required to provide
nitrogen. However, nitrogen may not be preferentially
allocated to carboxylating enzymes, but rather to anti-
herbivore compounds. A study on the response of
occidentalis to an April nitrate fertilizer application
reported increased tissue nitrogen concentrations during May
214
and July in juveniles and small-adults but no concomitant
increase in carbon dioxide assimilation (Chapter IV).
Patterns in J. occidentalis of afternoon reductions in
conductance with carbon assimilation rates similar to those
measured during the morning (Fig. V.4) were also reported
for Eucalyptus qlobulus growing in the field in Portugal,
where the pattern was not related to changes in vapor
pressure deficits (Pereira et al. 1987). A reduction in the
balance of cytokinin/ABA due to a partial droughting of the
roots may be responsible for afternoon reductions in
stomatal opening which reduce conductance but do not affect
photosynthesis (Blackman and Davies 1985).
Daily total water loss through transpiration calculated
for the average large-adult J. occidentalis in this study
was i-1rto the 121 1 d1 calculated for a J. occidentalis
with a basal diameter 30.5 cm growing near Burns, OR
(Miller, Angell, and Eddleman 1987). The availability of
data on the seasonal course of daily transpiration (Fig. 5B)
plus information on tree density and precipitation patterns
can be used in simulation models to estimate water loss from
juniper communities on larger spatial and temporal scales
than were considered in this study.
215
Leaf temperature
The high temperature compensation point, i. e., the
maximum temperature for carbon dioxide assimilation, of
occidentalis was 43°C (Fig. V.7B), slightly higher than the
compensation point reported for other conifers, 3 5-42°C
(Larcher 1983). Juniperus occidentalis appears adapted to
maintain positive carbon dioxide assimilation with high leaf
temperatures and declining xylem pressure potentials. As
soil water content decreased from April to September, 1988
(Fig. V.lC), with a corresponding decline in pre-dawn xylem
pressure potentials from -0.5 to -2.7 MPa (Fig. V.6), the
high leaf temperature compensation point for J. occidentalis
increased from 27 °C to 43 °C (Fig. V.7B). Under
experimental conditions, the high compensation point of
carbon dioxide assimilation in Quercus suber in Portugal
occurred at lower leaf temperatures as soil moisture
declined and pre-dawn xylem pressure potentials became more
negative (Tenhunen et al. 1987).
Foliar nutrients
Although nitrogen concentrations in J. occidentalis
foliage (Table V.2) were at the low end of values reported
for other evergreen trees and shrubs (Field and Mooney
1986), during October, 1987, they were higher than the mean

216
nitrogen concentration in juvenile and mature J. osteosperma
foliage collected during September and October from 17 sites
in Utah (Bunderson and Weber 1986). Phosphorus
concentrations in J. occidentalis were 2 - 2.6x and iron 5.5
- 6x higher than those reported for in J. osteosperina.
Concentrations of calcium were similar in the two studies.
Soil analysis
Nitrate and ammonjum in soils at the research site were
at concentrations considered to be low to very low and
marginal for plant growth (Preston 1942, Barth 1980) but
were similar to concentrations measured between trees in a
pinyon-juniper stand near Sedona, AZ (DeBano et al. 1987).
Concentrations of phosphorus, potassium, and calcium were
higher than and concentrations of magnesium similar to the
mean mineral composition of soil from 17 pinyon-juniper
sites in Utah (Bunderson et al. 1985).
Branchlet elongation
In J. occideritalis, maximum branchlet elongation
occurred in June and July. Cumulative leader elongation of
Juniperus osteosperma, J. inonosperma, scopulorum, and
deppeana growing near Flagstaff, AZ, was also highest during
June and July (Herman 1956). Initiation of foliage growth
in J. occidentalis may be delayed until late May/early June
217
because cambial growth preceded branchlet elongation. In
californica the previous year's phloem and xylem cells,
which died during the winter, were replaced during April and
May; cambial growth slowed in early June and was completed
by late June (Alfieri and Kemp 1983). With its low rates of
carbon dioxide assimilation, J. occidentalis may not be able
to support simultaneous growth of cambium and foliage.
During the period of maximum branchlet elongation in
June and July, 1988 (Fig. V.10), minimal pre-dawn xylem
pressure potentials were -1.1 MPa in juveniles and -0.9 MPa
in small-adults (Fig. V.6). No additional branchiet
elongation was measured after August 3, 1988, when pre-dawn
pressure potentials were -2.4 and -2.1 in juvenile and
small-adult J. occidentalis, respectively. Growth appears
to be possible at more negative xylem pressure potentials in
juvenile foliage than in adult foliage on small-adult trees.
Periods of rapid growth in juveniles and small-adult
occidentalis, June and July 1987, respectively, were
associated with high daily total carbon dioxide assimilation
(Fig. V.3A), which may indicate the higher assimilation
capacity of young tissue. A different pattern was observed
in P. ponderosa where 2-yr-old needles had higher average

218
net photosynthesis than did current-year needles (Helms
1970)
Specific leaf mass
Specific leaf mass (SLM) varies with mesophyll area and
RTJBP-carboxylase activity and is highly correlated with
photosynthetic rate in annual crops, broad leaf woody
species, deciduous and evergreen conifers (e.g. Oren et al.
1986). Through the 15-month measurement period, of
foliage used in carbon dioxide assimilation measurements
varied 3.5x in juvenile and 2x in small-adult and large-
adult J. occidentalis (Fig. V.9). SLN was not correlated
with maximum rates of carbon dioxide assimilation (r = 0.16
- 0.41) or daily total assimilation in juvenile, small-
adult, and large-adult J. occidentalis (r = -0.21, -0.28, -
0.33, respectively). The seasonal variability of and
the lack of correlation between and carbon dioxide
assimilation would hamper the computation of a canopy
photosynthetic index for J. occidentalis, an index which has
been proposed as a means to compare relative carbon uptake
between forests of differing species composition (Oren et
al. 1986).

219
Quantum, water, and nitrogen use efficiencies
It should be noted that OIJE was calculated using area-
based measurements of carbon dioxide assimilation. Low
specific leaf mass of juvenile foliage compared to foliage
of small-adults and large-adults (Fig. V.9) alters the
relationship of OUE (Fig. V.12) among the three plant types
compared to the relationship of carbon dioxide assimilation
(Fig. V.3A). On a dry mass basis, assimilation of juveniles
was higher than that of small-adults or large-adults during
periods of high soil water availability, but during the same
periods OUE on an area basis was lower in juveniles than
small-adults or large-adults.
Juniperus occidentalis does not efficiently control the
lose of available soil water. In J. occidentalis daily E
(Fig. V.12) increased due to high daily totals of carbon
assimilation (Fig. V.3A) rather than low daily transpiration
(Fig. V.5B). The lowest WUE of juveniles, small-adults, and
large-adults occurred during October, 1988 (Fig. V.12), when
some of the most negative xylem pressure potentials of the
15-month period were measured (Fig. V.6). A similar pattern
of low during periods of severe water stress and high
water vapor pressure deficits was measured in Eucalyptus
220
globulus under field conditions in Portugal (Pereira et al.
1987)
Maximum photosynthetic capacity and maximum leaf
conductance are related in many ecologically different plant
species (Korner et al. 1979). However, the relationship
between carbon dioxide assimilation and conductance of
juvenile, small-adult, and large-adult J. occidentalis does
not support the concept of optimal stomatal function with
respect to photosynthesis-related water-use efficiency
(Cowan and Farquhar 1977). During the 15-month measurement
period, maximum carbon dioxide assimilation only co-occurred
with maximum rates of conductance during September, 1988,
when maximum assimilation rates occurred before 0900 hr.
Maximum rates of assimilation occurred after 0900 hr in 85%
of the measurements. During the 15-month measurement
period, maximum conductance in J. occidentalis occurred
before 0830 hr during 74% of the measurements, at carbon
dioxide assimilation rates below the compensation point in
34% of the measurements, and at assimilation rates <30% of
maximum during 72% of the measurements. The field data for
J. occidentalis do not support the hypothesis that leaf
diffusion resistance and the biochemical capacity of the
photosynthetic apparatus are coupled (Wong et al. 1979,

221
Lange et al. 1987). Based on data from this study, these
two features which control actual photosynthesis appear to
vary independently in J. occidentalis.
Potential photosynthetic nitrogen-use efficiencies
calculated for J. occidentalis were very low compared to
efficiencies of other plant growth forms. Highest
efficiencies for juvenile J. occidentalis were similar to
the lowest values reported for evergreen shrubs and trees
and South African shrubs. During ten of the measurement
periods, small-adult and large-adults had potential
photosynthetic nitrogen-use efficiencies lower than values
reported for other evergreen species (Field and Mooney
1986)
222
CONCLUSIONS
Maximum carbon dioxide assimilation appears to be
limited in J. occidentalis because new tissue with the
capacity for high rates of assimilation usually does not co-
occur with adequate soil moisture. Juniperus occidentalis,
growing in soils similar to those at the research site,
would fix more carbon if relative soil water content were
consistently above 15% during July and August. High
transpiration and low water use efficiencies in
occidentalis may reflect low soil nitrogen availability.
High rates of transpiration may be required to acquire an
adequate supply of nitrogen, but nitrogen did not appear to
be allocated preferentially to photosynthetic compounds.
Juvenile J. occidentalis appear to have tighter
stoinatal control over water use than small-adults or large-
adults, but none of the junipers measured were water-use
efficient. Juniperus occidentalis had the highest demand
for water during June, July, and August. Juveniles had
higher rates of physiological processes over a broader range
of conditions with lower tissue nitrogen concentrations than
did small-adults or large-adults. Juveniles were more
responsive to the changing environment than were small-
223
adults; large-adults had the least seasonal variation in
measured processes.
The trait of low did not appear to be detrimental
to J. occidentalis growing at the research area, because the
trait was not selected against during the last 100 yrears of
juniper expansion into degraded rangelands. If soil
moisture during July and August decreases with anticipated
climatic changes related to increased atmospheric greenhouse
gasses, growth of J. occidentalis foliage may be reduced,
which eventually will disfavor J. occidentalis and may alter
community composition, depending on the response of other
species in the community.

224
ACKNOWLEDGMENTS
The research was supported in part by the Agricultural
Experiment Station, Oregon State University. Dr. E. M.
Romney and the University of California, Los Angeles,
Biomedical Laboratory provided assistance for sample
analysis. We thank the Bureau of Land Management for use of
the site and G. W. Cox, W. Krueger, R. F. Miller, and R.
Waring for reviewing a draft of the manuscript. J. Miller,
S. Kr'mner, and N. B'o'hm assisted with the field measurements.
This paper is Technical Paper 9207, Oregon Agricultural
Experiment Station.
225
VI. SUMMARY
Juniperus occidentalis can support a large below-ground
biomass, because roots had lower construction cost, 1.39-1.5
g glu/g dm, and lower nitrogen concentrations, 0.25-0.67%,
than did foliage. Foliage costs of construction were 1.90-
2.09 g glu/g dm, and foliage nitrogen concentrations were
1.10-1.23% (Table 11.2).
Adult foliage had the highest heat of combustion,
nitrogen concentrations, and construction cost (Table 11.2).
Allocation patterns indicated a larger investment in
resources to above-ground than below-ground tissue in both
juvenile and small-adult J. occidentalis (Table 11.4). The
proportions by weight of nutrient elements in juniper
foliage were 1.3 to 29 times higher that the optimal
proportions relative to nitrogen required for maximum growth
of Pinus sylvestris (Table 11.6). The relatively high
nutrient status of J. occidentalis may indicate that
additional root biomass is not required to balance the
activity and relative growth rate of above-ground tissue.
Assuming that unrecovered fine roots were a similar
percentage of total root dry mass and that sampling errors
were similar between studies, J. occidentalis had high
root:shoot ratios when compared with other conifer species

226
from more inesic habitats and Larrea tridentata from more
xeric habitats (Table 11.5).
Compared with available data for species of similar
ages, juvenile and small adult J. occidentalis allocate
larger proportions of dry mass to foliage, which maximizes
photosynthetic capacity, and to roots, to maximize water and
nutrient acquisition; the larger allocation to foliage and
roots was accomplished through reduction of allocation to
branches and trunk (Table 11.4).
Altering the balance of resource acquisition tissue by
removing 50% of the foliage and cutting lateral roots of
juvenile and small-adult J. occidentalis affected processes
of carbon assimilation, conductance, and nitrogen uptake.
Compensatory increases in carbon dioxide assimilation were
measured in cut-top juveniles during April/May and cut-top
small-adults during August, when assimilation was
significantly higher than in control plants (Table 111.1).
In this study, juveniles and small-adults in the cut-
top treatment compensated by maintaining a balance of
physiological processes, i.e. by August, patterns of
quantum, water, and nitrogen-use efficiencies were similar
to efficiencies measured in controls (Table 111.5, Fig.
111.4, Fig. 111.6). Similarities in efficiencies with 50%
227
foliage removal may indicate that an overall metabolic
control was functioning to regulate the balance between
carbon dioxide assimilation and water loss (Tenhunen et al.
1987)
Cutting the lateral roots significantly reduced
nitrogen concentrations in foliage of juveniles and small-
adults during all three measurement periods (Table 111.3).
Mean minimum xylem pressure potentials were significantly
more negative than controls in the cut-root treatment during
July (Fig. 111.2). Predawn xylem pressure potentials were
similar in cut-root juveniles and small-adults (Fig. 111.2).
Significant reductions in transpiration during all
three measurement periods in the cut-root treatment
indicated that roots within the 3x crown diameter were not
able to support the transpiration demands of either
juveniles or small-adults (Table 111.1). Availability of
photosynthate, water, and nutrients for growth was altered
by the cut-root treatment. Branchlet elongation was
significantly reduced in cut-root juveniles and small-adults
compared to controls (Table 111.4).
Negative effects of the cut-root treatment on carbon
dioxide assimilation, conductance, transpiration, xylem
pressure potentials, and foliage nitrogen concentrations
228
were still present in late August (Table 111.1, Fig. 111.2,
Table 111.2). After lateral roots were cut at the edge of
the canopy, juvenile and small-adult J. occidentalis were
not able to regain a balance of physiological processes by
late August. Quantum use efficiency, and PPNUE were
more negatively affected by the cut-root than the cut-top
treatment (Table 111.5, Table 111.6).
The strong correlation between carbon dioxide
assimilation and conductance in cut-root juvenile and small
adult J. occidentaljs indicates stomatal control over water
loss. However, the significant decrease in in the cut-
root treatments during July and August (Table 111.5)
suggests that stomatal control was not adequate to prevent
uncompensated water loss when assimilation was reduced.
Throughout the summer research period, concentrations
of nitrate-N in ambient soils were lower than concentrations
of aituuonium-N (Table IV.i.). Fertilization with nitrate and
ammonium significantly increased foliar concentrations of
nitrogen in juveniles and small-adults during May;
concentrations in small-adult foliage were still
significantly higher than controls in September (Table
IV.2). Juvenile J. occidentalis do not appear to use
ammonium more than nitrate; both types of nitrogen reduced

229
carbon dioxide assimilation (Table IV.3). Small-adults did
not show a more positive response to nitrate than ammonium;
assimilation was not increased compared to controls with
additions of either form of nitrogen (Table IV.3).
Potential photosynthetic nitrogen-use efficiencies were
lower in +NO3 and +NH4 juveniles and small-adults than in
controls (Table IV.5). Stomatal regulation of water loss
was tighter with nitrogen fertilization. Both forms of
nitrogen reduced conductance and transpiration, thus
increasing water-use efficiency. Branchlet elongation was
increased but variability reduced significance levels in
juveniles and small-adults (Table IV.4).
Juniperus occidentalis appears to be adapted to the
low, ambient levels of nitrate in the soil and does not
preferentially utilize ammonium even though ammonium is more
abundant in the soil during the summer.
Juvenile J. occidentalis had higher measured rates of
carbon dioxide assimilation than small-adults or large-
adults. During the fifteen month measurement period, daily
total carbon dioxide assimilation was significantly higher
in juveniles than small-adults or large-adults (Fig. V.3b).
Total daily carbon dioxide assimilation of juveniles
responded more rapidly to changes in available soil moisture

230
than did large-adult daily assimilation (Fig V.lc). Maximum
carbon dioxide assimilation appears to be limited in
occidentalis because new tissue with the capacity for high
rates of assimilation usually did not co-occur with adequate
soil moisture. Juniperus occidentalis, growing in soils
similar to those at the research site, would fix more carbon
if relative soil water content was consistently above 15%
during July and August.
Juvenile J. occidentalis had higher measured rates of
conductance than small-adults or large-adults (Fig. V.2c).
For the fifteen month measurement period, daily total
transpiration was higher (P <0.10) than transpiration of
small-adults or large-adults. Large-adults close their
stomates at -2 to -2.5 MPa (Fig. V.8). However, juvenile L.occidentalis appear to have tighter stomatal control over
water use than small-adults or large-adults, but none of the
junipers measured were water-use efficient. Juniperus
occidentalis had the highest demand for water during June,
July, and August.
Changes in xylem pressure potentials and vapor pressure
deficit were not strongly related to seasonal changes in
conductance in J. occidentalis (Fig. V.8). Soil water seems
to be the more important variable (Fig. V.6).
231
Stoinates were more open than necessary to produce
maximum rates of carbon dioxide assimilation during April
and June (Fig V.2c). Juniperus occidentalis can achieve
rates of assimilation -80% of maximum with stomates open
-30% of maximum when young tissue is present. During
periods of adequate soil water availability, J. occidentalis
did not reduce stomatal conductance to match its
photosynthetic capacity.
High transpiration and low water use efficiencies in
Juniperus occidentalis may reflect low soil nitrogen
availability. High rates of transpiration may be required
to acquire an adequate supply of nitrogen, but nitrogen did
not appear to be allocated preferentially to photosynthetic
compounds.
Juniperus occidentalis appears adapted to maintain
positive carbon dioxide assimilation with high leaf
temperatures and declining xylem pressure potentials (Fig.
V.6 and V.7b). Leaf temperatures were as much a 4°C above
air temperature in all three morphotypes during the late
summer measurements. Carbon dioxide assimilation was 80% of
maximum over a broad range of leaf temperatures, 12 - 33°C.
Juveniles had higher rates of physiological processes
over a broader range of conditions with lower tissue
232
nitrogen concentrations than did small-adults or large-
adults. Juveniles were more responsive to the changing
environment than were small-adults; large-adults had the
least seasonal variation in measured processes.
The lowest WtJE of juveniles, small-adults, and large-
adults occurred during October, 1988, (Fig. V.12), when some
of the most negative xylem pressure potentials of the
fifteen month period were measured (Fig. V.6). Large-adult
WUE was significantly higher than juvenile WtJE only during
one of the twelve measurement periods, August, 1987.
The trait of low WUE did not appear to be detrimental
to J. occidentalis growing at the research area, because the
trait was not selected against during the recent period of
juniper expansion. During most years, soil water may not
limit daily conductance of J. occidentalis in the research
areas. During 2 out of 3 years, juvenile and small-adult
root systems appear to be adequate to support daily
conductance without mid-morning stomatal closure. If soil
moisture during July and August decreases with anticipated
climatic changes related to increased atmospheric greenhouse
gasses, growth of J. occidentalis foliage may be reduced
which eventually will disfavor J. occidentalis and may alter
233
community composition depending on the response of other
species in the community.
Juvenile J. occidentalis appear to have the capacity
for higher carbon dioxide assimilation over a broader range
of stomatal resistances and xylem pressure potentials with
lower foliage nitrogen concentrations than do small-adults
or large-adults. Juveniles are more responsive to changing
environmental conditions. The low specific leaf mass of
juvenile foliage allows display of a large photosynthetic
surface area with minimal investment of carbon and nutrient
resources.
The large foliage mass of large-adult J. occidentalis
mandates the measured low daily total transpiration. Soil
water resources at the research site may not be able to
sustain the measured seasonal transpiration rates of
juveniles (Fig. V.5) for the large foliage mass present in
large-adults.
However, stomates of large-adults appear to be open
more than necessary for adequate carbon dioxide
assimilation, because transpirational loss of water may be
required to supply adequate nitrogen. Ambient soils are low
in nitrate (Table IV.l), which appears to be the preferred
form of nitrogen.
234
The low rates of carbon dioxide assimilation in large-
adults may be modulated to match the low availability of
nitrate in the soil at the research site (Table IV.l).
Additional nitrate increased small-adult foliage
concentrations of nitrogen (Table IV.2) but did not increase
carbon dioxide assimilation (Table IV.3). Additional
nitrogen apparently was not invested in carboxylating
enzymes. Large-adult 3. occidentalis appear to be adapted
to the conservative use of nitrogen for carboxylating
enzymes. The availability of additional nitrate may have
increased foliage nitrogen concentrations because the root
capacity for nitrate reduction was exceeded. Nitrate may
have then been translocated to the shoots where it was
stored in vacuoles, unavailable for nitrogen metabolism
(Marschner 1986). Large-adult 3. occidentalis are
successful because, on a per gram basis, they use resources
more conservatively than juveniles.

LEFT BLANK INTENTIONALLY
235
VII. BIBLIOGRAPHY
Abrahamson, W. G. and H. Caswell. 1982. on the comparativeallocation of biomass, energy, and nutrients in plants.Ecology 63:982-991.
Adams, A. W. 1975. A brief history of juniper and shrubpopulations in southern Oregon. Oregon State WildlifeComm. Wildlife Res. Rep. No 6, pp 37.
Agren, G. L., B. Axelsson, J. G. K. Flower-Ellis, S. Linder,H. Persson, H. Staaf, and E. Troeng. 1980. Annualcarbon budget for young scots pine. In: T. Persson(ed.), Structure and function of northern coniferousforests; an ecosystem study. Ecol. Bull. Stockholm,pp 307-313.
Alfieri, F. J. and R. I. Kemp. 1983. The seasonal cycle ofphloem development in Juniperus californica. Amer. J.Bot. 70(6):89l-896.
American Society of Agronomy. 1980. Nitrificationinhibitors:potentials and limitations. Amer. Soc.Agron. Special Pub. No.38. Madison, WI. pp 78.
Ball, J. T. 1987. Calculations related to gas exchange.In: E. Zeiger, G. D. Farquhar, and I. R. Cowan (eds.),Stomatal function. Stanford Univ. Press. Stanford,CA, pp 445-476.
Barber, S. A. 1984. Soil nutrient bioavailability. JohnWiley and Sons. New York, NY, pp 398.
Barbour, M. G. 1973. Desert dogma reexamined: Root/shootproductivity and plant spacing. Amer. Midi. Nat.89:41-57.
Barbour, M. G., G.G. Cunningham, W.C. Oechel, and S. A.Bamberg. 1977. Growth and development, form andfunction. In: T. J. Manbry, J. H. Hunziker, D.R. DifeoJr. (eds.), Creosote bush: Biology and chemistry ofLarrea in new world deserts. Dowden, Hutchinson andRoss, Inc. Stroudsburg, PA, pp 48-91.
236

237
Barth, R. C. 1980. Influence of pinyon pine on soilchemical and physical properties. Soil Sci. Soc. Amer.J. 44:112-114.
Bedell, T. E. and T. R. Brunch. 1978. Effects of westernjuniper on forage production and livestock grazingmanagement. In: Proc. Western Juniper Ecology andManagement Workshop. Bend OR. U.S.D.A. For. Ser. Gen.Tech. Rep. PNW-74. Portland, OR, pp 163-176.
Billings, W. D. 1985. The historical development ofphysiological plant ecology. In: B. F. Chabot and H.A. Mooney (eds.), Physiological ecology of NorthAmerican plant communities. Chapman and Hall. NewYork, NY, pp 1-15.
Blackman, P. G. and Davies, W. J. 1985. Cytokinins,abscisic acid and the control of plant water balance.Acta Horticulturae 11:255-261.
Blackburn, W. H. and P. T. Tueller. 1970. Pinyon andjuniper invasion in black sagebrush communities ineast-central Nevada. Ecology 51:841-848.
Bloom, A. J. 1985. Wild and cultivated barleys showsimilar affinities for mineral nitrogen. Oecologia65:555-557.
Bloom, A. 3., F. S. Chapin III, and H. A. Mooney. 1985.Resource limitation in plants - an economic analogy.Ann. Rev. Ecol. Syst. 16:363-392.
Brix, H. 1981. Effects of nitrogen fertilizer source andapplication rates on foliar nitrogen concentration,photosynthesis, and growth of Douglas-fir. Can. 3.For. Res. 11:775-780.
Brix, H. and L. F. Ebell. 1969. Effects of nitrogenfertilization on growth, leaf area, and photosynthesisrate in Douglas-fir. For. Sci. 15:189-196.
Buckman, R. E. and G. L. Wotlers. 1987. Multi-resourcemanagement of pinyon-juniper woodlands. In: R. L.Everett (compiler), Proceedings - Pinyon-juniperConference. U.S.D.A. For. Ser. Gen Tech. Rep. INT-215.Ogden, UT, pp 2-4.
238
Bunderson, E. D. and D. J. Weber. 1986. Foliar nutrientcomposition of Juniperus osteosperma and environmentalinteractions. For. Sci. 32:149-156.
Bunderson, E. D., D. J. Weber, and J. N. Davis. 1985. Soilmineral composition and nutrient uptake in Juniperusosteosperiiia in 17 Utah sites. Soil Sci. 139:139-148.
Burkhardt, J. W. and E. W. Tisdale. 1969. Naturalsuccessional status of western juniper vegetation inIdaho. J. Range Mange. 22:264-270.
Burkhardt, J. W. and E. W. Tisdale. 1976. Causes ofjuniper invasion in southern Idaho. Ecology 57:472-484.
Caldwell, M. M. 1979. Root structure: the considerablecost of below-ground function. In: 0. T. Solbrig, S.Jam, G. B. Johnson, and P. H. Raven (eds.), Topics inplant population biology. Columbia Univ. Press. NewYork, NY, pp 408-427.
Caidwell, M. M. 1985. Cold desert. In: B. F. Chabot and H.A. Mooney (eds.), Physiological ecology of NorthAmerican plant communities. Chhapman and Hall. NewYork, NY, pp 198-212.
Caldwell, M. M. 1987. Competition between root systems innatural communities. In: P. J. Gregory, J. V. Lake,and D. A. Rose (eds.), Root development and function.Soc. for Exp. Bio. Sein. Ser. 30. Cambridge Univ.Press. Cambridge, UK, pp 167-185.
Caldwell, M. M. and 0. A Fernandez. 1975. Dynamics ofGreat Basin shrub root systems. In: N. F. Hadley(ed.), Environmental physiology of desert organisms.Dowden, Hutchinson and Ross, Inc. Stroudsburg, PN, pp38-51.
Caldwell, M. M., J. H. Richards, D. A. Johnson, R. S. Nowak,and R. S. Dzurec. 1981. Coping with herbivory:Photosynthetic capacity and resource allocation in twosemiarid Agropyron bunchgrasses. oecologia (Berlin)50:14-24.
239
Cale, W. G., G. M. Henebry, and 5. A. Yeakley. 1989.Inferring process form pattern in natural communities.BioScience 39(9) :600-605.
Campbell, G. 5. 1986. An introduction to environmentalbiophysics. Springer-Verlag. New York, NY, pp 159.
Campbell, G. S. and G. A. Harris. 1977. Water relationsand water use patterns for Artemisia tridentata Nutt.in wet and dry years. Ecology 58:652-659.
Carahar, D. L. 1978. The spread of western juniper incentral Oregon. In: Western juniper ecology andmanagement workshop. U.S.D.A. For. Ser. Gen. Tech.Rep. PNW-74. Portland, OR, pp 1-7.
Chapin, F. S., III. 1980. The mineral nutrition of wildplants. Annu. Rev. Ecol. Syst. 11:233-260.
Chapin, F. S. III, A. 5. Bloom, C. B. Field, and R. H.Waring. 1987. Plant responses to multipleenvironmental factors. BioScience 37:49-57.
Charley, 5. L. 1972. The role of shrubs in nutrientcycling. In: C. H. McKell, 5. P. Blaisdell, and 5. R.Goodin (eds.), Wildland shrubs-their biology andutilization. U.S.D.A. For. Serv. Gen. Tech. Rep. INT-l. Ogden, UT, pp 182-203.
Charley, 5. L. and N. E. West. 1977. Micro-patterns ofnitrogen mineralization activity in soils of someshrub-dominated semi-desert ecosystems of Utah. SoilBiol. Biochem. 9:357-365.
Chew, R. M. and A. E. Chew. 1965. The primary productivityof a desert-shrub (Larrea tridentata) community. Ecol.Mono. 35:355-375.
Chow, V. T. 1976. Handbook of applied hydrology. McGraw-Hill Co. New York, NY, pp 678.
Christensen, N. W. and V. W. Meints. 1982. Evaluating Nfertilizer sources and timing for winter wheat. Agron.5. 74:840-844.
Chung, H. H. and R. L. Barnes. 1977. Photosynthateallocation in Pinus taeda. I. Substrate requirements

for synthesis of shoot biomass. Can. J. For. Res.7: 106-111.
Clarkson, D. T. 1985. Factors affecting mineral nutrientacquisition by plants. Ann. Rev. Plant Physiol. 36:77-115.
Cowan, I. R. 1986. Economics of carbon fixation in higherplants. In: T. J. Givnish (ed.), On the economy ofplant form and function. Cambridge Univ. Press.Cambridge, UK, pp 133-170.
Cowan, I. R., and G. D. Farguhar. 1977. Stomatal functionin relation to leaf metabolism and environment. In:D. H. Jennings (ed.), Integration of activity in thehigher plant. Cambridge Univ. Press. Cambridge UK, pp471-505.
Davis, 0. K. 1987. Palynological evidence for historicjuniper invasion in central Arizona: a late Quaternaryperspective. In: R. L. Everett (compiler),Proceeddings - Pinyon-Juniper Conference. U.S.D.A.For. Ser. Gen. Tech. Rep. INT-2l5. Ogden UT, pp 120-124.
Davis, T. D., N. Sankhla, W. R. Anderson, D. J. Weber, andB. N. Smith. 1985. High rates of photosynthesis inthe desert shrub Chrysothamnus nauseosus ssp.Albicaulis. Great Basin Nat. 45(3):520-525.
Dealy, J. E., J. N. Geist, and R. S. Driscoll. 1978.Western juniper communities on rangelands of thePacific Northwest. In: D. N. Hyder (ed.), Firstinternaational rangeland congress. Society for RangeManagement. Denver, CO1 pp 201-204.
DeBano, L. F., H. N. Perry, and S. T. Overby. 1987.Effects of fuelwood harvesting and slash burning onbiomass and nutrient relationships in a pinyon-juniperstand. In: R. L. Everett (compiler), Proceedings ofPinyon-juniper Conference. U.S.D.A. For. Ser. GenTech. Rep. INT-215. Ogden, UT, pp 382-386.
de Laubenfels, D. J. 1953. The external morphology ofconiferous leaves. Phytomorphology 3:1-17.
240
De Lucia, E. H., W. H. Schlesinger, and W. D. Billings.1988. Comparative drought tolerance and water-useefficiency in adjacent Great Basin and Sierranvegetation. Bull. Eco. Soc. 69(2):l17.
De Lucia, E. H., W. H. Schlesinger, and W. D. Billings.1989. Edaphic limitations to growth and photosynthesisin Sierran and Great Basin vegetation. Oecologia(Berlin) 78:184-190.
DePuit, E. J. and M. M. Caidwell. 1973. Seasonal patternsof net photosynthesis of Artemisia tridentata. Amer.J. Bot. 60(5):426-435.
Detling, J. K., N. I. Dyer, and D. T. Winn. 1979. Netphotosynthesis, root respiration, and regrowth inBouteloua gracilis following simulated grazing.Oecologia (Berlin) 41:127-134.
Dietz, D. R., R. H. Udall, and L. E Yeager. 1962. Chemicalcomposition and digestibility by mule deer of selectedforage species Cache la Poudre range, Colorado. Tech.Pub. 14. Cob. Game and Fish Dept. Denver, CO, pp 89.
Doescher, P. S., L. E. Eddleman, and M. R. Vaitkus. 1987.Evaluation of soil nutrients, pH, and organic matter inrangelands dominated by western juniper. NorthwestSci. 61:97-102.
Doescher, P. S., R. F. Miller, and A. H. Winward. 1984.Soil chemical patterns under eastern Oregon plantcommunities dominated by big sagebrush. Soil Sci. Soc.Am. J. 48:659-663.
Driscoll, R. S. 1964. vegetation-soil units in the centralOregon juniper zone. U.S.D.A. For. Serv. PNW Res. Pap.19. Portland OR, pp 61.
Eddleman, L. E. 1987. Establishment and stand developmentof western juniper in central Oregon. In: R. L.Everett (compiler), Proceedings - Pinyon-juniperConference. U.S.D.A. For. Ser. Gen Tech. Rep. INT-2l5.Ogden, UT, pp 255-259.
Ehleringer, J. R. 1988. Carbon isotope ratios andphysiological processes in aridland plants. In: P. W.Rundel, 3. R. Ehleringer, and K. A. Nagy (eds.),
241
Stable Isotopes in ecological research. Springer-Verlag. New York, NY, pp 41-54.
Ericsson, A., S. Larsson, and 0. Tenow. 1980. Effects ofearly and late season defoliation on growth andcarbohydrate dynamics in scots pine. J. App. Ecol.17:747-769.
Evans, R. A. and 1. A. Young. 1985. Plant successionfollowing control of western juniper (Juniperusoccidentalis) with Picloram. Weed Sci. 33:63-68.
Everett, R. L. 1987. Proceedings of Pinyon-juniperconference. U.S.D.A. For. Ser. Gen Tech. Rept. INT-2l5Ogden, Ut, pp 581.
Farquhar, G. D., K. T. Hubick, A. G. Condon, and R. A.Richards. 1989. Carbon isotope fractionation andplant water-use efficiency. In: P. W. Rundel, J. R.Ehleringer, and K. A. Nagy (eds.), Stable Isotopes inecological research. Springer-Verlag. New York, NY,pp 41-54.
Farquhar, G. D. and T. D. Starkey. 1982. Stomatalconductance and photosynthesis. Ann. Rev. PlantPhysiol. 33:317-345.
Field, C., J. Merino, and H. A. Mooney. 1983. Compromisesbetween water-use efficiency and nitrogen-useefficiency in five species of California evergreens.Oecologia (Berlin) 60:384-389.
Field C. and H. A. Mooney. 1983. The photosynthesis -nitrogen relationship in wild plants. In: T. J.Givnish (ed.), On the economy of plant form andfunction. Cambridge Univ. Press. New York, NY, pp 25-55.
Field, C. and H. A. Mooney. 1986. The photosynthesis -nitrogen relations in wild plants. In: T. J. Givnish(ed.), On the economy of plant form and function.Cambridge Univ. Press. New York, NY, pp 25-55.
Forest-Range Task Force. 1972. The nation's rangeresources-a forest range environmental study. U.S.D.A.For. Serv. Res. Rep. 19. Ogden Ut, pp 59.
242

243
Foxx, T. S. and G. D. Tierney. 1987. Rooting patterns inthe pinyon-juniper woodland. In: R. L. Everett(compiler), Proceedings - Pinyon-juniper Conference.U.S.D.A. For. Ser. Gen Tech. Rep. INT-215. Ogden, UT,pp 69-79.
Garcia-Moya,,E., and C. N. McKell. 1970. Contribution ofshrubs to the nitrogen economy of a desert-wash plantcommunity. Ecology 51:81-88.
Gholz, H. L. 1980. Structure and productivity of Juniperusoccidentalis in central Oregon. Amer. Midl. Nat.103:251-261.
Gollan, T., N. C. Turner, and E.-D. Schuize. 1985. Theresponse of stomata and leaf gas exchange to vaporpressure deficits and soil water content. III In thesclerophyllous woody species Nerium oleander.Oecologia (Berlin) 65:356-362.
Golley, F. B. 1961. Energy values of ecological materials.Ecology 42:581-584.
Green, K. and R. Wright. 1977. Field response ofphotosynthesis to CO2 enhancement in ponderosa pine.Ecology 58:687-692.
Grime, J. P. 1979. Plant strategies and vegetationprocesses. John Wiley and Sons. New York, NY, pp 222.
Gulmon, S. L. and C. C. Chu. 1981. The effects of lightand nitrogen on photosynthesis, leaf characteristics,and dry matter allocation in the chaparral shrub,Diplacus aurantiacus. Oecologia (Berlin) 49:207-212.
Gulmon, S. L. and H. A. Mooney. 1983. Costs of defense andtheir effects on plant productivity. In: T. J.Givnish (ed.), On the economy of plant form andfunction. Cambridge Univ. Press. New York, NY, pp681-698.
Haiso, T. C. 1973. Plant responses to water stress. Ann.Rev. Plant Physio. 24:519-570.
Harley, P. C., J. D. Tenhunen, and 0. L. Lange. 1986. Useof an analytical model to study limitations on net
244
photosynthesis in Arbutus unedo under field conditions.Oecologia (Berlin) 70:393-401.
Harper, J. L. 1977. Population biology of Plants.Academic Pres. New York, NY, pp 892.
Haynes, R. J. 1986. Uptake and assimilation of mineralnitrogen by plants. In: R. J. Haynes (ed.), Mineralnitrogen in the plant-soil system. Academic Press,Inc. New York, NY, pp 303-378.
Haynes, R. J. and K. M. Goh. 1978. Ammonium and nitratenutrition of plants. Biol. Rev. 53:465-510.
Hayes, D. W. 1960. Key to iniportand woody plants ofeastern Oregon and Washington. U.S.D.A. Handbook No.148 Washington, D.C., pp 159.
Heichel, G. H. and N. C. Turner. 1983. CO2 assimilation ofprimary and regrowth foliage of red maple (Acer rubrumL.) and red oak (Ouercus rubra L.) : response todefoliation. Oecologia (Berlin) 57:14-19.
Helms, J. A. 1970. Summer net photosynthesis of ponderosapine in its natural environment. Photosynthetica4:243-253.
Herman, F. R. 1956. Growth and phenological observationsof Arizona junipers. Ecology 37:193-195.
Hillel, D. 1971. Soil and water, physical principles andprocesses. Academic Press. New York, NY, pp 288.
Hitchcock, C. L. and A. Cronquist. 1987. Flora of thepacific northwest. Univ. of Washington Press.Seattle, WA, pp 730.
Hodgkinson, K. C. 1974. Influence of partial defoliationon photosynthesis, photorespiration, and transpirationby lucerne leaves of different ages. Aust. J. PlantPhysiol. 1:561-578.
Incoll, L. D. and P. C. Jewer. 1987. Cytokinins andStomata. In: E. Zeiger, G. D. Farquhar, I. R. Cowan(eds.), Stomatal function. Stanford Univ. Press.Stanford, CA, pp 281-292.

245
Ingestad, T. 1979. Mineral nutrient requirements of Pinussilvestris and Picea abies seedlings. Physiol. Plant.45: 373-380.
Ingestad, T. 1987. New concepts on soil fertility andplant nutrition as illustrated by research on foresttrees and stands. Geoderma 40:237-252.
Jackson, D. S. and J. Chittenden. 1981. Estimation of drymatter in Pinus radiata root systems I. individualtrees. New Zealand J. For. Sci. 11:164-182.
Jansson, S. L. 1971. Use of '5N in studies of soilnitrogen. In: A. P. McLaren and J. Skujinis (eds.),Soil Biochemistry, vol.2. Marcel Dekker. New York,NY, pp 137-149.
Jarvis, P. G. 1976. The interpretation of the variationsin leaf water potentials and stomatal conductance foundin canopies in the field. Phil. Trans. Roy. Soc.London. Ser. B. 273:593-610.
Jarvis, P. G. and K. G. McNaughton. 1986. Stomatal controlof transpiration: scaling up from leaf to region. Adv.Eco. Res. 15:1-49.
Johnsen, T. N. Jr. 1962. One-seed juniper invasion ofnorthern Arizona grasslands. Ecol. Monog. 32:87-207.
Johnson, D. W., D. W. Cole, C. S. Bledsoe, K. Cromack, R.L. Edmonds, S. P. Gessel, G. C. Grier, B. N. Richards,and K. A. Vogt. 1982. Nutrient cycling in forests ofthe pacific northwest. In: R. L. Edinonds (ed.),Analysis of coniferous forest ecosystems in the westernUnited States. Dowden, Hutchinson, and Ross, Inc.Stroudsburg, PN, pp 186-232.
Kiellarid, K. 1988. Circumvention of net nitrogenmineralization through amino acid uptake by arcticplants. Bull. Eco. Soc. Amer. 69:191.
Klopatek, J. M. 1897. Nutrient patterns and succession inpinyon-juniper ecosystems of northern Arizona. In: R.L. Everett (compiler), Proceedings - Pinyon-juniperConference. U.S.D.A. For. Ser. Gen Tech. Rep. INT-215.Ogden, UT, pp 391-396.
246
Korner, C. H., J. A. Scheel, and H. Bauer. 1979. Maximumleaf diffusive conductance in vascular plants.Photosynthetica 13:45-82.
Krajina, V. J., S. Madoc-Jones, and G. Mellor. 1973.Ammonium and nitrate in the nitrogen economy of someconifers growing in Douglas-fir communities of thepacific north-west of America. Soil Biol. Biochem5:143-147.
Krmer, S. 1990. Development and morphology of juvenilewestern juniper (Juniperus occidentalis Hook.). M. S.thesis, Oregon State Univ. Corvallis, OR, pp 135.
Kuminerow, J. 1980. Adaptations of roots in water-stressednative vegetation. In: N. C. Turner and P. J. Kramer(eds.), Adaptations of plants to water and hightemperature stress. John Wiley and Sons. New York,NY, pp 57-73.
Kuinmerow, J., D. Krause, and W. Jow. 1978. Seasonalchanges of fine root density in the southern Califorianchaparral. Oecologia (Berlin) 37:201-212.
Kummerow, J, G. Montenegro, and D. Krause. 1981. Biomass,phenology, and growth. In: P. C. Miller (ed.),Resource use by chaparral and matorral. Springer-Verlag. New York, NY, pp 69-96.
Lange, 0. L., W. Beyschlag, and J. D. Tenhunen. 1987. B.
Control of leaf carbon assimilation - input of chemicalenergy into ecosystems. In: E.-D. Schulze, and H.Zwolfer (eds.), Ecological Studies, Vol. 61. Springer-Verlag. New York, NY, pp 149-163.
Larcher, W. 1983. Physiological plant ecology. Springer-Verlag. New York, NY, pp 301.
Lassoie, J. P., P. M. Dougherty, P. B. Reich, T. M.Hinckley, C. M. Metcalf, and S. J. Dma. 1983.Ecophysiological investigations of understory easternredcedar in central Missouri. Ecology 64:1355-1366.
Lederer, R. J. 1977. Winter territoriality and foragingbehavior of the Townsend's solitaire. Amer. Midl. Nat.97:101-109.

247
Lee, J. A., R. Harmer, and R. Ignaciuk. 1982. Nitrogen asa limiting factor in plant communities. In: J. A.Lee, S. McNeill, and I. H. Rorison (eds.), Nitrogen asan ecological factor. Blackwell Scientific Pub.London, pp 95-112.
Leonard, S. G., R. L. Miles, and H. A. Summerfield. 1987.Soils of The pinyon-juniper woodlands. In: R. L.Everett (compiler), Proceedings - Pinyon-juniperConference. U.S.D.A. For. Ser. Gen Tech. Rep. INT-2l5.Ogden, UT, pp 227-230.
Linder, S. and B. Axelsson. 1982. Changes in carbon uptakeand allocation patterns as a result of irrigation andfertilization in a young Pinus sylvestris stand. In:R. H. Waring (ed.), Carbon uptake and allocation insubalpine ecosystems as a key to management. OregonState Univ. Corvallis, OR, pp 38-44.
Longstreth, D. J. and P. S. Nobel. 1980. Nutrientinfluences on leaf photosynthesis effects of nitrogen,phosphorus, and potassium for Gossypium hirsutum L.Plant Physiol. 65:541-543.
Ludwig, J. A. 1977. Distributional adaptations of rootsystems in desert environments. In: J. K. Marshall(ed.), The below-ground ecosystem: a synthesis ofplant associated processes. Range Sci. Dept. Sci. Ser.No 26. Cob. State Univ. Fort Collins, CO, pp 85-91.
Ludwig, J. A., J. F. Reynolds, and P. D. Whitson. 1975.Size-biomass relationships of several Chihuahuan desertshrubs. Amer. Midl. Nat. 94:451-461.
Margaris, N. S. and H. A. Mooney. 1891. Components ofproductivity of Mediterranean-climate regions, basicand applied aspects. Dr. W. Junk Pub. Boston, MA, pp279.
Marschner, H. 1986. Mineral nutrition of higher plants.Academic Press. New York, NY, pp 674.
Merino, J., C. Field, and H. A. Mooney. 1982. Constructionand maintenance costs of Mediterranean-climateevergreen and deciduous leaves I. Growth and CO2exchange analysis. Oecologia (Berlin) 53:208-213.

248
Miller, P. C. 1981. Resource use by chaparral andmatorral. Springer-Verlag. New York, NY, pp 455.
Miller, P. C., P. M. Miller, N. Blake-Jacobson, F. S. ChapinIII, K. R. Everett, D. W. Hubert, J. Kuminerow, A. E.Linkins, G. M. Marion, W. C. Oechel, S. W. Roberts, andL. Stuart. 1984. Plant-soil processes in Eriophoruinvaginatum tussock tundra in Alaska: a systems modelingapproach. Ecol. Mono. 54(4):361-405.
Miller, P. C. and W. A. Stoner. 1979. Canopy structure andenvironmental interactions. In: 0. T. Soibrig, S.Jam, G. B. Johnson and P. H. Raven (eds.), Topics inplant population biology. Columbia Univ. Press. NewYork, NY, pp 428-458.
Miller, R. F., R. F. Angell, and L. E. Eddleman. 1987.Water use by western juniper. In: R. L. Everett(compiler), Proceedings of Pinyon-juniper Conference.U.S.D.A. For. Ser. Gen Tech. Rep. INT-2l5. Ogden, UT,pp 418-422.
Miller, R. F., L. E. Eddleman, and R. F. Angell. 1987. Therelationship of western juniper stem conducting tissueand basal circumference to leaf area and bioniass.Great Basin Nat. 47(3):345-354.
Miller, R. F. and L. M. Shultz. 1987. Water relations andleaf morphology of Juniperus occidentalis in thenorthern Great Basin. For. Sci. 33:690-706.
Monk, C. 1966. Ecological importance of root/shoot ratios.Bull. Torr. Bot. Club 93:402-406.
Monsi, M. 1960. Mathematical models of plant communities.In: F. E. Eckhardt, (ed.), Functioning of terrestrialecosystems at the primary production level. UNESCO,Paris, pp 131-149.
Mooney, H. A. and N. R. Chiariello. 1984. The study ofplant function, the plant as a balanced system. In:R. Dirzo and J. Sarukhan (eds.), Perspectives on plantpopulation ecology. Sinauer Ass. Sunderland, MA, pp305-323.
Mooney, H. A. and S. L. Gulxnon. 1979. Environmental andevolutionary constraints on the photosynthetic

characteristics of higher plants. In: 0. T.S. Jam, G. B. Johnson, and P. H. Raven (eds.in plant population biology. Columbia Univ.New York, NY, pp 316-367.
Mooney, H. A. and S. L. Gulmon 1982. Constraints on leafstructure and function in reference to herbivory.BioScience 32:198-206.
Mooney, H. A. and P. C. Miller. 1985. Chaparral. In: B.
F. Chabot and H. A. Mooney (eds.), Physiologicalecology of North American plant communities. Chapmanand Hall. New York, NY, pp 213-231.
Nelson, L. E. and R. Selby. 1974. The effect of nitrogensources and iron levels on the growth and compositionof sitka spruce and scots pine. Plant and Soil 41:573-588.
NOAA, 1982. Monthly normals of temperature, precipitation,and heating and cooling degree days 1951-1980 Oregon.National Climatic Center. Washington, D. C.
Nobel, p. s 1983. Biophysical plant physiology andecology. W. H. Freeman and Co. San Francisco, CA, pp608.
Nobel, P. 5. 1985. Desert Succulents. In: B. F. Chabotand H. A. Mooney (eds.), Physiological ecology of NorthAmerican plant communities. Chapman and Hall. NewYork, NY, pp 181-197.
Oren, R., E.-D. Schulze, R. Matyssek, and R. Zimmermann.1986. Estimating photosynthetic rate and annual carbongain in conifers from specific leaf weight and leafbiomass. Oecologia (Berlin) 70:187-193.
Orians, G. H. and 0. T. Solbrig. 1977. A cost-income modelof leaves and roots with special reference to arid andsemiarid areas. Amer. Nat. 111:677-690.
Ormsbee, P., F. A. Bazzaz, and W. R. Boggess. 1976.Physiological ecology of Juniperus virginiana inoldfields. Oecologia (Berlin) 23:75-82.
Ovington, J. D. 1957. Dry-matter production by Pinussylvestris L. Ann. of Bot., N. S. 82:287-314.
249
Solbrig,), TopicsPress.

Parr Instrument Co. 1975. Instructions for the 1241 and1242 adiabatic calorimeter. Manual 153. Parr Inst.Co. Moline, IL, Pp 29.
Pearcy, R. W., 0. Bjorkman, N. M. Caldwell, J. E. Keeley, R.K. Monson, and B. R. Strain. 1987. Carbon gain byplants in natural environments. BioScience 37:21-29.
Pearcy, R. W. and J. Ehleringer. 1984. Comparativeecophysiology of C3 and C4 plants. Plant, Cell andEnvir. 7:1-13.
Penning De Vries, F. W. T., A. H. M. Brunstring, and H. H.van Larr. 1974. Products, requirements and efficiencyof biosynthesis: a quantitative approach. J. Theor.Bio. 45:339-337.
Pereira, J. S., J. D. Tenhunen, and 0. L. Lange. 1987.Stomatal control of photosynthesis of Eucalyptusglobulus Labill. trees under field conditions inPortugal. J. Exper. Bot. 38:1678-1688.
Persson, H. 1983. The importance of fine roots in borealforests. In: Wurzeloekologie und ihrenutzanwendung/root ecology and its practicalapplication. International Symposium Gumpenstein,1982. Bundesanstalt Grumpenstein. Irdning, Austria,pp 505-608.
Poddar, S. and R. J. Lederer. 1982. Juniper berries as anexclusive winter forage for Townsend's solitaires.Amer. Midi. Nat. 108:34-40.
Potvin, C. and M. J. Lechowicz. 1988. On the statisticalanalysis of photosynthetic response curves. Bull. Eco.Soc. Am. 69:264.
Preston, R. J. Jr. 1942. The growth and development of theroot systems of juvenile lodgepole pine. Ecol. Monogr.12:449-468.
Radin, J. W. and L. L. Parker. 1979. Water relations ofcotton plants under nitrogen deficiency. I. Dependenceupon leaf structure. Plant Physiol. 64:495-498.
250
251
Raschke, K. 1987. Action of abscisic acid on guard cells.In: E. Zeiger, G. D. Farquhar, and I. R. Cowan (eds.),Stomatal function. Stanford Univ. Press. Stanford, CA,pp 253-279.
Richards, J. H. and M. M. Caldwell. 1985. Solublecarbohydrates, concurrent photosynthesis and efficiencyin regrowth following defoliation: a field study withAgropvron species. J. App. Ecol. 22:907-920.
Roy, J. and H. A. Mooney. 1982. Physiological adaptationand plasticity to water stress of coastal and desertpopulations of Heliotropium curassavicum L. Oecologia(Berlin) 52:370-375.
Rudloff, E. V., L. Hogge, and M. Grant. 1980. The leaf oilterpene composition of Juniperus occidentalis.Phtochemistry 19: 1701-1703.
Runge, M. 1983. Physiology and ecology of nutrition. In:0. L. Lange, P. S. Nobel, C. B. Osmond, and H. Ziegler(eds.), Physiological plant ecology III, Responses tothe chemical and biological environment. Encyclopediaof plant physiology, New Series, Vol. 12c. Springer-Verlag, Berlin, pp 163-200.
Schuize, E.-D. 1986. Carbon dioxide and water vaporexchange in response to drought in the atmosphere andin the soil. Ann. Rev. Plant Physiol. 37:247-274.
Schuize, E.-D., K. Schilling, and S. Nagarajah. 1983.Carbohydrate partitioning in relation to whole plantproduction and water use of Vigna unguiculata (L.)Waip. Oecologia (Berlin) 58:169-177.
Schwartz, C. C., J. G. Nagy, and W. L. Regelin. 1980.Juniper oil yield, terpenoid concentration, andantimicrobial effects on deer. J. Wildl. Manage.44:107-113.
Sheriff, E. K., S. Nambiar, and D. N. Fife. 1986.Relationships between nutrient status, carbonassimilation and water use efficiency in Pinus radiata(D.Don) needles. In: R. J. Luxmoore, J. J. Landsberg,and N. R. Kaufmann (eds.), Coupling of carbon, waterand nutrient interactions in woody plant systems.Heron Pub. Victoria, Canada, pp 73-88.
252
Smith, W. K. 1985. Western montane forests. In: B. F.Chabot and H. A. Mooney (eds.). Physiological ecologyof North American plant communities. Chapman and Hall.New York, NY, pp 95-126.
Sokal, R. R. and F. J. Rohif. 1981. Biometry. W. H.Freeman and Co. San Francisco, CA, pp 859.
Specht, R. L. 1989. Mediterranean-type ecosystems, a datasource book. Kluwer Academic Pub. Boston, MA, pp 248.
Stevenson, F. J. 1986. Cycles of Soil. John Wiley andSons. New York, NY, pp 380.
STSC Inc. 1987. StatgraphicsR statistical graphics system.STSC Inc. Rockvill, MY, pp 326.
Tausch, R. J., N. E. West, and A. A. Nabi. 1981. J. RangeManage. 34:259-264.
Tenhunen, J. D., W. Beyschlag, 0. L. Lange, and P. C.Harley. 1987. Changed during drought in leaf CO2uptake rates of macchia shrubs growing in Portugal.In: J. D. Tenhunen (ed.), Plant response to stress.Springer-Verlag. Berlin, pp 305-327.
Tenhunen, J. D., 0. L. Lange, P. C. Harley, W. Beyschlag,and A. Meyer. 1984. Environmental constraints onproductivity of the Mediterranean sclerophyll shrubQuercus coccifera. Proceedings of INTECOL workshop -Rates of natural primary productivity and agriculturalproduction. Instituto Agronomico Mediterraneo.Zaragoza, Portugal, pp 33-53.
Tenhunen, J. D., R. W. Pearcy, and 0. L. Lange. 1987.Diurnal variations in leaf conductance and gas exchangein natural environments. In: E. Zeiger, G. D.Farguhar, and I. R. Cowan (eds.), Stomatal functionStanford Univ. Press. Stanford, CA, pp 323-351.
Tidwell, D. P. 1987. Multi-resource management of pinyon-juniper woodlands: times have changed, but do we knowit? In: R. L. Everett (compiler), Proceedings ofPinyon-juniper Conference. U.S.D.A. For. Ser. GenTech. Rep. INT-215. Ogden, UT, pp 5-8.
253
Tiedemann, A. P. 1987. Nutrient accumulations in pinyon-juniper ecosystems. In: R. L. Everett (compiler),Proceedings of Pinyon-juniper Conference. U.S.D.A.For. Ser. Gen Tech. Rep. INT-215. Ogden, UT, pp 352-359.
Toft, N. L., J. E. Anderson, and R. S. Nowak. In review.Water use efficiency and carbon isotope composition ofplants in a cold desert environment. Oecologia(Berlin).
Troughton, A. 1980. Environmental effects upon root-shootrelationships. In: D. N. Sen (ed.), Environment androot behavior. Geobjos International. Calcutta,India, pp 25-41.
Turner, N. C., E.-D. Schulze, and T. Gollan. 1985. Theresponse of stomata and leaf gas exchange to vaporpressure deficits and soil water content II. In themesophylic herbaceous species Helianthus annuns.Oecologia (Berlin) 65:348-355.
van den Driessche, R. 1971. Response of conifer seedlingsto nitrate and ammonium sources of nitrogen. Plant andSoil 34:421-439.
van den Driessche, R. 1972. Different effects of nitrateand ammonium forms of nitrogen on growth andphotosynthesis of slash pine seeddlings. Aust. For.36:125-137.
Vasek, F. C. 1966. The distribution and taxonomy of threewestern junipers. Brittonia 18:350-372.
von Caemmerer, S. and G. D. Farquhar. 1981. Somerelationships between the biochemistry ofphotosynthesis and the gas exchange of leaves. Planta153:376-387.
von Caemmerer, S. and G. D. Farquhar. 1984. Effects ofpartial defoliation, changes of irradiance duringgrowth, short term water stress and growth at enhancedp(CO2) on the photosynthetic capacity of leaves ofPhaseolus vulgaris L. Planta 160:320-329.

254
Wallace, A., S. A. Bamberg, and J. W. Cha. 1974.Quantitative studies of roots of perennial plants inthe inojave desert. Ecology 55:1160-1162.
Wallace, A. and E. M. Romney. 1972. RadioecolOgy andecophysiology of desert plants at the Nevada test site.United States AEC. Washington, DC, pp 369.
Walters, J. P. and C. E. Freeman. 1983. Growth rates androot:shoot ratios in seedlings of the desert shrubLarrea tridentata. South West Nat. 28:357-363.
West, N. E. 1984. Successional patterns and productivitypotentials of pinyon-juniper ecosystems. In:Developing strategies for range management. WestviewPress, Boulder, Ca, pp 1301-1332.
West, N. E. and N. S. Van Pelt. 1987. Successionalpatterns in pinyon-juniper woodlands. In: R. L.Everett (compiler), Proceedings of Pinyon-juniperConference. U.S.D.A. For. Ser. Gen Tech. Rep. INT-215.Ogden, UT, pp 43-52.
Wexier, A. 1976. Vapor pressure formulation for water inthe range 00 to 100°C - a revision. In: J. Res. Natl.Bur. Stand. 80. Washington, D. C. pp 775-798.
Wexler, A. 1977. Vapor pressure formulations for ice. In:J. Res. Natl. Bur. Stand. 81A. Washington, D. C. pp 5-20.
Williams, K., F. Percival, J. Merino, and H. A. Mooney.1987. Estimation of tissue construction cost from heatof combustion and organic nitrogen content. Plant,Cell, and Environ. 10:725-734.
Wong, S. C. 1979. Elevated atmospheric partial pressure ofCO2and plant growth. I. Interactions of nitrogennutrition and photosynthetic capacity in C3 and C4
plants. Oecologia (Berlin) 44: 68-74.
Wong, S. C., I. R. Cowan, and G. D. Farquhar. 1979.Stomatal conductance correlates with photosyntheticcapacity. Nature 282:424-426.

255
Young, J. A. and R. A. Evans. 1981. Demography and firehistory of a western juniper stand. J. Range Manage.34: 501-505.
Zar, J. H. 1984. Biostatistical analysis. 2nd Edition.Prentice-Hall, Inc. Englewood, NJ, pp 718.

APPENDIX
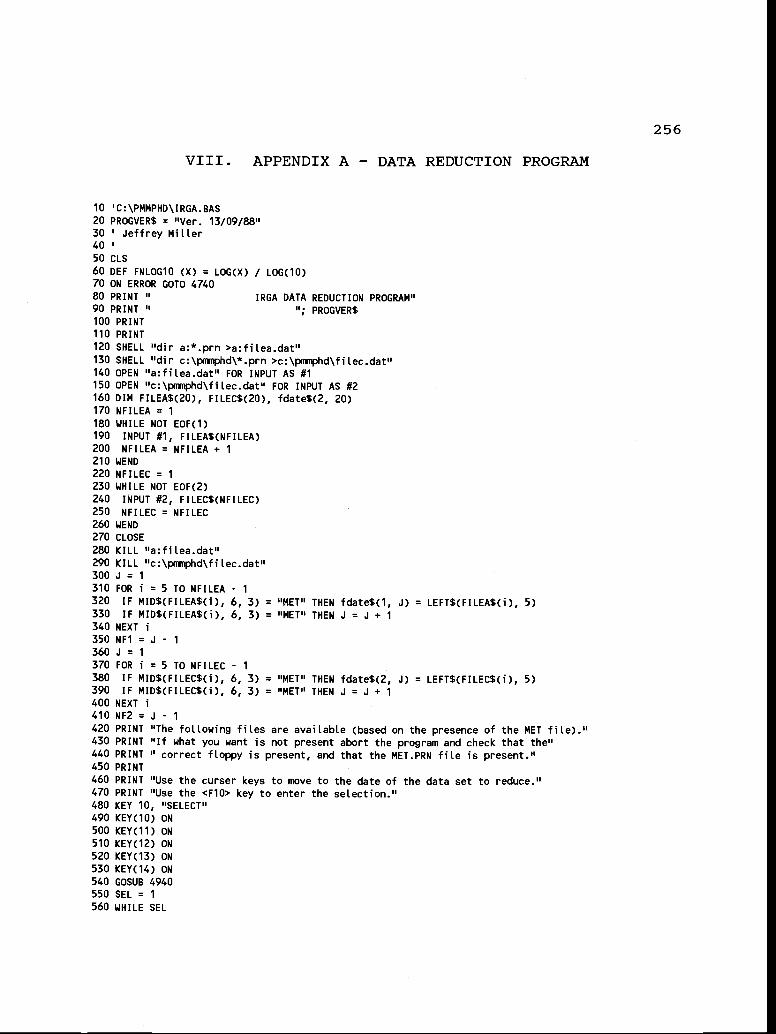
VIII. APPENDIX A - DATA REDUCTION PROGRAM
10 'C:\PMMPHD\IRGA.BAS20 PROGVER$ = "Ver. 13/09/88"30 ' Jeffrey Miller4050 CLS60 DEF FNLOG1O CX) = LOG(X) / LOG(1O)70 ON ERROR GOTO 474080 PRINT " IRGA DATA REDUCTION PROGRAM"90 PRINT " "; PROGVER$100 PRINT110 PRINT120 SHELL "dir a:*.prn >a:filea.dat"130 SHELL "dir c:\pnlnphd\*.prn >c:\pninphd\filec.dat"140 OPEN "a:filea.dat" FOR INPUT AS #1150 OPEN "c:\pniiiphd\filec.dat" FOR INPUT AS #2160 DIM FILEA$(20), FILEC$(2O), fdate%(2, 20)170 NFILEA = 1
180 WHILE NOT EOF(1)190 INPUT #1, FILEA$(NFILEA)200 NFILEA = NFILEA + 1
210 WEND
220 NFILEC = 1230 WHILE NOT EOF(2)240 INPUT #2, FILECS(NFILEC)250 NFILEC = NFILEC260 WEND270 CLOSE280 KILL "a:filea.dat"290 KILL "c:\pninphd\fitec.dat"300 J = 1310 FOR i = 5 TO NFILEA - 1
320 IF MID$(FILEA$(i), 6, 3) = "MET" THEN fdate$(1, J) = LEFTS(FILEAS(i), 5)330 IF MID$(FILEAS(i), 6, 3) = "MET" THEN J = J + 1340 NEXT i350 NFl = J - 1
360 J = 1370 FOR i = 5 TO NFILEC - 1
380 IF MID$(FILEC$(j), 6, 3) = "MET" THEN fdate$(2, J) = LEFT$(FILEC$(i), 5)390 IF MID$(FILEC$(i), 6, 3) = "MET" THEN J = J + 1400 NEXT i410 NF2 J - 1
420 PRINT "The following files are available (based on the presence of the MET file)."430 PRINT "If what you want is not present abort the program and check that the"440 PRINT " correct floppy is present, and that the MET.PRN file is present."450 PRINT460 PRINT "Use the curser keys to move to the date of the data set to reduce."470 PRINT "Use the <F1O> key to enter the selection."480 KEY 10, "SELECT"490 KEY(1O) ON500 KEY(11) ON510 KEY(12) ON520 KEY(13) ON530 KEY(14) ON540 GOSUB 4940550 SEL = 1560 WHILE SEL
256

257
620 WEND
630 KEY(1O) OFF
640 KEY(11) OFF
650 KEY(12) OFF
660 KEY(13) OFF670 KEY(14) OFF
680 OPEN METFILES FOR INPUT AS #1
690 OPEN CO2FILE$ FOR INPUT AS #2
700 INPUT #1, MFILE$
710 IF MFILES = " THEN GOTO 700720 INPUT #2, CFILES
730 IF CFILES = " THEN GOTO 720740 PRINT
750 PRINT "You have opened meteorological file "; MFILES760 PRINT " and IRGA file "; CFILES770 PRINT "Are these correct? (y,n) ";
780 aS = INPUTS(1)
790 IF aS = "y" OR aS = "Y" THEN GOTO 830800 CLOSE
810 IF aS = "n" OR aS = "N" THEN GOTO 10820 GOTO 780830
840 CLS
850 PRINT "Presently reading "; MFILES860 PRINT
870 INPUT #1, TITLES, NOTE1S, note2S880 PRINT TITLES
890 PRINT NOTE1S900 PRINT note2S
910 INPUT #1, DAIS, DAYS, MONTHS, yearS
920 PRINT DAIS; DAYS; MONTHS; yearS
930 INPUT #1, SHRS, HR1$, EHRS, HR2S
940 PRINT SHRS; HR1S, EHRS; HR2S
950 DIM VARS(11), M(VAL(HR2S), 10), MS(VAL(HR2S), 10)960
970 TIME = 1: TWET = 3: TDRY = 5: par = 7: CU2REF = 4: RHEXT = 2: TCHAM = 6: PRESS = 8: TPUMP = 10: lAIR=9
980 FOR i = 1 TO 11
990 INPUT #1, VARS(i)
1000 NEXT i
1010
1020 PRINT "For hour :";
1030 FOR HR = VAL(HR1S) TO VAL(HR2$)1040 PRINT HR;
1050 INPUT #1, MS(HR, TIME), MS(HR, TWET), MS(HR, TDRY), M$(HR, par), MS(HR, CO2REF), MS(HR, RHEXT),MS(HR, TCHAM), MS(HR, PRESS), MS(HR, TPUMP)
1060 INPUT #1, MS(HR, lAIR)1070 NEXT HR
1080 CLOSE #1
1090 PRINT
1100 FOR HR = VAL(HR1S) TO VAL(HR2S)1110 FOR P = 1 TO 10
1120 M(HR, P) = VAL(MS(HR, P))1130 NEXT P1140
570 ON KEY(10) GOSUB 5100 'SeLect
580 ON KEY(11) GOSUB 5200 'Up cursor590 ON KEY(12) GOSUB 5310 'Left cursor600 ON KEY(13) GOSUB 5430 'Right cursor610 ON KEY(14) GOSUB 5550 'Down cursor

258
1150 M(HR, RHEXT) = M(HR, RHEXT) / 100 'convert to fraction1160 M(HR, PRESS) = M(HR, PRESS) / 10 'convert mbar to kPa1170 M(HR, TPUMP) = M(HR, TPUMP) + 273.15 'convert deg C to deg K1180 M(HR, TDRY) = ((5 / 9) * (M(HR, TDRY) - 32)) + 273.15'convert deg F to deg K1190
1200 NEXT HR1210
1220 CLS
1230 PRINT "Presently reading "; CFILES1240 PRINT
1250 INPUT #2, TITLE2S, NOTE21S, note22S1260 PRINT TITLE2S
1270 PRINT NOTE21$
1280 PRINT note22S
1290 INPUT #2, DATE2S, day2S, month2S, year2S
1300 PRINT DATE2S; day2S; month2S; year2S1310 INPUT #2, NUMZNDS, NINDS, NUMRNDS, NRNDS
1320 PRINT NUMINDS; WINDS, NUMRNDS; NRNDS1330 NIND = VAL(WINDS): NRND = VAL(NRNDS)
1340 DIM VAR2S(13), id$(NIND), i(NIND, NRND, 12), iS(WIND, NRND, 12)1350
1360 FOR I = 1 TO 131370 INPUT #2, VAR2S(i)
1380 IF VAR2S(i) = " THEN GOTO 13701390 NEXT i
1400
1410 TIME = 1: RHEXT = 2: FLOW = 3: CO2DIF = 4: RHINT = 5: TCHAM = 6: par = 7: TLEAF = 8: TAIR = 9: PBOMB= 10: LEAFAREA = 11: LEAFWT = 12
1420
1430 PRINT "Round Individual"1440 FOR r = 1 TO NRND1450 INPUT #2, rS1460 IF rS = " THEN GOTO 14501470 INPUT #2, ROUND1480 PRINT ROUND,
1490 FOR md = 1 TO MIND1500 INPUT #2, idS(ind)
1510 IF idS(ind) = " THEN GOTO 15001520 PRINT idS(ind);
1530 INPUT #2, iS(ind, r, TIME), iS(ind, r, RHEXT), iS(ind, r, FLOW)1540 INPUT #2, iS(ind, r, CO2DIF), iS(ind, r, RHINT), iS(ind, r, TCHAM), iS(ind, r, par)1550 INPUT #2, iS(ind, r, TLEAF), iS(ind, r, lAIR), i$(ind, r, PBOMB), iS(ind, r, LEAFAREA), iS(ind,
r, LEAFWT)1560
1570 FORP=1 TO121580 i(ind, r, P) = VAL(iS(ind, r, P))1590 NEXT P1600 i(ind, r, LEAFAREA) = i(ind, r, LEAFAREA) / (100 * 100)'convert crn2 to m21610 i(ind, r, RHEXT) = i(ind, r, RHEXT) / 100'convert to fraction1620 i(ind, r, RHINT) = i(ind, r, RHINT) / 100'convert to fraction1630 i(ind, r, CO2DIF) = -i(ind, r, CO2DIF)1640 i(ind, r, TCHAM) = i(ind, r, TCHAM) + 273.15'convert deg C to deg K1650 i(ind, r, TLEAF) = i(ind, r, TLEAF) + 273.151660 i(ind, r, TAIR) = i(ind, r, TAIR) + 273.151670 i(ind, r, PBOMB) = i(ind, r, PBOMB) I 10 'convert bar to MPa1680 NEXT md1690 PRINT
1700 NEXT r1710 CLOSE #2
1720

1730 CLS
1740 PRINT "The calculated data wiLl be displayed on the screen."1750 PRINT "Do you want to pause after each plant? (y,n) ";1760 AUTOPRINTS = INPUTS(1)
1770 IF AUTOPRINTS = "n" THEN AUTOPRINTS = "N"
1780 IF AUTOPRINTS = "y" THEN AUTOPRINTS = "Y"
1790 IF AUTOPRINTS = "N" OR AUTOPRINTS = "Y" THEN GOTO 18101800 GOTO 1750
1810 PRINT
1820 PRINT "Do you also want the results simutaneousLy printed on the printer? (y,n) ";1830 PRINTERS = INPUT$(1)
1840 PRINT PRINTERS
1850 IF PRINTERS = "y" OR PRINTERS = "n" THEN GOTO 18901860 IF PRINTERS = "Y" OR PRINTERS = "N" THEN GOTO 18901870 PRINT "Improper response, try again."1880 GOTO 1820
1890 IF PRINTERS = "y" THEN PRINTERS = "Y"1900 IF PRINTERS = "Y" THEN1902 PRINT "Is the printer a STAR or a LASER JET? (S,L) ";1903 aS = INPUTS(1)1904 PRINT aS1905 IF aS = "5" OR aS = "s" OR aS = "L" OR aS = "I" THEN GOTO 19081906 PRINT "Improper response, please try again."1907 GOTO 1902
1908 IF aS = "S" OR aS = "s" THEN LPRINT CHRS(27); CHRS(15); 'compressed print1909 IF aS = "L" OR aS = "I" THEN LPRINT CHR$(27); CHRS(38); CHRS(107); CHR$(50); CHR$(83);1910 WIDTH LPRINT 135
1915 END IF
1920 PRINT
1930 PRINT "Do you also want the results saved in a file? (y,n) ";1940 FILES = INPUTS(1)1950 PRINT FILES
1960 IF FILES = "y" OR FILES = "n" THEN GOTO 20001970 IF FILES = "Y" OR FILES = "N" THEN GOTO 20001980 PRINT "Improper response, try again."1990 GOTO 1930
2000 IF FILES = "y" THEN FILES = "Y"
2010 IF FILES = "n" OR FILES = "N" THEN GOTO 21602020 PRINT "On which drive do you want the results stored? (A,C, or Dtefault]) ";
2025 PRINT "On Jeff's machine onLy: Drive b (8), RANDISK (H)"2030 driveS = INPUT$(1)
2040 PRINT driveS
2050 IF driveS = "a" OR driveS = "A" THEN GOTO 21102055 IF driveS = "b" OR driveS = "B" THEN GOTO 2122
2060 IF driveS = "c" OR driveS = "C" THEN GOTO 2130
2070 IF (driveS = "d" OR driveS = "0") AND LEFTS(METFILES, 1) "A" THEN GOTO 21102080 IF (driveS = "d" OR driveS = "D") AND LEFT$(METFILES, 1) = "C" THEN GOTO 21302085 IF driveS = "h" OR driveS = "H" THEN GOTO 2127
2130 FILENAMES = "C:\PMMPHD\" + fdateS(yloc - 14, xloc) + "RES.DAT"
259
2090 PRINT "Improper response,
2100 GOTO 2020try again."
2110 FILENAMES = "A:" + fdateS(yloc - 14, xloc) + "RES.DAT"2115 statgfiLe$ = "A:" + fdate$(yloc - 14, xloc)2120 GOTO 2140
2122 FILENAMES = "B:" + fdateS(yloc - 14, xloc) + "RES.DAT"2124 statgfileS = "B:" + fdateS(yLoc - 14, xLoc)2126 GOTO 2140
2127 FILENAMES = "D:" + fdate$(yloc - 14, xloc) + "RES.DAT"2128 statgfiLe$ = "D:" + fdateS(yloc - 14, xloc)2129 GOTO 2140

260
2135 statgfiteS = "C:\PMMPHD\" + fdateS(ytoc - 14, xloc)2140 OPEN FILENAMES FOR OUTPUT AS #32150 WRITE #3, FILENAMES2151
2152 PRINT "Do you also want the data to be stored as one file per individual for"2153 PRINT "use in STATGRAPHICS ? (y,n) :";2154 statgS = INPUTS(1)2155 PRINT statg$
2156 IF statgS = "y" THEN statgS =2157 IF statgS = "n" THEN statgS = "N"
2158 IF statgS = "N" OR statgS = "Y" THEN GOTO 21602159 GOTO 2151
2160'2170 CLS2180 aS = DATES
2190 PRINT "REDUCED IRGA DATA: Program "; PROGVER$2200 PRINT TITLES; " "; TITLE2S2210 PRINT "Calculated "; aS; " "; TIMES2220 IF PRINTERS = "Y" THEN LPRINT "REDUCED IRGA DATA: Program "; PROGVER$; " "; TITLES; " "; TITLE2S;
" Calculated "; aS
2230 IF FILES = "Y" AND Ip = 1 THEN WRITE #3, "REDUCED IRGA DATA: Program", PROGVERS, TITLES, TITLE2S,"Calculated", aS
2240 PRINT NOTE21S
2250 IF PRINTERS = "Y" THEN LPRINT NOTE21S
2260 IF FILES = "Y" AND Ip = 1 THEN WRITE #3, NOTE21S2270 PRINT note22$
2280 IF PRINTERS = "Y" THEN LPRINT note22S
2290 IF FILES = "Y" AND lp = 1 THEN WRITE #3, note22S
2300 PRINT DATE2S; ": "; day2S; "I"; rnonth2S; "/"; year2S
2310 IF PRINTERS = "Y" THEN LPRINT DATE2S; ": "; day2S; "I"; month2S; "I"; year2$2320 IF FILES = "Y" AND Lp = 1 THEN WRITE #3, DATE2S, day2S, month2S, year2S
2330 IF FILES = "Y" AND Ip = 1 THEN WRITE #3, NUMINDS, NINDS
2340 IF FILES = "Y" AND Lp = 1 THEN WRITE #3, NUMRNDS, NRNDS2350 PRINT
2360 IF PRINTERS = "Y" THEN LPRINT "2370'2380
' Calibration parameter for effect2390
' of water vapor on IRGA CO2 values2400 EMAX = 12405
' Elevation of site in meters2410 IF note2S = "RYE FIELD" OR note22S = "RYE FIELD" THEN ELEV = 1175 ELSE ELEV = 9752420
2430 FOR lp= 1 TO22440 IF Ip = 1 THEN LINECOIJNT = 82450 IF Ip = 2 THEN LINECOUNT = 32460 FOR md = 1 TO MIND2463 IF md <= 9 THEN aS = RIGHTS(STRS(ind), 1) ELSE aS = RIGHTS(STRS(ind), 2)2465 IF Ip = 1 AND statgS = "Y" THEN statfileS = statgfileS + "" + aS + ".RES"2467 IF Ip = 1 AND statg$ = "Y" THEN OPEN statfileS FOR OUTPUT AS #42470 IF LINECOUNT + NRND + 3 > 50 AND PRINTERS = "Y" THEN LPRINT CHR$(12)2480 IF LINECOUNT + NRND + 3 > 50 THEN LINECOUNT = 02490 r=12500 PRINT "Plant "; idS(ind)2510 PRINT " Leaf area "; i(ind, r, LEAFAREA) * (100 * 100); "cm2 Leaf weight "; i(ind, r, LEAFWT);
"g Leaf specific wt ";2520 IF i(ind, r, LEAFWT) = 9999 THEN PRINT "9999 g/n2" ELSE PRINT i(ind, r, LEAFWT) / i(ind, r,
LEAFAREA); "g/m2"
2530 IF PRINTERS = "Y" THEN LPRINT "Plant "; idS(ind); " Leaf area "; i(mnd, r, LEAFAREA) * (100* 100); "cm2 Leaf weight "; i(ind, r, LEAFWT); "g Leaf specific wt ";
2540 IF i(ind, r, LEAFWT) = 9999 AND PRINTERS = "Y" THEN LPRINT "9999 g/m2"

2550 IF i(ind, r, LEAFWT) <> 9999 AND PRINTERS = "V" THEN LPRINT i(ind, r, LEAFWT) / i(ind, r,LEA FAREA); "g/m2"
2560 IF FILES = "Y" AND Lp = 1 THEN WRITE #3, "PLant ", idS(ind), "Leaf area (cm2) ", i(ind, r,
LEAFAREA) * (100 * 100), "Leaf weight", i(ind, r, LEAFWT)2570 IF FILES = "Y" AND Lp = 1 THEN WRITE #3, "Time", "Time", "Ass", "Ass", "Ref VPM", "Int CO2",
"Trans", "Trans", "Cond", "Cond", "Cond", "P Bomb", "PAR", "Amb VPD ", "LeafVPD", "TCham",
"TLeaf", "TAi r", "AlE", "A/PAR", "Rh ( i nt cell)",
"Bar Press", "Stat Press"2580 IF FILES = "Y" AND lp = 1 THEN WRITE #3, "24hr", "hr.dec mm", "unot/m2/s", "rinol/g/s", "vpm",
"vpm", "rmiol/m2/s", "unot/g/s", "nmiol/m2/s", "umo l/g/s", "mis", "MPa", "umo l/m2/s", "kPa", "kPa",
''uno I /nino I , "nmo L/uno I", 11%h1
"kPa", "kPa"
2585 IF (p = 1 AND statgS = "Y" THEN WRITE #4, "Ind", "Day", "Month", "Year", "Dtime", "Assarea","Asswt", "Ref vpm", "I ntvpm", "T ransarea", "T ranswt", "Condarea", "Condwt", "Condnins", "Pbomb",
"Par", "Ambvpd", "Leafvpd", "Tcham", "Tteaf", "lair","Rhintcel I", "Barpress", "Statpress"
2590 IF lp = 2 THEN GOTO 267026002610 'Heading for values bases on area2620 PRINT "Time Assimilation mt CO2 Trans Cond Cond"2630 PRINT "24hr umol/m2/s vpm rnol/m2/s rnol/rn2/s mis"2640 IF PRINTERS = "Y" THEN LPRINT "Time Time Ass Int CO2 Trans Cond Cond P Bomb
PAR Anib VPD Leaf VPD Tcham Tleaf Tair A/E A/PAR"2650 IF PRINTERS = "Y" THEN LPRINT "24hr hr.dec mm umol/m2/s vpm rnol/m2/s rnot/m2/s rn/s MPa
unol/m2/s kPa kPa C C C umol/ninol nmot/umol"2660 GOTO 27202670 'Heading for values based on weight2680 PRINT "Time Assimilation Ref CO2 Trans Cond Res"2690 PRINT "24hr nmot/g/s vpm umol/g/s umol/g/s s/rn"2700 IF PRINTERS = "Y" THEN LPRINT "Time Time Ass Ref CO2 Trans Cond Res P Bomb
Rhincelt Amb VPD Leaf VPD Tcham Tleaf Tair Barpress Statpress"2710 IF PRINTERS = "Y" THEM IPRINT "24hr hr.dec mm rmol/g/s vpm uuol/g/s uinol/g/s s/rn MPa
kPa kPa C C C kPa kPa"27202730 FOR r = 1 TO NRND2740
2750 2400 time to hr and decmal minute (hr.min)2760 HR = INT(i(ind, r, TIME) / 100)2770 MIN= ((i(ind, r, TIME) / 100)- (INT(i(ind, r, TIME) / 100))) / .62780 DTIME = HR + MIN2790 IF i(ind, r, TIME) = 9999 THEN DTIME = 99.992800
2810 ' Find the correct pun ten, barameteric pressure, and ref CO2 values2820 ' (Average requires MET data 1 hr before and after any IRGA data)2830
2840 FOR HR = VAL(HR1S) TO VAL(HR2S) - 1
2850 IF M(HR, TIME) < i(ind, r, TIME) AND i(ind, r, TIME) < M(HR + 1, TIME) THEN GOTO 28702860 0010 2910
2870 PUMPTEMP = (M(HR, TPUMP) + M(HR + 1, TPUMP)) / 22880 barpress = (M(HR, PRESS) + M(HR + 1, PRESS)) / 22890 STATTEMP = (M(HR, TDRY) + M(HR + 1, TORY)) / 22900 REFCO2 = (M(HR, CO2REF) + M(HR + 1, CO2REF)) / 22910 NEXT HR2920
2930 statpress = barpress * (((288 - .0065 * ELEV) / 288) 5.256)'(List p. 268)2940
2950 Check for missing IRGA data2960 IF i(ind, r, FLOU) = 9999 THEN GOTO 42002962
2963 Calibration correction for ADC light sensor
261
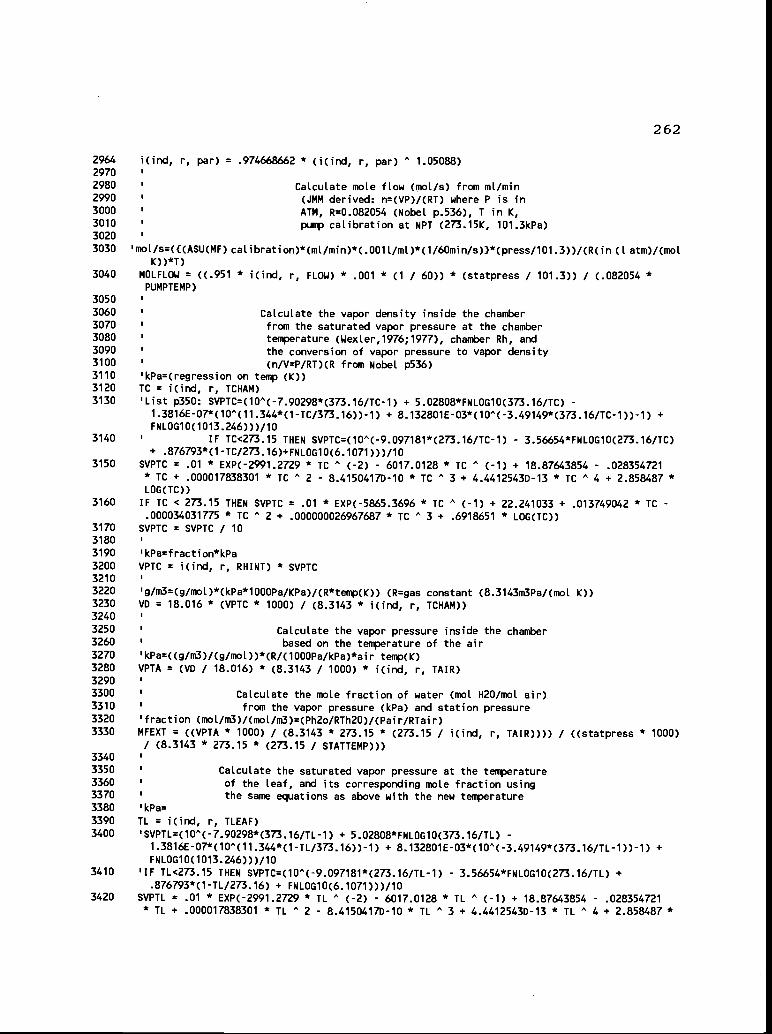
262
2964 i(ind, r, par) = .974668662 * (i(ind, r, par) 1.05088)2970 '
2980' CaI.culate mole flow (niot/s) from mt/mm
2990' (JMM derived: n=(VP)/(RT) where P is in
3000' ATM, R=0.082054 (Nobel p.536), I in K,
3010' pui calibration at NPT (273.15K, 101.3kPa)
30203030 'mol/s=({(ASU(MF) calibration)*(mt/min)*(.001l/ml)*(1/60rnin/s))*(press/101.3))/(R(jn (I atm)/(mol
K))*T)
3040 MOLFLOW = ((.951 * i(ind, r, FLOW) * .001 * (1 I 60)) * (statpress / 101.3)) / (.082054 *PUMPTEMP)
3050
3060 CaLculate the vapor density inside the chamber3070 from the saturated vapor pressure at the chamber3080 temperature (Wexler,1976;1977), chamber Rh, and3090 the conversion of vapor pressure to vapor density3100 (n/V=P/RT)(R from Nobel p536)3110 'kPa=(regression on temp (K))3120 IC = i(ind, r, TCHAM)3130 'List p350: SVPTC=(10(7.9o298*(373.16,TC.1) + 5.02808*FNLOG1O(373.16/TC) -
1.3816EO7*(10A(11.344*(1IC,373.16)).1) + 8.132801E.03*(10(3.49149*(373.16/TC1)).1) +FNLOG1O( 1013.246)) )/10
3140 ' IF TC<273.15 THEN svPIC=(1OA(.9.097181*(273.16/IC.1) - 3.56654*FNLOG1O(273.16/TC)+ .876793*(1_IC/273.16)+FNL0G1O(6.1071))),10
3150 SVPTC = .01 * ExP(-2991.2729 * IC (-2) - 6017.0128 * " (-1) + 18.87643854 .028354721* IC + .000017838301 * IC "2- 8.41504170-10 * IC "3 + 4.44125430-13 * IC "4 + 2.858487 *LOG(TC))
3160 IF TC < 273.15 THEN SVPTC = .01 * EXP(-5865.3696 * IC (-1) + 22.241033 + .013749042 * IC -.000034031775 * IC " 2 + .000000026967687 * 3 + .6918651 * LOG(IC))
3170 SVPTC = SVPIC / 103180
3190 IkPa=fraction*kPa3200 VPTC = i(ind, r, RHINT) * SVPIC32103220 g/m3=(g/mol)*(kPa*1000Pa/Kpa)/(R*tefpp(K)) (R=gas constant (8.3143m3Paf(mol K))3230 VD = 18.016 * (VPTC * 1000) / (8.3143 * i(ind, r, ICHAM))32403250 Calculate the vapor pressure inside the chamber3260 ' based on the temperature of the air3270 IkPa=((g/m3)/(g/mol))*(R/(1000pa/kpa)*ajr temp(K)3280 VPIA = (VD / 18.016) * (8.3143 / 1000) * i(incl, r, lAIR)3290
3300 Calculate the mole fraction of water (mol H20/mol air)3310 ' from the vapor pressure (kPa) and station pressure3320 'fraction (mot/m3)/(mol/m3)=(ph2o/R1h20)/(pair/Rlair)3330 MFEXT = ((VPTA * 1000) I (8.3143 * 273.15 * (273.15 / i(ind, r, lAIR)))) I ((statpress * 1000)
/ (8.3143 * 273.15 * (273.15 I SIAIIEMP)))3340
3350 Calculate the saturated vapor pressure at the temperature3360 of the Leaf, and its corresponding mole fraction using3370 ' the same equations as above with the new temperature3380 'kPa=
3390 IL = i(ind, r, ILEAF)3400 SVPTL=(10"(7.90298*(373.16/IL.1) + 5.02808*FNLOG1O(373.16/IL) -
1.3816E.07*(1OA(11.344*(1IL,373.16))1) + 8.132801E03*(10A(3.49149*(373.16/TL1))1) +
FN LOG 10 C 1013 . 246) ) )/10
3410 'IF IL<273.15 THEN SVPIC=(1OA(*9.097181*(273.16/TL_1) - 3.56654*FNLOG1O(273.16/TL) +
.876793*(1IL/273.16) + FNLOG1O(6.1071)))/103420 SVPTL = .01 * EXP(-2991.2729 * IL (-2) - 6017.0128 * IL (-1) + 18.87643854 - .028354721
* IL + .000017838301 * IL "2-8.41504170-10 * IL "3 + 4.4412543D-13 * IL "4 + 2.858487 *

263
LOG(TL))3430 IF IL < 273.15 THEN SVPTL = .01 * EXP(-5865.3696 * TL " (-1) + 22.241033 + .013749042 * TL -
.000034031775 * IL 2 + .000000026967687 * IL "3 + .6918651 * LOG(TL))3440 SVPTL = SVPTL / 103450
3460 Correct the SVPTL due to neg water potentials3470 (NobeL p412, Vw p537)3480 ' Rh=exp((Vw*I( IND,R,PBOMB)/(RT)3490 IF i(ind, r, PBOtIB) = (9999 / 10) THEN rhinceLL = 1 ELSE rhincetL = EXP((1.805E-05 * (i(nd, r,
PBONB)) * 1000000!) / (8.3143 * i(ind, r, TLEAF)))3500 SVPTL = rhincell. * SVPTL
3510
3520 Correct the saturated vapor pressure for elevation3530 SVPTL = (statpress I barpress) * SVPTL3540
3550 'g/m3=3560 SVDTL = 18.016 * (SVPTL * 1000) / (8.3143 * i(ind, r, TLEAF))3570 'fraction=3580 MFINT = ((SVPTL * 1000) I (8.3143 * 273.15 * (273.15 / i(ind, r, TLEAF)))) I ((statpress * 1000)
/ (8.3143 * 273.15 * (273.15 / STATTEMP)))3590
3600 CaLculate the vapor pressure gradient from inside3610 the Leaf to the air (VPD)3620 'kPa=kPa-kPa3630 vpdLa = SVPTL - VPTA36403650 CalcuLate the ambient vapor pressure gradient based3660 on the ambient Rh measured by the chamber and the3670 1 chamber temp3680 ambvpdtc = SVPTC - VPTC3690
3700 CalcuLate the transpiration rate from the mole3710 flow rate, the difference in the moLe fraction of3720 water in the air in the exiting and entering the3730 chamber (exiting flow rate corrected for the3740 increase in fLow due to the transpiration), and3750 ' the leaf area (BaLL in Zeiger p455 eq 12)3760 ImoL/m2/s=((molls)*((rnol frac-moL frac)/(1-mot frac)))/Leaf area (m2)3770 trans = (MOLFLOW * ((MFEXT 0) I (1 - MFEXT))) / i(ind, r, LEAFAREA)3780
3790 CaLcuLate the conductance in mol/m2/s from the transpiration,3800 the Leaf to air H20 gradient in mole fractions, and a mass3810 ' balance correction (Ball in Zeiger p462 eq 28b)3820 ImoL/rn2/s=(mol/m2/s)*((((moLImoL)(moL/mol))I2)/(mol/moLmoL/moL))3830 cond = trans * ((1 - ((MFINT + MFEXT) / 2)) / (MFINT - MFEXT))3840
3850 Calculate the conductance in rn/s from the transpiration and3860 1 the leaf to air gradient expressed as rnol/m3 (JMM derived)3870 'mls=(moL/m2/s)/((g/m3)/(g/moL )-(g/m3)/(g/mol))3880 condms = trans I ((SVDTL / 18.016) - (VD / 18.016))3890
3900 Correct the IRGA display units (which are moL/L * a constant)3910 ' to VPM (at SIP)3920 IVPMDIFF=I(IND,R,c02DIF)*(101 .3/STATPRESS)*(PUMPTEMP/293.15)3930 vpmdiff = i(ind, r, CO2DIF) * (101.3 / statpress)39323933 Calibration correct for IRGA3934 vpmdiff = vpmdiff * 1.0459183673940
3950 Correct the CO2 differential for water vapor (ADC IRGA manual)

264
3960 'vpm(=unoL/mot)= regression on CO2 differentiaL(vpm) and water vapor pressure in the air (mbarkPa*10)
3970 CORCO2DIF = vpmdiff - (1 + .000787 * vpindiff) * EMAX * (1 - EXP(-.07 * VPTA * 10))3980
3990 CaLculate carbon assimiLation rate (Coombs p93)4000 (with the fLow rate corrected to incLude the4010 addition of the transpiration).4020 'unoL/m2/s=(((moL/s+((mot/m2/s)*m2))*(unoL/mot ))1m24030 co2ass = ((MOLFLOW + (trans * i(ind, r, LEAFAREA))) * CORCO2DIF) I i(ind, r, LEAFAREA)40404050 Correct the IRGA dispLay units to VPM at SIP4060 uREFVPMREFCO2*(101 .3/STATPRESS)*(i(ind,r,tair)/293.15)4070 refvpm = REFCO2 * (101.3 I statpress)3972
3973 Calibration correct for IRGA3974 ref vpm = ref vpm * 1.045918367
4080
4090 CaLcuLate the internaL CO2 concentration in VPM at SIP4100 (BaLL in Zeiger p466 eq 35)4110 'vpm=
4120 intco2 = (((cond / 1.6) - (trans / 2)) * (refvpm - CORCO2DIF) - (co2ass I 1000000!)) / ((cond /1.6) + (trans / 2))
4130
4140 'nlnoL/m2/s=moL/m2/s*10004150 trans = trans * 10004160 cond = cond * 10004170 Im/s=m/s*10004180 conäns = cons * 10004190
4200 'output
4210 IF co2ass 0 THEN co2ass2 = 99.999 / 1000 ELSE co2ass2 = co2ass * (i(ind, r, LEAFAREA) I i(ind,r, LEAFWT))
4215 IF co2ass2 = 99.999 I 1000 THEN stco2ass2 = -99999 / 1000 ELSE stco2ass2 = co2ass24220 IF co2ass = 0 THEN co2ass = 99.9994225 IF co2ass = 99.999 THEN stco2ass = -99999 ELSE stco2ass = co2ass4230 IF refvpm = 0 THEN refvpm = 9994235 IF refvpm = 999 THEN strefvpm = -99999 ELSE strefvpm = refvpm4240 IF intco2 = 0 THEN intco2 = 9994245 IF intco2 = 999 THEN stintco2 = -99999 ELSE stintco2 = intco24250 IF trans = 0 THEN trans2 = 99.999 / 1000 ELSE trans2 = trans * (i(ind, r, LEAFAREA) I i(ind, r,
LEAFWT))
4255 IF trans2 = 99.999 / 1000 THEN sttrans2 = -99999 / 1000 ELSE sttrans2 = trans24260 IF trans = 0 THEN trans = 99.9994265 IF trans = 99.999 THEN sttrans = -99999 ELSE sttrans = trans4270 IF cond = 0 THEN cond2 = 99.999 / 1000 ELSE cond2 cond * (i(ind, r, LEAFAREA) / i(ind, r,
LEA FWT))
4275 IF cond2 = 99.999 / 1000 THEN stcond2 = -99999 / 1000 ELSE stcond2 = cond24280 IF cond = 0 THEN cond = 99.9994285 IF cond = 99.999 THEN stcond = -99999 ELSE stcond = cond4290 IF condms = 0 THEN condms = 99.994295 IF conc*ns = 99.99 THEN stcondins = -99999 ELSE stcondms = condins4300 IF vpdta = 0 THEN vpdLa = 99.9994305 IF vpdta = 0 THEN stvpdta = -99999 ELSE stvpdta vpdLa4310 IF aithvpdtc = 0 THEN ambvpdtc = 99.9994315 IF ambvpdtc = 99.999 THEN stathvpdtc = -99999 ELSE stambvpdtc = ambvpdtc4320 IF barpress = 0 THEN barpress = 999.9994325 IF barpress = 999.999 THEN stbarpress = -99999 ELSE stbarpress = barpress4330 IF statpress = 0 THEN statpress = 999.9994335 IF statpress = 999.999 THEN ststatpress = -99999 ELSE ststatpress = statpress4340 IF rhinceLL = 0 THEN rhinceLL = 99.99
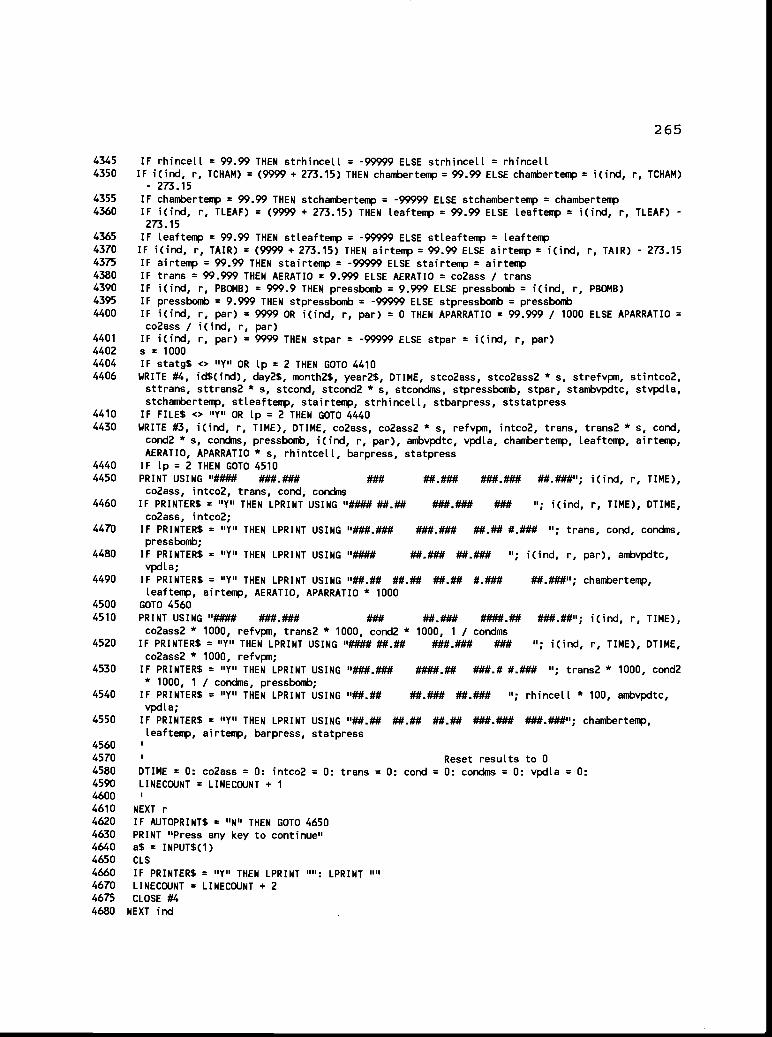
265
4345 IF rhthcett = 99.99 THEN strhincett = -99999 ELSE strhincett = rhincett
4350 IF i(ind, r, TCHAM) = (9999 + 273.15) THEN chamberten = 99.99 ELSE chambertentp = i(ind, r, TCHAM)
- 273.15
4355 IF chambertemp = 99.99 THEN stchambertetnp = -99999 ELSE stchambertemp = chambertemp4360 IF i(ind, r, TLEAF) = (9999 + 273.15) THEN Leaftenip = 99.99 ELSE Leaftenip = i(ind, r, TLEAF) -
273.154365 IF Leaftemp = 99.99 THEN stteaftenp = -99999 ELSE stteaftenp = Leaften4370 IF i(ind, r, TAIR) = (9999 + 273.15) THEN airtefnp = 99.99 ELSE airtemp = i(ind, r, TAIR) - 273.154375 IF airtenip = 99.99 THEN stairteffip = -99999 ELSE stairtenp airtenip
4380 IF trans = 99.999 THEN AERATIO = 9.999 ELSE AERATIO = co2ass I trans4390 IF i(ind, r, PBOMB) = 9999 THEN pressbomb = 9.999 ELSE pressbomb = i(ind, r, PBOMB)4395 IF pressboth = 9.999 THEN stpressbomb = -99999 ELSE stpressbon = pressbomb4400 IF i(ind, r, par) = 9999 OR i(ind, r, par) = 0 THEN APARRATIO = 99.999 / 1000 ELSE APARRATIO =
co2ass / i(ind, r, par)4401 IF i(ind, r, par) = 9999 THEN stpar = -99999 ELSE stpar = i(ind, r, par)4402 s = 10004404 IF statgS <> "Y" OR Lp = 2 THEN GOTO 44104406 WRITE #4, idS(ind), day2$, month2$, year2s, DTIME, stco2ass, stco2ass2 * s, strefvpm, stintco2,
sttrans, sttrans2 * s, stcond, stcond2 * s, stcondins, stpressbomb, stpar, stambvpdtc, stvpdta,
stchan*ertemp, stteaftenip, stairtemp, strhincett, stbarpress, ststatpress4410 IF FILES <> "Y" OR Lp = 2 THEN GOTO 44404430 WRITE #3, i(ind, r, TIME), DTIME, co2ass, co2ass2 * s, refvpm, intco2, trans, trans2 * S. cond,
cond2 * s, concns, pressbonib, i(ind, r, par), ambvpdtc, vpdta, chambertemp, Leaftemp, airtenç,
AERATIO, APARRATIO * s, rhintcetL, barpress, statpress4440 IF Lp = 2 THEN GOTO 45104450 PRINT USING "#### ###.### ### ##.### ###.### ##.###"; i(ind, r, TIME),
co2ass, intco2, trans, cond, condms4460 IF PRINTERS = "Y" THEN LPRINT USING "#### ##.## ###.### ### "; i(ind, r, TIME), DTIME,
co2ass, intco2;4470 IF PRINTERS = "Y" THEN LPRINT USING "###.### ###.### ##.## #.### "; trans, cond, condms,
pressbomb;4480 IF PRINTERS = "Y" THEN LPRINT USING "#### ##.### ##.### "; i(ind, r, par), ambvpdtc,
vpd La;4490 IF PRINTERS = "Y" THEN LPRINT USING "##.## ##.## ##.## #.### ##.###"; chambertemp,
Leaftenip, airtemp, AERATIO, APARRATIO * 10004500 GOTO 45604510 PRINT USING "#### ###.### ### ##.### ###### ###.##"; i(ind, r, TIME),
co2ass2 * 1000, refvpm, trans2 * 1000, cond2 * 1000, 1 / condms4520 IF PRINTERS = "Y" THEN IPRINT USING "#### ##.## ##### ### "; i(ind, r, TIME), DTIME,
co2ass2 * 1000, refvpm;4530 IF PRINTERS = "Y" THEN IPRINT USING "###.### ####.## ###.# #.### "; trans2 * 1000, cond2
* 1000, 1 / concns, pressbonib;
4540 IF PRINTERS = "Y" THEN LPRINT USING "##.## ##.### ##.### "; rhincetL * 100, ambvpdtc,vpd La;
4550 IF PRINTERS = "Y" THEN LPRINT USING "##.## ##.## ##.## ###.### ###.###"; chambertemp,Leaftemp, airten, barpress, statpress
45604570 Reset resuLts to 04580 DTIME = 0: co2ass = 0: intco2 = 0: trans :0: cond = 0: condms = 0: vpdta :0:4590 LINECOIJNT = LINECOIJNT + 1
4600 '
4610 NEXT r
4620 IF AUTOPRINTS = "N" THEN GOTO 46504630 PRINT "Press any key to continue"4640 aS = INPUT$(1)
4650 CLS
4660 IF PRINTERS = "Y" THEN LPRINT ": LPRINT "4670 LINECO(JNT = LINECOUNT + 24675 CLOSE #4
4680 NEXT md

4690 IF PRINTERS = "Y" THEN LPRINT CHRS(12)4700 LINECOIJNT = 0
4710 NEXT Ip
4720 CLOSE
4730 END
47404750 ' Error routines
4760 PRINT "Error #"; ERR
4770 IF ERR = 53 THEN GOTO 4840
4780 IF ERR = 64 THEN GOTO 48404790 PRINT CHRS(7), CHRS(7), CHRS(7)4800 PRINT
4810 PRINT "There is a program error that was not trapped- PROGRAM ABORTED"4820 RESUME 47204830
4840 ' trying to open a file that doesn't exist4850 FOR I = 1 TO 34860 PRINT CHRS(7);4870 NEXT i
4880 IF ERR = 53 AND ERL = 690 THEN PRINT "The CO2 PRN file is not on the floppy. Quit BASIC andre-generate in LOTUS"
4890 IF ERR = 53 AND ERL = 690 THEN 47204900 RESUME 630
4910
4920 'File selection menu actions4930
4940 'InitiaL conditions4950 yloc = 15
4960 xloc = 1
4970 FOR drive = 1 TO 24980 IF drive = 1 THEN NF = NFl4990 IF drive = 2 THEN NF = NF25000 FORF=1TONF5010 LOCATE yloc + drive - 1, 1 + (xloc + F - 2) * 105020 IF drive = 1 AND F = 1 THEN COLOR 0, 7 ELSE COLOR 7, 05030 PRINT fdateS(drive, F)5040 NEXT F
5050 COLOR 7, 05060 NEXT drive
5070 LOCATE ytoc, 1 + ((xtoc - 1) * 10)5080 RETURN
5090
5100 '<FlO> (select)
5110 SEL = 0
5120 IF yLoc = 16 THEN GOTO 5020
5130 METFILES = "A:" + fdateS(ytoc - 14, xLoc) + "MELPRN"5140 CO2FILES = "A:" + fdateS(yLoc - 14, xtoc) + "CO2.PRN"5150 GOTO 5180
5160 METFILES = "C:\PMMPHD\" + fdateS(yloc - 14, xloc) + "MET .PRN"
5170 CO2FILES = "C:\PMMPHD\" + fdates(yloc - 14, xloc) + "CO2.PRN"5180 RETURN
5190
5200 'Up cursor
5210 PRINT fdate$(yloc - 14, xloc)5220 yLoc = ytoc - 1
5230 IF yloc = 14 THEN ytoc = 16
5240 LOCATE ytoc, 1 + ((xtoc - 1) * 10)5250 COLOR 0, 7
5260 PRINT fdates(yloc - 14, xloc)5270 COLOR 7, 0
266
5280 LOCATE ytoc, 1 + ((xtoc - 1) * 10)5290 RETURN
5300
5310 'Left cursor
5320 PRINT fdate$(yLoc - 14, xtoc)
5330 xtoc = xtoc - 1
5340 IF xtoc = 0 AND yLoc = 15 THEN xtoc = NFl
5350 IF xtoc = 0 AND yLoc = 16 THEN xtoc = NF25360 LOCATE yloc, 1 + ((xtoc - 1) * 10)5370 COLOR 0, 7
5380 PRINT fdate$(ytoc - 14, xtoc)5390 COLOR 7, 05400 LOCATE ytoc, 1 + ((xLoc - 1) * 10)
5410 RETURN
5420
5430 'Right cursor
5440 PRINT fdate$(ytoc 14, xtoc)
5450 xtoc = xLoc + 15460 IF ytoc = 15 AND xtoc > NFl THEN xtoc = 1
5470 IF ytoc = 16 AND xtoc > NF2 THEN xtoc = 15480 LOCATE yLoc, 1 + ((xtoc - 1) * 10)
5490 COLOR 0, 75500 PRINT fdate$(ytoc 14, xtoc)
5510 COLOR 7, 05520 LOCATE ytoc, 1 + ((xtoc - 1) * 10)5530 RETURN5540
5550 'Down cursor
5560 PRINT fdate$(ytoc 14, xtoc)
5570 ytoc = ytoc + 1
5580 IF yLoc = 17 THEN ytoc = 155590 LOCATE ytoc, 1 + ((xtoc - 1) * 10)5600 COLOR 0, 7
5610 PRINT fdateS(ytoc - 14, xtoc)5620 COLOR 7, 0
5630 LOCATE ytoc, 1 + ((xtoc - 1) * 10)5640 RETURN
267

Notes on IRGA.BAS (Ver. 24/01/88)
(Ver. 24/01/88)
Jeffrey Miller
This is an explanation of the equations used in the IRGA.BAS program used to reduce the ADCIRGA data colLected by Patsy MiLler in Central Oregon, and the Logic of their sequence.
The format of this explanation is a LINE NUMBER, followed by an explanation.
NOTE: due to continuing program development and renumbering, the Line numbers given here maynot always be up to date. The use of subscripts and superscripts in the variable names and units isdependant on the ability of the printer to print them, and is therefore not uniform.
60
Because the LOG function in BASIC is base e (i.e. it is the mathematical function LW) thedefined function FNLOG1O calculates LOG base 10.
1010-1140
1420-1720
The program uses needs meteorological data and IRGA data that is read in from LOTUS files.These fiLes have blank spaces which BASIC would interpret as delimiters around numeric fields. To overcome this problem the numbers are read in from the files as strings, which use the comas that are in thedata structure as delimiters, and then converted to numbers.
1140-1190
1600-1670
As the numbers are read in from the Met and CO. files the units are corrected. This applies
to areas (from cm2 to m'), Relative humidities (from X to fraction), temperatures (from C and F to K),pressures (from millibar to kPa), and water potentials (from bars to MPa).
2400
EMAX is a calibration parameter for the effect of water in the sample gas returning from theleaf chamber on the CO, reading. This is necessary because H2O absorbs infrared light in the same bandsas CO, and is therefore mistaken for Co,, causing an incorrect and elevated reading.
2410
Some of the equations use absolute atmospheric pressure (station pressure), which is a function
of the elevation of the site, and other equations use the barometric pressure, which has been correctedfor elevation and is as if the site was at sea level.
2750-2800
Decimal time (which is hours and fractions of hours) is calculated for ease of plotting.
2840- 2910
The hourly Met values an hour before and after the time of measurement are found and an averageis calculated.
268
2930
The lapse rate for atmospheric pressure is calculated from the elevation of the site using anequation from List (p. 268). This generates station pressure from barometric pressure.

-i5.256288- . 0065*ELEV
STATPRESS = BARPRESS *
L288
For the elevation of our site in Central Oregon, which is 975 meters, the correction tobarometric pressure is approximateLy 0.8896. This changes a barometric pressure of 101.3 kPa to 90.1 kPa.
3040
Calculate the flow rate of dry air entering the leaf cuvette in moles/second from thevoLumetric flow rate (mI/mm) that the ASU (MF) gives. This is a re-arraignment of the ideal gas law(PV = nRT) where P is in Atmospheres (i.e. pressure in kPa/1O1.3), R = 0.082054 (1 atm)IOnol K) (Nobelp.536), and I is in °K. The ASU (MF) was caLibrated at NPT (273.15 K, 101.3 kPa) and has a calibrationcoefficient of 0.951 to correct it's slight over-reading.
Definition of symboLs and units in the following equations:
SymboL Definition Units Unit Abbreviationn nunber of moles mole melV Volume liter I
P Pressure (varies) kPa or AtmR Gas Law constant (varies)T Temperature Kelvin K
(V] [P]
n-[R] [1]
ml 1 1 mini [ Station press1IASU(MF) cat*FLOW(_____)*.Oo1(_)*(_)I
L mm
mel
[.951*I(IND,R,FLOW)*.001*(1/60)] * [STATPRESS/1O1.3]MOLFLOW -
[.082054] * [PUMPTEMP]
MOLEFLOW is affected by changes in temperature and pressure as follows:
MOLEFLOW STATPRESS PUMPTEMP
meL/s kPa
269
If we take (1) as the base values the tack of correction for elevation is given in (2). The5 degree variation in temperature, between (1) and (3) is a typicaL temperature difference measuredbetween the air as it Leaves the ASU(MF), and the temperature measured in the Leaf Chamber by the IRGA.
(1) 1.758611E-04 90.11941 293.15(2) 1.976792E-04 101.3 293.15
(3) 1.789127E-04 90.11941 288.15
ml 60 s 101.3JL _J
-ii- -iT (K)
J L
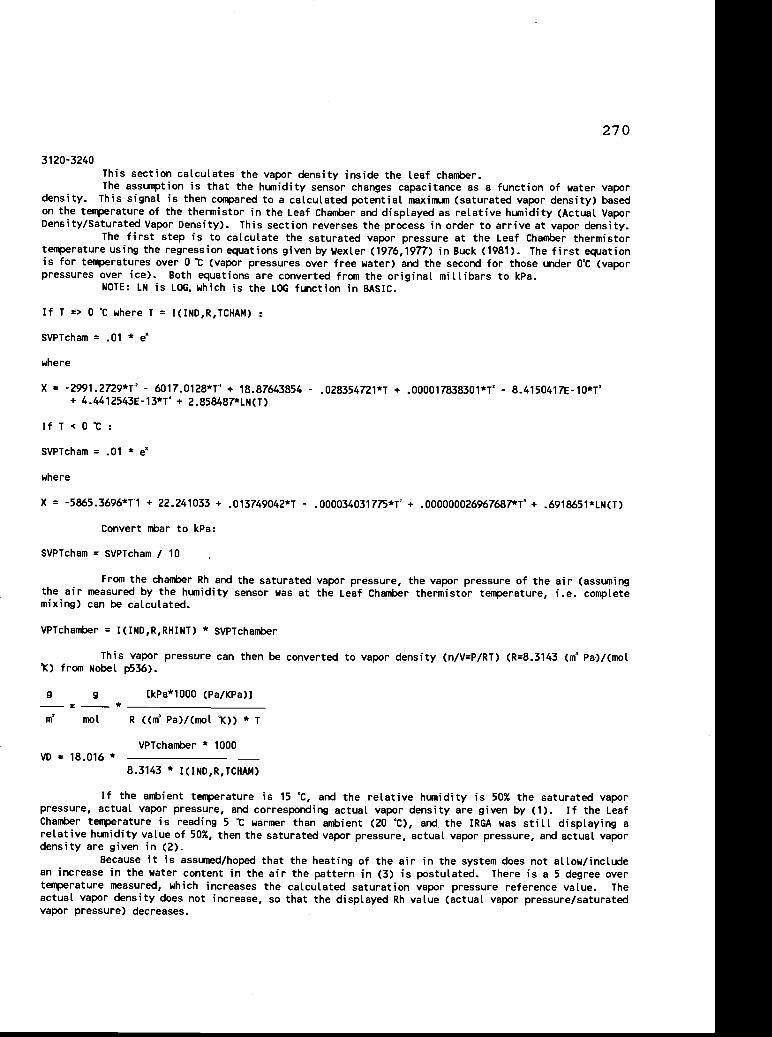
270
3120-3240
This section calculates the vapor density inside the leaf chamber.
The assultion is that the hunidity sensor changes capacitance as a function of water vapordensity. This signal is then compared to a calculated potential maximum (saturated vapor density) based
on the temperature of the thermistor in the Leaf Chamber and displayed as relative humidity (Actual VaporDensity/Saturated Vapor Density). This section reverses the process in order to arrive at vapor density.
The first step is to calculate the saturated vapor pressure at the Leaf Chamber thermistortemperature using the regression equations given by Wexter (1976,1977) in Buck (1981). The first equation
is for temperatures over 0 'C (vapor pressures over free water) and the second for those under O'C (vaporpressures over ice). Both equations are converted from the originaL mitlibars to kPa.
NOTE: LN is LOG, which is the LOG function in BASIC.
If I => 0 'C where I = I(IND,R,TCHAM)
SVPTcham = .01 * e'
where
X = .29912729*1' - 6017.0128*1' + 18.87643854 - .028354721*1 + .000017838301*1' - 8.415O417E1O*T'+ 4.4412543E.13*T' + 2.858487*LN(T)
If I < 0 'C
SVPTcham = .01 *
where
X = 5539*fl + 22.241033 + .013749042*1 - .000034031775*1' + .000000026967687*1' + .6918651*LN(T)
Convert mbar to kPa:
SVPTcham = SVPTcham / 10
From the chamber Rh and the saturated vapor pressure, the vapor pressure of the air (assumingthe air measured by the humidity sensor was at the Leaf Chamber thermistor temperature, i.e. completemixing) can be calculated.
VPlchariter = I(IND,R,RHINT) * SVPlchamber
This vapor pressure can then be converted to vapor density (n/VP/RT) (R8.3143 (m' Pa)/(mol'K) from Nobel p536).
g g [kPa*1000 (Pa/KPa)]*
m' mol R ((m' Pa)/(mol 'K)) * I
VPTchamber * 1000VD = 18.016 *
8.3143 * I(IND,R,TCHAM)
If the ambient temperature is 15 'C, and the relative humidity is 50% the saturated vapor
pressure, actual vapor pressure, and corresponding actual vapor density are given by (1). If the Leaf
Chamber temperature is reading 5 'C warmer than ambient (20 'C), and the IRGA was still displaying arelative humidity vaLue of 50%, then the saturated vapor pressure, actual vapor pressure, and actual vapordensity are given in (2).
Because it is assumed/hoped that the heating of the air in the system does not allow/includean increase in the water content in the air the pattern in (3) is postulated. There is a 5 degree over
temperature measured, which increases the calculated saturation vapor pressure reference value. Theactual vapor density does not increase, so that the displayed Rh value (actual vapor pressure/saturatedvapor pressure) decreases.

VPTair
3330
Calculate the mole fraction of water in the air (mel H0/mol air) from the vapor pressure andstation pressure. Both pressures are corrected to normal temperature (273.15 K).
rmoLH2O 1 r [PH2O] 1
CaLculate the vapor pressure inside the chamber based on the temperature of the air (measuredwith a thermocoupLe) and the vapor density of the air.
rin
*R*TlviL--J
I- -I r -iI lB.3143i
- i*lL18°16] L
1000]
I(IND,R,TAIR)
m3 ER] [T0*(T0/TH2O)]
fraction -
molair [Pair]
m3 ER] [T0*(T0/Tair)]L _J L _J
I-vplair(kpa) * 1000(Pa/kPa)
m3 Pa 273.158.3143 * 273.15 *
mot K I(IND,R,TAIR)MFext -
STATPRESS(kPa) * 1000(Pa/kPa)
m3 Pa 273.158.3143 * 273.15 *
Linot K
271
Temp
iC
svickPa
Rh VPTCfraction kPa g/m
(1) 288.15 17.05319 .5 8.526595 64.11945(2) 293.15 23.38545 .5 11.69273 86.42883(3) 293.15 23.38545 .370937 8.67453 64.1193
3280
F
L
1m3 Pa
ng/m3 mot K
kPa - * *Kg/rno I
LPa
kPa

272
3350-3590
Calculate the vapor pressure, vapor density, and mole fraction of water in the air in thesubstomatat cavity of the Leaf. The vapor pressure is assumed to be the saturated vapor pressure at the
temperature of the Leaf and the water potentiaL of the Leaf for the eLevation of the Leaf (i.e. saturated
vapor pressure modified by water potential and station pressure). The vapor density and the mole fraction
are then caLcuLated using the same equations as were used above but with the Leaf temperature instead ofthe air temperature.
First the saturated vapor pressure at the temperature of the Leaf is caLcuLated using theequations of WexLer (1976,1977) in Buck (1981). This is at a station pressure of 101 .3kPa (i.e. sea levelor 1 atm), and with a Leaf water potentiaL (I)of 0 MPa.
SVPTL = .01 * e'
where
X = -2991.2729T' - 6017.0128*T + 18.87643854 - .028354721*T + .000017838301*T' - 8.4150417E10*T'+ 4.4412543E13*T' + 2.858487*IN(T)
If the leaf temperature is less than 0 c it is assumed to be frozen and the equation forsaturated vapor pressure over ice is used.
SVPTL = .01 *
where
X = -5865.3696'T + 22.241033 + .013749042*T - .000034031775*T' + .000000026967687*1' + .6918651*LN(T)
Saturation vapor pressure is then converted from mbar to kPa.
Saturation vapor pressure is reduced due to negative water potentials following Nobel (p4l2).The value for the partial inolal volume of water (V) is from Nobel (p537).
V(- I)/RTRhintcell = e
SVPTLeaf = Rhintcell * SVPTleaf
1
1.805E-05 (m3/mot] * (-I(IND,R,PBOMB)) (MPa] * 1000000 (Pa/MPa]I
I 8.3143 L(m3 Pa)/(moL K)] * I(IND,R,TLEAF) (K]SVPTLeaf=e1 * SVPTLeaf
Next the saturation vapor pressure is reduced due to the reduction of total atmosphericpressure with eLevation.
SVPTleaf = (STATPRESS/BARPRESS) * SVPTLeaf
The saturated vapor density is then calculated from the corrected saturated vapor pressure, as is themole fraction, using the same equations as above.
SVPT leaf * 1000
SVDTIeaf = 18.016 *
8.3143 * I(IND,R,TLEAF)
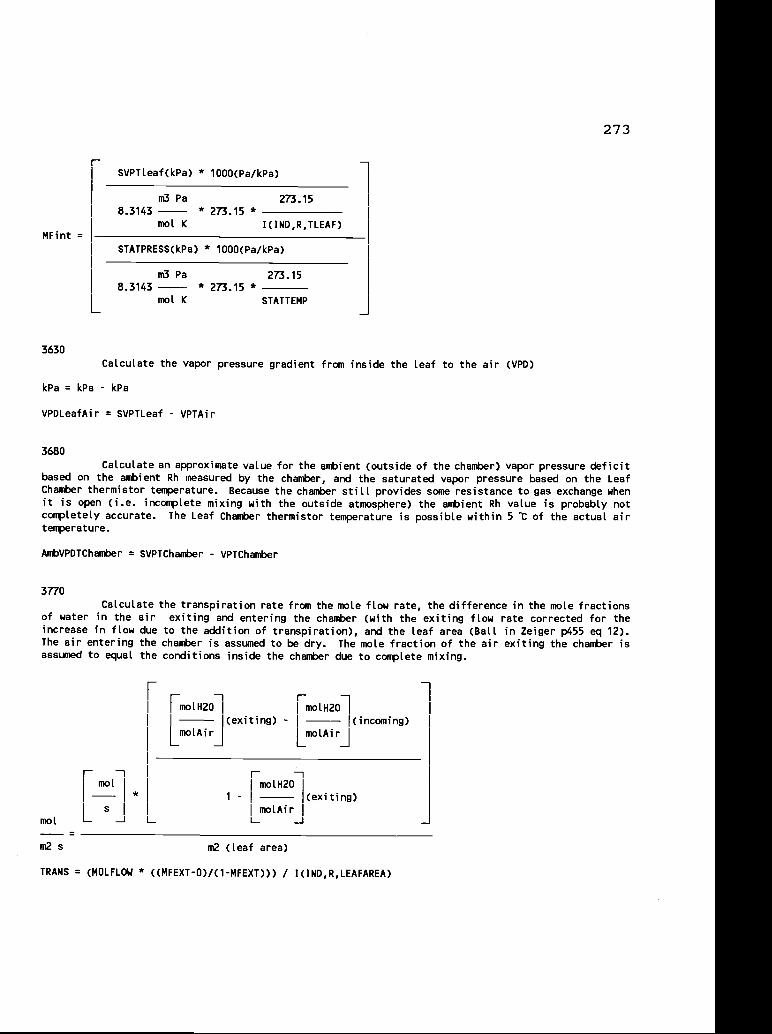
MFint -
3630
CaLcuLate the vapor pressure gradient from inside the leaf to the air (VPD)
kPa = kPa - kPa
VPDLeafAir = SVPTLeaf - VPTAir
3680
Calculate an approximate value for the ambient (outside of the chamber) vapor pressure deficit
based on the ambient Rh measured by the chamber, and the saturated vapor pressure based on the LeafChamber thermistor temperature. Because the chamber still provides some resistance to gas exchange when
it is open (i.e. incomplete mixing with the outside atmosphere) the ambient Rh value is probably notcompletely accurate. The Leaf Chamber thermistor temperature is possibLe within 5 C of the actual airtemperature.
AntVPDlChamber = SVPTChamber - VPTChamber
3770
Calculate the transpiration rate from the mole flow rate, the difference in the mole fractionsof water in the air exiting and entering the chamber (with the exiting flow rate corrected for theincrease in flow due to the addition of transpiration), and the leaf area (BalL in Zeiger p455 eq 12).The air entering the chamber is assumed to be dry. The mole fraction of the air exiting the chamber isassumed to equal the conditions inside the chamber due to compLete mixing.
m3 Pa 273.158.3143 * 273.15 *
Imel K STATTEMP
L _J
mel
m2s
E -I I- -1rnolH2O molH2O
(exiting) - (incoming)
Lmo.] Lmor]
I-molH2O
1 - (exiting)
moLAir-J
m2 (leaf area)
TRANS = (MOLFLOW * ((MFEXT-0)/(1-MFExT))) / I(IND,R,LEAFAREA)
1
-J
273
SVPTleaf(kPa) * 1000(Pa/kpa)
m3 Pa 273.158.3143 * 273.15 *
moL K I(IND,R,TLEAF)
STATPRESS(kPa) * 1000(Pa/kPa)
r
i--ilmel
L _J L

3830
Calculate the conductance in mot/m'/s from the transpiration, the Leaf to air water vaporgradient (expressed in mote fractions), and a mass balance correction (BaLL in Zeiger p462 eq 28b).
rrmotH2Ol
J
COND = TRANS * ((1 - ((MFINT + MFEXT) / 2)) / (MFINT - MFEXT))
3880
CaLcuLate the conductance in rn/s from the transpiration and the Leaf to air gradient expressedas mot/m3 (= vapor density in g/m divided by the molecular weight of water).
mol
m m2s
rim3 m3
g g
moL moLL _i L.. _i
TRANSCONDMS =
(SVDTL/18016) - (VD/18.016)
3920-3930
Infrared Gas analyzers measure CO, density, and then display them as VPM at a calibrationtemperature and pressure. At all other temperatures and pressures the display units of VPM are incorrect.
The IRGA carbon display units (which are moL/L * a constant) are corrected to VPM at NTP (293.15 1(,101.3kPa) with a correction term for both pressure and temperature.
NOTE : This does not give very good results. Better results are arrived at by Leaving out thetemperature correction term. Unfortunately this would be proper onLy if the machine had a spancompensation thermistor measuring the temperature of the gas in the sample cell, and then automaticaLLycorrected itself. The air temperature measured with the thermocouple is taken to be the most accurate,and closest approximation to the temperature inside the IRGA sample cell.
I(extracelLutar)
I
J
ext race I LuL ar)
-j
274
1
(intraceL LuLar)+ I
2L..mot
- TRANS *n2s F
moLH2OI-moLH2O
(intracellular) -molAir molAir
L LL
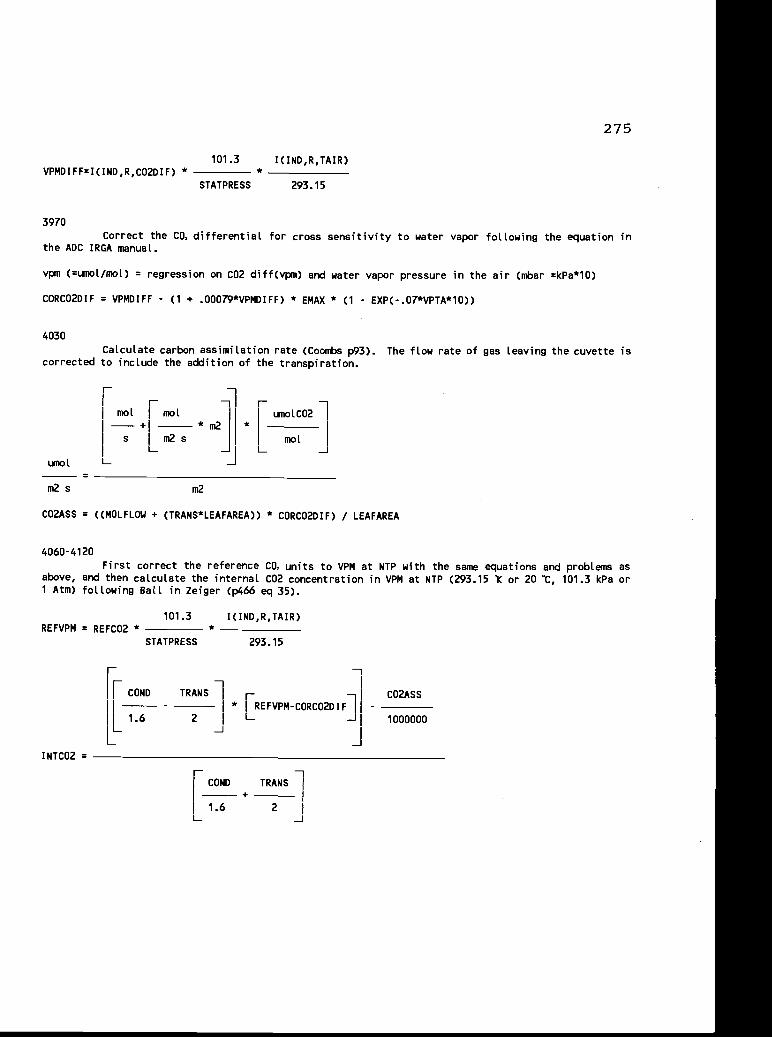
101.3 I(IND,R,IAIR)VPMDIFF=I(IND,R,co2DIF) * *
STATPRESS 293.15
3970
Correct the CO. differential for cross sensitivity to water vapor following the equation inthe ADC IRGA manual.
vpm (=umoL/mol) = regression on CO2 diff(vpm) and water vapor pressure in the air (mbar =kPa*10)
CORCO2DIF = VPMDIFF - (1 + .00079*VPMDIFF) * EMAX * (1 - EXP(- .07*VPTA*10))
4030
CaLculate carbon assimilation rate (Coombs p93). The flow rate of gas leaving the cuvette iscorrected to include the addition of the transpiration.
unol
rImol mel
*11.2 *
5 m2sL
_JL
m2s m2
CO2ASS = ((MOIFLOW + (TRANs*LEAFAREA)) * CORCO2DIF) / LEAFAREA
4060-4120
First correct the reference CO, units to VPM at NIP with the same equations and problems asabove, and then calculate the internal CO2 concentration in VPM at NIP (293.15 "K or 20 "C, 101.3 kPa or1 Atm) foE towing BaEL in Zeiger (p466 eq 35).
101.3 I(IND,R,TAIR)= REFCO2 * *
STAIPRESS 293.15
1
CO2ASSCOND TRANS I *rREFVPMCORCO2DIF1
10000002]LL
275
INICO2 -
COND+
1
TRANS
1.6L
2
rumolCO2
molL

4140-4180
Change the scale on the units to an appropriate value.
moL/m2/s = mol/m2/s * 1000
TRANS = TRANS * 1000COND = COND * 1000
ran/s = rn/s * 1000
CONDMS = CONDMS * 1000
276