Signature redacted
253
Reactions of S-nitrosothiols with biomimetic iron complexes and other transition metals by MASSACHUSES TT$ JTfE OF TECHNOLOGY Eric Victor SEP 1j 2014 B.Sc. Chemistry University of Wisconsin - Madison, 2009 LIBRARIES Submitted to the Department of Chemistry in Partial Fulfillment of the Requirement for the Degree of DOCTOR OF PHILOSOPHY IN INORGANIC CHEMISTRY at the Massachusetts Institute of Technology September 2014 C Massachusetts Institute of Technology, 2014 All Rights Reserved Signature redacted Signature of Author: Department of Chemistry June 4, 2013 Signature redacted Certified by:__________________ Stephen J. Lippard Arthur Amos Noyes Professor of Chemistry Thesis Supervisor Signature redacted Accepted by: Robert W. Field Chairman, Departmental Committee on Graduate Student
-
Upload
khangminh22 -
Category
Documents
-
view
2 -
download
0
Transcript of Signature redacted

Reactions of S-nitrosothiols with biomimetic iron complexes and othertransition metals
byMASSACHUSES TT$ JTfE
OF TECHNOLOGYEric Victor
SEP 1j 2014B.Sc. Chemistry
University of Wisconsin - Madison, 2009 LIBRARIES
Submitted to the Department of Chemistry in Partial Fulfillment of the Requirement for theDegree of
DOCTOR OF PHILOSOPHY IN INORGANIC CHEMISTRY
at theMassachusetts Institute of Technology
September 2014
C Massachusetts Institute of Technology, 2014All Rights Reserved
Signature redactedSignature of Author:
Department of ChemistryJune 4, 2013
Signature redactedCertified by:__________________
Stephen J. LippardArthur Amos Noyes Professor of Chemistry
Thesis Supervisor
Signature redactedAccepted by:
Robert W. FieldChairman, Departmental Committee on Graduate Student

This doctoral thesis has been examined by a committee of the Department of Chemistry asfollows:
Signature redacted
Christopher C. CumminsProfessor of Chemistry
Committee Chairperson
Signature redacted
i U SteAldft J. LippardArthur Amos Noyes Professor of Chemistry
Thesis Supervisor
Signature redactedMircea Dincd
tant Professor of Chemistry
2

Reactions of S-nitrosothiols with biomimetic iron complexes and other transition metals
by
Eric Victor
Submitted to the Department of Chemistry in Partial Fulfillment of theRequirements for the Degree of Doctor of Philosophy in Inorganic Chemistry
Abstract
Chapter 1. Bioinorganic Chemistry of Nitric Oxide and S-Nitrosothiols
The interplay of nitric oxide (NO), biological thiols, and metals has been a topic of intense study
since the discovery of NO as the endothelium-derived relaxation factor. NO is a redox-active
diatomic, radical gas that is generated biologically during the conversion of L-arginine to
L-citrulline by nitric oxide synthases (NOS), NADH, and 02. NOS enzymes have iron-
porphyrin and biopterin cofactors that catalyze this conversion. S-nitrosothiols form in biology as
NO-transport mechanisms, post-translational modifications, or as a cellular protectant against
overexposure to NO. Heme and non-heme iron cofactors serve as targets in biology to induce
degradation of active sites or to induce conformational changes to inhibit or promote cellular
pathways. The only structurally characterized metal complexes containing S-nitrosothiols have
either iridium or ruthenium centers.
Chapter 2. Rapid Nitric Oxide and Nitrogen Dioxide Detection and Quantification Assays
and Devices based on M(BIPhMe)X 2 Complexes
To explore the release of nitrogen oxide gases from reaction solutions, we developed a series of
colorimetric sensors based on the cis-nitrogen donating ligand BIPhMe,
bis-(1-methylimidazol-2-yl)phenylmethoxymethane. The complexes M(BIPhMe)X 2, where M
3

is Fe2+ or Co2+ and X is Cl~, Br, or I, were prepared, and structurally and spectroscopically
characterized. The reactivity of these complexes toward NO (g) and NO 2 (g) in solution was
explored and characterized. These complexes were then incorporated into test strips and syringes
to provide devices that can qualitatively, and in the case of the syringes quantitatively, detect
NO(g) and N0 2 (g) in a reaction headspace without additional equipment.
Chapter 3. Reactions of (PPN)(SNO) and (PPN)(SSNO) with HBF4 and Biomimetic Iron
Complexes.
The biological relevance of HSNO as a transnitrosating was recently reported. The gas H 2S can
perform an W-NO+ exchange with an S-nitrosated serum albumin to form HSNO, which can
cross the cellular membrane and transnitrosate an exposed cysteine on a hemoglobin protein.
With this discovery, we explored the reactivity of the anion SNO- and the related SSNO- toward
an acid and the biomimetic iron complexes [Fe,"(TPP)Cl], [Fe2 S2(SPh)4 ]2-,
[Fe2(Et-HPTB)(PhCO2)]2+, [Fe2(u-OH)(Ph 4DBA)(TMEDA) 2(OTf)], and [Fe(BIPhMe)C 2]. In
all cases HSNO was found to be unstable. The reaction of SNO with HBF4 led to NO (g)
release. The reaction of both S-nitrosothiols with [FeI"(TPP)Cl] resulted in reductive
nitrosylation of the iron center. The reaction of the [2Fe-2S] cluster with both S-nitrosothiols
led to the formation of reduced Roussin's black anion. The reaction of the mononuclear complex
[Fe(BLPhMe)C1 2] with both S-nitrosothiols led to formation of the dinitrosyl iron complex
[FeS5(NO) 2]f. Only with the two diiron complexes was a difference in reactivity between SNO-
and SSNO~ observed, leading to formation of Roussin's black anion or [FeS5(NO)2]~,
respectively.
Chapter 4. Reactions of Nitrogen Oxide Species with a Monofunctional Platinum Complex
4

The structural isomers SNO- and NSO- have both been synthetically prepared, but only the
metal-binding reactivity of NSO has been previously explored. Structural characterization of
early first-row, and second and third row transition metals are reported with NSO-, where
metal-binding occurs via the terminal nitrogen atom. We attempted to form structurally
characterizable Pt-SNO and Pt-SSNO complexes using the "monofunctional" complex
cis-[Pt(NH3)2(py)Cl](OTf), but were not successful. Instead, a new complex formed that we
propose to be a polysulfide-bridged diplatinum complex with intact nitrogen-binding of the
starting complex and release of NO (g). The vibrational spectra of the proposed complexes were
calculated using DFT methods to compare with the experimental data and provides further
evidence for the formation of a polysulfide-bridged diplatinum complex. DFT calculations were
also performed on possible structural isomers of Pt-SNO and Pt-SSNO complexes. To test
whether that the reactivity may not occur by release of NO+ from the S-nitrosothiols,
cis-[Pt(NH3)2(py)Cl](OTf) was found to react with NOBF4 to form
cis-[Pt(NH3)2(py)(CH3CN)]2+ and cis-mer-[Pt(NH3)2(py)Cl3].
Chapter 5. Synthesis of [3:1] Site-Differentiated [4Fe-4S] Clusters and their Reactivity
towards NO (g) and Ph3CSNO
Previous studies provide evidence that [4Fe-4S] clusters serve as targets of reactive nitrogen
oxide species in biology. The products of this reaction range from dinitrosyl iron complexes,
[Fe(NO) 2L2]f, to Roussin's Black Anion, [Fe4S3(NO)7] . To date, the pathways by which these
reactions occur have not been fully elucidated. In this study we prepared the site-differentiated
complexes [Fe4 S4 (LS3)L'] 2- (LS3 = 1,3,5-tris(4,6-dimethyl-3-mercaptophenylthio)-2,4,6-
tris(p-tolylthio)benzene; L' = Cl, SEt, SPh, N3, 2-SPyr, Tp, S2CNEt2) to serve as synthetic
models for biological [4Fe-4S] clusters and studied their reactivity toward NO (g) and Ph3CSNO.
5

The products were characterized by X-ray crystallography, mass spectrometry, and IR, EPR, and
H NMR spectroscopy. In all cases reported here, the reactions proceed via formation of the S =
V2 species [Fe4S4(NO)4 ] , which ultimately converts to EPR-silent [Fe4 S3(NO)7].
Appendix A. M(BIPhMe) Complexes and Reactions with RNOS
The synthesis and characterization of the metal-BIPhMe complexes [Fe(BIPhMe)1 2],
[Fe(BIPhMe)(MeCN)2(OTf) 2], [Fe2(U-O)(BIPhMe) 2(NO3 )4], [Cu(BIPhMe)2](OTf)2,
[Cu(BIPhMe) 2][CuCl 2J, and [Zn2(u-OTf)2(BIPhMe)2(OTf)2] was reported. These complexes
were characterized by X-ray diffraction, FTIR, 'H NMR, and ESI-MS. The reaction of
[Zn2(u-OTf) 2(BIPhMe)2(OTf) 2] with (PPN)(SNO) results in the release of NO (g) and formation
of (PPN)(SSNO) and a zinc-sulfide species. The reaction of (PPN)(SSNO) results in the release
of NO (g) and a zinc-sulfide species.
Appendix B. Mass-Spec and FTIR figures of the Reactions of NO (g) and Ph3CSNO with
[Fe4S4 (LS3)L'12-
Thesis Supervisor: Stephen J. Lippard
Title: Arthur Amos Noyes Professor of Chemistry
6

To Maggie for all the love and support
To my parents for letting me know that it is not the end of the world to fail
"If someone else has done it before, than you can do it too." - William C. Victor
"Thankfully, dreams can change. Ifwe'd all stuck with our first dream, the world would be
overrun with cowboys and princesses." - Stephen Colbert
7

Ackniowledgements
I would like to first and foremost thank my advisor Professor Stephen J. Lippard for
taking me into his lab and providing me with the resources, support, and guidance to complete
my thesis. His persistence to correct my language and force me to provide more clear and
concise descriptions of my research will provide the most lasting impact, as well as forcing me to
pronounce acetonitrile properly, rather than the germanic way. Being in the lippard lab, I have
been exposed to more areas of scientific research, even beyond chemistry, than I think I
would've experienced in any other lab. I have also been given access to more instrumentation
than I think some entire chemistry departments have. The opportunity to characterize my
compounds by mass spectrometry, by ReactIR and M6ssbauer spectroscopy, and by X-ray
crystallography without having to leave the confines of the lab proved invaluable in my research
progress. I would also like to thank the inorganic faculty at MIT, especially my thesis committee
chair Professor Kit Cummins who provided me with valuable and encouraging words during our
annual meetings. Kit's interest in all things chemistry is inspiring and was always fascinating to
observe being manifested in his questions during the inorganic seminars. Rich Girardi deserves
thanks for his endless help regarding all things administrative and for his jokes.
I must also thank my undergraduate research advisors Professors John F. Berry, Bassam
Shakhashiri, and Philipp Simon. Working in John's lab was a wonderful experience that pushed
me towards pursuing graduate school. Learning how to communicate science to the general
public from Bassam was amazing. Performing genetic research on carrots for Philipp and the
USDA gave me a great wealth of knowledge to share anytime I see people eating carrots. I
would also like to give my gratitude to my Berry lab mentor Michael Nippe. I know that he will
continue to guide and work with wonderful students as a professor at Texas A&M.
My time in the lippard lab has given me the privilege to work with many great people
over the past few years. Ali Liang, aka the Queen of the Stopped Flow, has been a wonderful
friend and without whom I would have never had an OKcupid profile worthy of meeting my
fiancd. She always served as an outlet for personal discussions and a balance to some of the
crazier experiences of graduate school. Tim Johnstone is a great friend and compatriot, and I
couldn't choose a better yearmate, if that is a thing - well, it is now. Mik Minier has been an
excellent safety officer with a great eye for graphic design. Former lab members Julia Kozhukh
and Justin Wilson were both great people to bounce experimental ideas of off, or even to discuss
crystallography. It was just a joy to hear Semi speak and be very self-conscious of what she
would say.Now for the post-docs as there are many that have come through the lab. I want to thank
Zach Tonzetich for pitching the NO project to me during my first year. He was a pleasure to
8

overlap with and I kind of wish we would've had more time to work together, so that I could
pick his brain more. Shanta Dhar taught me the ropes of the lab and I am happy that she is doing
great work in Georgia. Daniella Buccella is a wonderful person and I can never forget the long
laughs we had about a Sara Lee's croissan'wich. Nakedia Carvalho was a "cool dude" and I am
looking forward to meeting her again this summer in Brazil. I want to thank Yang Li for showing
me amazing figures of his crystal structures displaying his basic iron (III) acetates. Rui Cao was
a great guide in how to not present properly to Steve. Shoutout to Ulf Peter Apfel for being one
of the most intense chemists I have ever met, but still having the patience and humor to deal with
me, and also for giving me that sweet singing teddy bear in lederhosen. I want to thank Shawn
Tsai-Te Lu for being a great lab member with whom I could talk NO chemistry, but mainly for
his skills at hitting the Volleyball into the sun so that the other team couldn't hit it. On the topic
of volleyball, one of the most fun experiences of graduate school was beating the Nocera lab
team with only 4 players (myself, Shawn, Justin, and Tuang). I want to thank Patricia for the
beautiful picture of my dog that she took and developed, and also for being a great friend. Amit
Majumdar was a great chemist to work with and I am happy for him that he took my advice to
further pursue the diiron NO+ chemistry, instead of passing on it.
I would like to thank my old roommates, Chris Lemon, Ben Ofori-Okai, and Michael
Funk for the great times in the "dudes in chemistry" house. You all made me feel better for
coming home much later than me, but also terrible because I would usually try to sleep while you
guys would have late-night Smash Bros sessions, especially the night before my oral exams. My
best friend and soon-to-be best man Russ Jensen for being an awesome person to hang out with.
The 2011-2012 Chemistry Flag Football team for bringing home the intramural championship.
My fellow GSC officers Brian Spatocco, Aalap Dighe, and Bomy Lee Chung for a great
experience advocating for students, never has there been a better team. I would like to thank the
ImprovBoston community for providing me a regular outlet to express my creativity and think
about other things than MIT and chemistry. My improv mentors Lori Strauss, Rachel Klein, and
Jeff Perry showed me how to roll with the punches and accept whatever comes at me, no matter
what. To my cast mates on Intervention! and Abra Cadaver; you all great people to work with
even if you try to force science scenes onto me.
I want to give many thanks to my fiance Maggie Brown. Patience isn't her strongest suit
and I know these last two years have really tested it, so thank you for dealing with me. I want to
thank my mom for letting me know that it is ok to follow my passions. Last but not least, I need
to thank my dad for his wise words that he imparted on me during my time in the Army that I
have carried with me since.
9

Preface
The field of biological nitric oxide research has matured greatly over the past thirty years.
This first chapter serves as a brief introduction into the biological chemistry of nitric oxide and
S-nitrosothiols. This introductory chapter introduces the reader to the catalytic conversion of L-
arginine to NO by the heme cofactor of nitric oxide synthase enzymes. The interactions that
biological NO has with different iron active sites, including iron-sulfur clusters and diiron
reductases, is presented. The introductory chapter closes with structurally characterized S-
nitrosothiol ligated metal complexes and a brief discussion of cisplatin resistance that is imparted
by S-nitrosation in cancer cells.
The second chapter of this thesis presents original research in developing a colorimetric
sensor based on the first row transition metals and the BIPhMe ligand. These sensors allow for
rapid, "naked eye" detection of NO (g) and NO 2 (g) release into a reaction headspace. The
sensors were further developed into test strips capable of providing qualitative detection of these
gases, and test syringes that can provide a quantitative assessment of gas release.
The third chapter explores the reactivity of the two S-nitrosothiol anions, SNO and
SSNO~, with an acid and bioinspired iron complexes, ranging from simple mononuclear
coordination and iron-heme complexes to carboxylate-bridged diiron and [2Fe-2S] clusters. No
new species were prepared from these anionic S-nitrosothiols, but they did show rapid NO and
electron transfer reactivity. The fourth chapter describes the attempt to form a platinum complex
with these two anionic S-nitrosothiols, as well as theoretical calculations performed to interogate
the structure of the formed species.
The final chapter describes the nitric oxide chemistry explored using nine [3:1] site-
differentiated [4Fe-4S] clusters that are coordinated by the LS 33 - ligand. Upon reaction with NO
(g), these clusters decompose to form [Fe4S4] and Roussin's black anion, [Fe4S3(NO)7]f. The
10

reaction can be performed in a more controlled fashion by using the S-nitrosothiol Ph3CSNO,
resulting in initial formation of [Fe4S4]~ en route to [Fe4 S3(NO)7]~.
11

Table of Contents
Abstract 3
Dedication 7
Acknowledgements 8
Preface 10
Table of Contents 12
List of Figures 16
List of Charts 23
List of Schemes 23
List of Tables 24
List of Equations 25
Chapter 1. Bioinorganic Chemistry of Nitric Oxide and S-Nitrosothiols 26
1.1 Introduction 27
1.2 S-nitrosothiols in biology 31
1.3 Iron-sulfur clusters and dinitrosyl iron complexes in biology 33
1.4 Diiron nitric oxide reductases 36
1.5 Precious metals and nitric oxide 39
1.6 Conclusion 42
1.7 References 43
Chapter 2. Rapid Nitric Oxide and Nitrogen Dioxide Detection and Quantification
Assays and Devices based on M(BIIPhMe)X 2 Complexes 47
2.1 Introduction 48
2.2 Experimental Methods 50
Materials 50
Characterization Methods 50
Synthetic Procedures 51
NO(g)/NO 2(g) Reaction Procedures 60
NO(g)/NO 2(g) Test Strip Preparation and Application 60
12

NO(g)/NO 2(g) Test Syringe Preparation and Application 61
2.3 Results and Discussion 61
Synthesis and Spectroscopic Characterization of BIPhMe Starting Complexes 61
X-ray Crystallographic Characterization of BIPhMe Starting Complexes 64
Reactions of Fe(BIPhMe)Cl 2 and Fe(BIPhMe)Br2 with NO(g) and N0 2(g) 69
Reactions of Co(BIPhMe)Cl 2 and Co(BIPhMe)I 2 with NO(g) and N0 2(g) 79
Prepartion and Utilization of NO(g)/NO 2(g) Test Strips and Syringes 85
2.4 Summary and Conclusions 88
2.5 References 89
Chapter 3. Reactions of (PPN)(SNO) and (PPN)(SSNO) with HBF4 and
Biomimetic Iron Complexes. 91
3.1 Introduction 92
3.2 Experimental Methods 93
Materials 93
Characterization Methods 93
DFT Calculation Procedure 96
Synthetic Procedures 96
SNO~/SSNO Reaction Procedures 97
3.3 Results and Discussion 103
Preparation and characterization of SSNO~ and SNO~ 103
HBF4-Et2O Reactivity 109
Iron-Porphyrin Reactivity 112
[Fe2S2] Reactivity 118
Nitrogen-Rich Carboxylate-Bridged Diiron Reactivity 120
Oxygen-Rich Carboxylate-Bridged Diiron Reactivity 122
Mononuclear Iron Complex Reactivity 130
3.4 Summary and Conclusions 131
3.5 References 133
13

Chapter 4. Reactions of Nitrogen Oxide Species with a Monofunctional
Platinum Complex 136
4.1 Introduction 137
4.2 Experimental Methods 139
Materials 139
Characterization Methods 139
DFT Calculation Procedure 140
SNO~/SSNO- Reaction Procedures 140
Reaction of cis-[Pt(NH 3)2(py)Cl](OTf) with NOBF4 142
4.3 Results and Discussion 143
Reaction of cis-[Pt(NH 3)2(py)Cl](OTf) with (PPN)(SSNO) and (PPN)(SNO) 143
DFT Calculations of Polysulfide-Bridged Pt-Species 146
DFT Calculations of cis-[Pt(NH 3)2(py)(SNO)]+ and cis- [Pt(NH3) 2(py)(SSNO)]+ 149
Reactions of cis-[Pt(NH 3)2(py)Cl](OTf) with NOBF4 152
4.4 Summary and Conclusions 158
4.5 References 159
Chapter 5. Synthesis of [3:1] Site-Differentiated [4Fe-4S] Clusters and their
Reactivity towards NO(g) and Ph3CSNO 161
5.1 Introduction 162
5.2 Experimental Methods 164
Materials 164
Characterization Methods 164
Synthetic Procedures 166
NO(g)/Ph 3CSNO Reaction Procedures 181
5.3 Results and Discussion 183
Synthesis of the [3:1] Site-Differentatied Cluster 183
Synthesis and Characterization of Clusters 191
Reactions with NO(g) 199
Reactions with Ph3CSNO 200
Reactions with NO(g)/Ph 3CSNO in the presence of TIPF6 206
14

5.4 Summary and Conclusions 210
5.5 References 211
Appendix A. M(BIPhMe) Complexes and Reactions with RNOS 213
A. 1 Introduction 214
A.2 Experimental Methods 214
Materials 214
Characterization Methods 214
Synthetic Procedures 216
SNO~/SSNO Reaction Procedures 221
A.3 Results and Discussion 222
Synthesis and Spectroscopic Characterization of M(BIPhMe) Complexes 222
Crystallographic Characterization of M(BIPhMe) Complexes 226
Reactions of M(BIPhMe) Complexes with RNOS 235
A.4 Summary and Conclusions 237
A.5 References 238
Appendix B. Mass-Spec and FTIR figures of the Reactions of NO(g)
and Ph3 CSNO with [Fe4S4(LS3)L']2- 239
Biographical Note 251
Curriculum vitae 252
15

List of Figures
Chapter 1
Figure 1.1.
Figure 1.2.
Figure 1.3.
Figure 1.4.
Figure 1.5.
Figure 1.6
Figure 1.7.
Figure 1.8.
Chapter 2
Cartoon depictions of the crystal structures of active and NO-inhibited
inducible nitric oxide synthase
Cartoon depiction of the crystal structure of S-nitrosated HbA
Cartoon depiction of the crystal structure of S-nitrosated cNP
Cartoon depiction of the crystal structure
of protein-bound DNIC to hGST
Cartoon depiction of the crystal structure of ACO2
Diiron active sites of nitric oxide reductases
Ball-and-stick representation of the crystals structures of diiron-nitrosyl
complexes
Ball-and-stick representation of the crystal structures of iridium and
ruthenium S-nitrosothiol complexes
Figure 2.1. Metal-halide complexes of the bis-N donor BIPhMe
Figure 2.2. 'H NMR spectra of [Fe(BIPhMe)C 2], [Fe(BIPhMe)Br2], and BIPhMe
Figure 2.3. MS Characterization of [Fe(BIPhMe)C 2] and [Fe(BIPhMe)Br2]
Figure 2.4. 'H NMR spectra of [Co(BIPhMe)C 2] and [Co(BIPhMe)1 2]
Figure 2.5. MS Characterization of [Co(BIPhMe)C 2] and [Co(BIPhMe)1 2]
Figure 2.6. Drawings of the X-ray crystal structures of mononuclear and dimeric
[Fe(BIPhMe)CI 2]
Figure 2.7. Drawing of the X-ray crystal structure of [Fe(BIPhMe)Br2]
Figure 2.8. Drawings of the X-ray crystal structures of [Co(BIPhMe)C 2] and
[Co(BIPhMe)I 2]
Figure 2.9. UV-Vis spectra of [Fe(BIPhMe)C 2] and [Fe(BIPhMe)Br2] and their
NO(g) reaction products
Figure 2.10. Solutions of [Fe(BIPhMe)C 2], [Fe(BIPhMe)Br 2], and [Co(BIPhMe)I 2]
in methylene chloride that were exposed to varying amounts of NO(g)
16

Figure 2.11.
Figure 2.12.
Figure 2.13.
Figure 2.14.
Figure 2.15.
Figure 2.16.
Figure 2.17.
Figure 2.18.
Figure 2.19.
Figure 2.20.
Figure 2.21.
Figure 2.22.
Figure 2.23.
Figure 2.24.
Figure 2.25.
Figure 2.26.
FTIR spectra of [Fe(BIPhMe) 2(NO)Cl][Fe(NO)C 3] and
[Fe(BIPhMe) 2(NO)Br][Fe(NO)Br 3]
Positive- and negative-mode ESI-MS spectra of
[Fe(BLPhMe) 2(NO)Cl][Fe(NO)Cl 3]
Positive- and negative-mode ESI-MS spectra of
[Fe(BIPhMe) 2(NO)Br][Fe(NO)Br3]
Drawing of the X-ray crystal structure
of (BIPhMe)2(NO)Cl][Fe(NO)C 3]
UV-Vis spectra of [Fe(BIPhMe)C 2] and [Fe(BIPhMe)Br2] and
their N0 2(g) reaction products
FTIR spectra of [Fe(BIPhMe)(NO 3)2C] and [Fe(BIPhMe)(NO 3)2Br]
Positive-mode ESI-MS spectra of [Fe(BIPhMe)(NO 3)2C] and
[Fe(BIPhMe)(NO 3)2Br]
Solutions of [Fe(BIPhMe)C 2], [Fe(BIPhMe)Br2], [Co(BIPhMe)Cl2], and
[Co(BIPhMe)1 2] in methylene chloride that were exposed to varying
amounts of N0 2(g)
Drawing of the X-ray crystal structure of [Fe(BIPhMe)(N0 3)2CI]
Spectroscopic characterization of the product generated by the reaction
of [Co(BIPhMe)C 2] and N0 2(g)
Spectroscopic characterization of the product generated by the reaction
of [Co(BIPhMe) 2] and NO(g)
Positive- and negative-mode ESI-MS spectra of the product generated by
the reaction of [Co(BIPhMe)2] and NO(g)
Spectroscopic characterization of the product generated by the reaction of
[Co(BIPhMe) 2] and N0 2(g)
Drawings of the X-ray crystal structure of [Co(BIPhMe)(NO 3)21
Filter paper loaded with [Fe(BIPhMe)C 2], [Fe(BLPhMe)Br2],
[Co(BIPhMe)C 2], and [Co(BIPhMe)1 2]
and exposed to NO(g) and N0 2(g)
Silica TLC plates loaded with [Fe(BIPhMe)C 2], [Fe(BIPhMe)Br 2],
[Co(BIPhMe)C1 2], and [Co(BIPhMe) 2] complexes and exposed to NO(g)
17

Figure 2.27.
Figure 2.28.
Chapter 3
Figure 3.1.
Figure 3.2.
Figure 3.3.
Figure 3.4.
Figure 3.5.
Figure 3.6.
Figure 3.7.
Figure 3.8.
Figure 3.9.
Figure 3.10.
Figure 3.11.
Figure 3.12.
Figure 3.13.
Figure 3.14.
Figure 3.15.
Figure 3.16.
and N0 2(g) 86
Syringes filled with [Fe(BIPhMe)C 2], [Fe(BIPhMe)Br 2], and
[Co(BIPhMe)1 2] loaded onto silica gel and exposed to varying amounts
of NO(g) 87
Syringes filled with [Fe(BIPhMe)C 2], [Fe(BIPhMe)Br 2], [Co(BIPhMe)C 2],
and [Co(BIPhMe)1 2] loaded onto silica gel and exposed to N0 2(g) 87
Diagram of H 2S-facilitated cross-membrane transnitrosation
Spectroscopic characterization of (PPN)(SSNO)
Spectroscopic characterization of (PPN)(SNO)
Cyclic voltammogram of (PPN)(SNO)
Drawings of the X-ray crystal structures of (PPN)(SSNO)
and (PPN)(SNO)
Crystallographically characterized small molecule organo-S-nitrosothiols
UV-Vis spectrum of (PPN)(SNO) + HBF4-Et2O
Solutions of (PPN)(SNO) and [Fe(BIPhMe)C 2] before and after addition
of HBF4-Et2O
Calculated energies and structures of the protonated forms of SNO~
Spectroscopic characterization of [Fe"(TPP)C] + (PPN)(SNO)31P NMR spectrum of the pentane extract of the reaction of
[Fe"'(TPP)Cl] + (PPN)(SSNO)
UV-Vis spectrum of the reaction of [Feln(TPP)Cl] with (PPN)(SSNO)
and (PPN)(SNO)
Stopped-flow kinetic traces and fits of the reaction of [FeR(TPP)Cl]
with (PPN)(SSNO)
ReactIR spectra of the reaction of [FeH"(TPP)Cl] with NO(g)
and Ph3CSNO
FTIR spectra of [Fe4S3(NO)7] 2 formed in the reaction of
[Fe2 S2(SPh) 4]2- and (PPN)(SSNO)/(PPN)(SNO)
EPR and ESI-MS characterization of [Fe4 S3(NO) 7]2 -
92
105
106
107
108
109
110
111
112
113
113
115
116
118
119
119
18

Figure 3.17.
Figure 3.18.
Figure 3.19.
Figure 3.20.
Figure 3.21.
Figure 3.22.
Figure 3.23.
Figure 3.24
Figure 3.25.
FTIR and ESI-MS characterization of [Fe4S3(NO) 7] formed in the reaction
of [Fe2(Et-HPTB)(PhCO 2)](BF4)2 and (PPN)(SNO) 121
FTIR and ESI-MS characterization of [FeS5(NO)2] formed in the reaction
of [Fe2(Et-HPTB)(PhCO2)](BF4)2 and (PPN)(SSNO) 121
EPR spectra of [FeS5(NO)2] at RT and 77 K 122
Drawings of the crystal structure of
[Fe3(p-0)(Ph4DBA)2(TMEDA)2(NO)2](OTf) 124
UV-Vis of the reaction of [Fe2(u-OH)(Ph 4DBA)(TMEDA) 2(OTf)]
with NO(g) 126
ReactIR of the reaction of [Fe2(u-OH)(Ph 4DBA)(TMEDA) 2(OTf)]
with NO(g) 127
57M6ssbauer spectrum of
[Fe3(O-)2(Ph4DBA)2(TMEDA)2(NO)2](OTf) 128
Drawings of the X-ray crystal structure of (PPN)2[FeS5 (NO)2](OTf) 129
Spectroscopic characterization of [FeS5(NO)2]~ formed in the reaction
of [Fe(BIPhMe)C 2] and (PPN)(SNO) 131
Chapter 4
Figure 4.1. Known metal complexes containing the NSO~ ligand
Figure 4.2. 'H NMR spectra of cis-[Pt(NH 3)2(py)Cl](OTf) and the reaction products
with (PPN)(SSNO) and (PPN)(SNO)
Figure 4.3. FTIR spectra of the reaction of natural abundance and '5N-labeled
(PPN)(SSNO) and (PPN)(SNO) with cis-[Pt(NH3)2(py)Cl](OTf)
Figure 4.4. Solutions of cis-[Pt(NH 3)2(py)Cl](OTf) and [Fe(BIPhMe)C 2] before
and after addition of (PPN)(SNO)
Figure 4.5. Calculated structures of cis-[Pt2(NH3)4(py)2(-S 2)]2+ and
cis-[Pt2(NH3)4(py)2(p-S4)]2+
Figure 4.6. Calculated spectra of cis-[Pt2 (NH 3)4(py) 2 (U-S2 )]2+ and
cis-[Pt2(NH3) 4(py) 2(u-S4 )] 2 +, and the experimental spectra of the product
formed in the reaction of cis-[Pt(NH3)2(py)Cl](OTf) with (PPN)(SSNO)
and (PPN)(SNO)
19
137
144
145
145
147
148

Figure 4.7.
Figure 4.8.
Figure 4.9.
Figure 4.10.
Figure 4.11.
Figure 4.12.
Figure 4.13.
Chapter 5
Figure 5.1.
Figure 5.2.
Figure 5.3.
Figure 5.4.
Figure 5.5.
Figure 5.6.
Figure 5.7.
Figure 5.8.
Figure 5.9.
Figure 5.10.
Figure 5.11.
Figure 5.12.
Figure 5.13.
Calculated energies and structures of cis-[Pt(NH 3)2(py){SNO}]
Calculated vibrational spectra of cis-[Pt(NH3)2(py) {SNO}]+
Calculated energies and structures of cis-[Pt(NH3)2(py){SSNO}]
Calculated vibrational spectra of cis-[Pt(NH3)2(py) {SSNO}]+
Drawing of the X-ray crystal structure of
cis-[Pt(NH 3)2(py)(CH3CN)](BF 4)2Drawing of the X-ray crystal structure of cis-mer-[Pt(NH3)2(py)C3]C1
'H NMR spectrum of a mixture of crystalline
cis-[Pt(NH 3)2(py)(CH3CN)](BF 4)2 and cis-mer-[Pt(NH3)2(py)C 3]Cl
Iron-sulfur nitrosyl compounds
19F NMR spectra of C6Br3F3, CF3(SC6 H4CH3)3,
and LF(SCH 2OCH2CH3)2
Gas Chromatogram of crude product when attempting to protect
C6H2(CH3)2(SH)2
Drawings of the X-ray crystal structures of LS2(SCH2OCH3)2 and
L(SCH20CH3)3-(CH3)2CO
'H NMR spectra of LS3 and intermediates57Fe M6ssbauer spectra of [Fe4 S4(LS3)L']2- complexes
'H NMR spectra of [Fe4 S4(LS3)L']2- complexes
ESI-MS of [Fe4S4(LS3)CI] 2- and [Fe4S4(LS3)N3]2~
Drawings of the X-ray crystal structures of [Fe4 S4(LS3)N3 ]2- and
[Fe4S4 (LS3)(S 2CNEt2)]2-
Characterization of the products formed between clusters and NO(g)
ReactIR spectra of (Et4N)[Fe4S4(SPh)4] and (Ph4P)2[Fe4S4(LS3)(SPh)]
with Ph3CSNO
80 K 57Fe M6ssbauer spectra of [Fe4 S4(LS3)C]2 -, [Fe4S4(NO)4]f, and
in a 1:1 ratio
Gas chromatogram and EI-MS spectrum of the pentane extract of
the reaction of [Fe4 S4(LS3)Cl] 2- and Ph3CSNO
20
150
150
151
152
153
154
157
162
186
187
188
190
192
195
196
197
200
201
202
203

Figure 5.14.
Figure 5.15.
Figure 5.16.
Figure 5.17.
Figure 5.18.
Figure 5.19.
Appendix A
Figure A. 1.
Figure A.2.
Figure A.3.
Figure A.4.
Figure A.5.
Figure A.6.
Figure A.7.
Figure A.8.
Figure A.9.
Figure A.10.
Figure A.11.
Figure A.12.
Figure A.13.
Figure A.14.
Figure A.15.
Drawing of the crystal structure of (Ph3CS) 2
X-band EPR spectra of [Fe4S4(NO)4 ~ at RT and 77 K
CH2C12 solution FTIR of the reaction of [Fe4 S4 (LS3)Cl]2- with NO(g)
and Ph3CSNO in the presence of TIPF6
Cyclic voltammogram of [Fe4S4(NO)4] at ambient temperature at scan
speeds from 50 - 1000 mV/s
Negative-mode ESI-MS spectrum of [Fe4S4(NO)4]
Drawing of the crystal structure of [Cp' 2Fe][Fe4S4(NO)4]
'H NMR spectrum of [Fe(BIPhMe)1 2]
FTIR spectrum of [Fe(BIPhMe)(MeCN) 2(OTf)2]
'H NMR spectrum of [Fe(BIPhMe)(MeCN) 2(OTf)2]
'9F{'H} NMR spectrum of [Fe(BIPhMe)(MeCN) 2(OTf)2]
'H NMR spectrum of [Zn2(p-OTf)2(OTf)2(BIPhMe)2]
Diffraction spot intensities of a single crystal of [Fe(BIPhMe)1 2] at
varying temperatures
Drawing of the X-ray crystal structures of [Fe(BIPhMe) 2] at 298 K
and 140 K
Drawing of the X-ray crystal structure of [Fe(BIPhMe)(MeCN) 2(OTf) 2]
Drawing of the X-ray crystal structure of [Fe(BIPhMe)(NO 3)2]20
Drawing of the X-ray crystal structure of [Cu(BIPhMe)2](OTf)2
Drawing of the X-ray crystal structure of [Cu(BIPhMe)2][CuC 2]
UV-Vis spectra of the reaction of [Cu(BIPhMe) 2](OTf)2 with NO(g)
and N0 2(g)
UV-Vis spectra of the reaction of [Zn 2(u-OTf)2(OTf)2(BIPhMe)2]
and (PPN)(SNO)
UV-Vis spectra of the reaction of [Zn2(u-OTf)2(OTf)2(BIPhMe)2]
and (PPN)(SSNO)
Solutions of [Zn2(u-OTf)2(OTf)2(BIPhMe)2] and [Fe(BIPhMe)C 2] before
and after the addition of(PPN)(SSNO)
21
203
206
207
207
208
209
222
223
224
224
226
227
228
230
231
233
234
235
236
236
237

Appendix B
Figure B.1.
Figure B.2.
Figure B.3.
Figure B.4.
Figure B.5.
Figure B.6.
Figure B.7.
Figure B.8.
Figure B.9.
Figure B.10.
Figure B.11.
Figure B.12.
Figure B.13.
Figure B.14.
Figure B.15.
Figure B.16.
Figure B.17.
Figure B.18.
Figure B.19.
Figure B.20.
Figure B.21.
Figure B.22.
ReactIR of(Ph4P)2[Fe4S4(LS3)(SPh)] with NO(g)
Negative-mode ESI-MS spectrum of(Ph4P)2 [Fe4 S4(LS3)Cl]+ NO(g)
Negative-mode ESI-MS spectrum of(Ph4P)2[Fe4S4(LS3)(SEt)] + NO(g)
Negative-mode ESI-MS spectrum of (Ph4P)2[Fe4S4(LS3)(SPh)] + NO(g)
Negative-mode ESI-MS spectrum of (Ph4P)2[Fe4S4(LS3)(N3)]+ NO(g)
Negative-mode ESI-MS spectrum of (Ph4P)2 [Fe4S4(LS3)(SPyr)] + NO(g)
Negative-mode ESI-MS spectrum of (Ph4P)2[Fe4S4(LS3)(Tp)] + NO(g)
Negative-mode ESI-MS spectrum of
(Ph4P)2 [Fe4 S4 (LS3)(S2CNEt2)]+ NO(g)
Negative-mode ESI-MS spectrum of (Ph4P)2[Fe4S4(LS3)Cl]+ Ph3CSNO
Negative-mode ESI-MS spectrum of
(Ph4P)2[Fe4S4(LS3)Cl]+4 Ph3CSNO
Negative-mode ESI-MS spectrum of
(Ph4P)2[Fe4S4(LS3)(SPh)] + Ph3CSNO
Negative-mode ESI-MS spectrum of
(Ph4P)2[Fe4S4(LS3)(SPyr)] + Ph3CSNO
Negative-mode ESI-MS spectrum of
(Ph4P)2 [Fe4S4(LS3)(Tp)] + Ph3CSNO
'H NMR spectrum of pentane extract of
(Ph4P)2[Fe4S4(LS3)C] + Ph3CSNO
FTIR spectroscopy of(Ph4P)2 [Fe4S4(LS3)C]+ 1-4 Ph3CSNO
FTIR spectroscopy of(Ph4P)2[Fe4S4(LS3)(SEt)] + Ph3CSNO
FTIR spectroscopy of(Ph4P)2[Fe4S4(LS3)(SPh)] + Ph3CSNO
FTIR spectroscopy of(Ph4P)2[Fe4S4(LS3)(N3)] + Ph3CSNO
FTIR spectroscopy of(Ph4P)2[Fe4S4(LS3)(SPyr)] + Ph3CSNO
FTIR spectroscopy of(Ph4P)2[Fe4S4(LS3)(Tp)] + Ph3CSNO
FTIR spectroscopy of(Ph4P)2[Fe4 S4(LS3)(S 2CNEt2 )] + Ph3CSNO
Negative-mode ESI-MS spectrum of [Cp*2Fe][Fe4S4(NO)4]
22
240
240
241
241
242
242
243
243
244
244
245
245
246
246
247
247
248
248
249
249
250
250

List of Charts
Reactivites of the different redox states of NO
List of Schemes
Chapter 1
Scheme 1.1.
Scheme 1.2.
Chapter 2
Scheme 2.1.
Chapter 3
Scheme 3.1.
Scheme 3.2.
Scheme 3.3.
Chapter 4
Scheme 4.1.
Chapter 5
Scheme 5.1.
Scheme 5.2.
Reaction pathway of L-arginine to L-citrulline conversion with
concomitant NO release
Proposed reduction pathways of NO to N20 conversion by
FprA diiron proteins
Known colorimetric and fluorescent probes to detect NO
Suggested pathways in the reaction of [Fel"'(TPP)Cl] and (PPN)(SSNO)
Reaction pathways of [Fe2S2(SPh) 4 ]2- to
form iron-sulfur-nitrosyl products
Reaction pathways of [Fe2(Et-HPTB)(PhCO 2)](BF4)2 and
[Fe2(p-OH)(Ph4DBA)(TMEDA)2(OTf)] with various RNOS species
Reactions of cis-[Pt(NH3)2(py)Cl](OTf) with (PPN)(SSNO),
(PPN)(SNO), and NOBF4
Reactivity pathways of synthetic [4Fe-4S] clusters with NO(g)
and Ph3CSNO
Synthesis of the [3:1] site-differentiating ligand L(SH) 3
23
Chapter 1
Chart 1.1. 27
30
38
49
117
120
138
163
185

Scheme 5.3. Preparation of [Fe4 S4(LS3)L'] 2~ using different alkali metal salts
List of Tables
Chapter 2
Table 2.1. Selected geometrical parameters of M(BIPhMe)X 2 complexes 66
Table 2.2. X-ray crystallographic data for mononuclear and chloro-bridged
[Fe(BIPhMe)C 2], and [Fe(BIPhMe)Br 2] 67Table 2.3. X-ray crystallographic data for [Co(BIPhMe)C 2] and [Co(BIPhMe) 2] 68
Table 2.4. Selected geometrical parameters and vibrational stretches of
[Fe(BIPhMe)2(NO)Cl][Fe(NO)C 3] and related compounds 74
Table 2.5. X-ray crystallographic data for [Fe(BIPhMe) 2(NO)Cl][Fe(NO)Cl 3]
and [Fe(BIPhMe)(NO3)2 C] 75
Table 2.6. Selected geometrical parameters of [Fe(BIPhMe)(NO 3)2Cl]
and [Co(BIPhMe)(NO 3)2] 79
Table 2.7. X-ray crystallographic data for [Co(BIPhMe)(NO 3)2] 84
Chapter 3
Table 3.1. X-ray crystallographic data for (PPN)(SSNO) and (PPN)(SNO)-(CH 3)2CO 108
Table 3.2. Selected geometrical parameters of S-nitrosothiols 109
Table 3.3. Selected geometrical parameters of
[Fe3(p-O)(Ph4DBA)2(TMEDA)2(NO)2](OTf)and other diiron-nitrosyl species 123
Table 3.4. X-ray crystallographic data for (PPN)2[FeS5(NO)2](OTf) and
[Fe3(p-0)(Ph 4DBA)2(TMEDA)2(NO)2](OTf)-2Et2O-O.5CH2CI2 125
Chapter 4
Table 4.1. Selected calculated geometrical parameters for cis-[Pt2(NH3) 4(py)2(U-S2)] 2 +
and cis-[Pt2(NH3)4(py)2(P-S4)] 2+ 147
Table 4.2. Vibrational energies used to prepare fitting equation for calculated spectra 149
Table 4.3. Geometrical parameters of pyriplatin and related complexes 153
24
191

Table 4.4. X-ray crystallographic data for cis-[Pt(NH 3)2(py)(CH3CN)](BF 4)2and cis-mer-[Pt(NH3)2(py)Cl3]C 1
Chapter 5
Table 5.1.
Table 5.2.
Table 5.3.
Table 5.4.
Table 5.5.
Appendix A
X-ray crystallographic data for LS2(SCH2OCH 2CH3) and
L(SCH2OCH3)-(CH 3)2CO
M6ssbauer parameters of relevant iron-sulfur complexes
X-ray crystallographic data for
(Ph4P)2[Fe4S4(LS3)N3]-4MeCN-Et2&-O.5H 20 and
(Ph4P)2[Fe4 S4(LS3)(S 2CNEt2 )] 2.5 -Et2O
X-ray crystallographic data for (Ph3CS) 2 and [Cp*2Fe][Fe 4S4(NO)4]
Selected geometric parameters of iron-sulfur clusters capped
with mono-nitrosyls
Table A. 1. Selected geometrical parameters for M(BIPhMe) complexes
Table A.2. X-ray crystallographic data for [Fe(BIPhMe)I 2] at 296 K and 140 K
Table A.3. X-ray crystallographic data for [Fe(BIPhMe)(OTf) 2(MeCN)2] and
[Fe(BIPhMe)(NO 3)2]20
Table A.4. Selected geometrical parameters of hepta-coordinate, p-oxo diiron
complexes
Table A.5. X-ray crystallographic data for [Cu(BIPhMe) 2](OTf)2,
[Cu(BIPhMe)2][CuCl 2], and [Zn2(p1-OTf)2(OTf)2(BIPhMe)2]
List of Equations
Chapter 5
Equation 5.1. Reaction of [Fe4 S4(LS3)C]2 - and 11 equiv NO(g)
Equation 5.2. Reaction of [Fe4 S4(LS3)C]2 - and 4 equiv Ph3CSNO
Equation 5.3. Reaction of [Fe4 S4(LS3)Cl] 2 - and 7 equiv Ph3CSNO
Equation 5.4. Reaction of [Fe4 S4(LS3)C]2 ~, 11 equiv NO(g), and 3 equiv Tl
Equation 5.5. Reaction of [Fe4 S4(LS3)Cl]2 -, 4 equiv Ph3CSNO, and 2 equiv Tl
25
189
193
198
204
209
228
229
230
232
234
199
202
202
207
207
153

CHAPTER 1: BIOINORGANIC CHEMISTRY OFNITRIC OXIDE AND S-NITROSOTHIOLS
26

1.1 Introduction. The chemical composition of the diatomic gas nitric oxide (NO) was
discovered in the mid-18th century. NO is a radical with one unpaired electron in a x-antibonding
orbital, giving the N-O bond an order of 2.5. The radical nature of NO makes it a highly reactive
molecule with transition metals and other small-molecule radicals such as N02 , 02*, and
RS'(Chart 1.1).1
NO is redox active and can be both oxidized and reduced. NO oxidation to NO+ occurs at
1.52 V vs. NHE and reduction to the triplet ground state of NO occurs at -0.8 V vs. NHE, both
potentials were determined in acetonitrile.2 ,3 The pKa of 3NO was determined to be 11.6.
RR'N-NO RR'NH
ROHRO-NO -
RS-NO
RSHH2N-OH-
H20 NO
HONQq0+ H22ONOO
M-NO
[Ox]
/02 N2
NO - ONOO
M-NO[Red]
NO NO-
N0O ONQO
I \ M-NO
H20
2O3 NO/NO~H20
-NO N0RSH -N02
RS-NO
N20Chart 1.1. Reactivities of the different redox states of NO.'
Prior to the 1980's, NO was considered a major pollutant with little industrial
application. 4 Three decades ago, NO was determined to have a role as the endothelium-derived
27
~

relaxation factor in mammals. This discovery led to an entire field of research in the biological
sciences being developed with the purpose of determining the role of NO as a signaling agent
and microbicide. As NO gained more popularity it was named the Molecule of the Year in 1992
by Science magazine, and the 1998 Nobel Prize in Physiology and Medicine was awarded to
Furchgott, Ignarro, and Murad for their discoveries of the role NO serves in biological signaling
of the cardiovascular system.4 7
NO is produced through multiple pathways in biology.8 One route of production in
mammals involves the conversion of L-arginine to L-citrulline and NO by nitric oxide synthases
(NOS), NADPH, and 02 (Scheme 1.1).9,'o NOS enzymes are homodimers that require the
cofactors (6R)-5,6,7,8-tetrahydrobiopterin (BH4), ironprotoporphyrin IX (heme), flavin-adenine
dinucleotide (FAD), and flavin mononucleotide (FMN) and the messenger protein calmodulin
for full activity.1 1" 2 The homodimer of NOS enzymes is stabilized by Zn2+ ions that bind to
cysteines C I10 and C 115 at the dimer interface (Figure 1.1).11,13
28

Zn(cys)4 active INOS Heme-arginineand biooterin
S-nitrosated INOS N-nitrosobiopterinFigure 1.1. Cartoon depictions of the crystal structures of active (top; PDB: INSI; resolution:2.55 A) and NO-inhibited (bottom; PDB: 3NQS; resolution: 2.20 A) inducible NOS."'1 3 ActiveiNOS forms a homodimer that is stabilized by a Zn2+ ion bound by two cysteines of eachmonomer. When NO concentrations are high, the thiolates of these cysteines are nitrosated andrelease Zn2+, along with nitrosation of the biopterin to prevent further conversion of L-arginineto NO and L-citrulline.
The FAD and FMN cofactors transfer electrons from NADPH to the oxygenase domain
where the heme and BH4 units catalyze the reaction. 14-17 NOS enzymes can be inhibited by high
concentrations of NO as a negative feedback mechanism.' 3 Nitrosation of C1 0 and C 115
results in the release of Zn 2+, formation of protein-bound S-nitrosocysteine, and destabilization of
the homodimer as well as nitrosation of the N5 position of the BH4 cofactor to form a N-
nitrosamine. 3 These NO-modifications can be reversed by high concentrations of glutathione
29
4'I-

(GSH), which form S-nitrosoglutathione (GSNO) by transnitrosation from the protein and
cofactor.
NH2
H2N XOH
+ NO+ H20
+ -
0 OH
0Ct)
0"0-
+0-
+ H*NH
2H2N OH
H2N ~ NH2N ON C
H2N NH2 ON HNHN-Y +H-OHH N + L-Hrgl
HO-'I
-H2
Scheme 1.1. Reaction pathway of L-arginine to L-citrulline conversion with concomitant NOrelease.14
Three isoforms of NOS enzymes exist: endothelial, neuronal, and inducible. Neuronal
(nNOS) and endothelial (eNOS) NOS are Ca2+-dependent enzymes that require calmodulin
binding, whereas the inducible NOS enzymes (iNOS) are not Ca2+-sensitive as calmodulin
remains bound.' 7 Release of NO from eNOS occurs in endothelial cells to regulate vascular
function.'~2 ' The nNOS enzymes are present in the of the central and peripheral nervous
system.' 0 In the central nervous system, NO released by nNOS is linked to cognitive function,
sleep control, and neurosecretion.' 2 Smooth muscle relaxation is controlled by NO released
from nNOS in the peripheral nervous system.24 In these systems, NO serves as a signaling agent
30

to activate soluble guanylyl cyclase, a heme-containing enzyme that catalyzes the conversion of
guanosine triphosphate to 3',5'-cyclic guanosine monophosphate (cGMP), which in turn serves
to signal smooth muscle cell relaxation.25 Macrophages contain iNOS enzymes to release NO in
high concentrations and attack bacteria and tumor cells.9,26 The effect of oxidative stress on
target cells and caspase activation can trigger an apoptotic response leading to cell death. To
counteract the release of NO as a microbicide by macrophages, some bacteria have developed
nitric oxide reductases (NORs) to convert the released NO into N20, a less cytotoxic nitrogen
oxide; others such as Helicobacter pylori express arginase enzymes to deplete the L-arginine
stores of hosts and prevent NO production.28-31
The cellular release of NO can perform post-translational modifications, such as protein-
bound S-nitrosothiol formation or C-nitroso DNA modification, degrade metal active sites in
enzymes, such as iron-sulfur clusters, or form other reactive nitrogen oxide species (RNOS) that
further affect biological pathways. 27 ,3 2 -3 4
1.2. S-nitrosothiols in biology. Similar to NO, thiols, sulfides, and thioethers can access
multiple redox states, from -2 to +6, providing the basis for rich chemistry." S-nitrosothiol
formation can occur from multiple pathways by reduction of disulfides, copper-mediated
oxidation of NO, or reaction with peroxynitrite or dinitrogen." 3 6 Low molecular weight S-
nitrosothiols, such as GSNO, can-transport and shuttle NO throughout the cytosol and perform
post-translational modifications. 37 40 Recently, the smallest S-nitrosothiol HSNO was proposed to
serve as a biologically relevant signaling molecule. 42 HSNO is believed to form upon
transnitrosation of H2S by a Cys-SNO residue on human serum albumin. Due to the small size
and neutral charge of HSNO, the molecule crosses the cell membrane and transfers the NO to a
surface exposed cysteine of hemoglobin. A crystal structure of SNO-nitrosylHbA (human
31

hemoglobin A) has been reported and was prepared by exposing crystals of carbonmonoxyl HbA
to gaseous NO under anaerobic conditions. 43 The CO ligands of the Fe-heme are replaced by NO
and Cys93 is S-nitrosated (Figure 1.2).
Heme-NO S-nitrosated HbA Cys93-SNOFigure 1.2. Cartoon depiction of the 1.90 A resolution crystal structure of S-nitrosated HbA(PDB: I BUW).43 The S-nitrosocysteine residue has a syn-conformation.
Protein-bound S-nitrosothiols can also serve as intercellular and interspecies NO
transporters, such as the NO transport protein nitrophorin (cNP) from the insect Climex
lectularius, commonly known as the bedbug. The cNP protein binds NO at Cys60 as well as its
heme cofactor (Figure 1.3).44 The low pH in the saliva of C. lectularius prevents the release of
NO from nitrosated-cNP. When the protein is injected into the feeding site on the victim, the NO
is released in the higher pH environment. The release of NO induces vasodilation at the site of
injection and improves feeding for the insect.
32

S-nitrosated nitrophorin Heme-NO and Cys60-SNOFigure 1.3. Cartoon depiction of the 1.75 A resolution crystal structure of S-nitrosated cNP fromC. lectularius (PDB: 1Y21).44 Prior to nitrosation, the proximal cysteine is bound to the heme
cofactor. The CSNO moiety has a syn-conformation and is oriented away from the hemecofactor.
1.3. Iron-sulfur clusters and dinitrosyl iron complexes in biology. The NO released by iNOS
during the immune response can proliferate other reactive oxygen/nitrogen species and react with
other biological components such as the non-heme iron cofactor [4Fe-4S] cluster.26 ,45- 47 Protein-
bound [4Fe-4S] clusters can serve as sensor domains in cells for oxidative stress and cytosolic
iron levels, among other uses.48 Dinitrosyl iron complexes (DNICs) are mononuclear iron species
that form upon nitrosation of labile iron.1 4' 37'45'49 NO released into the cytosol of cells will react
with cytosolic iron to form DNICs that can provide long-term storage for NO and either transfer
NO to other metal centers within cells or to bind proteins and inhibit function (Figure 1.4).34,49-52
DNICs are also formed during the degradation process of iron-sulfur proteins and are thought to
52-57be the major iron-containing product of these transformations.
33
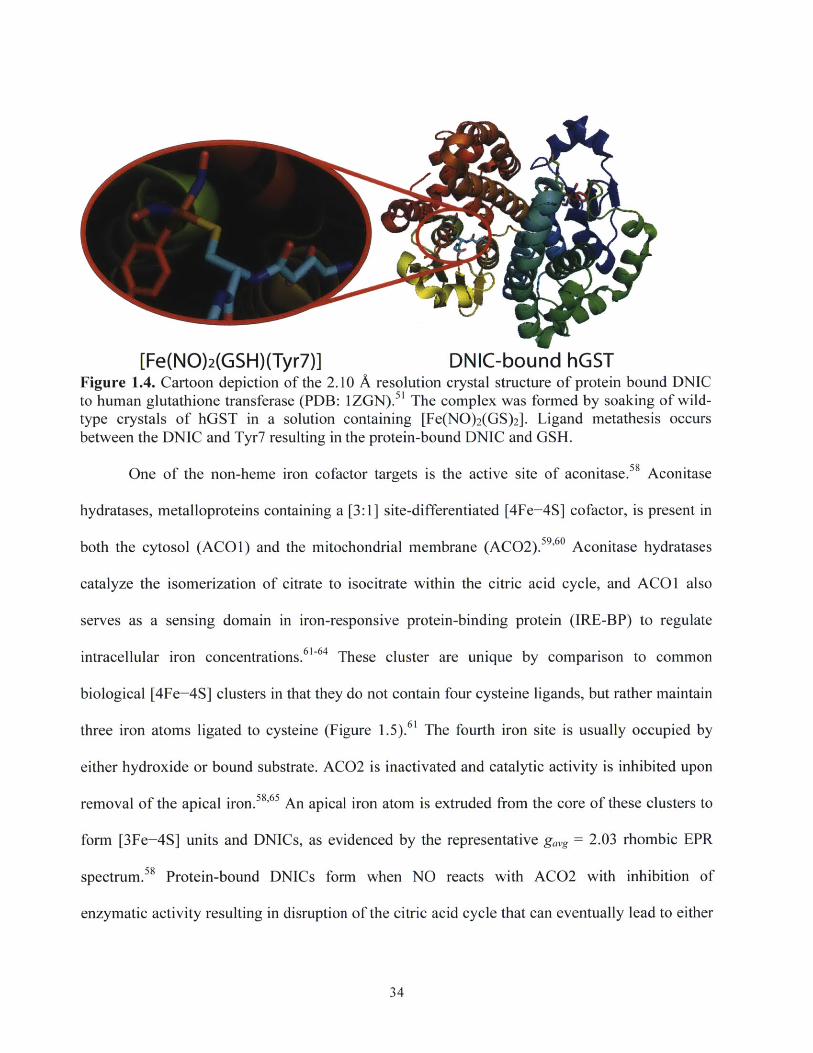
[Fe(NO)2(GSH)(Tyr7)] DNIC-bound hGSTFigure 1.4. Cartoon depiction of the 2.10 A resolution crystal structure of protein bound DNICto human glutathione transferase (PDB: 1ZGN). 1 The complex was formed by soaking of wild-type crystals of hGST in a solution containing [Fe(NO) 2(GS) 2]. Ligand metathesis occursbetween the DNIC and Tyr7 resulting in the protein-bound DNIC and GSH.
One of the non-heme iron cofactor targets is the active site of aconitase.58 Aconitase
hydratases, metalloproteins containing a [3:1] site-differentiated [4Fe-4S] cofactor, is present in
both the cytosol (ACOl) and the mitochondrial membrane (ACO2). 9'60 Aconitase hydratases
catalyze the isomerization of citrate to isocitrate within the citric acid cycle, and ACO1 also
serves as a sensing domain in iron-responsive protein-binding protein (IRE-BP) to regulate
intracellular iron concentrations.61-64 These cluster are unique by comparison to common
biological [4Fe-4S] clusters in that they do not contain four cysteine ligands, but rather maintain
three iron atoms ligated to cysteine (Figure 1. 5).61 The fourth iron site is usually occupied by
either hydroxide or bound substrate. ACO2 is inactivated and catalytic activity is inhibited upon
removal of the apical iron.58'65 An apical iron atom is extruded from the core of these clusters to
form [3Fe-4S] units and DNICs, as evidenced by the representative gai'g = 2.03 rhombic EPR
spectrum.58 Protein-bound DNICs form when NO reacts with ACO2 with inhibition of
enzymatic activity resulting in disruption of the citric acid cycle that can eventually lead to either
34
4L'4 4

cellular apoptosis or necrosis. 66 Complete degradation of the [4Fe-4S] active site in ACOl by
NO has been implicated in the regulation of intracellular iron levels by changing the
conformation of iron regulatory protein 1 (IRP 1) to its IRE-binding conformation. 67
mitochondrial aconitase [Fe4S4(Cys)3] clusterFigure 1.5. A cartoon depiction of the 2.50 A resolution crystal structure of the [Fe4S4] activesite of ACO2 isolated from pig heart mitochondria (PDB: 6ACN). The cluster is ligated by threecysteine residues and a H20/OH.
The [4Fe-4S] clusters of the fumarate nitrate reduction (FNR) regulator in Escherichia
coli reacts with 02 and NO to control anaerobic and aerobic respiration as well as the cellular
oxidative stress response.68 Exposure of E. coli cells to -5 pM of NO in an aerobic environment
leads to inactivation of FNR by degradation of the [4Fe-4S] cluster, resulting in formation of
DNICs and Roussin's red ester (RRE), and leads to monomerization of the enzyme. This
monomerization reduces DNA binding affinity and removes transcriptional repression of the
hmp gene. The hmp gene regulates expression of Hmp, a flavohemoglobin protein that detoxifies
cells of NO by conversion to N20 (anaerobic) or N03 (aerobic).69
35

The [4Fe-4S]-containing Wbl proteins induce sporulation in actinomycetes upon
degradation by NO, resulting in the formation of two equivalents of RRE as the major product
with only <3% DNIC formation.7 0 The formation of RRE was postulated based on reaction
completion at eight equivalents NO and the release of So.
1.4. Flavodiiron nitric oxide reductases. NO is encountered by bacteria due to reduction of
nitrate and nitrite during denitrification or as a host immune response during infection. 1- There
are multiple forms of nitric oxide reductases (NORs) that involve heme and/or non-heme iron
active sites (Figure 1.6).28,78 These NORs can be membrane-bound or dissolved in the cytosol.
A-type flavoproteins (FprA) have been proposed to serve as scavenging NORs in the cytosol to
reduce NO to N20. 7980 FprA proteins contain non-heme, non-sulfur diiron sites where the iron
atoms are five-coordinate and bridged by a solvent molecule (OH/H2O) and an aspartate.8 1,'2
Each iron site contains two histidines and a terminal carboxylate ligand from either an aspartate
or a glutamate. The open coordination sites on the irons are syn with one another. These proteins
also contain a FMN cofactor for electron transport.
36

His207
His258 His259Asp89
Glu87Glu211
His85 His90
His347 His158 Asp168
cNOR FprAFigure 1.6. Diiron active sites of nitric oxide reductases from Pseudomonas aeruginosa (left;PDB: 300R) and Thermotoga maritime (right; PDB: 1VME). The active site of cNOR from P.aeruginosa consists of an Fe-heme-his and FeN302 oxo-bridged active site. The FprA diironactive site of T. maritime consists of both an oxo-bridge as well as a carboxylate-bridge. In bothNORs, the two irons have different coordination environments, and in the case of FprA may alsohave different coordination numbers.30' 83
1.5 Proposed flavodiiron nitric oxide reductase pathways. The reduction mechanism of NO
by FprA proteins has not been fully elucidated. 29,3 0,7 8 Two mechanistic pathways have been
proposed and partially proven via biochemical methods (Scheme 1.2).30 The super-reduction
pathway involves concomitant binding of NO to both iron sites to form a diferrous-dinitrosyl
species. The nitrosyls are protonated to nitroxyls, followed by N=N bond formation to yield N20
and H20. In the hyponitrite intermediate pathway, NO initially binds to a single iron within the
active site. An additional NO couples to the bound-NO to form an N=N bond and the oxygen
forms a bridge to the second iron. N 20 dissociation occurs, followed by protonation of the
bridging oxygen to form and release H120.
37

Super-reduction mechanism
FMNH 2 FMNH 2 FMN FMN
NO NO HNO HNOI I
Fe" Fe" + 2 NO Fe" Fe"l Fe Fe" Fe" Fe"N0 0 a~H H H H
-N 20-H 2 0
Hyponitrite intermediate mechanism
N NONO +2H+
Fell Fe + NO Fe" Fe + NO Fe"' Fe Fel Fe'
H H H H-N 20-H 20
Scheme 1.2. Proposed reduction pathways of NO to N20 by FprA diiron proteins.30
1.6 Synthetic flavodiiron nitric oxide reductase models. Synthetic analogues capable of
reproducing this chemistry have not been well explored. Our lab was the first to publish a
carboxylate-bridged diiron(II)-dinitrosyl species, [Fe2(N-Et-HPTB)(O 2CPh)(NO) 2](BF4)2; the
related compound [Fe2(BPMP)(O 2Pr)(NO) 2](BPh4)2 was shown to form N20 upon bulk two-
electron reduction, making it the first functional FprA model (Figure 1.7).84'8 Our lab recently
published the first synthetic diiron-mononitrosyl species [Fe2(N-Et-HPTB)(L)(NO)(DMF) 2]3 ,
where L is either hydroxide or N-coordinated DMF.16 This species was formed by the one-
electron oxidation with NOBF 4 or by addition of ferrocenium and Ph3CSNO. A hydroxo-bridged
tetra-iron-nitrosyl cube, Fe4(Mes2ArCO2)4(NO)(p 3-OH) 4, forms upon addition of NO to a
toluene solution containing FeOTf2, 2,6-dimesitylbenzoate, and water.87 The [Fe4(OH)4] core
resembles a [Fe4S4] cluster, but the iron atoms have an octahedral geometry instead of the typical
tetrahedral geometry.
38

A) B)
C) D
Figure 1.7. Ball-and-stick representation of the crystal structures of A)[Fe2(N-Et-HPTB)( 2CPh)(NO) 2] 2+,4 B) [Fe2(BPMP)(O2Pr)(NO)2] 2+,8 5 C)[Fe2(N-Et-HPTB)(L)(NO)(DMF) 2]3 ,86 and D) Fe 4(Mes2ArCO 2 ) 4(NO)(p3-OH) 4 . Colorscheme: iron, orange; nitrogen, blue; oxygen, red; carbon; grey.
1.7. Precious metals and nitric oxide. The first crystallographically characterized bent metal-
nitrosyl species was trans-[IrCl(CO)(NO)(PPh 3)2](BF4) (Figure 1.8A).88 .89 This species was
prepared by addition of 1.5 equiv of NOBF 4 to Vaska's complex, trans-[IrCl(CO)(PPh3)2]. This
species is thought to be formally Ir(III) by oxidative addition of NO+ to the Ir(I) starting material.
Studies of Vaska's complex with 02 and 12 are also characterized to occur by oxidative addition
of these substrates. 90 In all cases, the vco stretch increases in energy from 1967 cm 1 to 2015
39

cm-' (02), 2050 cm~' (NO), and 2067 cm-' (12), due to a decrease in -backbonding of Ir to C
upon oxidation from 1+ to 3+.
The first crystallographically characterized metal-SNO complex was cis-
[RuCl(bpy) 2{N(O)SO 3}] (Figure 1.8B). 91 Only spectroscopic characterization of similar
complexes of iron or ruthenium are available owing to the instability of the formed complexes
and their subsequent decomposition. 92 This ruthenium species provided the first structural
evidence for the product formed in the analogous reaction of [Fe(CN)5(NO)] 2~ with S032-,
originally reported by Boedeker in 1861 that forms a deep red solution.95 It was later established
by spectroscopic means that that the species is [Fe(CN) 5{N(O)SO3 }]4 , but no structural
characterization was performed.93
The first crystallographically characterized metal-bound organo-S-nitrosothiol was an
iridium complex, trans-K[IrCl 4(CH3CN){N(O)SCH 2Ph}] (Figure 1.8C).9 This species was
formed by addition of benzyl mercaptan to K[IrCl5(NO)] in acetonitrile to form the S-
nitrosothiol. The formation of the S-nitrosothiol labilizes the trans-chloride and results in ligand
metathesis with the solvent to release HCL. This method was employed to form analogous
complexes using mercaptanobenzene, mercaptosuccinic acid, N-acetyl-L-cysteine, and L-
cysteine ethyl ester, but these compounds were characterized only by 1H NMR and other
spectroscopies.97
40
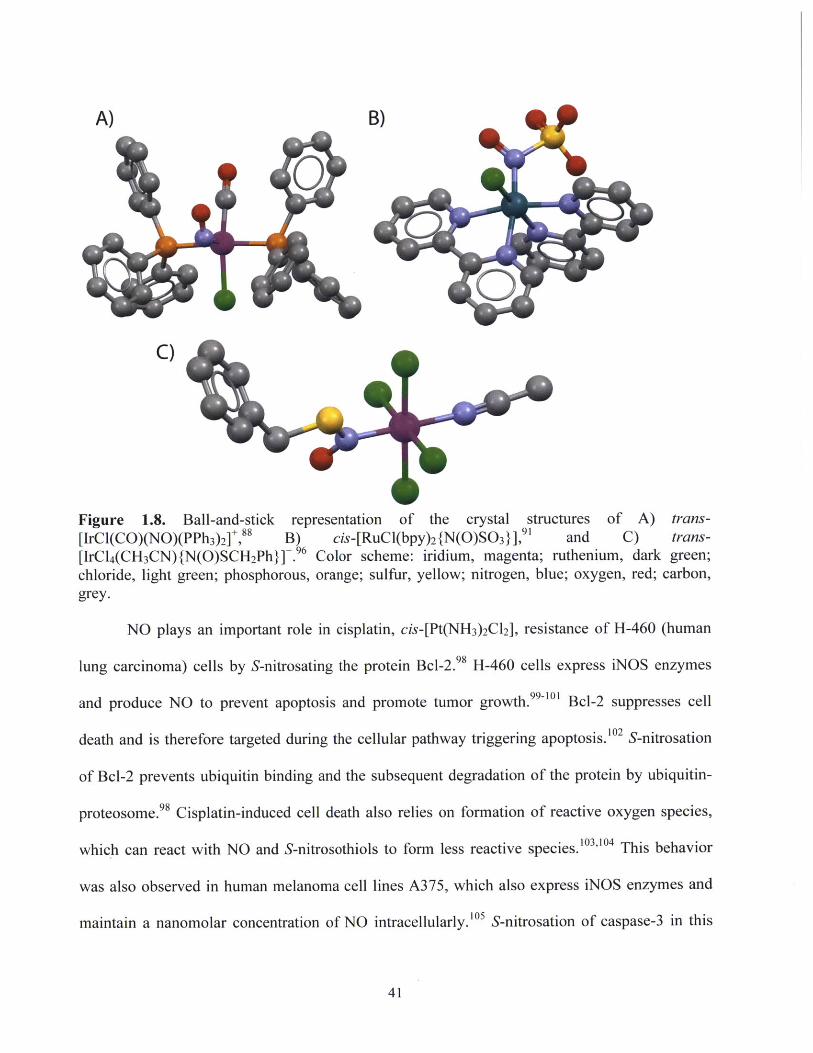
A) B)
C)
Figure 1.8. Ball-and-stick representation of the crystal structures of A) trans-[IrCl(CO)(NO)(PPh 3)2], 88 B) cis-[RuCl(bpy) 2 {N(O)SO3}],9 and C) trans-
[IrCl4(CH 3CN){N(O)SCH 2Ph} ]. 96 Color scheme: iridium, magenta; ruthenium, dark green;chloride, light green; phosphorous, orange; sulfur, yellow; nitrogen, blue; oxygen, red; carbon,grey.
NO plays an important role in cisplatin, cis-[Pt(NH 3)2Cl2], resistance of H-460 (human
lung carcinoma) cells by S-nitrosating the protein Bcl-2. 98 H-460 cells express iNOS enzymes
and produce NO to prevent apoptosis and promote tumor growth.99-'0' Bcl-2 suppresses cell
death and is therefore targeted during the cellular pathway triggering apoptosis.10 2 S-nitrosation
of Bcl-2 prevents ubiquitin binding and the subsequent degradation of the protein by ubiquitin-
proteosome. 98 Cisplatin-induced cell death also relies on formation of reactive oxygen species,
which can react with NO and S-nitrosothiols to form less reactive species. 103"104 This behavior
was also observed in human melanoma cell lines A375, which also express iNOS enzymes and
maintain a nanomolar concentration of NO intracellularly. 105 S-nitrosation of caspase-3 in this
41

cell line interferes with apoptosis. In both cases, inhibition of iNOS activity or addition of NO
scavengers increased cisplatin sensitivity.98 1 05 No evidence in either study was presented for NO
interacting directly with cisplatin to cause the displayed resistance.
1.8. Conclusion. NO and S-nitrosothiols play an important role in biology and bioinorganic
chemistry. Further understanding their interactions with metal active sites requires multiple
approaches. The approach taken in this thesis the use of small molecule analogues of iron-sulfur
clusters, hemes, non-heme NORs, and a platinum complex, and studies of their reactivity toward
NO and three S-nitrosothiols: Ph3CSNO, SSNO~, and SNO~.
42

1.7. References.
1. Torday, L. L.; Santillan, M. B.; Ciuffo, G. M.; Jauregui, E. A.; Pataricza, J.; Papp, J. G.;Csizmadia, I. G., J. Mol. Struct. - Theochem 1999, 465, 69.
2. Kochi, J. K., Acc. Chem. Res. 1992, 25, 39.3. Bartberger, M. D.; Liu, W.; Ford, E.; Miranda, K. M.; Switzer, C.; Fukuto, J. M.; Farmer,
P. J.; Wink, D. A.; Houk, K. N., Proc. Nat!. Acad Sci. U.S.A. 2002,99, 10958.4. Koshland, D., Science 1992,258, 1861.5. Furchgott, R. F., Angew. Chem. Int. Ed. 1999,38, 1870.6. Ignarro, L. J., Angew. Chem. Int. Ed. 1999, 38, 1882.7. Murad, F., Angew. Chem. Int. Ed 1999,38, 1857.8. Shiva, S., Redox Biol. 2013, 1, 40.9. Bronte, V.; Zanovello, P., Nat. Rev. Immunol. 2005, 5, 641.10. Calabrese, V.; Mancuso, C.; Calvani, M.; Rizzarelli, E.; Butterfield, D. A.; Stella, A. M.,
Nat. Rev. Neurosci. 2007, 8, 766.11. Li, H.; Raman, C. S.; Glaser, C. B.; Blasko, E.; Young, T. A.; Parkinson, J. F.; Whitlow,
M.; Poulos, T. L., J. Biol. Chem. 1999,274,21276.12. Knowles, R. G.; Moncada, S., Biochem. J. 1994, 298 (Pt 2), 249.13. Rosenfeld, R. J.; Bonaventura, J.; Szymczyna, B. R.; MacCoss, M. J.; Arvai, A. S.;
Yates, J. R.; Tainer, J. A.; Getzoff, E. D., J. Biol. Chem. 2010, 285, 31581.14. Szacilowski, K.; Chmura, A.; Stasicka, Z., Coord Chem. Rev. 2005,249,2408.15. Andrew, P. J.; Mayer, B., Cardiovasc. Res. 1999, 43, 521.16. Wasielewska, E.; Witko, M.; Stochel, G.; Stasicka, Z., Chem. Eur. J. 1997, 3, 609.17. Stuehr, D. J., Biochim. Biophys. Acta, Bioenerg. 1999, 1411, 217.18. Furchgott, R. F.; Vanhoutte, P. M., FASEB J. 1989, 3, 2007.19. Ignarro, L. J.; Buga, G. M.; Wood, K. S.; Byrns, R. E.; Chaudhuri, G., Proc. Nat. Acad.
Sci. U.S.A. 1987, 84, 9265.20. Rapoport, R. M.; Draznin, M. B.; Murad, F., Nature 1983, 306, 174.21. Ignarro, L. J., Nitric Oxide: Biology and Pathobiology. Academic Press: San Diego,
2000.22. McCann, S. M., Experimental Gerontology 1997, 32, 431.23. Guix, F. X.; Uribesalgo, I.; Coma, M.; Mufioz, F. J., Prog. Neurobiol. 2005, 76, 126.24. Toda, N.; Ayajiki, K.; Okamura, T., Pharmacol. Ther. 2005, 106,233.25. Krumenacker, J. S.; Hanafy, K. A.; Murad, F., Brain Res. Bull. 2004, 62, 505.26. Bogdan, C., Nat. Immunol. 2001,2,907.27. Wink, D. A.; Mitchell, J. B., Free Radical Biol. Med 1998, 25, 434.28. Wasser, I. M.; de Vries, S.; Modnne-Loccoz, P.; SchrSder, I.; Karlin, K. D., Chem. Rev.
2002,102, 1201.29. Kurtz, D. M., Dalton Trans. 2007,4115.30. Hayashi, T.; Caranto, J. D.; Wampler, D. A.; Kurtz, D. M.; Modnne-Loccoz, P.,
Biochemistry 2010,49, 7040.31. Gobert, A. P.; McGee, D. J.; Akhtar, M.; Mendz, G. L.; Newton, J. C.; Cheng, Y.;
Mobley, H. L. T.; Wilson, K. T., Proc. Nat!. Acad Sci. US.A. 2001, 98, 13844.32. Gaston, B., Biochim. Biophys. Acta, Bioenerg. 1999, 1411, 323.33. Howard-Flanders, P., Nature 1957, 180, 1191.
43

34. McCleverty, J. A., Chem. Rev. 2004, 104,403.35. Meyer, B., Chem. Rev. 1976, 76, 367.36. Zhang, S.; Celebi-Olqnm, N.; Melzer, M. M.; Houk, K. N.; Warren, T. H., J. Am. Chem.
Soc. 2013, 135, 16746.37. Tennyson, A. G.; Dhar, S.; Lippard, S. J., J. Am. Chem. Soc. 2008,130, 15087.38. Ramachandran, N.; Root, P.; Jiang, X.-M.; Hogg, P. J.; Mutus, B., Proc. Nati. Acad Sci.
U.S.A. 2001, 98, 9539.39. Singh, S. P.; Wishnok, J. S.; Keshive, M.; Deen, W. M.; Tannenbaum, S. R., Proc. Nati.
Acad Sci. U.S.A. 1996, 93, 14428.40. Myers, P. R.; Minor, R. L.; Guerra, R.; Bates, J. N.; Harrison, D. G., Nature 1990, 345,
161.41. Filipovic, M. R.; Miljkovic, J. L.; Nauser, T.; Royzen, M.; Klos, K.; Shubina, T.;
Koppenol, W. H.; Lippard, S. J.; Ivanovid-Burmazovi5, I., J Am. Chem. Soc. 2012, 134,12016.
42. Miljkovic, J. L.; Kenkel, I.; Ivanovi&-Burmazovid, I.; Filipovic, M. R., Angew. Chem. Int.Ed. 2013, 52, 12061.
43. Chan, N.-L.; Rogers, P. H.; Arnone, A., Biochemistry 1998, 37, 16459.44. Weichsel, A.; Maes, E. M.; Andersen, J. F.; Valenzuela, J. G.; Shokhireva, T. K.; Walker,
F. A.; Montfort, W. R., Proc. Natl. Acad Sci. U.S.A. 2005, 102, 594.45. Tonzetich, Z. J.; McQuade, L. E.; Lippard, S. J., Inorg. Chem. 2010, 49, 6338.46. Saini, V.; Farhana, A.; Glasgow, J. N.; Steyn, A. J. C., Curr. Opin. Chem. Biol. 2012, 16,
45.47. Crack, J. C.; Green, J.; Thomson, A. J.; Le Brun, N. E., Curr. Opin. Chem. Biol. 2012,
16, 35.48. Crack, J. C.; Green, J.; Hutchings, M. I.; Thomson, A. J.; Le Brun, N. E., Antioxid Redox
Signaling 2012, 17, 1215.49. Vanin, A. F., Nitric Oxide 2009, 21, 1.50. Vanin, A. F., Biochemistry (Moscow) 1998, 63, 782.51. Cesareo, E.; Parker, L. J.; Pedersen, J. Z.; Nuccetelli, M.; Mazzetti, A. P.; Pastore, A.;
Federici, G.; Caccuri, A. M.; Ricci, G.; Adams, J. J.; Parker, M. W.; Bello, M. L., J. Biol.Chem. 2005,280,42172.
52. Richardson, D. R.; Lok, H. C., Biochim. Biophys. Acta 2008, 1780, 638.53. Harrop, T. C.; Tonzetich, Z. J.; Reisner, E.; Lippard, S. J., J Am. Chem. Soc. 2008, 130,
15602.54. Chen, Y.-J.; Ku, W.-C.; Feng, L.-T.; Tsai, M.-L.; Hsieh, C.-H.; Hsu, W.-H.; Liaw, W.-F.;
Hung, C.-H.; Chen, Y.-J., J. Am. Chem. Soc. 2008,130, 10929.55. Tsai, F.-T.; Chiou, S.-J.; Tsai, M.-C.; Tsai, M.-L.; Huang, H.-W.; Chiang, M.-H.; Liaw,
W.-F., Inorg. Chem. 2005, 44, 5872.56. Lu, T.-T.; Huang, H.-W.; Liaw, W.-F., Inorg. Chem. 2009, 48,9027.57. Lu, T.-T.; Chiou, S.-J.; Chen, C.-Y.; Liaw, W.-F., Inorg. Chem. 2006, 45, 8799.58. Kennedy, M. C.; Antholine, W. E.; Beinert, H., J. Biol. Chem. 1997, 272,20340.59. Dupuy, J.; Volbeda, A.; Carpentier, P.; Darnault, C.; Moulis, J. M.; Fontecilla-Camps, J.
C., Structure 2006, 14, 129.60. Robbins, A. H.; Stout, C. D., Proc. Nati. Acad Sci. U.S.A. 1989, 86,3639.61. Rao, P. V.; Holm, R. H., Chem. Rev. 2004, 104, 527.62. Drapier, J.-C., Methods 1997, 11, 319.
44

63. Beinert, H.; Kennedy, M. C.; Stout, C. D., Chem. Rev. 1996, 96,2335.64. Beinert, H.; Kennedy, M. C., FASEB J. 1993, 7, 1442.65. Foster, M. W.; Cowan, J. A., J. Am. Chem. Soc. 1999, 121, 4093.66. Han, D.; Canali, R.; Garcia, J.; Aguilera, R.; Gallaher, T. K.; Cadenas, E., Biochemistry
2005, 44, 11986.67. Styg, A.; Galy, B.; Starzyniski, R. R.; Smuda, E.; Drapier, J.-C.; Lipinski, P.; Bouton, C.,
J. Biol. Chem. 2011.68. Cruz-Ramos, H.; Crack, J.; Wu, G. G.; Hughes, M. N.; Scott, C.; Thomson, A. J.; Green,
J.; Poole, R. K., EMBO J. 2002, 21, 3235.69. Bang, I. S.; Liu, L. M.; Vazquez-Torres, A.; Crouch, M. L.; Stamler, J. S.; Fang, F. C., J
Biol. Chem. 2006,281,28039.70. Crack, J. C.; Smith, L. J.; Stapleton, M. R.; Peck, J.; Watmough, N. J.; Buttner, M. J.;
Buxton, R. S.; Green, J.; Oganesyan, V. S.; Thomson, A. J.; Le Brun, N. E., J. Am. Chem.Soc. 2010, 133, 1112.
71. Watmough, N. J.; Butland, G.; Cheesman, M. R.; Moir, J. W.; Richardson, D. J.; Spiro,S., Biochim. Biophys. Acta 1999,1411, 456.
72. Sarti, P.; Fiori, P. L.; Forte, E.; Rappelli, P.; Teixeira, M.; Mastronicola, D.; Sanciu, G.;Giuffr6, A.; Brunori, M., Cell. Mol. Life Sci. 2004, 61, 618.
73. Gardner, A. M.; Helmick, R. A.; Gardner, P. R., J. Biol. Chem. 2002, 277, 8172.74. Gomes, C. M.; Giuffr6, A.; Forte, E.; Vicente, J. B.; Saraiva, L. g. M.; Brunori, M.;
Teixeira, M., J. Biol. Chem. 2002,277,25273.75. Anjum, M. F.; Stevanin, T. M.; Read, R. C.; Moir, J. W. B., J. Bacteriol. 2002, 184,
2987.76. Stevanin, T. M.; Moir, J. W. B.; Read, R. C., Infect. Immun. 2005, 73, 3322.77. Modnne-Loccoz, P.; Fee, J. A., Science 2010, 330, 1632.78. Hayashi, T.; Caranto, J. D.; Matsumura, H.; Kurtz, D. M.; Modnne-Loccoz, P., J. Am.
Chem. Soc. 2012,134,6878.79. Poock, S. R.; Leach, E. R.; Moir, J. W.; Cole, J. A.; Richardson, D. J., J. Biol. Chem.
2002, 277, 23664.80. Corker, H.; Poole, R. K., J. Biol. Chem. 2003,278, 31584.81. Silaghi-Dumitrescu, R.; Kurtz, D. M.; Ljungdahl, L. G.; Lanzilotta, W. N., Biochemistry
2005,44, 6492.82. Silaghi-Dumitrescu, R.; Coulter, E. D.; Das, A.; Ljungdahl, L. G.; Jameson, G. N.;
Huynh, B. H.; Kurtz, D. M., Jr., Biochemistry 2003, 42, 2806.83. Hino, T.; Matsumoto, Y.; Nagano, S.; Sugimoto, H.; Fukumori, Y.; Murata, T.; Iwata, S.;
Shiro, Y., Science 2010, 330, 1666.84. Feig, A. L.; Bautista, M. T.; Lippard, S. J., Inorg. Chem. 1996, 35, 6892.85. Zheng, S.; Berto, T. C.; Dahl, E. W.; Hoffman, M. B.; Speelman, A. L.; Lehnert, N., J.
Am. Chem. Soc. 2013, 135, 4902.86. Majumdar, A.; Lippard, S. J., Inorg. Chem. 2013, 52, 13292.87. Klein, D. P.; Young, V. G.; Tolman, W. B.; Que, L., Inorg. Chem. 2006, 45, 8006.88. Hodgson, D. J.; Ibers, J. A., Inorg. Chem. 1968, 7,2345.89. Hodgson, D. J.; Payne, N. C.; McGinnety, J. A.; Pearson, R. G.; Ibers, J. A., J. Am.
Chem. Soc. 1968, 90,4486.90. Crabtree, R. H., The Organometallic Chemistry of the Transition Metals. 5th ed.; John
Wiley & Sons, Inc.: 2009; p 505.
45

91. Bottomley, F.; Brooks, W. V. F.; Paez, D. E.; White, P. S.; Mukaida, M., J. Chem. Soc.,Dalton Trans. 1983, 2465.
92. Swinehart, J. H., Coord Chem. Rev. 1967, 2, 385.93. Moser, W.; Chalmers, R. A.; Fogg, A. G., J. Inorg. Nucl. Chem. 1965, 27, 831.94. Hofinann, K. A., Z. Anorg. Chem. 1896,11, 31.95. Boedeker, C., Liebigs Ann. Chem. 1861, 117, 193.96. Perissinotti, L. L.; Estrin, D. A.; Leitus, G.; Doctorovich, F., J. Am. Chem. Soc. 2006,
128,2512.97. Perissinotti, L. L.; Leitus, G.; Shimon, L.; Estrin, D.; Doctorovich, F., Inorg. Chem. 2008,
47,4723.98. Chanvorachote, P.; Nimmannit, U.; Stehlik, C.; Wang, L.; Jiang, B.-H.; Ongpipatanakul,
B.; Rojanasakul, Y., Cancer Res. 2006, 66, 6353.99. Kolb, J. P., Leukemia 2000,14, 1685.100. Liu, C. Y.; Wang, C. H.; Chen, T. C.; Lin, H. C.; Yu, C. T.; Kuo, H. P., Br. J. Cancer
1998, 78, 534.101. Puhakka, A.; Kinnula, V.; Ndpankangas, U.; SaiIly, M.; Koistinen, P.; PHkk6, P.; Soini,
Y., APMIS 2003, 111, 1137.102. Xie, K.; Huang, S., Free Radical Biol. Med 2003,34, 969.103. Miyajima, A.; Nakashima, J.; Yoshioka, K.; Tachibana, M.; Tazaki, H.; Murai, M., Br. J.
Cancer 1997, 76, 206.104. Schweyer, S.; Soruri, A.; Heintze, A.; Radzun, H. J.; Fayyazi, A., Int. J. Oncol. 2004, 25,
1671.105. Godoy, L. C.; Anderson, C. T. M.; Chowdhury, R.; Trudel, L. J.; Wogan, G. N., Proc.
Nati. Acad Sci. U.S.A. 2012,109,20373.
46

CHAPTER 2: RAPID NITRIC OXIDE ANDNITROGEN DIOXIDE DETECTION ANDQUANTIFICATION ASSAYS AND DEVICESBASED ON M(BIPhMe)X 2 COMPLEXES
47

2.1 Introduction.
It is often desirable to observe and quantify the release of NO (g) or NO2 (g) from a
reaction, both in biology and chemistry. There currently exist multiple methods to perform these
experiments either using electrochemistry or spectroscopy.
Electrochemical methods oxidize NO to NO+ and monitor the change in amperage using
Clark electrode.' These setups can provide solution concentrations of NO', but cannot measure
the release of NO (g) to the surrounding headspace and require an additional instrument that may
not be commonly available or can alter the observed reaction.
[Fe"(porphyrin)] compounds have been used to detect and quantify the release of NO (g)
by IR, UV-Vis, and EPR spectroscopy follow capture as [Fe"(porphyrin)(NO)].2'3 These methods
provide a rapid method to detect the release of NO (g) using instruments available in most
chemistry departments, but, due to the strong intensity of porphyrin absorbance bands, do not
provide a rapid method for observing the release by the naked eye.
Commercial NO colorimetric detection kits are available, however, which indirectly
measure NO by oxidation to a higher NO, species and subsequently quantification of the
concentration of nitrate and nitrite present in solution using the Griess reagent.4 ,5 This method
can result in incorrect measurements due to N0 2 contamination or loss of NO (g) to the
surrounding headspace.
The complexes [Cu(dmp) 2]2+ and [Cu(RB-Py)] 2+, and a tetraarylcalix[4]arene ether
radical (Scheme 2.1), exhibit colorimetric responses upon NO' exposure.6~S The mechanism of
response of the Cu2+ complexes occurs by reduction to Cu+, resulting in a change from pale
green to bright yellow/orange and colorless to pink, respectively for the two compounds noted.
48

This response mechanism is similar to that of the fluorescent NO probe CuFL1.9,10 The
tetraarylcalix[4]arene radical binds NO', eliciting a color change from bright green to dark blue.
2+ L L 2+
N
IN N, 0[Cu(dmp)?* [Cu(RB-py)12'
Ar Ar 11- N -r
0 0 C0
Ar A ~
Ar - 2,5-dimethoxytolyTetraarylcallx[4]armn ether rdiCal CuFLI
Scheme 2.1. Known colorimetric and fluorescent probes to detect NO'.
In the present work we report a set of colorimetric sensors (Figure 2.1) using Fe2+ and
C02+ halide complexes of bis-(1-methylimidazol-2-yl)phenylmethoxymethane, BIPhMe, which
is a bis-N donor ligand." The NO (g) and NO 2 (g) chemistry of these complexes was explored,
and they were characterized by X-ray crystallography, ESI-MS spectrometry, and FT-IR, UV-
Vis, EPR, and 'H NMR spectroscopy. We developed these compounds into colorimetric test
strips and headspace analyzers capable of providing simple and rapid methods to observe the
release of NO (g) and NO2 (g) from chemical and biological reactions.
-N _N XN 1X
N
Figure 2.1. Metal-halide complexes of the bis-N donor BIPhMe, where M = Fe2+ or Co 2+ and X
= Cl~, Br-, or I-.
49

3.2 Experimental Methods
General. All manipulations were performed under an atmosphere of nitrogen gas using standard
Schlenk techniques or in an MBraun glovebox under an atmosphere of purified nitrogen. NO
(Airgas, 99%) was purified by a literature procedure.' 2 The NO gas stream was passed through
an Ascarite column (NaOH fused on silica gel) and a 6 ft. coil filled with silica gel that was
cooled to -78 *C using a dry ice/acetone bath. Nitric oxide was stored using standard gas bulbs
and transferred via gastight syringes. Diethyl ether, pentane, methylene chloride, and acetonitrile
were purified using a Glass Contour solvent system.'3 Deuterated solvents were purchased from
Cambridge Isotope Labs Inc. (Tewksbury, MA). BIPhMe was synthesized according to a
literature procedure." All organic chemicals were purchased from Sigma-Aldrich and used as
received. Metal salts were purchased from Strem Chemicals and used as received.
Physical Measurements. NMR spectra were recorded on a Bruker Avance spectrometer
operating at 400 MHz at ambient temperature and referenced to residual signals in the deuterated
solvent. MALDI-TOF mass spectra were obtained with a Bruker Omniflex MALDI-TOF with a
Reflectron accessory. Low-resolution ESI mass spectra were obtained with an Agilent 1100
Series LC/MSD mass spectrometer using degassed acetonitrile as the carrier solvent. FT-IR
spectra were recorded on a Thermo Nicolet Avatar 360 spectrometer running the OMNIC
software package; solid samples were pressed into KBr disks and solution samples were
prepared in an airtight Graseby-Specac solution cell with CaF2 windows and 0.1 mm spacers.
MOssbauer Measurements. Samples for 57Fe Mssbauer studies were prepared by grinding a
solid sample with Apiezon-N grease. These 57Fe M6ssbauer samples were placed in an 80 K
cryostat during measurement. A 57Co/Rh source was moved at a constant acceleration at room
temperature against the absorber sample. All isomer shift (8) and quadrupole splitting (AEQ)
50

values are reported with respect to 57Fe-enriched metallic iron foil that was used for velocity
calibration. The displayed spectrum was folded to enhance the signal-to-noise ratio. Fits of the
data were calculated by the WMOSS plot-and-fit program, version 2.5.14
X-ray Data Collection, Structure, and Solution Refinement. Crystals of 1 - 9 suitable for X-
ray diffraction were mounted in Paratone N oil and frozen under a nitrogen cold stream
maintained at 100 K by a KRYO-FLEX low-temperature apparatus. Data were collected on a
Bruker APEX CCD X-ray diffractometer with Mo Ka radiation (X= 0.71073 A) controlled by the
APEX2 software package.' 5 Empirical absorption corrections were calculated with SADABS.16
The structures were solved by direct methods with refinement by full-matrix least-squares based
on F2 using SHELXTL-97. 17'1 8 All non-hydrogen atoms were located and refined anisotropically.
Hydrogen atoms were assigned to idealized positions and given thermal parameters equal to
either 1.5 (methyl hydrogen atoms) or 1.2 (non-methyl hydrogen atoms) times the thermal
parameters of the atoms to which they were attached. Figures were generated using the Olex2.1
Graphical User Interface.' 9 See Tables 2.2, 2.3, 2.5, and 2.7 below for crystallographic data and
refinement details.
-N
-N
1
Fe(BIPhMe)C 2, 1. A 50 mL Erlenmeyer flask was charged with FeCl2-4H20 (227.5 mg, 1.144
mmol) and BIPhMe (336.0 mg, 1.190 mmol). Tetrahydrofuran (20 mL) was added to the flask
and the reacting solution was stirred for I h, during which time a white precipitate formed. The
precipitate was filterted and the solid was washed with tetrahydrofuran (3 x 10 mL) and diethyl
51

ether (3 x 20 mL), and dried in vacuo. The solid was collected to yield 417.6 mg (1.021 mmol,
74%) of 1. X-ray quality crystals were grown by vapor diffusion of diethyl ether into a
methylene chloride solution of 1. Anal. Calc'd for C16H1sCl2FeN40: C, 46.98; H, 4.43; N, 13.70.
Found: C, 47.12; H, 4.45; N, 13.51. MALDI-TOF MS (anthracene, m/z): 408.17 (calc'd [M]':
408.02), 373.12 (calc'd [M-Cl]+: 373.05). ESI-MS (MeCN, m/z): 373.1 (calc'd [M-Cl]+: 373.1),
655.2 (calc'd [M+BIPhMe-Cl]f: 655.2). 'H NMR (400 MHz, CDCl 3, ppm): 1.88 (s), 3.77 (s),
9.42 (s), 10.93 (s), 18.82 (s), 21.90 (br), 29.15 (s), 37.27 (s). FT-IR (KBr, cm '): 3156 (w), 3139
(w), 3118 (m), 3067 (w), 3009 (w), 2954 (m), 2834 (m), 1630 (w), 1603 (w), 1541 (m), 1500 (s),
1470 (m), 1449 (s), 1400 (m), 1350 (w), 1323 (m), 1284 (s), 1225 (w), 1212 (w), 1174 (m), 1174
(s), 1146 (s), 1090 (sh), 1071 (s), 1032 (w), 990 (s), 940 (w), 898 (s), 760 (s), 733 (s), 703 (s),
688 (w), 645 (m), 558 (w), 512 (w), 465 (w). 57M6ssbauer (mm/s) (80 K, 6 mm/s, AEQ mm/s, F
mm/s): 0.929(2), 3.127(2), 0.354(2).
F_-~N
Br
N
2
Fe(BIPhMe)Br 2, 2. In a 20 mL vial FeBr2 (330.2 mg, 1.531 mmol) was dissolved in THF (10
mL) and a solution of BIPhMe (422.0 mg, 1.495 mmol) in tetrahydrofuran (10 mL) was added
dropwise over one min. The solution was stirred for I h, during which time a pale brown
precipitate formed and was collected on an F-grade frit. The precipitate was washed with THF (3
x 10 mL), diethyl ether (3 x 20 mL), dried in vacuo and collected to yield 569.1 mg (1.143
mmol, 77 %) of 2. X-ray quality crystals were grown by vapor diffusion of diethyl ether into a
52

methylene chloride solution of 2. Anal. Calc'd for C16Hj 8Br2FeN40: C, 38.59; H, 3.64; N, 11.25.
Found: C, 38.39; H, 3.34; N, 11.06. ESI-MS (MeCN, m/z): 417.0 (calc'd [M-Br]+: 417.0), 699.2
(calc'd [M+BIPhMe-Br]+: 699.1). 'H NMR (400 MHz, CDCl 3, ppm): 2.82 (br), 9.72 (s), 11.03
(s), 23.09 (br), 23.36 (s), 33.59 (s), 38.54 (s). FT-IR (KBr, cm'1): 3153 (w), 3143 (w), 3120 (m),
3056 (w), 3005 (w), 2954 (w), 2833 (w), 1709 (w), 1691 (w), 1603 (m), 1542 (m), 1498 (s),
1468 (m), 1448 (s), 1398 (w), 1349 (w), 1322 (w), 1284 (s), 1225 (w), 1212 (w), 1174 (m), 1145
(in), 1089 (m), 1070 (s), 988 (s), 939 (w), 898 (s), 759 (s), 723 (s), 702 (s), 645 (m), 627 (w), 556
(w), 511 (w), 465 (w). 57M6ssbauer (mm/s) (80 K, 6 mm/s, AEQ mm/s, F mm/s): 0.901(2),
3.322(2), 0.255(2).
-N
-\ N
_N
3
Co(BIPhMe)C 2, 3. To a 20 mL vial anhydrous CoCl 2 (212.0 mg, 1.633 mmol) and BIPhMe
(460.0 mg, 1.629 mmol) was added. The mixture was dissolved in a mixture of tetrahydrofuran
(12 mL) and methylene chloride (4 mL). The solution was stirred for 1 h, resulting in a deep blue
precipitate. The precipitate was collected by filtration, washed with tetrahydrofuran (2 x 5 mL)
and diethyl ether (3 x 20 mL), and dried in vacuo to afford 619.6 mg (1.503 mmol, 92 %) of 3.
X-ray quality crystals of 3 were grown by vapor diffusion of diethyl ether into an acetonitrile
solution. Anal. Calc'd for C16HI 8Cl2CoN40: C, 46.62; H, 4.40; N, 13.59. Found: C, 46.28; H,
4.15; N, 13.39. ESI-MS (MeCN, m/z): 376.1 (calc'd [M-Cl]+: 376.1), 658.3 (calc'd
[M+BIPhMe-Cl]+: 658.2). 'H NMR (400 MHz, CDCl 3, ppm): 9.12 (s, 1H), 10.56 (s, 2H), 13.08
53

(s, 3H), 17.75 (s, 6H), 19.70 (br, 1H), 33.78 (s, 2H), 37.93 (br, 2H). FT-IR (KBr, cm-'): 3143
(w), 3116 (m), 3056 (w), 2999 (w), 2956 (m), 2928 (w), 2889 (w), 2823 (w), 1679 (w), 1594 (w),
1533 (w), 1493 (s), 1461 (m), 1446 (s), 1393 (w), 1348 (w), 1317 (w), 1283 (s), 1222 (m), 1207
(w), 1182 (m), 1168 (m), 1142 (m), 1085 (s), 1066 (s), 1031 (w), 985 (s), 949 (w), 932 (w), 891
(s), 841 (w), 755 (s), 719 (s), 702 (s), 642 (m), 554 (w), 508 (w), 461 (w). UV-Vis (MeCN, nm,
s, M1cm1): 531 (155 4), 555(259 5), 611(422 5), 631(490 4).
-N
NN
4
Co(BIPhMe)1 2, 4. To a 50 mL Erlenmeyer flask, anhydrous CoI2 (325.5 mg, 1.041 mmol) and
BIPhMe (306.6 mg, 1.083 mmol) was added. The mixture was dissolved in a mixture of
tetrahydrofuran (20 mL) and methylene chloride (2 mL). The solution was stirred for 1 h,
resulting in a green solution. Pentanes (30 mL) were added to precipitate the product as a green
microcrystalline solid. The precipitate was filtered, washed with pentanes (3 x 10 mL), and dried
under vacuum for 5 h, affording 579.8 mg (0.973 mmol, 93 %) of 4. X-ray quality crystals of 4
were grown by vapor diffusion of diethyl ether into the methylene chloride solution. Anal.
Calc'd for C16 Hi8I 2CoN40: C, 32.29; H, 3.05; N, 9.41. Found: C, 31.98; H, 2.81; N, 9.32. ESI-
MS (MeCN, m/z): 750.2 (calc'd [M+BlPhMe-I]+: 750.1), 468.0 (calc'd [M-I]+: 468.0), 579.6
(calc'd [M-CH3]: 579.9), 126.8 (calc'd [I]f: 126.9). 'H NMR (400 MHz, CDCl 3, ppm): 9.60 (s,
1H), 11.20 (s, 2H), 17.01 (s, 2H), 22.30 (s, 6H), 28.13 (br, 1H), 34.64 (s, 2H). FT-IR (KBr,
cm-'): 3162 (w), 3130 (m), 3079 (w), 2973 (w), 2928 (w), 2898 (w), 2863 (w), 2829 (w), 1649
(w), 1550 (w), 1505 (s), 1449 (m), 1408 (w), 1355 (w), 1285 (s), 1224 (m), 1150 (s), 1090 (m),
54

1072 (in), 1031 (s), 992 (in), 938 (w), 900 (in), 762 (s), 725 (s), 704 (in), 637 (s), 572 (m), 517
(m), 472 (w). UV-Vis (MeCN, nm, s, MIVcm'): 310 (2123 105), 373 (1506 69), 583 (289
16), 607 (424 21), 639 (596 28), 668 (449 22).
0
N C
FNN F .C
5
[Fe(BIPhMe) 2(NO)C][Fe(NO)CI 3], 5. In a 20 mL vial, 1 (58.2 mg, 0.143 mmol) was dissolved
in methylene chloride (2 mL). The reaction vessel was capped with a rubber septum and NO (g)
(7.5 mL, 0.30 mmol) was injected under vigorous stirring. The solution instantly turned from
colorless to dark green. The solution was stirred for an additional 1 h and filtered through glass
microfiber filter paper. X-ray quality crystals of the product were formed upon vapor diffusion of
diethyl ether over the course of 2 days. These dark green crystals were collected by filtration and
washed with diethyl ether (3 x 5 mL), resulting in a yield of 41.6 mg (47.4 pmol, 33%) of 5.
Anal. Calc'd for C32H36Cl4Fe2NioO4: C, 43.77; H, 4.13; N, 15.95. Found: C, 43.42; H, 4.34; N,
16.13. ESI-MS (MeCN, m/z): 655.2 ([CAT-NO]+, calc'd 655.2), 125.8 ([AN-NOCl] , calc'd
125.9), 160.6 ([AN-NO]-, calc'd 160.8). FT-IR (KBr, cm'): 3121 (in), 3054 (w), 2958 (m),
2928 (m), 2829 (w), 1792 (vNO), 1709 (VNO), 1656 (s), 1606 (w), 1542 (w), 1498 (s), 1468 (w),
1448 (in), 1400 (w), 1351 (w), 1322 (w), 1282 (s), 1226 (w), 1171 (m), 1143 (m), 1089 (m),
1072 (s), 1032 (w), 988 (s), 935 (w), 898 (s), 761 (s), 723 (s), 702 (s), 644 (m), 510 (w), 466 (w).
UV-Vis (MeCN, nm, s, M 1 cm1): 363 (850 40), 473 (340 30), 699 (220 10).
55

0
/ N\ r Ir
N
- -N__ N ~ r J\N /Sr r
6
[Fe(BIPhMe) 2(NO)BrJ[Fe(NO)Br 3J, 6. In a 20 mL vial, 2 (20.4 mg, 0.0371 mmol) was
dissolved in methylene chloride (2 mL). The reaction vessel was capped with a rubber septum
and NO (g) (3.7 mL, 0.15 mmol) was injected under vigorous stirring. The solution instantly
turned from colorless to dark red. The solution was stirred for an additional hour and filtered
through a piece of glass microfiber filter paper. Dark red crystals were grown by vapor diffusion
of diethyl ether into the methylene chloride solution, collected by filtration, and washed with
diethyl ether (3 x 5 mL), resulting in a yield of 7.2 mg (6.8 pimol, 18%) of 6. Anal. Calc'd for
C 3 2H36Br4Fe2NloO4 : C, 36.40; H, 3.44; N, 13.26. Found: C, 36.55; H, 3.57; N, 13.33.ESI-MS
(MeCN, m/z): 701.1 ([Cat-NO]+, calc'd 701.2), 213.6 ([An-NOBr]~, calc'd 213.8), 296.5
([An-NO]-, calc'd 296.7). FT-IR (KBr, cm'): 3120 (in), 3061 (w), 3006 (w), 2955 (in), 2928
(m), 2829 (m), 1791 (vNO), 1705 (vNO), 1656 (m), 1597 (w), 1542 (w), 1497 (s), 1468 (m), 1448
(m), 1399 (w), 1350 (w), 1322 (w), 1282 (s), 1226 (w), 1208 (w), 1171 (m), 1143 (m), 1089 (m),
1071 (s), 1032 (w), 988 (s), 935 (w), 897 (s), 761 (s), 723 (s), 702 (m), 645 (m), 557 (w), 510
(w), 466 (w). UV-Vis (MeCN, nm, &, MIvcm-'): 370 (2780 200), 490 (750 L 30), 701 (360
20).
56

N
Fe/,,.0N 0\
-- N N-
0
7
Synthesis of Fe(BIPhMe)(N0 3)2CI, 7. In a 20 mL vial, 1 (20.0 mg, 0.0489 mmol) was
dissolved in methylene chloride (2 mL). The reaction vessel was capped with a rubber septum
and N0 2 (g) (3.7 mL, 0.15 mmol) was injected under vigorous stirring. The solution instantly
turned from colorless to yellow. The solution was stirred for an additional hour and filtered
through a piece of glass filter paper in a Pasteur pipette. X-ray quality crystals of the product
were formed upon vapor diffusion of diethyl ether over the course of 2 days. The crystals were
collected by filtration and washed with diethyl ether (3 x 5 mL), resulting in a yield of 9.7 mg
(0.0 18 mmol, 37 %) of 7. Anal. Calc'd for C16 HI8C1FeN6 O 7: C, 38.62; H, 3.65; N, 16.89. Found:
C, 38.79; H, 3.81; N, 16.90. ESI-MS (MeCN, m/z): 682.2 (calc'd [M+BIPhMe-NO 3-Cl]:
682.2), 655.2 (calc'd [M+BlPhMe-2NO 3]: 655.2). FT-IR (KBr, cm-1): 3120 (m), 3058 (w),
2997 (w), 2954 (m), 2931 (m), 2824 (w), 1653 (w), 1546 (w), 1493 (s), 1467 (s), 1448 (m), 1384
(in), 1352 (in), 1282 (w), 1227 (w), 1208 (m), 1169 (w), 1153 (w), 1132 (in), 1090 (in), 1073
(m), 1032 (w), 987 (in), 949 (w), 936 (w), 900 (s), 846 (in), 761 (s), 722 (s), 702 (s), 644 (w),
556 (w), 511 (w). UV-Vis (MeCN, nin, c, M- 1cm 1): 335 (570 40).
57

N
N '-OBr-- N
0
8
Synthesis of Fe(BIPhMe)(NO 3)2Br, 8. In a 20 mL vial, 2 (20.0 mg, 0.0489 mmol) was
dissolved in methylene chloride (2 mL). The reaction vessel was capped with a rubber septum
and N0 2(g) (3.7 mL, 0.15 mmol) was injected under vigorous stirring. The solution instantly
turned from colorless to yellow. The solution was stirred for an additional hour and filtered
through a piece of glass filter paper in a Pasteur pipette. The crystals were collected by filtration
and washed with diethyl ether (3 x 5 mL), resulting in a yield of 9.7 mg (0.0 18 mmol, 37 %) of
8. Anal. Calc'd for C16H18ClFeN6O 7: C, 38.62; H, 3.65; N, 16.89. Found: C, 38.79; H, 3.81; N,
16.90. ESI-MS (MeCN, m/z): 701.1 (calc'd [M+BIPhMe-2NO 3]*: 701.1), 682.1 (calc'd
[M+BlPhMe-NO 3-Br]+: 682.2). FT-IR (KBr, cm'1): 3129 (in), 3062 (w), 2997 (w), 2954 (in),
2929 (in), 2829 (w), 1635 (w), 1545 (w), 1495 (s), 1468 (m), 1448 (in), 1384 (s), 1353 (s), 1282
(s), 1169 (in), 1154 (m), 1134 (in), 1090 (m), 1072 (s), 1032(w), 897 (in), 932 (w), 899 (s), 834
(m), 760 (s), 721 (s), 702 (m), 634 (w), 555 (w), 511 (w). UV-Vis (MeCN, nm): 290 (5800
300), 360 (3500 220).
Reaction of Co(BIPhMe)C 2 and NO2(g). In a 20 mL vial 3 (27.7 mg, 0.0672 mmol) was
dissolved in methylene chloride (2 mL). The reaction vessel was capped with a rubber septum
and NO2 (g) injected until no further color change was observed. The solution turned from deep
blue to dark green. The solution was stirred for 1 h and subsequently filtered through glass
microfiber filter paper. The product was precipitated by addition of diethyl ether (10 mL),
collected by filtration, and dried under vacuum. The final product was a dark green solid and the
58

collected yield was 17 mg. The exact structure of the product is currently unknown. ESI-MS
(m/z): 660.7 (calc'd [Co(BIPhMe) 2H2ClI]: 660.2); 685.4 (calc'd [Co(BIPhMe) 2NO3]*: 685.2);
780.3 (calc'd [Co2(BIPhMe)(NO 3)HCl]: 780.1). FT-IR (KBr, cm-'): 3122 (m), 3058 (w), 2997
(w), 2935 (in), 2830 (w), 1652 (w), 1501 (s), 1471 (in), 1448 (s), 1385 (in), 1314 (s), 1286 (s),
1169 (s), 1149 (s), 1090 (in), 1072 (s), 1033 (w), 992 (s), 960 (w), 899 (s), 819 (in), 760 (s), 721
(s), 703 (s), 644 (in), 556 (w), 510 (w).
Reaction of Co(BIPhMe)1 2 and NO (g). In a 20 mL vial, 4 (44.5 mg, 0.0748 mmol) was
dissolved in tetrahydrofuran (2 mL). The reaction vessel was capped with a rubber septum and
NO (g) injected until no further color change was observed. The solution turned from emerald
green to dark green. The solution was stirred for 1 h and subsequently filtered through glass
microfiber filter paper. The product was precipitated by addition of diethyl ether (10 mL),
collected by filtration, and dried under vacuum. The final product was a dark green solid and the
collected yield was 38 mg. The exact structural nature of the product is currently unknown. ESI-
MS (m/z): 668.2 (calc'd [Co(BIPhMe) 2(NO)2]*: 668.2); 371.1 (calc'd [Co(BIPhMe)(NO)]':
371.1); 341.1 (calc'd [Co(BIPhMe)]+: 341.1); 439.6 (calc'd [CoI3]~: 439.6); 380.5 (calc'd [13] :
380.7); 312.6 (calc'd [CoI2]~: 312.7). FT-IR (KBr, cm~'): 3112 (in), 3058 (w), 3002 (w), 2993
(m), 2863 (w), 2826 (w), 1866 (s), 1818 (s), 1748 (s), 1748 (s), 1596 (w), 1542 (in), 1503 (s),
1447 (s), 1404 (in), 1319 (w), 1283 (s), 1226 (w), 1184 (in), 1170 (m), 1134 (w), 1088 (m), 1071
(s), 1031 (w), 986 (in), 934 (w), 897 (s), 759 (s), 721 (s), 701 (s), 645 (w), 626 (w), 556 (w), 509
(w), 468 (w).
59

0 N 0N0-
> N CotNO
9
Synthesis of Co(BIPhMe)(NO 3)2, 9. In a 20 mL vial, 4 (37.5 mg, 0.0630 mmol) was dissolved
in methylene chloride (2 mL). The reaction vessel was capped with a rubber septum and NO 2 (g)
injected until no further color change was observed. The solution turned from emerald green to
purple-red. The solution was stirred for 1 h and filtered through glass microfiber filter paper. X-
ray quality crystals of the product were formed upon vapor diffusion of diethyl ether over the
course of one week. The crystals were collected by filtration and washed with diethyl ether (3 x 5
mL), resulting in a yield of 6.1 mg (0.0131 mmol, 21 %) of 9. Anal. Calc'd for C16H18C1FeN6O 7:
C, 38.62; H, 3.65; N, 16.89. Found: C, 38.79; H, 3.81; N, 16.90. ESI-MS (m/z): 685.4 (calc'd
[M+BlPhMe-NO 3]: 685.2). FT-IR (KBr, cm-1): 3128 (in), 3058 (w), 2993 (w), 2932 (in), 2824
(w), 1597 (w), 1500 (s), 1448 (s), 1384 (in), 1315 (s), 1284 (in), 1164 (s), 1089 (m), 1070 (s),
1032 (w), 990 (in), 958 (w), 898 (m), 856 (w), 819 (in), 758 (s), 720 (s), 702 (s), 644 (w), 556
(w), 510 (w).
NO (g)/N0 2 (g) reactions monitored by UV-Vis spectroscopy. Solutions of 1 - 4 (102 - 1120
pLM) in acetonitrile were prepared in the glove box, removed, and placed into the Cary 50 UV-
Vis spectrometer. After an initial scan, a syringe of 500 AL gas was injected, and the cuvette
shaken for 10 - 20 sec, and returned into the spectrometer. Scans were collected every 30 sec for
the first 10 min, 1 min for the next 20 min, and every 5 min for the final 90 min.
Sensor loaded filter paper NO/NO 2 test strips. Strips of filter paper were dipped into separate
methylene chloride solutions of 1 - 4 (30 - 50 mM). The methylene chloride was allowed to
60

evaporate. These integrated filter paper strips were placed in 20 mL vials that were sealed with a
septum. NO (g) or NO 2 (g) (1 mL) was injected into the vial and color changes were observed
instantly and recorded.
Sensor loaded silica TLC NO/NO 2 test strips. Methylene chloride solutions of 1 - 4 (30 - 50
mM) were spotted onto TLC plates and the methylene chloride was allowed to evaporate. These
TLC plates were placed in a 20 mL vial and the vial was sealed with a septum. NO (g) or NO 2
(g) (1 mL) was injected into the vial and color changes were observed within 1 min.
Sensor loaded silica syringe NO/NO2 headspace gas analyzers. Solutions of 1 - 4 (30-50 mM)
in methylene chloride were loaded onto 250 - 300 mg of silica gel and dried under vacuum. The
integrated silica gel was poured into 1 mL plastic syringes fitted with 16 gauge stainless steel
needles. NO (g) or NO 2 (g) was pulled into the syringe headspace and color changes were
observed instantly.
3.3 Results and Discussion
Synthesis and spectroscopic of BIPhMe starting complexes. The BIPhMe ligand was
previously used to impart preorganization of two cis-histidine donors within diiron-carboxylate
complexes." We originally intended to use this ligand to prepare models of Rieske-type
[2Fe-2S], but no successful synthetic route was found to install this ligand onto a prepared
[2Fe-2S] cluster. While trying to develop starting materials for these Rieske-models, a variety of
metal halide complexes were prepared.
Compounds 1 - 3 are fairly insoluble in THF whereas their starting materials are soluble.
This property allows for easy preparation and purification of the target complexes. Addition of
BIPhMe to the metal halide solution affords rapid precipitation of microcrystalline material.
Stirring for an additional hour was performed to allow for completion and improve overall
61

yields. Purification of compounds 1 - 3 was performed by washing with additional THF and
Et2O and subsequently drying under vacuum.
The 'H NMR spectrum of 1 has eight peaks and the spectrum of 2 has seven (Figure 2.2).
All of these peaks are shifted downfield from the spectrum of BIPhMe. The peaks are fairly
similar to one another. The differences are that, in the spectrum of 1, there are peaks at 1.86 ppm
and 3.76 ppm, whereas in the spectrum of 2 there is a single broad peak at 2.83 ppm. This result
suggests that the two peaks at for 1 maybe be related and are collapsed into a single broad peak
in 2, which is why 1 has an additional peak. The other difference between the two spectra is that
the broad peak at 21.81 ppm and the sharp peak at 18.83 ppm in the spectrum of 1 shift
downfield and overlap in the spectrum of 2.
40 35 30 25 20 15 10 5 0
1(0ID0) (~ C)
c ()p 9(1
40 35 30 25 20 15 10 5 0
9 8 7 6 5 4 3 2 1 0fi (ppm)
Figure 2.2. 'H NMR spectra of 1 (black), 2 (red), and BIPhMe (green) in CDCl 3 collected at 400MHz. The spectra are references to the residual CHCl 3 peak at 7.29 ppm
62

Complex 1 was observed in a MALDI-TOF experiment using recrystallized anthracene
as the matrix (Figure 2.3). We were also able to observe 1 and 2 losing a halide in the ESI-MS
experiment using acetonitrile as the carrier solvent. During the ESI-MS experiment we also
observed the binding of an additional BIPhMe ligand to iron. Since there was not a second set of
peaks in the H NMR experiment, we doubt that an equilibrium exists in solution where
dissociation and binding of an additional BIPhMe ligand occur.
360 370 380 390 400 410 420 60 695 700 706 710
m/z m/z
Figure 2.3. Left: MALDI-TOF spectrum of 1 using anthracene as the matrix. Right: Positivemode ESI-MS spectrum of [2+BIPhMe-Br] using acetonitrile as the carrier solvent. Colorscheme: black, experimental; red, simulated.
Preparation of pure 4 is not as simple owing to its high solubility in THF, requiring the
addition of a 1.5 equivolume of pentanes to precipitate the intended product. The compound was
washed with pentane to remove any residual solvent and subsequently dried under vacuum.
In the 'H NMR spectrum of 3, seven peaks are present, whereas we only observe six
peaks in the spectrum of 4 (Figure 2.4). The BIPhMe peaks are all shifted downfield as in the
iron complexes. The farthest downfield peak for 3 occurs at 37.95 ppm, but this resonance is not
observed in the spectrum of 4. We hypothesize that the peak has been broadened enough to be
observed under these experimental conditions.
63

4 e OD C 2 0 OD (D
(3) 4))C
(2) 2) 0
40 36 32 28 24 20 1'6 12
C C I
40 36 32 28 24 20 16 12 8fi1(ppm)
Figure 2.4. 'H NMR spectra of 3 (black) and 4 (red) in CDCl 3 collected at 400 MHz.
As in the ESI-MS spectra of the iron containing compounds, 3 and 4 show peaks
corresponding to the complexes minus a halide (Figure 2.5). These spectra also have peaks that
correspond to the binding of an additional BIPhMe ligand to the complex. The 'H NMR spectra
of 3 and 4 do not suggest that a bis-BIPhMe complex exists in solution.
658.3 20 750.2 .2
100 2030 0 50 30 800.3 30D 400 500 $D0 708 0 8 am 0 No 000 Mo
Figure 2.5. Positive mode ESI-MS spectra of 3 (left) and 4 (right) using acetonitrile as thecarrier solvent. Peak assignments (m/z): 376.1 ([3-Cl]+, calc'd 376.1); 658.3 ([3+BlPhMe-Cl]+,calc'd 658.2); 750.2 ([4+BIPhMe-I]+, calc'd 750.1); 468.0 ([4--I], calc'd 468.0).
X-ray crystallographic characterization of BIPhMe starting complexes. Crystallization of
compound 1 resulted in two different structures, a mononuclear complex and two chloro-bridged
dimers co-crystallized with two molecules of methylene chloride (Figure 2.6). Both crystals were
64
2-
261A 376.1I " ' 3783 78.31.
468.0
251 1IU
3112 W888
!123
138.2

grown by vapor diffusion of diethyl ether into a methylene chloride solution of the compound at
ambient temperature. Crystals of the mononuclear species form as colorless rods while the dimer
complex forms colorless block crystals. The mononuclear species contains a pseudo-tetrahedral
iron with a Cl-Fe-Cl angle of 119.778(14)0 and Fe-Cl bond distances of 2.2405(4) A and
2.2638(4) A (Table 2.1).
The chloride-bridged dimer has two pseudo-square pyramidal iron centers with axial
chlorides. The average Cl-Fe-Cl angles are 82.134(1 1)', 98.476(13)0, and 110.630(15)0. The
average Fe-Cl bond distances are 2.4336(4) A and 2.5025(4) A for the bridging chlorides, and
2.2931(4) A for the axial chloride. The average Fe-Cl-Fe angles are 97.124(13)0 and
98.369(13)'. The average N-Fe-N bond angle is more acute in the dimer, 83.18(4)0, compared
to the mononuclear complex, 86.53(4)0, resulting in elongation of the Fe-N bond by more than
0.5 A. Compound 2 also crystallizes as a pseudo-tetrahedral complex (Figure 2.7) with a
Br-Fe-Br bond angle of 118.618(13)' and Fe-Br bond distances of 2.3800(3) A and 2.4058(3)
A.
12
C14
N6
N6 C13
NN Fel
Fe2 N
C2 N21C12
Figure 2.6. Drawings of the X-ray crystal structures of 1, mononuclear (top) and dimer (bottom),with ellipsoids shown at 50% probability. Solvent molecules and hydrogen atoms are omitted forclarity. Color scheme: iron, orange; chloride, dark green; nitrogen, blue; oxygen, red; carbon,colorless.
65

Br1
Br2
NI Fel
N6
Figure 2.7. Drawing of the X-ray crystal structure of 2 with ellipsoids shown at 50% probability.Hydrogen atoms are omitted for clarity. Color scheme: iron, orange; bromide, dark red; nitrogen,blue; oxygen, red; carbon - colorless.
Table 2.1. Selected geometrical parameters of 1 - 4.Compound M-N, (A) N-M-N, (0) M-X, (A) X-M-X, (o) N-M-X, (o)Fe(BIPhMe)Cl2 , 1 2.0601(10) 86.53(4) 2.2405(4) 119.778(14) 111.81(3)
2.0644(10) 2.2638(4) 116.57(3)109.9 1(3)107.32(3)
Fe2 (u-CI) 2(BIPhMe) 2Cl2 , 2.1162(11) 83.18(4) Axial: 82.134(11) 89.58(3)average values of equivalent atoms 2.1314(11) 2.2931(4) 98.476(13) 91.20(3)
Bridge: 110.630(15) 99.33(3)2.4336(4) 115.70(3)2.5025(4) 133.65(3)
162.06(3)Fe(BIPhMe)Br 2, 2 2.0539(16) 86.75(6) 2.3800(3) 118.618(13) 108.09(4)
2.0612(16) 2.4058(3) 110.44(4)110.55(4)117.88(4)
Co(BIPhMe)C 2, 3 1.9996(10) 91.13(4) 2.2269(4) 114.903(14) 108.32(3)1.9961(11) 2.2494(4) 110.51(3)
112.36(3)117.18(3)
Co(BIPhMe)I2, 4 1.990(4) 90.93(15) 2.5510(8) 113.62(3) 106.28(10)1.991(4) 2.5594(8) 106.14(11)
118.48(11)120.01(11)
66

Table 2.2. X-ray crystallographic data for mononuclear 1, chloro-bridged dimer 1, and 2 atlOOK.
compounds Fe(BIPhMe)C 2, Fe2 (u-Cl)2(BIPhMe) 2C 2 Fe(BIPhMe)Br2 ,1 -2CH2C12, 1 2
formula C16HISC12FeN40 C 37H38Cl6Fe2NgO 2 C16HIBr2FeN40formula weight 409.09 903.12 498.01crystal system monoclinic monoclinic monoclinicspace group P21/n P2 1/n P2 1/na, A 10.2647(5) 16.4602(8) 10.4213(4)b, A 14.0114(8) 18.1395(9) 14.3580(5)c, A 13.2275(7) 25.8784(13) 13.3271(5)P, deg 104.5200(10 93.9280(10) 104.8480(10)v, A3 1841.65(17) 7708.6(7) 1927.54(12)Z 4 8 4
pMUj, g/cm 3 1.475 1.556 1.716p, mm-1 1.119 1.211 4.9380 range, deg 2.15 to 30.91 1.37 to 30.79 2.12 to 31.16completeness to 0, % 96.1 99.2 92.7reflections collected 39933 180470 27105independent reflections 5589 23955 5782R(int) 0.0302 0.0335 0.0270restraints 0 0 0parameters 220 931 220Max., min. transmission 0.7461, 0.6798 0.7461,0.6556 0.7462, 0.5320R1(wR2) [I>2a(I)] 0.0269 (0.0758) 0.0285 (0.0736) 0.0248 (0.0698)R1(wR2) 0.0338 (0.0782) 0.0385 (0.0779) 0.0329 (0.0718)GoF(F2) 1.397 1.457 1.304max, min peaks, e.A 3 0.495, -0.226 0.760, -0.890 0.965, -0.368
Compounds 3 and 4 both crystallize as pseudo-tetrahedral mononuclear complexes
(Figure 2.8). Compound 3 has a Cl-Co-Cl bond angle of 114.903(14)0 and Co-Cl bond
distances of 2.2269(4) A and 2.2494(4) A. Compound 4 has a I-Co-I bond angle of 113.62(3)*
and Co-I bond distances of 2.5510(8) A and 2.5594(8) A. The N-M-N bond angles of these
cobalt complexes are larger by ~5* compared to the iron analogues.
67

C12 Cli
Col
N6 N1
N6 N1
Col
12 1
Figure 2.8. Drawings of the X-ray crystal structures of 3 and 4 with ellipsoids shown at 50%probability. Solvent molecules and hydrogen atoms are omitted for clarity. Color scheme: cobalt,light blue; chloride, dark green; iodine, purple; nitrogen, blue; oxygen, red; carbon, colorless.
Table 2.3. X-ray crystallographic datacompoundsformula
formula weightcrystal systemspace groupa, Ab, Ac, AP, degv, A3
zPcalcd, g/Cm 3
J, mm~1
0 range, degcompleteness to 0, %reflections collectedindependent reflectionsR(int)restraintsparametersMax., min. transmissionR1(wR2) [I>2a(l)]R1(wR2)GoF(F 2)max, min peaks, e.- 3
for 3 and 4 at lOOK.Co(BIPhMe)C2, 3
C 16H18Cl 2CoN40412.17monoclinicP21/n10.2452(5)13.9041(6)13.2165(6)104.3620(10)1823.86(14)41.5011.2442.16 to 30.9395.73935155150.030902200.7462, 0.66180.0265 (0.0733)0.0324 (0.0755)1.5770.420, -0.301
Co(BIPhMe) 2, 4
C 16HI 8CoI 2N 40595.07monoclinicP2 1/n10.7833(18)13.324(2)14.141(2)100.339(3)1998.8(6)41.9773.9582.12 to 27.1999.83504444280.073502200.7455, 0.61370.0347 (0.0549)0.0530 (0.0571)1.5361.012, -0.712
68

Reactions of Fe(BIPhMe)C 2 and Fe(BIPhMe)Br 2 with NO (g) and NO 2 (g). The reaction of
colorless 1 with NO (g) results in the formation of the MNICs [Fe(BIPhMe) 2(NO)Cl]+ and
[Fe(NO)Cl3] , 5. The reaction occurs rapidly in methylene chloride, acetonitrile, and methanol,
and forms a dark green solution. The UV-Vis spectrum (Figure 2.9) shows absorption bands at
363 nm, 473 nm, and 699 nm. The band at 363 nm is ascribed to [Fe(NO)Cl3]~ based on the
published literature value of 360 nm.20 The two bands at 473 nm and 699 nm are assigned to the
octahedral [Fe(BIPhMe)2(NO)Cl]+ cation. These values are similar to the absorption bands of the
published complex [Fe(TPA)(O 2CCH3)(NO)]+, which are 430 nm and 650 nm and have
extinction coefficients of 730 M1cm' and 150 M cm', respectively. 21
3600
1250
3000 370
1000 3632400-
750la0
500 473
3699 1200
Goo 490
701
01
300 400 500 600 700 600 300 400 S00 600 700 a00
Wavelength (nm) Wavelength (nm)
Figure 2.9. UV-Vis spectra of 1 (left) and 2 (right) and their NO (g) products. Color scheme:black, starting; red, nitrosylated product.
The formation of these bands allows for 1 to be used as a quantitative and qualitative
assay to measure NO (g) release into the reaction headspace. Using complex 1 in this manner
was very instrumental in the elucidation of reaction products of SNO~ with protons and metal
centers reported in chapters 3 and 4. A solution of 1 could be prepared and set up to share the
headspace of a reaction that may evolve NO (g) and subsequently convert 1 into 5. This
conversion could be qualitatively observed by the formation of a green solution from a colorless
starting solution (Figure 2.10). This reaction could be qualitatively observed with less than 2
69

pmol of NO (g) added. To quantify the conversion, the solution of 1/5 could then be transferred
to a volumetric flask and appropriately diluted to measure the absorbance. Because 1 does not
absorb at 363 nm, 473 nm, or 699 nm, there is no interference with quantification of the
formation of 5.
O mL 0 pL <OpL
< 50 pL < 50 pL < 50 pL
< 100 pL < 100 pL <100 pL
< 200 pL
< 500 pL < 500 pL< 500 pL
< 1000 pL < 1000 pL* 1000 pL
< 2000 pL < 2500 pL < 2500 pL
Figure 2.10. Solutions of 1 (left; 24 mM), 2 (middle; 32 mM), and 4 (right; 35 mM) inmethylene chloride that were exposed to varying amounts of NO (g).
The IR spectrum of 1 shows two bands at 1709 cm'1 and 1792 cm-1 (Figure 2.11)
assigned as VNO. Upon reaction with 15NO these bands shift to 1681 cm-1 and 1757 cm-1, which
are close to the calculated values of 1678 cm' and 1760 cm- 1. The vNO band at 1792 cm-1 is
assigned to [Fe(NO)Cl 3] based on literature published values of 1777 cm-', 1794 cm', and
1806 cm-1. 20,22,3 The vNo band at 1709 cm' is attributed to the complex [Fe(BIPhMe) 2(NO)Cl]*,
which is comparable to the published vNO value of 1720 cm' and 1690 cm-1 for the related
70

octahedral complexes cis-[Fe(cyclam)(NO)Cl]+ and [Fe(Me 3-TACN)(N3)2(NO)],
respectively.24,25
1792 1791 .1770
200 2600 2000 10 U0 00 00 2 2000 110 100
Wavenumbers (cm') Wavenumbers (cm')
Figure 2.11. FT-IR spectra of 5 (left) and 6 (right) with NO.
The positive-mode ESI-MS spectrum of 5 (Figure 2.12) shows peaks that match the
isotopic distribution of [Fe(BIPhMe) 2Cl]+ at 655.2 m/z. The negative-mode ESI-MS of 5 has two
sets of peaks that correspond to [FeCl 3] and [FeCl2] at 162.6 m/z and 125.8 m/z, respectively.
The loss of the nitrosyl ligands was anticipated based on the observed ESI-MS spectra of the
{Fe-S-NO} clusters described in chapter 2, where loss of multiple nitrosyls from the parent
complex was observed during the ESI-MS experiment.
71

Irt , -+AS 03in l
655.2
3
2 251.0
2300 3a. 339.1 37-
1 .L
85
| 156.7197.5
141.7 18A 11.285 217.24.5 2675
0.0 _! .. " ... .. 1 4 I .5 A ,. I100 120 140 10 180 280 220 240 280 2M 0 300 wrl
Figure 2.12. Positive-mode (top) and negative-mode (bottom) ESI-MS spectra of 5 inacetonitrile. Peak assignments (m/z): 655.2 ([Fe(BIPhMe) 2Cl]*, calc'd 655.2); 162.6 ([FeCl 3] ,calc'd 162.8); 125.8 ([FeCl2 ] , calc'd 125.8).
The reaction of 2 with NO (g) forms a similar product,
[Fe(BIPhMe)2(NO)Br][Fe(NO)Br 3], 6. The UV-Vis spectrum of 6 shows bands at 370 nm, 490
nm, and 701 nm (Figure 2.10). The IR spectrum of 6 (Figure 2.11) shows VNO bands at 1705
cmf and 1791 cm-'. The ESI-MS spectrum (Figure 2.13) shows isotopic patterns for
[Fe(BIPhMe) 2Br]+, [FeBr3] , and [FeBr2] at 701.1 m/z, 296.5 m/z, and 252.6 m/z, respectively.
72

ntns +MS, 0.3min FE
701.1 701.1
2.5j
2510
0.M.2
1.50
*5 210 '.
att. 96.e. 0 700. .5
0. 20 30 0 350 410.950 S5 O 60 70 o
001 250 300-M. 0.3mm
12524
0.01 2 23213.6
160.7 33t. 3 75.41it 2W0 225 250 275 300 V20 25 46 M4t
Figure 2.13. Positive-mode (top) and negative-mode (bottom) ESI-MS spectra of 6 inacetonitrile. Peak assignments (mlz): 701.1 (IiFe(BIPhMe)2Br]+, calc'd 701.2); 296.5 ([FeBr3]-,calc'd 296.7); 213.6 ([FeBr2 f-, calc'd 213.8).
Crystals of 5 were obtained by vapor diffusion of diethyl ether into a methylene chloride
solution of the compound over the course of two days. The crystal structure of 5 contains a bent
MNIC, [Fe(BIPhMe) 2(NO)Cl]+, and a linear MNIC, [Fe(NO)Cl]- (Figure 2.14). The Fe-N-O
angle of the bent, octahedral complex is 148.9(3)0 and the N-O bond distance is 1.102(3) A. The
Fe-N-O angle in the linear, tetrahedral complex is 170.6(3)* and it has an N-O bond distance of
1.153(3) A. These values match the published values of 177(1)0 and 1.12(2) A.26 To verify that
the anion was actually [Fe(NO)C 3]~ instead of [FeC 4 ]-, the NO ligand was replaced with
chloride during the structure refinement. This substitution resulted in the thermal ellipsoid of the
substituted chloride being elongated along the Fe-Cl bond, showing that the electron density of
73

the appropriate ligand is spread linearly along the bond axis and that a linear NO ligand was the
correct assignment. The final structure solution does contain residual electron density 1.1 A from
the Fe(10) atom, trans to the N( 11) atom. The geometric parameters of the [Fe(NO)C 3]
complex are similar to the published values confirming our atom assignment and refinement is
true (Table 2.4). Crystals of 6 were obtained and refinement of [Fe(BIPhMe) 2(NO)Br]+
proceeded satisfactorily, but the NO moiety is disordered over multiple positions with the Br
ligands on the [Fe(NO)Br3]~ complex, resulting in an overall unsatisfactory refinement of the
structure.
C11 02
N2 Oil
C112 N11
N6 Fel N26N 1 FelO1
N21
C113
Figure 2.14. Drawing of the X-ray crystal structure of 5 with ellipsoids shown at 50%probability. Hydrogen atoms are omitted for clarity. Color scheme: iron, orange; chloride, darkgreen; nitrogen, blue; oxygen, red; carbon, colorless.
Table 2.4. Selected geometric parameters and vibrational stretches of 5 and related compounds.[Fe(BIPhMe) 2(NO)C]*, 5 [Fe(Me 3TACN)(N 3)2(NO)], [Fe(NO)CI3 ~, 5 [Fe(NO)C1 3 ~,
bond length, (A)Fe-NNO 1.818(3) 1.738(5) 1.738(3) 1.700(10)NNO-O 1.102(3) 1.142(7) 1.153(3) 1.120(20)Fe-Xa 2.4043(8) 2.075(4) 2.2207(11) 2.224(7)
2.032(4) 2.2320(9) 2.258(7)2.2340(9) 2.228(8)
bond angle, (0)
Fe-NNO-O 148.9(3) 155.5(10) 170.6(3) 177.0(1)X-Fe-NNO" 87.50(9) 97.2(3) 109.93(10) 109.8(5)
94.2(3) 109.70(10) 111.0(5)104.69(10) 103.3(5)
vNo, (Cm 1) 1709 1690 1792 1802179423177720
a. X = CI or N3
74

Table 2.5. X-ray crystallographic data for compounds 5 and 7 at lOOK.compounds [Fe(BIPhMe) 2(NO)Cl[FeCl 3(NO), 5 [Fe(BIPhMe)(N0 3)2CI]-0.5CH 2CI2, 7formula C32H36Cl4Fe2NIO 4 C16.5H19Cl2FeN6O7
formula weight 878.21 540.13crystal system monoclinic monoclinicspace group P21/n P21/ca, A 17.7234(6) 9.5411(3)b, A 12.4526(4) 13.6642(5)c, A 20.6292(7) 17.0791(6)P, deg 110.4730(10) 93.3630(10)V, A3 4265.3(2) 2222.79(13)zPcacd, g/cm 3
pa, mm-0 range, degcompleteness to 0, %reflections collectedindependent reflectionsR(int)restraintsparametersMax., min. transmissionR1(wR2) [I>2o(I)]R1(wR2)GoF(F2)max, min peaks, e.A- 3
41.3680.9761.31 to 25.73100.07021881510.062004760.7453, 0.66640.0455 (0.1156)0.0622 (0.1213)1.2322.518, -0.654
41.6140.9701.91 to 30.9495.04763766820.021903100.7461, 0.65630.0369 (0.1315)0.0399 (0.1338)2.0671.048, -1.198
The reaction of 1 with N0 2(g) results in disproportionation to N0 3 and N20, and
formation of the yellow seven-coordinate complex [Fe(BIPhMe)(NO 3)2C1, 7. The UV-Vis
spectrum of 7 (Figure 2.15) has a shoulder at 335 nm with an extinction coefficient of 568 M~ 1
cm~'. The ESI-MS spectrum shows an isotopic distribution that matches values expected for the
complex and an additional bound BIPhMe ligand (Figure 2.17).
75

E
1500.
1200-
900-
600-
300 -
0-
7000.
8000.
5000.
4000.
2000-
1000.
0.
335
290
360
200 300 400 500 600 700 800 300 400 500 600
Wavelength (nm) Wavelength (nm)
Figure 2.15. UV-Vis spectra of 1 (left) and 2 (right) and their N0 2(g) products.black, starting; red, reaction product.
700 800
Color scheme:
4000 3500 3000 2500 2000 1500 1000 500
Wavenumbers (cm")
are 2.16. FT-IR spectra of 7 (left) and 8 (rig
4000 3500 3000 2500 2000 1500
Wavenumbers (cm~')
ht) with N0 2 (g).
Figure 2.17. Positive-mode ESI-MS spectra of 7 (left) and 8 (right) in acetonitrile. Peakassignments (m/z): 655.2 ([Fe(BIPhMe) 2Cl]*, calc'd 655.2); 682.2 ([Fe(BIPhMe) 2(NO3)]*, calc'd682.2); 701.1 ([Fe(BIPhMe) 2Br]4 , calc'd 701.1); 682.1 ([Fe(BIPhMe) 2(NO3)]+, calc'd 682.2).
76
Fig
1000 50
655.2
682.2808240. 84GVI.2'i2
.106
725 " 701.1
100
682.1 77500M 6621
654.0
025. 7332
*0577I8 1h2..diilu..1l78D0
a
I
Nf

B)0 p0 pL
< 2500 pL < 2500 pL
0 pL D) 0 pL
< 2500 pL <2500 pL
Figure 2.18. Solutions of A) 1, B) 2, C) 3, and D) 4 in methylene chloride that were exposed toN0 2(g).
The seven-coordinate iron(III) compound 7 has a pentagonal bipyramid geometry with
the oxygen atoms of the nitrate ligands and one of the nitrogen atoms of the BLPhMe ligand in
the equatorial plane, while the other nitrogen atoms of the BIPhMe ligand and the chloride atom
occupy the apical positions. The Fe-N bond distances involving the BIPhMe ligand are
2.0819(12) A and 2.0882(12) A, and the N-Fe-N bond angle is 85.84(5)0. The Fe-O bond
distances are 2.1357(1 1) A, 2.1439(1 1) A, 2.1860(11) A, and 2.1974(12) A. The intra O-Fe-O
bond angles of the nitrates are 59.43(4)0 and 59.54(4). The inter O-Fe-O bond angles are
76.26(4)0, 135.56(4)0, 135.69(4)0, and 163.81(4)0. The O-Fe-Nq bond angles are 81.75(5)0,
82.41(5)0, 140.71(5)0, and 141.28(5)0. The O-Fe-Nax bond angles are 86.23(5)0, 86.24(4)0,
87.68(4)0, and 87.84(5)0. The Fe-Cl bond distance is 2.2651(4) A. The Cl-Fe-Nax bond angle is
178.03(4)0, the Cl-Fe-Neq bond angle is 95.53(3)0, and the Cl-Fe-O bond angles are 91.08(3)0,
91.80(3)0, 93.58(3)0, and 95.53(3)0. The iron atom is not planar with the equatorial ligands, but
rather puckered towards the chloride ion, as indicated by the Xeq-Fe-Cl angles being greater
than 900. According to a search of the Cambridge structural database, this is the first compound
that has a bidentate N-binding ligand, two bidentate nitrates, and a non-oxygen ligand. The
77
A)

binding motif is similar to the other known seven-coordinate iron(III) nitrates with bidentate
N-binding ligands: {cis-[Ru(CN-'Bu) 4(CN)2]Fe(NO 3)3}2, [Fe2(U-O)(bpy) 2(NO3)4], and
[Fe 2(p-0)(ethyl-(bpy) 2)(NO3)4]. 27-29 Seven-coordinate iron(III) complexes are relatively rare,
comprising only 0.7% of the published iron-containing crystal structures in the Cambridge
structural database.30
Ci1
022 2
021 Fe1 Oil
N6N1
Figure 2.19. Drawing of the X-ray crystal structure of 7 with ellipsoids shown at 50%probability. Solvent molecules and hydrogen atoms are omitted for clarity. Color scheme: iron,orange; chloride, dark green; nitrogen, blue; oxygen, red; carbon, colorless.
78

Table 2.6. Selected geometrical parameters of 7 and 9.[Fe(BIPhMe)(N0 3 )2Cl], 7
bond length, (A)M-N Axial: Equatorial
2.0819(12) 2.0882(12)M-O 2.1357(11)
2.1439(11)2.1439(11)2.1974(12)
M-Cl 2.2651(4)bond angle, (0)
0-M-O Intra: Inter:59.43(4) 76.26(4)59.54(4) 135.56(4)
135.69(4)163.81(4)
N-M-N 85.84(5)N-M-O Axial: Equatorial:
86.23(5) 82.41(5)86.24(4) 81.75(5)87.68(4) 140.71(5)87.84(5) 141.28(5)
N-M-Cl 178.03(4) 95.53(3)O-M-Cl 93.58(3)
91.80(3)91.08(3)93.75(3)
[Co(BIPhMe)(NO3 )21, 9
2.0242(11)2.0330(11)2.2136(10)2.0903(10)2.0766(10)2.2398(10)
Intra: Inter59.94(4) 91.71(4)59.80(4) 94.04(4)
94.50(4)141.08(4)
90.95(4)110.43(4)102.99(4)96.32(4)104.33(4)
Similar to the formation of 7, compound 8 forms from the reaction of 2 and N0 2(g). This
reaction can be followed using UV-vis spectroscopy involving'by the formation of bands at 290
nm and 360 nm (Figure 2.15). The visible absorption bands of 8 are more intense than the bands
observed for 7 (Figure 2.18).
Reactions of Co(BIPhMe)Cl 2 and Co(BIPhMe)1 2 with NO (g) and NO 2 (g). No reactivity is
observed between 3 and NO (g) by UV-Vis or FT-IR spectroscopy. The reaction of 3 with NO 2
(g) results a color change from deep blue to dark green in methylene chloride. This color change
can be followed by UV-Vis (Figure 2.20), where the growth of new bands at 359 nm and 700 nm
are observed. A decrease in intensity of the bands at 554 nm and 632 nm is also observed,
suggesting that the chloride ligands are retained. This is further corroborated by the ESI-MS
spectrum.
79

359
0.9- 1632
0.6
554
Q 03. 700
0.0
3;0 4;0 0 600 700 .... 00....
Wavelength (nm) 4000 3500 3000 2500 2000 1500 1000 500
Wavenumbers (cm1
)
Figure 2.20. Spectroscopic characterization of the product generated by the reaction of 3 andN0 2(g). The UV-Vis spectrum (left) was recorded in acetonitrile (1.12 mM) under nitrogen. TheFT-IR spectra (right) was recorded as a KBr pellet. Color scheme: black, starting material; red,product.
The reaction of 4 in methylene chloride with NO (g) results in a color change from deep
green to dark yellow. When this reaction is followed by UV-vis spectroscopy (Figure 2.21), the
bands at 244 nm and from 583 - 668 nm are diminished upon addition of excess NO (g). The
bands at 310 nm and 373 nm blue shift and increase in intensity to 293 nm and 362 nm. These
two bands may be associated with the 13- ion which has absorption maxima at 297 nm and 350
nm. Cobalt-mediated iodide oxidation may be the reaction route observed, resulting in formation
of a new species that cannot be identified by optical spectroscopy from the crude product.
The FT-IR spectrum of the crude nitrosylated product of 4 shows bands at 1748 cmf,
1784 cm', 1818 cm'1, and 1866 cm 1 . The shape and separation of the bands suggests the
formation of two separate cobalt dinitrosyl species. One of these putative cobalt dinitrosyl
species would consist of the bands with 1748 cm- 1 and 1818 cm-, and the other species would
consist of the bands at 1784 cm' and 1866 cm .
80

3.0 -
2.7 t 27
293 I310
2.42. 1 02.1
1.5 -362
1.2 06 60 6 181&-
0.9 0.3
0.6- 00 1748Waveingth (m) 1866
0.31784
300 400 800 600 700 800 300 25 200 15 100 50
Wavelength (nm) Wavenumber (cm-1)
Figure 2.21. Spectroscopic characterization of the product generated by the reaction of 4 and NO(g). The UV-Vis spectrum (left) was recorded in acetonitrile (1.02 mM) under nitrogen. The FT-IR spectra (right) was recorded as a KBr pellet.
The positive-mode ESI-MS spectrum (Figure 2.22) shows two sets of peaks with the
most abundant ions located at 341.1 m/z and 371.1 m/z. These two peaks correspond well with
the potential ions of [Co(BIPhMe)(NO)]f, calculated to have a mass of 371.1 m/z, and
[Co(BIPhMe)]f, calculated to have a mass of 341.1 m/z. Both of these ions may form from the
synthetically possible [Co(BIPhMe)(NO) 2] complex. Evidence for the formation of the complex
[Co(BIPhMe) 2(NO)2] is observed in the ESI-MS spectrum by the group of peaks with the most
abundant ion located at 668.2 m/z, which matches well with the calculated value of 668.2 m/z for
[Co(BIPhMe) 2(NO)2]. The negative-mode ESI-MS shows peaks at 312.6 m/z ([CoI2 ] , calc'd
312.7 m/z), 380.5 m/z (13-, calc'd 380.7 m/z), and 439.5 m/z ([CoI 3 ] , calc'd 439.6 m/z).
Attempts at crystallization, separation, and structural characterization of the two nitrosyl species
have proved to be unsuccessful.
81

WA".1 -MS. 0lSf
317.120- 371.1
371.1
1.5
41.1
1.0
0.5750,
25111450.0668.2
8772 2_.
3128412.6
0.20
0 026. 37. 425.5
([C(BI )(N), 3 ; 3.
1.3800
([o(I ~ 0e2( 5)0* 3a8d602).5. [oI],cl'd327;30. I- al' 8.)
523.(C 439.60.25- 43005
270.9 306420.50.500 . 350.M
2M 27 300 M2 80 37 450 4Z0 40 475 m&z
Figure 2.22. Positive-mode (top) and negative-mode (bottom) ESI-MS spectra of the productformed in the reaction of 4 and NO (g) in acetonitrile. Peak assignments (m/z): 371.1([Co(BIPhMe)(NO)]', calc'd 371.1); 341.1 ([Co(B1PhMe)]', calc'd 341.1); 668.2([Co(BIPhMe) 2(NO)2]+, calc'd 668.2); 312.6 ([CoI2 ]-, calc'd 312.7); 380.5 (13 , calc'd 380.7),439.5 K[Co 3 ] , calc'd 439.6).
Exposure of 4 in methylene chloride to NO 2 (g) results in a color change from dark green
to red-purple, from which the pink complex [Co(BIPhMe)(NO 3)2], 9, was isolated. This
qualitative color change (Figure 2.18C) corresponds to loss of the absorption band at 244 nm and
the cluster of bands ranging from 583 - 668 nm. A new, broad band grows in at 462 nm along
with a shoulder at 270 nm (Figure 2.23). These two spectral features correspond well with the
formation of I2, which has absorption bands at 288 nm, 350 nm, and 460 nm. The absorption
band at 350 nm is obscured by the absorption bands of dissolved N0 2 (g).
82

0.6-
0.5
0.4
0.3-
0.2
0.1 462
0.01 639
0.0 ."- " '
300 400 60 6; 0 700 600
Wavelength (nm) 4000 3500 3000 2500 2000 1500 1000 500
Wavenumbers (cm")
Figure 2.23. Spectroscopic characterization of the product generated by the reaction of 4 andN0 2 (g). The UV-Vis spectra (left) was recorded in acetonitrile (102 pM) under nitrogen. TheFT-IR spectra (right) was recorded as a KBr pellet.
Compound 9 crystallizes in C2/c with a six-coordinate cobalt(II) center (Figure 2.24).
The compound has Co-N bond distances of 2.0242(11) and 2.0330(11) and a 90.95(4) N-Co-N
bond angle. Both nitrates are bidentate and bound to the cobalt by the oxygen atoms. The Co-O
bond distances are 2.0766(10), 2.0903(10), 2.2136(10), and 2.2398(10). The inter O-Co-O bond
angles are 59.94(4) and 59.80(4), and intra O-Co-O bond angles of 91.71(4), 94.04(4), 94.50(4),
and 141.08(4). The O-Co-N bond angles are 88.00(4), 89.35(4), 96.32(4), 102.99(4), 104.33(4),
110.43(4), 164.18(4), and 169.53(4). The ligands form a propeller-like geometry around the
cobalt due to the acute O-Co-O angles.
83

Oil 022
012 021Col
N6N1
Figure 2.24. Drawing of the X-ray crystal structures of 9 with ellipsoids shown at 50%probability. Solvent molecules and hydrogen atoms are omitted for clarity. Color scheme: cobalt,light blue; nitrogen, blue; oxygen, red; carbon, colorless.
Table 2.7. X-ray crystallographic data for 9 atcompoundformula
formula weightcrystal systemspace groupa, Ab, Ac, Af, degv, A3
zPcalcd, g/cm 3
p, mm _Io range, degcompleteness to 0, %reflections collectedindependent reflectionsR(int)restraintsparametersMax., min. transmissionR1(wR2) [1>2a(I)]RI(wR2)GoF(F 2 )max, min peaks, e.A
lOOK.Co(BIPhMe)(NO 3)2, 9Cl 6H1 8CoN6O 7
465.29monoclinicC2/c15.3271(6)10.6612(4)24.0172(9)101.1750(10)*3850.1(3)81.6050.9451.73 to 30.9294.94140858000.036602740.7461, 0.66720.0306 (0.0759)0.0418 (0.0808)1.3440.468, -0.236
84

Preparation of NO (g)/N0 2 (g) test strips and syringes. Experimentalists desire a rapid and
easy method to detect chemical changes. Colorimetric test strips are commonly used in synthetic
chemistry and biology to quickly evaluate pH changes in aqueous solutions or quantitatively
observe H2S release, using Pb(OAc) 2 strips, and metals ions, such as Al3 , Co 2+, and Cu 2 +, and
are available commercially from scientific vendors.3 '
Compounds 1 - 4 can be loaded on filter paper from a methylene chloride solution
(Figure 2.25). Exposure to NO (g) or NO 2 (g) of these loaded paper strips results in qualitative
color changes for the strips. This method provides a rapid and low cost method to qualitatively
measure NO (g) or NO2 (g) release from a chemical or biochemical reaction.
Startin + NO(g)
4 3 1 2 4 3 1 2Starting + N02(g)
4 3 1 2 4 3 1 2
Figure 2.25. Filter paper strips loaded with 1 - 4 and exposed to 100 mmol NO (g) (top) andNO 2 (g) (bottom).
These individual strips can be combined into a single test strip by spotting silica TLC
plates with multiple solutions of the compounds (Figure 2.26). These silica-based test strips
require less space and allow for direct comparison of gas release from multiple compounds to
determine whether the color change profile matches what is expected. Silica TLC plates have
85

been previously developed as test strips by loading with a colorimetric sensor to detect
hypochlorite.3 2
StartingStarting
4 3 1 2 4 3 1 2+ NO(g) + N02(g)
4 3 1 24 3 1 2Figure 2.26. Silica TLC plates loaded with 1 - 4 and exposed to NO (g) (top) and N0 2(g)(bottom).
These compounds can be loaded onto silica by dissolving in methylene chloride and
evaporating onto silica gel. This silica gel bound sensor can be loaded into syringes equipped
with needles (Figures 2.27 and 2.28). By pulling the headspace of a reaction through the syringe,
the compound will change color and allow for the observation of NO (g) or NO 2 (g) release into
the reaction headspace. An added benefit of using this device is by controlling the amount of
compound loaded onto the syringe, we can quantitatively measure the amount of gas released in
the reaction by how far along the syringe the color change occurs due to the rapid reaction with
the colorimetric sensors. This rapid quantification can serve as an initial experiment for
biochemical experiments to determine how much of 1 will be necessary to more accurately
measure the amount of gas released by spectroscopic methods.
86

+ 0 pL
+ 100 pL
+ 200 pL
+ 300 pL
C)
B)+ OpL
+ 100 pL
+ 200 pL
+ 300 pL
+ OpL
+ 100 pL
+ 200 pL
+ 300 pL
Figure 2.27. Syringes filledvarying amounts of NO (g).
A)+ OpL
+500 pL
C)+ OpL
+500 pL
with A)1, B) 2, and C) 4 loaded onto silica gel and exposed to
B)+ OpL
+500 pL
D)+ OpL
+500 pL
Figure 2.28. Syringes filled with A)1, B) 2, C) 3, and D) 4 loaded onto silica gel and exposed tovarying amounts of N0 2(g).
87

3.4 Summary and Conclusions
New Fe2+ and Co2+ complexes using the bis-nitrogen donor ligand BIPhMe were
prepared. These complexes were crystallographically and spectroscopically characterized. The
iron and cobalt complexes are species of the type M(BIPhMe)X 2, where M is Fe2+ or Co2+, and X
is cr, Br~, or F.
The reaction of colorless 1, Fe(BIPhMe)C 2, with NO (g) forms the dark green complex
5, [Fe(BIPhMe) 2(NO)Cl][Fe(NO)Cl 3], whereas the reaction with N0 2(g) forms the yellow
complex 7, Fe(BIPhMe)(NO 3)2C. This complex can serve in a quantitative and qualitative assay
to measure the release of NO (g) or NO 2 (g) from reactions. The yellow compound 2,
Fe(BIPhMe)Br2, can be used in a similar manner as it generates similar products.
Compound 3, Co(BIPhMe)C 2, shows no reactivity toward NO (g), but the related
compound 4, Co(BIPhMe)1 2, does react with NO (g) to form two dinitrosyl species that we
assign as [Co(BIPhMe)(NO) 2]* and [Co(BIPhMe)2(NO)2]+, as well as 13-. Both C02+ complexes
react with NO 2 (g) and change color.
Using these metal complexes, NO (g) and NO 2 (g) test strips were prepared using filter
paper or silica TLC plates. These test strips could be placed in enclosed containers that share the
headspace with reactions that form NO (g) and NO 2 (g) and provide qualitative proof that these
gases are generated. To more quantitatively measure gas generation, silica loaded syringes can
be used to measure gas amounts.
88

3.5 References
1. Davies, I. R.; Zhang, X., Nitric Oxide Selective Electrodes. In Methods Enzymol., Robert,K. P., Ed. Academic Press: 2008; Vol. Volume 436, pp 63.
2. Skodje, K. M.; Kwon, M.-Y.; Chung, S. W.; Kim, E., Chem. Sci. 2014, DOI:10.1039/C3SC53319K.
3. Wennmalm, A.; Lanne, B.; Petersson, A.-S., Analytical Biochemistry 1990, 187, 359.4. Abcan, Nitric Oxide Assay Kit (Colorimetric). In
http://www.abcam.com/ps/products/65/ab65328/documents/ab65328 Nitric Oxide Assay KitColorimetric (Website).pdf, : 2012.
5. Green, L. C.; Wagner, D. A.; Glogowski, J.; Skipper, P. L.; Wishnok, J. S.; Tannenbaum,S. R., Analytical Biochemistry 1982, 126, 131.
6. Dacres, H.; Narayanaswamy, R., Sens. Actuators, B 2005, 107, 14.7. Meng, Q. T.; Zhang, Y. X.; Hou, D. Y.; Xin, G.; Li, T. C.; He, C.; Duan, C. Y.,
Tetrahedron 2013, 69, 636.8. Rathore, R.; Abdelwahed, S. H.; Guzei, I. A., J. Am. Chem. Soc. 2004,126, 13582.9. McQuade, L. E.; Pluth, M. D.; Lippard, S. J., Inorg. Chem. 2010, 49, 8025.10. Lim, M. H.; Xu, D.; Lippard, S. J., Nat. Chem. Biol. 2006,2,375.11. Tolman, W. B.; Liu, S. C.; Bentsen, J. G.; Lippard, S. J., J. Am. Chem. Soc. 1991,113,
152.12. Lorkovic, I. M.; Ford, P. C., Inorg. Chem. 2000, 39, 632.13. Pangborn, A. B.; Giardello, M. A.; Grubbs, R. H.; Rosen, R. K.; Timmers, F. J.,
Organometallics 1996, 15, 1518.14. Kent, T. A. WMOSS v. 2.5: Mossbauer Spectral Analysis Software, WEB Research Co.,
WEB Research Co.: Minneapolis, MN, 1998.15. APEX2 v2009 APEX2 v2009, Bruker AXS: Madison, WI, 2009.16. Sheldrick, G. M. SADABS: Area-Detector Absorption Correction, University of
Gttingen: G6ttingen, Germany, 2008.17. Sheldrick, G., Acta Crystallogr., Sect. A: Found. Crystallogr. 2008, 64, 112.18. Sheldrick, G. M. SHELXTL97: Program for Refinement of Crystal Structures, University
of G6ttingen: G6ttingen, Germany, 1997.19. Dolomanov, 0. V.; Bourhis, L. J.; Gildea, R. J.; Howard, J. A. K.; Puschmann, H., J.
Appl. Crystallogr. 2009, 42,339.20. Tran, C. T.; Kim, E., Inorg. Chem. 2012, 51, 10086.21. Zang, Y.; Que, L., Inorg. Chem. 1995,34, 1030.22. Connelly, N. G.; Gardner, C., J. Chem. Soc., Dalton Trans. 1976, 1525.23. Kalyvas, H.; Coucouvanis, D., Polyhedron 2007, 26, 4765.24. Siri, 0.; Tabard, A.; Pullumbi, P.; Guilard, R., Inorg. Chim. Acta 2003, 350, 633.25. Pohl, K.; Wieghardt, K.; Nuber, B.; Weiss, J., J. Chem. Soc., Dalton Trans. 1987, 187.26. Steimann, M.; Nagel, U.; Grenz, R.; Beck, W., J. Organomet. Chem. 1983,247, 171.27. Taft, K. L.; Masschelein, A.; Liu, S.; Lippard, S. J.; Garfinkel-Shweky, D.; Bino, A.,
Inorg. Chim. Acta 1992, 198-200, 627.28. Halbauer, K.; Spielberg, E. T.; Sterzik, A.; Plass, W.; Imhof, W., Inorg. Chim. Acta 2010,
363, 1013.29. Seddon, E. J.; Yoo, J.; Folting, K.; Huffman, J. C.; Hendrickson, D. N.; Christou, G., J.
Chem. Soc., Dalton Trans. 2000, 3640.
89

30. Craig, G. A.; Barrios, L. A.; Costa, J. S.; Roubeau, 0.; Ruiz, E.; Teat, S. J.; Wilson, C.C.; Thomas, L.; Aromi, G., Dalton Trans. 2010, 39, 4874.
31. Machery-Nagel QUANTOFIX@ test strips. http://www.mn-net.com/tabid/4928/default.aspx(accessed 7 April 2014).
32. Goswami, S.; Paul, S.; Manna, A., Dalton Trans. 2013, 42, 10097.
90

CHAPTER 3: REACTIONS OF (PPN)(SNO)AND (PPN)(SSNO) WITH HBF4 ANDBIOMIMETIC IRON COMPLEXES
91

3.1 Introduction
Owing to the high reactivity of NO, a majority of the biological functions attributed to
NO may actually occur via secondary translocators such as S-nitrosothiols and dinitrosyl iron
complexes (DNICs).'-8 In a collaboration with our lab, it was recently discovered that
biologically generated H2 S promotes trans-membrane transfer of NO from S-nitrosated albumin
in plasma to form S-nitrosohemoglobin inside red blood cells (Figure 3.1).9 This transfer is
presumably facilitated by thionitrous acid (HSNO), the smallest S-nitrosothiol.
ONS
HS
HSNO
Outside Cell
Inside Cell HSNO
4W SH H2S 4
Figure 3.1. H2S can facilitate the transfer of NO from a S-nitrosated albumin across themembrane of white blood cells to an exposed cysteine on hemoglobin. This transfer is proposedto occur by formation of HSNO, the smallest S-nitrosothiol.
Preparation of the salts (PPN)(SSNO), 1, and (PPN)(SNO), 2, has been reported but no
reactivity studies have been published.' 0 The recent discovery of HSNO as an NO transfer
reagent inspired us to undertake reactivity studies with an organic-soluble acid and known
biomimetic iron complexes in organic solvents to make products that may be formed in
biological systems. In this chapter, we describe a modified method for preparing 1 and 2, along
with their characterization. Reactivity studies of these S-nitrosothiols were performed with the
92

proton source HBF4-Et2O, 3, and the biomimetic iron complexes [Fe"'(TPP)Cl], 4,
[Fe2 S2(SPh) 4 ]2 ~, 5, [Fe2(Et-HPTB)(PHCOO)](BF 4)2, 6,
[Fe2(p-OH)(p-Ph4DBA)(TMEDA) 2(OTf)], 7, and [Fe(BIPhMe)C 2], 8. The S-nitrosothiol and
NO(g) chemistry of all of the iron compounds is either known or was explored here, and used as
a comparison to further understand the chemistry exhibited by the SNO~ moiety.
3.2 Experimental Methods
General comments. All manipulations were performed under an atmosphere of nitrogen gas in
an Mbraun glovebox. NO (Airgas, 99%) was purified by a literature procedure." The NO gas
stream was passed through an Ascarite column (NaOH fused on silica gel) and a 6 ft coil filled
with silica gel that was cooled to -78 *C using a dry ice/acetone bath. Nitric oxide was stored
using standard gas storage bulbs and transferred via gastight syringes. Diethyl ether,
tetrahydrofuran, pentane, methylene chloride, and acetonitrile were purified by passage through
activated alumina then stored over 4-A molecular sieves prior to use.' 2 Acetone was distilled
from K2C0 3 under argon and stored over 4-A molecular sieves prior to use.' 3 (PPN)(NO 2),
(Bu4N)2[Fe 2 S2(SPh)4], [Fe2(C-OH)(u-Ph4DBA)(TMEDA) 2(OTf)],
[Fe2(Et-HPTB)(PHCOO)](BF 4)2, and Ph3CSNO were synthesized per literature procedure. 14-18
[Fe(BIPhMe)C 2] was prepared as reported in chapter 2. All organics were purchased from
Sigma-Aldrich and used as received. Triphenylphosphine was purchased from Alfa Aesar and
purified by recrystallizing from hot hexanes.13 HBF4-Et2O was purchased from Alfa Aesar and
used as received. [Fe(TPP)Cl] was purchased from Strem Chemicals and used as received after
testing its purity by UV-Vis spectroscopy.
93

Physical Measurements. FTIR spectra were recorded on a Thermo Nicolet Avatar 360
spectrometer running the OMNIC software package. Low-resolution mass spectra were obtained
with an Agilent 1100 Series LC/MSD mass spectrometer. UV-Vis spectra were recorded on a
Cary-50 spectrophotometer in air-tight rubber septum-capped quartz cells at 25.0 *C. X-Band
EPR spectra were recorded on a Bruker EMX EPR spectrometer at ambient temperature or at
77K using a quartz finger dewar. Samples for "Fe M5ssbauer studies were prepared by grinding
a solid sample with Apiezon-N grease. These "Fe M~ssbauer samples were placed in an 80 K
cryostat during measurement. A "Co/Rh source was moved at a constant acceleration at room
temperature against the absorber sample. All isomer shift (6) and quadrupole splitting (AEQ)
values are reported with respect to "Fe-enriched meta iron foil that was used for velocity
calibration. The displayed spectrum was folded to enhance the signal-to-noise ratio. Fits of the
data were calculated by the WMOSS plot and fit program, version 2.5.'9
Reaction monitoring of (PPN)(SNO) with HBF4-Et2O by UV-Vis. A solution of 2 (240 pM)
in acetonitrile was prepared in the glove box and added to a quartz cuvette. An airtight syringe
was filled with the appropriate volume to add 10 equiv of 3. The cuvette was removed from the
glovebox and placed into a Cary 50 UV-Vis spectrometer. After the initial scan was taken, the
filled syringe was injected into the cuvette, which was shaken for 10 - 20 sec and placed back
into the spectrometer. Scans were collected every 30 sec for the first 10 min, 1 min for the next
20 min, and every 5 min for the final 90 min.
Reaction monitoring of (PPN)(SSNO) or (PPN)(SNO) with [Fe"'(TPP)C] by UV-Vis. A
solution of 4 (14 pM) in tetrahydrofuran was prepared in the glove box and added to a quartz
cuvette. Solutions of 1 (1.8 mM) and 2 (1.5 mM) in acetonitrile were prepared in the glovebox
and an airtight syringe was filled with the appropriate volume to add 1 and 2 equiv. The cuvette
94

was removed from the glovebox and placed into a Cary 50 UV-Vis spectrometer. After the
initial scan was taken, the filled syringe was injected into the cuvette, which was shaken for 10 -
20 sec and placed back into the spectrometer. Scans were collected every 30 sec for the first 10
min, 1 min for the next 20 min, and every 5 min for the final 90 min.
ReactIR Measurements. In situ IR spectra were recorded on a ReactIR iC 10 instrument from
Mettler Toledo equipped with a 1 in. diameter, 30-reflection silicon ATR (SiComp) probe. In a
typical experiment, the instrument was blanked with the solvent and a sample of 4 or 7, at a
concentration of 30 mM. After the first data collection time point, NO(g) was added to the
anaerobic sample compartment through a rubber septum with a gas-tight syringe. The data were
referenced to the initial scan and imported to Origin 8. 0 as a *.spc file to generate the figures.
X-ray Data Collection, and Structure and Solution Refinement. Crystals of 1, 2,
11 -(PPN)(OTf), and 12 suitable for X-ray diffraction were mounted in Paratone N oil and frozen
under a nitrogen cold stream maintained by a KRYO-FLEX low-temperature apparatus. Data
were collected on a Bruker APEX CCD X-ray diffractometer with Mo Ka radiation ()= 0.71073
A) controlled by the APEX2 software package.20 Empirical absorption corrections were
calculated with SADABS. 2 1 The structure was solved by direct methods with refinement by full-
matrix least-squares based on F2 using SHELXTL-97.22-24 All non-hydrogen atoms were located
and their positions refined anisotropically. Hydrogen atoms were assigned to idealized positions
and given thermal parameters equal to either 1.5 (methyl hydrogen atoms) or 1.2 (non-methyl
hydrogen atoms) times the thermal parameters of the atoms to which they were attached. The
crystal of 12 exhibited non-merohedral twinning with a twin law of (-1 0 0) (0 -1 0) (0.5 0 1).
One of the molecules of diethyl ether was highly disordered and was removed by using the
SQUEEZE function in Platon.25 , 6 Space group verification was performed using Platon. Figures
95

were generated using the Olex 2.1 graphical user interface. See Tables 3.1 and 3.4 below for
crystallographic data and refinement details.
Theoretical calculations. Quantum mechanical density functional theory (DFT) calculations
were performed on the different binding isomers of HSNO. The DFT calculations were carried
out in GaussianO3 using the B3LYP functional and the dgdzvp basis set in the gas phase.2 -33
The atomic coordinates from the crystal structure of 2 were used as the input for geometry
optimizations. Frequency calculations were performed to confirm that the geometry converged at
an energy minimum on the potential energy surface of the molecule.
(PPN)(SSNO), 1.1" A 250 mL Erlenmeyer flask was charged with (PPN)(NO 2) (7.36 g, 12.2
mmol) and sulfur (0.798 g, 24.4 mmol). This mixture was dissolved in acetone (210 mL) and
stirred for 12 h, after which it had turned dark red with a yellow precipitate. The yellow
precipitate was filtered and the dark red filtrate was collected and poured into 16 x 100 mm test
tubes. These test tubes were placed into a I L jar filled with 400 mL diethyl ether and left
standing for one week, after which black, dark red, orange, and yellow crystals formed. The
black crystals were mechanically isolated and recrystallized an additional two times in an
analogous fashion yielding 1.83 g (2.89 mmol, 23.7 %) of X-ray quality black blocks. The FTIR
and UV-Vis spectroscopy matched the previously published spectra.' 0 FTIR (KBr, cm '): 3056
(w), 2974 (w), 2924 (w), 2869 (w), 1482 (w), 1437 (s), 1335 (vNO, s), 1305 (s), 1286 (in), 1271
(in), 1181 (w), 1115 (s), 1047 (in), 997 (w), 902 (w), 795 (w), 763 (w), 741 (w), 721 (s), 692
(m), 662 (w), 549 (s), 531 (s), 496 (in). UV-Vis (MeCN, nm, e, M~1cm~'): 420 (2720).
(PPN)(SNO)-(CH 3)2CO, 2.10 A 125 mL Erlenmeyer flask was charged with 1 (1.91 g, 3.02
mmol) and PPh3 (1.58 g, 6.04 mmol). This mixture was dissolved in acetone (100 mL) and
stirred for 24 h in the dark, after which the solution turned green. This green solution was filtered
96

and the filtrate was reduced to 10 mL and poured into 16 x 100 mm test tubes. These test tubes
were placed into a 1 L jar filled with 400 mL diethyl ether and left standing for 1 week, after
which dark green and orange crystals formed. The dark green crystals were isolated
mechanically and recrystallized an additional time in an analogous fashion, yielding 1.163 g
(1.765 mmol, 58.5 %) of X-ray quality dark green blocks. The FTIR and UV-Vis spectroscopy
matched the previously published spectra.1 0 FTIR (KBr, cm'): 2921 (m), 2876 (w), 1438 (s),
1304 (m), 1264 (s), 1162 (w), 1115 (s), 1046 (m), 1026 (m), 997 (m), 724 (s), 693 (s), 548 (s),
534 (s), 500 (m). UV-Vis (MeCN, nm, e, M~1cm 1'): 332 (2950).
Reaction of (PPN)(SNO) with HBF4 -Et2O. In a 20 mL vial, 8 (13.0 mg, 31.8 pmol) was
dissolved in acetonitrile (2 mL), resulting in a colorless solution. In a 5 mL vial, 2 (20.7 mg, 31.4
pmol) was dissolved in acetonitrile (2 mL), resulting in a dark green solution, and a stir bar was
added. The 5 mL vial was placed into the 20 mL vial and the entire system was sealed with a
rubber septum. A syringe was filled with 3 (60.4 pmol) and injected into the solution of 2 while
stirring. The solution turned from dark green to orange to colorless within 1 min. The solution of
8 turned green, indicating the release of NO(g) (see chapter 2).
Reaction of (PPN)(SSNO) with [Fe"'(TPP)C]. A 20 mL vial was charged with 1 (18.0 mg,
28.4 Pmol) and 4 (10.0 mg, 14.2 pmol). This mixture was dissolved in tetrahydrofuran (10 mL)
and stirred for 2 h, after which it was poured into pentanes (100 mL) and stirred for 10 min. A
dark purple precipitate formed and was collected by filtration through Celite, followed by
tetrahydrofuran extraction. The extracted product was characterized by UV-Vis, IR, and EPR
spectroscopy to consist of [Fe"(TPP)], 9.4-36 FTIR (KBr, cm'1): 3105 (w), 3028 (w), 2963 (w),
2923 (w), 2853 (w), 1698 (VNO, s), 1598 (m), 1440 (m), 1347 (m), 1262 (m), 1203 (w), 1176 (m),
1114(w), 1072 (w), 1003 (s), 803 (m), 753 (m), 720 (m), 703 (m), 665 (w), 548 (w), 534 (m),
97

464 (w). EPR (X-band, 2Me-THF, RT, g-factor): 2.05 (avg, 3-line). The pentane-containing
filtrate was stripped and characterized for So by addition of an excess of PPh3 (15 mg, 57.2
pmol), which formed Ph3P=S as to contain So as characterized by 31P NMR spectroscopy.37 3 1p
NMR (300 MHz, CDCl 3, ppm): 42.85 (S=PPh3), -4.81 (PPh3).
Reaction of (PPN)(SNO) with [Fe"(TPP)CI]. A 20 mL vial was charged with 2 (18.7 mg, 28.4
pmol) and 4 (10.0 mg, 14.2 pmol). This mixture was dissolved tetrahydrofuran (10 mL) and
stirred for 2 h, after which it was poured into pentane (100 mL) and stirred for 10 min. A dark
purple precipitate formed and was collected by filtration through Celite, followed by
tetrahydrofuran extraction. The extracted product was characterized by UV-Vis, IR, and EPR
spectroscopies to consist of 9.34-36 FTIR (KBr, cm-'): 2966 (w), 2920 (w), 2855 (w), 1697 (VNO,
s), 1597 (in), 1486 (w), 1440 (m), 1340 (m), 1263 (w), 1201 (w), 1175 (w), 1071 (in), 1002 (s),
805 (in), 752 (s), 721 (s), 703 (s), 661 (in), 534 (w), 500 (w). EPR (X-band, 2Me-THF, RT, g-
factor): 2.05 (avg, 3-line). The pentante-containing filtrate was stripped and characterized by
addition of PPh3 (9.8 mg, 37.4 pmol) to contain So, as characterized by 3 1P NMR spectroscopy.
31P NMR (300 MHz, CDCl 3, ppm): 42.88 (S=PPh 3), -4.80 (PPh 3).
Reaction of (PPN)(SSNO) with ("Bu 4N)2[Fe2S2(SPh)4]. A 20 mL vial was charged with 1 (29.1
mg, 46.0 pmol) and ("Bu4N)2[Fe2S2(SPh)4], 5, (10.0 mg, 11.5 pmol). This mixture was dissolved
in tetrahydrofuran (10 mL) and stirred. After 2 h, the solution was poured into pentane (100 mL)
and stirred for 10 min. A black precipitate formed and was collected by filtration through Celite,
followed by tetrahydrofuran extraction. The extracted product was characterized by IR and EPR
spectroscopy to contain the [Fe4 S3(NO)7] 2- anion, 102-, and matched literature values.38 FTIR
(KBr, cm'1): 3052 (w), 2959 (in), 2871 (w), 1739 (vNO, m), 1691 (vNO, s), 1645 (vNO, sh), 1587
(w), 1481 (w), 1437 (s), 1263 (s), 1183 (w), 1115 (s), 1062 (w), 1021 (w), 997 (m), 796 (w), 745
98

(m), 724 (s), 693 (s), 602 (w), 548 (in), 534 (s), 499 (m). EPR (X-band, 2Me-THF, RT, g-factor):
2.026 (avg, 5-line).
Reaction of (PPN)(SNO) with ("Bu4N) 2[Fe2S2(SPh)4]. A 20 mL vial was charged with 2 (30.3
mg, 46.0 pmol) and 5, (10.0 mg, 11.5 jpmol). This mixture was dissolved in tetrahydrofuran (10
mL) and stirred. After 2 h, the solution was poured into pentane (100 mL) and stirred for 10 min.
A black precipitate formed and was collected by filtration through Celite, followed by
tetrahydrofuran extraction. The extracted product was characterized by ESI-MS spectrometry,
and IR and EPR spectroscopy to contain 102-, and matched literature values. 38 ESI-MS (MeCN,
m/z, calc'd): 242.3 ((Et4N), 242.3 m/z), 538.4 ((PPN)+, 538.2), 439.5 ([10-3NO]f, 439.6). FTIR
(KBr, cm'1): 3053 (w), 2960 (m), 2933 (m), 2873 (m), 1741 (VNO, in), 1691 (vNO, s), 1659 (vNO,
sh), 1576 (w), 1470 (m), 1438 (in), 1381 (w), 1266 (m), 1183 (w), 1115 (s), 1082 (w), 1071 (w),
1024 (w), 997 (w), 884 (w), 741 (m), 724 (s), 693 (s), 547 (m), 535 (s), 501 (m). EPR (X-band,
2Me-THF, RT, g-factor): 2.026 (avg, 5-line).
Reaction of (PPN)(SSNO) with [Fe2(E1-HPTB)(PHCOO)(BF 4)2. A 20 mL vial was charged
with 1 (11.5 ing, 18.2 smol) and 6 (10.0 mg, 9.10 smol). This mixture was dissolved in
tetrahydrofuran (10 mL) and stirred for 6 h, after which it was poured into pentane (100 mL) and
stirred for 10 min. A brown precipitate formed and was collected by filtration through Celite,
followed by tetrahydrofuran extraction. The extracted product was stripped and characterized to
be (PPN)[FeS5(NO)2], 11 by ESI-MS spectrometry, and FTIR and EPR spectroscopy and
matched literature values.39 ESI-MS (MeCN, m/z, calc'd): 275.6 ([11]-, 275.8), 215.5
([11-2NO]~, 215.8). FTIR (KBr, cm-1): 3054 (w), 2974 (w), 1738 (vNO, s), 1693 (VNO, s), 1628
(s), 1588 (w), 1482 (w), 1438 (w), 1360 (sh), 1115 (s), 1064 (w), 724 (s), 692 (s), 534 (s). EPR
99

(X-Band, 2Me-THF, RT) g-factor: 2.030. EPR (X-Band, 2Me-THF, 77 K) g-factors: 2.0148,
2.0304, 2.0494.
Reaction of (PPN)(SNO) with [Fe2(Et-HPTB)(PHCOO)](BF4)2. A 20 mL vial was charged
with 2 (11.5 mg, 18.2 pmol) and 6 (10.0 mg, 9.10 pmol). This mixture was dissolved in
tetrahydrofuran (10 mL) and stirred for 6 h, after which it was poured into pentane (100 mL) and
stirred for 10 min. A black precipitate formed and was collected by filtration through Celite,
followed by tetrahydrofuran extraction. The extracted product was characterized by ESI-MS and
IR spectroscopy to consist of the [Fe4S3(NO)7] anion, 101-, and matched literature values.38 ESI-
MS (MeCN, m/z, calc'd): 538.2 ((PPN)+, 538.2), 529.5 ([10]-, 529.6), 499.4 ([10-iNO] ,
499.6), 469.4 ([10-2NO]-, 469.6), 439.4 ([10-3NO]-, 439.6). FTIR (KBr, cm~'): 3057 (w), 2963
(w), 2923 (w), 1795 (VNO, w), 1739 (VNO, s), 1699 (VNO, m), 1659 (w), 1627 (m), 1483 (w), 1439
(m), 1360 (w), 1268 (s), 1224 (w), 1185 (w), 1149 (w), 1115 (s), 1031 (s), 998 (w), 799 (w), 745
(w), 724 (s), 693 (s), 637 (s), 547 (m), 534 (s), 501 (m).
Reaction of (PPN)(SSNO) with [Fe2(Q-OH)(u-Ph4DBA)(TMEDA) 2(OTIf). A 20 mL vial
was charged with 1 (11.5 mg, 18.2 jsmol) and 7 (10.0 mg, 9.10 pmol). This mixture was
dissolved in tetrahydrofuran (10 mL) and stirred for 6 h, after which it was poured into pentane
(100 mL) and stirred for 10 min. A brown precipitate formed and was collected by filtration
through Celite, followed by tetrahydrofuran extraction. The extracted product was stripped and
characterized to be (PPN)[FeS5 (NO)2], 11 by ESI-MS spectrometry, and FTIR and EPR
spectroscopy, and matched literature values. 39 . Dark brown needles were grown by vapor
diffusion of diethyl ether into a 2-methyl tetrahydrofuran solution, which were determined to be
of 11-(PPN)(OTf). FTIR (KBr, cmi 1): 3054 (w), 2974 (w), 1738 (VNO, s), 1693 (VNO, s), 1628 (s),
100

1588 (w), 1482 (w), 1438 (w), 1360 (sh), 1115 (s), 1064 (w), 724 (s), 692 (s), 534 (s). EPR (X-
Band, 2Me-THF, RT) g-factor: 2.030.
Reaction of (PPN)(SNO) with [Fe2(-OH)(-Ph 4DBA)(TMEDA) 2(OTf)]. A 20 mL vial was
charged with 2 (11.5 mg, 18.2 pmol) and 7 (10.0 mg, 9.10 pmol). This mixture was dissolved in
tetrahydrofuran (10 mL) and stirred for 6 h, after which it was poured into pentane (100 mL) and
stirred for 10 min. A black precipitate formed and was collected by filtration through Celite,
followed by tetrahydrofuran extraction. The extracted product was characterized by ESI-MS and
IR spectroscopy to consist of the [Fe4 S3(NO) 7]- anion, 101 , and matched literature values.38
ESI-MS (MeCN, m/z, calc'd): 538.2 ((PPN)+, 538.2), 529.5 ([10]-, 529.6), 499.4 ([10-lNO]~,
499.6), 469.4 ([10-2NO]f, 469.6), 439.4 ([10-3NO]f, 439.6). FTIR (KBr, cm '): 3057 (w), 2963
(w), 2923 (w), 1795 (w), 1739 (VNO, s), 1699 (VNO, m), 1659 (w), 1627 (in), 1483 (w), 1439 (in),
1360 (w), 1268 (s), 1224 (w), 1185 (w), 1149 (w), 1115 (s), 1031 (s), 998 (w), 799 (w), 745 (w),
724 (s), 693 (s), 637 (s), 547 (in), 534 (s), 501 (m).
0 2-Ph ', Ph 0_ 0
0 0_Fe JY00o Fe 0F
12
[Fe3(u-0)2(u-Ph4DBA)2(TMEDA)2(NO)2](OTf), 12. Method a. In a 50 mL Erlenmeyer flask,
7 (150 mg, 137 pmol) was dissolved in methylene chloride (15 mL). In a separate 20 mL vial,
Ph3CSNO (83.6 mg, 274 pmol) was dissolved in methylene chloride (15 mL) and instantly
poured into the reaction flask and capped with a rubber septum. Throughout the course of the
reaction, a 40 - 60 iL aliquot was taken to monitor the reaction by solution IR between CaF 2 salt
101

plates. After no further growth or decay in bands was observed in the 1500 - 1850 cm-1 region
(6 h), the reaction mixture was poured into 300 mL pentane and stirred for 10 minutes. The
mixture was filtered through Celite and the remaining solid was extracted with 15 mL methylene
chloride. The volume of the methylene chloride extract was reduced to 4 mL. Diethyl ether was
vapor diffused into the methylene chloride solution to yield 60.5 mg dark green crystals of 11
(33.3 simol, 24.3 %) of X-ray diffraction quality. Anal. Calc'd for
C93H84F3Fe3N6 O17S-(CH 2 C 2). 25 : C, 58.95; H, 4.54; N, 4.38. Found: C, 58.84; H, 4.37; N, 4.49.
ESI-MS (MeCN, m/z): 148.7 ((OTf)f, 149.0). FTIR (CH 2Cl 2, cm-1): 1722 (vNo, m). FTIR (KBr,
cm~'): 3057 (w), 2954 (m), 2923 (s), 2852 (m), 1724 (vNO, in), 1591 (s), 1492 (m), 1468 (s), 1444
(in), 1423 (w), 1375 (s), 1264 (s), 1223 (w), 1186 (m), 1156 (in), 1063 (w), 1030 (s), 951 (w),
860 (w), 801 (w), 767 (in), 741 (m), 725 (in), 700 (in), 680 (w), 638 (s), 575 (w), 517 (w), 492
(w). 5 7Mssbauer (mm/s) (80 K, 8 mm/s, AEQ mm/s, F mm/s): Site 1 - 0.70(2), 1.02(2), 0.32(2),
Site 2 - 0.68(2), 1.47(2), 0.35(2), Site 3 - 0.51(2), 0.95(2), 0.49(2).
Method b. In a 20 mL vial, 7 (23.1 mg, 21.1 pmol) was dissolved in methylene chloride (3 mL)
and the vial was sealed with a rubber septum. NO(g) (2.5 mL, 102.6 pmol) was injected using a
gas tight syringe into the reaction vial. After 6 h, the reaction mixture was poured into 100 mL
pentane and stirred for 10 minutes. The mixture was filtered over and the remaining solid was
extracted with 5 mL methylene chloride and stripped to yield 7.8 mg (4.3 pmol, 19%) of a green-
brown solid. The sample spectroscopically and crystallographycally matched the isolated product
from method a.
Reaction of (PPN)(SSNO) with [Fe(BIPhMe)CI2]. A 20 mL vial was charged with 8 (21.4 mg,
52.3 ptmol) and 1 (65.9 mg, 104 smol). This mixture was dissolved in acetonitrile (10 mL) and
stirred for 2 h, after which it was poured into diethyl ether (120 mL) and stirred for 10 min. A
102

light brown precipitate formed and was collected by filtration through Celite. The black filtrate
was collected and stripped to leave a 46.9 mg of black solid. The black solid was dissolved in
tetrahydrofuran (1.5 mL) and layered with pentanes. Black needle crystals formed over the
course of 2 weeks and were collected to yield 27.9 mg of 11 (65 %) as characterized by FTIR
and EPR spectroscopy. 39 FTIR (KBr, cm-'): 3054 (w), 2951 (w), 2859 (w), 1739 (vNo, s), 1693
(vNO, s), 1587 (w), 1482 (in), 1437 (s), 1281 (s), 1266 (s), 1183 (w), 1114 (s), 1067 (in), 1026
(w), 998 (w), 975 (w), 894 (w), 746 (in), 732 (s), 692 (s), 547 (in), 533 (s), 500 (in). EPR (X-
Band, 2Me-THF, RT) g-factor: 2.030.
Reaction of (PPN)(SNO) with [Fe(BIPhMe)CI21. A 20 mL vial was charged with 8 (21.7 mg,
53.1 s1mol) and 2 (74.8 mg, 114 smol). This mixture was dissolved in acetonitrile (10 mL) and
stirred for 2 h, after which it was poured into diethyl ether (120 mL) and stirred for 10 min. A
light brown precipitate formed and was collected by filtration through Celite. The black filtrate
was collected and stripped to leave a 33.8 mg of black solid. The black solid was dissolved in
tetrahydrofuran (1.5 mL) and layered with pentanes. Black needle crystals formed over the
course of 2 weeks and were collected to yield 18.4 mg of 11 (43 %) as characterized by FTIR
and EPR spectroscopy.39 FTIR (KBr, cm1): 3054 (w), 2954 (w), 2929 (w), 2842 (w), 1738 (vNO,
s), 1694 (vNO, s), 1621 (w), 1587 (w), 1483 (in), 1438 (s), 1281 (s), 1264 (s), 1183 (w), 1115 (s),
1067 (in), 1027 (w), 997 (w), 975 (w), 894 (w), 747 (in), 723 (s), 692 (s), 547 (in), 534 (s), 500
(in). EPR (X-Band, 2Me-THF, RT) g-factor: 2.03 EPR (X-Band, 2Me-THF, 77 K) g-factors:
2.0138, 2.0294, 2.0485.
3.3 Results and Discussion
Preparation and characterization of SSNO~ and SNO . The originally reported syntheses of 1
and 2 were performed using only Schlenk techniques.' 0 (PPN)(NO 2) and elemental sulfur are
103

combined in a Schlenk flask and dissolved in acetone distilled over K2CO3. Over the course of a
day, the solution would turn from a pale yellow to orange to a black solution containing the
intended product 1 along with a variety of other sulfur, nitrogen, and oxygen containing species.
Black crystals of 1 were formed by slow vapor diffusion of diethyl ether into the crude solution
and then mechanically separated from the other colorless, yellow, orange, and red crystals.
Fractional crystallization was used to prepare pure 1. This tedious process was repeated multiple
times until only black crystals crystallized. The apparatus for crystallization consisted of a
specialized Schlenk flask with multiple tubes allowing for the filtration of the crude reaction
solution into a tube that had common headspace with another tube containing diethyl ether. This
setup allowed for the slow evaporation, deposition, and diffusion of diethyl ether into the
solution of 1.
The preparation of 2 would then follow by sulfur extraction from 1 by PPh3 in dry
acetone. This reaction would yield a green solution. The purification of 2 was described as
following a similar method as for 1, but was described as being even more air-sensitive.
We were able to simplify the preparation of 1 and 2 by switching from Schlenk to glove
box techniques. Mixing (PPN)(NO 2), elemental sulfur, and acetone in an Erlenmeyer flask gives
the color changes that were described in the original synthesis. The reaction mixture was then
filtered through a glass frit and the filtrate was poured into test tubes to about a third of the
maximum volume. These filled test tubes were placed into a 1 L jar filled with 400 mL diethyl
ether and sealed. Over the course of a week, the diethyl ether would diffuse into the test tubes
and generate a mixture of black, red, orange, yellow, and colorless crystals. Larger and easier to
separate crystals were generated when the reaction was performed on a multi-gram scale rather
104

than a hundreds-of-milligram scale. To prepare batches of crystals that were only black, this
method was employed at least three times.
The character of the black crystals was verified by UV-Vis and IR spectroscopy (Figure
3.2) and by X-ray crystallography (Figure 3.5). The UV-Vis spectrum of 1 (Figure 3.2) shows an
absorption band at 420 nm in acetonitrile compared to the published value of 425 nm in
methanol and 448 nm in acetone.10 The VNO band in the IR spectrum of 1 was determined to be
1335 cm'1, whereas the VNO band shifts to 1310 cm- when (PPN)(' 5NO) was used. The shift
upon isotopic labeling matches the calculated value of 1311 cm' using the harmonic oscillator
model.
2.0-
14 420
C0 1.2
1.0
0.6.
0.6.
OA.
1335 1310
300 40 600 600 700 60 17'00 100 1600 1400 1300 1200 1100
Wavelength (nm) Wavenumbers (em')
Figure 3.2. Spectroscopic characterization of (PPN)(SSNO). The UV-Vis spectrum (left) wascollected in acetonitrile at 650 ptM at 25'C. The IR spectra of KBr pellets (right) of(PPN)(SSNO) (black line) and (PPN)(SS1 5NO) (red line).
Compound 2 was prepared in a similar manner by dissolving crystals of 1 in acetone and
adding freshly purified PPh3. This reaction results in a deep green solution reminiscent of
solutions consisting of Ph3CSNO. During the first attempt to crystallize 2, the solution turned
orange and resulted in orange crystals, the nature of which is still unknown. However, when the
reaction and crystallization were performed in the dark, deep green crystals were obtained that
105

were characterized as 2-(CH 3)2CO by X-ray crystallography and by UV-Vis and IR
spectroscopy. The photoinstability of 2 should have been expected because other S-nitrosothiols
degrade when exposed to light. 40'4' The collected crystals were stored in a -30' C freezer to
minimize exposure to light and to slow down any possible thermal decomposition pathways that
may occur at ambient temperature.
In the UV-Vis spectrum (Figure 3.3), 2 has an absorption band at 332 nm in acetonitrile
(Figure 3.3) that matches well with the published value of 350 nm in acetone. The spectrum of 2
in acetonitrile was published in the original synthesis paper to compare the absorption spectrum
with that of (PPN)(N0 2), but no exact values were given for the absorption wavelength of 2.10
The absorption band of (PPN)(N0 2) is listed as 352 nm in this report with a 10 - 20 nm blue
shift for 2.
1.0.
0.9-
0.8
0.7 332
(0 0.6
0.5
0.4
Q 0.3
0.2
0.1
0.0-
1700 1600 1500 1400 1300 1200 1100 1000Wavelength (nm) Wvnmes(m1Wavenumbers (cnf)
Figure 3.3. Spectroscopic characterization of (PPN)(SNO). The UV-Vis spectrum (left) wascollected in acetonitrile at 220 ptM at 25oC. The IR spectra of KBr pellets (right) of (PPN)(SNO)(black line) and (PPN)(S 5NO) (red line).
S-nitrosothiols decompose electrochemically, and sulfur-containing compounds can exist
in multiple redox states. The cyclic voltammogram of 2 (Figure 3.4) has an irreversible reduction
at -2.64 V, which is much lower than the value of -1.36 V published for Ph3CSNO.4 2
Measurement of the oxidation potential was hindered by the strongly oxidizing ability of 2
106

because after a single scan the silver wire pseudo-reference electrode would be covered in a
black material and the redox events would be shifted, requiring us to perform all CV
measurements with ferrocene present as an internal reference. The reduction potential of 2 is so
great that dissolution in methylene chloride results in effervescence and a color change from
green to orange.
200 - -117
10'\ -2641100-
-100
-200 F(Cp)2
-300
1000 0 -1000 -2000 -300
Potential (mV)
Figure 3.4. Cyclic voltamogram of 2 in acetonitrile performed at 100 mV/s. The scan wasreferenced to the Fc/Fc+ redox couple at 0.00 V.
The crystal structure of 1 (Figure 3.5) consists of a single PPN+ cation and a disordered
SSNO- anion. The SSNO~ anion has a syn conformation with a dihedral angle of 20.34'. The
S-N-O bond angle is 117.3(4)0. The N-O bond distance is 1.257(6) A and the S-N bond
distance is 1.689(7) A. The crystal structure of 2 has a co-crystallized acetone molecule. For 2,
the S-N-O bond angle is 118.30(15)0, and has an N-O bond distance of 1.222(2) A and a S-N
bond distance of 1.707(2) A. The S-N bonds are shorter and the N-O bonds are longer for 1 and
2 compared to the published crystal structures of three other crystallographically characterized S-
nitrosothiols Ph3CSNO, S-nitrosoacetyl-D,L-penicillamine (SNAP), and TrmSNO (Table 3.2,
Figure 3.6).243
107

N1N1
01
S1
01I
S1
S2
Figure 3.5. Drawings of the X-ray crystal structures of SSNO (left) and SNO (right).Ellipsoids are drawn at 50% probability. Cations and solvent molecules are omitted for clarity.Color scheme: sulfur, yellow; nitrogen, blue; oxygen, red.
Table 3.1. Crystallographic parameterscompoundsformula
formula weightcrystal system
space groupa, Ab, Ac, Aa, degP, degy, degv, A3
zPcalcd, g/cm 3
U, mm0 range, degcompleteness to 0, %reflections collectedindependent reflectionsR(int)restraintsparametersMax., min. transmissionR I(wR2) [I>2a(l)]RI(wR2)GoF(F2)max, min peaks, e.A 3
for 1 and 2 at lOOK.(PPN)(SSNO), 1 (PPN)(SNO)-(CH 3)20, 2
C36H 30N 20P2S2 C 39H 36N2O2 P2S632.68 658.70orthorhombic triclinic
Pbcn11.8640(5)16.7022(7)15.5266(6)9090903076.7(2)41.3660.3112.11 to 25.1399.84575227550.023902130.7452, 0.69520.0351 (0.1360)0.0380 (0.1384)2.6690.351, -0.324
P19.4246(4)10.5576(4)17.2008(7)92.356(1)95.200(1)92.392(1)1701.24(12)21.2860.2271.93 to 27.9799.53335681400.024704170.7456, 0.70180.0422 (0.1340)0.0484 (0.1381)1.8771.030, -0.711
108

Table 3.2. Bond lengths and angles of S-nitrosothiols.
(PPN)(SSNO), 1 (PPN)(SNO), 2 PhCSNO 42
bond lengths, (A)N-0 1.257(6) 1.222(2) 1.177(6)S-N 1.689(7) 1.707(2) 1.792(5)S/C-S 1.978(2) - 1.867(3)
bond angles, (0)
O-N-S 117.3(4) 118.30(15) 114.0(4)N-S-S/C 115.7(2) - 102.1(2)O-N-S-X 20.34 - 175.7
0
S -,N
Ph 3CSNO
HON-0
0 S
HN0
SNAP
0
S -- N..-Xy! Xy! 0
Xyl Xyl
Xyl \ y Xyl
Xyl Xyl
anti-TrmSNO syn-TrmSNOFigure 3.6. Crystallographically characterized small molecule organo-S-nitrosothiols.
HBF4-Et2O reactivity. To explore the affect that protons have on SNO and to possibly prepare
HSNO in an organic solvent for further reactivity studies, the acid HBF4-Et2O, 3, was allowed to
react with 2 in acetonitrile. When the reaction was followed by UV-Vis (Figure 3.7), instant
bleaching and a loss of the absorption band at 332 nm was observed.
109
SNAP 42
1.206(3)1.762(3)1.842(2)
114.9(2)96.56(8)
179.7
anti-TrmSN0 43
1.205(6)1.781(5)1.841(4)
111.4(6)104.2(3)
179.6
syn-04TrmSNO 43
1.189(12)1.781(5)1.841(4)
123.6(7)104.2(3)
7.3

1.0-
0.9
0.8
0.7- 332
Cd 0.6-
0.6
0.4-.0
< 0.3.
0.2 3110.2 - 381
0.1.
0.0300 400 600 600 700 800
Wavelength (nm)
Figure 3.7. UV-Vis spectrum of 0.24 mM 2 (black) and 2 + 3 (red) in acetonitrile at 250 C.
To test whether the S-N bond is being homolytically or heterolytically cleaved upon
addition of acid, the reaction was repeated in a enclosed environment also containing the
colorimetric NO(g) sensor [Fe(BIPhMe)C 2], 8 (Figure 3.8). Addition of 3 to 2 results in a rapid
color change from green to orange to colorless, and a color change of the solution of 8 from
colorless to dark green, providing evidence that NO(g) is released in an acidic environment.
Homolytic cleavage of the S-N bond was previously proposed by calculations to be the more
favorable process.44
110

Figure 3.8. Left: A 20 mL vial containing a colorless solution of 8 in acetonitrile and a 5 mL vialcontaining a green solution of 2 in acetonitrile. Right: Addition of 3 to the solution of 2 results incolor loss by decomposition of SNO~ to form NO(g). The released NO(g) reacted with thesolution of 8 to turn it green.
This reaction product of SNO differs from the known reactivity of S-nitrosothiols in
acidic environments that results in the heterolytic cleavage of the S-N bond to form RS~ and
NO+, while we observe NO(g) release.45 The fate of the sulfur is currently unknown but the
sulfanyl radical (HS') could potentially form and subsequently react with itself to form persulfide
(H 2 S2 ) and further disproportionate to H2 and SO.46 The sulfanyl radical is a known product in
thermal decomposition of methyl and ethyl thiolates, or as an intermediate in sulfide
dehydrogenation of HS to So in sulfur bacteria.7 4
The SNO~ anion can be protonated at three different sites, the sulfur, the nitrogen, or the
oxygen atom. DFT calculations using Gaussian 03 using the B3LYP functional with the dgdzvp
basis set allowed us to compare the effects that protonation could have on the SNO~ anion
(Figure 3.9). Protonation of the sulfur resulted in the structure with the lowest energy.
Protonation of the nitrogen to form a S(HN)O molecule results in a free energy that is 12.9
kJ/mol higher, whereas protonation of the oxygen to form SNOH has a free energy that is 31.5
kJ/mol higher than HSNO. The calculated S-N bond length for SNO is 1.741 A, which is
111

longer than the crystallographically determined value of 1.689(7) A, however, upon protonation
the calculated S-N bond is elongated to 1.889 A. Previously reported calculations determined
the S-N bond bond energy to be 27.76 kcal/mol in HSNO and would therefore have a homolytic
dissocation rate constant of 1.75x10'-0 s- at 298 K. Possible double protonation of the sulfur may
induce S-N bond cleavage and result in the observed NO(g) release.
31.5 ki/mol
12.9 kJ/mol
0 ki/mol
'.640 q>
Figure 3.9. Calculated Energies and structures of the protonated forms of SNO-. These valueswere calculated by DFT methods in the gas phase using B3LYP/DGDZVP.
Iron-porphyrin reactivity. The reaction of 1 or 2, with [Fe"'(TPP)CI], 4, forms the products
[Fe"(TPP)(NO)], 9, a {Fe(NO)} 7 species by the Enemark-Feltham notation, and SO.49 A 3-line
EPR spectrum with <g> = 2.05 at ambient temperature provided evidence that 9 was formed and
is in agreement with previously published spectra of 9 (Figure 3.10).36 In the IR spectrum, a VNO
band at 1698 cm-1 is observed in the IR spectrum. This result matches well with the different
published values for the vNO band of 9, ranging from 1670 cm' to 1700 cm'1.3 4'5 0 The lack of
other bands in the 1650 - 1950 cm~1 region suggested that coordination of a sulfur species did
not occur to any of the nitrosated complexes. 50 Attempts to measure the conversion of 4 to 9 by
112

ReactIR were unsuccessful due to the high concentration of analyte needed that is above the
solubility limit of 1 and 2 in CD3CN.
2.08 2.07 2.06 2.05 2.04 2.03 2.02 3500 3000 20 2000 1500 1000 500
g-Factor Wavenumbers (cm-')
Figure 3.10. EPR (left) and FTIR (right) spectroscopic characterization of [Fe"(TPP)(NO)] (9)from [Fem(TPP)Cl] (4) and (PPN)(SNO) (2). EPR Conditions: RT; frequency 9.845 GHz,microwave power 2.017 mW, modulation amplitude 2.0 G; <g> = 2.05.
Formation of So was observed by extraction into pentanes and addition of a slight excess
of triphenylphosphine to form triphenylphosphine sulfide, S=PPh3 . The 31P NMR experiment
shows a peak at 42.88 ppm that matches the published value of 42.6 ppm for S=PPh3, along with
some residual PPh3 at -4.80 ppm (Figure 3.11).' This result suggests that oxidation of the sulfur
is what drives the reduction of the iron.
113
1698

0
120 110 100 90 so 70 60 s0 40 30 70 10 0 -10 -20 -30 -40 -50 -60 -70f, (o0P0)
Figure 3.11. 31P NMR spectrum of the pentane extract of the reaction of 4 and 1, in CDCl 3(black line) and the external reference H 3PO4 (red line). The peak at 42.88 ppm is S=PPh 3 andthe peak at -4.80 ppm is residual PPh 3.
Conversion of 4 to 9 can be monitored by UV-Vis spectroscopy (Figure 3.12) by
watching the blue shift of the Soret band from 417 nm to 410 nm, along with the loss of the Q-
band at 507 nm and formation of new Q-bands at 472 and 546 nm. This reaction is similar to the
reductive nitrosylation observed when the DNIC [Fe(NO) 2((2,6-
diisopropylphenyl)NC(Me)) 2CH)] reacts with 4, resulting in the formation of 9 and the MNIC
[Fe(NO)Cl((2,6-diisopropylphenyl)NC(Me)) 2CH)]. The reaction of the DNIC with 4 goes to
completion after 30 min, but the reaction of 1 or 2 with 4 goes to completion within minutes.
Stopped-flow UV-Vis spectroscopy was used to determine some kinetic parameters for
the reaction of 1 with 4 (Figure 3.13). The ki and k2 parameters of the reaction were in
agreement for all spectral changes, 0.17(1) a.u./sec and 0.0322(7) a.u./sec respectively.
114

1.621.4-
1.3- 4101.2
1.11
1.0.
0.9-
0.8-
S 0.7. a *0.6 371
0
0.6-
0.4-
0.3.
0.2472 0. -507 5460.1
0.0-
300 400 600 600 700 800
Wavelength (nm)
1.6-
1.4 -410 u
1.3 41021.24
1.2- ~120.1.1 - :::1.0-
S 0.9 11
0.8 -I 1MI
U 0.7 0 5 2 5
.2 - 371 Tim. (mm)
0.6-
0.4-
0.3 t472 10.2 -507t
5 460.1 -0.0 -
300 400 500 600 700 800
Wavelength (nm)
Figure 3.12. UV-Vis spectrum of the reaction of 4 (14 pM )with 1 equiv 1 (top) and 2 (bottom)to form 9. Insets are kinetic traces of the Soret band at 410 nm.
115
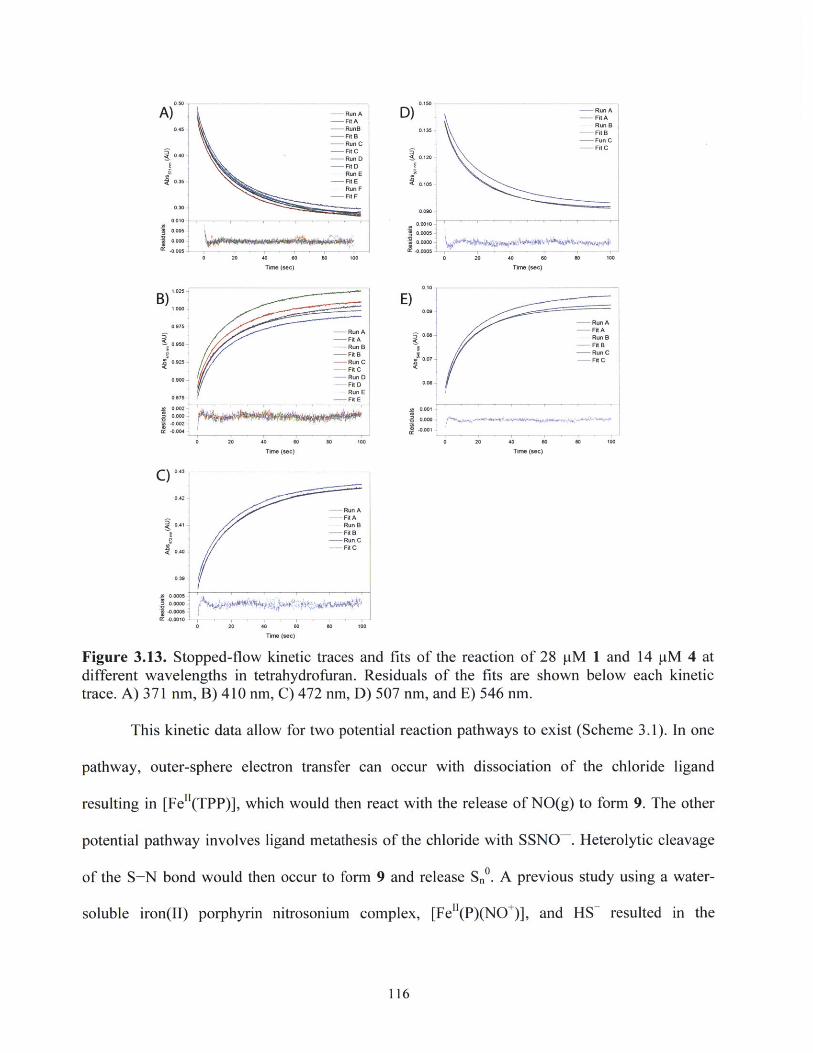
A)'0.45
0.35
- 0000
-0.005
B)1.0002
0.975
0 950
0.925
0.900
0.875 -
0.002
00 -0.004
Rn A
-- RunB
- -Fit B-Run E
-- FitE
-Run F--- Fit F
Run
AE-Fit BC
Run FC- Fit C
-- Run A-- FKA-Run E-FitB
o ~ ~ ~ - u 2C4 0 0 10T me (st )
0.150 ,D)
0.135 -
0. 120-
010
0.090-
E)0.0
007.
0.0010.000
C 0.43
0.42-0Run A
-- Fit A0.41 Run B
- Fit BS -Run C
o 4e - Fit C
.39
00000 -
.0.0010
Time (see)
Figure 3.13. Stopped-flow kinetic traces and fits of the reaction of 28 pM 1 and 14 pM 4 atdifferent wavelengths in tetrahydrofuran. Residuals of the fits are shown below each kinetictrace. A) 371 nm, B) 410 nm, C) 472 nm, D) 507 nm, and E) 546 nm.
This kinetic data allow for two potential reaction pathways to exist (Scheme 3.1). In one
pathway, outer-sphere electron transfer can occur with dissociation of the chloride ligand
resulting in [Fe"(TPP)], which would then react with the release of NO(g) to form 9. The other
potential pathway involves ligand metathesis of the chloride with SSNO~. Heterolytic cleavage
of the S-N bond would then occur to form 9 and release S.. A previous study using a water-
soluble iron(II) porphyrin nitrosonium complex, [Fe"(P)(NO+)], and HS resulted in the
116
-Rn B
-- Fit C
-- Run A-Fit A
- Run B
- Fit C
0 20 40 so W0 1DO
Time (sac)

formation of [Fe"(P)(HSNO)]." This result suggests that the second reaction pathway may be
the correct route.
Ph PhN
SN-Fe"-N NO
N
Ph _ Phe-I
Ph Ph Ph Ph
N N| ,C NO
| N-Fe"'-N SSNO I N-Fe"-N
N .. SS0 NPh Ph Ph Ph Ph Ph
N
I N-Fe'"-N (SS)nC1- I-
Ph _ Ph
Scheme 3.1. Suggested pathways in the reaction of 1 and 4.
In an attempt to compare the reactivity of 4 with NO(g) in acetonitrile, the reaction was
monitored by ReactIR (Figure 3.14). The result was not a VNO band in the 1670 - 1700 cm'1
region, but rather a strong band at 1883 cm-', corresponding to the formation of
[FeI.(TPP)(NO)Cl]. 6 Reductive nitrosylation of ferric porphyrins using NO(g) occurs only in
protic solvents, such as H20 and MeOH, to form [Fe"(por)(NO)] and HNO 2.' 5 The reaction
occurs on a slower time scale, taking longer than an hour to complete. The reaction of 4 with
Ph3CSNO in acetonitrile did not form 9 in any appreciable amount. These results suggests that 1
and 2 have a stronger nitrosating effect on iron(III) porphyrins than typical S-nitrosothiols,
NO(g), and DNICs.
117

0.151883
0.14-0.10
0.12.
oe 0.050.05 F* |--- -1-8 830.08
0.00 0.06.
1:0120 0.04.
Time (min) s0002
40
1950 1900 1660 1800 1760 1700 1650 1600 T (mi)
Wavenumbers (cm")
-0.03
1686
C 0.038- 1619|W -0.05 -e -0.040-
-0.04 -0.042
40044-
.0. 74
24 -0.040-20
Time (min) 161 4048-
$1- -0.060-
4.05210 50 100 1;0 200 2;0 300
1960 1900 1650 1800 1750 1700 1650 1600 Time (mi)Wavenumbers (cm*)
Figure 3.14. ReactIR spectra of the reaction of 9 with NO(g) (top) and Ph3CSNO (bottom) inCD3CN at ambient temperature.
[Fe2 S2 ] reactivity. Reactions of [Fe2S2(SPh)4]>, 5, with NO(g) or the S-nitrosothiol Ph3CSNO
result in the formation of the DNIC [Fe(SPh) 2(NO)2] and SO. 6 Upon standing, So will react with
the DNICs to form RBA, [Fe4S 3(NO)7] , 10', and PhSSPh. When 5 is allowed to react with
either 1 or 2 the dianionic form of RBA, [Fe4S 3(NO)7]2-, 102-, forms. The FTIR spectrum
(Figure 3.15) of 102- displays vNo bands at 1691 cm ' and 1740 cm^1 and a shoulder at 1651
cm I, which are in agreement with the published spectral values of 1748 cm-1, 1689 cm-1 , and
1660 cm-1 and differ from the values of 1795 cm 1, 1743 cm'1, and 1708 cm-1 for 101-.38
118

1659
1741
1691
3600 3000 25 2000 1500 1 50 O 3500 3000 2500 2000 1500 1000 500Wavenumbers (cm") Wavenumbers (cm-1)
Figure 3.15. FTIR spectrum (KBr) of the reaction of 5 with 1 (left) and 2 (right). Thenitrosylated product in both cases is 102-.
Compound 102- is paramagnetic compared to 101-, which is diamagnetic. At room
temperature, compound 102- has a 5-line EPR spectrum with a <g> = 2.026 that matches the
published shape and <g> value of 2.025 (Figure 3.16).38 The ESI-MS shows peaks corresponding
to a mass of 529.5 m/z, which matches closely to the mass of 10 (529.6 m/z).
-439.6
g-Factor
Figure 3.16. X-Band EPR spectrum (left) and negative-mode ESI-MS (right) of 102- EPRConditions: RT; frequency 9.850 GHz, microwave power 2.017 mW, modulation amplitude 0.5G; <g> = 2.025. ESI-MS peak assignments (m/z): 439.5 ([10-3NO]-, 439.6).
The formation of 102- from a [2Fe-2S] 2- cluster and a single reagent has not been
previously reported (Scheme 3.2). We propose that the formation of the sulfanyl radical may
promote formation of the reduced form of Roussin's black anion.
119

72-ON S NO
PhS S SPh +1 or 2 ON NO Fe-NO
PhS \ S SPh \ I
5 -WsOs
ON NO
102-
+ NO(g)IPh3CSNO+ Na
71-ON S NO
PhS NO +S o ON' Fe/ NO
PhS FNO I
DNIC ON No
101Scheme 3.2. Reaction pathways of 5 to form iron-sulfur-nitrosyl products.
Nitrogen rich carboxylate-bridged diiron reactivity. The reaction of
[Fe2(Et-HPTB)(PHCOO)](BF 4)2, 6, with NO(g) and Ph3CSNO has been previously explored
and results in the formation of a di-MNIC species, [Fe2(Et-HPTB)(PhCOO)(NO) 2](BF4)2, 6-NO,
with a vNO band at 1785 cm- 1.53 ' 54 Recently our lab reported that oxidation of 7 with NOBF4
results in the formation of the first synthetically prepared diiron-mono-MNIC,
[Fe2(Et-HPTB)(OH)(NO)(DMF) 2](BF4)3.54 The known NO chemistry of this carboxylate-
bridged diiron complex gave us a reference framework to examine and compare the chemistry
that 1 and 2 exhibits.
In the reaction of 6 with 2, the iron dissociates from the original complex to form 10'.
This transformation was observed by the formation of vNO bands at 1700, 1739, and 1795 cm-' in
the FTIR spectrum and mass peaks corresponding to 10 in the ESI-MS spectrum (Figure 3.17).38
120

4000 3M00 3000 286 2000 1500 1000 500 _qWavenumbers (cm-)
Figure 3.17. FTIR (left) and negative-mode ESI-MS (right) spectra of 101- formed from 6 and 2.ESI-MS peak assignments (m/z): 529.5 ([10], 529.6), 499.4 ([10-1NO] , 499.6), 469.4([10-2NO]f, 469.6), 439.4 ([10-3NO] , 439.6).
The formation of (PPN)[FeS5(NO)2], 11, is observed when 6 is allowed to react with 2.5
equivs of 1. The FTIR spectrum (Figure 3.18) shows two strong vNO bands at 1694 cm-1 and
1739 cm-', values comparable to the published data of 1695 cm-' and 1739 cm'1. 39 The
characterization of 11 is further corroborated by an X-Band EPR spectrum (Figure 3.19) showing
an isotropic signal at room temperature with <g> = 2.030 and a rhombic pattern with g, = 2.0148,
g2= 2.0304, g3 = 2.0494 as a frozen solution at 77 K. In the ESI-MS experiment peaks similar to
10 are observed which are ascribed to air oxidation from the experimental setup, along with a
peak at 275.6 m/z that matches that of 11.
4000 3800 3000 . 2500 2000 150 1000 50
Wavenumbers (cm")
Figure 3.18. FTIR (left) and negative-mode ESI-MS (right) spectra of 11 formed from 6 and 1.ESI-MS peak assignments (m/z): 275.6 ([11]-, 275.8), 215.5 ([11-2NO]~, 215.8).
121
469.5
439.44 \ 529.5
A499.4
24 .. ~ 4f~
275.6
J, _ I JIl 7
6394N I
1739
1739N
1694

2. 5 2.04 2.03 2.02 2.01 2.08 2. 6 2.04 2.02 2.00 1.98 1.96g-factor g-factor
Figure 3.19. X-band EPR spectra of 11 at room temperature (left) and 77 K (right). EPRConditions: RT - frequency 9.846 GHz, microwave power 2.017 mW, modulation amplitude 0.5G, <g> = 2.03; 77 K - frequency 9.193 GHz, microwave power 2.012 mW, modulation amplitude5.0 G, g, = 2.0148, g2= 2.0304, gs = 2.0494.
Oxygen-rich carboxylate-bridged diiron reactivity. In an attempt to further the understanding
in the reactivity of RNOS with carboxylate-bridged diiron complexes, we prepared the known
compound [Fe2(p-OH)(p-Ph4DBA)(TMEDA)2(OTf)], 7, which has both 5- and 6-coordinate
irons. We wanted to exploit this difference in coordination to form a diiron-mono-M4NIC species,
however, upon reaction with NO(g) or PhCSNO the complex [Fe3(p-
0)2(TMEDA)2(Ph4DBA)2(NO)2](OTf), 12, was formed. This species does not exhibit a signal in
the EPR experiment at ambient temperature and 77 K, similar to the results obtained previously
using 6 with NO(g) or NO+.
Two full molecules of 12, a methylene chloride, and two molecules of diethyl ether are
present in the asymmetric unit of crystals grown by vapor difflusion of diethyl ether into a
methylene chloride solution (Figure 3.20). The iron atoms form a linear chain bridged by two
carboxylate ligands and an oxygen atom. This linear chain has been observed before when using
bridging-carboxylate ligands but never with bound nitrosyls.5
The iron atoms were assigned to have a 3+ oxidation state based on the bond valence
method .56 The bridging oxygen atoms were assigned to be 02- rather than HO-, for a hydrogen
122

atom could not be detected near the oxygen atoms. The outer irons are bound to a bent nitrosyl
and chelated by a TMEDA ligand. The central iron is bound only to oxygen atoms of the
Ph4DBA2 ~ ligands and the bridging oxygen atoms. The nitrosyls are bent inwards with Fe-N-0
bond angles of 146.0(5)0, 145.1(5)0, 142.0(6)*, and 138.7(6)*. The nitrosyls have N-O bond
distances of 1.128(7) A, 1.133(7) A, 1.132(8) A, and 1.085(7) A, and Fe-N bond distances of
1.803(5) A, 1.778(5) A, 1.777(5) A, and 1.864(6) A. The Fe-N-O bond angles of 12 are more
acute than those of other published nitrosyl-diiron complexes (table 3.3), suggesting that they
could be formally assigned as NO, which would change the assignment of the bridging oxygen
atoms from 02~ to HO~. The Fent--Obidge-Fen bond angles of 12 are 121.56(17)*, 123.73(17)*,
122.05(18)0, and 124.07(18)0, which are greater than the Fe-Osridge-Fe bond angle of
110.45(11)* for 1. The Fe-Obridge bond lengths for 12 are 1.956(4) A, 2.026(4) A, 2.034(4) A,
and 1.955(4) A for the outer iron atoms, and 1.985(3) A, 1.977(3) A, 1.958(4) A, and 1.961(4) A
for the inner iron atom. In the structure of 7 the Fe-Osridge bond distances are 2.020(2) A for the
six-coordinate iron and 1.953(2) A for the five-coordinate iron.
Table 3.3. Selected geometrical parameters of 12 and other diiron-nitrosyl species.12 6-NO,"' [Fe2(Et-HBTXDMF)2(NOXOH) 3 +, [Fe2(BPMP)( Pr)(NO)2]2,
54 57
bond Length, AFe-N 1.778(5) 1.777(5) 1.749(8) . 1.787(2) 1.774(2)
1.803(5) 1.864(6) 1.750(7) 1.796(3)N-O 1.128(7) 1.132(8) 1.156(8) 1.109(6) 1.156(3)
1.133(7) 1.085(7) 1.151(8) 1.172(3)Fe-Ob, 1.956(4) 2.034(4) 2.017(5) 1.952(2) 2.0570(19)
2.026(4) 1.955(4) 2.006(5) 2.044(2) 2.020(2)bond angle, *Fe-N-O 138.7(6) 145.1(5) 166.6(7) 171.0(3) 155.4(2)
142.0(6) 146.0(5) 168.3(7) 144.7(2)Fe-O-Fe 121.56(17) 122.05(18) 117.7(2) 130.0(1) 116.71(9)
123.73(17) 124.07(18)
123

A)
VVV
C) 01 02
N1 0121 0122 0222 0221 N2
N181 FelFe3 Fe2 N281
0200
N185
0151 0152 0252 0251 N285
Figure 3.20. Drawing of the crystal structure of 12. A) Complete asymmetric unit prior toapplying the SQUEEZE function of Platon to remove the disordered diethyl ether.25 B) Singlemolecule of 12. C) Coordination environment of the linear iron chain of 12. Ellipsoids are shownat 50% probability. Hydrogens are omitted for clarity.
124
B)

Table 3.4. X-ray crystallographic data for 11 -(PPN)(OTf) and 12-2Et 2OO.5CH2C 2 at lOOK.Compounds (PPN)(Fe(NOS5 ], 11 [Fe 3(p-Oy)(TMEDA)2(Ph4DBA)2(NO)2 1(OTf), 12Formula C73H6OF 3FeN405 P4S6 C95.5HqOClFFe3N60 17.5Sformula weight 1502.34 1893.8crystal system orthorhombic monoclinicspace group P2 12121 P2 1/c
a, A 15.2542(12) 12.7891(10)b, A 30.042(3) 43.864(4)
c, A 30.062(3) 33.243(3)1, deg 90 95.5330(10)
V, A3 13776(2) 18562(3)Z 8 8Pakd, g/cm 3 1.449 1.355P, mm~' 0.557 0.5890 range, deg 0.96 to 30.51 0.77 to 25.26completeness to 0, % 100.0 99.5reflections collected 400185 292850independent reflections 42061 33495R(int) 0.0811 0.0714restraints 9611 0parameters 1732 2306Max., min. transmission 0.9413, 0.8419 0.7452, 0.6091
R1(wR2) [I>2a(I)] 0.0633 (0.1524) 0.1081 (0.2456)R1(wR2) 0.0818 (0.1676) 0.1207 (0.2494)GoF(F2) 1.067 2.339max, min peaks, e.A 3 2.365, -0.848 1.810, -1.486
When the reaction of 4 and NO(g) was followed by UV-Vis (Figure 2) in acetonitrile at
25* C, bands initially grew in at 434 nm and 617 nm along with a shoulder at 341 nm. The
spectrum then continued to change, with the shoulder at 341 nm continuing to increase in
intensity and the band at 431 nm red-shifts to 452 nm and decreasing in intensity, with a pseudo-
isosbestic point at 420 nm. These changes suggest that the reaction is multi-phasic with multiple
kinetic parameters. The reaction may proceed through oxidation of the iron atoms, which then
leads to disproportionation into 12 and an unknown non-nitrosylated iron species.
125

2.0 1.35-
1.8 1.20
1.6 1.05.
1.4 34730.90- 3 1
1.2 ___
.20.75 4521.0 i
-e o.8~e0.80.6 434452 0.45
0.4 0.30-
0.2. 617 0.16<0.0 1_____________________________ 0.00
30 40 500 600 700 800 0 15 30 60 75 90
Wavelength (nm) Time (min)
Figure 3.21. The UV-Vis spectrum (left) and selected kinetic traces (right) of the reaction of 7and excess NO(g) in acetonitrile at 25' C. Scans were collected every 30 seconds.
The reaction could also be followed by ReactIR in CH2Cl2 at ambient temperature (Figure
3.22). Four bands were monitored that have different rates of change in intensity. Bands at 1722
cm' and 1602 cm-1 grow in, while a the initial carboxylate band at 1627 cm 1 diminishes. A
band at 1615 cm- 1 initially forms, but begins to disappear after 4 min. The band at 1722 cm-' is
the VNO band, while the 1602 cm' , 1615 cm-1, and 1627 cmn1 are the changes of the vibrations
from the carboxylate stretch. No intermediate iron-nitrosyl species were observed, even at -77'
C. The observed changes of the band intensities suggest that oxidation of the iron atoms and
rearrangement of the iron-carboxylate coordination occurs prior to NO binding. The vNO band is
40 - 80 cm' lower in energy than other published synthetic nitrosyl-diiron models, but is closer
to the resonance Raman vNO value of 1681 cm 1 observed for a mononitrosyl-diiron species of
the flavodiiron nitric oxide reducates active site (FDP-NO).5 3,54 ,5 7,5 8 The FDP-NO species is
proposed to have a bent nitrosyl oriented toward the non-nitrosylated iron atom, a geometry that
we observe in the crystal structure of 12.
126

1722 1602 0.040-0.04 0.035-
0.030-
002 0.025
0.020
0.015
0.010_0.000--. 2 0.010.
100 -0.005
Time (min) 12 -0.010
40 1627 01
-0.020100 1750 1700 1650 1000 150 1500
Wavenumbers (cm") 0 5 10 15 20 25
Time (min)
Figure 3.22. ReactIR spectrum (left) and selected kinetic traces (right) of the reaction of 7 withNO(g) recorded in CH2 CI 2 at ambient temperature. Scans were collected every min and thespectra were referenced to the initial scan.
The 57Fe M6ssbauer spectrum of compound 5 was fit with three sites (Figure 4). The first
and second fitted sites have similar isomer shifts, but different quadrupole splitting parameters.
The second fitted site compares favorably to the value published for 1 (5, 0.67 mm/z; AEQ, 1.44
mm/z). The third fitted site compares favorably to the published values of the iron atoms in the
oxygen-rich coordination environment in the complex [Fe 4(u-OH) 6(PIM)(Ph 3CCO 2)2] (6,
0.51(2) mm/s; AZEQ, 1.06(2) mm/s) and similar to the published value of the species formed in the
reaction of 7 and 02 at low temperature (6, 0.53(1) mm/s; AEQ, 1.28(3) mm/s), suggesting that
this site corresponds to the central iron atom.
127

RawFitSite 1Site 2Site 3
-2 -1 0 1 2 3
Velocity (mm/s)Figure 3.23. 57Fe M6ssbauer spectrum of 5 collected at 80 K. Color coding: raw, black; full fit,red; site 1, blue; site 2, green; site 3, pink. Site 1: 6, 0.70(2) mm/s; AEQ, 1.02(2) mm/s; F, 0.32(2)mm/s; Area, 0.30%. Site 2: 6, 0.68(2) mm/s; AEQ, 1.47(2) mm/s; F, 0.35(2) mm/s; Area, 0.26%.Site 3: 5, 0.51(2) mm/s; AEQ, 0.95(2) mm/s; F, 0.49(2) mm/s; Area, 0.44%.
The reaction of 7 with both 1 and 2 yielded similar results as for 6. Formation of 10'- was
observed by the characteristic VNO bands at 1700 cin', 1739 cm-', and 1795 cm-' in the FTIR
spectrum as well as the correct mass isotopic patterns in the ESI-MS spectrum in the reaction
with 2.38 In the reaction with 1 the formed product was 11, as characterized by the vNO bands at
1695 cm'1 and 1739 cm-1 in the IR spectrum, the <g> = 2.030 in the room temperature X-band
EPR spectrum, and the X-ray crystal structure. 39
Crystals of 11 were formed with (PPN)(OTf) by vapor diffusion of diethyl ether into 2-
methyl tetrahydrofuran (Figure 3.24). The crystals appeared as plates with merohedral twinning.
The crystals initially appeared to be in a tetragonal space group, but were found to be in the
orthogonal crystal system with the space group P212121. Within the asymmetric unit there are
two molecules of (PPN)[FeS 5(NO)2] and two molecules of (PPN)(OTf). The FeS5 ring has a
128

chair conformation. The N-O bond distances are 1.123(7) A, 1.159(7) A, 1.143(6) A, and
1.170(7) A, which are a little shorter than the published values of (PPN)[FeS5 (NO)2] of 1.177(3)
A and 1.178(3) A.39 The Fe-N-O bond angles are almost linear at 167.2(5)', 174.8(5)0,
164.9(5)0, and 174.2(5)*, which compare favorably to the published values of 165.9(2)' and
172.8(2) .
Oil
Nil11
Fel
N12
15 012
S24
S23 522
022
N22
525
S25Fe2
N21
021~21
Figure 3.24. Drawings of the X-ray crystal structures of the asymmetric unit (top) and the twoindependent [FeS 5(NO)2] , 11, molecules (bottom). Ellipsoids are drawn at 50% probability.Hydrogen atoms are omitted for clarity. Color scheme: iron, orange; sulfur; yellow; nitrogen,blue; oxygen, red; phosphorous, magenta; fluorine, green; carbon, colorless.
129
S12
/ K* S513
514\
SS

Complex 11 has been proposed as an intermediate in the formation of 101-.5 9 Oxidation
of 11 by [Cp2Fe](BF4) is reported to form 101- in 65 % yield. The reaction of 6 and 7 with 1 and
2 extrudes the iron atoms from their carboxylate and N-donating ligands to form these sulfur and
nitrosyl-containing complexes, but it is currently unclear why the reaction with 1 prefers to form
the DNIC 11 over 101-. Current speculation posits that the polysulfide nature of 1 forms the S52-
ligand more readily than the single sulfide released from 2.
Et\ Ph /Et~ 2+
NN
6-N2O
F -
t N N
6 0
S-1-
Et 2+ NO
\t F 1eN ON ONN/N
N NOPh NF/
Fe" OFe
Scheme 3.3. Reaction pathways of 6 and 7 with various RNOS species.
Mononuclear iron complex reactivity. To test whether the difference in reactivity between 1
and 2 could also be observed with a mononuclear iron complex we used [Fe(BIPhMe)C1 2], 8.
The reaction of 8 and 1 also formed 11, but this result was expected based on the reactivity of 6
and 7, however, when compound 8 was allowed to react with 2, compound 11 was the only iron-
nitrosyl species that formed. The FTIR spectra (Figure 3.25) of the reactions have two VNO bands
130

at 1694 cm' and 1739 cm'. The 77 K X-band EPR spectrum shows a rhombic signal with gi =
2.0485, g2 = 2.0294, and g3 = 2.0138, which compares favorably to the spectrum of 11 obtained
from 6.
1694
1739
4000 3500 3000 2500 2000 1500 10,00 50 2.08 2.07 2.06 2.06 2.04 2.03 2.02 2.01 2.00 1.99 1.98
Wavenumber (cm1) g-Factor
Figure 3.25. Spectroscopic characterization of the product in the reaction of 8 and 2. The FTIRspectrum (left) was collected as a KBr pellet. The X-band EPR spectrum (right) was collected at77K. EPR Conditions: 77 K - frequency 9.175 GHz, microwave power 0.2017 mW, modulationamplitude 1.0 G, g, = 2.0485, g2= 2.0294, and g3 = 2.0138.
The formation of only 11 from the reaction with 2 was somewhat surprising, formation of
101 being anticipated. The current hypothesis is that the close proximity of the iron atoms to one
another in 6 and 7, and the single sulfide that is released from 2 may promote self-assembly of an
iron-sulfur cluster that is then converted into 101-. The iron atoms of 8 are farther apart, allowing
for the formation of polysulfide ligands from the sulfides.
3.4 Summary and Conclusions
The S-nitrosothiol salts 1 and 2 were prepared using an altered experimental setup of a
previously published synthesis. These salts were characterized by UV-Vis, FTIR, and X-ray
crystallography to match the published compounds. Compound 2 was further characterized by
cyclic voltammetry to have an irreversible reduction occur at -2.64 V.
131

These S-nitrosothiols readily release NO(g) upon addition of acid. The reaction of 1 and 2
with [Fe"'(TPP)Cl] resulted in reductive nitrosylation of iron to form [Fe"(TPP)(NO)]. In the
reaction of a [2Fe-2S] cluster with these S-nitrosothiols, dianionic Roussin's black anion, 102-,
forms, a result that has not been previously reported from a single nitrosating reagent. The
reaction of 1 or 2 with a mononuclear iron(II) complex resulted in the formation of the DNIC 11.
A difference in reactivity between 1 and 2 was observed with the carboxylate-bridged diiron
complexes. In the reactions with 1, 11 was formed, but in the reaction with 2, the nitrosated
product is Roussin's black anion, 101-.
This reactivity profile for these S-nitrosothiols is very unique but did not produce any
new compounds or improve upon known synthetic methods for obtaining the previously reported
compounds.
132

3.5 References
1. Bosworth, C. A.; Toledo, J. C., Jr.; Zmijewski, J. W.; Li, Q.; Lancaster, J. R., Jr., Proc.Nati. Acad Sci. U.S.A. 2009,106,4671.
2. Chen, Y.-J.; Ku, W.-C.; Feng, L.-T.; Tsai, M.-L.; Hsieh, C.-H.; Hsu, W.-H.; Liaw, W.-F.;Hung, C.-H.; Chen, Y.-J., J. Am. Chem. Soc. 2008, 130, 10929.
3. Cho, D.-H.; Nakamura, T.; Fang, J.; Cieplak, P.; Godzik, A.; Gu, Z.; Lipton, S. A.,Science 2009, 324, 102.
4. Foster, H. W.; Cowan, J. A., J Am. Chem. Soc. 1999, 121, 4093.5. Hickok, J. R.; Vasudevan, D.; Thatcher, G. R.; Thomas, D. D., Antioxid. Redox Signaling
2012, 17, 962.6. Lewandowska, H.; Kalinowska, M.; Brzoska, K.; Wojciuk, K.; Wojciuk, G.; Kruszewski,
M., Dalton Trans. 2011, 40, 8273.7. Tennyson, Andrew G.; Lippard, Stephen J., Chem. Biol. 2011, 18, 1211.8. Tonzetich, Z. J.; McQuade, L. E.; Lippard, S. J., Inorg. Chem. 2010, 49, 6338.9. Filipovic, M. R.; Miljkovic, J. L.; Nauser, T.; Royzen, M.; Klos, K.; Shubina, T.;
Koppenol, W. H.; Lippard, S. J.; Ivanovid-Bunnazovi, I., J. Am. Chem. Soc. 2012,134,12016.
10. Seel, F.; Kuhn, R.; Simon, G.; Wagner, M., Z. Naturforsch. B 1985, 40b, 160711. Lorkovic, I. M.; Ford, P. C., Inorg. Chem. 2000, 39, 632.12. Pangborn, A. B.; Giardello, M. A.; Grubbs, R. H.; Rosen, R. K.; Timmers, F. J.,
Organometallics 1996, 15, 1518.13. Armarego, W. L. F.; Chai, C., Purification ofLaboratory Chemicals. 6 ed.; Butterworth-
Heinemann: 2009; p 760.14. Dong, Y.; Menage, S.; Brennan, B. A.; Elgren, T. E.; Jang, H. G.; Pearce, L. L.; Que, L.,
J. Am. Chem. Soc. 1993, 115, 1851.15. Hagen, K. S.; Reynolds, J. G.; Holm, R. H., J. Am. Chem. Soc. 1981,103,4054.16. Harrop, T. C.; Tonzetich, Z. J.; Reisner, E.; Lippard, S. J., J. Am. Chem. Soc. 2008,130,
15602.17. Martinsen, A.; Songstad, J., Acta Chem. Scand. 1977, 31A, 645.18. Mizoguchi, T. J.; Kuzelka, J.; Spingler, B.; DuBois, J. L.; Davydov, R. M.; Hedman, B.;
Hodgson, K. 0.; Lippard, S. J., Inorg. Chem. 2001, 40, 4662.19. Kent, T. A. WMOSS v. 2.5: Mossbauer Spectral Analysis Software, WEB Research Co.,
WEB Research Co.: Minneapolis, MN, 1998.20. APEX2 v2009 APEX2 v2009, Bruker AXS: Madison, WI, 2009.21. Sheldrick, G. M. SADABS: Area-Detector Absorption Correction, University of
Gttingen: Gttingen, Germany, 2008.22. Sheldrick, G., Acta Crystallogr., Sect. A: Found. Crystallogr. 2008, 64, 112.23. Sheldrick, G. M. SHELXTL97: Programfor Refinement of Crystal Structures, University
of G~ttingen: Gttingen, Germany, 1997.24. SHELXTL v. 6.10: Program Library for Structure Solution and Molecular Graphics,
Bruker AXS, Madison, WI, 2001.25. Spek, A. L. PLA TON, A Multipurpose Crystallographic Tool, Utrecht University,
Utrecht, The Netherlands, 2000.26. Spek, A. L., J. Appl. Crystallogr. 2003, 36, 7.27. Dolomanov, 0. V.; Bourhis, L. J.; Gildea, R. J.; Howard, J. A. K.; Puschmann, H., J.
Appl. Crystallogr. 2009,42,339.
133

28. Frisch, M. J.; Trucks, G. W.; Schlegel, H. B.; Scuseria, G. E.; Robb, M. A.; Cheesman, J.R.; Montgomery, J. A. J.; Vreven, T.; Kudin, K. N.; Burant, J. C.; Millam, J. M.; Iyengar,S. S.; Tomasi, J.; Barone, V.; Mennucci, B.; Cossi, M.; Scalmani, G.; Rega, N.;Petersson, G. A.; Nakatsuji, H.; Hada, M.; Ehara, M.; Toyota, K.; Fukuda, R.; Hasegawa,J.; Ishida, M.; Nakajima, T.; Honda, Y.; Kitao, 0.; Nakai, H.; Klene, M.; Li, X.; Know, J.E.; Hratchian, H. P.; Cross, J. B.; Adamo, C.; Jaramillo, J.; Gomperts, R.; Stratmann, R.E.; Yazyev, 0.; Austin, A. J.; Cammi, R.; Pomelli, C.; Ochterski, J. W.; Ayala, P. Y.;Morokuma, K.; Voth, G. A.; Salvador, P.; Dannenberg, J. J.; Zakrzewski, V. G.;Dapprich, S.; Daniels, A. D.; Strain, M. C.; Farkas, 0.; Malick, D. K.; Rabuck, A. D.;Raghavachari, K.; Foresman, J. B.; Ortiz, J. V.; Cui, Q.; Baboul, A. G.; Clifford, S.;Cioslowski, J.; Stefanov, B. B.; Liu, G.; Liashenko, A.; Piskorz, P.; Komaromi, I.;Martin, R. L.; Fox, D. J.; Keith, T.; Al-Laham, M. A.; Peng, C. Y.; Nanayakkara, A.;Challacombe, M.; Gill, P. M. W.; Johnson, B.; Chen, W.; Wong, M. W.; Gonzalez, C.;Pople, J. A. Gaussian 03, Pittsburgh, PA, 2003.
29. Becke, A. D., J. Chem. Phys. 1993, 98, 5648.30. Lee, C.; Yang, W.; Parr, R. G., Phys. Rev. B 1988,37, 785.31. Vosko, S. H.; Wilk, L.; Nusair, M., Can. J. Phys. 1980, 58, 1200.32. Stephens, P. J.; Devlin, F. J.; Chabalowski, C. F.; Frisch, M. J., J. Phys. Chem. 1994, 98,
11623.33. Godbout, N.; Salahub, D. R.; Andzelm, J.; Wimmer, E., Can. J. Chem. 1992, 70, 560.34. Kurtikyan, T. S.; Martirosyan, G. G.; Lorkovic, I. M.; Ford, P. C., J. Am. Chem. Soc.
2002,124,10124.35. Tonzetich, Z. J.; Hdroguel, F.; Do, L. H.; Lippard, S. J., Inorg. Chem. 2011, 50, 1570.36. Wayland, B. B.; Olson, L. W., J. Am. Chem. Soc. 1974, 96, 6037.37. Moedritzer, K.; Maier, L.; Groenweghe, L. C. D., J. Chem. Eng. Data 1962, 7, 307.38. D'Addario, S.; Demartin, F.; Grossi, L.; lapalucci, M. C.; Laschi, F.; Longoni, G.;
Zanello, P., Inorg. Chem. 1993, 32, 1153.39. Tsai, M.-L.; Chen, C.-C.; Hsu, I.-J.; Ke, S.-C.; Hsieh, C.-H.; Chiang, K.-A.; Lee, G.-H.;
Wang, Y.; Chen, J.-M.; Lee, J.-F.; Liaw, W.-F., Inorg. Chem. 2004, 43, 5159.40. Veleeparampil, M. M.; Aravind, U. K.; Aravindakumar, C. T., Adv. Phys. Chem. 2009,
2009.41. Wang Peng, G.; Xian, M.; Tang, X.; Wu, X.; Wen, Z.; Cai, T.; Janczuk, A. J., Chem. Rev.
2002,102, 1091.42. Arulsamy, N.; Bohle, D. S.; Butt, J. A.; Irvine, G. J.; Jordan, P. A.; Sagan, E., J. Am.
Chem. Soc. 1999,121, 7115.43. Goto, K.; Hino, Y.; Kawashima, T.; Kaminaga, M.; Yano, E.; Yamamoto, G.; Takagi, N.;
Nagase, S., Tetrahedron Lett. 2000, 41, 8479.44. Fazaeli, R.; Solimannejad, M.; Seif, A., J. Chem. Sci. 2013, 125, 913.45. Barnett, D. J.; Rios, A.; Williams, D. L. H., J. Chem. Soc., Perkin Trans. 2 1995, 1279.46. Tiee, J. J.; Wampler, F. B.; Oldenborg, R. C.; Rice, W. W., Chem. Phys. Lett. 1981, 82,
80.47. Sehon, A. H.; deB. Darwent, B., J. Am. Chem. Soc. 1954, 76,4806.48. Sorokin, D. Y.; de Jong, G. A. H.; Robertson, L. A.; Kuenen, G. J., FEBSLett. 1998, 427,
11.49. Enemark, J. H.; Feltham, R. D., Coord. Chem. Rev. 1974, 13, 339.50. Mu, X. H.; Kadish, K. M., Inorg. Chem. 1988,27,4720.
134

51. Miljkovic, J. L.; Kenkel, I.; Ivanovid-Burmazovid, I.; Filipovic, M. R., Angew. Chem. Int.Ed. 2013, 52, 12061.
52. Fernandez, B. 0.; Lorkovic, I. M.; Ford, P. C., Inorg. Chem. 2004, 43, 5393.53. Feig, A. L.; Bautista, M. T.; Lippard, S. J., Inorg. Chem. 1996, 35, 6892.54. Majumdar, A.; Lippard, S. J., Inorg. Chem. 2013,52, 13292.55. Rardin, R. L.; Bino, A.; Poganiuch, P.; Tolman, W. B.; Liu, S.; Lippard, S. J., Angew.
Chem. Int. Ed. 1990, 29, 812.56. Brown, I. D., Chem. Rev. 2009, 109, 6858.57. Zheng, S.; Berto, T. C.; Dahl, E. W.; Hoffman, M. B.; Speelman, A. L.; Lehnert, N., J.
Am. Chem. Soc. 2013,135,4902.58. Hayashi, T.; Caranto, J. D.; Matsumura, H.; Kurtz, D. M.; Modnne-Loccoz, P., J. Am.
Chem. Soc. 2012, 134, 6878.59. Chen, T.-N.; Lo, F.-C.; Tsai, M.-L.; Shih, K.-N.; Chiang, M.-H.; Lee, G.-H.; Liaw, W.-
F., Inorg. Chim. Acta 2006, 359, 2525.
135

CHAPTER 4: REACTIONS OF NITROGENOXIDE SPECIES WITH AMONOFUNCTIONAL PLATINUM COMPLEX
136

4.1 Introduction
In the previous chapter, we explored the reactivity of SNO with iron complexes, but we
were unable to obtain a stable, crystalline metal-bound SNO complex for structural
characterization. The related anion thionylimide, NSO-, has been stabilized as metal salts, as a
silyl reagent, and as the acid.1 3 The binding of NSO~ to Ti, Hf, Zr, Ru, Os, Co, Rh, Ir, Pd, and Pt
compounds (Figure 4.1) has been studied by X-ray crystallography and by NMR and FTIR
spectroscopy. 3
00
T TolNTi NO Tol
I 01N0
TiRCP 2(NSO) 2 Ru"(TTP)(NSO)(NO)
0
N PP
P~
0
Rh"(PPh3)2(NSO) 2 Pt"(PMe3)2(NSO) 2
Figure 4.1 Known metal complexes containing the NSO~ ligand.
The most common source of NSO~ in these reactions is the alkali metal salt. These
alkalimetalthionylimides are prepared in tetrahydrofuran from alkali t-butoxides and
trimethylsilylthionylimide, (CH3)3SiNSO, which is synthesized from tris(trimethylsilyl) amine,
((CH 3)3 Si)3N, and thionyl chloride, SOC12.1,2 The M(NSO) salts can then be used for ligand
metathesis to replace a halide ion of a metal complex to form the intended M-NSO species as
137

well as to precipitate the alkali halide salt.4~ Other sources used in direct ligand metathesis
reactions are HOSN, S(NSO) 2, and Hg(NSO) 2.7
M-NSO complexes can also be prepared by oxygen atom transfer to a thionitrosyl, NS
ligand. This reaction can occur by addition of N02-, as is the case for Ru(TTP)(NO)(NSO), by
running a solution of the compound through a SiO2 column, as with Cp2Ti(NSO) 2, or by using
molecular oxygen, such as for Co(NSO)C 2(P(OPh)3)2. '' Sulfur insertion into the N-O bond
of Os(NO)X 2(PPh3)2, where X = Cl- or Br-, results in the formation of Os(NSO)X2(PPh3)2.7
Most of the metals used to form complexes are either second- or third-row transition
elements, that are typically considered to be under thermodynamic control compared to first-row
transition metals. We were hoping to exploit this characteristic to prepare an SNO~- or SSNO-
bound complex to pyriplatin, cis-[Pt(NH3)2(py)Cl](OTf), 1, and to compare the physical
properties to known NSO~ complexes, however, this goal was not achieved. We studied the
reaction of 1 with NO+ to compare the reactivity and, in the process, obtained Pt(II) and Pt(IV)
complexes (Scheme 4.1).
2+
1+ H3N., N
/% +2/3 H3N**' SH
3N,, N 1S, NH
H3~ _'*CNHL - NI 'WNH3
5(n=2)+N0* 6(n=4)
[ 1+2+ C1
H N I + HN,,/ N3N /PtxHaNNCP
Pt4N H3NVF 1 CH3N*# *NCC 3 C1
7 8Scheme 4.1. Reactions of cis-[Pt(NH3)2(py)Cl]* with SNO , SSNO , and NO+.
138

4.2 Experimental Methods
General. All manipulations were performed under an atmosphere of nitrogen gas using standard
Schlenk techniques or in an MBraun glovebox under an atmosphere of purified nitrogen. Diethyl
ether, pentane, methylene chloride, and acetonitrile were purified using a Glass Contour solvent
system.' 4 Deuterated solvents and Na15 N0 2 were purchased from Cambridge Isotope Labs Inc.
(Tewksbury, MA). cis-[Pt(NH 3)2(py)Cl](OTf), 1, was prepared according to a literature
procedure.' 5 (PPN)(SS14 1'NO), 2, and (PPN)(S'41 "NO), 3, were synthesized according to the
procedure in chapter 4. [Fe(BIPhMe)C 2], 4, was synthesized according to the procedure in
chapter 2. NOBF4 was purchased from Sigma-Aldrich, used as received, and stored in a -30* C
freezer.
Physical Measurements. NMR spectra were recorded on a Varian spectrometer operating at 500
MHz at ambient temperature and referenced to residual signals in the deuterated solvent. Low-
resolution ESI mass spectra were obtained with an Agilent 1100 Series LC/MSD mass
spectrometer using degassed acetonitrile as the carrier solvent. FTIR spectra were recorded on a
Thermo Nicolet Avatar 360 spectrometer running the OMNIC software package; solid samples
were pressed into KBr disks.
X-ray Data Collection and Structure Solution Refinement. Crystals of 7 and 8 suitable for
X-ray diffraction were mounted in Paratone N oil and frozen under a nitrogen cold stream
maintained at 100 K by a KRYO-FLEX low-temperature apparatus. Data were collected on a
Bruker APEX CCD X-ray diffractometer with Mo Ka radiation (X= 0.71073 A) controlled by the
APEX2 software package. Empirical absorption corrections were calculated with SADABS.17
The structures were solved by direct methods with refinement by full-matrix least-squares based
139

on F2 using SHELXTL-97.1 8 -20 All non-hydrogen atoms were located and refined anisotropically.
Hydrogen atoms were assigned to idealized positions and given thermal parameters equal to
either 1.5 (methyl hydrogen atoms) or 1.2 (non-methyl hydrogen atoms) times the thermal
parameters of the atoms to which they were attached. Figures were generated using the Okex2.1
Graphical User Interface.2' See Tables 2.1, 2.3, and 2.4 below for crystallographic data and
refinement details.
Theoretical calculations. Quantum mechanical density functional theory (DFT) calculations
were performed on the different binding isomers of cis-[Pt(NH 3)2(py)(SNO)]* and cis-
[Pt(NH 3)2(py)(SSNO)]+, and for the two sulfide-bridged species cis-[Pt2(NH3) 4(py)2(u-S2 )] 2+ and
cis-[Pt2(NH3) 4(py)2(P-S4)]2+. The DFT calculations were carried out in GaussianO3 using the
RPBE1PBE functional and the 31++g(d,p) basis set for non-platinum atoms and the LANL2DZ
effective core potential for the platinum atom.22 23 The atomic coordinates from the crystal
structures of 2 and 3 reported in chapter 4, and the crystal structure of 7 were used as the input
geometry optimizations for the platinum centers and the SNO and SSNO ligands. Frequency
calculations were performed to confirm that each converged upon geometry was at an energy
minimum on the potential energy surface of the molecule.
Reaction of cis-[Pt(NH 3)2(py)Cl](OTf), 1, with (PPN)(SSNO), 2. A 20 mL vial was charged
with 1 (19.8 mg, 40.6 pmol) and 2 (26.6 mg, 40.7pmol). The solid mixture was dissolved in
acetonitrile (5 mL) and allowed to stir for 2 hrs. Over the course of the reaction, the solution
formed a red-orange precipitate. The precipitate, 5, was filtered off and washed with acetonitrile
(3 x 2 mL) and diethyl ether (3 x 2 mL). The filtrate was collected, stripped, and analyzed by 'H,
'9F, and 3 'P NMR spectroscopy, and by ESI-MS to consist of (PPN)(OTf). The red-orange solid
5 (16.2 mg, 35 % total starting weight) was collected and analyzed by FTIR, 'H, '9F, 3 1P, and
140

' 95Pt NMR. 'H NMR (DMF-d7, 6 ppm): 4.83 (3H, br), 5.34 (3H, br), 7.61 (2H, t), 8.09 (1H, t),
8.93 (2H, d). 195Pt NMR (DMF-d7, 8 ppm): 2311.65 (s). FTIR (KBr, cm'1): 3287 (in), 3242 (s),
3110 (s), 3067 (s), 2963 (in), 2920 (in), 2850 (in), 1658 (sh), 1609 (s), 1571 (in), 1488 (w), 1452
(s), 1370 (w), 1340 (s), 1242 (w), 1212 (w), 1153 (w), 1113 (w), 1075 (in), 1020 (w), 762 (s),
691 (s), 534 (w).
Reaction of cis-[Pt(NH3)2(py)CIJ(OTf), 1, with (PPN)(SS' 5NO), 152. Experimental conditions
were similar to reaction with 2 and by 1H NMR and FTIR was found to consist of 5. FTIR (KBr,
cm-1): 3287 (in), 3244 (s), 3110 (s), 3066 (s), 2924 (in), 2849 (in), 1654 (w), 1609 (s), 1570 (in),
1488 (w), 1452 (s), 1370 (w), 1340 (s), 1242 (w), 1213 (w), 1153 (w), 1075 (m), 1020 (w), 762
(s), 691 (s), 533 (w).
Reaction of cis-[Pt(NH 3)2(py)CI](OTf), 1, with (PPN)(SNO), 3. A 5 mL vial was charged with
1 (12.3 mg, 25.0 pmol) and 3 (15.3 mg, 25.5 pmol). The vial was placed into a larger 20 mL vial
containing a solution of 4 in MeCN (20 pM). The solid mixture was dissolved in acetonitrile (2
mL) and allowed to stir for 2 hrs. Over the course of the reaction, the reaction solution formed a
yellow precipitate and the 4-containing solution turned dark green and was determined by FTIR
to consist of [Fe(BIPhMe) 2(NO)Cl][Fe(NO)C 3], 4-NO. The precipitate, 6, was filtered off and
washed with acetonitrile (3 x 2 mL) and diethyl ether (3 x 2 mL). The filtrate was collected,
stripped, and analyzed by 'H, '9F, and 3 1P NMR, and by ESI-MS to consist of (PPN)(OTf). The
yellow solid 6 (9.4 mg, 34 % total starting weight) was collected. 'H NMR (DMF-d 7, 8 ppm):
4.76 (3H, br), 5.23 (3H, br), 7.61 (2H, t), 8.10 (1H, t), 8.91 (1H, d). FTIR (KBr, cm-'): 3287 (in),
3239 (s), 3105 (s), 3092 (s), 3067 (s), 2924 (w), 1609 (s), 1570 (in), 1488 (w), 1452 (s), 1370
(in), 1340 (s), 1242 (w), 1213 (w), 1154 (in), 1075 (w), 1020 (w), 762 (s), 691 (s), 465 (w).
141

Reaction of cis-[Pt(NH 3)2(py)CIJ(OTf), 1, with (PPN)(S' 5NO), 153. Experimental conditions
were similar to those used with reaction with 3 and by 'H NMR and IR spectroscopy was
concluded to consist of 6. The presence of 4-'5 NO was detected by IR spectroscopy. FTIR (KBr,
cm-1): 3283 (m), 3244 (s), 3135 (s), 3109 (s), 3097 (s), 3067 (s), 1675 (w), 1610 (s), 1571 (m),
1489 (w), 1452 (s), 1370 (m), 1340 (s), 1242 (w), 1208 (w), 1154 (m), 1075 (w), 1020 (w), 762
(s), 691 (s), 452 (w).
Reaction of cis-[Pt(NH3)2(py)CJJ(OT), 1, with NOBF4 to form cis-
[Pt(NH3)2(py)(CH 3CN)](BF 4), 7, and cis-mer-[Pt(NH 3)2(py)C 3 ]Cl, 8. A 20 mL vial was
charged with 1 (21.4 mg, 43.4 smol) and dissolved in acetonitrile (4 mL). A portion of NOBF4
(10.2 mg, 87.3 imol) was dissolved in acetonitrile (4 mL) and added dropwise over the course of
1 min. The solution turned blue initially but, over the course of 3 h, turned pale yellow. The
solution was stripped and redissolved in acetonitrile (0.5 mL). Colorless and yellow block
crystals were grown by vapor diffusion of diethyl ether into the acetonitrile solution. The crystals
were too small to separate mechanically, but individual crystals could be selected for X-ray and
elemental analysis. The elemental analysis produces no useable information, but was still close
to the expected values based on the X-ray diffraction study. We suspect that the presence of
different anions within the selected crystals may be the reason. The crystal mixture was
collected, washed with diethyl ether (3 x 2 mL), and dried to yield a total collected product of 9.5
mg (30 % of expected weight). Characterization of 7: Anal. Calc'd for C7Hl4B2FgN4Pt: C,
16.08; H, 2.70; N, 10.71. Found: C, 15.77; H, 1.78; N, 9.12. 'H NMR (CD3CN, 6 ppm): 3.82
(3H, br), 3.98 (3H, br), 7.62 (2H, t), 8.10 (IH, t), 8.65 (2H, d). Characterization of 8: Anal.
Calc'd for C5HiiCl4N3Pt: C, 13.34; H, 2.46; N, 9.34. Found: C, 13.65; H, 1.88; N, 9.15.'H NMR
142

(CD3CN, 8 ppm): 5.20 (3H, tt, JH-Pt 22.9 Hz, JH-N 63.9 Hz), 5.32 (3H, tt, JH-Pt 24.5 Hz, JH-N
53.8 Hz), 7.71 (2H, dd), 8.24 (1H, tt), 8.91 (2H, dt).
4.3 Results and Discussion
Reaction of cis-[Pt(NH 3)2(py)ClJ(OTf) with (PPN)(SSNO) and (PPN)(SNO). In an attempt to
form a stable SNO~ or SSNO~ complex, [Pt(NH 3)2(py)Cl](OTf), 1, was used. Both
(PPN)(SSNO), 2, and (PPN)(SNO), 3, react to form a Pt-containing species 5 and 6 that are
highly insoluble in all solvents except for N,N'-DMF and DMSO. Attempts were made to grow
crystals of N,T'-DMF solutions of 5 and 6, but all were unsuccessful and only resulted in non-
crystalline precipitates.
These two reactions form two slightly different species, 5 and 6, based on their colors,
red-orange and yellow, respectively, and their 'H and '9 5Pt spectra (Figure 4.2). The 'H NMR
spectra consist solely of peaks assigned to Pt-bound amines and pyridine that are shifted
downfield from the starting material. This result suggests that the Cl- ligand may be replaced
with a more electron-withdrawing ligand. The PPN+ cation and OTf~ anion are removed and only
present in the worked up filtrate, based on ESI-MS, and on '9F, and 31P NMR spectroscopy.
143

a .4 V 4 44*q Iq a
ct S P. 414 1
R q I
9.5 9.0 8.5 8.0 7.5 7.0 6.5 6.0 5.5 5.0 4.5 4.0fi (ppm)
Figure 4.2. 'H NMR spectra of 1 (black), 1 + 2 (blue), and 1 + 3 (red) in DMF-d 7.
Compounds 5 and 6 contain Cl-, as determined by the instant formation of a precipitate
upon addition of Ag+ and Tl+ salts. It was initially thought based on these data and the mass
balance of the reaction that the precipitated species 5 and 6 were cis-[Pt(NH 3)2(py)(SSNO)]Cl
and cis-[Pt(NH 3)2(py)(SNO)]Cl, respectively. This result was shown to not be the case after
preparing 5 and 6 with the use of 15N-isotopically labled 2 and 3 a measuring their FTIR spectra
(Figure 4.3). The isotopically labeled spectra overlay directly on the natural abundance ones,
indicating that the labeled nitrogen of 2 and 3 is not incorporated into the final product.
144

SSNOI S14N-SSNONO
S15N 15d
100 1700 1600 100 100 1300 1200 1100 1000 1160 1io0 IO 16 v6 I 1 2oo 1200 1 00 0 oWavenumbers (cm-) Wavenumbers (cm")
Figure 4.3. FTIR spectra (KBr) of natural abundance (black) and 15N labeled (red) 5 (left) and 6(right).
To ascertain the fate of the nitrogen atom, the preparation of 6 was repeated while sharing
the headspace with a 20 pM solution of 4 in acetonitrile in a closed vessel. After a 2 hour
reaction period, the 4-solution turned green, signaling the presence of NO(g) (Figure 4.4) by
observing the FTIR spectrum of the green solution. This result shows that 1 homolytically
cleaves the S-N bond of 3.
Figure 4.4. Vials following the formation of 6 and release of NO(g) to convert 1 into itsnitrosylated product. Initial (left) and after 2 hrs (right).
Our current hypothesis is that the Pt-species contains a polysulfide ligand and successful
crystallization conditions remain elusive. Because 5 and 6 have different colors and their 'H
NMR spectra do not overlay, we believe that the difference between these two compounds may
145

reflect the length of the polysulfide ligand. To investigate the structure of the product more
thoroughly, additional spectroscopic characterization using resonance Raman or XAS
spectroscopy would be required.
DFT calculations of polysulfide-bridged Pt-species. Since we determined that the final
species did not contain an NO-containing ligand, we proceeded to calculate the vibrational
spectrum of two cis-[Pt(NH3)2(py)2+ units bridged by di- and tetrasulfides (Figure 4.5). We
optimized the geometry of both molecules, which resulted in the two Pt-centers of each molecule
to be equivalent. For both molecules, the Pt-N distances were lengthened by -0.04 - 0.11 A
compared to the published distances of 1. Between the two calculated structures the only major
difference in geometrical parameters is the Pt-S---S-Pt dihedral angle (Table 4.1). For the
S4-bridged molecule, the dihedral angle is -180*, whereas for the S 2-bridged molecule the
dihedral angle is ~117*. This difference can be attributed to hydrogen bonding between an amine
proton and the secondary sulfur in both structures. The additional sulfur atoms of the S4-bridged
molecule allow for the Pt-S--S-Pt dihedral angle to adjust itself to -180*.
146

Figure 4.5. Calculated structures of cis-[Pt2(NH 3) 4(py) 2(U-S2 )] 2+ (left) and cis-[Pt2(NH3) 4(py)2(u-
S4)]2+ (right). Color scheme: platinum, light grey; nitrogen, blue; sulfur, yellow; carbon, darkgrey; hydrogen, white.
Table 4.1. Selected calculated geometrical parameters for 5 and 6.cis-[Pt2(NH3)4(py) 2(U-S2)]2+ cis-[Pt 2(NH3)4(py)2(p-S4)]
bond length, APt-Namine
Pt-NpyridinePt-SS-S
Hamine-SBond angles,Namine-Pt-NamineNamine-Pt-Nyridine
Namine-Pt-S
N pyidine-Pt-SPt-S-SS-S-SDihedral angles,Pt-S---S-PtS-S-S-S
2.073112.157602.043512.321672.08500
2.23192
92.0675189.08125178.4429292.75949174.2917986.03822109.85713
116.86187
2.073522.159002.042312.317762.036852.200052.28634
92.1009789.28411178.5945793.11209174.7724085.50129110.17700103.41323
179.99814179.99582
The FTIR spectrum of 5 and 6 match fairly well with only a few features that are shifted
by a few wavenumbers, and the same is true of the vibrational spectra of the two calculated
147

molecules (Figure 4.6). The vibrational spectrum of the two calculated structures were corrected
by fitting the calculated values of selected peaks with experimental peaks that looked to be
appropriate (Table 4.2). After fitting, the calculated and experimental spectra have fairly similar
bands. Any variations in wavenumbers may be attributed to hydrogen bonding interactions that
may occur in the solid state and were not calculated. There is a band in both of the calculated
structures, 865 cm 1 and 883 cm-1, that does not have a corresponding experiment peak. These
bands are bending modes of the amine protons that do not effect a change in the dipole moment
of the molecule, suggesting that these may be IR-silent vibrations. These calculated results
provide further data that 5 and 6 have similar structures but with different length polysulfide
linkers.
Calculated:[Pyriplatin] 2S 2[Pyriplatin] 2S 4
Experimental1 + SSNO~1 + SNO
600 800 1000 1200 1400 1600
Wavenumbers (cm-1)
Figure 4.6. Calculated spectra of cis-[Pt2(NH 3)4(py) 2(U-S2 )]2+ (black) and cis-[Pt2(NH3)4(py) 2(u-S 4)] 2+ (red) overlayed on spectra of 5 (blue) and 6 (green). The calculated spectra were correctedby fitting selected peaks to experimental data.
148

Table 4.2. Vibrational energies used to prepare fitting equation for calculated spectra.Experimental: Calculated: Experimental: Calculated:
5 cis-[Pt2 (NH3 )4 (py (-S 4)2 6 cis-[Pt2(NH3) 4(py 2 (p-S2)12
691 cm~' 708 cm~ 691 cm-' 707 cm-'761 cmn' 786 cm- 761 cmn' 787 cm-'1451 cm-' 1499 cm 1451 cm~ 1501 cm-'1570 cm-' 1644 cm' 1570 cm~ 1645 cm-'1609 cm-1 1683 cmn 1 1609 cm' 1684 cm~'
Fit equation: 0.9463x + 20.258 cm-' Fit equation: 0.9449x + 21.253 cm'iR2: 0.9997 R2: 0.9998
DFT calculations of cis-[Pt(NH 3)2(py)(SNO)]* and cis-[Pt(NH 3)2(py)(SSNO)]. We
performed DFT calculations using the RPBE1PBE functional in Gaussian 03 to determine how
the energy of the N-O vibration changes among the different binding modes possible for cis-
[Pt(NH3) 2(py)(SNO)]+, 1-SNO, and cis-[Pt(NH3)2(py)(SSNO)], 1-SSNO. In both situations, the
binding of the terminal sulfur to the platinum center was the most energetically favorable.
Platinum binding to the nitrogen in 1-SNO has a free energy that is higher by 29.5
kJ/mol, whereas the oxygen-bound species is less favorable by 77.9 kJ/mol compared to the
sulfur-bound species. The S-N bond in sulfur-bound 1-SNO is elongated by 0.159 A to 1.848 A
compared to the anion, but is 0.041 A shorter than the calculated HSNO structure. The Pt-S
bond is calculated to be 2.299 A.
149

77.9 kJ/mol
29.5 kJ/mol
0 kJ/mol
1178 1.5911.314
f148 3 al234
222.*004 2.006
2.025 2.-4 4 C066-1A ---34 2-B076
14 M;2
F g r 122170 '' 22 W '2 10
Figure 4.7. Energies and structures of - SNO calculated by DFT.
The VNO stretching frequency of 1. SNO varies significantly between the different
calculated structures. For the energetically favorable sulfur-bound structure the frequency is
1742 cm The VNO stretch decreases as the binding site moves to the nitrogen and oxygen,
resulting in values of 1483 cm and 1134 cm respectively.
1742 cm-1
1134 cm-1 N-Bound-S-Boundl
0-Bound
14 3 cm-1
oI 400 800 1200 "1600 20'00 '24100 '2800 3200 3600
Wavenumbers (cm)
Figure 4.8. Vibrational spectra of I -SNO calculated by DFT using the RPBE1IPBE basis set.
In the calculated structure of 1 SSNO, binding to the secondary sulfur results in a free
energy that is unfavorable by 52.2 kJ/mol. Nitrogen-binding to the platinum is less favorable by
90.5 kJ/mol and oxygen-binding is even less favorable, by 98.4 kJ/mol. When we attempted to
150

calculate the S- and O-chelated structure of I-SSNO, the oxygen atom moved away from the
platinum and the SSNO-moiety rotated until it was in the same position as was calculated for the
terminal, sulfur-bound species. For the calculated structure of 1-SSNO, the S-N bond elongated
to 1.789 A with a Pt-S bond of 2.318 A.
98.4 kJ/mol90.5 kJ/mol
52.2 kJ/mol
0 kJ/mol
1925 1.624
2233 1.22 L A6
?A 2.23 LOML980
20328 7
Figure 4.9. Energies and structures of F-SSNO calculated by DFT.
The calculated VNO stretch of 1-SSNO spans a wider range than those calculated for
1-SNO. The energetically favorable terminal sulfur-bound species has a VNO stretch that is
calculated to occur at 1686 cm~', but this stretch increases in energy for the secondary sulfur-
bound case to 1962 cm-1 . The nitrogen-bound species has a calculated VNO stretch at 1506 cm-',
which is higher than for the N-bound 1-SNO case. The oxygen-bound species is calculated to
occur at 1287 cml.
151

1962 cm-1
-tS-Bound-- sS-Bound
N-Bound
1506 cm-1 -Bound
1686 -1
1287 cm-1
0 400 800 1200 1600 2000 2400 2800 3200 3600
Wavenumbers (cm-)Figure 4.10. Vibrational spectra of 1-SSNO calculated by DFT using the RPBE1PBE basis set.
Reaction of cis-[Pt(NH 3)2(py)CI](OTf) with NOBF 4. To understand whether 1 is susceptible to
oxidation by NO+, we performed a reaction with the reagent NOBF 4. Because 2 and 3 can
theoretically be perceived as consisting of S.2- and NO+, we wanted to compare the reaction
products obtained from exposure to NO+. Published reaction products of Pt(II) compounds with
NO+ include five-coordinate square pyramidal complexes having NO+ in the axial position and
the counterion of the nitrosonium salt. 2425
The reaction initially formed a pale blue solution, proposed to be a platinum-platinum
dimer, but turns pale yellow over the course of three hours. The solution contained the Pt(II)
species cis-[Pt(NH 3)2(py)(CH 3CN)]2+, 7, and the Pt(IV) species cis-mer-[Pt(NH3)2(py)Cl3], 8,
by X-ray crystallography and by 'H NMR spectroscopy. Pt(IV) compounds prefer to have an
octahedral geometry and therefore require two axial ligands to bind upon oxidation, which is
accomplished by removing the chlorides of two equivalents of 1 to form 8. The now open
coordination sites of 1 can be occupied by acetonitrile to form the {PtN4} complex 7.
152

Both 7 and 8 were crystallized by diffusion of diethyl ether into a crude acetonitrile
solution of the reaction. Crystals of 7 are colorless and have two BF4 molecules as counter ions.
The complex is square planar with adjacent bond angles that are 90' 10. The Pt-Naine bond
distances are 2.029(3) A and 2.049(3) A for the amines cis and trans to the pyridine ring,
respectively, which are shortened compared to the values of 2.0379(18) A and 2.0404(18) A
published for the structure of 1. The Pt-Npyriine bond distance is 2.024(3) A, which is
comparable to the published value of 2.0222(18) A for 1. The Pt-Nacetonitriie bond distance is
1.975(3) A and is much shorter than the Pt-Cl bond distance of 2.3047(5) A in the structure of 1.
N2 N1
4
Pti
N3 N11
Figure 4.11. Representation of the X-ray crystal structure of 7 with ellipsoids shown at 50%probability. Hydrogen atoms are omitted for clarity. Color scheme: platinum, red; nitrogen, blue;fluorine, green; boron, yellow; carbon, colorless.
Yellow crystals of 8 were collected from the same crystallization setup as 7. These
crystals have two molecules of 8, which have slightly different bond lengths and angles, and two
chloride counter ions present in the asymmetric unit. The Pt-Namine bond lengths are 2.032(4)
and 2.038(4) for one molecule and 2.029(4) and 2.055(4) for the other molecule. The Pt-Npyridine
bond distances are 2.067(3) and 2.057(3). The three Pt-Cl distances for the two molecules in the
crystal structure are more similar to each other than the Pt-N distances with 2.3207(11),
153

2.3078(10), and 2.3210(10) for one molecule of 8 and 2.3229(11), 2.3007(10), and 2.3167(10)
for the other. The two molecules have an octahedral geometry around the platinum atom with the
second molecule having bond angles that deviate more from the perfect 90' angles expected.
N13 N12
qPt1 Q1C11 3 CD1C12
02 N1 1 1 N22N2
C112 Pt2N2N21
C123 C
C122Figure 4.12. Graphical representation of the X-ray crystal structure of 8 with ellipsoids shown at50% probability. Hydrogen atoms are omitted for clarity. Color scheme: platinum, red; nitrogen,blue; chlorine, green; carbon, colorless.
154

Table 4.3. Geometrical parameters of pyriplatin and related complexes.cis-[Pt(NH 3)2(py)Cl](OTf), cis-[Pt(NH 3)2(py)(CH3CN)](BF 4)2, cis-mer-[Pt(NH3)2(py)Cl3]C,15 7 8
bond length, APt-N -me
Pt-NvywwinePt-XaN
Bond angles, 0
N.i.-Pt-N.iN.ie-Pt-Npywajn
N.i.,-Pt-Xa
Npyridi=e-Pt-Xa
2.0379(18)2.0404(18)2.0222(18)2.3047(5)
90.12(7)89.08(7)178.54(7)89.97(5)179.61(6)
2.029(3)2.049(3)2.024(3)1.975(3)
89.01(13)89.89(13)178.87(13)90.72(13)178.15(14)
90.39(12)
2.032(4);2.038(4);2.067(3);2.3207(11);2.3078(10);2.3210(10);
90.27(17);89.32(16);179.46(15);91.76(12);178.64(12);87.39(12);89.15(12);89.64(13);88.76(12);90.52(10);90.78(10);91.57(10);89.60(4);177.73(4);91.25(4):
2.029(4)2.055(4)2.057(3)2.3229(11)2.3007(10)2.3167(10)
91.77(16)88.59(15)179.37(15)91.68(12)178.01(12)86.24(12)90.34(12)89.18(12)88.11(12)89.14(10)90.47(10)92.43(10)90.06(4)177.37(4)92.04(4)
a X = Cl- or NCCH3
Table 4.4. X-ray crystallographic data for 7 and 8 at lOOK.compounds cis-[Pt(NH 3)2 (py)(CH3CN)(BF4)2 , 7formula C7H14B2FgN4Pt
formula weightcrystal system
space group
a, Ab, Ac, Aa, degp, degy, degv, A 3zPcalcd, g/cM3'
pU, mm~ 1
O range, degcompleteness to 0, %reflections collectedindependent reflectionsR(int)restraintsparametersMax., min. transmissionR1(wR2) [I>2a(I)]RI(wR2)GoF(F2 )max, min peaks, e.A~ 3
522.93100(2)
P21/c
12.4331(7)9.8021(6)12.4418(7)9090.735(1)901516.16(15)42.2919.3371.64 to 30.7695.03012944830.0363302240.7455, 0.43480.0272 (0.0661)0.0370 (0.0688)1.7913.877, -1.691
cis-mer-[Pt(NH3)2(py)Cl31CI, 8CH IC14N3Pt450.06Triclinic
P17.9480(8)11.8530(12)14.0649(14)67.621(2)88.870(2)72.3450(10)1160.8(2)42.57512.9691.58 to 26.4699.72060347700.037602830.7454, 0.61680.0216 (0.0426)0.0297 (0.0452)1.0441.269, -0.889
155
90.84(5)
Cl-Pt-Cl

Because both 7 and 8 were obtained from crystallization and could not be separated, we
collected a 'H NMR spectrum of the mixture in CD 3CN. Two sets of peaks that correspond to 7
and 8 could be identified from the obtained spectrum in a ratio of 2:1. The three peaks
corresponding to the pyridine protons of 7 occur at 7.62, 8.10, and 8.65 ppm, whereas the
pyridine protons of 8 occur downfield at 7.71, 8.24, and 8.91 ppm. The ammine protons of 8
occur in the range of 5.11 - 5.40 ppm and can be distinguished as a triplet of triplets with JH-pt
coupling constants of 22.9 and 24.5 Hz and JH-N coupling constants of 53.79 and 63.94 Hz. The
ammine protons of 7 are further upfield at 3.82 - 3.98 ppm and are less resolved, owing to
interactions of the 195Pt nucleus on the '4N nucleus of the amines. The peak at 2.42 ppm was
assigned as the coordinated acetonitrile in 7 and we attribute the low integration value of this
peak to substitution with the solvent CD3CN. The 'H NMR spectra of 7 and 8 do not match the
spectra obtained for either 5 or 6. This result informs us that 2 and 3 are not serving as NO+
donors to platinum centers.
156

.LN
Go OD 0 0 PI I I1 \ / Ln L nL
%D e -n N o 0 "1
9.0 8.8 8.6 8.4 8.2 8.0 7.8 7.6 7.4fl (ppm)
IIAJ vLIco
5.6 5554 5.3551 5504e
1j4 y yy P4)
6 0- C ~jv9.5 90 8.5 8.0 7.5 7.0 6.5 6.0 5.5 5.0 4.5 4.0 3.5 3.0 2.5 2.0 1.5 1.0 0.5 0.0
fi (ppm)
Figure 4.13. 'H NMR spectrum of a mixture of crystalline 7 and 8 collected in CD 3CN at 500MHz. Peaks corresponding to 7 are enclosed in green boxes. Peaks corresponding to 8 areenclosed in red boxes. The purple-labeled impurity is Et2O. The blue-labeled impurity is H20.
157
rn rnI I

4.4 Summary and Conclusions
We studied reactions of cis-[Pt(NH 3)2(py)Cl](OTf), 1, with (PPN)(SxNO), where x = 1 or
2, in an attempt to form a structurally characterizable metal-SxNO complexes, but this goal was
not achieved. We formed new complexes that do not contain the SXNO ligand, but maintain
binding of two amines and a pyridine to the platinum center. The physical properties of these
complexes differ from those of the starting material and from one another. The exact structures
of the products are currently unknown, but we proved that chloride is still present product and
that NO(g) is released during the reaction. Calculated results provide data that the products may
have polysulfide linkers between two platinum centers, which may account for the difference in
color and 1H NMR spectra of the two species.
We also prepared a Pt(II) and a Pt(IV) derivative of the starting material using NO+. The
complexes cis-[Pt(NH 3)2(py)(CH3CN)](BF4)2 and cis-mer-[Pt(NH3)2(py)Cl3]Cl were
crystallographically characterized and a 'H NMR spectrum was collected of a mixture containing
both compounds. Both species were spectroscopically different from the products obtained in the
reaction of 1 with (PPN)(SXNO), implying that this reaction does not involve NO+.
158

4.5 References
1. Armitage, D. A.; Brand, J. C., J. Chem. Soc., Chem. Commun. 1979, 1078.2. Mann, S.; Jansen, M., Z. Anorg. Alug. Chem. 1995, 621, 153.3. Pandey, K. K., Coordination Chemistry of Thionitrosyl (NS), Thiazate (NSO-),
Disulfidothionitrate (S3N-), Sulfur Monoxide (SO), and Disulfur Monoxide (S20)Ligands. In Prog. Inorg. Chem., John Wiley & Sons, Inc.: 1992; pp 445.
4. Bohle, D. S.; Hung, C.-H.; Powell, A. K.; Smith, B. D.; Wocadlo, S., Inorg. Chem. 1997,36, 1992.
5. Bohle, D. S.; Hung, C.-H.; Smith, B. D., Can. J. Chem. 2005, 83, 2021.6. Plenio, H.; Roesky, H. W.; Edelmann, F. T.; Noltemeyer, M., J. Chem. Soc., Dalton
Trans. 1989, 1815.7. Pandey, K. K.; Nehete, D. T.; Tewari, S. K.; Rewari, S.; Bhardwaj, R., Polyhedron 1988,
7, 709.8. Parkin, I. P.; Slawin, A. M. Z.; Williams, D. J.; Woollins, J. D., Polyhedron 1989,8, 835.9. Roesky, H. W.; Panday, K. K.; Krebs, B.; Dartmann, M., J. Chem. Soc., Dalton Trans.
1984, 2271.10. Parkin, I. P.; Slawin, A. M. Z.; Williams, D. J.; Woollins, J. D., J. Chem. Soc., Chem.
Commun. 1989, 1060.11. Short, R.; Hursthouse, M. B.; Purcell, T. G.; Woollins, J. D., J. Chem. Soc., Chem.
Commun. 1987, 407.12. Tiwari, R. D.; Pandey, K. K.; Agarwala, U. C., Inorg. Chem. 1982, 21, 845.13. Herberhold, M.; Neumann, F.; Suess-Fink, G.; Thewalt, U., Inorg. Chem. 1987, 26, 3612.14. Pangborn, A. B.; Giardello, M. A.; Grubbs, R. H.; Rosen, R. K.; Timmers, F. J.,
Organometallics 1996, 15, 1518.15. Johnstone, T. C.; Lippard, S. J., J. Am. Chem. Soc. 2014, 136, 2126.16. APEX2 v2009 APEX2 v2009, Bruker AXS: Madison, WI, 2009.17. Sheldrick, G. M. SADABS: Area-Detector Absorption Correction, University of
G6ttingen: Gttingen, Germany, 2008.18. Sheldrick, G., Acta Crystallogr., Sect. A: Found Crystallogr. 2008, 64, 112.19. Sheldrick, G. M. SHELXTL97: Programfor Refinement of Crystal Structures, University
of G6ttingen: Gttingen, Germany, 1997.20. SHELXTL v. 6.10: Program Library for Structure Solution and Molecular Graphics,
Bruker AXS, Madison, WI, 2001.21. Dolomanov, 0. V.; Bourhis, L. J.; Gildea, R. J.; Howard, J. A. K.; Puschmann, H., J.
Appl. Crystallogr. 2009, 42, 339.22. Frisch, M. J.; Trucks, G. W.; Schlegel, H. B.; Scuseria, G. E.; Robb, M. A.; Cheesman, J.
R.; Montgomery, J. A. J.; Vreven, T.; Kudin, K. N.; Burant, J. C.; Millam, J. M.; Iyengar,S. S.; Tomasi, J.; Barone, V.; Mennucci, B.; Cossi, M.; Scalmani, G.; Rega, N.;Petersson, G. A.; Nakatsuji, H.; Hada, M.; Ehara, M.; Toyota, K.; Fukuda, R.; Hasegawa,J.; Ishida, M.; Nakajima, T.; Honda, Y.; Kitao, 0.; Nakai, H.; Klene, M.; Li, X.; Know, J.E.; Hratchian, H. P.; Cross, J. B.; Adamo, C.; Jaramillo, J.; Gomperts, R.; Stratmann, R.E.; Yazyev, 0.; Austin, A. J.; Cammi, R.; Pomelli, C.; Ochterski, J. W.; Ayala, P. Y.;Morokuma, K.; Voth, G. A.; Salvador, P.; Dannenberg, J. J.; Zakrzewski, V. G.;Dapprich, S.; Daniels, A. D.; Strain, M. C.; Farkas, 0.; Malick, D. K.; Rabuck, A. D.;Raghavachari, K.; Foresman, J. B.; Ortiz, J. V.; Cui, Q.; Baboul, A. G.; Clifford, S.;
159

Cioslowski, J.; Stefanov, B. B.; Liu, G.; Liashenko, A.; Piskorz, P.; Komaromi, I.;Martin, R. L.; Fox, D. J.; Keith, T.; Al-Laham, M. A.; Peng, C. Y.; Nanayakkara, A.;Challacombe, M.; Gill, P. M. W.; Johnson, B.; Chen, W.; Wong, M. W.; Gonzalez, C.;Pople, J. A. Gaussian 03, Pittsburgh, PA, 2003.
23. Hay, P. J.; Wadt, W. R., J. Chem. Phys. 1985, 82, 299.24. Uson, R.; Fornies, J.; Tomas, M.; Menjon, B.; Bau, R.; Suenkel, K.; Kuwabara, E.,
Organometallics 1986, 5, 1576.25. Ara, I.; Fornids, J.; Garcia-Monforte, M. A.; Menj6n, B.; Sanz-Carrillo, R. M.; Tomas,
M.; Tsipis, A. C.; Tsipis, C. A., Chem. Eur. J. 2003, 9, 4094.
160

CHAPTER 5: SYNTHESIS OF [3:1]SITE-DIFFERENTIATED [4Fe-4S] CLUSTERSAND THEIR REACTIVITY TOWARD NO(g)AND Ph3CSNO
Portions of this chapter have appeared in print:
Victor, E; Lippard, S. J. Inorg. Chem. 2014, 52, 5311.
161

5.1 Introduction The reaction pathway between NO and iron-sulfur clusters has not been fully
elucidated, particularly within biological settings. 1-3 Initially, dinitrosyl iron complexes (DNIC)
were considered to be the major product formed during nitrosation of protein-bound [4Fe-4S]
clusters based on EPR spectra that matched those of known DNIC species.4'5 This technique is
limited, however, for it can only detect paramagnetic species and does not provide unambiguous
structural information. Work from our laboratory and others has demonstrated that the action of
NO on protein-bound iron-sulfur clusters also generates EPR-silent species, which may, in some
cases, be the major nitrosated product.,'6-8 In one study using recombinant Pyrococcusfuriosus
ferredoxin (D14C mutant), the EPR-silent Roussin's black anion (RBA), [Fe 4S 3(NO)7] (Figure
5.1), was detected as the major product by nuclear resonance vibrational spectroscopy.8
R 0/-1L 0/-1/-2 .3
NO ON,, / \ ,NOF
NO ON Fe- _ / R
DNIC Roussin's Red Ester (RRE)
NO 0/-1/-2 NO -1/-2/-3
Fe Fe
'Fe,ON NO LON NO
Fe F ' ON NO NO
[Fe4S 4(NO) 41 Roussin's Black Anion (RBA)
Figure 5.1. Iron-sulfur nitrosyl compounds.
The reactivity of NO towards aconitase, Wbl, FNR, and other [4Fe-4S] clusters has been
studied by EPR, NMR, M~ssbauer, and electronic absorption spectroscopies. 5'8 -1 The goal of the
project described in this chapter was to isolate and characterize potential intermediate species
that may form upon nitrosylation of [4Fe-4S] clusters prior to the formation of the known
extruded species.
162

To gain further insight into the nature of the reactions of NO and other RNOS with iron-
sulfur clusters, we investigated this chemistry using small-molecule analogs of the
metalloproteins. 2,8 Direct reaction of [Fe4 S4(SPh) 4 ] 2- with NO(g) or Ph3CSNO results in the
formation of RBA and, in the presence of additional thiolates, DNICs (Scheme 5.1).2,3'12 In the
present study, we extend these investigations to previously reported, site-differentiated
[Fe 4 S4 (LS3)L' ]2- (LS 3 = 1,3,5-tris(4,6-dimethyl-3-mercaptophenylthio)-2,4,6-tris(p-
tolylthio)benzene; L' = Cl, SEt, SPh, SC6F5 , N 3, S2CNEt2 , 2-SPyr, 2-OPyr, Tp) clusters.' 3 These
clusters were chosen based on the proclivity of the apical ligand (L') to exchange its ligands
preferentially and the ability of the LS 3 ligand to stabilize a [3Fe-4S] cluster after extrusion of
the apical iron, a property we wished to explore in order to mimic the observed NO reactivity of
mitochondrial aconitase. 14- 19 Altering L' affects the denticity on the apical iron and further
differentiates it from the remainder of the iron atoms in the cluster.
NO 0Fe
ON OJ> -NOI+ TIPF, 4 Ph3CSNO L NO
+ air or Na/Hg
-TO
0;~2.+
NO NO
+ 4 Ph3CSNO + xs PhCSNO
S S ON. 'NOsN.FKI\ Fe'No N ON NO "'NOS OF- I N !0 1N LN 04 e'.; ,NO
EPR Ative RBAL'-(9) C1 +NOWg
(10a) SEt (10e) SCNEI, +N-
(10b) SPht (l Of) 2-S-PyrI(10c) SC.F5 (0g) 2.0-Pyr + xs NO/PhCSNO(10d) N, (I10h) Tp + s
SPh 2-
ON ,Ph Ph I B1'NO jON F NO N 'NO 02, H2'2 PhS. NO 1 + hS-
'FSF 'F0'NO ON- 'Fe' NO PhS t SNO
h Ph+ FF0 >CVrR E RRE DNIC- 4 wt POg and'PhEPR Active E.PR Active -
Scheme 5.1. Reactivity pathways of synthetic [4Fe-4S] clusters with NO(g) and Ph3CSNO.
163

5.2 Experimental Methods
General. All manipulations were performed under an atmosphere of nitrogen gas using standard
Schlenk techniques or in an MBraun glovebox under an atmosphere of purified nitrogen. NO
(Airgas, 99%) was purified by a literature procedure.2 0 The NO gas stream was passed through
an Ascarite column (NaOH fused on silica gel) and a 6 ft coil filled with silica gel that was
cooled to -78 'C using a dry ice/acetone bath. Nitric oxide was stored using standard gas storage
bulbs and transferred via gastight syringes. Diethyl ether, pentane, methylene chloride, and
acetonitrile were purified using a Glass Contour solvent system using activated alumina to
purify.2' Deuterated solvents were purchased from Cambridge Isotope Labs Inc. (Tewksbury,
MA). (Ph4 P)2 [Fe4 S4 (SEt)4 ] and Ph3CSNO were synthesized according to literature procedures.2 2 2
All organic chemicals were purchased from Sigma-Aldrich and used as received. Metal salts
were purchased from Strem Chemicals and used as received.
Physical Measurements. NMR spectra were recorded on a Bruker Avance spectrometer
operating at 600 MHz at ambient temperature and referenced to residual signals in the deuterated
solvent. MALDI-TOF mass spectra were obtained on a Bruker Omniflex MALDI-TOF with a
Reflectron attachment. Low-resolution ESI mass spectra were obtained with an Agilent 1100
Series LC/MSD mass spectrometer using degassed acetonitrile as the carrier solvent. FT-IR
spectra were recorded on a Thermo Nicolet Avatar 360 spectrometer running the OMNIC
software package; solid samples were pressed into KBr disks and solution samples were
prepared in an air tight Graseby-Specac solution cell with CaF2 windows and 0.1 mm spacers. X-
Band EPR spectra were recorded on a Bruker EMX EPR spectrometer at ambient or liquid
nitrogen temperature using a quartz finger dewar. Electrochemical measurements were
performed at ambient temperature in a glovebox on a VersaSTAT3 Princeton Applied Research
164

potentiostat running the V3-Studio electrochemical analysis software. A 3-electrode set-up was
employed comprising a glassy carbon working electrode, platinum wire auxiliary electrode, and
a Ag(s)/Ag+(s) silver wire pseudo-reference electrode. Triply recrystallized (Bu4N)PF6 was used
as the supporting electrolyte. All electrochemical data were referenced internally to the Fc/Fc+
couple at 0.00 V.
ReactIR Measurements. In situ IR spectra were recorded on a ReactIR iC 10 instrument from
Mettler Toledo equipped with a 1 in. diameter, 30-reflection silicon ATR (SiComp) probe. In a
typical experiment, the instrument was blanked with CH2Cl2 and the sample, at concentrations
ranging from 15 to 30 mM. After the first data collection time point was completed, NO(g) or a
30 mM CH2Cl 2 solution of Ph3CSNO was added to the anaerobic sample compartment through a
rubber septum with a gas-tight syringe. The data was referenced to the initial scan and imported
to Origin 8.0 as a *.spc file to generate the figures.
M*ssbauer Measurements. Samples for 57Fe M6ssbauer studies were prepared by grinding a
solid sample with Apiezon-N grease. These 57Fe M6ssbauer samples were placed in an 80 K
cryostat during measurement. A 57Co/Rh source was moved at a constant acceleration at room
temperature against the absorber sample. All isomer shift (6) and quadrupole splitting (AEQ)
values are reported with respect to 5 7Fe-enriched metallic iron foil that was used for velocity
calibration. The displayed spectrum was folded to enhance the signal-to-noise ratio. Fits of the
data were calculated by the WMOSS plot and fit program, version 2.5.23 See Table 5.2 below for
experimentally determined parameters of 9, 10a, 10b, 10c, 10e, 10g, and 12.
X-ray Data Collection and Structure Solution Refinement. Crystals of LS2(SCH 20CH3),
7-(CH 3)2CO, 10d-4MeCN-Et 20-0.5H 20, 10e-2.5Et20, (Ph3CS) 2, and [Cp*2Fe]12 suitable for X-
ray diffraction were mounted in Paratone N oil and frozen under a nitrogen cold stream
165

maintained at 100 K by a KRYO-FLEX low-temperature apparatus. Data were collected on a
Bruker APEX CCD X-ray diffractometer with Mo Ka radiation (k= 0.71073 A) controlled by the
APEX2 software package. Empirical absorption corrections were calculated with SADABS.
The structures were solved by direct methods with refinement by full-matrix least-squares based
on F2 using SHELXTL-97.26,27 All non-hydrogen atoms were located and refined anisotropically.
Hydrogen atoms were assigned to idealized positions and given thermal parameters equal to
either 1.5 (methyl hydrogen atoms) or 1.2 (non-methyl hydrogen atoms) times the thermal
parameters of the atoms to which they were attached. Figures were generated using the Olex2.1
Graphical User Interface. 28 See Tables 5.1, 5.3, and 5.4 below for crystallographic data and
refinement details.
FBr Br
FFBr
1
C6Br 3F3, 1.29 A solid addition funnel was filled with Al flakes (1.6 g, 70 mmol) and was
attached to a 25 mL 3-necked round bottom flask filled with Br2 (97 mL, 1.9 mol). A condenser
was attached to the 3-neck reaction flask and the third opening was covered with a rubber
septum. The condenser was connected a reflux condenser attached to a Na2S20 3(aq) trap. The
reaction setup was flushed and placed under a constant N2 stream. Al was added to Br2 at a rate
of 2 flakes per 5 min to minimize the burning of the Al in the reaction vessel. C6 F3H3 (35 g, 265
mmol) was added at a rate of 4 drops/min via syringe. The reaction flask was then placed into a
60 'C water bath and stirred for 90 min. The reaction flask was then removed from the water
bath and allowed to cool to RT. The solution was poured into a 1000 mL seperatory funnel filled
with H20 (450 mL) and an orange aqueous layer formed above the Br2 layer. To the seperatory
funnel, 150 mL Et2O (400 mL) was added and the funnel was shaken. The aqueous layer was
166

removed and the organic layer was collected and the Et20 removed on a rotary evaporator. A
pale orange solid was collected and dissolved in 300 mL hexanes. The solution was ran through
a silica plug and the solvent removed on a rotary evaporator. The remaining white solid was
collected to yield 82.97 g (85%); mp = 98 'C (Lit. mp = 98 'C). The 19F NMR spectrum matched
that previously published. '9F NMR (282 MHz, CDCl 3, ref. CF3COOH 6 = -78.5 ppm): 6 -95.82
ppm. EI-MS (m/z): 368 ([M]+, calc'd: 368).
S \ U
2
CuSC6H4 CH3, 2.30 To a 250 mL Schlenk tube 200 mL anhydrous EtOH was added and sparged
with N2 for 1 hour. To a 500 mL round bottom Schlenk flask 20.1 g of p-tolyl mercaptan
(HSC6H4(CH3)) and a stir bar was added. The flask was evacuated and filled with N2(g) 3 times.
The anhydrous EtOH was transferred to the round bottom Schlenk flask via canula transfer and
the solution was stirred until the HSC6H4(CH3) was completely dissolved. Under heavy N2 flow,
14.1 g Cu2 0 was added to the solution. The reaction flask was capped with an N2 purged reflux
condenser. The reaction flask was placed into a 120 'C oil bath and stirred for three days under
an N2 atmosphere, after which time a pale yellow precipitate forms. The reaction solution was
then allowed to cool to RT and filtered in air through a Btchner funnel. The remaining pale
yellow solid was washed with 600 mL EtOH and 600 mL Acetone. The solid was dried under
vacuum and collected to provide a yield of 28.7 g (94.0%) of a pale yellow powder; dp = 254 'C
(Lit. dp = 260 'C).
167

F
-03
C6F3(SC6H4(CH3))3, 3.16 To a 500 mL round bottom Schlenk flask 7.9681 g of 1, 14.932 g of 2,
and a stir bar was added and placed under an inert atmosphere. 250 mL anhydrous N,N'-
dimethylformamide (DMF) was transferred via canula from a Sure/SealTM bottle to the reaction
flask. To the reaction flask a N2 purged reflux condenser was attached. The reaction flask was
placed into a 145 'C silicone oil bath and the slurry was stirred. After 12 h, the slurry turns red-
brown and after 36 hours the reaction was complete. The reaction flask is removed from the oil
bath and was allowed to cool to RT. The red-brown slurry is poured into a 1 L Erlenmeyer flask
filled with 600 mL ice and 80 mL conc. HCl at which point a grey precipitate forms. To the
mixture 200 mL Et20 is added and is stirred vigorously. The precipitate is removed by vacuum
filtration and the blue-green aqueous layer is removed from the filtrate in a seperatory funnel.
The yellow organic layer is washed twice with 500 mL 10% w/v K2C03(aq) and once with
Brine. The organic layer was collected and Et20 was removed by rotary evaporation after which
a pale yellow solid remained. The solid was recrystallized from a hot 10% v/v CHCl 3 in hexanes
in a -8 'C freezer. Gray fluffy solid was collected from a brown solution. The solid was
dissolved in Toluene and passed through a Silica gel plug. The Toluene was removed by rotary
evaporation to yield 5.1 g (47%) of a white fluffy solid; mp = 125.5 -127 'C (Lit. mp = 125.5 -
127 'C). The 1H and 19F NMR spectrum matched that previously published. 'H NMR (300 MHz,
CDCl 3): 8 2.31 (s, 3H, Me), 7.06 (d, 2H, Ph), 7.20 (d, 2H, Ph). 19F NMR (282 MHz, CDCl 3, ref.
CF3COOH 6 = -78.5 ppm): 6 -91.6.
168

S S
4C6H2 (CH3 ) 2(SO 2 C) 2, 4.3 To a 250 mL round bottom flask 100 mL Chlorosulfonic acid
(HOSO 2Cl) and a stir bar was added and was capped with a claisen adapter connected to a
NaHCO 3(aq) acid trap and a septum. The septum is pierced with a 20 mL plastic syringe filled
with 15 mL anhydrous m-xylenes. The m-xylenes is added to the HOSO 2CI at a rate of I
mL/min. Over the course of the addition the color of the solution will transition from colorless to
light brown, to pink, and end with purple. The reaction flask is capped with a reflux condenser
connected to a NaHCO 3(aq) acid trap and placed into a 160 'C silicon oil bath. The solution is
stirred for 2 hours and subsequently removed from the oil bath and allowed to cool to RT. The
solution is poured into an ice filled 4 L Erlenmeyer flask and the product is allowed to precipitate
overnight. The beige precipitate is collected by vacuum filtration from a Bichner funnel and
washed with methylene chloride. The filtrate is collected and the organic layer is separated from
the aqueous layer and collected. The methylene chloride is removed by rotary evaporation and a
pale red solid is collected. The final product is recrystallized from hot acetone in a -8 'C freezer
and yields 20.1 g (54%) white needles; dp = 124 'C (Lit. dp = 124 C). The 1H NMR spectrum
matched that previously published. 'H NMR (300 MHz, CDCl 3): 6 2.87 (s, 6H, Me), 7.52 (s, 1H,
Ph), 8.72 (s, lH, Ph). EI-MS (m/z): 302 ([M]+, calc'd: 302).
HS SH5
C6H2(CH3)2(SH)2, 5.3 To a 2 L round bottom flask 800 mL conc. HCl and a large oval-shaped
stir bar was added. Under heavy magnetic stirring 260 g Tin was added and the flask was capped
with a reflux condenser connected to a NaHCO 3(aq) acid trap. Bubble formation occurred
instantly. The reaction flask was placed into a heating mantle and heated to reflux. The reaction
169

vessel was allowed to react until all Tin was consumed, which usually occurred within 6 hours. If
any solid remained, the solution was gravity filtered. To the colorless solution 32.8 g 4 was
added and placed under reflux for 2 hours. The solution was removed from the heat and was
allowed to cool to RT. Steam distillation was performed on the solution and 8.4 g (40%) of white
crystalline flakes were collected; mp = 118 - 121 'C. The 'H NMR spectrum matched that
previously published. 1H NMR (400 MHz, CDCl 3): 6 2.25 (s, 6H, Me), 3.21 (s, 2H, SH), 6.96 (s,
1H, Ph), 7.23 (s, 1H, Ph). EI-MS (m/z): 170 ([M]+, calc'd: 170).
H S '6
C6H2(CH3)2(SH)(SCH 20CH3), 6.16 To a 100 mL Schlenk flask 3.9132 g of 5 was added. To a
500 mL Schlenk flask 1.9358 g sodium hydride (NaH, 60% oil suspension) and a stir bar was
added. Both flasks were evacuated and filled with N2 3 times. 80 mL and 100 mL of anhydrous
DMF from a Sure/SealTM bottle was transferred via canula to 5 and NaH respectively. The
solution of 5 was transferred to the NaH suspension via canula and bubble formation occurred.
The solution was stirred at RT for 3 hours at which time the bubble formation subsided and the
solution was red-orange. Under heavy N 2 flow 4x 917pL chloromethyl methyl ether (MOMCl)
was added to the solution using a VWR micropipette and the flask was capped. The solution was
stirred for 6 hours and turned white with a white precipitate. Under heavy N2 flow 1.9309 g
sodium ethyl thiolate (NaSET) was added and the solution turned beige. The reaction flask was
capped and was placed in a 90 'C oil bath. The solution was stirred for 3 hours. The DMF was
removed in vacuo and a pale orange solid remained. The solid was dissolved in 200 mL Et20 and
poured into a 500 mL seperatory funnel. To the seperatory funnel 250 mL 5% w/v NaOH(aq)
was added and the product was extracted. The aqueous layer was collected in a 500 mL
Erlenmeyer flask and 200 mL 2M Acetic acid (HOAc) was added. A white precipitate forms that
170

is extracted with 400 mL Et2 0. The Et20 is removed by rotary evaporation and a pale yellow
solid remains. The product is obtained by performing silica gel flash chromatography using a 5%
v/v Et20 in hexanes elutant. Fractions were analyzed by silica gel TLC in Toluene. All fractions
containing a single spot at rf = 0.68 were combined and others that contained additional spots
were further purified by flash chromatography using similar conditions. The solvent in the
combined fractions was removed by rotary evaporation to yield 2.52 g (52.2%) of a clear and
colorless oil. The 'H NMR spectrum matched that previously published. 'H NMR (400 MHz,
CDCl 3): 6 2.27 (s, 3H, "Me), 2.32 (s, 3H, PhMe), 3.27 (s, 1H, SH), 3.43 (s, 3H, OCH3 ), 4.91 (s,
2H, SCH 2O), 6.98 (s, 1H, Ph), 7.46 (s, 1H, Ph). EI-MS (m/z): 214 ([M] t , calc'd: 214).
s S S^OS
S*Sa
KS
0~
7L(SCH 20CH3)3, 7.15 To a 50 mL Schlenk flask 2.34 g of 6 was added and dissolved in 30 mL
Tetrahydrofuran (THF) under N2. In a 100 mL Schlenk flask 0.2754 g dry NaH was suspended in
15 mL THF with a stir bar. The solution of 6 was transferred via canula to the NaH suspension
and was stirred at RT for 3 hours. The THF was removed in vacuo and a gray, sticky solid
remained. Under heavy N2 flow 1.2116 g of 3 was added to the reaction flask. 30 mL of
anhydrous 1,3-dimethyl-2-imidazolidinone (DMEU) was transferred to the reaction flask via
canula transfer. In a 20 mL vial, 5 mL of Milli-Q purified H20 was sparged with N2. To the
reaction vessel 300 tL of the H20 was transferred with an air-tight glass syringe. The solution is
stirred at RT for 2 days followed by stirring in a 40 'C water bath for 3 days. The reaction
171

mixture becomes an orange slurry. The mixture is poured into 150 mL of 2M HOAc which is
then poured into a 500 mL seperatory funnel. The product is extracted from the aqueous solution
with 150 mL Et20 and washed with 250 mL of 5% w/v NaOH(aq) four times and Brine once.
The Et20 was removed by rotary evaporation and a bright yellow viscous oil remained. The oil
was recrystallized with hot acetone in a -8 'C freezer and yielded 1.4746 g (56.1%) of bright
yellow block crystals; mp = 115 - 118 'C (Lit. mp = 115 - 118 C). The 'H NMR spectrum
matched that previously published. 'H NMR (400 MHz, CDCl 3 ): 6 2.13 (s, 3H, PhMe), 2.23 (s,
3H, hMe), 2.27 (s, 3H, PhMe), 3.33 (s, 3H, OMe), 4.72 (s, 2H, SCH 2O), 6.83 (s, 1H, Ph), 6.84 (d,
1H, Ph), 6.87 (s, 1H, Ph), 6.89 (d, 1H, Ph). 13 C NMR (100 MHz, CDCl 3): 6 20.0, 20.3, 21.2,
56.3, 78.2, 128.4, 129.5, 131.5, 132.1, 132.6, 134.3, 134.8, 135.6, 135.7, 136.9, (central ring)
147.4, 148.5. MALDI-TOF MS (Anthracene, m/z): 1079.8 ([M]+, calc'd: 1080.2).
S S
S
8L(SH) 3, 8.16 In a 50 mL Schlenk tube, 15 mL CHCl 3 and 0.75 mL EtOH was sparged with N 2 for
45 min. Under heavy N2 flow, 0.3000 g of 7 and 0.2916 g of Hg(OAc) 2 was added to the tube
and was covered in aluminum foil. The solution was stirred for 12 h after which time a yellow
precipitate formed. H2 S was bubbled through the solution at a rate of one bubble/sec for 20
minutes. Over the course of the bubbling the solution turns from orange to brown to black. The
tube and solution was then purged with N2 for 45 minutes. A Schlenk frit was filled with 3 cm of
Celite, connected to a 500 mL round bottom Schlenk flask, and placed under a N2 atmosphere.
172

The solution was transferred to the Schlenk frit via canula transfer. The celite was washed with
N 2 sparged CHCl 3 until the filtrate became colorless. The CHCl3 was removed in vacuo and a
bright yellow solid remained. The solid was washed with Hot MeCN until the washings were
colorless. A yield of 0.2180 g (82.9%) of an air-sensitive, bright yellow solid was collected. The
H NMR spectrum matched that previously published. 1H NMR (400 MHz, CDCl 3): 6 2.17 (s,
3H, PhMe), 2.17 (s, 3H, PhMe), 2.27 (s, 3H, PhMe), 3.07 (s, 1H, SH), 6.44 (s, 1H, Ph), 6.83 (s, 1H,
Ph), 6.85 (d, 2H, Ph), 6.96 (d, 2H, Ph). 13C NMR (100 MHz, CDCl 3): 6 20.1, 20.7, 21.3, 128.2,
128.7, 129.8, 130.9, 132.4, 134.3, 134.9, 135.1, 135.1, 136.2, (central ring) 149.4, 149.9.
MALDI-TOF MS (Anthracene, m/z): 947.8 ([M]+, calc'd: 948.1).
C1IFe
F I Fe
9
(Ph4P)2[Fe4S 4(LS3)C1], 9.16 In a 250 mL Schlenk flask, (Ph4P)2[Fe 4S4(SEt) 4] (2.2069 g, 1.731
mmol) and L(SH) 3 (1.6436 g, 1.731 mmol) were combined and dissolved in 1:9 DMF/CH2Cl 2
(134 mL) and stirred at ambient temperature. After 30 min, the reaction was subjected to
dynamic vacuum for three h, after which all volatiles were removed in vacuo. The solid was
redissolved in DMF (14 mL) and pivaloyl chloride (235 ptL, 1.91 mmol) was added to the
solution. Aliquots of the solution were taken every 30 min to determine completeness of
conversion by 'H NMR in DMF-d7, by monitoring the disappearance of the peak at 6 = 3.81
ppm. The solution was filtered through a piece of glass microfiber filter paper into a 125 mL
Erlenmeyer flask. The solution was layered with 120 mL MeCN and placed into a -30* freezer
overnight during to afford a precipitate. The precipitate was collected by filtration and washed
173

with cold MeCN (3 x 5 mL) and Et20 (3 x 5 mL) to yield 2.8393 g (1.411 mmol, 81.5%) of a
black microcrystalline material. Crystals suitable for X-ray diffraction studies were grown by
vapor diffusion of Et20 into a DMF solution of the collected material. The 'H NMR spectrum
matched that previously published. 'H NMR (600 MHz, CD3CN, 6 ppm): 8.25 (5-H), 7.13 (2'-
H), 6.83 (3'-H), 5.05 (br, 2-H), 3.90 (4-Me), 3.87 (6-Me), 2.24 (4'-Me). ESI-MS (MeCN, m/z):
339.2 ([Ph4P] ,339.1), 1672.5 ([M-Ph 4P]F, 1672.8), 666.5 ([M-2(Ph 4P)] 2-, 666.9). UV-vis
(MeCN, Xmax, nm, E M' cm'): 300 (38000), 460 (sh, 10300). FT-IR (KBr, cm'): 2909 (w), 1657
(w), 1585 (w), 1489 (w), 1436 (s), 1378 (w), 1260 (w), 1186 (w), 1107 (s), 1080 (s), 1015 (w),
996 (w), 801 (w), 753 (w), 723 (s), 689 (s), 527 (s).
IFe
F~ Fe
I Oa'S
10a
(Ph4P)2[Fe 4S 4(LS3)(SEt)J, 10a.1 4 In a 25 mL Erlenmeyer flask, 9 (206.5 mg, 102.6 pmol) and
NaSEt (10.0 mg, 119 pmol) were combined. The solid mixture was dissolved in MeCN (10 mL)
and stirred. After 2 hours the crude reaction solution was filtered through a piece of glass filter
paper in a Pasteur pipette into a 125 mL Erlenmeyer flask. The filtrate was stripped to dryness
and redissolved in MeCN (3 mL). The solution was layered with Et20 (120 mL) and placed in a -
300 freezer overnight to afford a precipitate, which was collected on an F-grade frit and washed
with Et20 (3 x 10 mL) to yield 196.7 mg (96.5 ptmol, 97.4 %) of black microcrystalline material.
The 'H NMR spectrum matched that previously published. 'H NMR (600 MHz, CD3CN, 6 ppm):
13.16 (SEt-CH 2), 8.14 (5-H), 7.14 (2'-H), 6.84 (3'-H), 5.18 (br, 2-H), 3.81 (6-Me), 3.69 (4-Me),
174

2.40 (SEt-CH3), 2.24 (4'-Me). ESI-MS (MeCN, m/z): 339.4 ([Ph4P]+, 339.1), 1701.7
([M-Ph 4P] , 1701.9).
Fe
I Fe
S
10b
(Ph4P)2[Fe 4S 4(LS3)(SPh)], 10b.1 4 In a 25 mL Erlenmeyer flask, 9 (400 mg, 198 tmol) and
NaSPh (26.4 mg, 200 ptmol) were combined. The solid mixture was dissolved in MeCN (10 mL)
and stirred. After 2 hours the crude reaction solution was filtered through a piece of glass filter
paper in a Pasteur pipette into a 125 mL Erlenmeyer flask. The filtrate was stripped to dryness
and redissolved in MeCN (3 mL). The solution was layered with Et20 (120 mL) and placed in a -
30* freezer overnight to afford a precipitate, which was collected on an F-grade frit and washed
with Et20 (3 x 10 mL) to yield 276.1 mg (132.4 pmol, 66.7%) of brown microcrystalline
material. The 'H NMR spectrum matched that previously published. 'H NMR (600 MHz,
CD3CN, 6 ppm): 8.16 (SPh-Hm), 8.16 (5-H), 7.11 (2'-H), 6.84 (3'-H), 6.01 (br, SPh-H,), 5.37
(SPh-Hp), 5.15 (br, 2-H), 3.83 (6-Me), 3.76 (4-Me), 2.23 (4'-Me). ESI-MS (MeCN, m/z) : 339.2
([Ph4P] ,339.1), 1745.5 ([M-Ph 4P] , 1745.9). FT-IR (KBr, cm'1): 2908 (w), 1585 (w), 1575 (w),
1489 (w), 1470 (w), 1436 (s), 1378 (w), 1261 (w), 1187 (w), 1107 (s), 1081 (s), 1015 (w), 996
(w), 955 (w), 801 (w), 751 (w), 723 (s), 688 (s), 527 (s).
175

F
S F
FIe F
F Fe
10c
(Ph4P)2 [Fe4S 4(LS3)(SC6 F5)], 10c. In a 25 mL Erlenmeyer flask, 9 (200 mg, 198 pmol) and
NaSC 6F5 (44.4 mg, 200 pmol) were combined. The solid mixture was dissolved in 10 mL MeCN
and stirred. After 2 hours the crude reaction solution was filtered through a piece of glass filter
paper in a Pasteur pipette into a 125 mL Erlenmeyer flask. The filtrate was stripped to dryness
and redissolved in MeCN (3 mL). The solution was layered with Et20 (120 mL) and placed in a -
300 freezer overnight afford a precipitate, which was collected on an F-grade frit and washed
with Et20 (3 x 10 mL) to yield 186.2 mg (85.6 pimol, 43.2 %) of brown microcrystalline
material. 1H NMR (600 MHz, CD3CN, 6 ppm): 8.18 (5-H), 7.07 (2'-H), 6.83 (3'-H), 5.15 (br, 2-
H), 3.84 (4-Me), 3.82 (6-Me), 2.22 (4'-Me). ESI-MS (MeCN, m/z): 339.3 ([Ph4P]+,339.1),
1837.6 ([M-Ph 4P], 1837.8). FT-IR (KBr, cm'): 2909 (w), 1586 (w), 1502 (s), 1474 (s), 1437
(s), 1378 (w), 1260 (w), 1187 (w), 1108 (s), 1079 (s), 1015 (w), 997 (w), 970 (w), 856 (w), 802
(w), 751 (w), 723 (s), 689 (s), 507 (s).
176

N3
Fe
F Fe
10d
(Ph4P)2[Fe4S4(LS3)N 3], 10d. In a 25 mL Erlenmeyer flask, 9 (47.2 mg, 23.5 ptmol) and NaN 3
(7.2 mg, 111 mol) were combined, the mixture was dissolved in acetonitrile (14 mL) and then
stirred at ambient temperature. After 18 h, the crude reaction solution was filtered through glass
microfiber filter paper into a 125 mL Erlenmeyer flask. The filtrate was stripped to dryness and
the resulting solid dissolved in acetonitrile (3 mL). The solution was layered with diethyl ether
(45 mL) and placed in a -30 C freezer overnight to afford a precipitate, which was collected on
an F-grade frit and washed with diethyl ether (3 x 10 mL) to yield 29.3 mg (14.5 kmol, 58.2 %)
of blue-black microcrystalline material. Crystals suitable for X-ray diffraction studies were
grown by vapor diffusion of diethyl ether into an acetonitrile solution of 10d. The 'H NMR
spectrum matched that previously published.18 'H NMR (600 MHz, CD 3CN, 6 ppm): 8.25 (5-H),
7.13 (2'-H), 6.83 (3'-H), 5.05 (br, 2-H), 3.90 (4-Me), 3.87 (6-Me), 2.24 (4'-Me). Anal. Calcd for
C99H87Fe4N3P2 S130: C, 58.37; H, 4.31; N, 2.06. Found: C, 58.34; H, 4.47; N, 1.82. ESI-MS
(MeCN, m/z): 339.2 ([Ph 4P]+, calc'd 339.1), 1678.7 ([M-Ph4P]~, calc'd 1678.9), 669.6
([M-2(Ph 4P)]2-, calc'd 669.4). FT-IR (KBr, cm'): 2906 (w), 2055 (s, VN3), 1585 (w), 1488 (w),
1435 (s), 1377 (w), 1336 (w), 1258 (w), 1185 (w), 1107 (s), 1079 (s), 1028 (w), 996 (w), 954
(w), 872 (w), 801 (w), 751 (w), 722 (s), 688 (s), 526 (s).
177

s-"'Fe
Fe\(FeF
I Oe10e
(Ph4P)2 [Fe 4 S4 (LS3)(S 2CNEt2)], 10e. In a 25 mL Erlenmeyer flask, 9 (104.6 mg, 52 [imol) and
NaS2CNEt2 (10.0mg, 58.4 pimol) were combined. The solid mixture was dissolved in acetonitrile
(8 mL) and stirred. After 4 h, the crude reaction solution was filtered through glass microfiber
filter paper into a 125 mL Erlenmeyer flask. The filtrate was stripped to dryness and redissolved
in acetonitrile (3 mL). The solution was layered with diethyl ether (120 mL) and placed in a -30'
C freezer overnight afford a precipitate, which was collected on an F-grade frit and washed with
diethyl ether (3 x 10 mL) to yield 83.8 mg (38.9 ptmol, 74.8 %) of black microcrystalline
material. Crystals suitable for X-ray diffraction studies were grown by vapor diffusion of diethyl
ether into a NN-dimethylformamide solution of 10e. The 'H NMR spectrum matched that
previously published.' 9 'H NMR (600 MHz, CD 3CN, 8 ppm): 8.26 (5-H), 7.20 (2'-H), 7.01
(CH2), 6.74 (3'-H), 4.89 (br, 2-H), 3.88 (6-Me), 3.64 (4-Me), 2.27 (4'-Me), 1.27 (CH3). Anal.
Calcd for C1o4H95Fe4NP2S15 2Et2O: C, 559.17; H, 5.10; N, 0.62. Found: C, 59.42; H, 5.15; N,
0.53. ESI-MS (MeCN, m/z): 339.4 ([Ph4P]+, calc'd 339.1), 1446.0 ([M-2(Ph 4P)] , calc'd
1445.8). FT-IR (KBr, cm"1): 2908 (w), 1585 (w), 1524 (w), 1483 (s), 1435 (s), 1375 (w), 1354
(w), 1266 (w), 1210 (w), 1139 (w), 1107 (s), 1078 (s), 1014 (w), 996 (w), 955 (w), 800 (w), 752
(w), 722 (s), 688 (s), 506 (s).
178

S WN'Fe
Fe
1 Of
(Ph4P)2 [Fe4S4(LS3)(S-2-Pyr)], 1Of.1 4 In a 25 mL Erlenmeyer flask, 9 (134.0 mg, 67 pmol) and
NaSC 5H4N (10.4mg, 80 pmol) were combined. The solid mixture was dissolved in MeCN (10
mL) and stirred. After 18 hours the crude reaction solution was filtered through a piece of glass
filter paper in a Pasteur pipette into a 125 mL Erlenmeyer flask. The filtrate was stripped to
dryness and redissolved in MeCN (3 mL). The solution was layered with Et20 (120 mL) and
placed in a -30' freezer overnight afford a precipitate, which was collected on an F-grade frit and
washed with Et20 (3 x 10 mL) to yield 103.8 mg (49.7 ptmol, 74 %) of brown microcrystalline
material. The 1H NMR spectrum matched that previously published. 'H NMR (600 MHz,
CD 3CN, 6 ppm): 12.32 (Pyr-H3 ), 10.99 (br, Pyr-H 5), 10.05 (Pyr-H 4), 8.25 (5-H), 7.20 (2'-H),
6.77 (3'-H), 6.48 (Pyr-H 6), 5.02 (br, 2-H), 3.89 (6-Me), 3.72 (4-Me), 2.26 (4'-Me). ESI-MS
(MeCN, m/z): 339.4 ([Ph4P]+,339.1), 1751.2 ([M-Ph4P]~, 1750.9). FT-IR (KBr, cm'): 2911
(w), 1585 (w), 1570 (w), 1537 (w), 1489 (w), 1437 (s), 1410 (w), 1378 (w), 1259 (w), 1186 (w),
1108 (s), 1080 (s), 1015 (w), 966 (w), 955 (w), 874 (w), 801 (w), 753 (w), 723 (s), 689 (s), 507
(s).
179

O' 'N"
Fe
F e Fe
Sog
(Ph4P)2[Fe4S4(LS3)(0-2-Pyr)], 10g. In a 25 mL Erlenmeyer flask, 9 (134.0 mg, 67 pmol) and
NaSC 5H4N (10.4mg, 80 pmol) were combined. The solid mixture was dissolved in MeCN (10
mL) and stirred. After 18 hours the crude reaction solution was filtered through a piece of glass
filter paper in a Pasteur pipette into a 125 mL Erlenmeyer flask. The filtrate was stripped to
dryness and redissolved in MeCN (3 mL). The solution was layered with Et20 (120 mL) and
placed in a -30' freezer overnight afford a precipitate, which was collected on an F-grade frit and
washed with Et2O (3 x 10 mL) to yield 103.8 mg (49.7 pmol, 74 %) of brown microcrystalline
material. 'H NMR (600 MHz, CD 3CN, 6 ppm): 9.55 (br, Pyr-H3 ), 8.83 (br, Pyr-H), 8.25 (5-H),
7.20 (Pyr-H4), 7.17 (2'-H), 6.81 (3'-H), 6.78 (Pyr-H6 ), 4.97 (br, 2-H), 3.87 (6-Me), 3.82 (4-Me),
2.23 (4'-Me). ESI-MS (MeCN, m/z): 339.3 ([Ph4P]+,339.1), 1729.6 ([M-Ph4P] , 1729.9). FT-IR
(KBr, cm1): 2908 (w), 1585 (w), 1489 (w), 1462 (s), 1436 (s), 1421 (s), 1378 (w), 1324 (w),
1280 (w), 1186 (w), 1108 (s), 1080 (s), 1015 (w), 966 (w), 955 (w), 876 (w), 801 (w), 752 (w),
723 (s), 689 (s), 507 (s).
180

H
N
N N
Fe
F Fe
is O
10h
(Ph4P)2[Fe4S4(LS3)(Tp)], 10h. 14 In a 5 mL vial, 9 (100.0 mg, 50 pImol) was dissolved in 10:1
MeCN/DMF (2 mL). In a separate 5 mL vial K(Tp) (13.8 mg, 55 pmol) was dissolved in 10:1
MeCN/DMF (1 mL). The K(Tp) solution was transferred to the solution containing 1 -C1 and the
reaction was stirred for 3 hours. The crude mixture was filtered through a piece of glass filter
paper in a Pasteur pipette into a 125 mL Erlenmeyer flask and evaporated to dryness. The
remaining solid was redissolved in DMF (2 mL), layered with Et20, and placed in a -30' freezer
overnight afford a precipitate, which was collected on an F-grade frit and washed with Et20 (3 x
10 mL) to yield 60.2 mg (27.5 ptmol, 55 %) of brown microcrystalline material. The 'H NMR
spectrum matched that previously published. 1H NMR (600 MHz, CD 3CN, 6 ppm): 11.61
(pz-H4), 10.84 (pz-H3), 8.73 (5-H), 7.09 (2'-H), 6.59 (3'-H), 4.45 (6-Me), 4.03 (4-Me), 2.27
(4'-Me). FT-IR (KBr, cm): 2911 (w), 2448 (w), 1656 (w), 1586 (w), 1489 (w), 1437 (s), 1400
(w), 1304 (w), 1261 (w), 1210 (w), 1109 (s), 1081 (s), 1041 (s), 1015 (w), 997 (w), 877 (w), 801
(w), 754 (w), 721 (s), 689 (s), 527 (s).
NO(g) reactions. In a 20 mL vial, 9 or 10a-h (20.8 tmol) was dissolved in methylene chloride
(6 mL) and the vial was sealed with a rubber septum. An equivalent of NO(g) (500 pL, 16.35
ptmol) was then injected via a gas-tight syringe into the reaction vial. The reaction was stirred for
2 h and subsequently poured into pentane (120 mL) and stirred for 10 min. The mixture was
181

filtered through Celite, and the residual solid was extracted with methylene chloride (50 mL).
After solvent removal, the remaining solid was characterized by ESI-MS and CH2Cl 2 solution
FT-IR. Formation of [Fe 4S4 (NO)4 ]~, 12, and [Fe4S3(NO)7] , RBA, was observed.
Ph3 CSNO reactions. In a 20 mL vial, 9 or 10a-h (16.35 ptmol) was dissolved in methylene
chloride (6 mL) and the vial was sealed with a rubber septum. In a 5 mL vial 1, 2, 4, or 8
equivalents of Ph3CSNO (16.35, 32.7, 65.4, and 130.8 pmol, respectively) was dissolved in
methylene chloride (5 mL) and instantly injected via syringe into the reaction vial. Throughout
the course of the reaction, 40 - 60 ptL aliquots were taken to monitor the reaction by solution IR.
After no further growth of the bands in the region between 1600 and 1850 cm-1 was observed (2
- 6 h), the reaction mixture was poured into pentane (120 mL) and stirred for 10 min. The
mixture was filtered through Celite. The filtrate was analyzed by GC-MS to reveal the formation
of (Ph3CS) 2 and by 'H NMR spectroscopy in CD3CN to show the presence of the LS3 ligand.
The solid remaining on the Celite was extracted with methylene chloride (50 mL). After solvent
removal the remaining solid was characterized by ESI-MS, Mossbauer, CH2 Cl 2 solution FT-IR,
and KBr solid-state FT-IR. If up to four equivalents of Ph3CSNO were used, the isolated
nitrosated product was 12. When eight equivalents of Ph3CSNO were used, the isolated product
was RBA.
NOFe
0 N' Fe \,Fe'NO0N SNO
12[(C5 Me5) 2Fe][Fe4 S4 (NO)4], [Cp*2Fe]12. In a 20 mL vial, 9 (32.9 mg, 16.4 pmol) and TlPF6
(28.4 mg, 81.3 ptmol) were dissolved in methylene chloride (6 mL). The reaction vial was sealed
182

with a septum. In a 5 mL vial Ph3CSNO (20.0 mg, 65.4 pmol) was dissolved in methylene
chloride (5 mL) and instantly injected via syringe into the reaction vial. After 2 h, the reaction
mixture was poured into pentane (120 mL) and stirred for 10 min. The mixture was filtered
through Celite, and the filtrate was stripped to yield 30.4 mg of a yellow-brown solid.
Characterization of the mixture using ESI-MS, CH2Cl 2 solution FT-IR spectroscopy, and cyclic
voltammetry confirmed the presence of 11. This solid mixture was dissolved in methylene
chloride (2 mL) and (C 5Me5)2Fe (22.3 mg) was added. The reaction was stirred for 30 min and
subsequently poured into pentane (100 mL) affording a black precipitate. The precipitate was
collected via filtration through Celite and extracted with methylene chloride (10 mL). The
methylene chloride solution was stripped to yield 8.3 mg (10.0 pmol, 61.0 %) of a black powder.
Crystals suitable for X-ray diffraction studies were grown by vapor diffusion of diethyl ether into
a methylene chloride solution of [Cp*2Fe]12. ESI-MS (MeCN, m/z): 326.2 ([Cp* 2Fe]+, 326.3),
471.6 ([12]~, 471.6), 441.5 ([12-NO]-, 441.6), 411.5 ([12-2NO]f, 411.6), 381.5 ([12-3NO] ,
381.6), 351.5 ([12-4N0]-, 351.6). FT-IR (CH2Cl2 , cm'1): 1725 (s, vNO). Anal. Calcd for
C 2 0H3 0Fe 5S 4N 40 4 : C, 30.10; H, 3.79; N, 7.02. Found: C, 30.04; H, 3.41; N, 6.80.
5.3 Results and Discussion
Synthesis of the [3:1] Site-differentiated Cluster. Synthesis of the [3:1] site-differentiated
ligand, previously developed by Stack and Holm, involves an 8-step reaction pathway that
exploits the differences in reactivity between aryl fluorides and aryl bromides to build a ligand
with an ababab configuration (Scheme 5.2).16 The initial step in the synthesis involves formation
of 1,3,5-tribromo-2,4,6-trifluorobenzene, 1, by AlBr3-catalyzed bromination of 1,3,5-
trifluorobenzene. Purification of 1 was modified to substitute the recrystallization using hot
183

ethanol, by dissolution of the crude product in hexanes and running through a silica plug to
remove any residual Br2. This alternate purification improved the yield of the final product from
40% to 83% in our hands.
The alternating bromines and fluorines allow correct positioning of the "arms" and "legs"
of the final ligand scaffold without the need to separate various isomers that could arise during
the copper-mediated aryl-thiol coupling. The coupling agent is the pale yellow copper salt p-
tolylthiocuprate, 2, which is prepared by reaction of copper(I) oxide and p-tolyl mercaptan over
the course of three days in near-refluxing ethanol. The Ullman coupling reaction produces 1,3,5-
trifluoro-2,4,6-tris(p-tolylthio)benzene, 3. The purification of 3 was modified from the published
procedure to include silica gel chromatography with toluene as elutant. This step was deemed
necessary because residual copper salts were promoting deprotection of the "arms" during the
synthesis of the final protected ligand L(SCH 2OCH3)3, 7, leading to side-product formation and
decreased yields.
184

F
AIBr3 , Br2600 C, 1 hr
FBr NBr
F
SH
CU20, EtOH1200 C, 3 days, N2 1
BrF S
DMF145'C, 36 hrs, N 2
F
SlNs
F XF
'-3
DMEU, 3% H 203 days RT, N 22 days 40 C, N2
"Cu
HOSO 2CIreflux, 2hrs
C S C
--
S SCI Oo"CI1
4SnCI 2, HCIreflux, 2 hrs
5MOMCI, DMFRT, N 2
HS 0'6
S S
-S S
0~
7
Hg(OAc) 2, CHC 3 ,EtOH, H 2SRT, N 2
H S H
SC
8
Scheme 5.2. Synthesis of the [3:1] site-differentiated ligand L(SH) 3, 8.
185

The synthesis of the "arms" of the ligand begins with sulfonation of m-xylenes with
chlorosulfonic acid to produce 4,6-dimethyl-1,3-disulfonyl dichloride, 4. The synthesis described
in the thesis of Tard reported, no further purification beyond washing with water.34 An
alternative method of purification is described in Stack's thesis involving dissolution of the
product in methylene chloride and separation of water and a red oil.' 5 Removal of methylene
chloride is followed by recrystallization from hot acetone. This additional purification step
proved to be necessary for reduction of 4 to the sulfide with tin(II) chloride. Otherwise,
formation of a yellow-brown, insoluble polymer reduced the yield of 1,3-dimercapto-4,6-
dimethylbenzene, 5.
Initially, monoprotection of 5 was attempted with chloromethyl ethyl ether (EOMCL),
which is a more widely available and less expensive reagent than the published protecting
reagent, chloromethyl methyl ether (MOMCl). Unfortunately, the EOMC protecting group was
too bulky to allow for complete substitution of the aryl fluoride during the synthesis of 7,
resulting in the coupling of only two arms to the backbone (Figure 5.2).
F1 Br> Br
-F
L(CH 20CH2CH3)2F
-50 -55 -60 -65 -70 -75 -80 -85 -90 - 5 -1105 -1'15 -125 -135 -145
Figure 5.2. 1 9F NMR of 1, 3, and L(SCH 20CH2CH3)2F. The coupling of 6-EOM with 3 wasincomplete and resulted an undesired product.
186

We also attempted to monoprotect 5 directly rather than to diprotect the thiols. In this
protection, triethylamine replaced sodium hydride as the deprotonation agent. This method was
used by Gebbink and coworkers to selectively protect the sulfide on the thioindole of Tris(SH)3
by exploiting differences in pKa between the -SH and the -NH functional groups.1 7' 35 In our
case the reaction was not successful and led to production of mono- and diprotected product
along with starting material (Figure 5.3), which hindered easy purification of 4,6-dimethyl-3-
((methoxymethyl)thio)benzenethiol, 6.
en~lar e T1C: PRE+C(UMN 0 1. m
135e07!
12.-07'
1 2.+07,
I15e+07;
$000020
00000
2500002J
220002!
20002
1 200 002002010202220,002202000'20020
1-071:
Figure 5.3. Gas Chromatogram of crude product obtained when attempting to protect 5 usingEt3N as the base. The three peaks correspond to 5 (12.5 min), 6 (14 min), and [6-H+CH 2OCH3](16 min).
The best yields of 6 were obtained when the published synthetic procedure was followed
with the only alteration being that the mono-deprotection occurred at 90 C rather than 12O0 C.
Decomposition of the protecting groups was observed at the higher temperature when we
performed the synthesis on a gram rather than the published dozen-gram scale.
187

The aryl-fluoride substitution to synthesize 7 proved to be one of the more trying
synthetic steps. It requires multiple days to complete and is not properly described in the original
published procedure. Initial attempts resulted in unrecoverable yields of 7 due to the multitude of
products formed. The published purification for 7 by silica gel flash column chromatography
resulted in decomposition of the product into unknown species. This decomposition could be
monitored by loss of the signal assigned to the methylene peak of the methoxymethyl protecting
group and formation of new peaks in the 4.5 - 5.0 ppm region. One of the side products was
determined to be an intramolecular disulfide by X-ray crystallography from a crystal that was
serendipitously obtained upon evaporation of a column fraction (Figure 5.4). An investigation of
Stack's thesis yielded an altered synthesis that limited heating of the reaction to 40 'C and
addition of water.' 5 The modified purification involved an acid-wash step using acetic acid and
recrystallization from hot acetone, rather than purification by column chromatography. These
changes proved successful and led to the multi-gram synthesis of the protected ligand.
Figure 5.4. Drawings of the X-ray crystal structures of LS2(SCH 2OCH2CH3) (left) andL(SCH2OCH2CH 3)3-(CH3)2CO, 7, (right) with ellipsoids shown at 50% probability. Solventmolecules and hydrogen atoms are omitted for clarity. Color scheme: sulfur, yellow; oxygen,red; carbon, colorless.
188

Table 5.1. X-ray crystallographic datacompoundsformula
formula weightcrystal system
space groupa, Ab, Ac, A
a, degP, degy, deg
v, AzPcalcd, g/cm 3
p, mm -1
0 range, degcompleteness to 0, %reflections collectedindependent reflectionsR(int)restraintsparametersMax., min. transmissionR1(wR2) [I>2a(I)]RI(wR2)GoF(F 2)max, min peaks, e.A 3
for LS2(SCH20CH2CH3) and 7-(CH 3)2CO at lOOK.LS 2(SCH 20CH2CH3 ) 7-(CH 3) 2COC53H50OS9 C60H6604S 9
991.47 1139.67monoclinic triclinic
P2 1/n9.2558(9)23.454(2)22.517(2)
90100.684(2)90
4803.5(8)41.3710.4551.27 to 26.2899.68227196990.049705780.7454, 0.68040.04665 (0.1142)0.0612 (0.1218)1.4460.979, -0.470
PT12.5412(7)14.1338(8)18.4442(10)
88.0090(10)85.1100(10)
64.3000(10)2935.2(3)21.2900.3851.11 to 31.0091.664717171260.023006720.7462, 0.69170.0652 (0.2321)0.0783 (0.2449)1.7082.145, -1.352
Deprotection of 7 to form the final tridentate ligand L(SH) 3, 8, was effected by use of
Hg(OAc) 2 and protonation by H2S(g), as shown by 'H NMR spectroscopy (Figure 5.5). Because
8 has a tendency to form intramolecular disulfides when exposed to air, becoming useless as a
tridentate cluster scaffold, the final product was kept under nitrogen in the glove box.
189

F
F F
FNLflN.m
-4( r
0 K04s -S/Cl bCr C
ti
5 HS - SH
IIG) CA () Y (nJ (NJ
I II
6 HS - -- O-i~
s s . U)
7il
8 IC,
9.0 8.5 8.0 7.5 7.0 6.5 6.0
Figure 5.5. 'H NMR spectra of compounds5.5 5.0 4.5 4.0 3.5 3.0 2.5 2.0
3-8 in CDC13.
190
-- 4
8 (NJ'.0 PN1ro
P
ri

Synthesis and Characterization of Clusters. Over the course of two decades numerous ligand
substitutions were carried out on the site-differentiated, apical iron atom of [Fe4 S4 (LS 3)L']2-.3 6
Cluster incorporation to the ligand is achieved by stirring L(SH)3 with (Ph4 P)2 [Fe 4 S4(SEt) 4]
while under dynamic vacuum to remove ethyl mercaptan and push the equilibrium to form
(Ph4P) 2 [Fe4 S4 (SEt)4]. Addition of pivaloyl chloride forms 9 and (CH3)3COSEt, which are
separated by crystallization from DMF and acetonitrile.
Formation of compounds 10a-h begins with 9 and is performed using alkali metal salts of the
ligands in organic solvents (Scheme 5.3). The use of alkali metals to precipitate MCl (where M is
Na+ or K+) drives the reaction toward completion by replacing the ligand on the apical iron atom
to afford the ligand-substituted product as microcrystalline material in 50 to 90 % yield and an
insoluble alkali-halide salt.
Fe
e Fe
10a NaSEt83%
x
Fe
(F Fe
NaSC6X5 10b/c
X = H,F67%, 43%
FC
Scheme 5.3. Preparation
C FeN N/ Fe
F K[HB(pz)3] S NaN3
55% 58% Fe
Fe/ Fe Fe
e Fe Fe 7e
10
of10 - fNm a sn difeen alaSi metalsls
NOC.'H NaSC5 NH4 NSCNt79/6 4 75%
0' N5
Fe
K>xK Fee I 7'e
K'K' (e Fes(F e Fe~
log e
I Of
of l0a-h from 9 using different alkali metal salts.
191
H
F e
d
N ,

The synthesized complexes were chosen esed on a few factors. The thiolate complexes were
chosen as they mimic the coordination sphere of a majority of biological [4Fe-4S] clusters. The
published and experimentally determined M6ssbauer parameters of 10a-c (Table 5.2) suggest
that the apical iron in these complexes are not differentiated electronically from the remaining
[Fe-S] core (Figure 5.6).
A) -) ,
CI S
3 -2 -1 0 1 2 2 443 -2 -1 0 1 2 2 4
Velocity (mm/S) Velocity(mm/s)
F
:F F
E) Veocay (mm/ F) V. >o(mm)
21 S
Velocy (mm/s) Velocity (mm/S)
Figure 5.6. "Fe M6ssbauer spectra of A) 9; B) 1ot, C) 10b, D) 10c, E) 10e, and F) 10g. Allspectra were recorded at 80 K. Color schere: blh4k dots, raw data; red line, full fit; blue line,site one; green line, site two. 17Fe Mossbtjr parameters for each spectrum are given in Table5.2.
- 192

Table 5.2. M6ssbauer parameters of relevant iron-sulfur complexes.Complex Temperature Isomer Quadrapole Line Area Ref.
(K) Shift splitting width (%)(8, mM/s) (AEQ, mM/S) (IF, mm/s)
(Ph4P) 2[Fe4S4(LS3)Cl], 9 80 0.46(2) 1.03(2) 0.39(2) 100 a(Ph4P)2[Fe4S4(LS3)(SEt)], 10a 80 0.44(2) 0.90(2) 0.36(2) 60 a
0.44(2) 1.21(2) 0.27(2) 40(Ph4P)2[Fe4S4(LS3)(SPh)], 10b 80 0.41(2) 0.93(2) 0.46(2) 100 a(Ph4P)2 [Fe4 S4 (LS3)(SC6F5)], 10c 80 0.45(2) 1.02(2) 0.36(2) 100 a(Ph4P)2[Fe4S4(LS3)(S 2CNEt2)], 10e 80 0.71(2) 2.06(2) 0.31(2) 20 a
0.46(2) 1.12(2) 0.34(2) 80(Ph4P)2[Fe4S4(LS3)(S-2-Pyr)], 10f 4.2 0.52 1.70 0.56 25 14
0.34 0.94 0.30 390.34 1.26 0.29 36
(Ph4P)2[Fe4S4(LS3)(O-2-Pyr)], 10g 80 0.41(2) 0.93(2) 0.46(2) 100 a(Ph4P)2[Fe4S4(LS3)(Tp)], 10h 4.2 0.79 2.03 0.38 25 14
0.31 0.84 0.30 340.34 1.23 0.33 41
12 80 0.25(2) 0.90(2) 0.42(2) 100 a9 + 12 80 0.25(2) 0.90(2) 0.38(2) 48 a
0.46(2) 1.03(2) 0.36(2) 52[K(2,2,2-crypt)]12 300 0.156 0.935 N/A 100 3
[Fe4 S4 (NO)4], 11 78 0.150 1.473 0.334 100 8
(Et4N)[Fe 4S 3(NO) 7], RBA 90 0.15(2) 0.97(2) 0.32(2) 100 8
(Et4N)[Fe(SPh)2(NO)2] 90 0.17(2) 0.68(2) 0.26(2) 100 8
Fe(NO)(S2CNEt2)2 300 0.51(1) 0.80(1) N/A 100 39
aThis work
The potential ability of those apical ligands to disassociate more readily than LS3 was
intended to lend itself in the study of the mechanism by which most [4Fe-4S] clusters are
degraded by reactive nitrogen oxide species. Compound 10d was synthesized to possibly serve
as a precursor in the synthesis of a cluster-bound nitrogen oxide via formation of an intermediate
iron-nitrido complex, however, photoirridation of the cluster did not result in a nitride species.
Compounds 10e, 10f, and 10h were chosen due to their ability to electronically differentiate
irons in the cluster based on published M6ssbauer parameters (Table 5.2).14 These clusters also
provide the unique opportunity of having an additional coordination site occupied on the apical
iron to potentially allow the abstraction of that iron by NO and leave an intact [3Fe-4S] core.
This would provide a similar environment to that seen biologically where additional coordinating
ligands can be in close proximity to the reaction site in the form of amino acid residues or
193

unbound thiolates and histidines. Compound 10g was originally proposed to be bidentate but the
M6ssbauer spectrum (Figure 5.7) suggests that the apical ligand coordinates only through the
oxygen.
Characterization of these clusters by 'H NMR spectroscopy was possible owing to the S = 0
ground state of their [Fe 4S 4]2 + cores. The chemical shifts of the protons appear downfield from
those of the free ligand, and their line widths are broadened from what would be expected of a
diamagnetic complex, suggesting that thermal excitation produces a weakly paramagnetic state
(Figure 5.8). Electronic effects imparted by varying the apical ligand are manifested in different
chemical shifts, especially of protons closest in proximity to the cluster. As a result, distinct IH
NMR spectra can be obtained for almost every compound.
194

9
5
10a -F6
lob
1c \, F
kJ 3'L
6L
645 4'
6
411< 4'
10d 46
12.5 11.5 10.5 9.5 9.0 8.5 8.0 7.5 7.0 6.5 6.0 5.5 5.0 4.5 4.0 3.5 3.0 2.5
1 Oe
2 64
1Of \~ \~ ~/2
10h
A A
l~g\ \s\
1(7)6
64f
2' 3'
2 3 46
UJ : -1 NMIjJL j
12.5 11.5 10.5
74
9.5 9.0 8.5 8.0 7.5 7.0 6.5 6.0: 5.5 5.0 4.5 4.0 3.5 3.0 2.5
Figure 5.7. 'H NMR of 9 and 10a-h in CD 3CN. Assignments of protons on the LS3 ligand areassociated with the numbering order shown in Scheme 5.1.
These complexes were also identified by ESI-MS, with mass peaks corresponding to
[M-Ph4P] being common, and additional peaks arising from the presence of [M-2Ph4p]2-
Infrared spectroscopy is useful in identifying the formation of 10d by the VaziAe stretch at 2055
195
2' 3'
M04A..5
14 W'W
5
6 4"

cm- 1 but does not provide information about the extent of substitution. Shifts in the IR bands of
the derivatives of 1 are minimal and not useful in assessing conversion.
The synthesis of 10d has been previously reported using Me3SiN 3 as the azide source.18 We
report the formation of 10d using excess NaN3 over the course of 18 h. This synthesis is more
convenient than the previously published route. Sodium azide is readily available and is not as
dangerous as the silane. The 'H NMR spectrum of 10d is identical to that in starting complex 9,
preventing us from monitoring reaction completion by this technique as was the case for other
[Fe4 S4 (LS3)L']2- products. Conversion of the apical ligand from Cl- to N 3 can, however, be
followed using ESI-MS, observing the decrease of a peak at 1672.6 m/z and formation of one at
1678.7 m/z (Figure 5.8).
9 910d
10d
660 66 670 676 166 166516'70 1676 1f60166 160
Figure 5.8. ESI-MS of 9 (black) and 10d (red) using acetonitrile as the carrier solvent.
The X-ray crystal structure of 10d (Figure 5.9) reveals an almost linear azide ion (N-N-N =
177.2(9)0) with a bent coordination geometry at the apical iron atom (Fe-N-N = 132.4(6)0). The
three p-tolyl groups of the LS 3 ligand are oriented away from the cluster, a result that differs
from the published structure of 9, but most likely arises owing to packing of co-crystallized
molecules of acetonitrile occupying the voids created by these aryl groups in the crystal lattice. 16
196

The presence of co-crystallized H20 in the lattice may be arise from adventitious water in the
acetonitrile.
N3
N2
S24
Fel
Fe354
Fe4
571
572 e
S4
Figure 5.9. Drawings of the X-ray crystal structures of [Fe 4 S4(LS 3)(N 3)] 2 -, 10d, (left) and[Fe 4 S 4(LS3 )(S2 CNEt2 )] 2 , 10e, (right) with ellipsoids shown at 50% probability. Cations, solventmolecules, and hydrogen atoms are omitted for clarity. Color scheme: iron, green; sulfur, yellow;nitrogen, blue; carbon, colorless.
197

Table 5.3. X-ray crystallographiccompoundsformula
formula weightcrystal system
space group
a, Ab, Ac, Aa, degp, degy, degv, A3
ZPcaled, g/cm 3
u, mm~10 range, degcompleteness to 0,
reflections collectedindependent reflectionsR(int)restraints
parametersMax., min. transmissionR1(wR2) [I>2a(I)]RI(wR2)GoF(F2 )max, min peaks, e.A 3
The formation of 10e was previously observed by 'H NMR spectroscopy and cyclic
voltammetry, but it was never isolated and characterized. The synthesis of the
(Ph4P)2[Fe4S4(LS3)(S 2CNMe2)] analog was published but an X-ray crystal structure was never
obtained, resulting in some ambiguity as to whether the apical iron atom is four- or five-
coordinate. We have isolated 10e in high yield and were able to obtain X-ray diffraction quality
crystals (Figure 5.10).
The apical iron is five-coordinate with asymmetric thiocarbamate sulfur atoms, S(71) and
S(72) at distances from the apical iron of 2.3918(lo)A and 2.6063(10)A, respectively. As in 10d,
the p-tolyl groups of the LS3 ligand in 10e are oriented away from the cluster, but with the aryl
198
data for 1Od-4MeCN-Et 2O-O.5H 20 and 1Oe-2.5Et2O at lOOK.1Od-4MeCN-Et 2OO.5H20 1Oe-2.5Et 2OC, I 3H, joFe4NsO1.5oP 2S13 C, 1 4HI 20Fe4NO2.5P2S15
2306.21 2310.35Triclinic Triclinic
pT pT15.1180(12) 14.2454(10)16.8098(13) 16.7845(11)22.7156(18) 26.5044(18)96.5660(10) 87.4210(10)105.1310(10) 76.7280(10)91.6890(1) 69.4440(10)5525.4(8) 5770.3(7)2 21.386 1.3300.842 0.8401.80 to 25.31 1.49 to 27.3399.2 99.4
89482 10812019989 259080.1308 0.050524 301295 12810.7452, 0.6104 0.7455, 0.65700.0690 (0.1319) 0.0537 (0.1485)0.1344 (0.1554) 0.0808 (0.1643)1.016 1.2640.940, -0.663 2.322, -0.741

rings of the (Ph4P)+ cation partially occupying the voids. The refined structure has high residual
electron density (2.322 e. A~ 3) near an oxygen atom of one of the Et2O molecules at a site of
positional disorder that could not be refined satisfactorily.
The M6ssbauer spectrum of 10e (Figure 5.6E) shows that the apical iron atom is
electronically differentiated from the remainder of the cluster. This differentiation is typically
observed when the iron is multiply bound to the apical ligand (as in the case of 10f and 10h).14
Reactions with NO(g).In the reaction of clusters 9 and 10a-h with one equivalent of NO(g), two
nitrosyliron species (eq 1) are observed by IR spectroscopy and ESI mass spectrometry (Figure
5.10). The first species is RBA as evidenced by vNO bands at 1797, 1742, 1705 cm' (CH 2 Cl2 )
and observed masses for [Fe4S3(NO)X]~, where x ranges from 1 to 7.40 The formation of RBA
was anticipated because it has been identified as the dominant nitrosyliron product in the reaction
of NO(g) and Ph3CSNO with [Fe4 S4(SPh)4 ]2- and other synthetic iron-sulfur clusters.2 The
second nitrosyliron species was identified as 12, based on a vNO band at 1725 cm~1 (CH2Cl 2) and
observed masses for [Fe4S4(NO)y]~, where y ranges from 0 to 4 (Figure 5.10).7 In situ
monitoring of the reaction by ReactIR showed concomitant formation of both species (Figure
B.1). Upon addition of eight equivalents of NO(g), the sole nitrosyliron product is RBA.
2 [Fe4 S4 (LS3)Cl] 2- + 11 NO(g) -+ [Fe 4 S4 (NO)4]~+ [Fe4 S3(NO) 7]~+ 2 Cl + So + (LS 3)2 (1)
199

(Et4N) 21Fe4S4(SPh)1 [Fe(NO)] [FeS,(NO))[FeSS[(N[)F
2a[Fe4S,(NO)] )FeS,(NO))
[FeS,(N0)j [FeS,(NO)j
2e [Fe S (NO)4
[Fe S (NO))
1743cm1
1725 cm1
1300 1780 170 1740 1720 1700 34 380 380 400 420 440 460 480
Wavenumbers (cm ) m/z
Figure 5.10. Characterization of the products formed between clusters and NO(g). Left: CH2 Cl2
solution IR spectra. Right: ESI-MS negative mode spectrum from the reaction of 10b (Black,experimental; Red, simulated [Fe4S3(NO)x]V; Blue; simulated [Fe4S4(NO),]Y).
This result differs from that in previously published work, which reported the formation of
only RBA from synthetic, undifferentiated [4Fe-4S] clusters even in the presence of only one
equivalent of NO(g). 2 Our results suggest that the tridentate character of the LS3 ligand may slow
the reaction kinetics of these clusters with NO(g) by inhibiting access of NO to the less exposed
iron sites of the cluster.
Reactions with Ph3CSNO. In an attempt to control the release of NO and isolate possible
intermediate species, the S-nitrosothiol Ph3CSNO was allowed to react with clusters 9 and 10a-h.
When monitoring the cluster reaction with 1-4 equivalents of Ph3CSNO by solution FTIR
(Figure B. 14 - B.20) and ReactIR spectroscopy, the sole nitrosyliron product observed was 12
(eq 2), which is in contrast to the reaction of (Et4N)2 [Fe 4 S4 (SPh)4] with one equivalent of
Ph3CSNO forming RBA (Figure 5.11). After addition of two equivalents of Ph3CSNO, the
unreacted cluster was still observed by ESI-MS and Mbssbauer spectroscopy. Upon addition of
four equivalents of Ph3CSNO, only 12 is observed in the mass spectrum and the 5Fe M~ssbauer
spectrum (Figure 5.12). Further addition to a combined total of eight equivalents of Ph3CSNO
results in the conversion of 12 into RBA (eq 3). This conversion was previously observed while
200
I_-d,

trying to obtain X-ray quality crystals of [AsPh 4]12, but only [AsPh4]RBA was isolated, formed
presumably by an unknown decomposition pathway. 41 Formation of RBA has not been reported
to occur during nitrosation of [Fe4 S4(SR) 4 ]2- clusters. Formation of RBA from 12 has also been
observed by the 1-electron oxidation of 12 to 11 followed by air exposure.42 This known reaction
pathway suggests that 12 may form in biology at low NO concentrations from [4Fe-4S] clusters
but then converts readily to RBA in the presence of cellular oxidants and oxygen.
0.025 1746
0.020 0.025
0.015
1707 1746
00.0150.005 1800
-e 0.0100.000 0
16
Time (min)0.000
0 5 10 1S 201850 1800 1750 1700 1650
Wavenumbers (cm1 )
0.121749
0.10 - 101
00-1724 8 equive
724 - 00.06 ~~1703 00. M11
0.04 0.06. 4 equivs
0.02 8 equiva o.o4 removedfrom bath
0.00 equivs - 2 equive
94 oved from bathTime (min) 75
60 .02 equiv0
200 0 0 80 100
1840 820 1800 780 17M 1740 1720 171 0 10 Time (min)Wavenumbers (cm")
Figure 5.11. ReactIR spectra of (Et4N)2[Fe4S4(SPh) 4] and one equivalent of Ph3CSNO in CH2Cl2
at ambient temperature in CH2Cl 2 (top), 10b and varying equivalents of Ph3CSNO in CH2 Cl2(bottom). The time-dependent absorbances at different wavenumbers were monitored to observethe formation of 12 en route to RBA, which did not occur in the [Fe 4 S4 (SPh)4 ]2 - reaction but didin the reaction of 10b. The 10b solution was initially maintained in a dry ice/acetone bath, butafter no detectable product formed after one hour, the reaction was removed from the bath andallowed to warm to room temperature.
201

-2.0 -1.5 -. 0 0 0 0. 1.0 1.5 2.0 2.5 .2.. -1.0 .1.0 .. 0.0 Os 10 1.0S 2.0 2. 1 .1 ;. 0s 0" 10 2. 5 .6Velocity (mm/s) Velocity (mm/s) Velocity (min/s)
Figure 5.12. 80 K 57Fe Mbssbauer spectrum of 9 (left; raw data, black dots; fitted spectrum, redline), 12 (middle; raw data, black dots; fitted spectrum, blue line), and 9 and 12 via the reactionwith two equivalents of Ph3CSNO (right; raw data, black dots; fitted spectrum, green line; 9, redline; 12, blue line). 57Fe Mssbauer parameters for each spectrum are given in Table 5.2.
The reactions were worked up by pouring the mixture into a 10-fold greater volume of
pentanes, filtering through Celite, and extracting the remaining solid with methylene chloride.
Solvent was removed under vacuum from the filtrate and the methylene chloride extract to afford
masses of 26.4 mg and 17.2 mg, respectively. These masses correspond to the LS3 ligand and
(Ph 3CS) 2 in the filtrate and (Ph4P)C and 12 in the methylene chloride. The expected masses
were 33.5 mg for the filtrate and 19.4 mg for the methylene chloride extract. The presence of the
LS 3 ligand and (Ph3CS) 2 in the filtrate was confirmed by 'H NMR spectroscopy. The formation
of (Ph3CS)2 was further evidenced by GC-MS and X-ray crystallography (Figure 5.13 and 5.14).
Separation of 12 and (Ph 4P)CI from the methylene chloride extract was not achieved, but
spectroscopic characterization of 12 was not affected by this impurity.
[Fe4S 4(LS 3)Cl]2 + 4 Ph3CSNO -> [Fe4S4(NO)4] + Cl~+ Y (LS 3)2 + 2 (Ph3CS) 2 (2)
[Fe4S 4(LS 3)Cl] 2 + 7 Ph3CSNO [Fe4S 3(NO) 7] + Cl + S0 + 1/2 (LS 3)2 + 3.5 (Ph3CS) 2 (3)
202

Figure 5.13. Gas chromatogram and EI-MS spectrum of pentane extract of the reaction of 1 withone equivalent of Ph3CSNO.
Figure 5.14. Drawing of the crystal structure of (Ph3CS) 2 , ellipsoids are shown at 50%probability. Hydrogen atoms are removed for clarity. Color scheme: sulfur, yellow; carbon,colorless.
203

Table 5.4. X-ray crystallographic data for (Ph3CS) 2 and [compounds (Ph3CS) 2formula C38H30S 2
formula weight 550.74crystal system monoclinic
space group P2 1/ca, A 13.8744(15)b, A 12.0428(19)c, A 17.2348(19)a, deg 90P, deg 103.484(2)y, deg 90V, A3 2800.3(5)Z 4Pcalcd, g/cm 3 1.306p, mm~' 0.2170 range, deg 1.51 to 25.03completeness to 0, % 99.9reflections collected 43518independent reflections 4956R(int) 0.0957restraints 0parameters 361max., min. transmission 0.7452, 0.6251RL(wR2) [I>2a(I)] 0.0427 (0.0862)R1(wR2) 0.0708 (0.0959)GoF(F2 ) 1.204max, min peaks, e.A 3 0.434, -0.266
Cp*2Fe]12 at lOOK.[Cp* 2Fe]12C20H30Fe5N404S4
797.7triclinic
PI11.8500(9)14.8878(11)17.1595(13)90.1420(10)105.8060(10)92.2720(10)2910.3(4)41.82 12.7541.37 to 25.03100.045631102690.074106900.7452, 0.64380.0419 (0.0631)0.0829 (0.0722)1.0080.550, -0.442
The 80 K 57Fe Mdssbauer spectrum of the methylene chloride extract shows a doublet with
an isomer shift of 0.25 mm/s (Figure 5.13). This value varies from the published one of
[K(2,2,2-crypt)]12 at 300 K (0.156 mmn/s), but is close to the temperature-corrected value at 4.2
K (0.27 mnm/s) (Table 5.2). The observed quadruple splitting of 12 at 80 K is 0.90 mm/s, in
agreement with the previously reported value of 0.935 mm/s at 300 K of [K(2,2,2-crypt)]12."'.
The slight variations in isomer shifts may be due to temperature differences, but they are
nonetheless distinct from values of other known iron-nitrosyl species and the starting materials
used in this work (Table 2).3 The M6ssbauer spectrum of 12 also appears, in a 1:1 ratio with the
starting material, in a methylene chloride extract from the reaction of 9 with two equivalents of
204

Ph3CSNO, providing further evidence that at substoichiometric amounts of Ph3CSNO the only
observable product is 12.
An X-band EPR spectrum of the sample recorded at ambient temperature gave an isotropic
signal with geg= 2.030, and at 77 K a rhombic signal appeared with g, = 2.014, g2 = 2.026, and
g3 = 2.049 (Figure 5.15). These spectra have features similar to those in published EPR spectra
of biological DNICs, suggesting that previously reported experiments describing the formation
of DNICs were in fact observations of 12.41044 This conclusion may apply particularly when
products of [4Fe-4S] cluster nitrosation were assigned by their EPR spectra as non-protein
bound DNICs. In a previous study using NRVS using recombinant P. furiosus ferredoxin (D14C
mutant), RBA was identified as the major nitrosated product upon exposure to propylamine
propylamine NONOate.8 A minor EPR-active byproduct having <g> = 2.03 was assigned as a
protein-bound DNIC. Our current findings suggest that this and other results may merit
reconsideration. Further investigation of low-molecular weight products of protein nitrosations
using mass spectrometry, IR, NRVS, and Mssbauer spectroscopy are required to improve our
understanding of the nitrosated products.45
205

2.040 2.035 2.030 2.025 2.020 2.06 2.05 2.04 2.03 2.02 2.01
g-Factor g-Factor
Figure 5.15. X-Band EPR spectra of 12 at room temperature (left) and 77 K (right). Conditions:RT - frequency 9.847 GHz, microwave power 2.017 mW, modulation amplitude 10.0 G; 77K -frequency 9.208 GHz, microwave power 1.992 mW, modulation amplitude 10.0 G. The RTspectra is an isotropic S = V2 signal with a <g> = 2.030. The 77 K spectra is a rhombic S = 2
signal with gi = 2.014, g2 = 2.026, and g3 = 2.049. The shape and g-values of both spectra aretypically associated with DNICs in the literature.
Diamagnetic nitrosated products have been identified in stopped-flow kinetic studies of two
proteins of the Wbl family.' 6 This study reported evidence that the final product was generated
via the formation of mono-, di-, and tetra-nitrosated intermediates. The absence of additional
vibrational bands in the ReactIR traces during the present investigation, even at low temperature,
suggests that isolation and characterization of a mono- or dinitrosated iron-sulfur cubane cluster
is a difficult task. The instability of these thiol-bound, partially nitrosated cubane clusters may
lead to complete extrusion of the cluster from the LS3 ligand, as has been previously reported
when attempting salt metathesis of 9 using NaS'Bu.16
Reactions with NO(g)/Ph 3CSNO in the presence of TIPF6 Attempts to isolate a mono-
nitrosated cubane were unsuccessful. When attempts were made to identify a [Fe4 S4(LS3)(NO)]f~
species from the reaction of 9 and Ph3CSNO in the presence of a 5-fold excess of TlPF6, a VNO
band at 1790 cm- 1 (CH2Cl 2) was observed in the IR spectrum (Figure 5.16). This species was
subsequently identified as Fe4 S 4(NO)4 , 11, by cyclic voltammetry (Figure 5.17) and ESI mass
206

spectrometry (Figure 5.18). The CV shows two reversible reductions centered at -314 mV and -
1097 mV, which match the literature values of -370 mV and -1150 mV. 37 The reaction of 9 and
NO(g) in the presence of TlPF6 yields 11 and RBA (eq 4, Figure 5.16). Compound 11 can also
be obtained by addition of a 5-fold excess of TlPF 6 after formation of 12 from 9 (eq 5) or 10a/b.
2[Fe4 S 4(LS 3)ClI]2 + 1 NO(g) + 3Tl* -+ [Fe4S4(NO) 4] + [Fe4 S3(NO)7] + 2TICl(s) + (LS 3)2 + So + Ti(s) (4)
[Fe4 S 4(LS 3)CI]> + 4Ph3CSNO + 2T+ -- [Fe4S4(NO) 4] + TICI(s) + (LS3)2 + 2(Ph3 CS) 2 + Ti(s)
11
1 + N0(g)3
1 + 5TIPF6 + NO(g) [Cp*Fe]4
1788 c17i0
1750 c-
1743 c Q
1788 cm 1725 cni'
1725 cnil
7 a6 17,80 17'60 17'120 17'00
(5)
Wavenumbers (cm") Wavenumbers (cm")
Figure 5.16. CH2Cl 2 solution FTIR of the reaction of 1 in the presence of excess TIPF6 and oneequivalent of NO(g) (left) and Ph3CSNO (right).
-- 250 mV/s
IVI/000 m s
-50 mVIS---100 mV/S
250 mV/
---1000 mV/S
4.1 40.2 0.3 ;A 4.0 4 4.7 -08 -0.9 -1.0 -1.1 -1.2 -1.3 -1.4
Potential ( Potential (V)
Figure 5.17. Cyclic voltammogram of 11 at ambient temperature at scan speeds from 50 - 1000mV/s. The 11/12 couple appears at -314 mV and 12/12 couple at -1097 mV, both vs. Fc/Fc+. Allelectrochemical data were referenced internally to the ferrocene/ferrocenium couple at 0.00 V.
207

.106
441.4
1
3-
4000 1400 1600 800 2000 m1
Figure 5.18. Negative-mode ESI-MS spectrum of 11 in acetonitrile. Only peaks correspondingto [Fe4S4(NO)x,], where x is 0 - 4, were observed.
The one electron reduction of 11 using (C 5Me5 ) 2Fe resulted in formation of
[(C5Me5) 2 Fe][Fe4 S4 (NO)4], [Cp*2Fe]12 (Figure 5.19). This complex was crystallized from
CH2Cl2/Et 2O with two crystallographically independent molecules in the asymmetric unit. The
bond lengths and angles of the cluster are comparable to those published for [K(2,2,2-crypt)]12
and other mono-nitrosyl capped iron-sulfur clusters (Table 5.5).7 The observed isotopic patterns
in the mass spectrum and the vNO band in the IR match published values and those observed in
direct reactions of 9 with Ph3CSNO, providing further proof that the major isolatable product of
stoichiometric nitrosation of [Fe4 S4(LS 3)L']2- is 12.
208

N14514
Fe14
N13S13 -
Fe1 3 l2F2
512 Fe2\
FeN12
N11
Figure 5.19. Drawing of [Cp*2Fe]12 with thermal ellipsoids drawn at 50%. The other complex inthe asymmetric unit and hydrogen atoms are omitted for clarity. Color scheme: iron, green;sulfur, yellow; nitrogen; blue, oxygen, red; carbon, colorless.
Table 5.5. Selected geometric parameters of iron-sulfur clusters capped with mono-nitrosyls.(Cp 2*Fe)[12] [K(2,2,2-crypt)][12]37 1137 (Me 4N) 2 [Fe4 S4(NO) 4]
3 (PPN) 2 [Fe8S6 (NO)]46
bond length, AFe-N 1.654(4); 1.655(5) 1.661(5) 1.665(6) 1.673(3)
1.655(4) 1.659(5) 1.662(6) 1.665(7) 1.674(2)1.658(4); 1.660(5) 1.663(5) 1.676(2)1.664(4) 1.663(5) 1.666(6) 1.676(2)1.660(4);1.664(4)1.665(4);1.665(4)
N-O 1.176(4); 1.162(6) 1.143(6) 1.181(9) 1.177(2)1.175(4) 1.166(6) 1.148(7) 1.193(9) 1.179(3)1.183(4); 1.167(6) 1.157(6) 1.179(4)1.179(4) 1.178(6) 1.171(6) 1.184(3)1.185(4);1.180(4)1. 192(4);1.189(4)
bond angle,Fe-N-O 175.8(3); 176.8(5) 176.9(5) 176.4(6) 174.6(2)
175.8(3) 176.9(5) 177.3(5) 176.7(6) 176.7(2)176.7(3); 177.4(4) 177.6(5) 178.1(2)176.8(3) 178.9(6) 178.8(5) 178.8(2)178.1(4);177.9(3)179.1(3);179.1(3)
209

5.4 Summary and Conclusions
Synthesis of ligand 8 was successfully accomplished and modified to improve overall yields.
Cluster incorporation was achieved to form 9 which served as a starting material to form other
clusters of the type [Fe4S4 (LS3)L']2 -, 10a-h.
The reactions of the site-differentiated clusters 9 and 10a-h with either NO(g) or Ph3CSNO
produce the S = 2 nitrosated cluster 12 en route to the formation of the diamagnetic RBA. The
transformation of 12 into RBA by addition of an oxidant has been observed previously, but the
present study is the first to demonstrate that nitrosation reaction of [4Fe-4S] clusters proceed
through 12 en route to the RBA.41 The tetranitrosated cluster has a similar EPR spectrum to that
typically associated with DNICs, but only a single VNO band in the IR spectrum as well as
different Mssbauer parameters. The detection and isolation of EPR-active 12 via the direct
reaction of [4Fe-4S] clusters suggests that some nitrosyliron products previously reported in the
literature may have been mischaracterized as DNICs. This result is of particular interest when the
most of the nitrosated products are EPR-silent, suggesting formation of RBA as the end product.
Further investigations of low molecular weight nitrosyliron products by methods other than EPR
are necessary to determine conclusively whether 12 or a DNIC is generated in a biological
setting.
The isolation of a partially nitrosated cluster was not achieved. Even in the presence of
thallium, added to remove the apical chloride ion, the cluster was oxidized by Tl* to form 11,
which was then used to form [Cp*2 Fe]12 for crystallographic verification of the formation of 12.
210

5.5 References1. Crack, J. C.; Smith, L. J.; Stapleton, M. R.; Peck, J.; Watmough, N. J.; Buttner, M. J.;
Buxton, R. S.; Green, J.; Oganesyan, V. S.; Thomson, A. J.; Le Brun, N. E., J Am. Chem.Soc. 2010, 133, 1112.
2. Harrop, T. C.; Tonzetich, Z. J.; Reisner, E.; Lippard, S. J., J. Am. Chem. Soc. 2008, 130,15602.
3. Tsou, C.-C.; Lin, Z.-S.; Lu, T.-T.; Liaw, W.-F., J Am. Chem. Soc. 2008, 130, 17154.4. Drapier, J. C.; Pellat, C.; Henry, Y., J. Biol. Chem. 1991, 266, 10162.5. Kennedy, M. C.; Antholine, W. E.; Beinert, H., J. Biol. Chem. 1997, 272, 20340.6. Crack, J. C.; Stapleton, M. R.; Green, J.; Thomson, A. J.; Le Brun, N. E., J. Biol. Chem.
2013,288,11492.7. Tinberg, C. E.; Tonzetich, Z. J.; Wang, H.; Do, L. H.; Yoda, Y.; Cramer, S. P.; Lippard,
S. J., J. Am. Chem. Soc. 2010, 18168.8. Tonzetich, Z. J.; Wang, H.; Mitra, D.; Tinberg, C. E.; Do, L. H.; Jenney, F. E.; Adams,
M. W. W.; Cramer, S. P.; Lippard, S. J., J. Am. Chem. Soc. 2010, 132, 6914.9. Cruz-Ramos, H.; Crack, J.; Wu, G. G.; Hughes, M. N.; Scott, C.; Thomson, A. J.; Green,
J.; Poole, R. K., EMBO J. 2002, 21, 3235.10. Foster, M. W.; Cowan, J. A., J Am. Chem. Soc. 1999, 121, 4093.11. Emptage, M. H.; Kent, T. A.; Kennedy, M. C.; Beinert, H.; Munck, E., Proc. Natl. Acad.
Sci. U.S.A. 1983, 80, 4674.12. Chen, T.-N.; Lo, F.-C.; Tsai, M.-L.; Shih, K.-N.; Chiang, M.-H.; Lee, G.-H.; Liaw, W.-
F., Inorg. Chim. Acta 2006, 359,2525.13. Stack, T. D. P.; Holm, R. H., J. Am. Chem. Soc. 1987, 109, 2546.14. Ciurli, S.; Carrie, M.; Weigel, J. A.; Carney, M. J.; Stack, T. D. P.; Papaefthymiou, G. C.;
Holm, R. H., J. Am. Chem. Soc. 1990, 112, 2654.15. Stack, T. D. P. Subsite differentiated analogues of biological Fe4S42+ clusters: Steps
towards and detours from. Harvard University, Cambridge, MA, 1988.16. Stack, T. D. P.; Holm, R. H., J. Am. Chem. Soc. 1988, 110, 2484.17. van der Geer, E. P. L.; van den Brom, C. R.; Arfaoui, I.; Houssiau, L.; Rudolf, P.; van
Koten, G.; Klein Gebbink, R. J. M.; Hessen, B., J. Phys. Chem. C 2008, 112, 17225.18. Weigel, J. A.; Holm, R. H., J Am. Chem. Soc. 1991, 113, 4184.19. Zhou, C.; Holm, R. H., Inorg. Chem. 1997, 36, 4066.20. Lorkovic, I. M.; Ford, P. C., Inorg. Chem. 2000, 39, 632.21. Pangborn, A. B.; Giardello, M. A.; Grubbs, R. H.; Rosen, R. K.; Timmers, F. J.,
Organometallics 1996, 15, 1518.22. Christou, G.; Garner, C. D., J. Chem. Soc., Dalton Trans. 1979, 1093.23. Kent, T. A. WMOSS v. 2.5: Mossbauer Spectral Analysis Software, WEB Research Co.,
WEB Research Co.: Minneapolis, MN, 1998.24. APEX2 v2009 APEX2 v2009, Bruker AXS: Madison, WI, 2009.25. Sheldrick, G. M. SADABS: Area-Detector Absorption Correction, University of
G6ttingen: G6ttingen, Germany, 2008.26. Sheldrick, G., Acta Crystallogr., Sect. A: Found. Crystallogr. 2008, 64, 112.27. Sheldrick, G. M. SHELXTL97: Program for Refinement of Crystal Structures, University
of G~ttingen: GOttingen, Germany, 1997.28. Dolomanov, 0. V.; Bourhis, L. J.; Gildea, R. J.; Howard, J. A. K.; Puschmann, H., J.
Appl. Crystallogr. 2009, 42, 339.
211

29. Bolton, R.; Sandall, J. P. B., Journal of the Chemical Society, Perkin Transactions 21978, 137.
30. Hardy, A. D. U.; Macnicol, D. D.; Wilson, D. R., Journal ofthe Chemical Society, PerkinTransactions 2 1979, 1011.
31. Pollak, J.; Meissner, F. v., Monatsh. Chem. 1928, 50, 237.32. Pollak, J.; Rudich, Z., Monatsh. Chem. 1922, 43, 20933. Morgenstern, J.; Mayer, R., Z Chem. 1968,8, 106.34. Tard, C. CHEMISTRY RELATED TO THE [Fe]-HYDROGENASES. University of East
Anglia, Norwich, 2005.35. Walsdorff, C.; Saak, W.; Pohl, S., J. Chem. Soc., Dalton Trans. 1997, 1857.36. Rao, P. V.; Holm, R. H., Chem. Rev. 2004, 104, 527.37. Chu, C. T.-W.; Lo, F. Y.-K. W.; Dahl, L. F., J. Am. Chem. Soc. 1982, 104, 3409.38. Sedney, D.; Reiff, W. M., Inorg. Chim. Acta 1979, 34, 231.39. Sarte, B.; Stanford, J.; LaPrice, W. J.; Uhrich, D. L.; Lockhart, T. E.; Gelerinter, E.;
Duffy, N. V., Inorg. Chem. 1978, 17, 3361.40. D'Addario, S.; Demartin, F.; Grossi, L.; Iapalucci, M. C.; Laschi, F.; Longoni, G.;
Zanello, P., Inorg. Chem. 1993, 32, 1153.41. Chu, C. T. W.; Dahl, L. F., Inorg. Chem. 1977, 16, 3245.42. Butler, A. R.; Glidewell, C.; Li, M., Adv. Inorg. Chem. 1988, 32, 335.43. Hopmann, K. H.; Ghosh, A.; Noodleman, L., Inorg. Chem. 2009, 48, 9155.44. Duan, X.; Yang, J.; Ren, B.; Tan, G.; Ding, H., Biochem. J 2009, 417, 783.45. Tonzetich, Z. J.; McQuade, L. E.; Lippard, S. J., Inorg. Chem. 2010, 49, 6338.46. Kalyvas, H.; Coucouvanis, D., Inorg. Chem. 2006, 45, 8462.
212

APPENDIX A: M(BIPhMe) COMPLEXES ANDTHEIR REACTIONS WITH RNOS
213

A.1 Introduction
While exploring starting materials using the BIPhMe ligand, new iron, copper, and zinc
complexes were prepared. Some reactivity with nitrogen oxide species was explored for these
new complexes, but no studies were performed.
A.2 Experimental Methods
General. All manipulations were performed under an atmosphere of nitrogen gas using standard
Schlenk techniques or in an MBraun glovebox under an atmosphere of purified nitrogen. NO
(Airgas, 99%) was purified by a literature procedure.' The NO gas stream was passed through an
Ascarite column (NaOH fused on silica gel) and a 6 ft. coil filled with silica gel that was cooled
to -78 'C using a dry ice/acetone bath. Nitric oxide was stored using standard gas storage bulbs
and transferred by gastight syringes. Diethyl ether, pentane, methylene chloride, and acetonitrile
were purified using a Glass Contour solvent system.2 Deuterated solvents were purchased from
Cambridge Isotope Labs. [Fe(BIPhMe)Cl 2] was prepared as described in chapter 2. (PPN)(SNO)
and (PPN)(SSNO) were prepared as described in chapter 3. All organic chemicals were
purchased from Sigma-Aldrich and used as received. Metal salts were purchased from Strem
Chemicals and used as received.
Physical Measurements. NMR spectra were recorded on a Bruker Avance spectrometer
operating at 400 MHz at ambient temperature and referenced to residual signals in the deuterated
solvent. Low-resolution ESI mass spectra were obtained with an Agilent 1100 Series LC/MSD
mass spectrometer using degassed acetonitrile as the carrier solvent. FTIR spectra were recorded
on a Thermo Nicolet Avatar 360 spectrometer running the OMNIC software package; solid
samples were pressed into KBr disks and solution samples were prepared in an air-tight Graseby-
Specac solution cell with CaF2 windows and 0.1 mm spacers.
214

Mbssbauer Measurements. Samples for 5 7Fe M6ssbauer studies were prepared by grinding a
solid sample with Apiezon-N grease. These 57Fe M6ssbauer samples were placed in an 80 K
cryostat during measurement. A 5 7Co/Rh source was moved at a constant acceleration at room
temperature against the absorber sample. All isomer shift (6) and quadrupole splitting (AEQ)
values are reported with respect to 57Fe-enriched metallic iron foil that was used for velocity
calibration. The displayed spectrum was folded to enhance the signal-to-noise ratio. Fits of the
data were calculated by the WMOSS plot-and-fit program, version 2.5.5
X-ray Data Collection, and Structure and Solution Refinement. Crystals of suitable for X-ray
diffraction were mounted in Paratone N oil and frozen under a nitrogen cold stream maintained
at 100 K by a KRYO-FLEX low-temperature apparatus. Data were collected on a Bruker APEX
CCD X-ray diffractometer with Mo Ka radiation (X= 0.71073 A) controlled by the APEX2
software package.4 Empirical absorption corrections were calculated with SADABS. 5 The
structures were solved by direct methods with refinement by full-matrix least-squares based on
F2 using SHELXTL-97. 6-8 All non-hydrogen atoms were located and refined anisotropically.
Hydrogen atoms were assigned to idealized positions and given thermal parameters equal to
either 1.5 (methyl hydrogen atoms) or 1.2 (non-methyl hydrogen atoms) times the thermal
parameters of the atoms to which they were attached. Figures were generated using the Olex2.1
Graphical User Interface.9 See Tables A.1 - A.4 below for crystallographic data and refinement
details, and geometrical parameters.
215

N
1*
Fe(BIPhMe)1 2, 1. A 50 mL Erlenmeyer flask was charged with FeI2 (290 mg, 0.937 mmol) and
BIPhMe (261 mg, 0.922 mmol). Tetrahydrofuran (20 mL) and acetonitrile (10 mL) were added
to the flask and the solution was stirred for 30 min. The solvent was evaporated in vacuo and the
remaining brown solid was redissolved in methylene chloride (4 mL), then filtered through a
glass filter paper in a Pasteur pipette. The crystals were collected by filtration and washed with
diethyl ether (3x 10 mL) to afford 220.9 mg (0.373 mmol, 44%) of 1. X-ray quality crystals of 1
were grown by vapor diffusion of diethyl ether into the methylene chloride solution. Anal. Cale'd
for C1 6Hj8FeI 2N4 0: C, 32.46; H, 3.06; N, 9.46. Found: C, 32.60; H, 2.69; N, 9.32. ESI-MS
(MeCN, m/z): 747.1 (calc'd [M+BIPhMe-If]: 747.1), 465.0 (calc'd [M-I]f: 465.0), 339.1
(calc'd [M+H-I 2]+: 339.1), 283.1 (calc'd [BIPhMe+H]+: 283.2), 251.1 (calc'd [BIPhMe-OMe]f:
251.1). 'H NMR (400 MHz, CDCl 3, ppm): 10.88 (s), 11.55 (s), 12.00(br), 12.99 (s), 20.37 (br),
29.06 (br), 32.83 (br). FTIR (KBr, cm1): 3148 (w), 3108 (m), 3057 (w), 2933 (w), 2956 (w),
2924 (w), 2829 (w), 1977 (w), 1921 (w), 1839 (w), 1787 (w), 1636 (w), 1608 (w), 1540 (m),
1496 (s), 1467 (m), 1448 (s), 1399 (w), 1350 (w), 1324 (w), 1282 (s), 1255 (w), 1210 (w), 1171
(m), 1153 (m), 1138 (m), 1089 (m), 1072 (s), 984 (s), 897 (s), 762 (s), 723 (s), 701 (m), 645 (m),
628 (w), 664 (w), 511 (w), 467 (w). 57M5ssbauer (mm/s) (80 K, 6 mn/s, AEQ mm/s, F mm/s):
0.872(2), 3.100(2), 0.308(2).
216
1

NN
2
Fe(BIPhMe)(MeCN) 2(OTf)2, 2. In a 20 mL vial Fe(MeCN) 2(OTf) 2 (160 mg, 0.367 mmol) was
dissolved in acetonitrile (6 mL) and solution of BIPhMe (108 mg, 0.381 mmol) in methylene
chloride (4 mL) was added drop wise over the course of a minute. The solution was stirred
overnight, the solvent evaporated in vacuo, and redissolved in acetonitrile (0.5 mL) to afford a
colorless solution. This solution was filtered through glass filter paper in a Pasteur pipette. X-ray
quality crystals of 2 were grown by vapor diffusion of diethyl ether into the product solution over
the course of 7 days to afford colorless crystals. The product was collected and washed with
diethyl ether (3 x 10 mL) to afford 191.5 mg (0.266 mmol, 75%) of 2. Anal. Calc'd for
Fe(BIPhMe)(OTf) 2 (CH 3CN)1.5 CH 2C 2: C, 33.75; H, 3.15; N, 9.84. Found: C, 33.70; H, 3.34; N,
9.71. ESI-MS (MeCN, m/z): 487.0 (calc'd [M-OTf-2MeCN]+: 487.0), 283.1 [calc'd
[BIPhMe+H]+: 283.2), 251.1 (calc'd [BIPhMe-OMe]+: 251.1), 148.7 (calc'd [OTff : 149.0). 'H
NMR (400 MHz, CD3CN, ppm): 10.38 (s), 11.78 (s), 20.82 (s), 22.47 (s), 24.97 (s). '9F{'H}
NMR (376 MHz, CD3CN, ppm): -64.54 (s). FTIR (KBr, cm'): 3141 (w), 3058 (w), 2997 (w),
2939 (w), 2837 (w), 2313 (v(CN), m), 2284 (v(CN), m), 1546 (w), 1503 (m), 1473 (w), 1450
(m), 1404 (w), 1308 (v(S03, asymm), s), 1226 (s), 1217 (s), 1172 (v(CF3), s), 1091 (w), 1072
(w), 1035 (v(S0 3, sym), s), 991 (m), 956 (w), 936 (w), 900 (s), 761 (s), 725 (m), 690 (m), 637
(s), 583 (w), 512 (m), 469 (w). 57M6ssbauer (mm/s) (80 K, 6 mm/s, AEQ mm/s, F mm/s):
1.256(2), 4.344(2), 0.291(2).
217

0N \N
N N N
0 F N
N 0-N
-- ~ VN N
3
[Fe(BIPhMe)(N0 3)2j20, 3. This procedure was performed under aerobic and ambient moisture
conditions. A 100 mL round bottom flask was charged with Fe(N0 3)3-9H20 (600 mg, 1.487
mmol) and BIPhMe (421.1 mg, 1.487 mmol). The solid mixture was dissolved in tetrahydrofuran
(30 mL) and stirred for 1 h. Over the course of the reaction a brown precipitate formed. The
solvent was evaporated from the slurry and the product was extracted with methylene chloride
(10 mL). X-ray quality crystals were grown by vapor diffusion of diethyl ether into the
methylene chloride solution. The product was collected and washed with diethyl ether (3 x 20
mL) to afford 231 mg (0.416 mmol, 28 %) of 3. FTIR (KBr, cm): 3139 (m), 3063 (w), 2957
(w), 2933 (w), 2834 (w), 2525 (w), 2293 (w), 1776 (w), 1723 (w), 1500 (s), 1448 (m), 1407 (w),
1381 (w), 1353 (w), 1296 (s), 1278 (s), 1186 (w), 1162 (w), 1162 (w), 1141 (m), 1089 (w), 1070
(m), 1028 (m), 989 (m), 957 (w), 900 (m), 861 (m), 806 (w), 758 (m), 723 (m), 703 (m), 643
(m), 557 (w), 508 (w), 470 (w). UV-Vis (MeCN, nm, M -cm1): 268 (15270 700), 310 (10790
700), 365 (8450 800). 57M6ssbauer (mm/s) (80 K, 8 mm/s, AEQ mm/s, F mm/s): 0.562(2),
2.408(2), 0.284(2).
218

N 0N. 0
4
[Cu(BIPhMe) 2](OTf) 2, 4. To a 20 mL vial Cu(OTf)2 (183.1 mg, 0.5062 mmol) and BIPhMe
(297.7 mg, 1.051 mmol) was added. The mixture was dissolved in tetrahydrofuran (6 mL) and
stirred for 1 h resulting in a green solution. To the solution diethyl ether (14 mL) was added,
resulting in a green precipitate. The green precipitate was filtered on an F-grade frit, washed with
pentanes (3 x 10 mL), and dried under vacuum for 6 hours, affording 320.7 mg (0.3456 mmol,
68 %) of 4. X-ray quality crystals of 4 were grown by vapor diffusion of diethyl ether into a
methylene chloride solution. Anal. Calc'd for C34H36F6CuN8O 7S 2 : C, 44.08; H, 3.92; N, 12.10.
Found: C, 43.76; H, 3.61; N, 11.88. ESI-MS (MeCN, m/z): 627.3 (calc'd [M-2OTfl+: 627.2),
776.2 (calc'd [M-OTf]*: 776.2), 148.7 (calc'd [OTf]-: 149.0). FTIR (KBr, cm'1): 3162 (w),
3130 (in), 3079 (w), 2972 (m), 2937 (w), 2889 (w), 2834 (w), 1638 (w), 1550 (m), 1505 (s),
1449 (s), 1408 (w), 1354 (w), 1259(v(SO 3, asymm), s), 1224(s), 1149 (v(CF3), s), 1090 (w), 1071
(s), 1030 (v(S03, symm), s), 992 (s), 938 (w), 900 (s), 762 (s), 724 (s), 704 (s), 637 (s), 572 (m),
517 (m), 472 (w).
N N c]
'0 Cu0 C6
-N N....- N \: N-- - _CI
5
[Cu(BIPhMe) 2][CuC1 2j, 5. To a 20 mL vial CuCl (42.5 mg, 0.430 mmol) and BIPhMe (121.0
mg, 0.427 mmol) was added. The mixture was dissolved in a mixture of methylene chloride (6
219
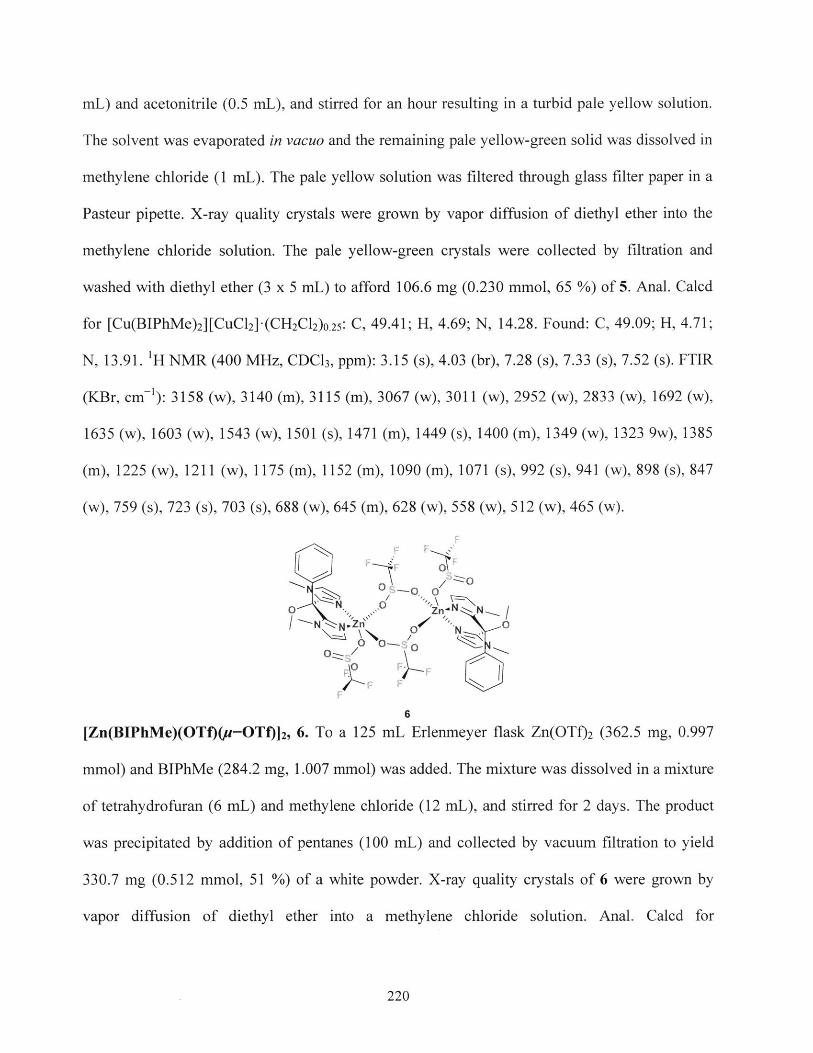
mL) and acetonitrile (0.5 mL), and stirred for an hour resulting in a turbid pale yellow solution.
The solvent was evaporated in vacuo and the remaining pale yellow-green solid was dissolved in
methylene chloride (1 mL). The pale yellow solution was filtered through glass filter paper in a
Pasteur pipette. X-ray quality crystals were grown by vapor diffusion of diethyl ether into the
methylene chloride solution. The pale yellow-green crystals were collected by filtration and
washed with diethyl ether (3 x 5 mL) to afford 106.6 mg (0.230 mmol, 65 %) of 5. Anal. Calcd
for [Cu(BIPhMe) 2][CuCl 2]-(CH2C 2). 25: C, 49.41; H, 4.69; N, 14.28. Found: C, 49.09; H, 4.71;
N, 13.91. 'H NMR (400 MHz, CDCl 3, ppm): 3.15 (s), 4.03 (br), 7.28 (s), 7.33 (s), 7.52 (s). FTIR
(KBr, cm 1): 3158 (w), 3140 (m), 3115 (m), 3067 (w), 3011 (w), 2952 (w), 2833 (w), 1692 (w),
1635 (w), 1603 (w), 1543 (w), 1501 (s), 1471 (m), 1449 (s), 1400 (m), 1349 (w), 1323 9w), 1385
(m), 1225 (w), 1211 (w), 1175 (m), 1152 (m), 1090 (m), 1071 (s), 992 (s), 941 (w), 898 (s), 847
(w), 759 (s), 723 (s), 703 (s), 688 (w), 645 (m), 628 (w), 558 (w), 512 (w), 465 (w).
N N.Zn 0 -
0F
6
[Zn(BIPhMe)(OTf)(u-OTf)] 2, 6. To a 125 mL Erlenmeyer flask Zn(OTf) 2 (362.5 mg, 0.997
mmol) and BIPhMe (284.2 mg, 1.007 mmol) was added. The mixture was dissolved in a mixture
of tetrahydrofuran (6 mL) and methylene chloride (12 mL), and stirred for 2 days. The product
was precipitated by addition of pentanes (100 mL) and collected by vacuum filtration to yield
330.7 mg (0.512 mmol, 51 %) of a white powder. X-ray quality crystals of 6 were grown by
vapor diffusion of diethyl ether into a methylene chloride solution. Anal. Calcd for
220

C36H36F 12N8O14 S4Zn2 : C, 33.47; H, 2.81; N, 8.67. Found: C, 33.44; H, 2.73; N, 8.45. 'H NMR
(400 MHz, CDC1 3, ppm): 3.32 (s, 3H), 3.62 (s, 6H), 7.31-7.80 (m, 5H), 7.50 (d, J = 7.43 Hz,
2H), 7.59 (d, J= 7.19 Hz, 2H). 19F{1H} NMR (376 MHz, CDCl 3, ppm): -77.72 (s). FTIR (KBr,
cm-1): 3148 (m), 3134 (m), 3058 (w), 2951 (w), 2835 (w), 1632 (w), 1548 (w), 1507 (m), 1476
(w), 1450 (m), 1328 (v(S0 3, asymm), s), 1312 (v(S0 3, asymm), s), 1285 (s), 1259 (s), 1236 (s),
1207 (s), 1183 (v(CF3 ), s), 1167 (v(CF 3), s), 1092 (m), 1074 (m), 1030 (v(S0 3, symM), s), 994
(m), 943 (w), 901 (m), 768 (s), 727 (s), 704 (s), 638 (s), 590 (w), 573 (m), 515 (m), 469 (m).
Reaction of [Zn(BIPhMe)(OTf)(u-OTf)j2 and (PPN)(SSNO). In a 20 mL vial,
[Fe(BIPhMe)C 2] (24.3 mg, 59.4 jimol) was dissolved in acetonitrile (2 mL), resulting in a
colorless solution. In a 5 mL vial, 6 (36.4 mg, 55.0 tmol) was dissolved in acetonitrile (2 mL),
resulting in a colorless solution, and a stir bar was added. The 5 mL vial was placed into the 20
mL vial. (PPN)(SSNO) (37.1 mg, 58.6 pmol) was added to the Zn-containing solution and the
reaction system was capped with a septum. The Zn-SSNO-containing solution turned from
colorless to black to orange to colorless within 2 min. The solution of [Fe(BIPhMe)C 2] turned
green indicating the release of NO(g). The Zn-containing solution was poured into pentanes (100
mL) and resulted in the formation of a colorless precipitate.
Reaction of [Zn(BIPhMe)(OTf)(u-OTf)]2 and (PPN)(SNO). In a 20 mL vial,
[Fe(BIPhMe)C 2] (23.1 mg, 56.5 gmol) was dissolved in acetonitrile (2 mL), resulting in a
colorless solution. In a 5 mL vial, 6 (39.8 mg, 60.1 ptmol) was dissolved in acetonitrile (2 mL),
resulting in a colorless solution, and a stir bar was added. The 5 mL vial was placed into the 20
mL vial. (PPN)(SNO) (39.0 mg, 64.9 pmol) was added to the Zn-containing solution and the
reaction system was capped with a septum. The Zn-SNO-containing solution turned from
colorless to dark green to orange to colorless within 2 min. The solution of [Fe(BIPhMe)C 2]
221

turned green indicating the release of NO(g). The Zn-containing solution was poured into
pentanes (100 mL) and resulted in the formation of a colorless precipitate.
A.3 Results and Discussion
Synthesis and spectroscopic characterization of M(BIPhMe) complexes. The brown-purple
compound Fe(BIPhMe)1 2, 1, is prepared by dissolving FeI2 and BIPhMe in a mixture of
tetrahydrofuran and acetonitrile. The complex is purified by stripping the reaction solvent,
redissolving the product in methylene chloride, and layering with diethyl ether. This method
yields brown-purple block crystals of 1 that can be further studied. The 1H NMR spectrum of 1 is
paramagnetically shifted similar to the related complexes having CI- and Br ligands (Figure
A.1).
34 3 32 31 3O 29 28 27 26 25 24 23 22 21 20 19 18 17 16 15 14 13 12 1' 10 9 8 7fi (ppm)
Figure A.1. 1H NMR spectrum of 1 in CDCl 3 at 400 MHz.
Preparation of Fe(BIPhMe)(MeCN) 2(OTf)2, 2, is achieved by mixing Fe(OTf)2(MeCN)2
and BIPhMe in acetonitrile. To obtain crystals of 2 we allowed diethyl ether to vapor diffuse into
222

the crude reaction solution, providing us with block crystals of 2 after two days. These crystals
do not maintain their crystallinity overtime but slowly turn into a powder, suggesting that loss of
acetonitrile may be occurring. The nitrile stretches of the bound acetonitrile molecules occur at
2284 cm' and 2313 cm', indicating that the two acetonitriles are not equivalent (Figure A.2).
The vibrational stretches at 1308 cm and 1035 cm are assigned as the asymmetric and
symmetric stretches of the SO 3 fragment, respectively. The band at 1172 cm-, is assigned as the
symmetric CF3 vibrational mode. These assignments match literature values.' 0
2313
2284
1308 171172
1035
4000 3oo 3000 2500 2000 1500 1000 0
Wavenumbers (cm 1)
Figure A.2. FTIR of 2 collected as a KBr pellet. Nitrile stretches are indicated in blue. SO 3stretches are indicated in yellow. A CF3 stretch is indicated in green.
The 'H NMR spectrum of 2 (Figure A.3) has only five peaks that are downfield of the
peaks of BIPhMe. The lack of the additional peaks is susptected to be due to the broadening of
the peaks corresponding to the protons of the imidazole rings. The lack of peaks for the bound
acetonitrile protons suggests that either the species is not six-coordinate in solution or the
resonances were replaced by deuterium-labeled acetronitrile molecules to form
223

Fe(BIPhMe)(CD 3CN)2(OTf)2. The '9F{'H} NMR spectrum of 2 (Figure A.4) contains a single
peak at -64.54 ppm which is down-field of the published value of -78.2 ppm."
I I C Go
40 30 30 25 20 A5 10 0 -5
Figure A.3. 'H NMR spectrum of 2 in CD3CN at 400 MHz.
10 0 -10 -20 -30 -40 -50 -60 -70 -00 -90 -100 -110 -120 -130 -140 -110 -100 170 -180 -190 -200 -210
Figure A.4. '9F{1H} NMR spectrum of 2 in CD3CN at 376 MHz.
The hept coordinate diiron compound [Fe(BIPhMe)(NO 3)2] 20, 3, is prepared by stirring a
solution of Fe(N0 3)3-9H20 and BlPhMe in tetrahydrofuran at ambient conditions. Loss of a
224

nitrate occurs by hydrolysis from adventitious water in the tetrahydrofuran to form nitric acid
and the oxo-bridge between the irons. During the reaction an insoluble, brown solid is formed
that is presumed to be an iron oxide hydroxide species. The intended product is separated from
the side products by stripping the reaction mixture and then redissolving the product in
methylene chloride. This methylene chloride solution can then be layered with diethyl ether to
form crystals of 3.
Copper binds two BIPhMe ligands. The preparation of [Cu(BIPhMe) 2](OTf)2, 4, is
performed by adding two equivalents of BIPhMe to a solution of Cu(OTf)2 in tetrahydrofuran,
and forming a green solution. Adding a 2-fold excess of diethyl ether to the solution precipitates
out 4. Filtration, washing with pentanes, and drying under vacuum affords analytically pure 4.
The Cu(I) complex [Cu(BIPhMe) 2][CuCl 2], 5, is afforded by combining molar
equivalents of CuCl and BIPhMe in a methylene chloride/acetonitrile mixture. The solvent is
then stripped, leaving a yellow-green solid. This solid is dissolved in a minimal amount of
methylene chloride and layered with diethyl ether to grow crystals of 5.
The Zn(OTf)2 binds an equivalent of BIPhMe to form a colorless solid. Crystallization of
the product results in a triflate-bridged dizinc complex, but the 1H NMR spectrum has two full
sets of ligand peaks (Figure A.5). These two sets are proposed to reflect an equilibrium between
a mononuclear and dinuclear complex at 298 K. The 1 9F{'H} NMR spectrum shows a single
peak at -77.72 ppm, which is similar to the published value of free triflate.
225

760 7.50 7.40 7.30 7 0 7.10
8,0 7.5 7.0 6.5 6.0 5.5 5.0 4.5 4.0 3.5 3.0 2.5 2.0 1.5 1.0 0.5fi (ppm)
Figure A.5. 'H NMR spectrum of 6 in CDCl3 at 400 MHz at 298 K.
Crystallographic characterization of M(BIPhMe) complexes. Crystals of compound 1 were
unstable below 140 K, at which point the crystal cracks and becomes unusable for X-ray
diffraction studies. Diffraction spot frames were collected at varying temperatures to determine
the lowest temperature that X-ray structural data could be collected (Figure A.6). Full data sets
were collected at 296 K and 140 K, both consisting of the pseudo-tetrahedral complex 1. No co-
crystallized solvent or other species were observed at either temperature, suggesting that the
cracking of the crystals is probably due to a change in the packing or rearrangement to another
crystal system. Changes in bond distances and angles between the two structures are neglible
(Table A.l).
226

Figure A.6. Diffraction spot intensities of a single crystal of 1 at varying temperatures. A) 296K, B) 250 K, C) 140 K, D) 120 K. The crystal undergoes a phase change in the 120-140 Ktemperature range resulting in loss of crystallinity.
227

N6
12
Figure A.7. Graphical representation of the X-ray crystal structures of 1 at 298 K (left) and 140K (right), with ellipsoids shown at 50% probability. Hydrogen atoms are omitted for clarity.Color scheme: iron, orange; iodide, purple; nitrogen, blue; oxygen, red; carbon, colorless.
Table A.1. Selected bond distances for M(BIPhMe) complexes.Complex M-N, A N-M-N, M-X, A X-M-X,o N-M-X,Fe(BIPhMe)1 2, 1 at 140 K 2.0458(16) 8677(6) 2.5749(3) 116.711(12) 109.17(5)
2.0551(16) 2.6040(3) 109.30(5)111.70(5)119.26(5)
Fe(BIPhMe)I2, 1 at 296 K 2.046(3) 86.82(12) 2.5713(6) 116.34(2) 109.37(9)2.055(3) 2.6021(6) 109.72(8)
112.11(8)118.79(9)
Fe(BIPhMe)(OTf)2(MeCN) 2, 2 2.109(2) 86.21(9) 2.099(2) 171.53(9) 91.64(9)2.129(2) 94.63(9) 2.156(2) 94.98(9)Acetontrile: 178.23(10) 90.66(9)2.169(3) 92.95(10) 93.31(9)2.205(3) 94.63(9) 86.87(10)
174.49(10) 90.95(10)86.35(10) 90.44(10)
81.24(9)[Cu(BIPhMe)2(OTf)](OTf), 4 1.9622(14) 90.45(5) 2.7074 N/A 76.23
1.9639(13) 90.60(5) 84.341.9786(13) 93.33(5) 80.681.9808(13) 99.04(5) 125.91
149.52(6)154.02(6)
[Cu(BIPhMe)2][CuCI2], 5 2.0178(13) 89.98(5) 2.1031(4) 180.0 N/A2.0337(13) 106.27(7)
109.03(7)134.18(5)
228
N1
N612

Table A.2. X-ray crystallographic data for 1 at 296compounds Fe(BIPhMe)1 2 ,formula C16H18I2FeN40formula weight 591.99crystal system monoclinicspace group P2 1/na, A 10.7545(7)b, A 15.2080(10)c, A 13.5729(9)P, deg 106.2520(10)v, A 2131.6(2)ZPcalcd, g/cm 3
P, mm~16 range, degcompleteness to 0, %reflections collectedindependent reflectionsR(int)restraintsparametersMax., min. transmissionR1(wR2) [I>2a(I)]RI(wR2)GoF(F 2)max, min peaks, e.A 3
41.8453.6142.06 to 27.54100.003973149150.037702200.7456, 0.63590.0397 (0.0866)0.0602 (0.0926)1.3620.973, -0.852
K and 140 K.1, 296 K Fe(BIPhMe) 2, 1, 140 K
C16HI 8I2FeN40591.99monoclinicP2 1/n10.7109(5)15.0257(7)13.4973(6)105.8210(10)2089.95(17)41.8813.6852.07 to 30.9595.04522663100.024202200.7461, 0.60980.0238 (0.0622)0.0291 (0.0636)1.4550.968, -0.666
Compound 2 crystallized as a distorted octahedral complex with all N-donors in the
equatorial plane and the two triflate anions bound by oxygen at the apical sites (Figure A.8). The
coordination environment of this complex is similar to that in the published structure of
Fe(OTf) 2(MeCN) 4, which is green, whereas these crystals are colorless. The asymmetric unit of
the crystal contains two independent molecules with similar coordination and bonding, where
one molecule is perpendicular to the other.
229

Figure A.8. Graphicalasymmetric unit withclarity. Color scheme:carbon, colorless.
Table A.3.
N6 N12
FelN11
04
representation of the X-ray crystal structure of one molecule of 2 from theellipsoids shown at 50% probability. Hydrogen atoms are omitted foriron, orange; sulfur, yellow; fluorine, green; nitrogen, blue; oxygen, red;
X-ray crystallographic data for 2 and 3 at 100K.compounds Fe(BIPhMe)(OTf) 2(MeCN) 2, 2formula C 20H24F6FeN 60 7S2
formula weight 574.75crystal system triclinic
space group
a, Ab, Ac, Aa, degP, degy, degV, A'zPcalcd, g/cm 3
U, mm0 range, degcompleteness to 0, %reflections collectedindependent reflectionsR(int)restraintsparametersMax., min. transmissionR I(wR2) [I>2a(1)]R1(wR2)GoF(F 2)max, min peaks, e.A
P 113.983(2)14.426(3)17.050(3)71.015(3)89.559(3)73.622(3)3107.0(10)41.2290.7051.27 to 28.8499.063776160900.040208030.7452, 0.65880.0633 (0.1938)0.0723 (0.1967)1.7852.265, -1.005
[Fe(BIPhMe)(NO 3)2]20, 3C34H40Cl4Fe2N12 01 5
1110.28monoclinicP2 1/c
19.2099(16)16.7977(18)14.919(2)90109.3520(18)904542.0(9)81.6240.9541.12 to 27.4099.720336102840.056306130.7455, 0.67960.0806 (0.2218)0.0941 (0.2240)2.7911.079, -2.064
230

Compound 3 crystallizes in a monoclinic space group with two molecules in the
asymmetric unit. The two irons are seven-coordinate with the oxygen atoms of the two nitrates
and a nitrogen of the BIPhMe forming the equatorial plane of a pentagonal bipyramid (Figure
A.9). The Fe-Oridge bond distance is 1.7781(6) A with a Fe-Oridge-Fe bond angle of
180.00(2)'. The Fe-Oitate bond distances are 2.178(3) A, 2.194(3) A, 2.214(3) A, and 2.249(4)
A. The Onitrate-Fe-Onitrate bond angles are 58.31(13)0 and 58.37(12)0 for the intra-nitrate oxygen
atoms, and 77.72(12)0, 136.08(13)0, 135.77(12)0, and 165.13(13)0 for the inter-nitrate oxygen
atoms. The Obrige-Fe-Onitrate bond angles are 92.10(9)0, 92.51(8)*, 89.87(10)0, and 93.54(9).
The Fe-Neq bond distance is 2.099(4) A and the Fe-Nax distance is 2.112(3) A. The N-Fe-N
bond angle is 84.30(14)0. The Nax-Fe-Obrige angle is 177.09(10)0 and the Neq-Fe-Orige angle
is 98.60(10)0. These geometrical parameters are very similar to the published values of the
crystal structure of [Fe(bpy)(NO3 )2] 20.1 2
011
N6 12 FelA
Fe1 01N1
/IA 015
014
Figure A.9. Graphical representation of the X-ray crystal structure of one molecule of 3 from theasymmetric unit with ellipsoids shown at 50% probability. Hydrogen atoms are omitted forclarity. Color scheme: iron, orange; chloride, dark green; nitrogen, blue; oxygen, red; carbon,colorless.
231

Table A.4 Selected geometrical parameters of hepta-coordinate, p-oxo diiron complexes.[Fe(BIPhMe)(NO 3)2]20, 3 [Fe(bpy)(N0 3)2]2012
bond length, AFe-Obridge 1.7781(6) 1.7755(4)Fe-Oniate 2.249(4) 2.214(3) 2.159(2) 2.142(2)
2.178(3) 2.194(3) 2.262(2) 2.203(2)Fe-N 2.099(4) 2.112(3) 2.140(2) 2.178(2)
bond angle, 0
Onirate-Fe-Onitrate Intra: Inter: Intra: Inter:58.31(13) 77.72(12) 57.97(7) 75.09(7)58.37(12) 136.08(13) 59.01(7)
135.77(12)165.13(13)
Onitrate-Fe-Obridge 92.10(9) 89.87(10) 96.32(5) 98.67(5)92.51(8) 93.54(9) 91.19(5) 93.44(6)
N-Fe-N 84.30(14) 75.02(8)N-Fe-Obridge 98.60(10) 177.09(10) 95.31(6) 169.19(6)Neq-Fe-Onitrate 137.00(14) 85.73(14) 79.84(8) 86.92(8)
142.42(14) 79.45(14)Nax-Fe-Onitrate 85.92(13) 90.08(13) N/A
84.99(12) 87.24(13)Fe-O-Fe 180.00(2) 180
Complex 4 has a distorted square pyramidal geometry (Figure A. 10). The two BIPhMe
ligands are positioned in the equatorial plane with the oxygen atom of the triflate ligand
interacting with the copper center at the apical position. The intra N-Cu-N bond angles of the
BIPhMe ligands are 90.45(5)* and 90.60(5)0. The N-Cu-N bond angles of the cis-nitrogens is
93.33(5)0 and 99.04(5)0, and 149.52(6) 0 and 154.02(6)0 between the trans-nitrogens. The Cu-N
bond distances are 1.9622(14) A, 1.9639(13) A, 1.9786(13) A, and 1.9808(13) A. The torsion
angle between the two ligands is 46.150 out of plane. The apical triflate ligand does not form a
perfect 900 angle with the equatorial nitrogen atoms, but is rather 84.340, 76.23*, 80.680, and
125.91'. An oxygen atom of the triflate ligands are 2.7074 A and 2.9318 A from the copper
center, suggesting that they are not directly bound but rather only interacting with the dz2 orbital
of the metal.
232

N1
Cul
N6 N26
N21
Figure A.10. Graphical representation of the X-ray crystal structure of 4 with ellipsoids shown at50% probability. Hydrogen atoms are omitted for clarity. Color scheme: copper, magenta; sulfur,yellow; fluorine, green; nitrogen, blue; oxygen, red; carbon, colorless.
Complex 5 crystallizes with half a molecule in the asymmetric unit (Figure A. 11).
Generation of the other half of the molecule results in a linear [Cu'Cl 2] and a pseudo-tetrahedral
[Cul(BIPhMe) 2] complex. The BIPhMe complex has an intra N-Cu-N angle of 89.98(5)0. The
N-Cu-N angles between the symmetry generated nitrogen atoms are 106.27(7)0 and 109.03(7)',
and 134.18(5)* for the trans-nitrogen atoms. The torsion angle between the two N-Cu-N planes
is 27.40. The Cu-N bond distances are 2.0337(13) A and 2.0178(13) A. The Cu-Cl bond
distance is 2.1031(4) A and the bond angle of the symmetry equivalent chlorides is 180'. The
structure does show that the geometry of the [Cu(BIPhMe) 2]"* complex changes dramatically
from having more square planar character to tetrahedral upon reduction.
233

Table A.5. X-ray crystallographic data for 4, 5, and 6 at 100 K.compounds [Cu(BIPhMe) 2](OTf)2, 4 K [Cu(BIPhMe) 2][CuCl2I, 5 K [Zn(BIPhMe)(OTf)(u-OTf)]2,
6formula C34H36CuF6N 808S2 C 32H 2CI2Cu 2N802 Cj 8H1 8F 6N 40 8S2Zn
formula weight 926.37 754.60 661.85crystal system monoclinic monoclinic Monoclinicspace group P21/c C2/c P2 1/ca, A 21.1854(9) 26.1032(11) 9.6948(4)b, A 13.1172(5) 7.9819(3) 22.6150(10)c, A 16.9684(7) 16.8627(7) 12.3263(5)P, deg 111.3610(10) 107.6840(10) 110.3110(10)V, A3 4391.5(3) 3347.4(2) 2534.48(18)Z 4 4 4Pcalcd, g/cm 3 1.401 1.497 1.735P, mm' 0.673 1.473 1.2290 range, deg 1.03 to 30.55 1.64 to 30.82 1.80 to 30.88completeness to 0, % 97.3 95.3 94.7reflections collected 93126 35190 53563independent reflections 13094 5020 7569R(int) 0.0299 0.0245 0.0251restraints 0 0 78parameters 538 213 355Max., min. 07461, 0.6735 0.7461, 0.6508 0.7461, 0.5733transmissionR l(wR2) [I>2a(I)] 0.0394 (0.1306) 0.0297 (0.1060) 0.0356 (0.1152)R1(wR2) 0.0457 (0.1340) 0.0359 (0.1125) 0.0434 (0.1195)GoF(F 2) 1.913 1.734 1.884max, min peaks, e.A 3 1.310, -0.586 0.994, -0.251 1.157, -1.045
N6A
CuC N6
NWAN1 U2
C1 A
Figure A. 11. Graphical representation of the X-ray crystal structure of 5 with ellipsoids shown at50% probability. Hydrogen atoms are omitted for clarity. Color scheme: copper, magenta;chloride, green; nitrogen, blue; oxygen, red; carbon, colorless.
234

Reactions of M(BIPhMe) complexes with RNOS. [Cu(BIPhMe) 2](OTf) 2 does not react with
NO(g) as measured by UV-vis spectroscopy, but upon addition of N0 2(g) shows the formation
of a shoulder at 350 nm and a minor decrease in intensity of the broad absorption bands at 610
nm and 746 nm (Figure A.12). This spectroscopic change does not result in a qualitative color
change of the solution in methylene chloride.
1.2 1.2
1.0-
0.9
0.6.
S0.6 0.6
0.4 350
0.3
0.2-
0.0- 0.0300 400 0 600 700 800 300 400 600 600 700 000
Wavelength (nm) Wavelength (nm)
Figure A.12. The UV-Vis spectra of [Cu(BIPhMe)2](OTf)2 and the reaction product with NO(g)(left) and N0 2(g) (right). In the reaction with NO(g) no change is observed. In the reaction withN0 2(g) only an increase in the band at 350 nnm.
The reaction of 6 with (PPN)(SNO) was monitored by UV-Visible spectroscopy (Figure
A. 13). The band at 332 nm, associated with SNO0, diminishes upon mixing with the solution of
6. A new band at 440 nm forms along with an isosbetic point at 390 nm. We assign the formation
of this band to the formation of SSNO . It has been previously reported that SSNO can be
formed from SNO upon addition of elemental sulfur in solution.' 3 The observance of SSNO
formation suggests that 6 promotes the cleavage of the S-N bond to form elemental sulfur.
235

1.8 1.8 -
1.2-
0.9. -3 ''' ""332 nm!0.4
0.60.
0.3-
0.0_ 0.0
2 300 30 400 450 60 50 600 60 0 20 0 60
Wavelength (nm) Time (min)
Figure A.13. The time-dependent UV-Visible spectroscopy in the reaction of 6 and (PPN)(SNO)in acetonitrile at 250 C.
Similar reactivity was observed during the reaction of 6 with (PPN)(SSNO), but only a
decrease in the intensity of the band at 420 nm with the band shifting to 440nm (Figure A.14).
This result suggests that 6 also promotes the cleavage of the S-N bond in SSNO . The release of
NO(g) from the reaction can be observed by using [Fe(BIPhMe)Cl2 ] as a colorimetric sensor
(Figure A. 16). The other reaction product is a zinc polysulfide.
2.0 IA
1.8
1.6 1.2 420 nm!20 1.0
1.23. 0.8
1.0
0 0.8 0.6
0.6
OA
0A
0.20.2-
300 400 500 60 0 700 0 2 40 100 120
Wavelength (nm) Time (min)
Figure A.14. The time-dependent UV-Visible spectroscopy in the reaction of 6 and(PPN)(SSNO) in acetonitrile at 25' C.
236

Figure A.16. Vial of 6 and Fe(BIPhMe)C 2 (left). After addition of (PPN)(SSNO) to the solutionof 6, NO(g) is released and converts Fe(BIPhMe)C 2 to [Fe(BIPhMe) 2(NO)Cl][Fe(NO)C 3](middle) and Zn{S} (right).
A.4 Summary and Conclusions
We prepared additional metal-BIPhMe complexes using iron, copper, and zinc. These
complexes were crystallographically characterized to have unique structures compared to the
complexes reported in chapter 3. Initial reactivity studies of the complexes with different RNOS
were performed, but further study would be needed to completely understand the chemistry
observed.
237

A.5 References
1. Lorkovic, I. M.; Ford, P. C., Inorg Chem 2000, 39, 632.2. Pangborn, A. B.; Giardello, M. A.; Grubbs, R. H.; Rosen, R. K.; Timmers, F. J.,
Organorfetallics 1996, 15, 1518.3. Kent, T. A. WMOSS v. 2.5: Mbssbauer Spectral Analysis Software, WEB Research Co.,
WEB Research Co.: Minneapolis, MN, 1998.4. APEX2 v2009 APEX2 v2009, Bruker AXS: Madison, WI, 2009.5. Sheldrick, G. M. SADABS: Area-Detector Absorption Correction, University of
G6ttingen: G6ttingen, Germany, 2008.6. Sheldrick, G., Acta Crystallographica Section A 2008, 64, 112.7. Sheldrick, G. M. SHELXTL97: Program for Refinement of Crystal Structures, University
of G6ttingen: G6ttingen, Germany, 1997.8. SHELXTL v. 6.10: Program Library for Structure Solution and Molecular Graphics,
Bruker AXS, Madison, WI, 2001.9. Dolomanov, 0. V.; Bourhis, L. J.; Gildea, R. J.; Howard, J. A. K.; Puschmann, H., JAppl
Crystallogr 2009, 42, 339.10. Riedel, P. J.; Arulsamy, N.; Mehn, M. P., Inorg. Chem. Commun. 2011, 14, 734.11. Martin, A.; Martinez-Espada, N.; Mena, M.; Yelamos, C., Chem. Commun. 2007, 2983.12. Taft, K. L.; Masschelein, A.; Liu, S.; Lippard, S. J.; Garfinkel-Shweky, D.; Bino, A.,
Inorg. Chim. Acta 1992, 198-200, 627.13. Seel, F.; Kuhn, R.; Simon, G.; Wagner, M., Zeitschriftfuer Naturforschung, Teil B:
Anorganische Chemie, Organische Chemie 1985, 40b, 1607
238

APPENDIX B: MASS SPEC AND FTIRFIGURES OF THE REACTIONS NO(g) andPh3CSNO WITH [Fe4S 4(LS 3)L']2-
239

1733 S0.0200.015
0.010
M
-e0
0.005 <
0.000
200150
5100 Time (min)
1850 1800 1750 1700 1650
Wavenumbers (cm")
ed
1600
0.022.
0.020-
0.018-
0.016.
0.014.-
0.012-
0.010.
0.008-
0.006.
0.004.
0.002.
0.000.
.0.002-
- 1 75 cm--- 1725 cm-- 1700 cm'
0 50 100 10 200 2;0
Time (min)
Figure B.1. Left: ReactIR spectra of (Ph4P)2[Fe4S 4(LS 3)(SPh)] and one equivalent of NO(g) inCH2C1 2. Right: The time-dependent absorbances at different wavenumbers were monitored toobserve the concomitant formation of RBA and [Fe4S4(NO)4] .
D439.5
B C411.6381.3 37. 41.
39 25
427.5
440
E485
481.1
1i 1 . 1 .11. I. 4 9.
500.4
IjI 11540 1 13.460 480k 0 5 20 S mDns
Figure B.2. Negative-mode ESI-MS spectrum (MeCN) of (Ph4P) 2 [Fe4 S4 (LS3)Cl] with oneequivalent of NO(g). A) [Fe4S 3(NO)] (calculated: 349.6 m/z, observed: 349.5 m/z), B)[Fe4S4(NO)] (calculated: 381.6 m/z, observed: 381.3 m/z), C) [Fe 4 S4(NO)2 ] (calculated: 411.6m/z, observed: 411.6 m/z), D) [Fe4 S3(NO) 4 ] (calculated: 439.6 m/z, observed: 439.5 m/z), E)[Fe4 S 3(NO) 5 (calculated: 469.6 m/z, observed: 469.5 m/z).
240
A349.5
Croon'X10
5
2.5
20
1.5
1.0
0.5
-MS. 0.4mn #1,
340O 360 380 400 420

Intens ImS, 0,5ln in 15-61 090n#1
A341
B D381 5 4395
C411 5
[ 4 4(44(e 42. 491.4( ) (.......... 4 ... L.. .L ....... . ... ... ...........3,0 360 380 400 420D 4404Q 4W0 500 0 112
Figure B.3. Negative-mode ESI MS spectrum (MeCN) of (Ph4P)2 [Fe4S4(LS3)(SEt)] with oneequivalent of NO(g). A) [Fe4S 3(NO)]- (calculated: 349.6 mlz, observed: 349.5 m/z), B)[Fe4S4(NO)]- (calculated: 381.6 m/z, observed: 381.5 m/z), C) [Fe4 S 4(NO) 2]- (calculated: 411.6m/z, observed: 411.5 m/z), D) [Fe4 S3(NO)4]- (calculated: 439.6 m/z, observed: 439.5 m/z), E)[Fe4 S3(NO)5]- (calculated: 469.6 m/z, observed: 469.5 m/z).
n ~ ~~ ~ ~ ~ - -- s. m #21
A349.6
DB C 434.
38105 411.5
43108
367. 3 469
0 349 L....JL..i .460.7 490. Y.7
34 30 3 00 42D 4 480 SoH
Figure B.4 Negative-mode ESI-MS spectrum (MeCN) of (Ph4P)2[Fe4S4(LS3)(SPh)] with oneequivalent of NO(g). A) [Fe 4S 3(NO)]- (calculated: 349.6 m/z, observed: 349.6 m/z), B)[Fe4S4(NO)]- (calculated: 381.6 m/z, observed: 381.5 m/z), C) [Fe 4 S4(NO) 2]~ (calculated: 411.6m/z, observed: 411.5 m/z), D) [Fe4 S3 (NO)4]~ (calculated: 439.6 m/z, observed: 439.5 m/z), E)[Fe4 S3(NO)5 ]~ (calculated: 469.6 m/z, observed: 469.5 m/z).
241

-MS. 09mms #239Intens -. I f,!D
439.5
20A3496
B
330 2 39 453. EI 437 1
340 360 .390 400 42V..440 ..460 ............. 5-10
Figure B.5. Negative-mode ESI-MS spectrum (MeCN) of (Ph4 P) 2[Fe 4 S 4(LS3)(N 3)] with one
equivalent of NO(g). A) [Fe4S3(NO)]- (calculated: 349.6 m/z, observed: 349.6 m/z), B)[Fe4S4(NO)]- (calculated: 381.6 m/z, observed: 381.5 m/z), C) [Fe 4 S4 (NO)2 ]~ (calculated: 411.6m/z, observed: 411.5 m/z), D) [Fe4 S3(NO) 4]- (calculated: 439.6 m/z, observed: 439.5 m/z), E)[Fe4 S3 (NO)5 ]- (calculated: 469.6 m/z, observed: 469.5 m/z).
Inens -MS 1 1mm #35-
A B34)5 381.5
2.5 i411i 6
D4396
1.01
493 6367 547
24.3997.6
134304 4 E37 17 3
469. 4.
340 360 380 400 420 40 480 S00 S20
Figure B.5. Negative-mode ESI-MS spectrum (MeCN) of (Ph4P) 2[Fe4S4(LS3)(SPyr)] with oneequivalent of NO(g). A) [Fe 4S 3(NO)]~ (calculated: 349.6 m/z, observed: 349.5 m/z), B)
[Fe4S4(NO)]~ (calculated: 381.6 m/z, observed: 381.5 m/z), C) [Fe 4 S 4(NO) 2]~ (calculated: 411.6m/z, observed: 411.6 m/z), D) [Fe4 S 3(NO)4 ]~ (calculated: 439.6 m/z, observed: 439.6 m/z), E)[Fe4 S3(NO)5 ]~ (calculated: 469.6 m/z, observed: 469.4 m/z).
242

iflI~f- ----- -0----9-intens -PS 30min #9s5A349.6
D439.5
54 C
B
418.6 5085
373
2
367.s5
334 677.4 lii 4696 40
340 360 300 400 420 4.40 40W 500 520 m.'
Figure B.6. Negative-mode ESI-MS spectrum (MeCN) of (Ph4P)2[Fe4S4(LS 3)(tpz)] with oneequivalent of NO(g). A) [Fe 4S 3(NO)]- (calculated: 349.6 m/z, observed: 349.6 m/z), B)[Fe4S4(NO)]- (calculated: 381.6 m/z, observed: 381.5 m/z), C) [Fe4 S4 (NO) 2]~ (calculated: 411.6m/z, observed: 411.5 m/z), D) [Fe4S3(NO) 4]- (calculated: 439.6 m/z, observed: 439.5 m/z), E)[Fe4 S3(NO) 51] (calculated: 469.6 m/z, observed: 469.6 m/z), F) [Fe4 S3(NO) 6 ]- (calculated: 499.6m/z, observed: 499.7 m/z), G) [Fe4 S3(NO) 7]- (calculated: 529.6 m/z, observed: 529.6 m/z).
A
1.5 1.5
340 . 038 40 42 44 46 48 50 2 mz
4390
43180
30 0
CF39gr s3p(
34 6 6 00 4. 4 6 4 0 0. o 52
Figure B.7. Negative-mode ESI-MS spectrum (MeCN) of (Ph4P) 2[Fe4S4(LS 3)(S2CNEt2)] withone equivalent of NO(g). A) [Fe4S3(NO)]- (calculated: 349.6 m/z, observed: 349.5 m/z), B)[Fe4S4(NO)]~ (calculated: 381.6 m/z, observed: 381.5 m/z), C) [Fe4 S4 (NO)2]~ (calculated: 411.6m/z, observed: 411.5 m/z), D) [Fe4 S3(NO) 4]- (calculated: 439.6 m/z, observed: 439.5 m/z), E)[Fe4 S3(NO) 5 f] (calculated: 469.6 m/z, observed: 469.5 m/z).
243

Intens MS, 0.7min #2Z
441.5
0 8
0 6'
A412 3
0.4
0 24382.9I 471353 0 4
340 380 300 400 420 0 440 rut
Figure B.8. Negative-mode ESI-MS spectrum (MeCN) of (Ph4P) 2 [Fe 4 S4 (LS3)(Cl)] with oneequivalent of Ph3CSNO. A) [Fe4S4(NO)2] (calculated: 411.6 m/z, observed: 412.3 m/z), B)[Fe4 S4(NO) 3 ]- (calculated: 441.6 m/z, observed: 441.5 m/z), C) [Fe4 S4 (NO) 4 ]~ (calculated: 471.6m/z, observed: 471.5 m/z).
4413
Inten
2.0 i
1 0
i.
- iUI1380.2200 400 400 800 1000 1200 1400 100 800 2 mz
Figure B.9. Negative-mode ESI-MS spectrum (MeCN) of (Ph4 P) 2 [Fe4 S4 (LS3)Cl] with fourequivalents of Ph3CSNO. The only product formed is [Fe4S4(NO) 4] and all of(Ph4 P)2 [Fe4 S4(LS 3)Cl] is consumed.
244
WS 0 Srrin 9 15:

-MS. 0 2min #7
B44 7
2
4123
40
352.6 3826 I342.6 4606 4769 4(Q8 50. 510.9 S20..
ji. 70 436 6LJ ~ 4 ~'64 ~ ' ~ o it 0
30 3 400 420 40 460 40 60 25II
Figure B.10. Negative-mode ESI-MS spectrum (MeCN) of (Ph4P) 2[Fe4S4(LS 3)(SPh)] with oneequivalent of Ph3CSNO. A) [Fe4 S4(NO)2 ]~ (calculated: 411.6 m/z, observed: 412.3 m/z), B)[Fe4 S4(NO)3]~ (calculated: 441.6 m/z, observed: 441.7 m/z), C) [Fe 4 S 4 (NO)4]~ (calculated: 471.6m/z, observed: 471.8 m/z).
Intens *M.. I * ..(105
3O B 41'3362.1
A352 1
2 0D441.4
4762
367 3 42 44 504. 5107 57
O ' ...... --. .... -........ ..,- --. ---... ---- ----.--- -.. --....-.-.-...^
Figure B.11. Negative-mode ESI-MS spectrum (MeCN) of (Ph4P)2[Fe4S 4(LS3)(SPyr)] with oneequivalent of Ph3CSNO. A) [Fe 4 S4 ]~ (calculated: 351.6 m/z, observed: 352.1 m/z), B)[Fe4S4(NO)]~ (calculated: 381.6 m/z, observed: 381.1 m/z), C) [Fe4 S4(NO) 2 ]~ (calculated: 411.6m/z, observed: 412.3 m/z), D) [Fe4 S 4(NO) 3]- (calculated: 441.6 m/z, observed: 441.6 m/z).
245
Intens ix1051

Infens I -MS 1.3m~ #40:I or,
C411 5
BA 381.4
3514
30.4!D
448.4
470),
67 40 ll 12. 46P.7 49180. ....... 5~ J ......
MO 3W1 400 40 0 460 4W4 Wo 50 0
Figure B.12. Negative-mode ESI-MS spectrum (MeCN) of (Ph4P) 2[Fe 4S4(LS3)(tpz)] with oneequivalent of Ph3CSNO. A) [Fe4 S4]~ (calculated: 351.6 m/z, observed: 351.4 m/z), B)[Fe4S4(NO)]~ (calculated: 381.6 m/z, observed: 381.4 m/z), C) [Fe4 S4(NO) 2 ]~ (observed: 411.6m/z, observed: 411.5 m/z), D) [Fe4 S4(NO) 3 ]~ (calculated: 441.6 m/z, observed: 441.5 m/z), E)[Fe4 S4 (NO)4]~ (calculated: 471.6 m/z, observed: 470.9 m/z).
' K ' 6 6 6 ' 6 6 d C C- C Cl C i ' i '- C ' | I ' I
14-0
7.5 7.0 6.5 6,0 5.5 ,0 4.S 4.0 3.5 3.0 2.5 2.0 1.5 1,0 0.5 0.0f1 (ppm)
Figure B.13. 1H NMR spectrum of pentane extract of the reaction of (Ph4P)2[Fe4S4(LS 3)Cl] withone equivalent of Ph3CSNO. The spectrum shows multiple species that correspond to the LS 3ligand suggesting that ligand forms both intra- and intermolecular S-S bonds.
246

__ \ / **
\ .
/
0 equiv- 1 equiv
---- 2 equiv------ 4e quiv
1725I * I * I * I * I
1850 1800 1750 1700 1650 1600
Wavenumbers (cm-)
Figure B.14. FTIR spectroscopy (CH2Cl 2) of (Ph4P)2[Fe 4S4(LS3)Cl] with 1 - 4 equivalents ofPh3CSNO. The only product detected is [Fe4S4(NO) 4] . (*) denotes a band associated with theLS 3 ligand.
5 min- - -30 min..--- -60 min\--- 120 min -.. . .... ................ .......
1725 *
1800 1780 1760 1740 1720 1700 1680 1660
Wavenumbers (cm")
Figure B.15. TD-FTIR spectroscopy (CH2Cl 2) of (Ph4P)2[Fe 4S 4(LS3)(SEt)] with one equivalentof Ph3CSNO. The only product detected is [Fe4S4(NO) 4]-. (*) denotes a band associated with theLS 3 ligand.
247

-' 5 min
*- - -
*' - 30min
1800 1750
1725
1700
- - 60 min- - - 120min
16001650
Wavenumbers (cm-)
Figure B.16. TD-FTIR spectroscopy (CH 2Cl2) of (Ph4P) 2[Fe4S4(LS3)(SPh)] with one equivalent
of Ph3CSNO. The only product detected is [Fe4S 4(NO)4 ] . (*) denotes a band associated with the
LS3 ligand.
5min- - -30 min---- 60 min---- 120 mi
*
\ /
1725
1800 1780 1760 1740 1720 1700 1680 1660
Wavenumbers (cm-)Figure B.17. TD-FTIR spectroscopy (CH 2Cl 2) of (Ph4P)2[Fe 4S4(LS3)(N 3)]Ph3CSNO. The only product detected is [Fe 4S4 (NO)4 ] . (*) denotes a bandLS3 ligand.
with one equivalent ofassociated with the
248
1850

-5 min- - -30 min- 60 min
---- 12Omin
1800
' *
1 71
-1725
Wavenumbers (cm-)
Figure B.18. TD-FTIR spectroscopy (CH 2Cl2) of (Ph4P) 2[Fe4S4(LS 3)(SPyr)] with one equivalentof Ph3CSNO. The only product detected is [Fe 4S 4(NO)4]~. (*) denotes a band associated with theLS3 ligand.
IN
N.
'I5 min-- 30 min
---- 60min-- 120 min
1800 1780 1760 1740 1720 1700 1680
/I -I.I.I. -
I. /I..
k. I'I
'I
'*1/
I
1660
Wavenumbers (cm')
Figure B.19. FTIR spectroscopy (CH 2Cl 2) of (Ph4P) 2[Fe4S4(LS 3)(tpz)] with one equivalent ofPh3CSNO. The only product detected is [Fe4S4(NO)4]-. (*) denotes a band associated with theLS 3 ligand.
249
/
1850 1750 1700 1650 1600

N.h
-0 min- - -5 min- - -60 min
120 min
I * I ~ ~ ' I
1800 1780 1760 1740 1720
/
/
/
/ .,
/ *1/ '1
'I
'I'I
7/
1700
Wavenumbers (cm 1 )Figure B.20. FTIR spectroscopy (CH 2Cl 2) of (Ph4P) 2[Fe 4S4(LS3)(S 2CNEt2)]of Ph3CSNO. The only product detected is [Fe 4S4(NO) 4 ]. (*) denotes a banLS3 ligand.
lntl Is
with one equivalentI associated with the
381.5
Ii 746,3 181.3
200 400 W1 000 1200 10 00 -006 I)V
Figure B.21. Negative-mode ESI-MS spectrum (MeCN) of [Cp 2Fe][Fe 4S4(NO) 4].
250
1680 1660

Biographical Note
The author was born on September 23, 1983 in El Paso, Texas to William Carney and
Astrid Victor. Shortly thereafter he moved to Germany where he grew up in Worms and
Karlsruhe. Eric graduated from Heidelberg American High School in 2002 and joined the US
Army has a 54B - Chemical Operations Specialist. Eric deployed in support of Operation Iraqi
Freedom in 2003 and 2005, being present for both the invasion and the first post-war government
elections. Eric was honorably discharged from the Army in 2006 with the rank of Sergeant. He
pursued undergraduate studies at the University of Wisconsin - Madison. At Madison the author
worked in the lab of Professor John F. Berry on quadruply-bonded group six transition metals
and their use as axial ligands for first row transition metals, in the lab of Professor Philipp W.
Simon on genetic variations of the gene CHXE in Daucus carota (carrots), and on combining
performance art with lecture demonstrations for Professor Bassam Shakhashiri. The author
graduated from Madison with a B.Sc. with honors in Chemistry in 2009, and pursued graduate
studies at MIT in the laboratory of Professor Stephen J. Lippard, where he studied the reactivity
of nitric oxide and S-nitrosothiols towards bio-inspired iron, cobalt, zinc, and platinum
complexes. After completing his graduate studies, the author will attend the World Cup
tournament in Brazil and pursue a career in management or policy consulting.
251

Curriculum Vitae
EducationMassachusetts Institute of Technology, Cambridge, MA September 2014Ph.D. Inorganic ChemistryThesis Topic: Reactions of S-nitrosothiols with biomimetic iron complexes and other transitionmetalsThesis Advisor: Professor Stephen J. Lippard
University of Wisconsin - Madison, Madison, WI May 2009B.Sc. Chemistry w/ Honors
PublicationsVictor, E.; Lippard, S. J. A tetranitrosyl [4Fe-4S] cluster forms en route to Roussin's BlackAnion: Nitric Oxide reactivity of [Fe4 S4 (LS3)L' ]2. Inorg. Chem., doi:10.1021/ic500586g.
Nippe, M.; Victor, E.; Berry, J. F. Oxidation Chemistry of Axially Protected Mo2 and W2Quadruply Bonded Compounds Inorg. Chem., 2009, 48, 11889-11895.
Nippe, M.; Victor, E.; Berry, J. F. Do Metal-Metal Multiply-Bonded Ligands Have a transInfluence? Structural and Magnetic Comparisons of Heterometallic CrCr-- -Co and MoMo- -CoInteractions Eur. J Inorg. Chem., 2008, 36, 5569-5572.
PresentationsVictor, E.; Lippard, S. J. Nitric Oxide reactivity of the site-differentiated cluster[Fe4 S4 (LS3)L'] 2- 2 4 7 th Meeting of the American Chemical Society, Dallas, TX; INOR-43.
Victor, E. NO reactivity of different irons: Site-differentiated multi-iron complexes and reactivenitrogen oxide species. MIT Department of Chemistry Inorganic Seminar Series; Cambridge,MA; March 6, 2013.
Victor, E. NO chemistry of site-differentiated multi-iron complexes. MIT Chemistry StudentSeminar Series; Cambridge, MA; March 9, 2012.
Victor, E. Work towards biomimetic chemistry between site-differentiated iron-sulfur clustersand nitric oxide. MIT Chemistry Metals in Synthesis Seminar Series; Cambridge, MA; February11, 2011.
Victor, E.; Schreiner, R.; Shakhashiri, B. Z. NO: Presenting real-world scientific research andproblems in an artistic way. 2 4 0th Meeting of the American Chemical Society; Boston, MA;CHED-77.
Victor, E.; Simon, P. W. Sequencing and Subcloning of the CHXE gene in a Carrot (DaucusCarota) BAC. University of Wisconsin - Madison Undergraduate Symposium 2008; Madison,
252

WI; April 16, 2008.
AwardsMIT Department of Chemistry Awards for Outstanding Teaching by a Graduate Student (August2010)National Chemical and Starch Foundation Scholar (2008, 2009)Edwin M. and Kathryn M. Larsen Scholar (2008)Dean's List (December 2006)
253