HMM-based on-line signature verification: Feature extraction and signature modeling
33
HMM-Based On-Line Signature Verification: Feature Extraction and Signature Modeling Julian Fierrez ∗ , Javier Ortega-Garcia, Daniel Ramos, Joaquin Gonzalez-Rodriguez Biometric Recognition Group – ATVS, Escuela Politecnica Superior, Universidad Autonoma de Madrid, C/ Francisco Tomas y Valiente 11, 28049 Madrid, Spain Abstract A function-based approach to on-line signature verification is presented. The system uses a set of time sequences and Hidden Markov Models (HMMs). Development and evaluation experiments are reported on a subcorpus of the MCYT bimodal biometric database comprising more than 7,000 signatures from 145 subjects. The system is compared to other state-of-the-art systems based on the results of the First International Signature Verification Competition (SVC 2004). A number of practical findings related to feature extraction and modeling are obtained. Key words: Biometrics, on-line signature, feature extraction, Hidden Markov Model, recognition, verification ∗ Tel.: +34914973363; fax: +34914972235. Email addresses: [email protected] (Julian Fierrez), [email protected] (Javier Ortega-Garcia), [email protected] (Daniel Ramos), [email protected] (Joaquin Gonzalez-Rodriguez). Preprint submitted to Elsevier 28 June 2007 * Manuscript [Word or (La)TeX]
-
Upload
independent -
Category
Documents
-
view
1 -
download
0
Transcript of HMM-based on-line signature verification: Feature extraction and signature modeling

HMM-Based On-Line Signature Verification:
Feature Extraction and Signature Modeling
Julian Fierrez ∗, Javier Ortega-Garcia, Daniel Ramos,
Joaquin Gonzalez-Rodriguez
Biometric Recognition Group – ATVS, Escuela Politecnica Superior, Universidad
Autonoma de Madrid, C/ Francisco Tomas y Valiente 11, 28049 Madrid, Spain
Abstract
A function-based approach to on-line signature verification is presented. The system
uses a set of time sequences and Hidden Markov Models (HMMs). Development
and evaluation experiments are reported on a subcorpus of the MCYT bimodal
biometric database comprising more than 7,000 signatures from 145 subjects. The
system is compared to other state-of-the-art systems based on the results of the
First International Signature Verification Competition (SVC 2004). A number of
practical findings related to feature extraction and modeling are obtained.
Key words: Biometrics, on-line signature, feature extraction, Hidden Markov
Model, recognition, verification
∗ Tel.: +34914973363; fax: +34914972235.
Email addresses: [email protected] (Julian Fierrez),
[email protected] (Javier Ortega-Garcia), [email protected] (Daniel
Ramos), [email protected] (Joaquin Gonzalez-Rodriguez).
Preprint submitted to Elsevier 28 June 2007
* Manuscript [Word or (La)TeX]
Manuel
Text Box
Published as: J. Fierrez, J. Ortega-Garcia, D. Ramos and J. Gonzalez-Rodriguez, "HMM-based on-line signature verification: feature extraction and signature modeling", Pattern Recognition Letters, Vol. 28, n. 16, pp. 2325-2334, December 2007.

1 Introduction
Automatic signature verification has been an intense research area because of
the social and legal acceptance and widespread use of the written signature as
a personal authentication method (Plamondon and Lorette, 1989; Leclerc and
Plamondon, 1994; Plamondon and Srihari, 2000), and still is a challenging
problem. This is mainly due to the large intra-class variations and, when
considering forgeries, small inter-class variations.
This paper deals with on-line signature verification. On-line refers here to
the use of the time functions of the dynamic signing process (e.g., position
trajectories, or pressure versus time), which are obtained using acquisition
devices like touch screens or digitizing tablets.
Many different approaches have been considered in the literature in order to
extract discriminative information from on-line signature data (Plamondon
and Lorette, 1989). The existing methods can broadly be divided into two
classes: i) feature-based approaches, in which a holistic vector representation
consisting of a set of global features is derived from the signature trajec-
tories (Lee et al., 1996; Ketabdar et al., 2005), and ii) function-based ap-
proaches, in which time sequences describing local properties of the signature
are used for recognition (Nalwa, 1997; Fairhurst, 1997; Jain et al., 2002; Li
et al., 2006), e.g., position trajectory, velocity, acceleration, force, or pressure
(Lei and Govindaraju, 2005). Although recent works show that feature-based
approaches are competitive with respect to function-based methods in some
conditions (Fierrez-Aguilar et al., 2005b), the latter methods have tradition-
ally yielded better results.
2
FeatureExtraction
EnrolledModels
Identity claim
SimilarityScore
NormalizationDecision
Threshold
Accepted orRejected
Fig. 1. Architecture of the proposed on-line signature verification system.
Function-based approaches can be classified into local and regional methods.
In local approaches, the time functions of different signatures are directly
matched by using elastic distance measures such as Dynamic Time Warping
(Munich and Perona, 2003; Kholmatov and Yanikoglu, 2005; Faundez-Zanuy,
2007). In regional methods, the time functions are converted to a sequence
of vectors describing regional properties. One of the most popular regional
approaches is the method based on Hidden Markov Models (Yang et al., 1995;
Kashi et al., 1997; Dolfing et al., 1998). In most of these cases, the HMMs
modeled stroke-based sequences. In this paper, we study the application of
HMMs to time sequences directly based on the dynamic functions, extending
the work reported in (Ortega-Garcia et al., 2003a).
The system architecture of the proposed on-line signature verification system
is depicted in Fig. 1.
The system described in this paper was submitted by the Biometric Recogni-
tion Group – ATVS to the First International Signature Verification Competi-
tion 2004 with very good results (Yeung et al., 2004), which will be summarized
in Section 4.6.
The paper is organized as follows. In Section 2, the feature extraction process is
presented. The statistical modeling based on HMMs is described in Section 3.
The experimental setup and the database used are presented in Section 4,
which are followed by the experimental results regarding feature extraction,
3

HMM configuration, training strategy, and a comparison with other state-of-
the-art systems based on SVC 2004 results. Some conclusions are finally drawn
in Section 5.
2 Feature extraction
2.1 Basic functions
The signature representation considered in this work is based on the following
five time sequences: horizontal xn and vertical yn position trajectories, azimuth
γn and altitude φn of the pen with respect to the tablet, and pressure signal
pn. The value n = 1, . . . , N is the discrete time index given by the acquisition
device and N is the time duration of the signature in sampling units. Although
pen inclination trajectories have shown some discriminative capabilities in
other works (Hangai et al., 2000; Sakamoto et al., 2001; Pacut and Czajka,
2001), the use of these two functions in our system degrades the verification
performance (as it is shown in Section 4.4.1). As a result, the basic function
set consists of xn, yn and pn.
2.2 Geometric normalization
A signature acquisition process on a restricted size frame is assumed (Fierrez-
Aguilar et al., 2004). As a result, users are supposed to be consistent in size and
writing dynamics. Moreover, a geometric normalization consisting of position
normalization followed by rotation alignment is applied.
4
Position normalization consists in aligning the center of mass
[x, y]T = (1/N)∑N
n=1[xn, yn]
T (1)
of the different signatures, where [·]T denotes transpose. Rotation normaliza-
tion consists in aligning the average path tangent angle
α = (1/N)∑N
n=1arctan (yn/xn) (2)
of the different signatures, where the upper dot notation denotes first order
time derivative.
2.3 Extended functions
After geometric normalization, 4 extended sequences are derived from the
basic function set. Previous results with other dynamic sequences have shown
good levels of performance (Ortega-Garcia et al., 2003a). In the present work,
four dynamic sequences have been used as extended functions, namely (Nelson
and Kishon, 1991):
• Path-tangent angle: θn = arctan (yn/xn)
• Path velocity magnitude: vn =√
x2n + y2
n
• Log curvature radius: ρn = log (1/κn) = log(
vn/θn
)
, where κn is the curva-
ture of the position trajectory and log (·) is applied in order to reduce the
range of function values.
• Total acceleration magnitude: an =√
t2n + c2n, where tn = vn and cn = vn · θn
are respectively the tangential and centripetal acceleration components of
5

the pen motion.
In all cases, (discrete) time derivatives have been computed by using the
second-order regression described in Section 2.4. The complete instantaneous
function-based feature set, including three basic and four extended time se-
quences is as follows:
un = [xn, yn, pn, θn, vn, ρn, an]T , n = 1, . . . , N, (3)
where N is the time duration of the considered signature in sampling units.
2.4 Time derivatives
First order time derivatives of complete instantaneous function-based feature
sets are highly effective as discriminative parameters regarding verification
with other behavioral traits (Soong and Rosenberg, 1988), so we have decided
to incorporate time derivatives in our system. Because of the discrete nature
of the above-mentioned functions, first order time derivatives are calculated
by using a second order regression (Young et al., 2002), expressed through
operator ∆:
fn ≈ ∆fn =
∑2τ=1 τ(fn+τ − fn−τ )
2 ·∑2
τ=1 τ 2. (4)
In this way, each parameterized signature is formally described as a matrix
V = [v1, . . . ,vN ], where vn =[
uTn , (∆un)T
]T, n = 1, . . . , N .
6
2.5 Signal normalization
A final signal normalization, oriented to obtain zero mean and unit standard
deviation function values, is applied:
on = Σ−1/2(vn − µ), n = 1, . . . , N, (5)
where µ and Σ are respectively the sample mean and sample diagonal covari-
ance matrix of vectors vn, n = 1, . . . , N .
As a result, each signature is represented by a matrix O = [o1, . . . , oN ] com-
prising 14 normalized discrete time sequences.
3 Signature modeling
3.1 Background on Hidden Markov Models
Hidden Markov Models were introduced in the pattern recognition field as a
robust method to model the variability of discrete time random signals where
time or context information is available (Rabiner, 1989). Some previous works
using HMMs for signature verification include (Yang et al., 1995; Kashi et al.,
1997; Dolfing et al., 1998). Basically, the HMM represents a doubly stochastic
process governed by an underlying Markov chain with finite number of states
and a set of random functions each of which is associated with the output
observation of one state (Yang et al., 1995). At discrete instants of time n, the
process is in one of the states and generates an observation symbol according
7

to the random function corresponding to that current state. The model is
hidden in the sense that the underlying state which generates each symbol
cannot be deduced from simple symbol observation.
Formally, a HMM is described as follows:
• H , which is the number of hidden states {S1, S2, . . . , SH}. The state at
discrete time n will be denoted as qn.
• The state transition matrix A = {aij} where
aij = P (qn+1 = Sj |qn = Si), 1 ≤ i, j ≤ H. (6)
• The observation symbol probability density function in state j, bj(o), 1 ≤
j ≤ H .
• The initial state distribution π = {πi} where
πi = P (q1 = Si), 1 ≤ i ≤ H. (7)
3.2 HMM configuration
In our system, the observation symbol probabilities bj(o) have been modeled
as mixtures of M multi-variate Gaussian densities:
bj(o) =M∑
m=1
cjmp(o|µjm,Σjm), 1 ≤ j ≤ H, (8)
where p(o|µjm,Σjm) is a multi-variate Gaussian distribution with mean µjm
and diagonal covariance matrix Σjm, and the coefficients are restricted to
∑Mm=1 cjm = 1, for 1 ≤ j ≤ H . Thus, the observation symbol density functions
8
can be parameterized as B ={
cjm, µjm,Σjm
}
, 1 ≤ j ≤ H, 1 ≤ m ≤ M .
The set λ = {π,A, B} models the K training signatures of a given sub-
ject. The similarity score of an input signature O = [o1, . . . , oN ] claiming the
identity λ is calculated as (1/N) log P (O |λ) by using the Viterbi algorithm
(Rabiner, 1989).
The client model λ is estimated with K training signatures{
O(1), . . . ,O(K)}
,
where O(k) = [o(k)1 , . . . , o
(k)Nk
], k = 1, . . . , K, by means of the following iterative
strategy:
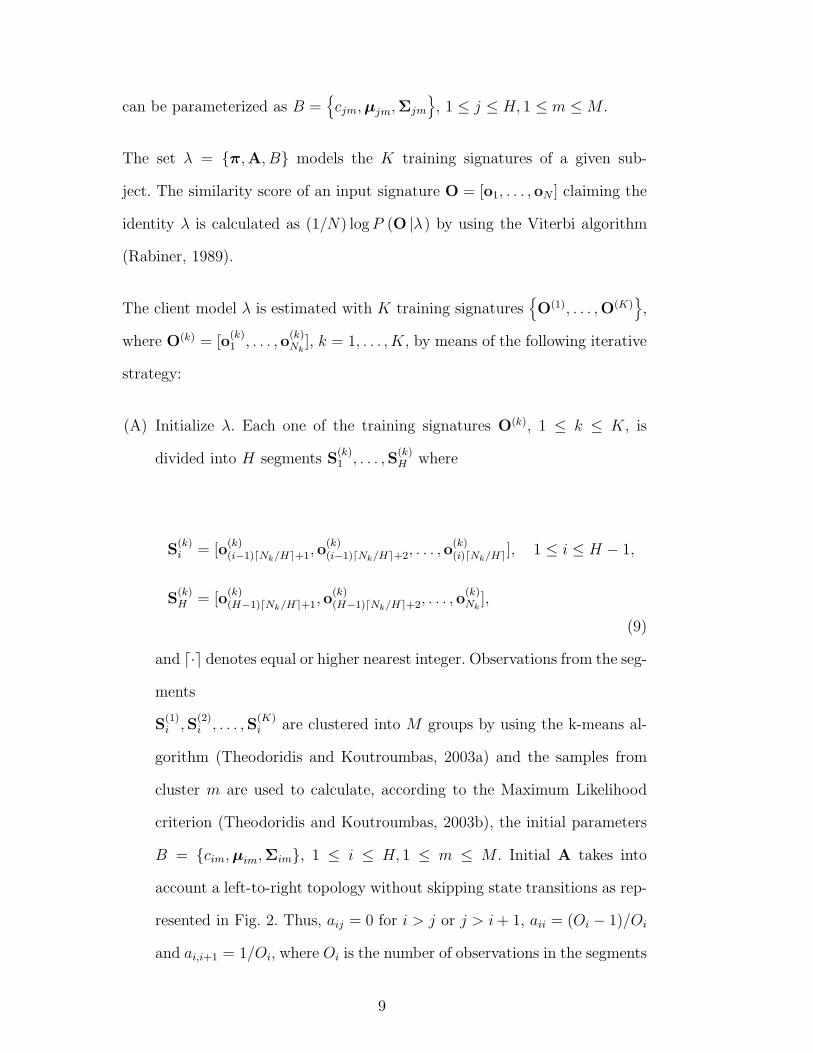
(A) Initialize λ. Each one of the training signatures O(k), 1 ≤ k ≤ K, is
divided into H segments S(k)1 , . . . ,S
(k)H where
S(k)i = [o
(k)(i−1)⌈Nk/H⌉+1, o
(k)(i−1)⌈Nk/H⌉+2, . . . , o
(k)(i)⌈Nk/H⌉], 1 ≤ i ≤ H − 1,
S(k)H = [o
(k)(H−1)⌈Nk/H⌉+1, o
(k)(H−1)⌈Nk/H⌉+2, . . . , o
(k)Nk
],
(9)
and ⌈·⌉ denotes equal or higher nearest integer. Observations from the seg-
ments
S(1)i ,S
(2)i , . . . ,S
(K)i are clustered into M groups by using the k-means al-
gorithm (Theodoridis and Koutroumbas, 2003a) and the samples from
cluster m are used to calculate, according to the Maximum Likelihood
criterion (Theodoridis and Koutroumbas, 2003b), the initial parameters
B = {cim, µim,Σim}, 1 ≤ i ≤ H, 1 ≤ m ≤ M . Initial A takes into
account a left-to-right topology without skipping state transitions as rep-
resented in Fig. 2. Thus, aij = 0 for i > j or j > i + 1, aii = (Oi − 1)/Oi
and ai,i+1 = 1/Oi, where Oi is the number of observations in the segments
9

Prob. Prob.
S1 S2
observation observation
Fig. 2. Topology of the Hidden Markov Model: left-to-right without skipping state
transitions.
S(1)i ,S
(2)i , . . . ,S
(K)i . The initial state distribution π = {π1, π2, . . . , πH} is
set up as {1, 0, . . . , 0}.
(B) Re-estimate a new model λ from λ by using the Baum-Welch re-estimation
equations (Rabiner, 1989), which guarantee that:
K∏
k=1
P (O(k)|λ) ≥K∏
k=1
P (O(k)|λ). (10)
(C) Replace λ by λ and go to step (B) until:
K∏
k=1
P (O(k)|λ) −K∏
k=1
P (O(k)|λ) ≤ Θ. (11)
where the threshold Θ is chosen heuristically and the maximum number
of iterations is limited to ten.
In the experiments that follows, the training algorithm typically converges
after five iterations.
4 Experiments
In the present section, we describe the signature database used and the vari-
ability factors considered in its design. This is followed by a discussion of
10
various aspects of performance assessment in biometric verification systems.
Finally, we present the experimental results.
4.1 MCYT database
For the experiments reported in this paper we used data from the MCYT
bimodal biometric database. In this section we provide a brief description of
this corpus. For more details we refer the reader to (Ortega-Garcia et al.,
2003b).
The MCYT bimodal biometric database consists of fingerprint and on-line
signature modalities. In order to acquire the dynamic signature sequences, a
WACOM pen tablet was employed, model INTUOS A6 USB. The pen tablet
resolution is 2,540 lines per inch (100 lines/mm), and the precision is ±0.25
mm. The maximum detection height is 10 mm (so pen-up movements are also
considered), and the capture area is 127 mm (width) × 97 mm (height). This
tablet provides the following discrete-time dynamic sequences: i) position xn
in x-axis, ii) position yn in y-axis, iii) pressure pn applied by the pen, iv)
azimuth angle γn of the pen with respect to the tablet, and v) altitude angle
φn of the pen with respect to the tablet. The sampling frequency is set to
100 Hz. Taking into account the Nyquist sampling criterion and the fact that
the maximum frequencies of the related biomechanical sequences are always
under 20-30 Hz (Baron and Plamondon, 1989), this sampling frequency leads
to a precise discrete-time signature representation. The capture area is further
divided into 37.5 mm (width) × 17.5 mm (height) blocks which are used as
frames for acquisition (Fierrez-Aguilar et al., 2004).
11

X
Y
P
Az
0 200 400
Al
0 200 400 600 0 200 400 600
X
Y
P
Az
0 100 200 300
Al
0 200 400 0 200 400
X
Y
P
Az
0 100 200 300
Al
0 100 200 0 200 400
Fig. 3. Signatures from MCYT database corresponding to three different subjects.
For each subject, the two left signatures are genuine and the one on the right is a
skilled forgery. Plots below each signature correspond to the available information,
namely: position trajectories (horizontal x, and vertical y), pressure (p), and pen
inclination (azimuth and altitude angles).
12
Signature corpus comprises genuine and shape-based skilled forgeries with nat-
ural dynamics. The forgeries were generated by contributors to the database
imitating other contributors. For this task they were given the printed sig-
nature to imitate and were asked not only to imitate the shape but also to
generate the imitation without artifacts such as time breaks or slowdowns.
Fig. 3 shows some example signatures.
The acquisition procedure was as follows. User n wrote a set of 5 genuine signa-
tures, and then 5 skilled forgeries of client n−1. This procedure was repeated
4 more times imitating previous users n− 2, n − 3, n − 4 and n − 5. Summa-
rizing, signature data for each client user n include 25 samples of his/her own
signature and 25 skilled forgeries produced by users n + 1, n + 2, n + 3, n + 4,
and n + 5. Taking into account that the signer was concentrated in a differ-
ent writing task between genuine signature sets, the variability between client
signatures from different acquisition sets (also called sessions throughout the
paper) is higher than the variability of signatures within the same acquisition
set.
4.2 Score normalization
Typical representations of the verification performance of a given biometric
system are the ROC and DET plots (Martin et al., 1997). Those represen-
tations consider all possible users of the system with the same scoring scale.
This common scale representation is equivalent to the use of a global decision
threshold for all clients of the system. User-specific decision thresholds pro-
duce results that in average usually outperform the global user-independent
decision approach (Jain et al., 2002; Ortega-Garcia et al., 2003a). Some score
13

normalization schemes have been proposed in order to exploit this fact (Auck-
enthaler et al., 2000), as the following target-dependent score normalization
technique based on EERs (TDSN-EER), which consists in normalizing the
score s(O, λT ) obtained from a test signature O claiming the model λT by
means of (Fierrez-Aguilar et al., 2005c):
sn(O, λT ) = s(O, λT ) − sEER(G, I), (12)
where sEER is the decision threshold at the empirical EER point for a given
set of genuine G and impostor I scores corresponding to the subject at hand.
In this work, the above described TDSN-EER has been applied a posteriori
(i.e., G and I score sets are the same used for system performance evaluation).
This is done to minimize the effects of the score misalignments across users
when studying the different modules of the system.
In an operating system, the statistics necessary to estimate the parameters
of the normalization functions have to be estimated from the available train-
ing data, using a priori score normalization schemes (Fierrez-Aguilar et al.,
2005c). Interestingly, the application of these a priori schemes in SVC 2004
proved to be quite useful in spite of the training data scarcity (only 5 training
signatures) and the challenging scenario: invented signatures written with-
out visual feedback, time span between sessions of at least one week and
only between-sessions comparisons, etc. (Yeung et al., 2004). In particular,
the application of a target-centric score normalization approach provided a
18% performance improvement to our HMM system for skilled forgeries while
maintaining the performance for random forgeries. This can be observed in
the competition results, summarized in Section 4.6. The systems 19a and 19b
14

submitted by the authors were identical except for an a priori score normal-
ization step (a = without score normalization, b = with score normalization).
The score normalization step in this case was the a priori score normalization
technique rotTC-3 described in (Fierrez-Aguilar et al., 2005c).
4.3 Experimental protocol
For the experiments presented here, we have used two disjoint subsets of the
MCYT database, the first one for development (50 subjects) and the second
one for evaluation (145 subjects). All the signatures of each subject are used
in both cases (25 genuine signatures and 25 skilled forgeries).
The client signatures not used for training are used for testing. The skilled
forgeries are used only for testing. In case of testing against random forgeries
and for a particular subject, all client signatures from the remaining subjects
are used during development (i.e., 50 × 49 × 25 impostor trials), but only 2
signatures from each of the remaining subjects are used during evaluation (i.e.,
145 × 144 × 2 impostor trials).
Experiments have been carried out according to the following procedure. We
first study the effects of function set selection, modeling and training strategy
on the verification performance using the development set. Results are given
as DET plots applying the a posteriori target-dependent score normalization
technique described in Section 4.2. From these development experiments, and
considering the EER as the cost function to minimize, an enhanced system
configuration is obtained. Finally, verification performance of the enhanced
system is provided on the evaluation set. Separate results are reported for
15

0.2 0.5 1 2 5 10 20 40
0.2
0.5
1
2
5
10
20
40
False Acceptance Rate (%)
Fal
se R
ejec
tion
Rat
e (%
)
x,yx,y,px,y,p,γx,y,p,φ
(a)
0.2 0.5 1 2 5 10 20 40
0.2
0.5
1
2
5
10
20
40
False Acceptance Rate (%)
Fal
se R
ejec
tion
Rat
e (%
)
x,y,p,θx,y,p,θ,vx,y,p,θ,v,ρx,y,p,θ,v,ρ,a = w
(b)
Fig. 4. Feature extraction experiments. Verification performance results for skilled
forgeries are given for various function sets including: position trajectories x and y,
pressure p, azimuth γ, altitude φ, path tangent angle θ, path velocity magnitude v,
log curvature radius ρ, and total acceleration magnitude a.
random and skilled forgeries.
4.4 Development experiments
4.4.1 Feature extraction
The initial configuration for the experiments is as follows (Ortega-Garcia et al.,
2003a): 4 HMM states, 8 mixtures per state and 5 training signatures from
different sessions. Results for different functions are shown in Fig. 4.
In Fig. 4(a) we compare some basic function sets. The EER decreases from
10.37% to 4.54% when pressure signal is included to the basic position trajec-
tory information but increases to 4.84% and 6.28% when altitude and azimuth
signals are respectively considered.
16
1 2 3 4 5 6 7 8 9 10 12 15 17 20
10−1
100
101
Number of training signatures per model
aver
age
EE
R (
%)
(a)
1 2 3 4 5 6 7 8 9 10 12 15 17 20
10−1
100
101
Number of training signatures per model
aver
age
EE
R (
%)
(b)
Fig. 5. Training strategy experiments. Verification performance results are given
for skilled forgeries with increasing number of training signatures: (a) training and
testing signatures from different sessions, (b) training and testing signatures from
the same sessions.
In Fig. 4(b) we show the progressive improvement in verification performance
when extended functions are included one by one to the basic set {x, y, p}
(4.54% EER). When path tangent angle θ, path velocity magnitude v, log
curvature radius ρ, and total acceleration mangnitude a are progressively in-
cluded, we obtain the following EERs: 2.57%, 1.99%, 1.44%, and 0.68%. The
set composed by these 7 functions {x, y, p, θ, v, ρ, a} will be referred to as w.
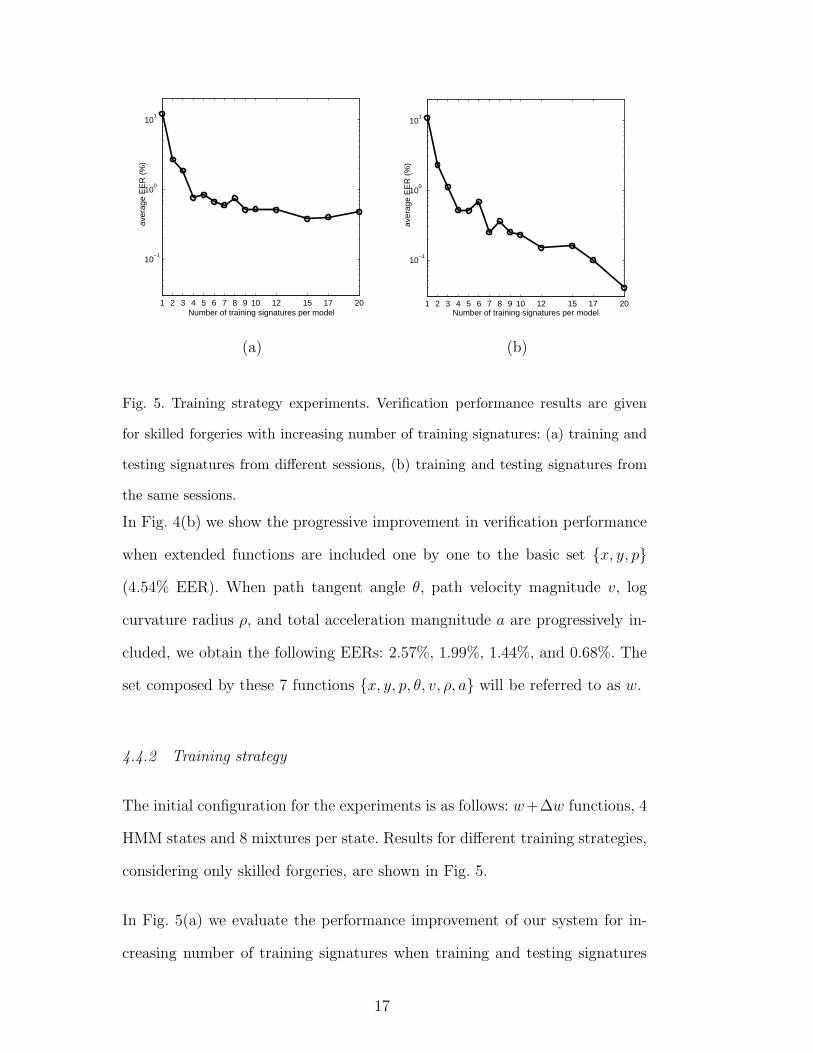
4.4.2 Training strategy
The initial configuration for the experiments is as follows: w+∆w functions, 4
HMM states and 8 mixtures per state. Results for different training strategies,
considering only skilled forgeries, are shown in Fig. 5.
In Fig. 5(a) we evaluate the performance improvement of our system for in-
creasing number of training signatures when training and testing signatures
17

come from different sessions. In order to do so, training signatures are selected
from the minimum number of sessions possible (i.e., 1 set for 1 to 5 training
signatures, 2 sessions for 6 to 10 signatures, and so on). As a result, the EER
does not improve significantly for more than 5 training samples.
In Fig. 5(b) we evaluate the performance improvement in our system when
the number of training signatures is increased and the training and testing
signatures come from the same sessions. For that purpose, we have selected
training signatures from the maximum possible number of sessions (i.e., 1
session for 1 training signature, 2 sessions for 2 training signatures, 3 sessions
for 3 training signatures, 4 sessions for 4 training signatures and 5 sessions for
5 to 20 training signatures). As a result, the EER improves significantly with
the first 5 training signatures (0.85% EER) and keeps improving for a higher
number of signatures (0.05% EER for 20 training samples).
Finally, we test the verification performance for a fixed number of training
signatures from an increasing number of sessions. In this case we provide a
DET plot (see Fig. 6) where, testing with two sessions, the fixed 5 training
samples have been selected from the other one (0.84% EER), two (0.82% EER)
and three (0.48% EER) sessions, respectively. As can be observed, verification
performance improves when training data come from different sessions.
4.4.3 Signature modeling
The initial configuration for the experiment is: w+∆w functions and 5 training
signatures from the first acquisition set. In Table 1 we show the results for
different HMM parameters including the degenerated case of the single state
HMM, which is equivalent to modeling based on Gaussian Mixture Models
18
0.2 0.5 1 2 5 10 20 40
0.2
0.5
1
2
5
10
20
40
False Acceptance Rate (%)
Fal
se R
ejec
tion
Rat
e (%
)
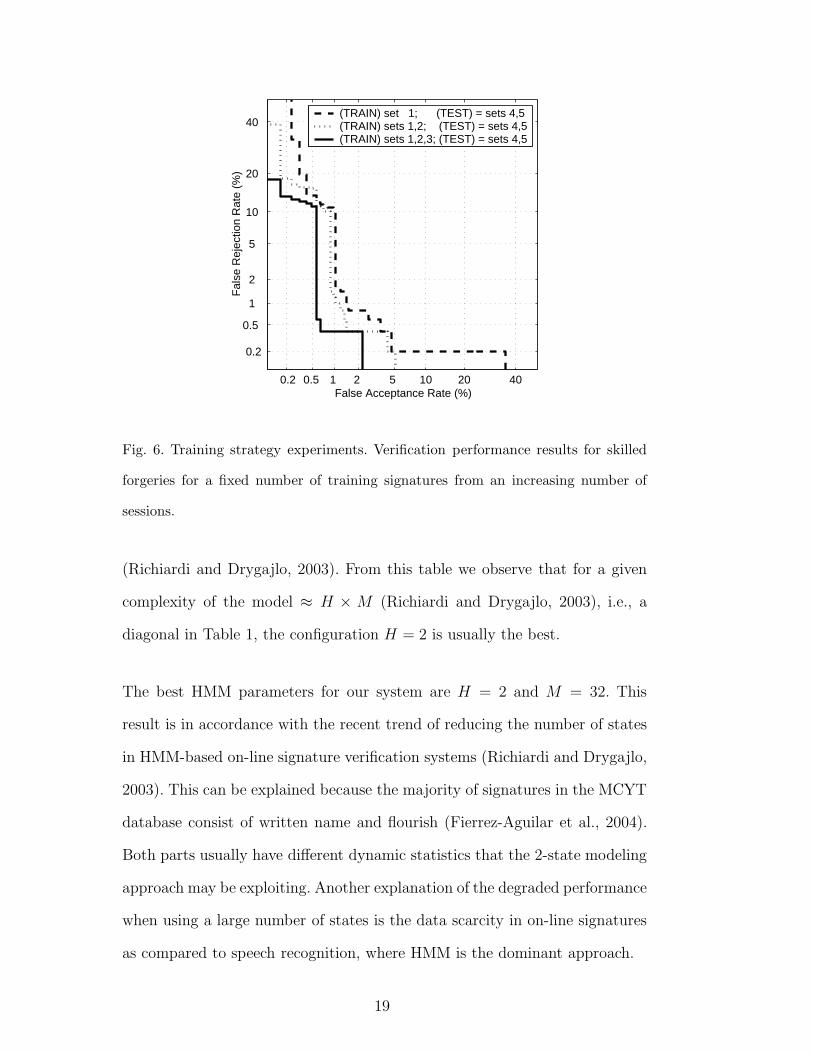
(TRAIN) set 1; (TEST) = sets 4,5(TRAIN) sets 1,2; (TEST) = sets 4,5(TRAIN) sets 1,2,3; (TEST) = sets 4,5
Fig. 6. Training strategy experiments. Verification performance results for skilled
forgeries for a fixed number of training signatures from an increasing number of
sessions.
(Richiardi and Drygajlo, 2003). From this table we observe that for a given
complexity of the model ≈ H × M (Richiardi and Drygajlo, 2003), i.e., a
diagonal in Table 1, the configuration H = 2 is usually the best.
The best HMM parameters for our system are H = 2 and M = 32. This
result is in accordance with the recent trend of reducing the number of states
in HMM-based on-line signature verification systems (Richiardi and Drygajlo,
2003). This can be explained because the majority of signatures in the MCYT
database consist of written name and flourish (Fierrez-Aguilar et al., 2004).
Both parts usually have different dynamic statistics that the 2-state modeling
approach may be exploiting. Another explanation of the degraded performance
when using a large number of states is the data scarcity in on-line signatures
as compared to speech recognition, where HMM is the dominant approach.
19

Table 1
EER (in %) for different HMM configurations (skilled forgeries). H = number of
states; M = number of Gaussian mixtures per state.
H M = 1 M = 2 M = 4 M = 8 M = 16 M = 32 M = 64 M = 128
1 1.74 1.05 0.70 0.71
2 1.51 0.74 0.30 0.44
4 1.64 0.87 0.52 0.48
8 1.81 0.79 0.76 0.35
16 1.20 0.96 0.74
32 1.28 0.97
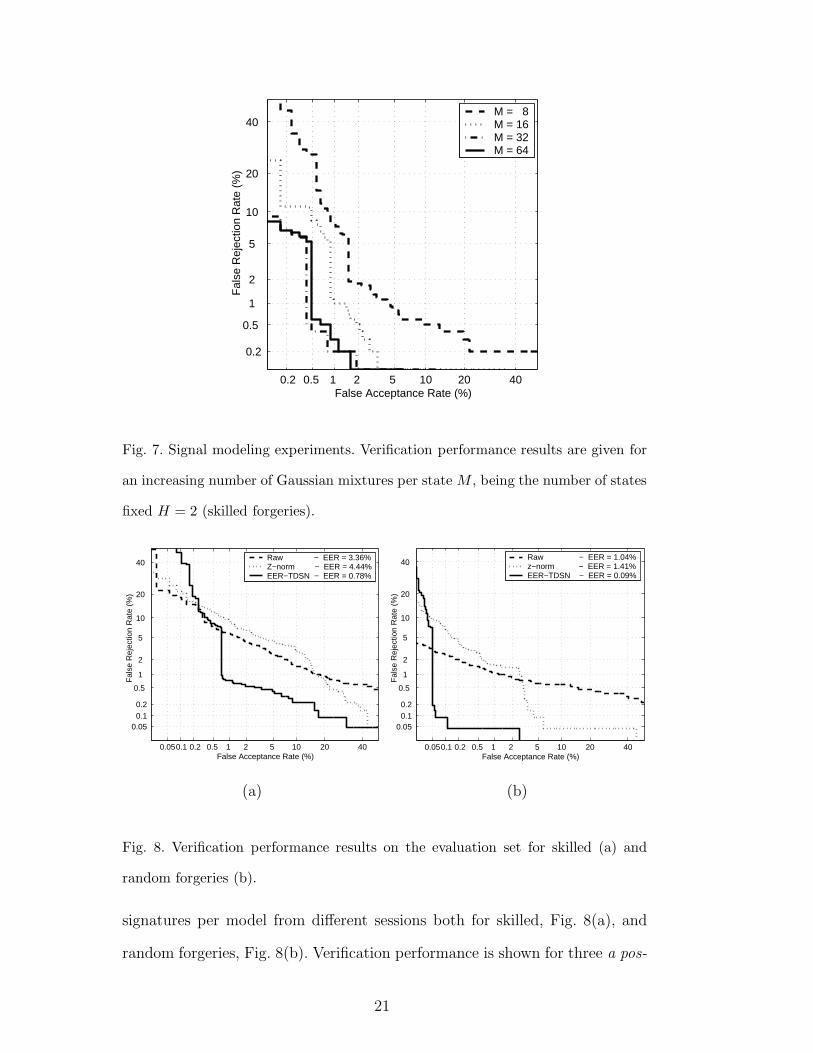
Finally, we represent in Fig. 7 DET plots for H = 2 with different values of
M , where the verification performance improvement for increasing values of
M can be seen, until the optimum M = 32 is reached.
4.5 Evaluation experiments
Summarizing the results of the experiments reported above, we conclude that
the best system configuration is the following: i) feature extraction based on
seven discrete-time functions (x trajectory, y trajectory, pressure, path tangent
angle, path velocity magnitude, log curvature radius and total acceleration
magnitude) and their first order time derivatives, and ii) HMM recognition
with 2 states and 32 Gaussian mixtures per state.
We finally show error rates on the evaluation set using as training data 10
20
0.2 0.5 1 2 5 10 20 40
0.2
0.5
1
2
5
10
20
40
False Acceptance Rate (%)
Fal
se R
ejec
tion
Rat
e (%
)
M = 8 M = 16 M = 32 M = 64
Fig. 7. Signal modeling experiments. Verification performance results are given for
an increasing number of Gaussian mixtures per state M , being the number of states
fixed H = 2 (skilled forgeries).
0.05 0.1 0.2 0.5 1 2 5 10 20 40
0.05 0.1 0.2
0.5
1
2
5
10
20
40
False Acceptance Rate (%)
Fal
se R
ejec
tion
Rat
e (%
)
Raw − EER = 3.36%Z−norm − EER = 4.44%EER−TDSN − EER = 0.78%
(a)
0.05 0.1 0.2 0.5 1 2 5 10 20 40
0.05 0.1 0.2
0.5
1
2
5
10
20
40
False Acceptance Rate (%)
Fal
se R
ejec
tion
Rat
e (%
)
Raw − EER = 1.04%z−norm − EER = 1.41%EER−TDSN − EER = 0.09%
(b)
Fig. 8. Verification performance results on the evaluation set for skilled (a) and
random forgeries (b).
signatures per model from different sessions both for skilled, Fig. 8(a), and
random forgeries, Fig. 8(b). Verification performance is shown for three a pos-
21
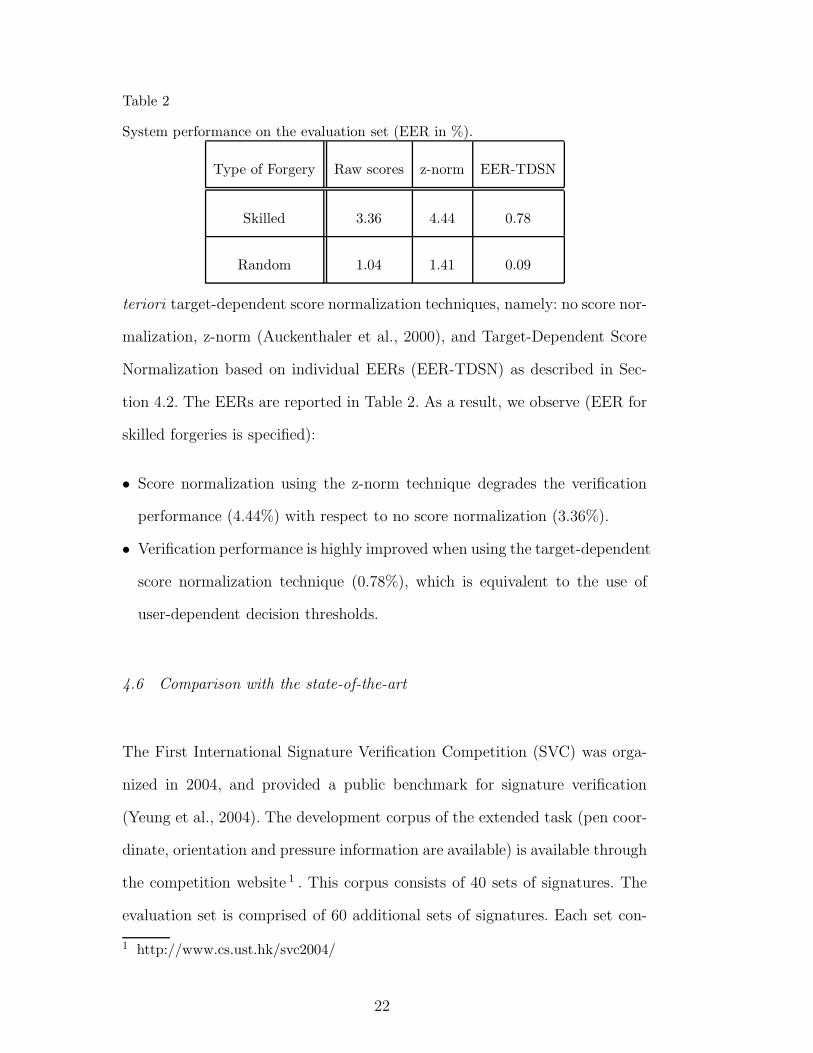
Table 2
System performance on the evaluation set (EER in %).
Type of Forgery Raw scores z-norm EER-TDSN
Skilled 3.36 4.44 0.78
Random 1.04 1.41 0.09
teriori target-dependent score normalization techniques, namely: no score nor-
malization, z-norm (Auckenthaler et al., 2000), and Target-Dependent Score
Normalization based on individual EERs (EER-TDSN) as described in Sec-
tion 4.2. The EERs are reported in Table 2. As a result, we observe (EER for
skilled forgeries is specified):
• Score normalization using the z-norm technique degrades the verification
performance (4.44%) with respect to no score normalization (3.36%).
• Verification performance is highly improved when using the target-dependent
score normalization technique (0.78%), which is equivalent to the use of
user-dependent decision thresholds.
4.6 Comparison with the state-of-the-art
The First International Signature Verification Competition (SVC) was orga-
nized in 2004, and provided a public benchmark for signature verification
(Yeung et al., 2004). The development corpus of the extended task (pen coor-
dinate, orientation and pressure information are available) is available through
the competition website 1 . This corpus consists of 40 sets of signatures. The
evaluation set is comprised of 60 additional sets of signatures. Each set con-
1 http://www.cs.ust.hk/svc2004/
22

u1s1
0 20 40 60 80
−1
0
1
X
0 20 40 60 80
−1
0
1
Y
0 20 40 60 80
−3
−2
−1
0
1
Pressure
0 20 40 60 80
−1
0
1
Azimuth
0 20 40 60 80
−1
0
1
Elevation
u1s10
0 20 40 60 80
−1
0
1
0 20 40 60 80
−1
0
1
0 20 40 60 80
−3
−2
−1
0
1
0 20 40 60 80
−1
0
1
0 20 40 60 80
−1
0
1
u1s21
0 50 100
−1
0
1
0 50 100
−1
0
1
0 50 100
−3
−2
−1
0
1
0 50 100
−1
0
1
0 50 100
−1
0
1
u1s30
0 50 100
−1
0
1
0 50 100
−1
0
1
0 50 100
−3
−2
−1
0
1
0 50 100
−1
0
1
0 50 100
−1
0
1
Fig. 9. Signature examples from SVC 2004 corpus. For a particular subject, two
genuine signatures (left columns) and two skilled forgeries (right columns) are given.
Plots of the coordinate trajectories, pressure signal and pen orientation functions
are also given.
tains 20 genuine signatures from one contributor (acquired in two separate ses-
sions) and 20 skilled forgeries from five other contributors. The SVC database
is especially challenging due to several factors, including: i) no visual feedback
when writing (acquisition was conducted by using a WACOM tablet with a
Grip Pen), ii) subjects used invented signatures different to the ones used in
daily life in order to protect their personal data, iii) skilled forgers imitated
not only the shape but also the dynamics, and iv) time span between train-
ing and testing signatures was at least one week. The signatures are in either
English or Chinese (see Fig. 9).
The authors participated to SVC 2004 with the system described in the present
paper (team ID 19). A summary of the evaluation results for the extended
23

task is given in Tables 3 and 4, which correspond to the development and the
evaluation sets, respectively (Yeung et al., 2004). Training data consisted of
5 signatures randomly selected from the first acquisition session, and testing
data consisted of the 10 genuine signatures of the second session, together
with 20 skilled or random forgeries. As indicated in Section 4.2, the different
systems submitted by the authors (a, b, and c) were identical except for an a
priori score normalization step: a = without score normalization, b and c =
different types of user-dependent score normalization (Fierrez-Aguilar et al.,
2005c).
In the evaluation set, the proposed HMM system was ranked second for
skilled forgeries and first for random forgeries. It was only outperformed by
the winner of the competition, which was based on a Dynamic Time Warp-
ing approach (Kholmatov and Yanikoglu, 2005). Interestingly, it has been
recently shown that the HMM approach outperforms an implementation of
the DTW approach used by the winner when enough training signatures are
available (Fierrez-Aguilar et al., 2005a). More comparative experiments with
other state-of-the-art systems can be found in (Garcia-Salicetti et al., 2006).
5 Conclusions
An on-line signature verification system based on dynamic time functions and
Hidden Markov Models has been presented.
In the experiments, we have explored various aspects of feature extraction and
modeling. With respect to HMM modeling we have shown that the best con-
figuration is 2 HMM states and 32 Gaussian mixtures per state. Experiments
24
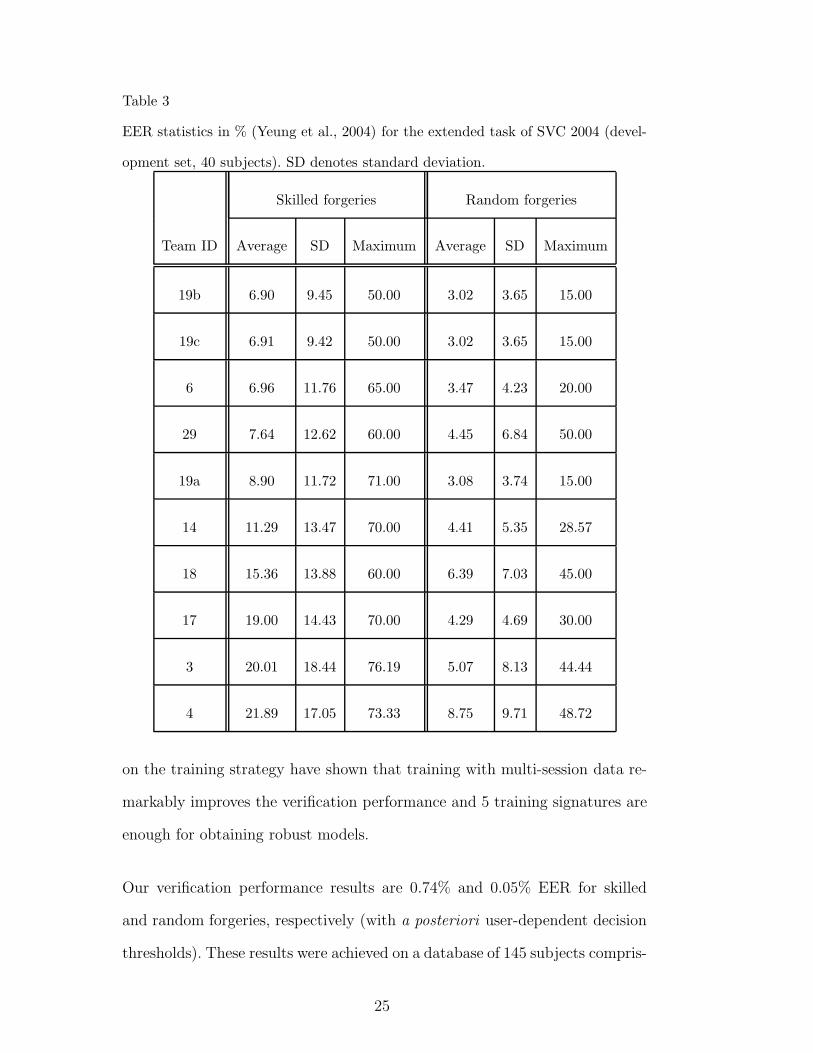
Table 3
EER statistics in % (Yeung et al., 2004) for the extended task of SVC 2004 (devel-
opment set, 40 subjects). SD denotes standard deviation.
Skilled forgeries Random forgeries
Team ID Average SD Maximum Average SD Maximum
19b 6.90 9.45 50.00 3.02 3.65 15.00
19c 6.91 9.42 50.00 3.02 3.65 15.00
6 6.96 11.76 65.00 3.47 4.23 20.00
29 7.64 12.62 60.00 4.45 6.84 50.00
19a 8.90 11.72 71.00 3.08 3.74 15.00
14 11.29 13.47 70.00 4.41 5.35 28.57
18 15.36 13.88 60.00 6.39 7.03 45.00
17 19.00 14.43 70.00 4.29 4.69 30.00
3 20.01 18.44 76.19 5.07 8.13 44.44
4 21.89 17.05 73.33 8.75 9.71 48.72
on the training strategy have shown that training with multi-session data re-
markably improves the verification performance and 5 training signatures are
enough for obtaining robust models.
Our verification performance results are 0.74% and 0.05% EER for skilled
and random forgeries, respectively (with a posteriori user-dependent decision
thresholds). These results were achieved on a database of 145 subjects compris-
25

Table 4
EER statistics in % (Yeung et al., 2004) for the extended task of SVC 2004 (evalu-
ation set, 60 subjects). SD denotes standard deviation.
Skilled forgeries Random forgeries
Team ID Average SD Maximum Average SD Maximum
6 2.89 5.69 30.00 2.55 5.66 50.00
19b 5.01 9.06 50.00 1.77 2.92 10.00
19c 5.13 8.98 51.00 1.79 2.93 10.00
19a 5.91 9.42 50.00 1.70 2.86 10.00
14 8.02 10.87 54.05 5.19 8.57 52.63
18 11.54 12.12 50.00 4.89 6.65 45.00
17 12.51 13.01 70.00 3.47 5.53 30.00
4 16.34 14.00 61.90 6.17 9.24 50.00
ing 3,625 client signatures, 3,625 skilled forgeries and 41,760 random impostor
attempts. The system described in this work was submitted by the Biometric
Recognition Group – ATVS to SVC 2004 (Yeung et al., 2004), from which
selected results in comparison with other systems have been also reported.
Acknowledgements
This work has been supported by the Spanish projects TIC2003-08382-C05-
01 and TEC2006-13141-C03-03, and by the European NoE Biosecure. The
26

postdoctoral research of J. F. is supported by a Marie Curie Outgoing Inter-
national Fellowship. Authors wish to thank Jorge Martin-Rello for his valuable
development work.
References
Auckenthaler, R., Carey, M., Lloyd-Tomas, H., 2000. Score normalization for
text-independent speaker verification systems. Digital Signal Processing 10,
42–54.
Baron, R., Plamondon, R., 1989. Acceleration measurement with an instru-
mented pen for signature verification and handwriting analysis. IEEE Trans.
on Instrum. Measurement 38 (6), 1132–1138.
Dolfing, J. G. A., Aarts, E. H. L., van Oosterhout, J. J. G. M., 1998. On-line
signature verification with Hidden Markov Models. In: Proc. of the Intl.
Conf. on Pattern Recognition, ICPR. IEEE CS Press, pp. 1309–1312.
Fairhurst, M. C., 1997. Signature verification revisited: Promoting practical
exploitation of biometric technology. IEE Electronics and Communication
Engineering Journal 9 (6), 273–280.
Faundez-Zanuy, M., 2007. On-line signature recognition based on VQ-DTW.
Pattern Recognition 40, 981–992.
Fierrez-Aguilar, J., Alonso-Hermira, N., Moreno-Marquez, G., Ortega-Garcia,
J., 2004. An off-line signature verification system based on fusion of local and
global information. In: Post-ECCV Workshop on Biometric Authentication,
BIOAW. Springer LNCS-3087, pp. 295–306.
Fierrez-Aguilar, J., Krawczyk, S., Ortega-Garcia, J., Jain, A. K., 2005a. Fusion
of local and regional approaches for on-line signature verification. In: Proc.
of Intl. Workshop on Biometric Recognition Systems, IWBRS. Springer
27

LNCS-3781, pp. 188–196.
Fierrez-Aguilar, J., Nanni, L., Lopez-Penalba, J., Ortega-Garcia, J., Maltoni,
D., 2005b. An on-line signature verification system based on fusion of local
and global information. In: Proc. of IAPR Intl. Conf. on Audio- and Video-
Based Biometric Person Authentication, AVBPA. Springer LNCS-3546, pp.
523–532.
Fierrez-Aguilar, J., Ortega-Garcia, J., Gonzalez-Rodriguez, J., 2005c. Target
dependent score normalization techniques and their application to signature
verification. IEEE Trans. on Systems, Man, and Cybernetics – Part C 35 (3),
418–425.
Garcia-Salicetti, S., Fierrez-Aguilar, J., Alonso-Fernandez, F., Vielhauer, C.,
Guest, R., Allano, L., Trung, T. D., Scheidat, T., Van, B. L., Dittmann, J.,
Dorizzi, B., Ortega-Garcia, J., Gonzalez-Rodriguez, J., Castiglione, M. B.,
Fairhurst, M., 2006. Biosecure reference systems for on-line signature verifi-
cation: A study of complementarity. Annals of Telecommunications, Special
Issue on Multimodal Biometrics 62 (1-2).
Hangai, S., Yamanaka, S., Hanamoto, T., 2000. On-line signature verification
based on altitude and direction of pen movement. In: Proc. of the IEEE
Intl. Conf. on Multimedia and Expo, ICME. Vol. 1. pp. 489–492.
Jain, A., Griess, F., Connell, S., 2002. On-line signature verification. Pattern
Recognition 35 (12), 2963–2972.
Kashi, R. S., Hu, J., Nelson, W. L., Turin, W., 1997. On-line handwritten
signature verification using Hidden Markov Model features. In: Proc. of the
4th Intl. Conf. on Document Analysis and Recognition, ICDAR. Vol. 1.
IEEE CS Press, pp. 253–257.
Ketabdar, H., Richiardi, J., Drygajlo, A., 2005. Global feature selection for
on-line signature verification. In: Proc. of 12th International Graphonomics
28
Society Conference.
Kholmatov, A., Yanikoglu, B., 2005. Identity authentication using improved
online signature verification method. Pattern Recognition Letters 26 (15),
2400–2408.
Leclerc, F., Plamondon, R., 1994. Automatic signature verification: The state
of the art, 1989–1993. Intl. Jour. of Pattern Rec. and Artificial Intell. 8 (3),
643–660.
Lee, L. L., Berger, T., Aviczer, E., 1996. Reliable on-line human signature
verification systems. IEEE Trans. on Pattern Anal. and Machine Intell.
18 (6), 643–647.
Lei, H., Govindaraju, V., 2005. A comparative study on the consistency of fea-
tures in on-line signature verification. Pattern Recognition Letters 26 (15),
2483–2489.
Li, B., Zhang, D., Wang, K., 2006. On-line signature verification based on
NCA (null component analysis) and PCA (principal component analysis).
Pattern Analysis and Applications 8, 345–356.
Martin, A., Doddington, G., Kamm, T., Ordowski, M., Przybocki, M., 1997.
The DET curve in assessment of decision task performance. In: Proc. of
ESCA Eur. Conf. on Speech Comm. and Tech., EuroSpeech. pp. 1895–1898.
Munich, M. E., Perona, P., 2003. Visual identification by signature tracking.
IEEE Trans. on Pattern Analysis and Machine Intelligence 25 (2), 200–217.
Nalwa, V. S., 1997. Automatic on-line signature verification. Proceedings of
the IEEE 85 (2), 215–239.
Nelson, W., Kishon, E., 1991. Use of dynamic features for signature verifica-
tion. In: Proc. of the IEEE Intl. Conf. on Systems, Man, and Cybernetics.
Vol. 1. pp. 201–205.
Ortega-Garcia, J., Fierrez-Aguilar, J., Martin-Rello, J., Gonzalez-Rodriguez,
29
J., 2003a. Complete signal modeling and score normalization for function-
based dynamic signature verification. In: Proc. of IAPR Intl. Conf. on
Audio- and Video-based Person Authentication, AVBPA. Springer LNCS-
2688, pp. 658–667.
Ortega-Garcia, J., Fierrez-Aguilar, J., Simon, D., et al., 2003b. MCYT baseline
corpus: A bimodal biometric database. IEE Proceedings Vision, Image and
Signal Processing 150 (6), 395–401.
Pacut, A., Czajka, A., 2001. Recognition of human signatures. In: Proc. of the
IEEE Joint Intl. Conf. on Neural Networks, IJCNN. Vol. 2. pp. 1560–1564.
Plamondon, R., Lorette, G., 1989. Automatic signature verification and writer
identification - the state of the art. Pattern Recognition 22 (2), 107–131.
Plamondon, R., Srihari, S. N., 2000. On-line and off-line handwriting recog-
nition: A comprehensive survey. IEEE Trans. Pattern Anal. and Machine
Intell. 22 (1), 63–84.
Rabiner, L. R., 1989. A tutorial on Hidden Markov Models and selected ap-
plications in speech recogniton. Proceedings of the IEEE 77 (2), 257–286.
Richiardi, J., Drygajlo, A., 2003. Gaussian Mixture Models for on-line signa-
ture verification. In: Proc. of ACM SIGMM Workshop on Biometric Meth-
ods and Applications, WBMA. pp. 115–122.
Sakamoto, D., Morita, H., Ohishi, T., Komiya, Y., Matsumoto, T., 2001. On-
line signature verification algorithm incorporating pen position, pen pres-
sure and pen inclination trajectories. In: Proc. of the IEEE Intl. Conf. on
Acoustics, Speech, and Signal Processing, ICASSP. Vol. 2. pp. 993–996.
Soong, F. K., Rosenberg, A. E., 1988. On the use of instantaneous and transi-
tional spectral information in speaker recognition. IEEE Trans. on Acoust.,
Speech and Signal Proc. 36 (6), 871–879.
Theodoridis, S., Koutroumbas, K., 2003a. Pattern Recognition. Academic
30

Press, pp. 531–533.
Theodoridis, S., Koutroumbas, K., 2003b. Pattern Recognition. Academic
Press, pp. 28–31.
Yang, L., Widjaja, B. K., Prasad, R., 1995. Application of Hidden Markov
Models for signature verification. Pattern Recognition 28 (2), 161–170.
Yeung, D.-Y., Chang, H., Xiong, Y., George, S., Kashi, R., Matsumoto,
T., Rigoll, G., 2004. SVC2004: First International Signature Verification
Competition. In: Proc. of Intl. Conf. on Biometric Authentication, ICBA.
Springer LNCS-3072, pp. 16–22.
Young, S., et al., 2002. The HTK Book Version 3.2.1. Cambridge University
Engineering Department, p. 65, (available at http://htk.eng.cam.ac.uk/).
31

JULIAN FIERREZ-AGUILAR received the M.Sc. and Ph.D. degrees in Elec-
trical Engineering in 2001 and 2006, respectively, both from Universidad Po-
litecnica de Madrid. Since 2004 he is with Universidad Autonoma de Madrid,
where he is an assistant researcher. Starting in April 2007 he will be a vis-
iting researcher at Michigan State University for two years under a Marie
Curie Outgoing International Fellowship. His research interests include signal
and image processing, pattern recognition and biometrics. He was the recip-
ient of the Best Poster Award at AVBPA 2003, the Rosina Ribalta Award
from the Epson Iberica Foundation to the Best PhD Proposal in 2005, the
Motorola Best Student Paper at ICB 2006, the EBF European Biometric In-
dustry Award 2006, and led the development of the UPM signature verification
system for SVC 2004.
JAVIER ORTEGA-GARCIA received the Ph.D. degree in electrical engineer-
ing in 1996 from Universidad Politecnica de Madrid. He is currently an As-
sociate Professor at Universidad Autonoma de Madrid. His research interests
are focused on forensic acoustics and biometrics signal processing. He has
participated in several scientific and technical committees, and has chaired
“Odyssey-04, The ISCA Speaker Recognition Workshop”.
DANIEL RAMOS-CASTRO received his M.Sc. in Electrical Engineering in
2000 from Universidad Politecnica de Madrid, Spain. Since 2004 he is with
Universidad Autonoma de Madrid pursing his Ph.D degree, where he is cur-
rently working as an assistant professor. His research interest are focused on
signal and image processing, pattern recognition and forensic biometrics. He
collaborated in the development of the ATVS-UAM speaker recognition sys-
tem for the NIST SRE 2004, 2005, and 2006 evaluations. He was the recipient
of the IBM Research Best Student Paper Award at Odyssey 2006.
32

JOAQUIN GONZALEZ-RODRIGUEZ received the Ph.D. degree in electrical
engineering in 1999 from Universidad Politecnica de Madrid. He is currently
and Associate Professor at Universidad Autonoma de Madrid. His research
interests are focused on signal processing, biometrics and forensics. He is an
invited member of ENFSI and has been vice-chairman for “Odyssey-04, The
ISCA Speaker Recognition Workshop”.
33