Reconstruction error based deep neural networks for coronary ...
17
RESEARCH ARTICLE Reconstruction error based deep neural networks for coronary heart disease risk prediction Tsatsral Amarbayasgalan ID 1 , Kwang Ho Park 1 , Jong Yun Lee 1 , Keun Ho Ryu ID 2,3 * 1 Database and Bioinformatics Laboratory, School of Electrical and Computer Engineering, Chungbuk National University, Cheongju, Korea, 2 Faculty of Information Technology, Ton Duc Thang University, Ho Chi Minh City, Vietnam, 3 College of Electrical and Computer Engineering, Chungbuk National University, Cheongju, Korea * [email protected], [email protected] Abstract Coronary heart disease (CHD) is one of the leading causes of death worldwide; if suffering from CHD and being in its end-stage, the most advanced treatments are required, such as heart surgery and heart transplant. Moreover, it is not easy to diagnose CHD at the earlier stage; hospitals diagnose it based on various types of medical tests. Thus, by predicting high-risk people who are to suffer from CHD, it is significant to reduce the risks of developing CHD. In recent years, some research works have been done using data mining to predict the risk of developing diseases based on medical tests. In this study, we have proposed a reconstruction error (RE) based deep neural networks (DNNs); this approach uses a deep autoencoder (AE) model for estimating RE. Initially, a training dataset is divided into two groups by their RE divergence on the deep AE model that learned from the whole training dataset. Next, two DNN classifiers are trained on each group of datasets separately by com- bining a RE based new feature with other risk factors to predict the risk of developing CHD. For creating the new feature, we use deep AE model that trained on the only high-risk data- set. We have performed an experiment to prove how the components of our proposed method work together more efficiently. As a result of our experiment, the performance measurements include accuracy, precision, recall, F-measure, and AUC score reached 86.3371%, 91.3716%, 82.9024%, 86.9148%, and 86.6568%, respectively. These results show that the proposed AE-DNNs outperformed regular machine learning-based classifiers for CHD risk prediction. Introduction According to the statement by the World Health Organization (WHO), CHD is said to be one of the fatal disorders in the world, and as for 2016, an estimated 15.2 million people died from CHD and stroke [1]. South Korea is equally considered to be one of the countries in which heart disease is higher, being ranked second of all deaths [2]. Risk factors of developing CHD PLOS ONE | https://doi.org/10.1371/journal.pone.0225991 December 5, 2019 1 / 17 a1111111111 a1111111111 a1111111111 a1111111111 a1111111111 OPEN ACCESS Citation: Amarbayasgalan T, Park KH, Lee JY, Ryu KH (2019) Reconstruction error based deep neural networks for coronary heart disease risk prediction. PLoS ONE 14(12): e0225991. https://doi.org/ 10.1371/journal.pone.0225991 Editor: Xia Li, College of Bioinformatics Science and Technology, CHINA Received: January 15, 2019 Accepted: November 18, 2019 Published: December 5, 2019 Copyright: © 2019 Amarbayasgalan et al. This is an open access article distributed under the terms of the Creative Commons Attribution License, which permits unrestricted use, distribution, and reproduction in any medium, provided the original author and source are credited. Data Availability Statement: Data cannot be shared publicly because of data policy. Data are available from the https://knhanes.cdc.go.kr/ knhanes/eng/index.do (https://knhanes.cdc.go.kr/ knhanes/sub03/sub03_02_02.do) for researchers who registered for access to confidential data. In other words, the authors who do not have the data access privilege can register first then download data from 1998 to 2017. Downloaded files are opened by SPSS or SAS programs. In registration, authors need to fill out their email, name, and affiliation. If email is already registered, the system
-
Upload
khangminh22 -
Category
Documents
-
view
3 -
download
0
Transcript of Reconstruction error based deep neural networks for coronary ...
RESEARCH ARTICLE
Reconstruction error based deep neural
networks for coronary heart disease risk
prediction
Tsatsral AmarbayasgalanID1, Kwang Ho Park1, Jong Yun Lee1, Keun Ho RyuID
2,3*
1 Database and Bioinformatics Laboratory, School of Electrical and Computer Engineering, Chungbuk
National University, Cheongju, Korea, 2 Faculty of Information Technology, Ton Duc Thang University, Ho
Chi Minh City, Vietnam, 3 College of Electrical and Computer Engineering, Chungbuk National University,
Cheongju, Korea
* [email protected], [email protected]
Abstract
Coronary heart disease (CHD) is one of the leading causes of death worldwide; if suffering
from CHD and being in its end-stage, the most advanced treatments are required, such as
heart surgery and heart transplant. Moreover, it is not easy to diagnose CHD at the earlier
stage; hospitals diagnose it based on various types of medical tests. Thus, by predicting
high-risk people who are to suffer from CHD, it is significant to reduce the risks of developing
CHD. In recent years, some research works have been done using data mining to predict
the risk of developing diseases based on medical tests. In this study, we have proposed a
reconstruction error (RE) based deep neural networks (DNNs); this approach uses a deep
autoencoder (AE) model for estimating RE. Initially, a training dataset is divided into two
groups by their RE divergence on the deep AE model that learned from the whole training
dataset. Next, two DNN classifiers are trained on each group of datasets separately by com-
bining a RE based new feature with other risk factors to predict the risk of developing CHD.
For creating the new feature, we use deep AE model that trained on the only high-risk data-
set. We have performed an experiment to prove how the components of our proposed
method work together more efficiently. As a result of our experiment, the performance
measurements include accuracy, precision, recall, F-measure, and AUC score reached
86.3371%, 91.3716%, 82.9024%, 86.9148%, and 86.6568%, respectively. These results
show that the proposed AE-DNNs outperformed regular machine learning-based classifiers
for CHD risk prediction.
Introduction
According to the statement by the World Health Organization (WHO), CHD is said to be one
of the fatal disorders in the world, and as for 2016, an estimated 15.2 million people died from
CHD and stroke [1]. South Korea is equally considered to be one of the countries in which
heart disease is higher, being ranked second of all deaths [2]. Risk factors of developing CHD
PLOS ONE | https://doi.org/10.1371/journal.pone.0225991 December 5, 2019 1 / 17
a1111111111
a1111111111
a1111111111
a1111111111
a1111111111
OPEN ACCESS
Citation: Amarbayasgalan T, Park KH, Lee JY, Ryu
KH (2019) Reconstruction error based deep neural
networks for coronary heart disease risk prediction.
PLoS ONE 14(12): e0225991. https://doi.org/
10.1371/journal.pone.0225991
Editor: Xia Li, College of Bioinformatics Science
and Technology, CHINA
Received: January 15, 2019
Accepted: November 18, 2019
Published: December 5, 2019
Copyright: © 2019 Amarbayasgalan et al. This is an
open access article distributed under the terms of
the Creative Commons Attribution License, which
permits unrestricted use, distribution, and
reproduction in any medium, provided the original
author and source are credited.
Data Availability Statement: Data cannot be
shared publicly because of data policy. Data are
available from the https://knhanes.cdc.go.kr/
knhanes/eng/index.do (https://knhanes.cdc.go.kr/
knhanes/sub03/sub03_02_02.do) for researchers
who registered for access to confidential data. In
other words, the authors who do not have the data
access privilege can register first then download
data from 1998 to 2017. Downloaded files are
opened by SPSS or SAS programs. In registration,
authors need to fill out their email, name, and
affiliation. If email is already registered, the system
include bad habits, such as lack of physical activity, poor diet, smoking and stress [3, 4]. If it
reaches the end-stage, the most advanced treatments are required to be conducted, including
stent surgery that helps keep coronary arteries open and reduce the chance of a heart attack,
and coronary artery bypass grafting that improves blood flow to the heart, and heart transplant
[5, 6]. In the early stage, it is possible to prevent suffering from CHD by giving advice and
appropriate medicines. However, it is difficult to make precise diagnose at the earlier-stage
of CHD [7, 8]; hospitals use many kinds of clinical tests, such as electrocardiogram, coronary
computed tomography angiogram, echocardiogram and blood tests [9].
In recent times, data mining based classification techniques have been used in the research
works, predicting the risk of CHD [10–16]. Data mining is a process of automatically discover-
ing useful information in large data repositories and provides an opportunity to predict the
outcome of further observation [17]. If data have labels revealing high risky or normal, classifi-
cation techniques are used. In [15, 18], the authors have compared several classification mod-
els: Decision tree (DT), Naïve Bayes (NB), K-nearest neighbors (KNN), Neural network (NN),
and Support vector machine (SVM). According to the findings from these researches, the
SVM algorithm showed the highest accuracy, with Kim et al., 2015 reaching higher accuracy
(69.51%) than SVM by using the Fuzzy Logic and Decision tree on the sixth Korea National
Health and Nutrition Examination Survey (KNHANES) dataset. In [14, 16, 19, 20], DNN
based CHD prediction modesl have been proposed and, Atkov et al., 2012 has built 10 different
prediction models by different risk factors—each model has two hidden layers with 4 neurons
—the accuracy reached 93% on 487 patients’ data in Central Clinical Hospital No. 2 of Russian
railways. In [19, 20], the authors have done feature correlation analysis, and hidden layers of
DNN were connected based on the correlation results; the accuracy and AUC score of the
DNN with feature correlation analysis were 83.9% and 79.0% on the sixth KNHANES dataset.
By this research work, we have proposed the RE based DNNs; we have aimed to improve
the performance of DNN by extracting the RE based feature from the deep AE neural network
model. In most cases, AE is used as a dimensionality reduction technique to project high
dimensional space into lower-dimensional space. Dimension reduction techniques are mostly
used to avoid the curse of dimensionality problem before cluster or classification algorithms
[21–24]. The novelty of our research work is that we used RE instead of low dimensional space
of deep AE model to extract the new feature. Reconstruction is a process of transforming the
lower-dimensional representation of source data into its original dimension. RE is estimated
by a difference between source data and reconstructed data. We have evaluated the proposed
AE-DNNs on a 6-years KNHANES dataset; it presented higher performance than the previous
studies with the same dataset as well as other machine learning-based algorithms.
Methodology
In this section, we will describe details of how to create the new feature using RE and to predict
the risk of developing CHD by DNNs. Our proposed approach has two fundamental functions:
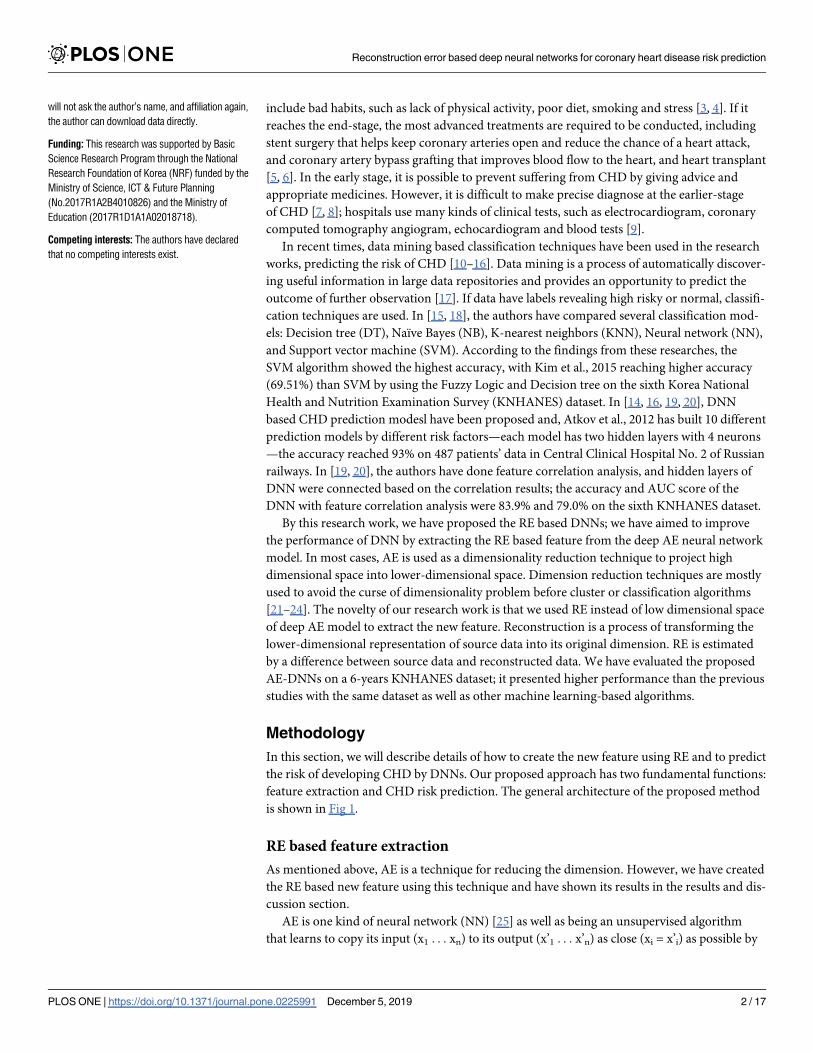
feature extraction and CHD risk prediction. The general architecture of the proposed method
is shown in Fig 1.
RE based feature extraction
As mentioned above, AE is a technique for reducing the dimension. However, we have created
the RE based new feature using this technique and have shown its results in the results and dis-
cussion section.
AE is one kind of neural network (NN) [25] as well as being an unsupervised algorithm
that learns to copy its input (x1 . . . xn) to its output (x’1 . . . x’n) as close (xi = x’i) as possible by
Reconstruction error based deep neural networks for coronary heart disease risk prediction
PLOS ONE | https://doi.org/10.1371/journal.pone.0225991 December 5, 2019 2 / 17
will not ask the author’s name, and affiliation again,
the author can download data directly.
Funding: This research was supported by Basic
Science Research Program through the National
Research Foundation of Korea (NRF) funded by the
Ministry of Science, ICT & Future Planning
(No.2017R1A2B4010826) and the Ministry of
Education (2017R1D1A1A02018718).
Competing interests: The authors have declared
that no competing interests exist.
reducing the difference between inputs and outputs [26]. Thus, the number of input neurons
equal to the number of output neurons in AE. In general, the structure of AE is similar to NN
with one hidden layer, at least, whereas AE is distinguished from the NN for predicting output
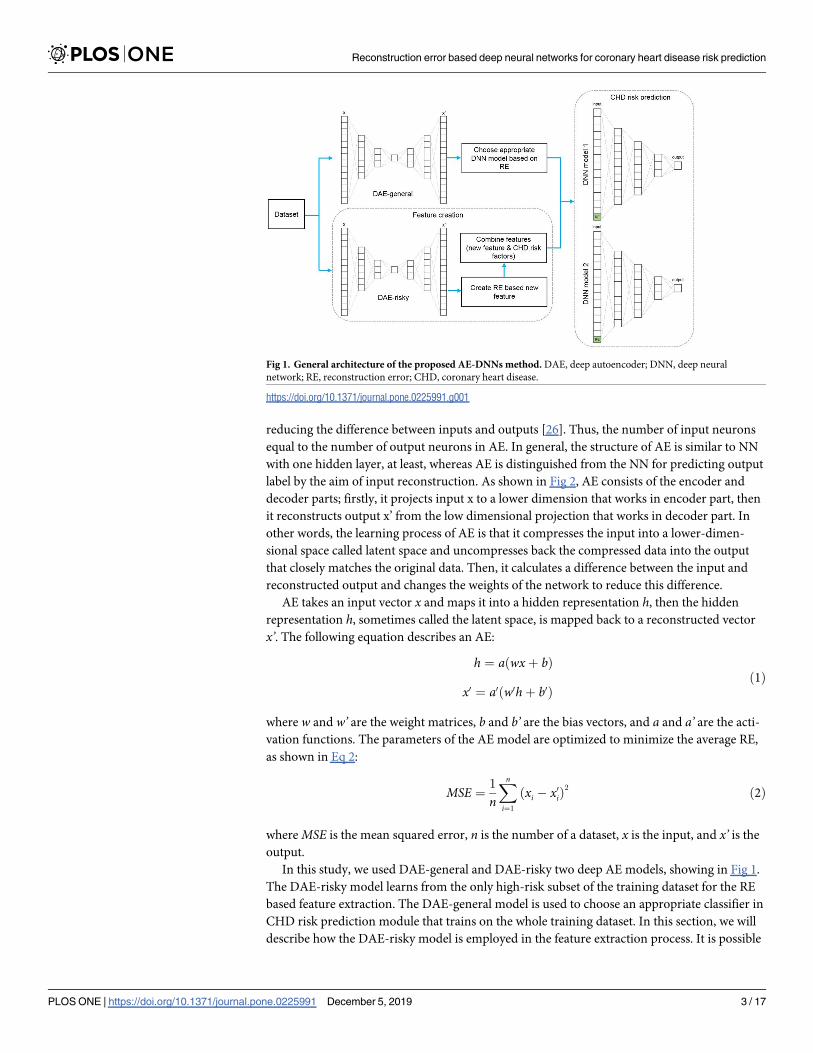
label by the aim of input reconstruction. As shown in Fig 2, AE consists of the encoder and
decoder parts; firstly, it projects input x to a lower dimension that works in encoder part, then
it reconstructs output x’ from the low dimensional projection that works in decoder part. In
other words, the learning process of AE is that it compresses the input into a lower-dimen-
sional space called latent space and uncompresses back the compressed data into the output
that closely matches the original data. Then, it calculates a difference between the input and
reconstructed output and changes the weights of the network to reduce this difference.
AE takes an input vector x and maps it into a hidden representation h, then the hidden
representation h, sometimes called the latent space, is mapped back to a reconstructed vector
x’. The following equation describes an AE:
h ¼ aðwxþ bÞ
x0 ¼ a0ðw0hþ b0Þð1Þ
where w and w’ are the weight matrices, b and b’ are the bias vectors, and a and a’ are the acti-
vation functions. The parameters of the AE model are optimized to minimize the average RE,
as shown in Eq 2:
MSE ¼1
n
Xn
i¼1
ðxi � x0
iÞ2
ð2Þ
where MSE is the mean squared error, n is the number of a dataset, x is the input, and x’ is the
output.
In this study, we used DAE-general and DAE-risky two deep AE models, showing in Fig 1.
The DAE-risky model learns from the only high-risk subset of the training dataset for the RE
based feature extraction. The DAE-general model is used to choose an appropriate classifier in
CHD risk prediction module that trains on the whole training dataset. In this section, we will
describe how the DAE-risky model is employed in the feature extraction process. It is possible
Fig 1. General architecture of the proposed AE-DNNs method. DAE, deep autoencoder; DNN, deep neural
network; RE, reconstruction error; CHD, coronary heart disease.
https://doi.org/10.1371/journal.pone.0225991.g001
Reconstruction error based deep neural networks for coronary heart disease risk prediction
PLOS ONE | https://doi.org/10.1371/journal.pone.0225991 December 5, 2019 3 / 17
to identify well which differentiation of RE is risky or normal by training the AE model on the
only risky dataset. In other words, if we give a person’s data who has low CHD risk as an input
of DAE-risky model, the RE will tend to be higher because the model did not learn from the
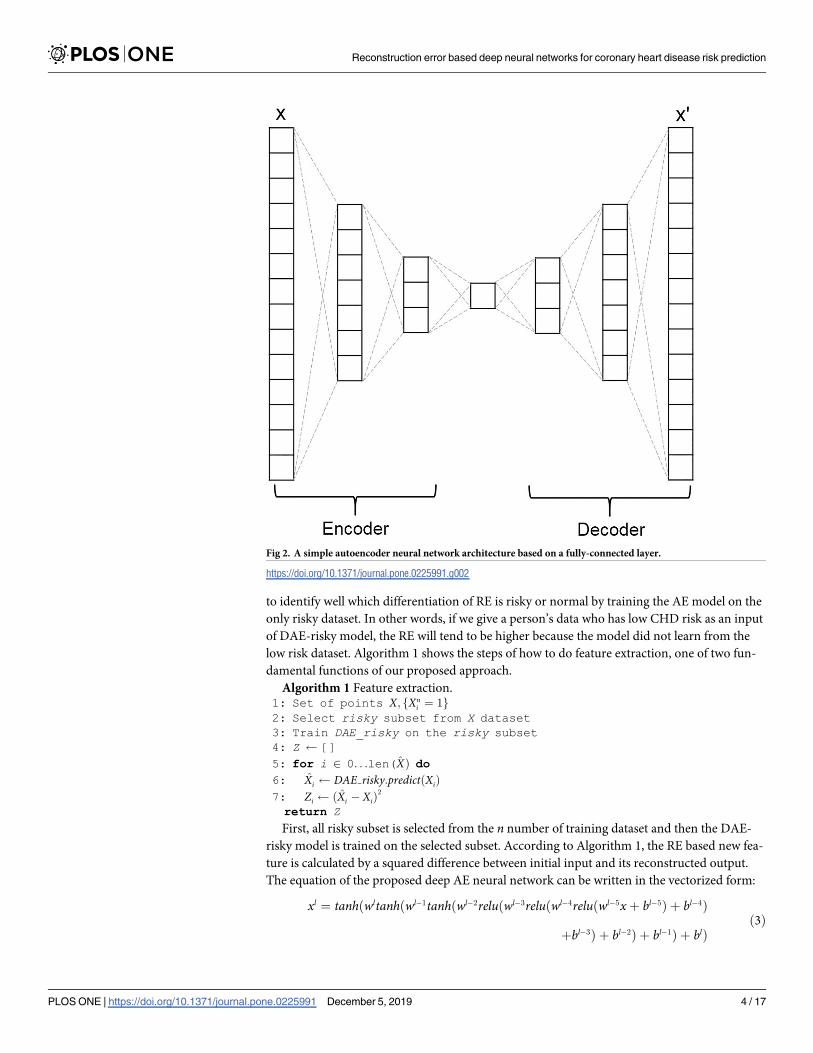
low risk dataset. Algorithm 1 shows the steps of how to do feature extraction, one of two fun-
damental functions of our proposed approach.
Algorithm 1 Feature extraction.1: Set of points X; fXn
i ¼ 1g
2: Select risky subset from X dataset3: Train DAE_risky on the risky subset4: Z []5: for i 2 0. . .len(X̂Þ do6: X̂i DAE risky:predictðXiÞ
7: Zi ðX̂i � XiÞ2
return Z
First, all risky subset is selected from the n number of training dataset and then the DAE-
risky model is trained on the selected subset. According to Algorithm 1, the RE based new fea-
ture is calculated by a squared difference between initial input and its reconstructed output.
The equation of the proposed deep AE neural network can be written in the vectorized form:
xl ¼ tanhðwltanhðwl� 1tanhðwl� 2reluðwl� 3reluðwl� 4reluðwl� 5xþ bl� 5Þ þ bl� 4Þ
þbl� 3Þ þ bl� 2Þ þ bl� 1Þ þ blÞð3Þ
Fig 2. A simple autoencoder neural network architecture based on a fully-connected layer.
https://doi.org/10.1371/journal.pone.0225991.g002
Reconstruction error based deep neural networks for coronary heart disease risk prediction
PLOS ONE | https://doi.org/10.1371/journal.pone.0225991 December 5, 2019 4 / 17
where tanh and relu are the activation functions, wl and bl are the weight matrix and the bias
vector for each layer, l, and x is the input vector.
DNNs for CHD risk prediction
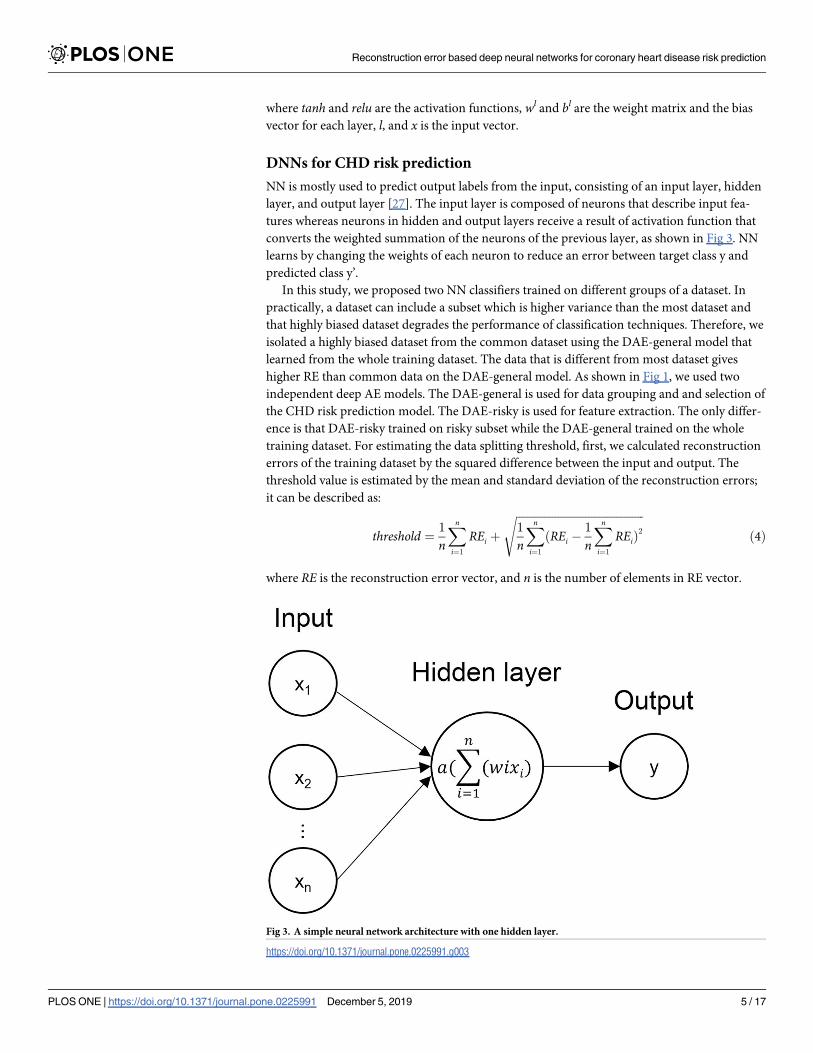
NN is mostly used to predict output labels from the input, consisting of an input layer, hidden
layer, and output layer [27]. The input layer is composed of neurons that describe input fea-
tures whereas neurons in hidden and output layers receive a result of activation function that
converts the weighted summation of the neurons of the previous layer, as shown in Fig 3. NN
learns by changing the weights of each neuron to reduce an error between target class y and
predicted class y’.
In this study, we proposed two NN classifiers trained on different groups of a dataset. In
practically, a dataset can include a subset which is higher variance than the most dataset and
that highly biased dataset degrades the performance of classification techniques. Therefore, we
isolated a highly biased dataset from the common dataset using the DAE-general model that
learned from the whole training dataset. The data that is different from most dataset gives
higher RE than common data on the DAE-general model. As shown in Fig 1, we used two
independent deep AE models. The DAE-general is used for data grouping and and selection of
the CHD risk prediction model. The DAE-risky is used for feature extraction. The only differ-
ence is that DAE-risky trained on risky subset while the DAE-general trained on the whole
training dataset. For estimating the data splitting threshold, first, we calculated reconstruction
errors of the training dataset by the squared difference between the input and output. The
threshold value is estimated by the mean and standard deviation of the reconstruction errors;
it can be described as:
threshold ¼1
n
Xn
i¼1
REi þ
ffiffiffiffiffiffiffiffiffiffiffiffiffiffiffiffiffiffiffiffiffiffiffiffiffiffiffiffiffiffiffiffiffiffiffiffiffiffiffiffiffiffiffiffiffiffi1
n
Xn
i¼1
ðREi �1
n
Xn
i¼1
REiÞ2
s
ð4Þ
where RE is the reconstruction error vector, and n is the number of elements in RE vector.
Fig 3. A simple neural network architecture with one hidden layer.
https://doi.org/10.1371/journal.pone.0225991.g003
Reconstruction error based deep neural networks for coronary heart disease risk prediction
PLOS ONE | https://doi.org/10.1371/journal.pone.0225991 December 5, 2019 5 / 17
After threshold estimation, we partitioned the training dataset into two parts; each part
consists of subsets labeled by high-risk and low-risk. The first part contained a dataset with
high RE that exceeds the threshold value and the second part consisted of the rest of the data-
set. Subsequently, DNN classifiers are trained on each group separately using CHD risk factors
with RE based newly created feature. Each of NN classifiers is the same structure that has four
hidden layers with neurons 10, 7, 5, and 3, respectively. The input layer consists of 15 neurons,
including the selected CHD risk factors, and the RE based feature to predict target variable y.
y ¼ sigmoidðwlreluðwl� 1reluðwl� 2reluðwl� 3reluðwl� 4 þ bl� 4Þ þ bl� 3Þ
þbl� 2Þ þ bl� 1Þ þ blÞð5Þ
where the output layer uses the sigmoid activation function, and all of the hidden layers use the
relu activation function, wl and bl are the weight matrix and the bias vector for each layer, l,and x is the input vector.
In the CHD risk prediction process, first, test data is given as an input of the trained DAE-
general model, and its RE is calculated. If the RE exceeds the threshold, the DNN model 1 that
trained on data group with high RE will be used; otherwise, the DNN model 2 that trained on
data group with lower RE will be used to predict the class label, as shown Fig 1.
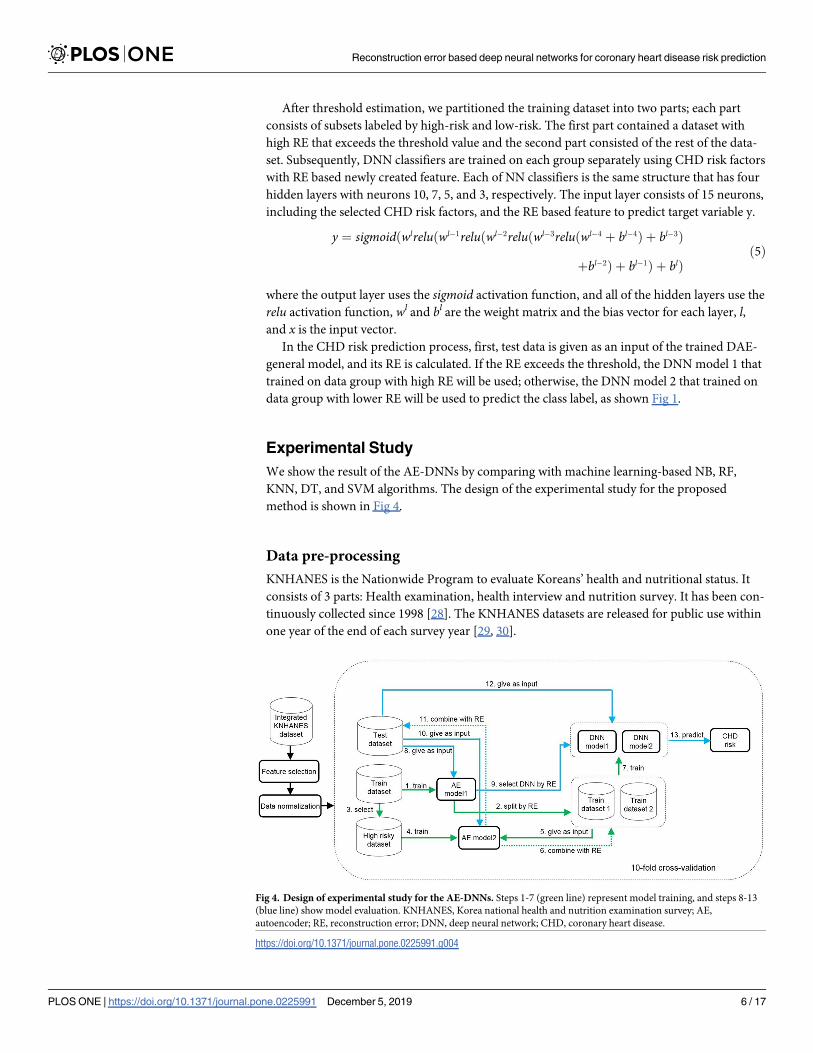
Experimental Study
We show the result of the AE-DNNs by comparing with machine learning-based NB, RF,
KNN, DT, and SVM algorithms. The design of the experimental study for the proposed
method is shown in Fig 4.
Data pre-processing
KNHANES is the Nationwide Program to evaluate Koreans’ health and nutritional status. It
consists of 3 parts: Health examination, health interview and nutrition survey. It has been con-
tinuously collected since 1998 [28]. The KNHANES datasets are released for public use within
one year of the end of each survey year [29, 30].
Fig 4. Design of experimental study for the AE-DNNs. Steps 1-7 (green line) represent model training, and steps 8-13
(blue line) show model evaluation. KNHANES, Korea national health and nutrition examination survey; AE,
autoencoder; RE, reconstruction error; DNN, deep neural network; CHD, coronary heart disease.
https://doi.org/10.1371/journal.pone.0225991.g004
Reconstruction error based deep neural networks for coronary heart disease risk prediction
PLOS ONE | https://doi.org/10.1371/journal.pone.0225991 December 5, 2019 6 / 17
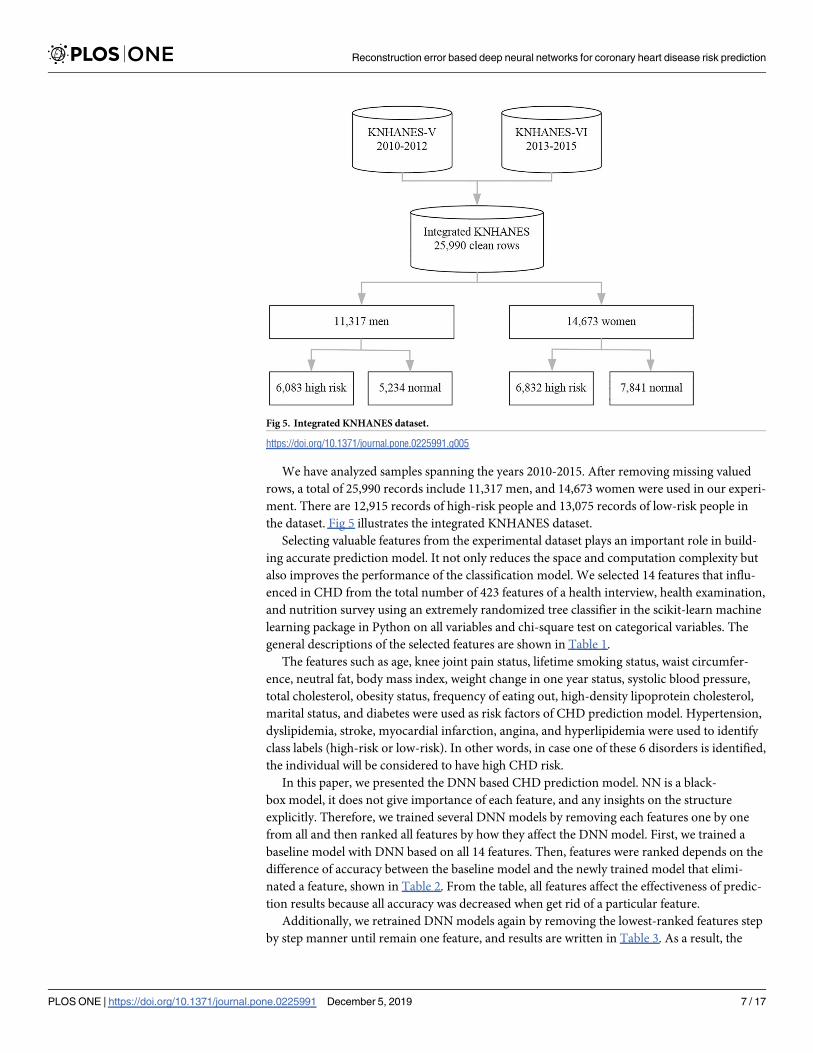
We have analyzed samples spanning the years 2010-2015. After removing missing valued
rows, a total of 25,990 records include 11,317 men, and 14,673 women were used in our experi-
ment. There are 12,915 records of high-risk people and 13,075 records of low-risk people in
the dataset. Fig 5 illustrates the integrated KNHANES dataset.
Selecting valuable features from the experimental dataset plays an important role in build-
ing accurate prediction model. It not only reduces the space and computation complexity but
also improves the performance of the classification model. We selected 14 features that influ-
enced in CHD from the total number of 423 features of a health interview, health examination,
and nutrition survey using an extremely randomized tree classifier in the scikit-learn machine
learning package in Python on all variables and chi-square test on categorical variables. The
general descriptions of the selected features are shown in Table 1.
The features such as age, knee joint pain status, lifetime smoking status, waist circumfer-
ence, neutral fat, body mass index, weight change in one year status, systolic blood pressure,
total cholesterol, obesity status, frequency of eating out, high-density lipoprotein cholesterol,
marital status, and diabetes were used as risk factors of CHD prediction model. Hypertension,
dyslipidemia, stroke, myocardial infarction, angina, and hyperlipidemia were used to identify
class labels (high-risk or low-risk). In other words, in case one of these 6 disorders is identified,
the individual will be considered to have high CHD risk.
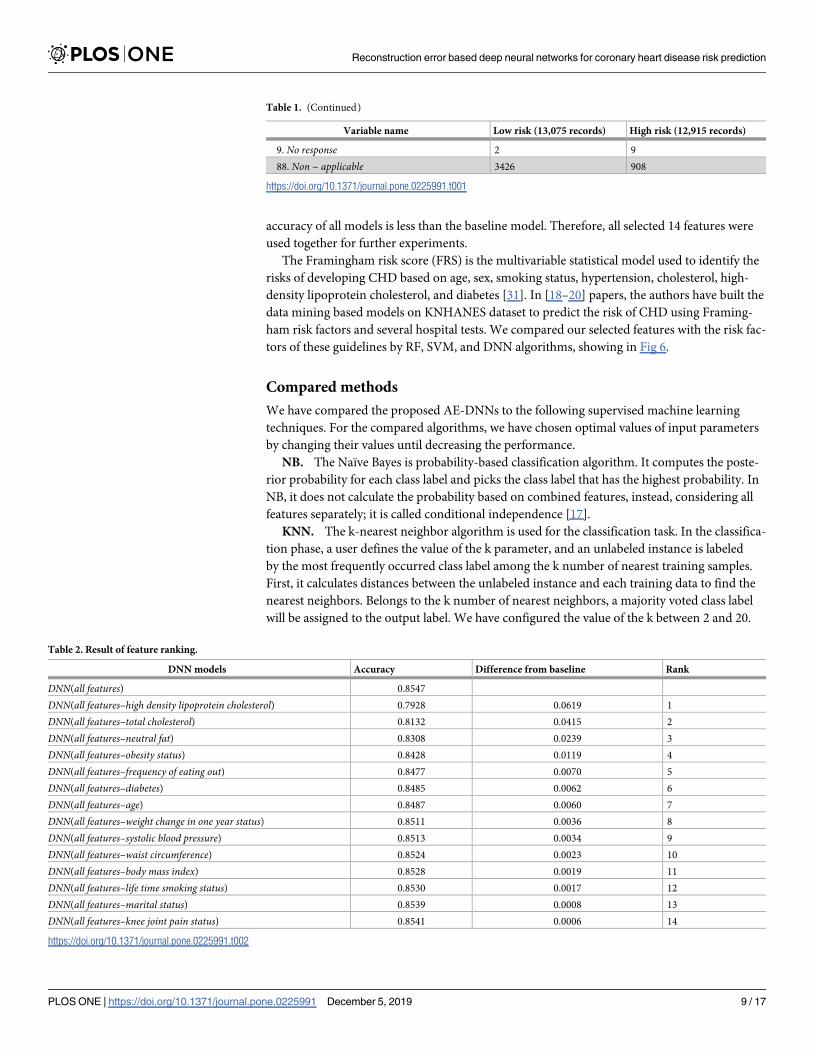
In this paper, we presented the DNN based CHD prediction model. NN is a black-
box model, it does not give importance of each feature, and any insights on the structure
explicitly. Therefore, we trained several DNN models by removing each features one by one
from all and then ranked all features by how they affect the DNN model. First, we trained a
baseline model with DNN based on all 14 features. Then, features were ranked depends on the
difference of accuracy between the baseline model and the newly trained model that elimi-
nated a feature, shown in Table 2. From the table, all features affect the effectiveness of predic-
tion results because all accuracy was decreased when get rid of a particular feature.
Additionally, we retrained DNN models again by removing the lowest-ranked features step
by step manner until remain one feature, and results are written in Table 3. As a result, the
Fig 5. Integrated KNHANES dataset.
https://doi.org/10.1371/journal.pone.0225991.g005
Reconstruction error based deep neural networks for coronary heart disease risk prediction
PLOS ONE | https://doi.org/10.1371/journal.pone.0225991 December 5, 2019 7 / 17
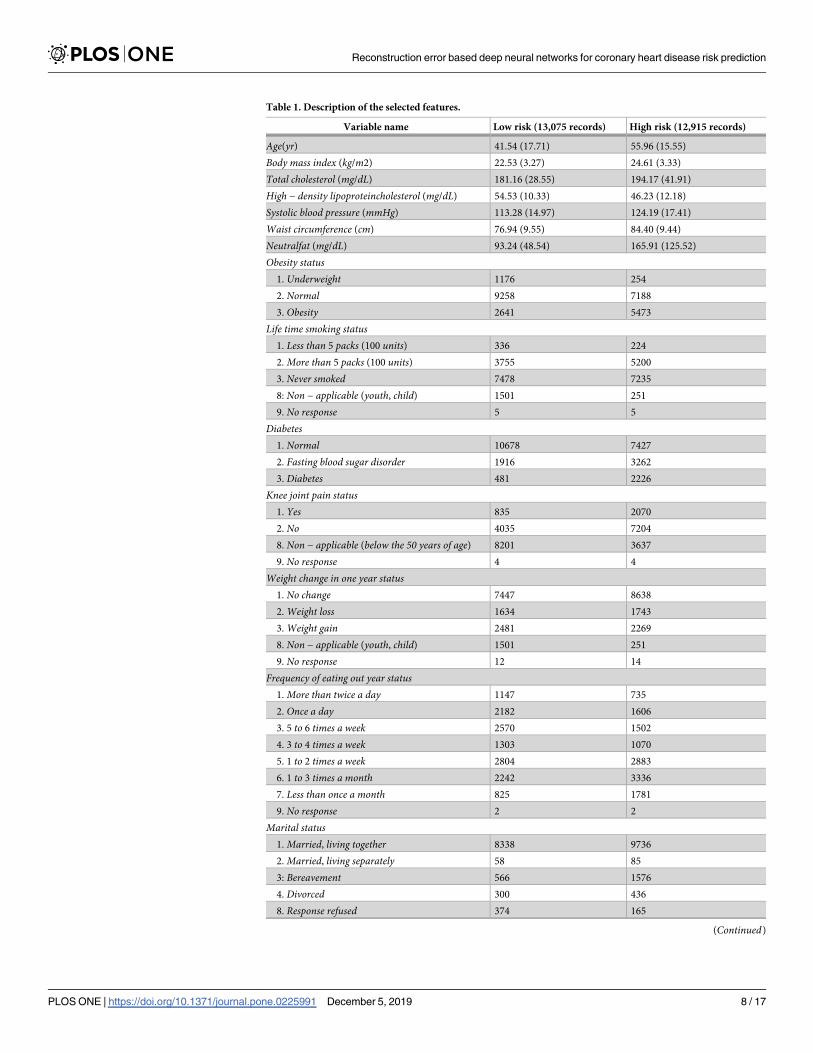
Table 1. Description of the selected features.
Variable name Low risk (13,075 records) High risk (12,915 records)
Age(yr) 41.54 (17.71) 55.96 (15.55)
Body mass index (kg/m2) 22.53 (3.27) 24.61 (3.33)
Total cholesterol (mg/dL) 181.16 (28.55) 194.17 (41.91)
High − density lipoproteincholesterol (mg/dL) 54.53 (10.33) 46.23 (12.18)
Systolic blood pressure (mmHg) 113.28 (14.97) 124.19 (17.41)
Waist circumference (cm) 76.94 (9.55) 84.40 (9.44)
Neutralfat (mg/dL) 93.24 (48.54) 165.91 (125.52)
Obesity status1. Underweight 1176 254
2. Normal 9258 7188
3. Obesity 2641 5473
Life time smoking status1. Less than 5 packs (100 units) 336 224
2. More than 5 packs (100 units) 3755 5200
3. Never smoked 7478 7235
8: Non − applicable (youth, child) 1501 251
9. No response 5 5
Diabetes1. Normal 10678 7427
2. Fasting blood sugar disorder 1916 3262
3. Diabetes 481 2226
Knee joint pain status1. Yes 835 2070
2. No 4035 7204
8. Non − applicable (below the 50 years of age) 8201 3637
9. No response 4 4
Weight change in one year status1. No change 7447 8638
2. Weight loss 1634 1743
3. Weight gain 2481 2269
8. Non − applicable (youth, child) 1501 251
9. No response 12 14
Frequency of eating out year status1. More than twice a day 1147 735
2. Once a day 2182 1606
3. 5 to 6 times a week 2570 1502
4. 3 to 4 times a week 1303 1070
5. 1 to 2 times a week 2804 2883
6. 1 to 3 times a month 2242 3336
7. Less than once a month 825 1781
9. No response 2 2
Marital status1. Married, living together 8338 9736
2. Married, living separately 58 85
3: Bereavement 566 1576
4. Divorced 300 436
8. Response refused 374 165
(Continued)
Reconstruction error based deep neural networks for coronary heart disease risk prediction
PLOS ONE | https://doi.org/10.1371/journal.pone.0225991 December 5, 2019 8 / 17
accuracy of all models is less than the baseline model. Therefore, all selected 14 features were
used together for further experiments.
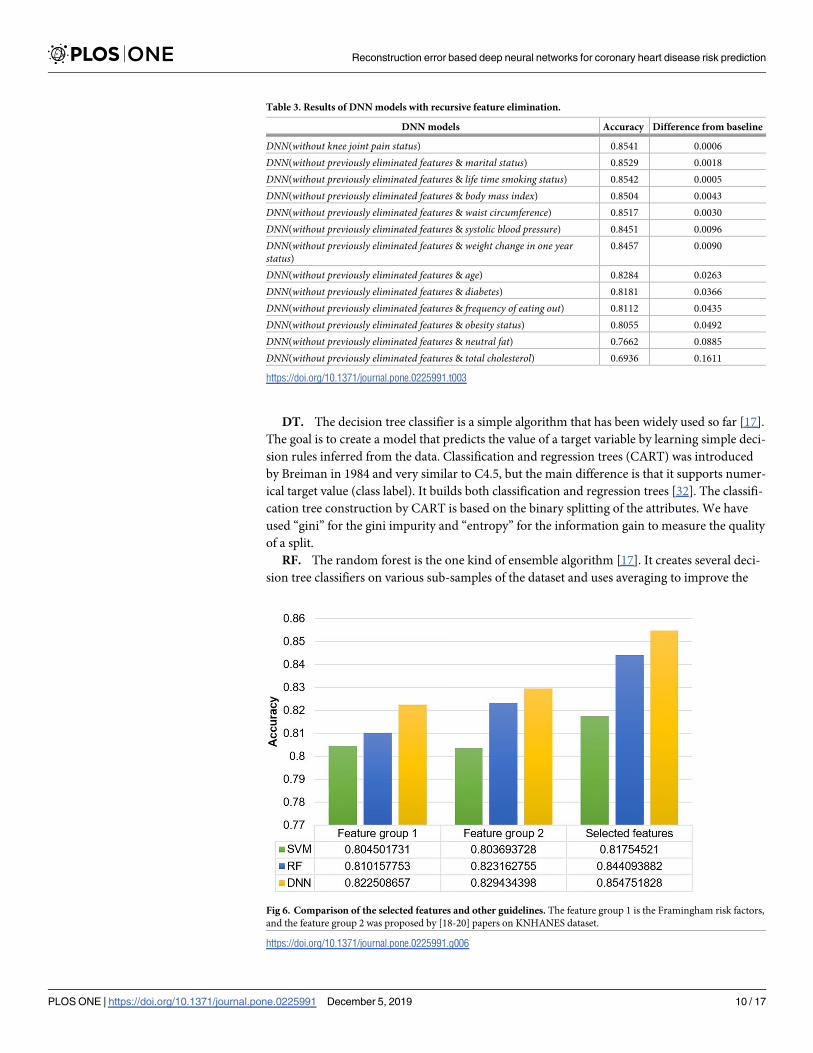
The Framingham risk score (FRS) is the multivariable statistical model used to identify the
risks of developing CHD based on age, sex, smoking status, hypertension, cholesterol, high-
density lipoprotein cholesterol, and diabetes [31]. In [18–20] papers, the authors have built the
data mining based models on KNHANES dataset to predict the risk of CHD using Framing-
ham risk factors and several hospital tests. We compared our selected features with the risk fac-
tors of these guidelines by RF, SVM, and DNN algorithms, showing in Fig 6.
Compared methods
We have compared the proposed AE-DNNs to the following supervised machine learning
techniques. For the compared algorithms, we have chosen optimal values of input parameters
by changing their values until decreasing the performance.
NB. The Naïve Bayes is probability-based classification algorithm. It computes the poste-
rior probability for each class label and picks the class label that has the highest probability. In
NB, it does not calculate the probability based on combined features, instead, considering all
features separately; it is called conditional independence [17].
KNN. The k-nearest neighbor algorithm is used for the classification task. In the classifica-
tion phase, a user defines the value of the k parameter, and an unlabeled instance is labeled
by the most frequently occurred class label among the k number of nearest training samples.
First, it calculates distances between the unlabeled instance and each training data to find the
nearest neighbors. Belongs to the k number of nearest neighbors, a majority voted class label
will be assigned to the output label. We have configured the value of the k between 2 and 20.
Table 1. (Continued)
Variable name Low risk (13,075 records) High risk (12,915 records)
9. No response 2 9
88. Non − applicable 3426 908
https://doi.org/10.1371/journal.pone.0225991.t001
Table 2. Result of feature ranking.
DNN models Accuracy Difference from baseline Rank
DNN(all features) 0.8547
DNN(all features–high density lipoprotein cholesterol) 0.7928 0.0619 1
DNN(all features–total cholesterol) 0.8132 0.0415 2
DNN(all features–neutral fat) 0.8308 0.0239 3
DNN(all features–obesity status) 0.8428 0.0119 4
DNN(all features–frequency of eating out) 0.8477 0.0070 5
DNN(all features–diabetes) 0.8485 0.0062 6
DNN(all features–age) 0.8487 0.0060 7
DNN(all features–weight change in one year status) 0.8511 0.0036 8
DNN(all features–systolic blood pressure) 0.8513 0.0034 9
DNN(all features–waist circumference) 0.8524 0.0023 10
DNN(all features–body mass index) 0.8528 0.0019 11
DNN(all features–life time smoking status) 0.8530 0.0017 12
DNN(all features–marital status) 0.8539 0.0008 13
DNN(all features–knee joint pain status) 0.8541 0.0006 14
https://doi.org/10.1371/journal.pone.0225991.t002
Reconstruction error based deep neural networks for coronary heart disease risk prediction
PLOS ONE | https://doi.org/10.1371/journal.pone.0225991 December 5, 2019 9 / 17
DT. The decision tree classifier is a simple algorithm that has been widely used so far [17].
The goal is to create a model that predicts the value of a target variable by learning simple deci-
sion rules inferred from the data. Classification and regression trees (CART) was introduced
by Breiman in 1984 and very similar to C4.5, but the main difference is that it supports numer-
ical target value (class label). It builds both classification and regression trees [32]. The classifi-
cation tree construction by CART is based on the binary splitting of the attributes. We have
used “gini” for the gini impurity and “entropy” for the information gain to measure the quality
of a split.
RF. The random forest is the one kind of ensemble algorithm [17]. It creates several deci-
sion tree classifiers on various sub-samples of the dataset and uses averaging to improve the
Table 3. Results of DNN models with recursive feature elimination.
DNN models Accuracy Difference from baseline
DNN(without knee joint pain status) 0.8541 0.0006
DNN(without previously eliminated features & marital status) 0.8529 0.0018
DNN(without previously eliminated features & life time smoking status) 0.8542 0.0005
DNN(without previously eliminated features & body mass index) 0.8504 0.0043
DNN(without previously eliminated features & waist circumference) 0.8517 0.0030
DNN(without previously eliminated features & systolic blood pressure) 0.8451 0.0096
DNN(without previously eliminated features & weight change in one yearstatus)
0.8457 0.0090
DNN(without previously eliminated features & age) 0.8284 0.0263
DNN(without previously eliminated features & diabetes) 0.8181 0.0366
DNN(without previously eliminated features & frequency of eating out) 0.8112 0.0435
DNN(without previously eliminated features & obesity status) 0.8055 0.0492
DNN(without previously eliminated features & neutral fat) 0.7662 0.0885
DNN(without previously eliminated features & total cholesterol) 0.6936 0.1611
https://doi.org/10.1371/journal.pone.0225991.t003
Fig 6. Comparison of the selected features and other guidelines. The feature group 1 is the Framingham risk factors,
and the feature group 2 was proposed by [18-20] papers on KNHANES dataset.
https://doi.org/10.1371/journal.pone.0225991.g006
Reconstruction error based deep neural networks for coronary heart disease risk prediction
PLOS ONE | https://doi.org/10.1371/journal.pone.0225991 December 5, 2019 10 / 17
predictive accuracy and control over-fitting [33]. In this research work, we have adjusted the
number of trees in the forest between 10 and 150.
SVM. The support vector machine is a supervised learning method, and it has shown
promising empirical results in many practical applications [17]. It finds a separator line called
the hyper-plane that differentiate the classes very well and learns by minimizing the classifica-
tion error and maximizing the margin. SVM can be extended to non-linearly separable data
using kernel function. We have built the SVM model by using kernel functions such as linear,
poly, rbf, and sigmoid.
PCA-DNNs. The proposed AE-DNNs uses the RE for two kinds of purposes. The first
one is RE based feature extraction by the AE model that trained on the high-risk subset of the
training dataset. The second one is used to arrange training dataset into two groups based on
their RE divergence by the AE model that trained on the whole training dataset. Subsequently,
two DNN models learn from these groups. In the prediction process, the second AE model
is also employed to choose a proper classification model. Therefore, we have used Principal
component analysis (PCA) in place of AE for calculating RE. PCA is a dimension reduction
technique that the direction with the largest projected variance is called the first principal com-
ponent. The orthogonal direction that captures the second largest projected variance is called
the second principal component, and so on [34]. We can estimate RE by projecting back a low
dimension to original space using PCA.
Results and discussion
The experiment was done on a computer with i5-8500 CPU, NVIDIA GeForce GTX 1070 Ti
graphics card, and 32GB RAM. We have compared our proposed approach to other machine
learning-based algorithms by experimenting with total 6-years data that integrated KNHA-
NES-V and KNHANES-VI datasets. All compared algorithms were implemented in Python
with Keras, which is a high-level neural networks API, written in Python and capable of run-
ning on top of TensorFlow. For AE-DNNs, two DNN classifiers were configured as same as
each other. Also, the learning rate to minimize the mean squared error was 0.001, and the
Adamax optimizer was used [35]. The batch size was 32, and the number of epochs was 5000.
Before train prediction models, we have normalized our dataset. Standardization is a widely
used normalization method in machine learning algorithms, and it calculates mean and stan-
dard deviation for each attribute of a dataset. Then each value is subtracted by the mean, and
the subtracted result is divided by the standard deviation.
The accuracy, precision, recall, specificity, f-measure, and area under the curve (AUC) that
represents a summary measure of accuracy is used to evaluate the classifiers’ performance. We
have used the methodology of 10-fold cross-validation to measure.
Table 4 shows the results of CHD prediction models that learned from risk factors in
Table 1, and the highest values of evaluation scores are marked in bold. The configuration of
input parameters is shown in the column of the Algorithm.
Table 4. Results of compared algorithms on integrated KNHANES dataset.
Algorithm Accuracy Precision Recall Specificity F-measure
NB 0.7421 0.7940 0.6493 0.8246 0.7123
KNN(n_neighbors = 19) 0.7919 0.7645 0.8415 0.7364 0.8011
DT(criterion = ‘gini’) 0.7819 0.7833 0.7763 0.7851 0.7797
RF(n_estimators = 110, criterion = ‘gini’) 0.8442 0.8150 0.8881 0.7979 0.8499
SVM (kernel = ‘rbf’) 0.8175 0.8053 0.8358 0.7948 0.8202
PCA − DNNs 0.8537 0.9012 0.8217 0.8908 0.8595
Proposed AE − DNNs 0.8633 0.9137 0.8290 0.9041 0.8691
https://doi.org/10.1371/journal.pone.0225991.t004
Reconstruction error based deep neural networks for coronary heart disease risk prediction
PLOS ONE | https://doi.org/10.1371/journal.pone.0225991 December 5, 2019 11 / 17
As a result, the AE based proposed approach outperformed the PCA based version. For
machine learning-based compared algorithms, the RF algorithm showed higher performance
than others. In Table 4, the precision of the proposed AE-DNNs increased by 9.86% from the
RF algorithm, but the recall decreased by 5.91%. The recall is a fraction of the true positive pre-
dictions over the total amount of positively labeled dataset, while precision is a fraction of the
true positive predictions among all positive predictions. In other words, recall measures what
proportion of actual positives was identified correctly, and the precision evaluates the effective-
ness of true positive predictions. However, as recall gives a high score, the number of false true
prediction can be increased relatively. That means improving recall typically reduces precision
and vice versa. It is difficult to compare models with low precision and high recall or high pre-
cision and low recall. Thus, F-measure is used to measure recall and precision at the same
time, where the highest F-measure indicates a good result. The specificity is a fraction of the
true negative (high risky) predictions over the total amount of negatively labeled dataset.
The AE-DNNs improved the specificity by 10.61% from the RF and 7.94% from the NB algo-
rithm. Moreover, AE-DNNs showed the result of the highest accuracy (86.33%) and F-mea-
sure (86.91%).
Table 5 shows the Receiver operating characteristic (ROC) curve analysis results. We tested
whether observed AUC differs significantly from AUC of 0.5 by Hanley and McNeil test [36].
For all compared algorithms, AUC (<0.000001) was statistically significant. In the case of
AE-DNNs, AUC was 0.8665 (95% CI, 85.25-88.07), and it improved the highest AUC of com-
pared algorithms (AUC of RF) by 2.35%.
Fig 7 shows the ROC curves of each compared algorithms on the integrated KNHANES
dataset with 10-fold cross-validation distinctly. For 10-fold cross-validation, it is possible to
calculate the mean area under the curve, and see the variance of the curve when the training
set is split into different subsets. Therefore, we show the ROC curve of each round of cross-val-
idation with variance in Fig 7.
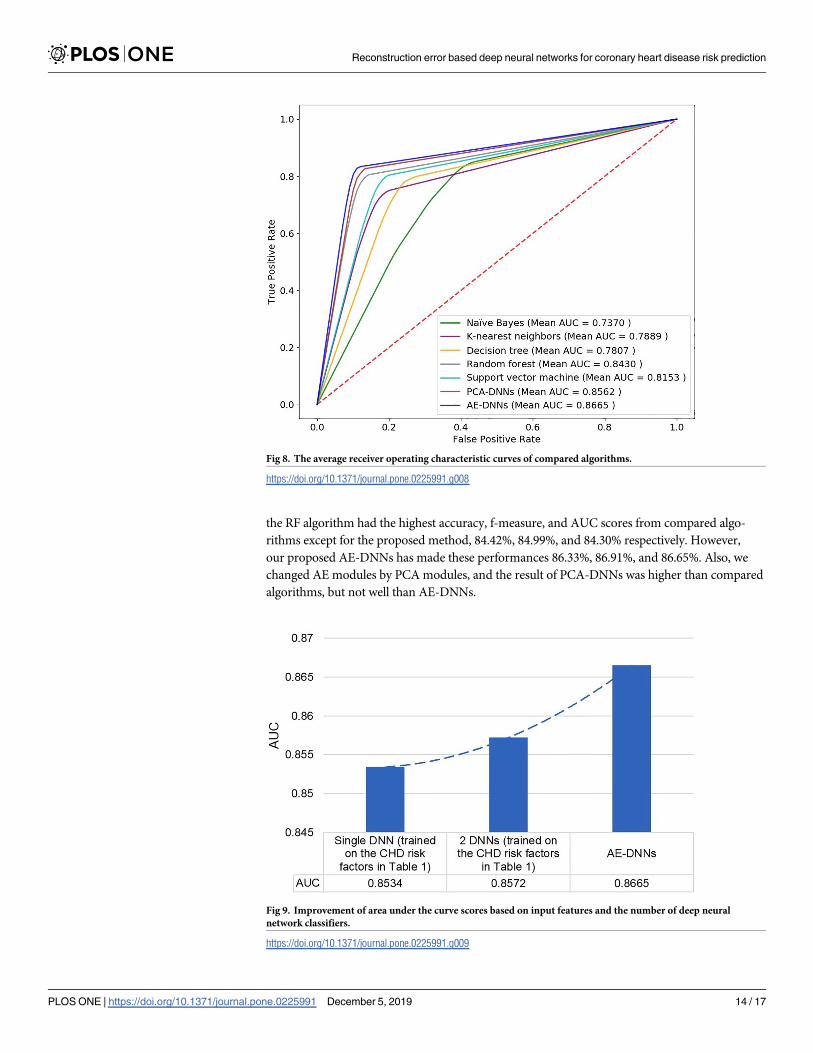
Fig 8 shows the average ROC curves of compared 7 methods. The AE-DNNs method shows
higher AUC scores than other methods.
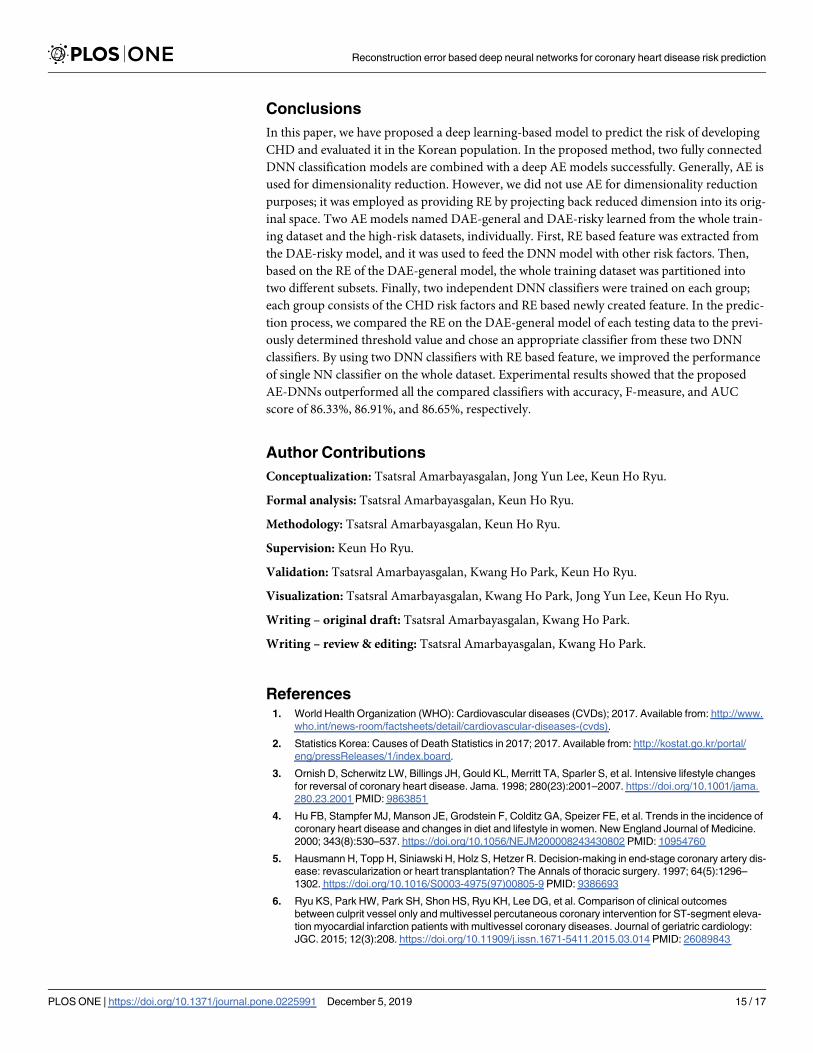
Fig 9 shows how the AUC score of the proposed DNN was improved by managing two DNNs
with the RE based feature. First, we trained a single DNN model using the selected features and
received AUC of 0.8534. Second, we partitioned the training dataset into two groups based on
their RE on the AE model that trained on the whole training dataset. Then, two DNN models
learned from each of the groups, and its AUC score increased to 0.8572 from the single NN
model. Finally, combining the RE based new feature with the selected CHD risk factors, AUC of
the two DNNs based approach improved by 1.31% from the proposed single DNN model.
Experimental results show that we can use the AE-DNNs method for CHD risk prediction
because it has given higher performance than other methods. In accordance with Tables 2 and 3,
Table 5. Results of the receiver operating characteristic curve analysis of compared algorithms.
Algorithm AUC p-value 95%CI
NB 0.7370 1.52848E-44 0.7180-0.7561
KNN 0.7889 3.5552E-78 0.7715-0.8064
DT 0.7807 2.34585E-65 0.7630-0.7984
RF 0.8430 9.901E-113 0.8277-0.8583
SVM 0.8153 5.15569E-96 0.7989-0.8318
PCA − DNNs 0.8562 1.5289E-125 0.8417-0.8709
Proposed AE − DNNs 0.8665 1.4386E-132 0.8525-0.8807
https://doi.org/10.1371/journal.pone.0225991.t005
Reconstruction error based deep neural networks for coronary heart disease risk prediction
PLOS ONE | https://doi.org/10.1371/journal.pone.0225991 December 5, 2019 12 / 17
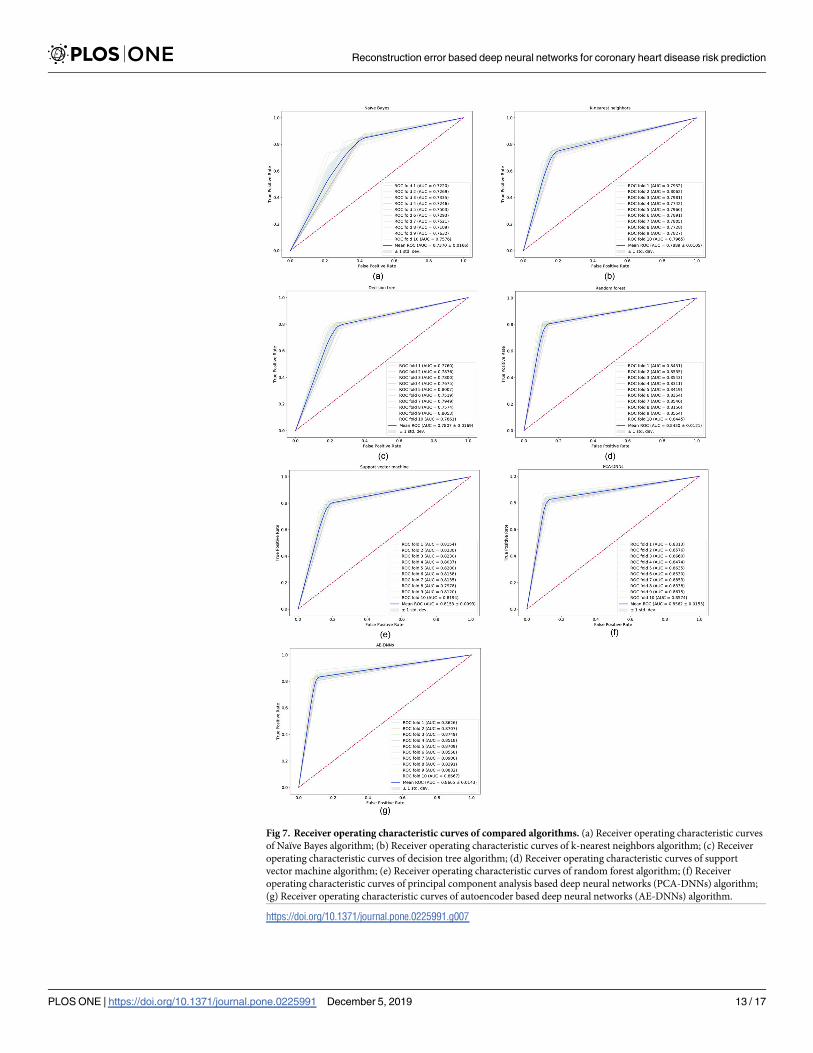
Fig 7. Receiver operating characteristic curves of compared algorithms. (a) Receiver operating characteristic curves
of Naïve Bayes algorithm; (b) Receiver operating characteristic curves of k-nearest neighbors algorithm; (c) Receiver
operating characteristic curves of decision tree algorithm; (d) Receiver operating characteristic curves of support
vector machine algorithm; (e) Receiver operating characteristic curves of random forest algorithm; (f) Receiver
operating characteristic curves of principal component analysis based deep neural networks (PCA-DNNs) algorithm;
(g) Receiver operating characteristic curves of autoencoder based deep neural networks (AE-DNNs) algorithm.
https://doi.org/10.1371/journal.pone.0225991.g007
Reconstruction error based deep neural networks for coronary heart disease risk prediction
PLOS ONE | https://doi.org/10.1371/journal.pone.0225991 December 5, 2019 13 / 17
the RF algorithm had the highest accuracy, f-measure, and AUC scores from compared algo-
rithms except for the proposed method, 84.42%, 84.99%, and 84.30% respectively. However,
our proposed AE-DNNs has made these performances 86.33%, 86.91%, and 86.65%. Also, we
changed AE modules by PCA modules, and the result of PCA-DNNs was higher than compared
algorithms, but not well than AE-DNNs.
Fig 8. The average receiver operating characteristic curves of compared algorithms.
https://doi.org/10.1371/journal.pone.0225991.g008
Fig 9. Improvement of area under the curve scores based on input features and the number of deep neural
network classifiers.
https://doi.org/10.1371/journal.pone.0225991.g009
Reconstruction error based deep neural networks for coronary heart disease risk prediction
PLOS ONE | https://doi.org/10.1371/journal.pone.0225991 December 5, 2019 14 / 17
Conclusions
In this paper, we have proposed a deep learning-based model to predict the risk of developing
CHD and evaluated it in the Korean population. In the proposed method, two fully connected
DNN classification models are combined with a deep AE models successfully. Generally, AE is
used for dimensionality reduction. However, we did not use AE for dimensionality reduction
purposes; it was employed as providing RE by projecting back reduced dimension into its orig-
inal space. Two AE models named DAE-general and DAE-risky learned from the whole train-
ing dataset and the high-risk datasets, individually. First, RE based feature was extracted from
the DAE-risky model, and it was used to feed the DNN model with other risk factors. Then,
based on the RE of the DAE-general model, the whole training dataset was partitioned into
two different subsets. Finally, two independent DNN classifiers were trained on each group;
each group consists of the CHD risk factors and RE based newly created feature. In the predic-
tion process, we compared the RE on the DAE-general model of each testing data to the previ-
ously determined threshold value and chose an appropriate classifier from these two DNN
classifiers. By using two DNN classifiers with RE based feature, we improved the performance
of single NN classifier on the whole dataset. Experimental results showed that the proposed
AE-DNNs outperformed all the compared classifiers with accuracy, F-measure, and AUC
score of 86.33%, 86.91%, and 86.65%, respectively.
Author Contributions
Conceptualization: Tsatsral Amarbayasgalan, Jong Yun Lee, Keun Ho Ryu.
Formal analysis: Tsatsral Amarbayasgalan, Keun Ho Ryu.
Methodology: Tsatsral Amarbayasgalan, Keun Ho Ryu.
Supervision: Keun Ho Ryu.
Validation: Tsatsral Amarbayasgalan, Kwang Ho Park, Keun Ho Ryu.
Visualization: Tsatsral Amarbayasgalan, Kwang Ho Park, Jong Yun Lee, Keun Ho Ryu.
Writing – original draft: Tsatsral Amarbayasgalan, Kwang Ho Park.
Writing – review & editing: Tsatsral Amarbayasgalan, Kwang Ho Park.
References1. World Health Organization (WHO): Cardiovascular diseases (CVDs); 2017. Available from: http://www.
who.int/news-room/factsheets/detail/cardiovascular-diseases-(cvds).
2. Statistics Korea: Causes of Death Statistics in 2017; 2017. Available from: http://kostat.go.kr/portal/
eng/pressReleases/1/index.board.
3. Ornish D, Scherwitz LW, Billings JH, Gould KL, Merritt TA, Sparler S, et al. Intensive lifestyle changes
for reversal of coronary heart disease. Jama. 1998; 280(23):2001–2007. https://doi.org/10.1001/jama.
280.23.2001 PMID: 9863851
4. Hu FB, Stampfer MJ, Manson JE, Grodstein F, Colditz GA, Speizer FE, et al. Trends in the incidence of
coronary heart disease and changes in diet and lifestyle in women. New England Journal of Medicine.
2000; 343(8):530–537. https://doi.org/10.1056/NEJM200008243430802 PMID: 10954760
5. Hausmann H, Topp H, Siniawski H, Holz S, Hetzer R. Decision-making in end-stage coronary artery dis-
ease: revascularization or heart transplantation? The Annals of thoracic surgery. 1997; 64(5):1296–
1302. https://doi.org/10.1016/S0003-4975(97)00805-9 PMID: 9386693
6. Ryu KS, Park HW, Park SH, Shon HS, Ryu KH, Lee DG, et al. Comparison of clinical outcomes
between culprit vessel only and multivessel percutaneous coronary intervention for ST-segment eleva-
tion myocardial infarction patients with multivessel coronary diseases. Journal of geriatric cardiology:
JGC. 2015; 12(3):208. https://doi.org/10.11909/j.issn.1671-5411.2015.03.014 PMID: 26089843
Reconstruction error based deep neural networks for coronary heart disease risk prediction
PLOS ONE | https://doi.org/10.1371/journal.pone.0225991 December 5, 2019 15 / 17
7. Diamond GA, Forrester JS. Analysis of probability as an aid in the clinical diagnosis of coronary-artery
disease. New England Journal of Medicine. 1979; 300(24):1350–1358. https://doi.org/10.1056/
NEJM197906143002402 PMID: 440357
8. Ryu KS, Bae JW, Jeong MH, Cho MC, Ryu KH, Investigators KAMIR, et al. Risk Scoring System for
Prognosis Estimation of Multivessel Disease Among Patients with ST-Segment Elevation Myocardial
Infarction. International heart journal. 2019; 60(3):708–714. https://doi.org/10.1536/ihj.17-337 PMID:
31105140
9. Heart Foundation: What is coronary heart disease?;. Available from: https://www.heartfoundation.org.
au/your-heart/heart-conditions/what-is-coronary-heart-disease.
10. Kurt I, Ture M, Kurum AT. Comparing performances of logistic regression, classification and regression
tree, and neural networks for predicting coronary artery disease. Expert systems with applications.
2008; 34(1):366–374. https://doi.org/10.1016/j.eswa.2006.09.004
11. Kim H, Ishag M, Piao M, Kwon T, Ryu K. A data mining approach for cardiovascular disease diagnosis
using heart rate variability and images of carotid arteries. Symmetry. 2016; 8(6):47. https://doi.org/10.
3390/sym8060047
12. Soni J, Ansari U, Sharma D, Soni S. Predictive data mining for medical diagnosis: An overview of heart
disease prediction. International Journal of Computer Applications. 2011; 17(8):43–48. https://doi.org/
10.5120/2237-2860
13. Lee HG, Kim WS, Noh KY, Shin JH, Yun U, Ryu KH. Coronary artery disease prediction method using
linear and nonlinear feature of heart rate variability in three recumbent postures. Information Systems
Frontiers. 2009; 11(4):419–431. https://doi.org/10.1007/s10796-009-9155-2
14. Atkov OY, Gorokhova SG, Sboev AG, Generozov EV, Muraseyeva EV, Moroshkina SY, et al. Coronary
heart disease diagnosis by artificial neural networks including genetic polymorphisms and clinical
parameters. Journal of cardiology. 2012; 59(2):190–194. https://doi.org/10.1016/j.jjcc.2011.11.005
PMID: 22218324
15. El-Bialy R, Salamay M, Karam O, Khalifa M. Feature analysis of coronary artery heart disease data
sets. Procedia Comput Sci 65: 459–468. Go to original source. 2015. https://doi.org/10.1016/j.procs.
2015.09.132
16. Lim K, Lee BM, Kang U, Lee Y. An optimized DBN-based coronary heart disease risk prediction. Inter-
national Journal of Computers Communications & Control. 2018; 13(4):492–502. https://doi.org/10.
15837/ijccc.2018.4.3269
17. Pang-Ning Tan K V Steinbach Micheal. Introduction to data mining. India: Pearson Education; 2007.
18. Kim J, Lee J, Lee Y. Data-mining-based coronary heart disease risk prediction model using fuzzy logic
and decision tree. Healthcare informatics research. 2015; 21(3):167–174. https://doi.org/10.4258/hir.
2015.21.3.167 PMID: 26279953
19. Kim JK, Kang S. Neural network-based coronary heart disease risk prediction using feature correlation
analysis. Journal of healthcare engineering. 2017; 2017. https://doi.org/10.1155/2017/2780501
20. Kim J, Kang U, Lee Y. Statistics and deep belief network-based cardiovascular risk prediction. Health-
care informatics research. 2017; 23(3):169–175. https://doi.org/10.4258/hir.2017.23.3.169 PMID:
28875051
21. Zong B, Song Q, Min MR, Cheng W, Lumezanu C, Cho D, et al. Deep autoencoding gaussian mixture
model for unsupervised anomaly detection. In: Proceedings of the sixth International Conference on
Learning Representations. Vancouver, Canada; 2018.
22. Kim H, Hirose A. Unsupervised fine land classification using quaternion autoencoder-based polarization
feature extraction and self-organizing mapping. IEEE Transactions on Geoscience and Remote Sens-
ing. 2017; 56(3):1839–1851. https://doi.org/10.1109/TGRS.2017.2768619
23. Pochet N, De Smet F, Suykens JA, De Moor BL. Systematic benchmarking of microarray data classifi-
cation: assessing the role of non-linearity and dimensionality reduction. Bioinformatics. 2004; 20
(17):3185–3195. https://doi.org/10.1093/bioinformatics/bth383 PMID: 15231531
24. Amarbayasgalan T, Jargalsaikhan B, Ryu K. Unsupervised novelty detection using deep autoenco-
ders with density based clustering. Applied Sciences. 2018; 8(9):1468. https://doi.org/10.3390/
app8091468
25. Liou CY, Cheng WC, Liou JW, Liou DR. Autoencoder for words. Neurocomputing. 2014; 139:84–96.
https://doi.org/10.1016/j.neucom.2013.09.055
26. Guo Y, Liu Y, Oerlemans A, Lao S, Wu S, Lew MS. Deep learning for visual understanding: A review.
Neurocomputing. 2016; 187:27–48. https://doi.org/10.1016/j.neucom.2015.09.116
27. Gevrey M, Dimopoulos I, Lek S. Review and comparison of methods to study the contribution of vari-
ables in artificial neural network models. Ecological modelling. 2003; 160(3):249–264. https://doi.org/
10.1016/S0304-3800(02)00257-0
Reconstruction error based deep neural networks for coronary heart disease risk prediction
PLOS ONE | https://doi.org/10.1371/journal.pone.0225991 December 5, 2019 16 / 17
28. Korea Centers for Disease Control and Prevention: Korea National Health and Nutrition Examination
Survey (KNHANES-V, VI);. Available from: https://knhanes.cdc.go.kr/knhanes/main.do.
29. Heo BM, Ryu KH. Prediction of Prehypertenison and Hypertension Based on Anthropometry, Blood
Parameters, and Spirometry. International journal of environmental research and public health. 2018;
15(11):2571. https://doi.org/10.3390/ijerph15112571
30. Kim Y. The Korea National Health and nutrition examination survey (KNHANES): current status and
challenges. Epidemiology and health. 2014; 36. https://doi.org/10.4178/epih/e2014002
31. Greenland P, LaBree L, Azen SP, Doherty TM, Detrano RC. Coronary artery calcium score combined
with Framingham score for risk prediction in asymptomatic individuals. Jama. 2004; 291(2):210–215.
https://doi.org/10.1001/jama.291.2.210 PMID: 14722147
32. Anyanwu MN, Shiva SG. Comparative analysis of serial decision tree classification algorithms. Interna-
tional Journal of Computer Science and Security. 2009; 3(3):230–240.
33. Breiman L. Random forests. Machine learning. 2001; 45(1):5–32. https://doi.org/10.1023/
A:1010933404324
34. Zaki MJ, Meira W Jr, Meira W. Data mining and analysis: fundamental concepts and algorithms. Cam-
bridge University Press; 2014.
35. Kingma DP, Ba J. Adam: A method for stochastic optimization. arXiv preprint arXiv:14126980. 2014.
36. Hanley JA, McNeil BJ. The meaning and use of the area under a receiver operating characteristic
(ROC) curve. Radiology. 1982; 143(1):29–36. https://doi.org/10.1148/radiology.143.1.7063747 PMID:
7063747
Reconstruction error based deep neural networks for coronary heart disease risk prediction
PLOS ONE | https://doi.org/10.1371/journal.pone.0225991 December 5, 2019 17 / 17