The evolution of error: error management, cognitive constraints, and adaptive decision-making biases
Upload
khangminh22Category
view
0download
0
First Semester Physics Lab(P141)
1
Location of the Lab: First floor (Chemistry Building)
Error Analysis
Study and evaluation of uncertainty in
measurement
SANTOSH BABU

Error?
Measured: g = 9.7 m/sec2
3
Relative error
=
Measurement Error? (how well do you know your measurement of
g = 9.7 m/sec2. Do you know it exactly 9.7 m/sec2 ? )
Theory: g = 9.8 m/sec2

Accuracy and Precision
The accuracy of a measurement
system is the degree of closeness
of measurements of a quantity
• to its true (actual) value.
• The precision of a measurement
system, also called reproducibility,
is the degree to which repeated
measurements under unchanged
conditions show the same results
4
9.8
m/s
ec2
9.7 m/sec2
How about the precision ?

What is the weight?
5
Weight= 50.8
0.05 kg
Least count = 0.1 kg

Errors in measurement
All digital measuring devices has
maximum uncertainty of the order
of half its last digit. i.e. uncertainty
is
0.005 Volts. Thus, assuming the
voltmeter is calibrated accurately, the
value is 12.880
0.005 V.
length of pencil is close to 36 mm.
best estimate = 36.0 mm
Probable range 35.5 to 36.5 mm
Therefore, l = 36.0
0.5 mm
6

Importance of uncertainty
Measurement by Dhoni and Kohli
DHONI best estimate is 15;
probable range:13.5 to 16.5 gm/cm3
KOHLI best estimate is 13.9 and
probable range:13.7 to 14.1 gm/cm3
ERROR BAR
7
Density of gold = 15.5 gm/cm3
Density of alloy = 13.8 gm/cm3

Types of experimental errors
• Systematic error: A clock running consistently 5% late. Hard to detect. Errors of this type affect all measurements in same way. They may result from faulty calibration or bias on part of the observer.
• Random Error: Fluctuation in observations. These errors can be reduced only by repeated measurements. Reducing them is essentially one of improving experimental method and refining techniques.
8

Precise with systematic error
9
0 2 4 6 8 102
4
6
8
10
12
14
16
18
measured data
true values
Y
X

Precise with ?
0 2 4 6 8 102
4
6
8
10
12
14
measured data
true values
Y
X10
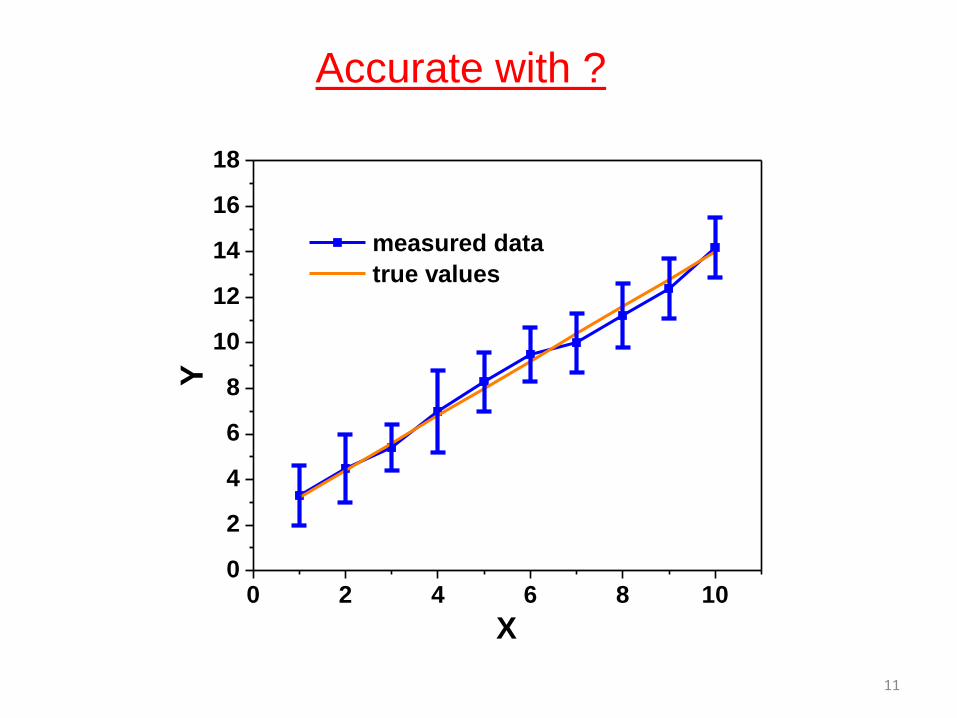
Accurate with ?
11
0 2 4 6 8 100
2
4
6
8
10
12
14
16
18
measured data
true values
Y
X

What is the total weight?
12
Total weight = weight left side (p)+ weight right side (q)
Total weight = (31.10±0.05)+(31.30±0.05) kg

Maximum probable error in difference and
sum
(Measured p) = pbest
δp
(Measured q) = qbest
δq
Best estimate for (p+q) is (pbest + qbest )
Highest probable value = (pbest + qbest ) + (δp + δq)
Lowest probable value = (pbest + qbest ) - (δp + δq)
Uncertainty in the difference (p-q) is also equal to the sum (δp + δq) of the original uncertainties.
13

Fractional or Relative uncertainty
Fractional uncertainty =
Length l = 50
1 cm
Fractional uncertainty
14

Relative errors of products and
ratio of two variables
15

Summary: Two Simple Rules
16

Why to improve addition rule?
17
x=5.3+0.2 cm
y=7.5-0.2 cm
y=7.5+0.2 cm
δx= 0.2 cm, probability of δy is 0.2 is 0.5

Propagation of errors
18

Propagation of errors
19

Propagation of errors
20

General formula
General formula for propagation of error:
If q=q(xi, xi+1 . . . . ., xn), then
(Provided all errors are independent and random)
For q = xn fractional uncertainty is
21

How to use general formula?
22

Propagation of errors
23

Systematic and Random Errors
24

Systematic and Random Errors
Real experiment 25

Statistical Analysis of Random Errors
26

Statistical Analysis of Random Errors
27

28

29

Summary
Systematic error: Reproducible inaccuracy introduced by faulty
equipment, calibration or technique.
Random error: Indefiniteness of result introduced by finite precision
of measurement or statistical variations. Measure of fluctuation after
repeated experimentation.
Uncertainty: Magnitude of error that is estimated to have been
made in determination of results.
Accuracy: Measure of how close the result of an experiment comes
to the “true” value.
Precision: Measure of how carefully the result is determined without
reference to any “true” value.
30

Summary-propagation of errors
General formula for propagation of error: If q=q(xi,xi+1 . . . . .,xn) is any function of xi,xi+1 . . . . .,xn, then (Provided all errors are independent and random)
31

Summary-statistical error
Statistical Error: If xi, xi+1 . . . . .,xn are N measurements of the same
quantity x, all using the same method. If all the uncertainties are
random and small,
The best estimate of x (mean)
The average uncertainty of individual xi,xi+1 . . . . .,xn is given by
standard deviation, or SD:
32

Estimate and Try to keep error small
Source: http://antongerdelan.net/teaching/vis/datareps
33

Qualitative Error in Slope
34

35
Suppose you have measurement of (x1,y1), (x2,y2)…….(xN, yN) and you want to fit it with best straight line y=Bx +A
For this one has to minimize the χ2 defines as
Straight line fit

36
An example of best line fit
Suppose a spring is hanging vertically and you put different mass on the bottom of
spring. The spring will extend to different lengths. Here mass is like “x” and the
length the spring extends is “y”.

37
An example of best line fit (cont.)
Intercept, A
Slope, B

38
Semester & next two weeks plan • There are nine experiments total in this semester.
• The lab manuals are on Physics Dept website
http://physics.niser.ac.in/act.php (under lab manual in semester-I (P-141)
• Read the lab manual before coming to class
• There will be lab teacher, scientists, PhD students and lab operator
to help you during lab class.
Next two weeks Plan:
• You will do two experiments in next two weeks. Everybody will do the same two
experiments to know how to use error analysis properly. You will submit the
report of these two experiments also and it will be graded
• In the first week first 50 students will do expt-I and the other 50 will do expt-II.
• In the second week, it will be swapped.

Expt.1 : Error Analysis Training
• ‘g’ by free fall
• You measure the time ‘T’ of free fall large number of times T1, T2, ........TN
• Calculate corresponding the ‘g1,g2 ..... gN’
• Find the mean ‘g’ and standard deviation in ‘g’
• Report the ‘g’ value with measurement error
• Is there any systematic error?
39

Expt.2: Error Analysis Training
• Volume of the metal bar • Determine the least count of vernier calipers,
screw gauze and travelling microscope • Measure length, breadth and thickness of metal
bar using vernier calipers and screw gauze • Calculate volume and calculate error in volume
by using error propagation formula • Use travelling microscope to find the volume of
metal bar by measuring the volume change of water
40

Reference
A Practical Guide to Data Analysis for Physical Science Students: Louis Lyons
Data Reduction and Error Analysis:
P. R. Bevington and D. K. Robinson
Practical Physics: G L Squires
41
Additional References
An Introduction to Error Analysis:
John R. Taylor

List of Experiments
• ‘g’ by compound pendulum
• Young’s modulus by bending of a beam
• Specific heat of Graphite
• Thermal conductivity of a poor conductor
• Viscosity of liquids by falling ball method
• Surface tension by capillary rise method
• Determination of ‘J’, Joule constant by electrical method
• Standing waves and spring constant of a soft massive spring
• Moment of Inertia of different bodies
42

Lab Evaluation P141
43
(1)Weekly Lab work and report submission (50 marks) -> Aim of the experiment (one or two lines) -> Theoretical introduction, what formula used, apparatus, diagrams -> Data (table) -> Analysis (plots, error calculations) -> Summary/Conclusion (2) Viva (20 marks) (3) Final Examination (30 marks) You will be given one of the experiments which you performed in the laboratory during semester, in the final exam

Lab Evaluation P141
44
(1)Weekly Lab work and report submission (50) -> If you perform a experiment this week, you need to submit the report the following week (at the beginning of lab class) So, you have one week to prepare your lab report. -> If you miss to submit the report in the following lab, 50% of the lab report mark will be taken off -> If you submit the report after 2 weeks, 75% will be taken off. -> After 2 weeks, Lab reports will not be accepted. (in case you are sick or you have any other reason that stops you from submitting report or performing lab, send email to your TA’s/ Teacher before lab class, not after)
Copyright © 2022 FDOKUMEN