Relationship of epicardial fat volume to coronary plaque, severe coronary stenosis, and high-risk...
8
Original Research Article Relationship of epicardial fat volume to coronary plaque, severe coronary stenosis, and high-risk coronary plaque features assessed by coronary CT angiography Ronak Rajani DM, MRCP a,b , Haim Shmilovich MD a,b , Ryo Nakazato PhD, MD a,b , Rine Nakanishi PhD, MD a,b , Yuka Otaki PhD, MD a,b , Victor Y. Cheng MD a,b , Sean W. Hayes MD a,b , Louise E.J. Thomson MBChB a,b , John D. Friedman MD a,b , Piotr J. Slomka PhD a,b , James K. Min MD a,b , Daniel S. Berman MD a,b , Damini Dey PhD c, * a Department of Imaging, Cedars-Sinai Medical Center, Cedars-Sinai Heart Institute, 8700 Beverly Blvd., Los Angeles, CA 90048, USA b Department of Medicine, Cedars-Sinai Medical Center, Cedars-Sinai Heart Institute, 8700 Beverly Blvd., Los Angeles, CA 90048, USA c Biomedical Imaging Research Institute, Department of Biomedical Sciences, Cedars-Sinai Medical Center, 8700 Beverly Blvd., Los Angeles, CA 90048, USA article info Article history: Received 8 November 2012 Received in revised form 15 January 2013 Accepted 21 February 2013 Keywords: Epicardial fat volume Coronary computed tomography angiography Coronary artery stenosis High-risk plaque features abstract Background: Associations of epicardial fat volume (EFV) measured on noncontrast cardiac CT (NCT) include coronary plaque, myocardial ischemia, and adverse cardiac events. Objectives: This study aimed to define the relationship of EFV to coronary plaque type, severe coronary stenosis, and the presence of high-risk plaque features (HRPFs). Methods: We retrospectively evaluated 402 consecutive patients, with no prior history of coronary artery disease, who underwent same day NCT and coronary CT angiography (CTA). EFV was measured on NCT with the use of validated, semiautomated software. The coronary arteries were evaluated for coronary plaque type (calcified [CP], noncalcified [NCP], or partially calcified [PCP]) and coronary stenosis severity 70% with the use of coronary CTA. For patients with NCP and PCP, 2 high-risk plaque features were evaluated: low-attenuation plaque and positive remodeling. Results: There were 402 patients with a median age of 66 years (range, 23e92 years) of whom 226 (56%) were men. The EFV was greater in patients with CP (112 55 cm 3 vs 89 39 cm 3 ), PCP (110 57 cm 3 vs 98 45 cm 3 ), and NCP (115 44 cm 3 vs EFV 100 52 cm 3 ). In the 192 patients with PCP or NCP, on multivariable analysis, after adjusting for conventional cardiovascular risk factors, EFV was an independent predictor of 70% coronary artery stenosis (odds ratio [OR], 3.0; 95% CI, 1.3e6.6; P ¼ 0.008), any high-risk plaque features (OR, 1.7; 95% CI, 0.9e3.4; P ¼ 0.04), and low attention plaque (OR, 2.4; 95% CI, 1.1e5.1; P ¼ 0.02) but not of positive remodeling. Conclusions: EFV is greater in patients with CP, PCP, and NCP. In patients with NCP and PCP, EFV is significantly associated with severe coronary stenosis, high-risk plaque features, and low attenuation plaque. ª 2013 Society of Cardiovascular Computed Tomography. All rights reserved. Conflict of interests: The authors report no conflict of interest. * Corresponding author. E-mail address: [email protected] (D. Dey). Available online at www.sciencedirect.com journal homepage: www.JournalofCardiovascularCT.com Journal of Cardiovascular Computed Tomography 7 (2013) 125 e132 1934-5925/$ e see front matter ª 2013 Society of Cardiovascular Computed Tomography. All rights reserved. http://dx.doi.org/10.1016/j.jcct.2013.02.003
-
Upload
independent -
Category
Documents
-
view
2 -
download
0
Transcript of Relationship of epicardial fat volume to coronary plaque, severe coronary stenosis, and high-risk...
ww.sciencedirect.com
J o u rn a l o f C a r d i o v a s c u l a r C om p u t e d T omog r a p h y 7 ( 2 0 1 3 ) 1 2 5e1 3 2
Available online at w
journal homepage: www.JournalofCardiovascularCT.com
Original Research Article
Relationship of epicardial fat volume to coronary plaque,severe coronary stenosis, and high-risk coronary plaquefeatures assessed by coronary CT angiography
Ronak Rajani DM, MRCPa,b, Haim Shmilovich MDa,b, Ryo Nakazato PhD, MDa,b,Rine Nakanishi PhD, MDa,b, Yuka Otaki PhD, MDa,b, Victor Y. Cheng MDa,b,Sean W. Hayes MDa,b, Louise E.J. Thomson MBChBa,b, John D. Friedman MDa,b,Piotr J. Slomka PhDa,b, James K. Min MDa,b, Daniel S. Berman MDa,b, Damini Dey PhDc,*aDepartment of Imaging, Cedars-Sinai Medical Center, Cedars-Sinai Heart Institute, 8700 Beverly Blvd., Los Angeles, CA 90048, USAbDepartment of Medicine, Cedars-Sinai Medical Center, Cedars-Sinai Heart Institute, 8700 Beverly Blvd., Los Angeles, CA 90048, USAcBiomedical Imaging Research Institute, Department of Biomedical Sciences, Cedars-Sinai Medical Center, 8700 Beverly Blvd., Los Angeles,
CA 90048, USA
a r t i c l e i n f o
Article history:
Received 8 November 2012
Received in revised form
15 January 2013
Accepted 21 February 2013
Keywords:
Epicardial fat volume
Coronary computed tomography
angiography
Coronary artery stenosis
High-risk plaque features
Conflict of interests: The authors report no* Corresponding author.E-mail address: [email protected] (D.
1934-5925/$ e see front matter ª 2013 Sociehttp://dx.doi.org/10.1016/j.jcct.2013.02.003
a b s t r a c t
Background: Associations of epicardial fat volume (EFV) measured on noncontrast cardiac
CT (NCT) include coronary plaque, myocardial ischemia, and adverse cardiac events.
Objectives: This study aimed to define the relationship of EFV to coronary plaque type,
severe coronary stenosis, and the presence of high-risk plaque features (HRPFs).
Methods: We retrospectively evaluated 402 consecutive patients, with no prior history of
coronary artery disease, who underwent same day NCT and coronary CT angiography
(CTA). EFV was measured on NCT with the use of validated, semiautomated software. The
coronary arteries were evaluated for coronary plaque type (calcified [CP], noncalcified
[NCP], or partially calcified [PCP]) and coronary stenosis severity �70% with the use of
coronary CTA. For patients with NCP and PCP, 2 high-risk plaque features were evaluated:
low-attenuation plaque and positive remodeling.
Results: Therewere402patientswithamedianageof66years (range,23e92years)ofwhom226
(56%)weremen.TheEFVwasgreater inpatientswithCP (112� 55 cm3vs89� 39 cm3), PCP (110
� 57 cm3 vs 98� 45 cm3), and NCP (115� 44 cm3 vs EFV 100� 52 cm3). In the 192 patients with
PCP or NCP, on multivariable analysis, after adjusting for conventional cardiovascular risk
factors, EFV was an independent predictor of �70% coronary artery stenosis (odds ratio [OR],
3.0; 95% CI, 1.3e6.6; P¼ 0.008), any high-risk plaque features (OR, 1.7; 95% CI, 0.9e3.4; P¼ 0.04),
and low attention plaque (OR, 2.4; 95% CI, 1.1e5.1; P ¼ 0.02) but not of positive remodeling.
Conclusions: EFV is greater in patients with CP, PCP, and NCP. In patients with NCP and PCP,
EFV is significantly associated with severe coronary stenosis, high-risk plaque features,
and low attenuation plaque.
ª 2013 Society of Cardiovascular Computed Tomography. All rights reserved.
conflict of interest.
Dey).ty of Cardiovascular Computed Tomography. All rights reserved.

J o u r n a l o f C a r d i o v a s c u l a r C om p u t e d T omog r a p h y 7 ( 2 0 1 3 ) 1 2 5e1 3 2126
1. Introduction
nonfasting glucose of >200 mg/dL. Family history of coronaryEpicardial fat volume (EFV), measured on noncontrast
enhanced CT (NCT), has emerged as an important parameter
in understanding the pathophysiology of coronary athero-
sclerosis. Recent studies have shown a relationship between
EFV and the presence and severity of coronary plaque as
assessed by coronary artery calcification.1,2 Furthermore,
emerging data now suggest that this parameter may be
related to myocardial ischemia,3 acute coronary syndrome,4
and also prognosis.4,5 However, despite these observations,
uncertainty remains as to how epicardial fat may exert these
detrimental effects. One potential hypothesis that has
emerged is that EFV may exert a local paracrine effect on
adjacent coronary artery segments and lead to local inflam-
mation and changes in plaque architecture.6 Supporting this
hypothesis are data showing that specific structural plaque
characteristics identified on coronary CT angiography (CTA)
are associated with culprit coronary lesions and an increased
risk of future cardiac events.7e10
Although EFV has been shown to be related to coronary
plaque11,12 and coronary stenosis,13e15 whether EFV is related
to high-risk plaque features (HRPFs) is a subject of ongoing
investigation. Oka et al16 showed an independent association
between EFV and HRPFs in patients with noncalcified coro-
nary plaques, and Schlett et al17 have shown EFV to be asso-
ciated to HRPFs in 13 patients with a high-risk coronary lesion
presenting with chest pain. The relationship between EFV and
thin-capped fibroatheroma has also been recently confirmed
on invasive coronary angiography and optical coherence
tomography.18 One area of current uncertainty is the associ-
ation of EFV to severe coronary stenosis, plaque type, and
HRPFs in patients with stable symptoms being referred for
coronary CTA. The principal aims of the present study were to
investigate the relationship of EFV to coronary plaque type,
severe coronary stenosis, and HRPFs in stable patients with
either noncalcified or partially calcified coronary plaques.
2. Methods
2.1. Patients
We retrospectively studied 402 consecutive patients who
underwent same-day coronary CTA and NCT at Cedars-Sinai
Medical Center from January 2009 through December 2009.
Patients were excluded if they had a prior history of coronary
artery disease (myocardial infarction, coronary stenting, and
prior bypass surgery), if their bodymass index (BMI; calculated
as weight divided by height; kg/m2) was beyond limits set by
mean BMI � 2 SDs, and if their image quality was not
considered good or excellent by an expert reader. Cardiovas-
cular risk factors were determined by preset criteria. Hyper-
tension was defined as a systolic blood pressure of >140 mm
Hg, a diastolic blood pressure of >90 mm Hg, or antihyper-
tensive drug use. Smoking was defined as a current smoker or
past heavy smoker (>20 package-years). Diabetes mellitus
was defined as a previously established diagnosis, insulin or
oral hypoglycemic therapy, fasting glucose of >126 mg/dL, or
artery disease was defined as myocardial infarction, coronary
revascularization, or sudden cardiac death in a first-degree
male relative <55 years or female relative aged <65 years.
EFV of all patients was measured on NCT with the use of
semiautomated quantitative software. Detailed assessment of
coronary plaque severity, type, and structural characteristics
was performed on coronary CTA images.
2.2. Nonecontrast-enhanced CT scan
All subjects underwent NCT on a on a dual-source CT scanner
(SOMATOM Definition; Siemens Medical Solutions, For-
chheim, Germany). The scan extended from the aortic arch to
the diaphragm and was obtained in a single breathhold. Heart
rateedependent electrocardiogram (ECG)etriggering was
performed, typically at 45%e60% of the R-R interval. The field
of view was 35 cm. Matrix size was 512 � 512. Tube voltage
was 120 kVpwithmultislice scanning. The slice thickness was
3 mm for electron-beam CT and 2.5 mm for multislice CT.
Each set of NCT images was evaluated for Agatston score by
an experienced reader blinded to results of epicardial fat
measurements, using semi-automatic, commercially avail-
able software (ScImage, Los Altos, CA, USA). The total Agat-
ston score was the sum of calcified plaque (CP) scores of all
coronary arteries.19
2.3. Epicardial fat quantification
Epicardial fat quantification was performed on the NCT scan
with the use of validated software (QFAT) developed at the
Cedars-Sinai Medical Center.20 Scans were presented to blin-
ded experienced readers in random order. Readers identified
the superior epicardial fat boundary at the takeoff of the right
pulmonary artery, and the inferior boundary at the first slice
where the posterior descending artery was first visualized.
Five to 10 contour points were then traced on the pericardium
at each slice from the upper slice limit to the lower slice in the
axial view (total number of slices ranged from 20 to 40 for
typical subjects). From these control points, piecewise cubic
Catmull-Rom spline functions were automatically generated
to form a smooth, closed pericardial contour (Fig. 1). The EFV
was then automatically calculated (reported in cm3), using
contiguous 3-dimensional voxels with Hounsfield units
between �190 and �30 as the range of attenuation values
defining fat.21e23 The reproducibility of QFAT software
measurement of EFV has previously been shown to be high for
both intrascanner (multidetector CT [MDCT]eMDCT) and
interscanner (electron beam CTeMDCT) data (correlation
coefficient � 0.98). The reproducibility coefficient values are
lowest (4.3% for EFV) for intrascanner same-observer
measurement. For intrascanner cross-observer measure-
ment, reproducibility values are 10.7% for EFV.24
2.4. Coronary CTA image acquisition and reconstruction
Coronary CTA was performed on a dual-source CT scanner
(SOMATOM Definition; Siemens Medical Solutions). The
imaging protocol has been previously described in detail.25,26

Figure 1 e The measurement of EFV in a patient with low (AeC) and high (DeF) EFV. The user identifies the pericardium and
places approximately 10 contour points manually on the pericardium at each slice from the upper slice limit to the lower
slice in the axial view. From these control points, the software (Q-FAT) automatically quantifies all fat voxels within the
pericardial contour (blue line) and generates the EFV (red ). EFV, epicardial fat volume.
J o u rn a l o f C a r d i o v a s c u l a r C om p u t e d T omog r a p h y 7 ( 2 0 1 3 ) 1 2 5e1 3 2 127
b-Blockadewithmetoprolol was used to achieve a heart rate of
<70 beats/min, and 0.4 mg of nitroglycerin spray (Sciele
Pharma, Alpharetta, GA, USA) was administered 3e5 minutes
before the scan. Eighty milliliters of intravenous contrast
(Omnipaque; GE Healthcare, Princeton, NJ, USA) followed by
50e80mL of saline at a rate of 5mL/swere power-injected into
the antecubital vein. Ascending aorta contrast-triggered (100
HU), ECG-gated helical scanning was then performed in
a single breathhold. Scanning parameters included heart
rateedependent pitch (0.2e0.45), gantry rotation time of 330
milliseconds, tube voltage of 100 or 120 kVp, depending on
patient BMI,26 and reference tube current of 330e350mAs. The
acquired coronary CTA datawas reconstructed inmid diastole
and at end systole with the use of 0.6-mm slice thickness
(0.75 mm if BMI was >35), 0.3-mm slice increment, 250 mm
field of view, 512 � 512 matrix, and B26f “medium-smooth”

J o u r n a l o f C a r d i o v a s c u l a r C om p u t e d T omog r a p h y 7 ( 2 0 1 3 ) 1 2 5e1 3 2128
kernel. If reconstruction from standard phases of the cardiac
cycle resulted in uninterpretable segments, additional phases
were reconstructed and analyzed.
2.5. Coronary CTA analysis
For the purposes of this research, plaque assessment on
coronary CTAwas independently performed by 2 experienced
readers with the use of axial images, oblique multiplanar
reformations, and oblique maximum intensity projections.27
Plaque type was classified into CP (plaque consisting of only
calcium), noncalcified plaque (NCP; plaque that was calcium
free), and partially calcified plaque (PCP; plaque that had
calcified and noncalcified components). Stenosis severity was
manually quantified with the luminal diameter ratio between
the sites of maximal stenosis and proximal healthy reference,
as previously reported.28 Severe coronary stenosis was
defined as �70% reduction in luminal diameter. For each NCP
and PCP, readers determined the presence of 2 HRPFs, shown
to predict subsequent adverse cardiovascular events (Fig. 2):
LAP, defined as visually distinct intraplaque hypoattenuation
that contained �30 HU, and PR, defined as maximal outer
arterial wall diameter along the plaque exceeding proximal
reference by �5% (Fig. 2). Patients were classified as having
none, 1, or 2 HRPFs. All readers were blinded to the results of
Figure 2 e The assessment of HRPFs. (A) The presence of 3
HRPFs are shown within the proximal right coronary
artery: a >70% stenosis, LAP (closed arrow), and PR at the
site of noncalcified plaque (open arrow). (B) The presence of
a proximal partially calcified plaque is shown within the
right coronary artery (open arrow) and a more distal
noncalcified plaque with a LAP component (closed arrow).
HRPFs, high-risk plaque features; LAP, low attenuation
plaque; PR, positive remodeling.
the EFV measurements. Consensus was used to resolve
discrepancies. Study quality was graded on a 5-point quali-
tative scale that ranged from uninterpretable to excellent.
Only studies graded as being good (some minor artifact
present but all coronary segments evaluable) and excellent
(no artifact present, all coronary segments evaluable) were
included in the study.
2.6. Statistical analysis
All continuous variables included in the analysis are pre-
sented as mean � SD. Variables with non-normal distribu-
tions are presented asmedianwith range. Univariate analyses
were performed on continuous variables with the use of the
2-sample t test for normally distributed variables and the
Mann-Whitney U test for non-normally distributed data. The
distribution of EFV was positively skewed; therefore, natural-
log transformed values were used throughout, unless other-
wise specified. Spearman correlation coefficient was used to
assess the relationship between continuous variables. Multi-
variable logistic regression was used to determine the
predictors of severe coronary stenosis and HRPFs with the use
of age, sex, BMI, hypertension, hypercholesterolemia, dia-
betes mellitus, active smoking, a family history of premature
coronary disease, and EFV as covariates. Statistical signifi-
cance for all analyses was set at the 5% level. All data were
collected and analyzed with SPSS for MAC version 17 (IBM,
Somers, NY, USA).
3. Results
There were 402 patients with a median age of 66 years (range,
23e92 years) of whom 226 were men (56%). Coronary CTAwas
predominantly performed for symptoms of chest pain in 227
patients (56.4%), shortness of breath in 107 (26.6%), as
a preoperative assessment in 15 (4%), and for an abnormal
resting ECG in 15 (4%). Other indications included equivocal
stress test results and prior positive Agatston scores. Table 1
shows the baseline demographics of the population. EFV
was weakly correlated to increasing age (r ¼ 0.29, P < 0.001),
BMI (r ¼ 0.42, P < 0.001), and also body surface area (r ¼ 0.39,
P< 0.001). On univariate analysis, EFVwas also greater inmen
[median (range): 102 cm3 (16e476 cm3) vs 85 cm3 (19e310 cm3);
P < 0.001], in patients with hypertension [107 cm3
(16e310 cm3) vs 81 (19e476 cm3); P < 0.001], hypercholester-
olemia [101 cm3 (30e310 cm3) vs 84 cm3 (16e476 cm3); P ¼0.001], and a prior smoking history [127 cm3 (42e266 cm3) vs
83 cm3 (16e476 cm3); P ¼ 0.007], but not in patients with dia-
betesmellitus or a significant family history of coronary artery
disease.
3.1. EFV and type of coronary artery plaque
Coronary CTA detected coronary plaques in 294 patients (73%)
and no plaques in 108 patients (27%). Calcified plaques were
present in 237 patients (59%) with a median plaque number of
3 (range, 1e12). Partially calcified coronary plaques were
present in 166 patients (41%) with a median plaque number of
2 (range, 1e8). NCPs were present in 76 patients (19%) with
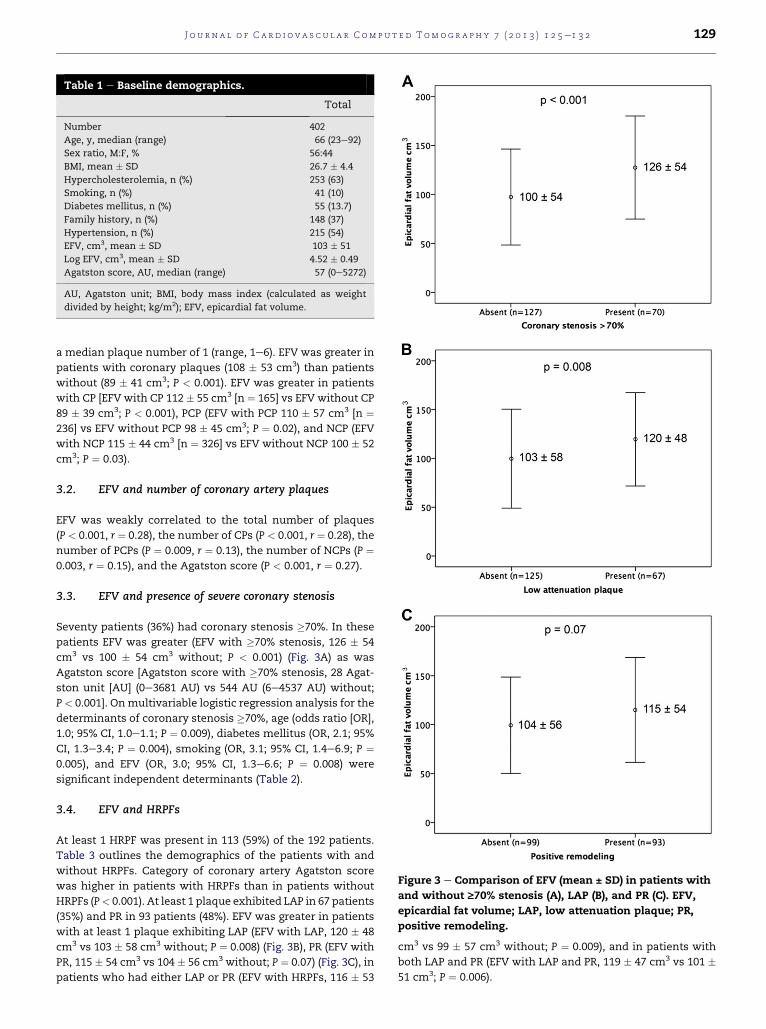
Table 1 e Baseline demographics.
Total
Number 402
Age, y, median (range) 66 (23e92)
Sex ratio, M:F, % 56:44
BMI, mean � SD 26.7 � 4.4
Hypercholesterolemia, n (%) 253 (63)
Smoking, n (%) 41 (10)
Diabetes mellitus, n (%) 55 (13.7)
Family history, n (%) 148 (37)
Hypertension, n (%) 215 (54)
EFV, cm3, mean � SD 103 � 51
Log EFV, cm3, mean � SD 4.52 � 0.49
Agatston score, AU, median (range) 57 (0e5272)
AU, Agatston unit; BMI, body mass index (calculated as weight
divided by height; kg/m2); EFV, epicardial fat volume.
Figure 3 e Comparison of EFV (mean ± SD) in patients with
and without ‡70% stenosis (A), LAP (B), and PR (C). EFV,
epicardial fat volume; LAP, low attenuation plaque; PR,
positive remodeling.
J o u rn a l o f C a r d i o v a s c u l a r C om p u t e d T omog r a p h y 7 ( 2 0 1 3 ) 1 2 5e1 3 2 129
a median plaque number of 1 (range, 1e6). EFV was greater in
patients with coronary plaques (108 � 53 cm3) than patients
without (89 � 41 cm3; P < 0.001). EFV was greater in patients
with CP [EFV with CP 112 � 55 cm3 [n ¼ 165] vs EFV without CP
89 � 39 cm3; P < 0.001), PCP (EFV with PCP 110 � 57 cm3 [n ¼236] vs EFV without PCP 98 � 45 cm3; P ¼ 0.02), and NCP (EFV
with NCP 115 � 44 cm3 [n ¼ 326] vs EFV without NCP 100 � 52
cm3; P ¼ 0.03).
3.2. EFV and number of coronary artery plaques
EFV was weakly correlated to the total number of plaques
(P < 0.001, r ¼ 0.28), the number of CPs (P < 0.001, r ¼ 0.28), the
number of PCPs (P ¼ 0.009, r ¼ 0.13), the number of NCPs (P ¼0.003, r ¼ 0.15), and the Agatston score (P < 0.001, r ¼ 0.27).
3.3. EFV and presence of severe coronary stenosis
Seventy patients (36%) had coronary stenosis �70%. In these
patients EFV was greater (EFV with �70% stenosis, 126 � 54
cm3 vs 100 � 54 cm3 without; P < 0.001) (Fig. 3A) as was
Agatston score [Agatston score with �70% stenosis, 28 Agat-
ston unit [AU] (0e3681 AU) vs 544 AU (6e4537 AU) without;
P< 0.001]. Onmultivariable logistic regression analysis for the
determinants of coronary stenosis �70%, age (odds ratio [OR],
1.0; 95% CI, 1.0e1.1; P ¼ 0.009), diabetes mellitus (OR, 2.1; 95%
CI, 1.3e3.4; P ¼ 0.004), smoking (OR, 3.1; 95% CI, 1.4e6.9; P ¼0.005), and EFV (OR, 3.0; 95% CI, 1.3e6.6; P ¼ 0.008) were
significant independent determinants (Table 2).
3.4. EFV and HRPFs
At least 1 HRPF was present in 113 (59%) of the 192 patients.
Table 3 outlines the demographics of the patients with and
without HRPFs. Category of coronary artery Agatston score
was higher in patients with HRPFs than in patients without
HRPFs (P< 0.001). At least 1 plaque exhibited LAP in 67 patients
(35%) and PR in 93 patients (48%). EFV was greater in patients
with at least 1 plaque exhibiting LAP (EFV with LAP, 120 � 48
cm3 vs 103 � 58 cm3 without; P ¼ 0.008) (Fig. 3B), PR (EFV with
PR, 115 � 54 cm3 vs 104 � 56 cm3 without; P ¼ 0.07) (Fig. 3C), in
patients who had either LAP or PR (EFV with HRPFs, 116 � 53
cm3 vs 99 � 57 cm3 without; P ¼ 0.009), and in patients with
both LAP and PR (EFV with LAP and PR, 119 � 47 cm3 vs 101 �51 cm3; P ¼ 0.006).

Table 2 e Multivariable logistic regression analysis forthe prediction of severe coronary stenosis (‡70%).
Odds ratio 95% CI P value
Age 1.0 1.0e1.1 0.009
BMI 1.0 0.9e1.0 0.3
Diabetes mellitus 2.1 1.3e3.4 0.004
Hypercholesterolemia 1.9 0.9e3.6 0.1
Smoking 3.1 1.4e6.9 0.005
Family history 1.0 0.6e1.9 0.9
Hypertension 1.3 0.7e2.4 0.4
Log EFV 3.0 1.3e6.6 0.008
BMI, body mass index (calculated as weight divided by height;
kg/m2); EFV, epicardial fat volume.
J o u r n a l o f C a r d i o v a s c u l a r C om p u t e d T omog r a p h y 7 ( 2 0 1 3 ) 1 2 5e1 3 2130
On multivariable logistic regression analysis for the
determinants of having at least 1 HRPF, diabetes mellitus,
hypercholesterolemia, and EFV were significantly associated
with having an HRPF (OR, 1.7; 95% CI, 0.9e3.4; P ¼ 0.038). For
LAP, diabetesmellitus and EFVwere independently associated
to LAP (OR, 2.4; 95% CI, 1.1e5.1; P ¼ 0.02). For PR, EFV was not
associated to the presence of PR. For both LAP and PR, diabetes
mellitus, smoking, hypertension, and EFV were significantly
associated with having both HRPFs (OR, 2.6; 95% CI, 1.1e6.2;
P ¼ 0.03) (Table 4).
4. Discussion
In the present study we show that EFV is greater in patients
with CP, PCP, and also NCP. Furthermore, we show that EFV is
associated with severe coronary stenosis (�70%) and also to
HRPFs in patients with NCP or PCP when clinical characteris-
tics and BMI are accounted for.
Table 3 e Comparison of risk factors in patients with andwithout HRPFs.
HRPFs(e)
HRPFs(þ)
Pvalue
Number 289 113
Age, y, median (range) 63 (23e92) 66 (41e87) 0.01
BMI, mean � SD 26.5 � 4.5 26.9 � 4.1 0.3
Hypercholesterolemia, n (%) 169 (59) 84 (74.3) 0.003
Smoking, n (%) 25 (8.7) 16 (14.2) 0.1
Diabetes mellitus, n (%) 31 (11.1) 23 (20.3) 0.01
Family history, n (%) 108 (37.4) 40 (35.4) 0.7
Hypertension, n (%) 148 (51.2) 67 (59.3) 0.1
EFV, cm3, mean � SD 98 � 50 116 � 53 <0.001
Log EFV, cm3, mean � SD 4.5 � 0.5 4.7 � 0.4 <0.001
Agatston score, AU,
median (range)
18 (0e5272) 268 (0e2600) <0.001
Agatston score category <0.001
0 AU, n (%) 110 (38) 4 (4)
1e99 AU, n (%) 84 (29) 29 (26)
100e399 AU, n (%) 53 (18) 35 (31)
>400 AU, n (%) 42 (15) 45 (30)
AU, Agatston unit; BMI, body mass index (calculated as weight
divided by height; kg/m2); EFV, epicardial fat volume.
4.1. Association of EFV to coronary disease
We found sizeable differences in EFV in patients who showed
any type of coronary plaque and also in patients who had
a significant coronary stenosis �70%. These findings are
consistent with prior studies that have suggested that EFV is
associated with significant coronary disease. Iwasaki et al14
measured EFV in 197 patients who underwent 64-slice coro-
nary CTA and observed on univariate analysis greater EFV in
patients with significant coronary stenosis (�50%) than
patients without significant coronary stenosis. Wang et al15
showed that epicardial fat thickness within the left atrioven-
tricular groove was independently related to the extent and
severity of significant coronary artery disease (� 50%), and
Ueno et al29 have shown that EFV is related independently to
chronic total occlusions. This finding supports the hypothesis
that EFV is associated to not only the presence of coronary
plaque disease but also its severity.
4.2. Association of EFV to HRPFs
Evidence is now emerging that EFV, as well as being associ-
ated with atherosclerosis and plaque composition,30 is asso-
ciated with adverse outcome. Studies have shown that EFV is
associated with acute coronary syndrome,4 myocardial
ischemia,3,13 and also cardiac events.5,14 Despite this, uncer-
tainty remains as to how exactly EFV exerts its detrimental
effect. A potential explanation is that EFV causes a local
inflammatory response on adjacent coronary arterial
segments that may in turn mediate atherosclerosis. In the
present study we therefore examined whether EFV was
related to the plaque characteristics of positive remodeling
and low attenuation plaque. These 2 features on coronary CTA
are considered to be HRPFs by virtue of their association with
acute and future coronary events.7e10 After adjusting for
conventional cardiovascular risk factors and BMI, we found
that EFV was related to having at least 1 HRPF, 2 HRPFs, and
also LAP. Our findings are consistent with prior published
work. Schlett et al17 evaluated the relationship of EFV to high-
risk coronary lesions in 358 patients presenting with acute
chest pain. The researchers defined a high-risk coronary
lesion as one having a �50% luminal narrowing and at least 2
high-risk plaque features (from PR, LAP, and spotty calcifica-
tion). In the 13 patients with a high-risk coronary lesion the
researchers showed an independent association to EFV after
adjusting for conventional cardiovascular risk factors and
BMI, but not for Agatston score. In another study, Oka et al16
additionally studied 357 patients undergoing coronary CTA
and examined the relationship of EFV to NCP characteristics.
The researchers showed that EFV was related to PR and LAP
after adjusting for conventional cardiovascular risk factors
and coronary artery Agatston score. In contrast to the present
study, the researchers did not examine PCPs as well as NCPs.
Recently, Ito et al18 have also shown that EFV measured on
cardiac CT is associated with thin-capped fibroatheroma
detected by invasive optical coherence tomography and also
to patients with acute coronary syndrome. The findings from
these studies suggest a possible relationship between EFV and
high-risk plaque structure, which in turn may explain the
observations that EFV is elevated in patients experiencing
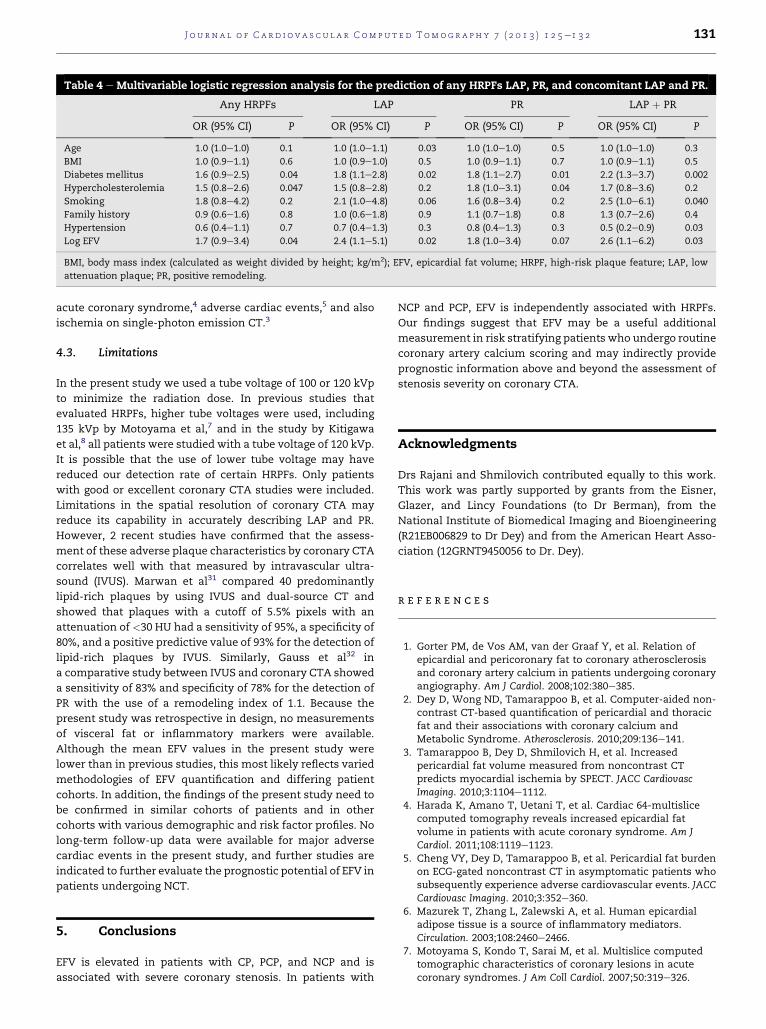
Table 4 e Multivariable logistic regression analysis for the prediction of any HRPFs LAP, PR, and concomitant LAP and PR.
Any HRPFs LAP PR LAP þ PR
OR (95% CI) P OR (95% CI) P OR (95% CI) P OR (95% CI) P
Age 1.0 (1.0e1.0) 0.1 1.0 (1.0e1.1) 0.03 1.0 (1.0e1.0) 0.5 1.0 (1.0e1.0) 0.3
BMI 1.0 (0.9e1.1) 0.6 1.0 (0.9e1.0) 0.5 1.0 (0.9e1.1) 0.7 1.0 (0.9e1.1) 0.5
Diabetes mellitus 1.6 (0.9e2.5) 0.04 1.8 (1.1e2.8) 0.02 1.8 (1.1e2.7) 0.01 2.2 (1.3e3.7) 0.002
Hypercholesterolemia 1.5 (0.8e2.6) 0.047 1.5 (0.8e2.8) 0.2 1.8 (1.0e3.1) 0.04 1.7 (0.8e3.6) 0.2
Smoking 1.8 (0.8e4.2) 0.2 2.1 (1.0e4.8) 0.06 1.6 (0.8e3.4) 0.2 2.5 (1.0e6.1) 0.040
Family history 0.9 (0.6e1.6) 0.8 1.0 (0.6e1.8) 0.9 1.1 (0.7e1.8) 0.8 1.3 (0.7e2.6) 0.4
Hypertension 0.6 (0.4e1.1) 0.7 0.7 (0.4e1.3) 0.3 0.8 (0.4e1.3) 0.3 0.5 (0.2e0.9) 0.03
Log EFV 1.7 (0.9e3.4) 0.04 2.4 (1.1e5.1) 0.02 1.8 (1.0e3.4) 0.07 2.6 (1.1e6.2) 0.03
BMI, body mass index (calculated as weight divided by height; kg/m2); EFV, epicardial fat volume; HRPF, high-risk plaque feature; LAP, low
attenuation plaque; PR, positive remodeling.
J o u rn a l o f C a r d i o v a s c u l a r C om p u t e d T omog r a p h y 7 ( 2 0 1 3 ) 1 2 5e1 3 2 131
acute coronary syndrome,4 adverse cardiac events,5 and also
ischemia on single-photon emission CT.3
4.3. Limitations
In the present study we used a tube voltage of 100 or 120 kVp
to minimize the radiation dose. In previous studies that
evaluated HRPFs, higher tube voltages were used, including
135 kVp by Motoyama et al,7 and in the study by Kitigawa
et al,8 all patients were studied with a tube voltage of 120 kVp.
It is possible that the use of lower tube voltage may have
reduced our detection rate of certain HRPFs. Only patients
with good or excellent coronary CTA studies were included.
Limitations in the spatial resolution of coronary CTA may
reduce its capability in accurately describing LAP and PR.
However, 2 recent studies have confirmed that the assess-
ment of these adverse plaque characteristics by coronary CTA
correlates well with that measured by intravascular ultra-
sound (IVUS). Marwan et al31 compared 40 predominantly
lipid-rich plaques by using IVUS and dual-source CT and
showed that plaques with a cutoff of 5.5% pixels with an
attenuation of <30 HU had a sensitivity of 95%, a specificity of
80%, and a positive predictive value of 93% for the detection of
lipid-rich plaques by IVUS. Similarly, Gauss et al32 in
a comparative study between IVUS and coronary CTA showed
a sensitivity of 83% and specificity of 78% for the detection of
PR with the use of a remodeling index of 1.1. Because the
present study was retrospective in design, no measurements
of visceral fat or inflammatory markers were available.
Although the mean EFV values in the present study were
lower than in previous studies, this most likely reflects varied
methodologies of EFV quantification and differing patient
cohorts. In addition, the findings of the present study need to
be confirmed in similar cohorts of patients and in other
cohorts with various demographic and risk factor profiles. No
long-term follow-up data were available for major adverse
cardiac events in the present study, and further studies are
indicated to further evaluate the prognostic potential of EFV in
patients undergoing NCT.
5. Conclusions
EFV is elevated in patients with CP, PCP, and NCP and is
associated with severe coronary stenosis. In patients with
NCP and PCP, EFV is independently associated with HRPFs.
Our findings suggest that EFV may be a useful additional
measurement in risk stratifying patients who undergo routine
coronary artery calcium scoring and may indirectly provide
prognostic information above and beyond the assessment of
stenosis severity on coronary CTA.
Acknowledgments
Drs Rajani and Shmilovich contributed equally to this work.
This work was partly supported by grants from the Eisner,
Glazer, and Lincy Foundations (to Dr Berman), from the
National Institute of Biomedical Imaging and Bioengineering
(R21EB006829 to Dr Dey) and from the American Heart Asso-
ciation (12GRNT9450056 to Dr. Dey).
r e f e r e n c e s
1. Gorter PM, de Vos AM, van der Graaf Y, et al. Relation ofepicardial and pericoronary fat to coronary atherosclerosisand coronary artery calcium in patients undergoing coronaryangiography. Am J Cardiol. 2008;102:380e385.
2. Dey D, Wong ND, Tamarappoo B, et al. Computer-aided non-contrast CT-based quantification of pericardial and thoracicfat and their associations with coronary calcium andMetabolic Syndrome. Atherosclerosis. 2010;209:136e141.
3. Tamarappoo B, Dey D, Shmilovich H, et al. Increasedpericardial fat volume measured from noncontrast CTpredicts myocardial ischemia by SPECT. JACC CardiovascImaging. 2010;3:1104e1112.
4. Harada K, Amano T, Uetani T, et al. Cardiac 64-multislicecomputed tomography reveals increased epicardial fatvolume in patients with acute coronary syndrome. Am JCardiol. 2011;108:1119e1123.
5. Cheng VY, Dey D, Tamarappoo B, et al. Pericardial fat burdenon ECG-gated noncontrast CT in asymptomatic patients whosubsequently experience adverse cardiovascular events. JACCCardiovasc Imaging. 2010;3:352e360.
6. Mazurek T, Zhang L, Zalewski A, et al. Human epicardialadipose tissue is a source of inflammatory mediators.Circulation. 2003;108:2460e2466.
7. Motoyama S, Kondo T, Sarai M, et al. Multislice computedtomographic characteristics of coronary lesions in acutecoronary syndromes. J Am Coll Cardiol. 2007;50:319e326.
J o u r n a l o f C a r d i o v a s c u l a r C om p u t e d T omog r a p h y 7 ( 2 0 1 3 ) 1 2 5e1 3 2132
8. Kitagawa T, Yamamoto H, Horiguchi J, et al. Characterization ofnoncalcified coronary plaques and identification of culpritlesions in patients with acute coronary syndrome by 64-slicecomputed tomography. JACCCardiovasc Imaging. 2009;2:153e160.
9. Pflederer T, Marwan M, Schepis T, et al. Characterization ofculprit lesions in acute coronary syndromes using coronarydual-source CT angiography. Atherosclerosis.2010;211:437e444.
10. Motoyama S, Sarai M, Harigaya H, et al. Computedtomographic angiography characteristics of atheroscleroticplaques subsequently resulting in acute coronary syndrome.J Am Coll Cardiol. 2009;54:49e57.
11. Ding J, Kritchevsky SB, Harris TB, et al. The association ofpericardial fat with calcified coronary plaque. Obesity (SilverSpring). 2008;16:1914e1919.
12. Mahabadi AA, Reinsch N, Lehmann N, et al. Association ofpericoronary fat volume with atherosclerotic plaque burdenin the underlying coronary artery: a segment analysis.Atherosclerosis. 2010;211:195e199.
13. Nakazato R, Dey D, Cheng VY, et al. Epicardial fat volume andconcurrent presence of both myocardial ischemia andobstructive coronary artery disease. Atherosclerosis.2012;221:422e426.
14. Iwasaki K, Matsumoto T, Aono H, Furukawa H, Samukawa M.Relationship between epicardial fat measured by 64-multidetector computed tomography and coronary arterydisease. Clin Cardiol. 2011;34:166e171.
15. Wang TD, Lee WJ, Shih FY, et al. Association of epicardialadipose tissue with coronary atherosclerosis is region-specific and independent of conventional risk factors andintra-abdominal adiposity. Atherosclerosis. 2010;213:279e287.
16. Oka T, Yamamoto H, Ohashi N, et al. Association betweenepicardial adipose tissue volume and characteristics of non-calcified plaques assessed by coronary computedtomographic angiography. Int J Cardiol. 2012;161:45e49.
17. Schlett CL, Ferencik M, Kriegel MF, et al. Association ofpericardial fat and coronary high-risk lesions as determinedby cardiac CT. Atherosclerosis. 2012;222:129e134.
18. Ito T, Nasu K, Terashima M, et al. The impact of epicardial fatvolume on coronary plaque vulnerability: insight from opticalcoherence tomography analysis. Eur Heart J CardiovascImaging. 2012;13:408e415.
19. Agatston AS, Janowitz WR, Hildner FJ, Zusmer NR,Viamonte M Jr, Detrano R. Quantification of coronary arterycalcium using ultrafast computed tomography. J Am CollCardiol. 1990;15:827e832.
20. Dey D, Suzuki Y, Suzuki S, et al. Automated quantitation ofpericardiac fat from noncontrast CT. Invest Radiol.2008;43:145e153.
21. Yoshizumi T, Nakamura T, Yamane M, et al. Abdominal fat:standardized technique for measurement at CT. Radiology.1999;211:283e286.
22. Kvist H, Chowdhury B, Grangard U, Tylen U, Sjostrom L. Totaland visceral adipose-tissue volumes derived frommeasurements with computed tomography in adult men andwomen: predictive equations. Am J Clin Nutr.1988;48:1351e1361.
23. Sjostrom L, Kvist H, Cederblad A, Tylen U. Determination oftotal adipose tissue and body fat in women by computedtomography, 40K, and tritium. Am J Physiol.1986;250:E736eE745.
24. Nakazato R, Shmilovich H, Tamarappoo BK, et al. Interscanreproducibility of computer-aided epicardial and thoracic fatmeasurement from noncontrast cardiac CT. J CardiovascComput Tomogr. 2011;5:172e179.
25. Dey D, Lee CJ, Ohba M, et al. Image quality and artifacts incoronary CT angiography with dual-source CT: initialclinical experience. J Cardiovasc Comput Tomogr.2008;2:105e114.
26. Gutstein A, Dey D, Cheng V, et al. Algorithm for radiation dosereduction with helical dual source coronary computedtomography angiography in clinical practice. J CardiovascComput Tomogr. 2008;2:311e322.
27. Ferencik M, Ropers D, Abbara S, et al. Diagnostic accuracy ofimage postprocessing methods for the detection of coronaryartery stenoses by using multidetector CT. Radiology.2007;243:696e702.
28. Cheng V, Gutstein A, Wolak A, et al. Moving beyond binarygrading of coronary arterial stenoses on coronarycomputed tomographic angiography: insights for theimager and referring clinician. JACC Cardiovasc Imaging.2008;1:460e471.
29. Ueno K, Anzai T, Jinzaki M, et al. Increased epicardial fatvolume quantified by 64-multidetector computedtomography is associated with coronary atherosclerosis andtotally occlusive lesions. Circ J. 2009;73:1927e1933.
30. Alexopoulos N, McLean DS, Janik M, Arepalli CD, Stillman AE,Raggi P. Epicardial adipose tissue and coronary artery plaquecharacteristics. Atherosclerosis. 2010;210:150e154.
31. Marwan M, Taher MA, El Meniawy K, et al. In vivo CTdetection of lipid-rich coronary artery atheroscleroticplaques using quantitative histogram analysis: a head tohead comparison with IVUS. Atherosclerosis.2011;215:110e115.
32. Gauss S, Achenbach S, Pflederer T, Schuhback A, Daniel WG,Marwan M. Assessment of coronary artery remodelling bydual-source CT: a head-to-head comparison withintravascular ultrasound. Heart. 2011;97:991e997.