Associations between dental care approachability and dental ...
Upload
khangminh22Category
view
3download
0
In Vitro Caries: Dental Plaque Formation and Acidogenicity
Thesis Submitted in Accordance with the Requirements of the University of Liverpool
for the Degree of Doctor in Philosophy by Gareth Owens
Department of Health Services Research
(School of Dentistry)
September 2013

i
Acknowledgments
During my time at the University of Liverpool I was the recipient of a Studentship awarded by
GlaxoSmithKline. Without this financial support my studies would not have been possible. I would
like to thank GlaxoSmithKline for the opportunity they have given me.
There are also a number of individuals I must thank. Firstly my supervisors, Prof Susan Higham for
her advice, guidance, support and encouragement throughout my PhD studies. I would also like to
thank both Dr Sabeel Valappil and Prof Richard Lynch for these same reasons and for lending me
their expertise and insight. The encouragement I have received throughout my studies has proven
invaluable and for this I will always be grateful. The advice of Dr Christopher Hope regarding the
design and proper execution of in vitro biofilm models has also been instrumental in enabling the
progression of this work.
I would also like to extend my thanks to Mr Lee Cooper for all of his tireless efforts, his skilful
technical support, wisdom and advice. In particular, the execution of transverse micro-radiographic
procedures and the exploration of electrophoretic separations would have not been possible if it
were not for his assistance. For sharing their considerable knowledge concerning all aspects of
transverse micro-radiography, I thank also Dr Elbert de Josselin de Jong and Dr Gleb Komorov.
Thanks also to Dr Girvan Burnside for his help with matters more statistical.
The help of Dr Gary Burdette and Dr Richard Wilson is also greatly appreciated. Thanks also to all in
the Dental Research Wing (Ms Khush Bakht, Ms Karen Van Daelen, Ms Emma Miles, Dr Jumoke
Adeyemi, Dr Sophie Desmons, Ms Gill Lloyd, Ms Karen Billingsley and Dr John Stanbury). Having the
opportunity to work with each of the persons above has been one of the best experiences.
Last, but by no means least, thanks to my friends and family. My Mum, Jay, Debbie, Nick, Ben,
Danny, Laura, Rhodri and Jonathan. You read my work, spurred me on and kept me focused. For this,
I owe you my deepest thanks.
You made good times great.
Thanks, Gareth.

ii
Declaration
This thesis is the result of my own work. The work presented in this thesis has not been presented,
nor is currently being presented, either wholly or in part for any other degree or qualification.
Research works were carried out within the School of Dentistry in the University of Liverpool.
Name: ………………………………………………………………………….. Signed: ……………………………………………………

iii
Thesis Contents
Figure Index ..................................................................................................................................... vii
Table Index ..................................................................................................................................... xiii
Abstract ........................................................................................................................................... xv
Research Communications ............................................................................................................. xvi
Abbreviations ................................................................................................................................ xvii
Chapter 1: General Introduction ....................................................................................................... 1
1.1 History and Evolution .............................................................................................................. 2
1.2 Modern Epidemiology ............................................................................................................. 3
1.3 Current Concepts in Caries ...................................................................................................... 4
1.3.1 Enamel Mineral and Solubility ........................................................................................... 5
1.3.2 Saliva and Dental Caries .................................................................................................... 8
1.3.3 Microbial Influence and the Ecological Plaque Hypothesis ...............................................11
1.3.4 Caries Lesion Formation ...................................................................................................16
1.4 Biological and Non-Biological Caries Models ...........................................................................20
1.5 General Objectives and Thesis Structure .................................................................................24
Chapter 2: Artificial Occlusal Surface Morphology and Enamel Demineralisation ...........................25
2.1.0 Introduction ........................................................................................................................25
2.1.1 Aims and Objectives.........................................................................................................26
2.2.0 Materials and Methods........................................................................................................27
2.2.1 Hydrogel Investigation Model (AGS).................................................................................28
2.2.2 pH Cycling Investigation Model ........................................................................................29
2.2.3 Transverse Micro-Radiography ........................................................................................30
2.2.4 Statistical Analysis............................................................................................................33
2.3.0 Results .................................................................................................................................34
2.3.1 QLF-D Inspection of Enamel Tissue Quality.......................................................................34
2.3.2 Demineralisation at various Groove Depth in Static AGSs .................................................35
2.3.3 Demineralisation at various Groove Depths in pH-Cycled Systems ...................................39
2.4.0 Discussion............................................................................................................................45
2.5.0 Conclusions .........................................................................................................................49
Chapter 3: Enamel Tissue Orientation and the Onset of Enamel Demineralisation. ........................50
3.1.0 Introduction ........................................................................................................................50
3.1.1 Aims and Objectives.........................................................................................................51
3.2.0 Materials and Methods........................................................................................................52

iv
3.2.1 Prism Orientation and Enamel Demineralisation ..............................................................52
3.2.2 Demineralisation within U-Shaped Grooves .....................................................................53
3.2.3 Scanning Electron Microscopy .........................................................................................55
3.2.4 TMR Experimental Specifics .............................................................................................56
3.3.0 Results .................................................................................................................................57
3.3.1 SEM of Transverse Enamel Sections .................................................................................57
3.3.2 TMR of both Lateral- and Surface-Created Enamel Lesions...............................................60
3.3.3 TMR of U-Shaped Grooves ...............................................................................................64
3.4.0 Discussion............................................................................................................................71
3.4.1 Lesion Progression on Lateral and Natural Surfaces .........................................................72
3.4.2 Preparation and Production of Lesions within U-Shaped Grooves ....................................73
3.5.0 Conclusions .........................................................................................................................76
Chapter 4: Abiotic Considerations for Biological Caries Models ......................................................77
4.1.0 Introduction ........................................................................................................................77
4.1.1 Aims and Objectives.........................................................................................................77
4.2.0 Materials and Methods........................................................................................................78
4.2.1 Buffering Capacity of Salivary Growth Medium (STGM) ....................................................78
4.2.2 Analysis of the Salivary Growth Medium (STGM) .............................................................79
4.3.0 Results .................................................................................................................................82
4.3.1 Buffering Capacity of Salivary growth Medium (STGM) ....................................................82
4.3.2.1CE Qualitative Composition of the Salivary Growth Medium (STGM)..............................83
4.3.2.2 CE Quantitative Composition of the Salivary Growth Medium (STGM) ..........................85
4.4.0 Discussion............................................................................................................................87
4.4.1 Buffering Capacity of the STGM .......................................................................................87
4.4.2 Ionic Composition of the STGM ........................................................................................90
4.5.0 Conclusions .........................................................................................................................93
Chapter 5: Effect of Growth Medium Supply and on Enamel Demineralisation and Substratum Type
on Biofilm Formation.......................................................................................................................94
5.1.0 Introduction ........................................................................................................................94
5.1.1 Aims and Objectives.........................................................................................................95
5.2.0 Materials and Methods........................................................................................................96
5.2.1 Inoculum Preparation ......................................................................................................96
5.2.2 CDFF design and dCDFF Set-Up ........................................................................................96
5.2.3 Biofilm Sampling and Substratum Extraction ....................................................................99

v
5.2.4 Recovery and Enumeration of Oral Bacteria .....................................................................99
5.2.5 TMR Experimental Specifics ...........................................................................................102
5.3.0 Results ...............................................................................................................................104
5.3.1 Enumeration of Biofilm Bacteria ....................................................................................104
5.3.2 Transverse Micro-Radiography ......................................................................................109
5.4.0 Discussion..........................................................................................................................115
5.4.1 Biofilm Formation on HA and Enamel Substrata .............................................................115
5.4.2 Biofilm Growth and Formation and Caries Lesions .........................................................117
5.5.0 Conclusions .......................................................................................................................122
Chapter 6: Influence of Sucrose vs. dH2O on In Vitro Biofilm Formation and Sucrose-Induced
Acidogenic Capacity.......................................................................................................................123
6.1.0 Introduction ......................................................................................................................123
6.1.1 Aims and Objectives.......................................................................................................124
6.2.0 Materials and Methods......................................................................................................125
6.2.1 Biofilm Sampling Procedure ...........................................................................................127
6.2.2 Plaque Fluid Extraction ..................................................................................................127
6.2.3 Organic Acid, Anion and Cation Analysis ........................................................................128
6.3.0 Results ...............................................................................................................................129
6.3.1 Enumeration of Biofilm Bacteria ....................................................................................129
6.3.3 Organic Acid, Anion and Cation Analysis ........................................................................132
6.4.0 Discussion..........................................................................................................................141
6.4.1 Comparative Plaque-Fluid Composition .........................................................................142
6.5.0 Conclusions .......................................................................................................................147
Chapter 7: Bi-Circadian NaF vs. dH2O Exposures, Sucrose-Induced Cariogenic Potential and Enamel
Demineralisation. ..........................................................................................................................148
7.1.0 Introduction ......................................................................................................................148
7.1.1 Aims and Objectives.......................................................................................................149
7.2.0 Materials and Methods......................................................................................................150
7.3.0 Results ...............................................................................................................................155
7.3.1 Enumeration of Biofilm Bacteria ....................................................................................155
7.3.2 Organic Acid and Anion Analysis ....................................................................................166
7.3.3 TMR of dCDFF Exposed Enamel Disks .............................................................................174
7.4.0 Discussion..........................................................................................................................179
7.4.1 Microbial Composition of Plaque Biofilms ......................................................................179
7.4.2 Comparative Plaque Fluid Composition and Microbial Ecology .......................................181

vi
7.4.3 Microbial Ecology and Caries Lesion Formation ..............................................................186
7.5.0 Conclusions .......................................................................................................................190
Chapter 8: Influence of Ca-Lactate vs. dH2O Exposure on Biofilm Formation and Cariogenicity under
NaF Exposures. ..............................................................................................................................191
8.1.0 Introduction ......................................................................................................................191
8.1.1 Aims and Objectives.......................................................................................................192
8.2.0 Materials and Methods......................................................................................................193
8.3.0 Results ...............................................................................................................................197
8.3.1 Enumeration of Biofilm Bacteria ....................................................................................197
8.3.2 TMR of dCDFF-Exposed Enamel Disks .............................................................................202
8.3.3 Organic Acid, Anion and Cation Analysis ........................................................................206
8.4.0 Discussion..........................................................................................................................215
8.4.1 Microbial Composition of Plaque Biofilms ......................................................................215
8.4.2 Comparative Plaque Fluid Composition ..........................................................................216
8.4.3 TMR of dCDFF Exposed Enamel Disks .............................................................................221
8.5.0 Conclusions .......................................................................................................................223
Chapter 9: Effect of NaF and Ca-Lactate vs. dH2O Exposures on the Cariogenicity of Established
Biofilm Communities. ....................................................................................................................224
9.1.0 Introduction ......................................................................................................................224
9.1.1 Aims and Objectives.......................................................................................................224
9.2.0 Materials and Methods......................................................................................................225
9.3.0 Results ...............................................................................................................................228
9.3.1 Enumeration of Biofilm Bacteria ....................................................................................228
9.3.2 TMR of sCDFF Exposed Enamel Disks .............................................................................235
9.4.0 Discussion..........................................................................................................................240
9.4.1 Microbial Composition in Response to Agent Exposures ................................................240
9.4.2 TMR of sCDFF Exposed Enamel Disks .............................................................................242
9.5.0 Conclusions .......................................................................................................................245
Chapter 10: General Discussion .....................................................................................................246
10.1 Efficacy of the CDFF Models for Caries Research .................................................................247
10.2 Investigating the Effects of Adjunct Agents .........................................................................250
10.3 Clinical Relevance ...............................................................................................................253
10.4 Future Perspectives ............................................................................................................253
10.5 General Conclusions ...........................................................................................................257
Reference List ................................................................................................................................258

vii
Figure Index
Figure 1.1 (Factors Influencing the Development of Dental Caries) .................................................... 1
Figure 1.2a (World Health Organisation Data) ................................................................................... 3
Figure 1.2b (World Health Organisation Data) ................................................................................... 4
Figure 1.3 (Hydroxyapatite Structure) ............................................................................................... 5
Figure 1.4 (Chemical Structures of Enamel Minerals)......................................................................... 6
Figure 1.5 (Oral Biofilm Development) .............................................................................................14
Figure 1.6 (Cariogenicity of Dental Plaque) .......................................................................................15
Figure 1.7 (Caries Lesion Formation) ................................................................................................17
Figure 1.8 (Carious Lesion Porosity)..................................................................................................19
Figure 1.9 (Constant Depth Film Fermenter; CDFF)...........................................................................21
Figure 1.10 (Thesis Structure)...........................................................................................................24
Figure 2.1.1 (Inverted Occlusal Surfaces) ..........................................................................................25
Figure 2.1.2 (Average Occlusal Surface Angles) ................................................................................26
Figure 2.2.1 (Initial Enamel Sectioning Process) ................................................................................27
Figure 2.2.2 (BEBs Paining Process) ..................................................................................................28
Figure 2.2.3 (BEB Groove Assembly Process) ....................................................................................29
Figure 2.2.4 (Diamond Impregnated Grinding Disks) ........................................................................31
Figure 2.2.5 (Sample Frame Assembly) .............................................................................................31
Figure 2.2.6 (Sample Frame Radiography) ........................................................................................32
Figure 2.3.1 (QLF-D Aided Inspection of Enamel Tissue Quality) .......................................................34
Figure 2.3.2 (TMR Parameters in Relation to θ) ................................................................................36
Figure 2.3.3 (Reconstructed Micro-Radiographs)..............................................................................37
Figure 2.3.4 (ΔZ Measured across the Length of the Enamel Lesions) ...............................................37
Figure 2.3.5 (LD Measured across the Length of the Enamel Lesions) ...............................................38
Figure 2.3.6 (R Measured across the Length of the Enamel Lesions) .................................................38
Figure 2.3.7 (SMax Measured across the Length of the Enamel Lesions) .............................................39

viii
Figure 2.3.8 (TMR Parameters in Relation to θ) ................................................................................41
Figure 2.3.9 (ΔZ Measured across the Length of the Enamel Lesions) ...............................................41
Figure 2.3.10 (LD Measured across the Length of the Enamel Lesions) .............................................42
Figure 2.3.11 (R Measured across the Length of the Enamel Lesions) ...............................................43
Figure 2.3.12 (SMax Measured across the Length of the Enamel Lesions) ...........................................44
Figure 3.1.1 (Chemical Heterogeneity of the Enamel Tissue) ............................................................50
Figure 3.2.1 (BEBs Paining Process) ..................................................................................................52
Figure 3.2.2 (BEBs Paining Process: Continued) ................................................................................53
Figure 3.2.3 (BEBs Paining and Groove Carving) ...............................................................................54
Figure 3.2.4 (Comparison of the Various Demineralisation Systems Used)........................................55
Figure 3.3.1 (SEM Images of the Transverse Section before Acid-Etching) ........................................57
Figure 3.3.2 (SEM Image of Dentine before Acid-Etching) .................................................................58
Figure 3.3.3 (SEM Images of the Transverse Section after Acid-Etching) ...........................................59
Figure 3.3.5 (Reconstructed Micro-Radiographs)..............................................................................60
Figure 3.3.6a (TMR Scan Profiles for Enamel Lesions created on Natural Surface of Lateral Sides) ....61
Figure 3.3.6b (TMR Parameters for Lesions Created on Natural Surfaces or Lateral Sides) ................62
Figure 3.3.7a (ΔZ Measurements at Increments from the EDJ) .........................................................63
Figure 3.3.7b (LD Measurements at increments from the EDJ) .........................................................63
Figure 3.3.8 (Example Micro-Radiographs) .......................................................................................64
Figure 3.3.9 (Groove Depth Plotted against Distance from the EDJ)..................................................65
Figure 3.3.10 (Example Micro-Radiographs) .....................................................................................66
Figure 3.3.11a (ΔZ Measurements from Carved Grooves incremented from the Enamel Surface) ....67
Figure 3.3.11b (LD Measurements from Carved Grooves incremented from the Enamel Surface) ....68
Figure 3.3.11c (R Measurements from Carved Grooves incremented from the Enamel Surface) .......69
Figure 3.3.11d (SMax Measurements from Carved Grooves incremented from the Enamel Surface) ..69
Figure 3.4.1 (Variation in the EDJ with Respect to the Enamel Surface) ............................................74
Figure 4.2.1 (Calculation of Buffering Capacity) ................................................................................79
ix
Figure 4.2.2 (Schematic Design of the CE Technique) .......................................................................79
Figure 4.2.3 (CE Sample Preparation) ...............................................................................................80
Figure 4.3.1 (STGM Buffering Capacity both Before and After Sterilisation) ......................................82
Figure 4.3.2 (Electropherogram of Anions Separated from the STGM)..............................................83
Figure 4.3.3 (Electropherogram of the Anion Level 1 Stock Solution) ................................................84
Figure 4.3.4 (Electropherogram of Cations Separated from the STGM).............................................85
Figure 4.3.5 (Concentrations of Inorganic Ions with the STGM following Autoclaving) ......................86
Figure 4.3.6 (Concentrations of Organic Ions within the STGM Following Autoclaving) .....................86
Figure 4.4.1 (Buffering Capacity of Unstimulated Human Whole Saliva) ...........................................87
Figure 4.4.2 (Bicarbonate Equilibrium) .............................................................................................88
Figure 4.4.3 (Amino Acids) ...............................................................................................................89
Figure 4.4.4 (Saturation with Respect to Calcium Salts within the STGM) .........................................92
Figure 5.2.1 (Cross-Sectional View of a Single PTFE Sample Pan) ......................................................97
Figure 5.2.2 (Pulsing Strategy for Feast-Famine vs. Continuous-Flow Strategies) ..............................98
Figure 5.2.3 (dCDFF Schematic Set-Up) ..........................................................................................103
Figure 5.3.1 (Fastidious Anaerobes; FA) .........................................................................................106
Figure 5.3.2 (Lactobacillus Spp.) .....................................................................................................106
Figure 5.3.3 (Streptococcus Spp.) ...................................................................................................107
Figure 5.3.4 (Mutans Streptococci; MS)..........................................................................................107
Figure 5.3.5 (Veillonella Spp.) .........................................................................................................108
Figure 5.3.7 (TMR Scan Profiles for Lesions Created under a Continuous Flow of STGM) ................110
Figure 5.3.8 (TMR Scan Profiles for Lesions Created under a Feast-Famine Flow for STGM) ............110
Figure 5.3.9 (Radiographic Images of Transverse Enamel Sections) ................................................111
Figure 5.3.10 (ΔZ Measurements taken from CF and FF Conditions) ...............................................112
Figure 5.3.11 (LD Measurements taken from CF and FF Conditions) ...............................................113
Figure 5.3.12 (R Measurements taken from CF and FF Conditions) .................................................113
Figure 5.3.13 (SMax Measurements taken from CF and FF Conditions) .............................................114

x
Figure 5.4.1 (Successive Basis of Lamination Zone Formation)........................................................119
Figure 6.1.1 (Sucrose Catabolism) ..................................................................................................123
Figure 6.2.1 (dCDFF Schematic Set-Up) ..........................................................................................126
Figure 6.2.2 (Pulsing Strategy for 100 mM Sucrose vs. dH2O Exposures) .........................................127
Figure 6.3.1 (Fastidious Anaerobes; FA) .........................................................................................129
Figure 6.3.2 (Lactobacillus Spp.) .....................................................................................................130
Figure 6.3.3 (Streptococcus Spp.) ...................................................................................................130
Figure 6.3.4 (Lactate PF Concentrations in Comparison by CDFF Condition) ...................................132
Figure 6.3.5 (Acetate PF Concentrations in Comparison by CDFF Condition) ...................................133
Figure 6.3.6 (Phosphate PF Concentrations in Comparison by CDFF Condition) ..............................134
Figure 6.3.7 (Butyrate PF Concentrations in Comparison by CDFF Condition) .................................135
Figure 6.3.8 (Calcium PF Concentrations in Comparison by CDFF Condition) ..................................136
Figure 6.3.9a (Plaque Fluid Composition at 2 Days; 7 min after a 100 mM Sucrose Pulse) ..............137
Figure 6.3.9b (Plaque Fluid Composition at 2 Days; 7 min after a dH2O Pulse) ................................137
Figure 6.3.9c (Plaque Fluid Composition at 4 Days; 7 min after a 100 mM Sucrose Pulse) ...............138
Figure 6.3.9d (Plaque Fluid Composition at 4 Days; 7 min after a dH2O Pulse) ................................138
Figure 6.3.9e (Plaque Fluid Composition at 6 Days; 7 min after a 100 mM Sucrose Pulse) ..............139
Figure 6.3.9f (Plaque Fluid Composition at 6 Days; 7 min after a dH2O Pulse) .................................139
Figure 6.3.9g (Plaque Fluid Composition at 8 Days; 7 min after a 100 mM Sucrose Pulse)...............140
Figure 6.3.9h (Plaque Fluid Composition at 8 Days; 7 min after a dH2O Pulse) ................................140
Figure 6.4.1 (Pyruvate Catabolism).................................................................................................143
Figure 7.2.1 (Enamel Disk Paining Process: Smooth Surfaces) .........................................................150
Figure 7.2.2 (Enamel Disk Painting Process: Fissured Surfaces) .......................................................151
Figure 7.2.3 (dCDFF Pulsing Strategy for both FF and CF Cycles: NaF vs. dH2O) ...............................153
Figure 7.2.4 (dCDFF Schematic Set-Up) ..........................................................................................154
Figure 7.3.1a (Fastidious Anaerobes in Exp. 1; FA) ..........................................................................155
Figure 7.3.1b (Fastidious Anaerobes in Exp. 2; FA)..........................................................................156

xi
Figure 7.3.1c (Fastidious Anaerobes in Exp. 3; FA) ..........................................................................157
Figure 7.3.2a (Lactobacillus Spp. in Exp. 1) .....................................................................................158
Figure 7.3.2b (Lactobacillus Spp. in Exp. 2) .....................................................................................159
Figure 7.3.2c (Lactobacillus Spp. in Exp. 3)......................................................................................159
Figure 7.3.3a (Streptococcus Spp. in Exp. 1) ....................................................................................160
Figure 7.3.3b (Streptococcus Spp. in Exp. 2)....................................................................................161
Figure 7.3.3c (Streptococcus Spp. in Exp. 3) ....................................................................................162
Figure 7.3.4a (Mutans Streptococci in Exp. 1; MS) ..........................................................................163
Figure 7.3.4b (Mutans Streptococci in Exp. 2; MS) ..........................................................................163
Figure 7.3.4c (Mutans Streptococci in Exp. 3; MS) ..........................................................................164
Figure 7.3.5 (Veillonella Spp. in Exp. 3) ...........................................................................................165
Figure 7.3.8 (Acetate PF Concentrations) .......................................................................................166
Figure 7.3.9 (Lactate PF Concentrations) ........................................................................................167
Figure 7.3.10a (Plaque Fluid Composition at Baseline on Day 2; NaF Condition) .............................168
Figure 7.3.10b (Plaque Fluid Composition Following a Sucrose Pulse on Day 2; NaF Condition) ......168
Figure 7.3.10c (Plaque Fluid Composition at Baseline on Day 2; dH2O Condition) ...........................169
Figure 7.3.10d (Plaque Fluid Composition Following a Sucrose Pulse on Day 2; dH2O Condition) ....169
Figure 7.3.10e (Plaque Fluid Composition at Baseline on Day 4; NaF Condition) .............................170
Figure 7.3.10f (Plaque Fluid Composition Following a Sucrose Pulse on Day 4; NaF Condition) .......170
Figure 7.3.11 (Propionate PF Concentrations) ................................................................................171
Figure 7.3.12 (Sulphate PF Concentrations) ....................................................................................172
Figure 7.3.13 (Phosphate PF Concentrations) .................................................................................173
Figure 7.3.14a (TMR Scan Profiles for Lesions Created under Exposure to NaF) ..............................175
Figure 7.3.15b (TMR Scan Profiles for Lesions Created under Exposure to dH2O .............................175
Figure 7.3.15a (TMR Parameters for Lesions Created under Exposure to NaF) ................................177
Figure 7.3.15b (TMR Parameters for Lesions Created under Exposure to dH2O) .............................177
Figure 7.3.16 (Example Radiographic Images) ................................................................................178

xii
Figure 8.2.1 (dCDFF Sample Pan Arrangements) .............................................................................193
Figure 8.2.2 (dCDFF Pulsing Strategies for Ca-Lactate vs. dH2O) ......................................................195
Figure 8.2.3 (dCDFF Schematic Set-Up) ..........................................................................................196
Figure 8.3.1 (Fastidious Anaerobes; FA) .........................................................................................197
Figure 8.3.2 (Lactobacillus Spp.) .....................................................................................................198
Figure 8.3.3 (Streptococcus Spp.) ...................................................................................................199
Figure 8.3.4 (Mutans Streptococci; MS)..........................................................................................200
Figure 8.3.5 (Veillonella Spp.) .........................................................................................................200
Figure 8.3.7a (TMR Parameters of Initially Sound Enamel Surfaces; Day 8) .....................................203
Figure 8.3.7b (TMR Parameters of Initially Sound Enamel Surfaces; Day 16) ...................................203
Figure 8.3.8 (TMR Parameters of Pre-Made Lesions Following Exposure within the dCDFF)............205
Figure 8.3.9 (CE Anion Trace) .........................................................................................................206
Figure 8.3.10 (PF Lactate Concentrations) ......................................................................................207
Figure 8.3.11 (PF Acetate Concentrations) .....................................................................................207
Figure 8.3.12a (Plaque Fluid Composition on Day 8; Ca-Lactate Condition) ....................................209
Figure 8.3.12b (Plaque Fluid Composition on Day 8; dH2O Condition).............................................209
Figure 8.3.12c (Plaque Fluid Composition on Day 16; Ca-Lactate Condition) ...................................210
Figure 8.3.12d (Plaque Fluid Composition on Day 16; dH2O Conditioned) .......................................210
Figure 8.3.13 (PF Fluoride Concentrations) .....................................................................................211
Figure 8.3.14 (PF Phosphate Concentrations) .................................................................................212
Figure 8.3.15 (PF Ammonium Concentrations) ...............................................................................212
Figure 8.3.16 (PF Calcium Concentrations) .....................................................................................213
Figure 9.2.1 (sCDFF Pulsing Strategies for NaF vs. Ca-Lactate vs. dH2O) ..........................................225
Figure 9.2.2 (sCDFF Schematic Set-Up) ...........................................................................................227
Figure 9.3.1 (Fastidious Anaerobes; FA) .........................................................................................229
Figure 9.3.2 (Lactobacillus Spp.) .....................................................................................................230
Figure 9.3.3 (Streptococcus Spp.) ...................................................................................................231

xiii
Figure 9.3.4 (Mutans Streptococci; MS)..........................................................................................232
Figure 9.3.5 (Veillonella Spp.) .........................................................................................................234
Figure 9.3.6a (Mean Scan Profiles of Lesions Created in Exp. S) ......................................................235
Figure 9.3.6b (Mean Scan Profiles of Lesions Created in Exp. SN) ...................................................236
Figure 9.3.6c (Mean Scan Profiles of Lesions Created in Exp. SNC) ..................................................236
Figure 9.3.7a (TMR Parameters from Lesions Created in Exp. S) .....................................................237
Figure 9.3.7b (TMR Parameters from Lesions Created in Exp. SN) ..................................................238
Figure 9.3.7c (TMR Parameters from Lesions Created in Exp. SNC) .................................................238
Figure 9.4.1 (Fluoride Penetration as a Function of Plaque Calcium) ..............................................243
Figure 10.1 (Control of Bi-Phasic Fluoride Exposures) .....................................................................254
Table Index
Table 2.2.1 (Composition of De- and Re-Mineralising Solutions) .......................................................29
Table 2.3.1 (TMR Parameters from AGS-Exposed Grooves) ..............................................................35
Table 2.3.2 (TMR Parameters from pH Cycling Exposed Grooves) .....................................................40
Table 3.3.1 (TMR Parameters from Natural and Lateral Enamel Surfaces) ........................................60
Table 3.3.2 (TMR Parameters within Carved Grooves)......................................................................67
Table 4.2.1 (Composition of the STGM) ............................................................................................78
Table 4.3.1 (Qualitative Analysis of Anions within the STGM) ...........................................................83
Table 4.3.2 (Qualitative Analysis of Cations within the STGM) ..........................................................84
Table 5.3.1 (TMR Parameters) ........................................................................................................109
Table 7.2.1 (Experimental Parameters) ..........................................................................................152
Table 7.3.2 (TMR Parameters; Exp. 3) ............................................................................................174
Table 8.3.1 (TMR Parameters of Initially Sound Enamel Surfaces) ..................................................202
Table 8.3.2 (TMR Parameters of Pre-Made Enamel Lesions) ...........................................................204
Table 9.3.1 (TMR Parameters of SCDFF Enamel Lesions) ................................................................ 235

xiv

xv
Abstract Dental caries is a significant disease world-wide and although a massive reduction in prevalence has
occurred over the past 50 years, incidents of this disease persist (particularly on the occlusal or
aproximal surfaces and concerning younger demographics). The main reason for the observed
reduction is exposure to fluoride either though water fluoridation and delivery by dentifrice.
Environmental exposure reduces incidence by incorporation into the mineral phase of the hard
tissue and, as a result, increases the resistance of the enamel mineral to acid-induced
demineralisation. Several mechanisms have been proposed in an attempt to explain the caries-
inhibiting effects of fluoride however its influence on the balance between de- and re-mineralisation
episodes appears to be the principal route by which fluorides exert their effects.
Efforts geared towards the continual improvement of fluoride delivery systems have also been
successful to some extent and thus further exploration shows promise of improving the anticaries
efficacy further. However, a complication is met in that, in vivo, multiple factors interrelated and
consequently, differences in the consortia within natural oral biofilms combined with unavoidable
inter-individual variations confound clinical investigations and make the distinction between
relevant aspects of the process difficult. One possible alternative strategy is the development of in
vitro biological models to simulate this process to a point of reflecting the in vivo situation whilst
retaining control over the parameters which are known to be crucial to the progression of the
disease. To this end, the Constant-Depth Film Fermenter (CDFF) has emerged as powerful tool to
potentially meet the needs of current in vitro research.
However, due to the lack of an inter-disciplinary approach to multi-faceted disease process, the full
potential of the CDFF has not yet been reached. Therefore, the CDFF model was applied to study of
anti-caries strategies which aimed to increase the persistence of the fluorides within natural
microcosm biofilms. Enamel lesions were successfully produced within this system and, using a
combination of both biological and non-biological demineralisations systems, the effects of
anticaries agents (calcium and fluoride) were also investigated for their effects on lesion progression
or reversal. Sodium fluoride (NaF; 300 ppm F-) exposures exhibited an ambiguous response on the
microbial community although definite anticaries activity. Conversely, calcium lactate pre-rinses (Ca-
lactate; 100 mM) appears to possess some inhibitory activity on the biofilms produced within the
model whereas a less effective anticaries activity was observed in comparison to NaF exposures
alone. Thus, further investigation of the effects of Ca-lactate should be pursued.
Operation of the CDFF was also further developed to meet the needs of this study and analyses were
performed on an integrative basis in order to capture the physiochemical events which take place
during caries lesion formation. Microcosm plaques were shown to be highly diverse with respect to
their community although homology was found on the bias of their ultimate definition, cariogenicity.
The synthesis of inorganic mineral reservoirs within microcosm biofilms holds great potential for
augmenting the physiology of the plaque and for increasing the efficacy of fluorides for prevention
of enamel demineralisation. Microcosm biofilms may also have an adaptive capacity which could
result in predicable response patterns. Ultimately, a holistic approach to the study of caries within a
biological context provides greater insight into the caries process than approaches which lack
specific interactions for the purposes of assigning direct relationships. With the successful
development of a fully functional enamel caries model, the possibilities are endless.

xvi
Research Communications
Owens, GJ; Lynch, RJM; Valappil, SP; Higham, SM (2014) “Evidence of an In Vitro Coupled-Diffusion
Mechanism of Lesion Formation within Microcosm Dental Plaque” Manuscript in Preparation.†
Owens, GJ; Valappil, SP; Lynch, RJM; Hope, CK; Higham, SM (2014) “Ecological Modification of In
Vitro Microcosm Biofilms through Twice-Daily NaF Exposures” Manuscript in Preparation.†
Owens, GJ; Valappil, SP; Hope, CK; Lynch, RJM; Higham, SM; (2013) “In Vitro Biofilm Formation: NaF
Exposures within a Sucrose Pulsing Strategy” 60th Annual ORCA Congress, Liverpool, UK.‡
Owens, GJ; Lynch, RJM; Valappil, SP; Higham, SM; (2011) “Artificial Occlusal Surface Morphology and
In Vitro Enamel Demineralisation”. 58th Annual ORCA Congress, Kaunas, Lithuania.‡
Owens, GJ; Lynch, RJM; Valappil, SP; Higham, SM; (2011) “Occlusal Surface Morphology and pH
Cycling Effect on Enamel Demineralisation”. BSODR Conference, Sheffield, UK.‡
Owens, GJ; Lynch, RJM; Cooper, L; Valappil, SP; Higham, SM; (2010) “Tooth Surface Proximity and
Orientation in Relation to Light-Induced Fluorescence”. ICQ2010 Conference, Liverpool, UK.‡
Owens, GJ; Lynch, RJM; Valappil, SP; Cooper, L; Higham SM; (2010) “Effect of hydrogel concentration
and calcium activity on demineralisation”. 57th Annual ORCA Congress, Montpellier, FR.‡
Owens, GJ; Valappil, SP; Miller, G; Clowes, R; Lynch, RJM; Higham, SM; (2010) “Role of Gallium in
Dental Mineralisation”. IADR Barcelona, Barcelona, ES.‡
Owens, GJ; Lynch, RJM; Hope, CK; Valappil, SP; Higham, SM (2013) “In Vitro Caries: Dental Plaque
Formation and Acidogenicity”. GSK Science Symposium, Weybridge, UK.§
Owens, GJ; Valappil, SP; Lynch, RJM; Cooper, L; Hope, CK; Higham, SM (2012) “In Vitro Caries: Dental
Plaque Formation” PGR Conference (University of Liverpool), Liverpool, UK.§
Owens, GJ; Lynch, RJM; Valappil, SP; Higham, SM (2012) “In Vitro Caries: Dental Plaque Formation”.
GSK Science Symposium, Weybridge, UK.§
Owens, GJ; Valappil, SP; Lynch, RJM; Cooper, L; Higham, SM (2011) “Dental Plaque as a Reservoir for
Anti-Caries Active Agents” Dental Seminars (University of Liverpool), Liverpool, UK.§
Owens, GJ; Lynch, RJM; Cooper, L; Valappil, SP; Higham, SM (2011) “Dental Plaque as a Reservoir for
Anti-Caries Active Agents: Occlusal Surface Morphology”. GSK Science Symposium, Weybridge, UK.§
Owens, GJ; Valappil, SP; Lynch, RJM; Cooper, L; Higham, SM (2010) “Dental Plaque as a Reservoir for
Anti-Caries Active Agents: Calcium and Fluoride Relationships” Dental Seminars (University of
Liverpool), Liverpool, UK.§
Owens, GJ; Lynch, RJM; Cooper, L; Valappil, SP; Higham, SM (2010) “Dental Plaque as a Reservoir for
Anti-Caries Active Agents: Non-Biological Models”. GSK Science Symposium, Weybridge, UK.§
† Original Paper (Proposed Publication)
‡ Conference Contribution (Published Communication)
§ External or Internal Presentation (Unpublished Communication)

xvii
Abbreviations
%Vol Mineral Volume LD Lesion Depth (µm)
µg Microgram M Molar
µL Microliter MDL Minimum Detection Limit
µM Micromolar Min Minutes
µm Micrometre mL Millilitre
3D Three-Dimensional mM Millimolar
AGS Acid-Gel System Mm Millimetre
ANOVA Analysis of Variance MSA Mitis-Salivarius Agar
BMDL Below the Minimum Detection Limit NSPH Non-Specific Plaque Hypothesis
CDFF Constant-Depth Film-Fermenter OCP Octacalcium Phosphate
CE Capillary Electrophoresis PF Plaque Fluid
CF Continuous-Flow PFL Pyruvate-Formate Lyase
CFU Colony Forming Units pKa Acid Dissociation Constant
cm Centimetre Ppm Parts per Million
dCDFF Dual Constant Depth Film Fermenter R Average Mineral Loss (%Vol)
dH2O De-Ionised Water sCDFF Sequential Constant Depth Film Fermenter
DS Degree of Saturation SD Standard Deviation
EDJ Enamel-Dentine Junction SEM Scanning Electron Microscopy
EEPH Extended Ecological Plaque Hypothesis SL Surface Layer
ELT Enamel-Layer Thickness SMax Surface Later Mineralisation (%Vol)
EPH Ecological Plaque Hypothesis SPH Specific Plaque Hypothesis
FAA Fastidious Anaerobe Agar TCP Tricalcalcium Phosphate
FF Feast-Famine TMR Transverse Micro-Radiography
FHA Flour-Hydroxyapatite TYCSB Tryptone Yeast-Extract Cystine Agar
g Gram
w/v Weight for Volume (%)
h Hours
ΔLD Change in Lesion Depth (µm)
HA Hydroxyapatite ΔR Change in Average Mineral Loss (%Vol)
IAP Ionic Activity Product ΔSMax Change in Surface Later Mineralisation (%Vol)
KSP Solubility Product Constant ΔZ Integrated Mineral Loss (%Vol.µm)
L Litre
ΔΔZ Change in Integrated Mineral Loss (%Vol.µm)

1
Chapter 1: General Introduction
Dental caries is a progressive demineralisation of the dental hard tissues which occurs as a result of
acidogenic bacterial metabolism. It is considered one of the most prevalent diseases worldwide
[Selwitz et al., 2007] and develops through a complex interaction between acid-producing or
acidogenic bacteria, the availability of fermentable carbohydrate and various other host-specific
factors such as the teeth themselves and the saliva. It is the concerted action of these factors (Figure
1.1) which results in the characteristic breakdown of the hard tissues (enamel or dentine) known as
a caries lesion [Fejerskov et al., 2008a]. Over time and in the absence of intervention, the disease
may often progress to a painful and debilitating condition and, dependent on location and extent,
further problems may arise with regard to mastication or ascetic perception [Locker, 1992].
Ultimately, a significant reduction in health-related quality of life is the result [Gerritsen et al., 2010].
Figure 1.1 (Factors influencing the Development of Dental Caries): a) mesial-distal view of a single human molar showing inner dentine supporting layers and the outer enamel layers. Visibly indicated is a supra-gingival caries lesion which has progressed to the point of cavitation in the enamel layer; b) Venn diagram adapted from Fejerskov and Manji [1990]. Dark blue () areas represent personal factors associated with dental caries, white () indicate oral environmental factors and light blue () indicate factors which contribute directly.
Carious lesions form from a specific interaction of the microbial consort present in the oral
environment, the dental hard tissues (the enamel, cementum or dentine) and the oral environment
itself (Figure 1.1b). The non-shedding dental hard tissues provide a stable surface for the formation
of multi-species microbial biofilms [Marsh, 2004] and the oral cavity provides both nutrients for
growth and a relatively stable environment [Marsh and Martin, 2009a]. Problems arise once a
biofilm community becomes established; frequent exposure to carbohydrates affect a shift in the

General Introduction | Ch.1
2
biofilm composition to one which is able to metabolise these substrates more efficiently and in the
process, produce acids which dissolve the underlying enamel substratum. Essentially, the physical
state of the plaque biofilm modulates the process of both de- and re-mineralisation [Kidd and
Fejerskov, 2004].
1.1 History and Evolution Some of the earliest known evidence suggests that caries has been present since the very beginnings
of human existence [Hillson, 2008; Lanfranco and Eggers, 2012] (i.e. the point at which the human
species may be defined). Moreover, evidence also suggests common parallels in various mammals
including the great apes [Hillson, 1996] and therefore advocates the assertion that the mechanistic
basis of the disease itself may predate the Homo sapien species in an evolutionary sense. Further to
this, the frequency with which archaeological evidence of dental caries is found is with such
consistency that post-mortem dental assessment is generally considered as an appropriate source of
anthropological data on prehistoric dietary habits of [Hillson, 2008]. In this respect, dental caries
may be considered as a natural phenomenon, part of the expected or ingenerate deterioration of
the teeth, but it is important to remember that, with respect to the individual, the disease is one
which is influenced by collective behaviours and the environment (Figure 1.1). In support of this
view, stochastic arguments [Manji et al., 1991] have also provided evidence that such a non-
deterministic epidemiology could be true for modern day populations to some extent.
Diet is a well-established contributing factor but by no means the only one (Figure 1.1). Further
factors involved such as the necessity for microbial inoculation [Featherstone, 2008],
communicability [Caufield et al., 2005; Hanada, 2000] and opportunities to alleviate or circumvent
the condition [Fejerskov and Manji, 1990] also have an influence. This creates an opposition to the
view that caries will occur with or without human intervention and therefore allows research to
strive towards a point of complete or near complete eradication [NIH, 2001].
Unlike many diseases, for dental caries there is no singular, clearly-defined causation pathway.
Rather, pathogenesis is the result of many factors which must be present under the correct
conditions over a sustained period of time. Nevertheless, multifaceted diseases such as caries may
still be understood in terms of their associated factors and the weighted risk thereof [Burt et al.,
2008; Fejerskov, 2004]. Although definite diagnoses cannot be always drawn, these associated
factors may in turn be used as a proxy to identify those individuals whom are at most risk and thus
may provide an opportunity for prophylactics if necessary [Balakrishnan et al., 2000].

General Introduction | Ch.1
3
1.2 Modern Epidemiology Dental caries is regarded as a significant community health problem [Bedi et al., 2013; NIH, 2001]. In
modern history, major leaps forward have been achieved, particularly in the more developed
countries [Burt et al., 2008] and most notably due to the introduction of fluorides either through
dentifrices [Marinho et al., 2003a, b; Walsh et al., 2010] or water fluoridation [Featherstone, 1999;
Kumar, 2008]. However distribution and severity of prevalence still tends to be weighted towards
more socioeconomically deprived or geographically isolated populations [Burt et al., 2008; Delgado-
Angulo et al., 2009; Kumar, 2008; ten Cate, 2009]. Further, the aetiology within those populations
which have seen a greater overall improvement over the past decades appears increasingly altered
[Batchelor and Sheiham, 2004; Beltrán-Aguilar et al., 2005; Brown and Selwitz, 1995; Caplan and
Weintraub, 1993; Delgado-Angulo et al., 2009; ten Cate, 2009]. In developed countries, incidence of
caries have now been greatly reduced on the coronal and smooth surfaces of the teeth but are still
present particularly at plaque retention sites on the occlusal or aproximal surfaces [Batchelor and
Sheiham, 2004; Berman and Slack, 1973; Hannigan et al., 2000]. There are a number of important
factors which have contributed to these altered trends; most notably the introduction of fluorides
and access to oral health care [NIH, 2001]. The WHO Oral Health Report [Petersen, 2003] stated that
dental caries is thought to affect between 60% and 90% of school children and the vast majority of
adults within linked demographic groups. Within this same report it was also noted that in many
areas of the world dental caries is still considered one of the most prevalent of all oral diseases and
that variations between and within demographics are continually apparent (Figure 1.2a).
Figure 1.2a (World Health Organisation Data): Summary of WHO data on caries severity for all countries where data was made available. Scores are normalised world-wide ranked as: Very High () > High () > Moderate () >Low () >Very Low () and Unknown (). This data was based on DMFT scores collected for 12 year old children by the WHO [WHO, 2000].

General Introduction | Ch.1
4
Considering the cost of dental caries, recent figures from the British Dental Association (2005 - 2006)
estimate the cost of oral diseases to the United Kingdom National Health Service to be £2.57bn per
annum with a further £2bn billed through the private sector [Moynihan, 2009]. In equivalence for
the year 2013, these values approach £2.9bn and £2.26bn respectively. Economic costs are further
exacerbated by a consequential impact on the rates of absenteeism from education or work.
Figure 1.2b (2001 World Health organisation Data partially updated for 2009): Summary of WHO data on caries severity for all countries where data was made available partially update with data for countries where data was available. Scores are normalised world-wide ranked as: Very High () > High () > Moderate () > Low () > Very Low () and Unknown (). This data was based on DMFT scores collected for 12 year old children [WHO, 2000] and various age groups [Bagramian et al., 2009]
The relationships between changing access to healthcare and diet have been demonstrated here as
some of the factors for which knowledge has contributed to our understanding of a revised trend.
However, the differences visually apparent in Figure 1.2a and Figure 1.2b may mask deeper trends
as we see these differences not only between countries but also between demographics and at an
individual level [Burt et al., 2008]. It is these differences which cause the majority of problems when
healthcare providers attempt to devise new and improved treatment plans since they need to be
applied to an entire population. Efforts which strive towards a preventative approach have also
become increasingly attractive as an alternative to surgical management [Selwitz et al., 2007]
although this view is not held without the realisation that the best way to alleviate caries is to
augment the behaviour of the individual [NIH, 2001].
1.3 Current Concepts in Caries Factors such as socio-demographic status, income, habits or oral hygiene, attitudes and education
are all able to be used as determiners for those individual who are at greater risk of developing the
disease (Figure 1.1). Persons on a lower income are generally more likely to experience caries than
General Introduction | Ch.1
5
those who earn more. Likewise, negative or apathetic attitude towards oral health or regular clinical
examinations are usually associated with the same problem. However although these factors are
considered are considered useful in identifying at-risk individuals, their efficacy is low [Reisine and
Psoter, 2001]. Even the correct designation of an individual into one of these groups does not ensure
the correct treatment plan would be applied. For this reason it is important to look further into the
factors which are known to contribute. These are the factors which are specific to the oral
environment. Knowledge of these internal factors may enable a much more accurate determination
of the risk of developing dental caries.
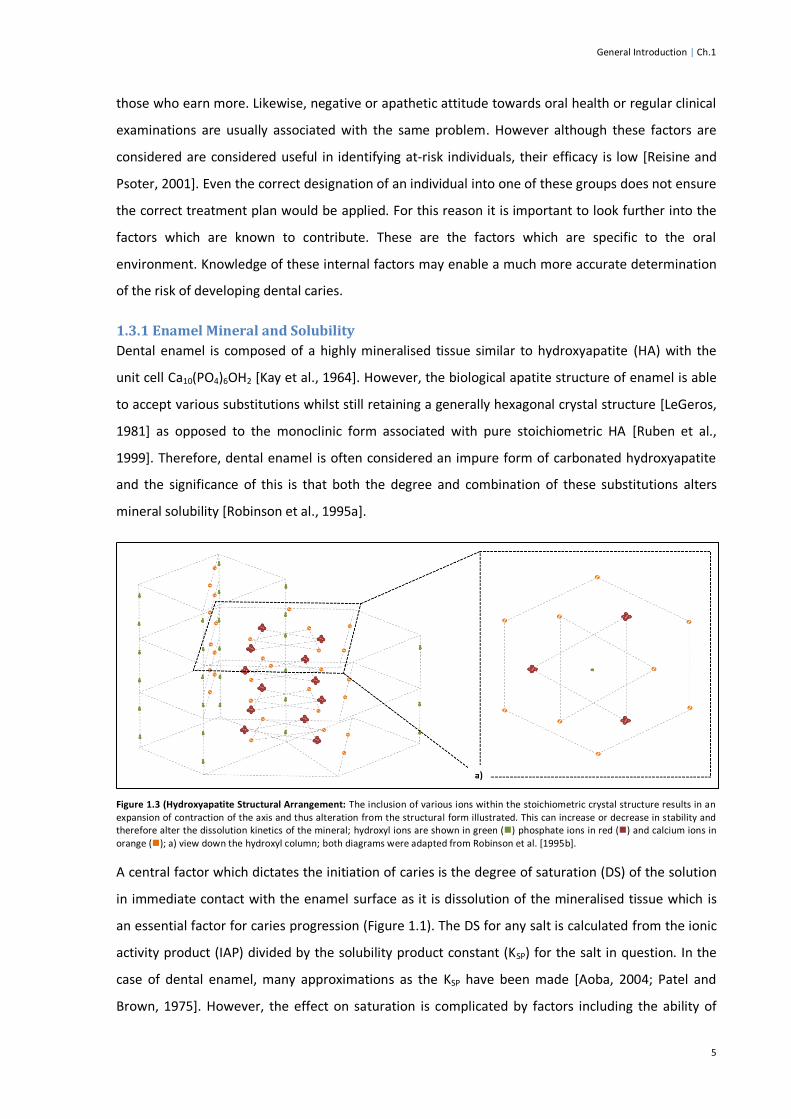
1.3.1 Enamel Mineral and Solubility
Dental enamel is composed of a highly mineralised tissue similar to hydroxyapatite (HA) with the
unit cell Ca10(PO4)6OH2 [Kay et al., 1964]. However, the biological apatite structure of enamel is able
to accept various substitutions whilst still retaining a generally hexagonal crystal structure [LeGeros,
1981] as opposed to the monoclinic form associated with pure stoichiometric HA [Ruben et al.,
1999]. Therefore, dental enamel is often considered an impure form of carbonated hydroxyapatite
and the significance of this is that both the degree and combination of these substitutions alters
mineral solubility [Robinson et al., 1995a].
Figure 1.3 (Hydroxyapatite Structural Arrangement: The inclusion of various ions within the stoichiometric crystal structure results in an expansion of contraction of the axis and thus alteration from the structural form illustrated. This can increase or decrease in stability and therefore alter the dissolution kinetics of the mineral; hydroxyl ions are shown in green () phosphate ions in red () and calcium ions in orange (); a) view down the hydroxyl column; both diagrams were adapted from Robinson et al. [1995b].
A central factor which dictates the initiation of caries is the degree of saturation (DS) of the solution
in immediate contact with the enamel surface as it is dissolution of the mineralised tissue which is
an essential factor for caries progression (Figure 1.1). The DS for any salt is calculated from the ionic
activity product (IAP) divided by the solubility product constant (KSP) for the salt in question. In the
case of dental enamel, many approximations as the KSP have been made [Aoba, 2004; Patel and
Brown, 1975]. However, the effect on saturation is complicated by factors including the ability of

General Introduction | Ch.1
6
apatites to incorporate substitutions (and the resultant affects these on the KSP) [LeGeros, 1981] and
a natural variability of tissue itself [Theuns et al., 1986b]. Hence, several approximations have been
made as to a representative stoichiometry for the enamel mineral (Figure 1.4) although it is widely
accepted that substitutions which create strain in the lattice will increase the KSP and those which
reduce strain or lattice dimensions will lower it. Figure 1.4a illustrates a generalised structure
calculated using human enamel [Aoba, 2004]. Clearly, the natural tissue itself would provide the best
substrate for experimentation [Mellberg, 1992]. However, for the general purpose of studying the
factors which alter the potential for de- or re-mineralisation, a simpler model is usually adopted (HA;
Figure 1.4b) as an analogue [Driessens, 1982].
Figure 1.4 (Chemical Structures of Enamel Minerals): a) Proposed ionic formula for human enamel [Aoba, 2004] where y = x – q –u; b) Stoichiometric structure of the mineral hydroxyapatite; c) Ionic formula for the fluoridated hydroxyapatite mineral (a mineral composed of both hydroxyapatite and fluorapatite); d) Ionic activity product calculation for hydroxyapatite.
The importance of adopting this putative composition is that from this, the KSP can be calculated.
This allows for the determination of the point at which any solution would become saturated with
respect to this mineral and therefore the point at which de- or remineralisation would be favoured.
However, calculation of the KSP alone does not provide full information on the mineralisation
process. The ionic activity product (IAP) of the solution in immediate contact with the surface of the
enamel must also be known in order to provide reference point within the physical environment.
Furthermore, such thermodynamic qualities only provide information on how a reaction should
proceed when in reality the kinetics of mineralisation will also have a significant influence. The IAP is
the nth root of the product of the activities of the ions relevant to the salt in question raised to the
proportion to which they constitute the salt where “n” is the sum of ions within the unit cell (Figure
1.4d). When the IAP is equal to the KSP the solution is at equilibrium. When the IAP is a value greater
than the KSP remineralisation is be favoured and when the IAP is less than the KSP the result is an
indication for demineralisation. As is evident from Figure 1.4d, a reduction in the chemical activity of
any one of the species which constitute the mineral will result in a reduction in the IAP. Based on Le
Chatellier's principle that any system at equilibrium will react to dissipate any change imposed on it,
the introduction or removal of one species will result in a shift in the system so that IAPs will again
General Introduction | Ch.1
7
satisfy KSP. Thus, it is apparent from the definition of IAP that additional Ca2+ would increase IAP and
so would reduce the likelihood of mineral dissolution (as would the addition of PO43- or OH-).
Although the oral environment is not a closed system, sources of calcium are nevertheless
appreciable [ten Cate, 2004], particularly from a perspective of raising the IAP to encourage
remineralisation or cariostaticity. The determination of IAP and KSP is also particularly useful when
comparing the effect of ionic substitutions such as those of F- and CO32-. Different substitutions may
also incorporate into the HA lattice heterogeneously and so when evaluating the DS for a complex
mixture, such calculations may not provide a complete picture of the mineralisation process [Aoba,
2004] and therefore the DS should only be used as an approximation to the situation which may
occur or to provide support for conclusions draw from further, more definitive, parameters.
One of the most important substitutions is the inclusion of ionic fluoride (F-) in place of OH-
(Ca5(PO4)3OHxF1-x) [Fejerskov et al., 1994; Robinson, 2009]. As noted above, the enamel mineral is
composed primarily of Ca2+, PO43- and OH- each of which contribute the IAP when present in
solution. It is their contribution to the IAP in solution and their susceptibility to pH-induced changes
which results in the sensitivity of enamel to acidic challenges. Interactions of ionic hydrogen (H+)
with PO43- and OH- effectively remove these species from the system by reactions which form HPO4
2-
and H2O respectively [Featherstone, 1977]. Although not removed completely, the relevant ionic
species are lost and a decreases in the DS results. The incorporation of F- in place of OH- is not
impervious to this phenomenon however F- is capable of reducing enamel solubility and enhancing
remineralisation though an alteration of these, and other, processes [Bollet-Quivogne et al., 2005].
Fluoride significantly reduces the KSP of the enamel mineral [Larsen, 1986; Margolis et al., 1986].
Interestingly the greatest reduction in bulk mineral solubility is achieved by only partial inclusion in
the lattice [Moreno et al., 1974]. This heightened stability with only partial substitution has been
explained on the basis of the fluoride-induced disorder in the orientation of the OH- column along
the lattice [Aoba, 1997] therefore stabilising the OH- column within [Robinson et al., 1995a].
However, the protective effects of fluoride are not instantaneous. Fluoride is thought to be
incorporated into the enamel mineral over a period of time [Featherstone, 1999] and an explanation
for this lies in the mechanism by which fluoride is incorporated.
As noted above, enamel is a chemically heterogeneous mineral [Robinson et al., 1995a] and the
fluoride-free mineral is more liable to acid-induced dissolution than the fluoridated form [Robinson
et al., 2000]. Before exposure to the oral environment the enamel mineral is partially composed of
impurities such as CO33- and Mg2+ however ions such as these reduced the stability of the mineral
whereas fluoride increase it [Aoba, 1997; Robinson, 2009]. The result of this is that as the pH is

General Introduction | Ch.1
8
reduced during acidic challenge, the solution in immediate contact with the enamel surface remains
saturated with respect to the fluoridated mineral for longer than for the fluoride-free mineral
[Lynch et al., 2006] therefore favouring the replacement of the fluoride-free mineral by the
precipitation of a fluoridated phase. Further to this, fluoride bound to the immediate enamel surface
may also protect from acid dissolution [Robinson et al., 1995a] by reducing the surface pKa and thus
inhibiting protonation [Robinson et al., 2006]. The requirement of lattice vacancies or opportunities
for precipitation for fluoride incorporation means that fluoride must be available during a
demineralising challenge in order to exert its protective effect(s) [Featherstone, 1999].
Fluoride is a unique in that it is both an accelerator of mineralisation and an inhibitor of
demineralisation. The exact process by which the enamel mineral precipitates is still a subject for
debate however there is compelling evidence that the HA form precipitates from hydrated layers of
plate-like octaclacium phosphate (OCP) and to this end, fluoride is able to facilitate the re-
arrangement of adjacent OCP layers into a HA lattice [Tomazic et al., 1989]. However, if the
formation of OCP is not kinetically favoured in the mineralising media, fluoride can also be
precipitated directly into the HA lattice or substitute for OH- [Aoba et al., 2003] if the driving force
(i.e. the degree of saturation) is high enough.
Free ionic species and the medium in which they exist are therefore of crucial importance in
determining dissolution behaviour. In addition, the DS may not be solely dependent on bulk mineral
dissolution but may also be significantly affected by further aspects of the media. Aspects such as
the influence of interchangeable ionic species noted above but also inter-chelating agents [Rose,
2000b; ten Cate et al., 2008] and mechanistic [Buzalaf et al., 2011] or biological reservoirs [Rose,
2000b; Vogel et al., 2010]. The reasons for this are due to the dynamic nature of the interactions
between ionic species. When considering the interaction between ions which are relevant to
mineralisation, it is important to note that a number of interactions may occur, this can result in the
formation of non-apatitic mineral phases such as CaF2 [Christoffersen et al., 1995], calcite and
brushite. By their very nature as ions, the elements are also able to bind to many other sites such as
carbonate and phosphate groups. Furthermore, it is important to consider that the oral fluids which
surround the dental hard tissues are considerably dissimilar with respect to their composition and
may also be compositionally localised such as is the case for the plaque-fluid (PF) [Jenkins, 1966].
1.3.2 Saliva and Dental Caries
Saliva is the principle fluid present in the oral environment. Its primary purposes include to lubricate
the oral surfaces [Amerongen and Veerman, 2002; Ship, 2004], confer protection from viruses,
bacteria and other invading organisms [Marsh and Martin, 2009b; Tenovuo, 2004], to aid in the

General Introduction | Ch.1
9
digestive process and mastication [Amerongen and Veerman, 2002; Mandel, 1987] and to provide a
protective environment for the dental hard tissues [Hannig, 2002; ten Cate, 2004]. The composition
of saliva has been the subject of several in-depth books and review papers [Amerongen and
Veerman, 2002; Dowd, 1999; Edgar and Higham, 1995; Larsen and Pearce, 2003; Lenander-Lumikari
and Loimaranta, 2000]. Each of which sought, in part, to delineate the relationship between salivary
composition and dental mineral dissolution (the beginnings of the caries process discussed above).
With respect to dental caries, the main protective effects conferred by saliva are due to buffering
[Edgar and Higham, 2004; ten Cate, 2004] and the clearance of dietary carbohydrates [Dawes,
2004b]. Saliva also contains various constitutes which are able to help maintain a relatively neutral
pH (such as PO43- and peptide fragments) although buffering capacity is principally derived by the
presence of bicarbonate (H2CO3) [Dowd, 1999], phosphate may play a minor role [Lenander-Lumikari
and Loimaranta, 2000]. Increased salivary flow increases the buffering capacity of the saliva [Bardow
et al., 2000] and therefore conferring improved protection from cariogenic challenges [Dodds et al.,
2005]. However, a definitive relationship between unstimulated salivary flow rate and caries
incidence remains to be proven conclusively [Lenander-Lumikari and Loimaranta, 2000] perhaps due
to the inter-individual variations which are inherent in clinical trials [Larsen et al., 1999]. Various
other constitutes of saliva are nevertheless crucial for it to fulfil the variety of the functions which it
has [Amerongen and Veerman, 2002; Bardow et al., 2008; Dodds et al., 2005; Rudney, 2000]. Within
the oral environment the invasion of pathogenic organisms and virus is hindered by immunological
factors (sIgA, Lysozyme Lactoferrin and Myeloperoxidases) [Amerongen and Veerman, 2002] and
enhanced clearance following bacterial aggregation [Tenovuo, 2004]. However during a cariogenic
challenge, saliva is not in direct contact with the point of lesion formation rather it is the fluid phase
of dental plaque (the PF) which is [Duckworth and Gao, 2006].
Although the major source of fluid within the oral environment, saliva only forms the basis of supra-
gingival PF due in part to the fact that life in the biofilm state enables microbial communities
mediate their environment [Gilbert et al., 2002]. It is therefore plays a role in maintaining (but does
not dictate) PF composition and mineral equilibrium. Nowhere is this more important than during
metabolic activity within the biofilm where the PF may become under-saturated with respect to the
mineral phase of the dental tissue [Margolis and Moreno, 1994] however the composition of the PF
is nevertheless mediated by the physiology of the microbes which exist within the biofilm [Bowden
and Li, 1997; Edgar and Higham, 1990; Margolis and Moreno, 1994; Vogel et al., 1990]. Saliva is able
to return the PF to a point of saturation through the neutralisation of harmful plaque acids [Stookey,
2008] helping to maintain a stable environment and thus prevent mineral dissolution [Duckworth

General Introduction | Ch.1
10
and Gao, 2006]. Further to this, the PF is able to accumulate ions which are relevant to the caries
process [Edgar and Tatevossian, 1971] which are themselves provided by both the saliva and
retained from the mineral following some level of dissolution.
Since the early measurements conducted by Tatevossian and Gould [1976], it has become apparent
that with analysing the composition of the PF, an array of species are involved in determining
saturation respect to enamel mineral [Higham and Edgar, 1989; Margolis and Moreno, 1992;
Margolis et al., 1985] as are the length of exposure to undersaturated conditions, the severity of the
demineralising challenge and the frequency at which these “cariogenic challenges” occur [Marsh and
Nyvad, 2008; ten Cate et al., 2008]. [Tatevossian and Gould, 1976]
The ability of saliva to deliver caries inhibiting agents to the tooth surface is also an important
property of this fluid. The immunological factors may help to inhibit pathogenic organisms and
prevent bacterial overgrowth but these functions are not fully maintained within the PF. Biofilms
provide an anchorage within the physical environment and a generally greater resistance to
environmental stresses or antimicrobial agents [Gilbert et al., 2002]. Specifically to dental plaque,
the aspects of the immunological system (such as sIgA, IgG and IgM) are degraded by proteolysis
within the plaque whilst retaining some ability for agglutination [Hsu and Cole, 1985] and therefore
providing an example of the ability of microbial populations within biofilms to take advantage of
factors which would present a disadvantage to life in the planktonic state.
Saliva is also naturally supersaturated with respect to the enamel mineral [Hay et al., 1982] however,
spontaneous precipitation of calcium-containing mineral phases are inhibited by the presence of
proteins such as proline-rich proteins (PRPs), histatins, cystatins and statherin [ten Cate, 2004]. The
same proteins are also able to adhere to the enamel surface producing a thin film approximately 0.1
µm thick known as the acquired enamel pellicle (AEP). Following adherence, salivary proteins may
undergo a conformational change [Lendenmann et al., 2000] and the resulting AEP layer both
protects the surface enamel from dissolution [Featherstone et al., 1993; Zahradnik et al., 1976] and
enables pioneer organisms to such as Streptococcus spp. [Gibbons et al., 1986; Gibbons and Hay,
1989] and Actinomyces viscous [Gibbons and Hay, 1988; Gibbons et al., 1988] to adhere to the
surface thus forming biofilms [Marsh and Martin, 2009c]. Given the antimicrobial actions and
attachment-facilitating properties of saliva, this fluid therefore provides both negative selection for
life in the planktonic state and positive selection for the formation of a biofilm [Rudney, 2000] and
therefore the construction of micro-environments which are essentially unique from that of the
saliva [Beer and Stoodley, 2006; Edgar and Higham, 1990; Vogel et al., 1990].

General Introduction | Ch.1
11
One of the most important roles of saliva is that of a nutrient source for microbial community itself
[Bowden and Li, 1997]. Once a biofilm community has become established, a complex network
physical interactions and food webs become established whereby the metabolic end products of
some species become the nutrient sources for others. The most well-know of these is the
relationship between Veillonella spp. and lactic acid-producing bacteria [Spratt and Pratten, 2003].
Veillonella spp. are able to metabolise lactate releasing energy in the form of ATP and weaker high
pKa acids as metabolic end products [Rogosa and Bishop, 1964]. In such a relationship the benefit for
the consumer is clear although there are wider implications which could results from the higher pKa
acid anion as is described in the following the sections (Section 1.3.3 and Section 1.3.4). Further to
this, the saliva helps to perpetuate the very existence of the microbes which inhabit the oral
environment by acting as a vehicle for transmission of the community from one host to another
[Balakrishnan et al., 2000].
Furthermore, the vast array of microbes present in vivo [Aas et al., 2005] are likewise able to
metabolise a wide range of organic substrates. As noted above, this is this may result in the
utilisation of end products however the collective metabolic capacity of several species may also
enable direct utilisation of different salivary constitutes or co-operative degradation through action
of externally secreted enzymes. Also, it should be noted that constitutes of the saliva are not all used
in a classical sense of nutrition. In viewing a biofilm as a collective or super-organism [Buchen, 2010]
it is understood that the physical structure and composition thereof plays a central role in
modulating the physiological conditions of the biofilm. To this end, nutrients which are provide by
the saliva may also be utilised for the formation of exo-polymeric substances (EPS) which form the
mature biofilm matrix and thus modulate the diffusion of salivary nutrients themselves and the end
products noted above [Bowden and Li, 1997].
1.3.3 Microbial Influence and the Ecological Plaque Hypothesis
Since the theory of “The Worm” (5000 BC), advances in our understanding of dental caries have
been progressed enormously [Flannigan, 2005]. Miller [1890] was the first to summarise that the
role of microbial fermentation (and the subsequent production of acids) which lead to the
disintegration of the mineral within dental hard tissues [Köhler, 1974]. Currently the Ecological
Plaque Hypothesis (EPH) [Marsh, 1994] is the most widely accepted theory to explain the formation
and progression of dental caries [Marsh and Martin, 2009a]. This theory emphasises the point that
no one specific organism or agent is responsible for the formation of a cariogenic plaque. This is in
opposition to other, theories where all dental diseases (not least of all dental caries) were thought to
be the result of a discrete disease causing factor (Specific Plaque Hypothesis; SPH) [Loesche, 1976].
Like the SPH, the EPH accepts that something unique must exist about an established plaque

General Introduction | Ch.1
12
community which results in caries formation [Marsh, 2003b] but essentially, both of these are in
contrast to the Non-Specific Plaque Hypothesis (NSPH) which associates oral diseases with a build-up
plaque without distinction of the ecology or capacity of the biofilm [Theilade, 1986]. The distinction
of the EPH is that the specific ecology of the plaque following establishment and, crucially, frequent
exposure to fermentable carbohydrates are the determining factors for the carcinogenicity of the
biofilm [Marsh, 2003b].
Recently however, the EPH has been revisited with the aim of taking account of the processes which
are known to result in the ecological shift toward a cariogenic state and how this relates to both
clinical presentations and the assumed condition of the underlying substratum. This refinement has
been dubbed the Extended Ecological Plaque Hypothesis (EEPH) [Takahashi and Nyvad, 2008] and in
its entirety, the EEPH expresses great similarity to the EPH. Dental plaque is noted as a dynamic
microbial ecosystem in which Streptococcus spp. (both mutans and non-mutans groups) and
Actinomyces spp. are central in maintaining a point known as dynamic stability [Takahashi and
Nyvad, 2008]. This is the point at which the biofilm has matured and is followed by adaptation and
changes in the relative proportions of the biofilm community. However, at this point the properties
of the biofilm remain stable with respect to cariogenic potential. The bacteria present have the
ability to produce acids via fermentation and these acids have the potential to demineralise the
dental hard tissues although these events are quickly offset and the biofilm pH is easily returned to
neutral level by buffering agents within and the metabolic activity of the microbes themselves
[Marsh and Martin, 2009a]. In effect, cariogenic challenges are produced by microbial fermentation
and it is the severity of the challenge which is altered by a change in the microbial ecology.
If buffering capacity proves inadequate or the frequency of carbohydrate intake is excessive, the
biofilm will become exposed to increasingly prolonged acidic conditions [Marsh and Bradshaw,
1997]. As a result of an adaptive selection process, species which are able to withstand this pH shift
gain a selective advantage over those which are not [Marsh, 2003b]. Thus these resistant community
members proliferate along with those which produce acids themselves (as acidogenic bacteria are,
through their own evolution, aciduric). The pH of the biofilm thus decreases further during each
cariogenic challenge further enhancing acidogenicity. However, the persistence of this state
following an ecological shift has yet to be addressed fully. The acidic conditions produced by
fermentation confer a selective advantage over for those species which are unable to tolerate such
conditions [Bradshaw et al., 1989]. However if the acidic episodes are reduced then this selective
advantage would be lost. Colonisation resistance may maintain the community for a period of time
[Sissons et al., 1995] but in the absence of this selective pressure may, in effect, alter the niche

General Introduction | Ch.1
13
environment to one in which less acidogenic species can compete and thus replace proportions of
the acidogenic species. In this way, the plaque biofilm may have the capacity to revert back to a less
cariogenic state if the removal of the selective pressure presents some benefit to such a community.
Although consensus agreement has moved away from the use of the SPH to explain caries aetiology,
alterations to the plaque ecology facilitate the predomination of specific acidogenic and aciduric
species [Marsh, 2006]. Streptococcus spp. and Lactobacillus spp. were some of the first
microorganisms to be implicated in the causation of dental caries [Fitzgerald et al., 1966; Orland et
al., 1954]. Since this point, Streptococcus spp. [Bowen, 1996; Kivelä et al., 1999b; Kleinberg, 2002],
Lactobacillus spp. [Becker et al., 2002; Kivelä et al., 1999b; Marsh and Martin, 2009b] and mutans
streptococci [Balakrishnan et al., 2000; Bowen, 1996; Frandsen et al., 1991; Loesche, 1986] have
been consistently implicated in both aetiology of this disease and in biofilm formation. Although first
implicated over 50 years ago [Mikx et al., 1972] the role of Veillonella spp. is now receiving
increasing attention [Arif et al., 2008; Palmer et al., 2006; Periasamy and Kolenbrander, 2010] as the
concept of microbial ecology within the EPH has become more widely adopted.
The thickness of the plaque biofilm ranges depending on the specific site on which it accumulates
[Sissons, 1997]. On smooth surfaces this can range up to 200 µm [Main et al., 1984] with aproximal
and fissured surfaces being able to support a much greater biological mass (≥ 2 mm) [Igarachi et al.,
1989; Newman and Morgan, 1980]. Furthermore, the intra-oral experiments performed by Auschill
et al. [2004] demonstrated that the topography of the site is an important factor which augments
the formation of plaque biofilms. It can further be deduced that the amount of support which
tooth’s surface provides is responsible for this relationship however variation in relatively un-
restricted biofilm have been demonstrated in situ [Auschill et al., 2004].
The microbial consortia which gives rise to dental plaque has a significant impact on the buffering
capacity [Shellis and Dibdin, 1988] and ionic composition of PF and so would be central to the
mineralisation dynamic of the underlying enamel surface [Jenkins, 1966]. The collective microbial
population which is able to inhabit the human oral cavity is also thought to consist of more than 700
species [Aas et al., 2005; Marsh, 2004; Paster et al., 2001] many of which are as yet “uncultivated”
[Wade, 2002]. For a given individual approximately 100 different species are expected to be present
[Chhour et al., 2005] therefore creating an extremely complex set of relationships which govern an
already multifactorial disease. This highly diverse array of microorganisms interact to form an
ordered community with a structure which provides optimal conditions for proliferation within their
given environment [Kolenbrander et al., 1999; Kolenbrander et al., 2006; Marsh and Martin, 2009a].
Existence within the biofilm state may also result in a phenotypic change in the microorganisms
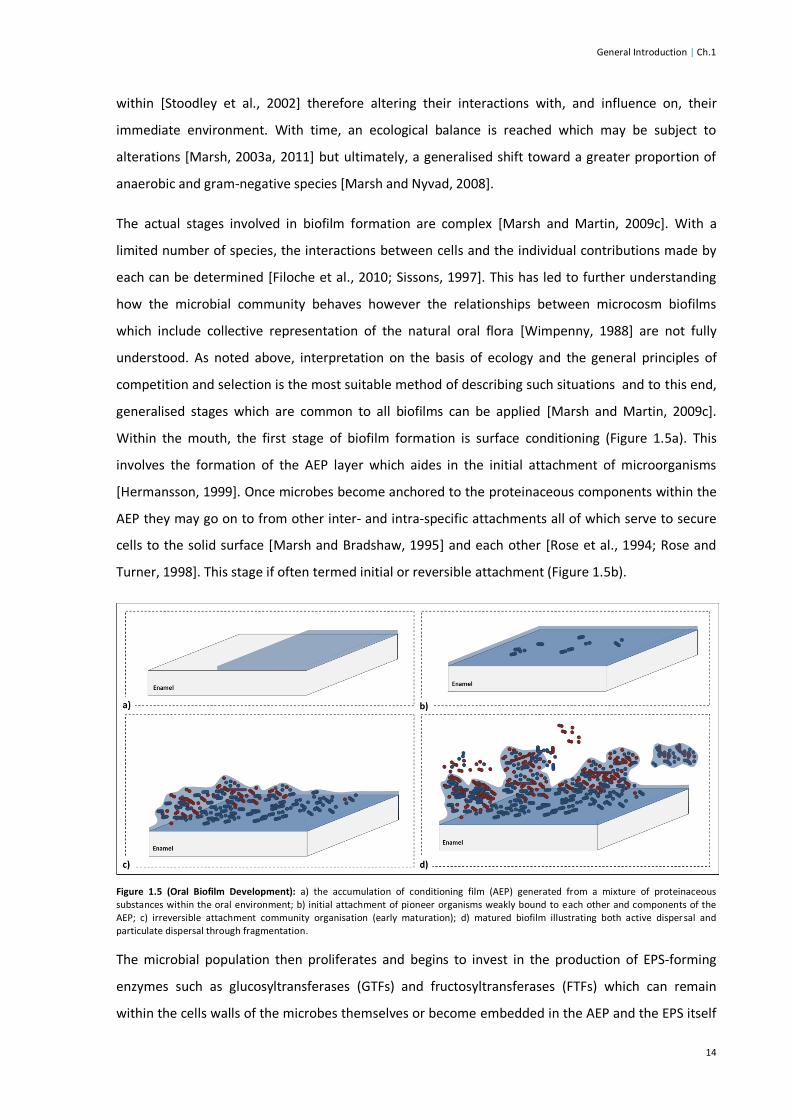
General Introduction | Ch.1
14
within [Stoodley et al., 2002] therefore altering their interactions with, and influence on, their
immediate environment. With time, an ecological balance is reached which may be subject to
alterations [Marsh, 2003a, 2011] but ultimately, a generalised shift toward a greater proportion of
anaerobic and gram-negative species [Marsh and Nyvad, 2008].
The actual stages involved in biofilm formation are complex [Marsh and Martin, 2009c]. With a
limited number of species, the interactions between cells and the individual contributions made by
each can be determined [Filoche et al., 2010; Sissons, 1997]. This has led to further understanding
how the microbial community behaves however the relationships between microcosm biofilms
which include collective representation of the natural oral flora [Wimpenny, 1988] are not fully
understood. As noted above, interpretation on the basis of ecology and the general principles of
competition and selection is the most suitable method of describing such situations and to this end,
generalised stages which are common to all biofilms can be applied [Marsh and Martin, 2009c].
Within the mouth, the first stage of biofilm formation is surface conditioning (Figure 1.5a). This
involves the formation of the AEP layer which aides in the initial attachment of microorganisms
[Hermansson, 1999]. Once microbes become anchored to the proteinaceous components within the
AEP they may go on to from other inter- and intra-specific attachments all of which serve to secure
cells to the solid surface [Marsh and Bradshaw, 1995] and each other [Rose et al., 1994; Rose and
Turner, 1998]. This stage if often termed initial or reversible attachment (Figure 1.5b).
Figure 1.5 (Oral Biofilm Development): a) the accumulation of conditioning film (AEP) generated from a mixture of proteinaceous substances within the oral environment; b) initial attachment of pioneer organisms weakly bound to each other and components of the AEP; c) irreversible attachment community organisation (early maturation); d) matured biofilm illustrating both active dispersal and particulate dispersal through fragmentation.
The microbial population then proliferates and begins to invest in the production of EPS-forming
enzymes such as glucosyltransferases (GTFs) and fructosyltransferases (FTFs) which can remain
within the cells walls of the microbes themselves or become embedded in the AEP and the EPS itself

General Introduction | Ch.1
15
[Burne, 1991; Leme et al., 2006; Marsh and Martin, 2009a]. At this point the microbial cells become
more securely attached within the EPS matrix [Banas and Vickerman, 2003; Bowen and Koo, 2011]
and although the connections involved in initial attachment may still be active, the matrix renders
the community in a state which is referred to as irreversible attached (Figure 1.5c). However,
changes to the biofilm structure do not cease at this point [Marsh and Martin, 2009c; Spratt and
Pratten, 2003]. The biofilm undergoes a process of maturation whereby community succession takes
place and complex networks of channels and voids are created by the activity of the members within
the community [Wood et al., 2000]. Hitherto, a series of physical [Kolenbrander and London, 1993]
and nutritional dependencies may also develop some of which being mutualistic [Spratt and Pratten,
2003] or actively competitive [Tong et al., 2007].
Figure 1.6 (Cariogenicity of Dental Plaque): Hypothetical illustration of the periods of plaque biofilm acidification which occur following exposure to fermentable carbohydrates. Both cariogenic (highly acidic) and non-cariogenic (mildly acidic) examples are given. The critical
pH is designated as 5.5 however depending on the initial DS of the biofilm PF this may vary [Margolis and Moreno, 1994].
Further to this, microbes such as Streptococcus mutans are able to produce endodextranases which
degrade the α1-6 linkages of the EPS-associated dextrans produced by earlier colonisers such as
Streptococcus mitis and Streptococcus sanguinis thus enabling their invasion into an established
biofilm [Balakrishnan et al., 2000]. Mechanisms such as this and the maturation process itself do not
run to a terminal end point rather (as described above for the EPH) [Marsh, 1994], the community
retains a degree of plasticity enabling it to react in order to exploit the changes in its environment
[Marsh and Martin, 2009c]. In this way, the concept of a “mature biofilm” relates only to an
4
4.5
5
5.5
6
6.5
7
7.5
0 10 20 30 40 50 60 70 80 90
pH
Time (Minutes)
Cariogenic Biofilm Critical pH Non-Cariogenic Biofilm

General Introduction | Ch.1
16
established structure. Whilst existing in the mature state further episodes of dispersal can take place
(Figure 1.5d). Dispersal is proliferative mechanism which allows community members to colonies
other sites within their environment or to escape unfavourable conditions within the biofilm. It
should also be noted that dispersal need not be triggered by the microbes themselves, in this sense
damage resulting from physical sheering forces can dislodge fragments of the biofilm which,
retaining their viability, can then go on to colonise other areas.
As noted above, in the presence of fermentable carbohydrates member of the biofilm community
produce acids which lower the pH of the biofilm and over time this leads to the selection of more
acidogenic or aciduric species [Marsh, 2003b]. Figure 1.6 (above) illustrates the relationship of this
response to the cariogenicity of biofilm. Acidification alone is not sufficient to result in carious
demineralisation rather the extent to which PF becomes undersaturated with respect to the enamel
mineral, the length of the demineralising challenge and the frequency of the exposures are what
determine whether or not caries will develop [Takahashi and Nyvad, 2008]. When periods of
demineralisation outweigh opportunities for remineralisation the net result is mineral loss.
1.3.4 Caries Lesion Formation
One defining aspect of a carious lesion is a relatively intact surface layer (SL) covering a deeper area
of greater demineralisation [Silverstone, 1968]. Various methods are available for the study of the
degree of mineralisation in dental tissues although TMR [Angmar et al., 1963] is currently considered
the foremost reliable and definitive technique [Arends and ten Bosch, 1992] enabling quantification
of the fine structures which develop within the carious lesions. These lesions are unique in that bulk
tissue loss does not immediately occur. Under exposure to relatively weak acidic challenges the un-
dissociated acid is able to diffuse through natural pores in the tissue and focal holes produced by the
acidic challenge itself. This allows for deep subsurface penetration where the acid then dissociates.
At this point reactions take place between the components of the dissociated acid and the enamel
mineral itself. As described above, the general principles of mineral dissolution apply. However,
further physical parameters are now involved as the reaction products are not localised to one place,
rather the liberated lattice ions, H2O and Ca-acid salts are free to diffuse through the tissue
establishing new equilibria in the process. Over time a caries lesion will develop (Figure 1.7). This is
essentially different from erosion where bulk tissue loss is observed as the ultra-structure of the
enamel tissue is destroyed [Larsen, 1991].
Several theories have been put forward which aimed to consolidate experimental observations into
a singular theory [Anderson and Elliott, 1992; Arends and Christoffersen, 1986]. Of these, it appears
that some aspects may be applicable to the situation in vivo whereas others may be less influential

General Introduction | Ch.1
17
[Arends and Christoffersen, 1986]. Clearly, any process which is proven to elicit an effect would do
so if the conditions favoured such event. In essence, the exclusion of theories consolidated by
Arends and Christofferson [1986] is based on those which exert the greatest effect and thus which
would presumably be the most likely to result in clinical presentation.
Figure 1.7 (Caries Lesion Formation): Mineral density profile in describing some of the discreet stages involved in typical caries lesion formation. Note that lesions need not develop a full character in order to present clinically as “white-spot lesions”. If conditions remains relatively stable, lesion formation generally flows the order indicated (Sound Enamel > Surface Softened Enamel > initial Lesion Character > Full Lesion Character)
The first of the theories reviewed by Arends and Christoffesen [1986] attribute some aspects of
lesion formation to the structural arrangement of the enamel tissue and to the compositional
gradients which exist within. As noted above, enamel is not homogenous with respect to
composition [Shore et al., 1995b] and gradients exist which alter the solubility of the mineral
[Theuns et al., 1986b]. Therefore it is plausible that during an acidic or cariogenic challenge, the less
soluble phases which exist near the surface would remain stable while deeper, more soluble phases
would dissolve. As simplistic as it is, this mechanism is perfectly reasonable but it does not explain
the fact that lesions have been created in compressed HA aggregates [Anderson and Elliott, 1992;
Langdon et al., 1980] which do not possess these physiochemical features [Arends and
Christoffersen, 1986]. However, for a natural enamel surfaces it is possible that the process of
chemical maturation [Shore et al., 1995b] would exaggerate such a solubility gradient within the
tissue.
40
45
50
55
60
65
70
75
80
85
90
0 20 40 60 80 100 120 140 160
Min
era
l Vo
lum
e (
%V
ol)
Distance form the Enamel Surface (µm)
Sound Enamel Surfcae Softened Enamel Initial Lesion Chatracter Full Lesion Character

General Introduction | Ch.1
18
In a similar way, the attachment of agents which inhibit demineralisation has also been proposed to
play a role in the retention of and SL at the expense of deeper areas of the tissue [Gray and Francis,
1963]. However, subsequent research has been able to indicate that the SL was not composed
entirely of the original mineral when artificial lesions were created in vitro [Lagerweij and ten Cate,
2006; Theuns et al., 1984]. Thus, the concept that the SL feature was actually the remnants of a
more protected layer of the tissue could not be entirely true. Further theories where thus brought
forward to help described a mechanistic basis for subsurface demineralisation.
An obvious candidate is the fluoride-induced precipitation of a less soluble mineral phase during
enamel demineralisation. This has been supported by the in vitro studies which have definitively
shown that during a dynamic process of de- and re-mineralising challenges, fluorides accumulate in
the SL resulting in less acid-susceptible mineral phase [Lagerweij and ten Cate, 2006]. The concept
behind this is known as the dissolution-precipitation mechanism and it is based on the fact that the
reactive species (fluoride) will enhance precipitation in the outer layers of the tissue whereas un-
dissociated acids are able to diffuse further into the porous tissue structure, the driving force of
demineralisation is able to penetrate further than that of remineralisation [Margolis and Moreno,
1985]. In reality, the combination of a surface protection (due mainly to fluorides) and the diffusion-
precipitation mechanism is the most likely cause of subsurface character observed in caries lesions
[Arends and Christoffersen, 1986; Ingram, 1990].
Whilst it is appreciated that caries lesion may form through a diffusion-precipitation mechanism in
conjunction with a degree of conferred surface protection, it is also clear that the rate of diffusion
through the enamel tissue would strongly influence the process [Margolis and Moreno, 1985]. To
this end, SL formation had been attributed to both incongruent dissolution [Brown and Martin,
1999] and couple diffusion [Anderson and Elliott, 1987]. The factors which govern the actual
progress of caries lesions in terms of the volume of mineral lost are dependent efflux of mineral ions
out of the lesion as opposed to a redistribution of the mineral itself however the distribution of
mineral can restrict diffusion [Featherstone, 1977]. It would appear that either of these concepts can
dictate mineral loss and may work in conjunction to do so. However, the degree to which either
limitation is imposed may depend on the parameters of both the demineralising challenge used and
the physical structure of the substrate.
As noted above, several chemical changes phase transitions occur as carious lesions develop.
However, one of the most important changes are differences which develop in the porosity of the
tissue [Robinson et al., 1995b]. Between tissue substrates this can be an important factor as, for
example, bovine enamel is more porous than human enamel and therefore the diffusion of agents

General Introduction | Ch.1
19
through the tissue is less restricted in the bovine tissue [Featherstone and Mellberg, 1981]. As would
be expected, bovine tissue is more susceptible to cariogenic challenges. Within carious enamel,
variations in the porosity of the tissue do exist. This is due to the preferential dissolution of inter-
prismic enamel leaving the enamel prisms largely intact [Kidd and Fejerskov, 2004]. Generally a
decrease in the level of porosity occurs from the natural surface of the enamel to the advancing
front of the lesion however precipitation in the SL means that the porosity within this area is lower
than in the surrounding tissue (Figure 1.8). This feature means that subsurface mineralisation may
be depended on the porosity of SL as this would determine diffusion into and out of the lesion body.
Figure 1.8 (Carious Lesion Porosity): Darker areas indicate a more porous structure a) external cariogenic environment; b) Surface layer (SL); c) lesion body; d) developing lesion front; d) sound enamel. Adapted from Robinson et al. [1995b].
The fact that scaffold is retained during the initial stages of demineralisation means that this can act
as a point of nucleation for the formation of new mineral and thus provide opportunities for
remineralisation presumably to a point of sound structural integrity. However maintaining porosity
in the SL is essential if diffusion into the deeper layers is to occur, if this is not possible or otherwise
severely impeded then a reduction in the efficacy of remineralisation would result. Expectedly this
has led investigators towards efforts which have aimed to maintain porosity in the SL. In such
circumstance, the use of ionic inhibitors have been applied [Lynch et al., 2011] as have acid buffer
solutions [Cochrane et al., 2008; Yamazaki and Margolis, 2008]. As both the structural integrity of
the tissue and the ability to facilitate subsurface remineralisation are strongly influenced by the SL,
an appreciation of the abiotic principles which govern its formation is necessary.
From the above discussion, it therefore follows that the removal of plaque biofilm would eradicate
the disease however, due to the ubiquitous nature of microbial species this is not a realistic scenario.
Mechanical removal of the plaque biofilm is effective in controlling the disease but for instances
where this is not possible the concept that the biofilm may be altered to a wholly less cariogenic
state is a more viable alternative. Clearly, any investigation which aims to explore such an avenue
would need to account for the microbiology of the biofilm and, to this end, various biological models
have been developed [Sissons, 1997; Tatevossian, 1988]. Of these the film fermenters aim to

General Introduction | Ch.1
20
simulate the conditions which preclude oral biofilm formation most comprehensively although
physiochemical interaction between the biofilm and the enamel substrate are often not included.
Given the relevance of inorganic processes to caries lesion formation an understanding of these
should be applied within a biological context. Notwithstanding that caries is regarded as a highly
complex and multifactorial disease and the complexity of each aspect often necessitates a
concentrated approach, with a greater conceptual understating and assessment of the process,
greater insight can gained.
1.4 Biological and Non-Biological Caries Models In vitro dental research has achieved major advance over the past 50 years. In comparison to in situ
or clinical trials, the quality of the information (and thus the wealth of understanding) provided from
in vitro research has been recognised as far greater [NIH, 2001]. The advantages of in vitro research
over in situ studies are afforded by their ability allow investigators to study specific mechanisms
whilst ensuring that only the desired parameters are altered at any one time [Arends and
Christoffersen, 1986; White, 1995]. Although the measures imposed may be deliberate, key aspects
of the complex biological interactions of the caries process are removed by the use of in vitro models
[White, 1995; White et al., 1992]. An obvious solution to this would therefore be to incorporate into
in vitro studies some of the factors which are important in vivo [Arends, 1995] and this has thus led
to the development of in vitro biological models to complement the more stringent abiotic models.
Abiotic systems are able to produce caries-like lesions through the control of ions which are specific
to the process (such as those described in Section 1.3.4). Further to this, many include other specific
ions for the purposes of investigating their influence lesion formation, progression or reversal
[Lippert et al., 2012; Lynch, 2011; Valappil et al., 2012] and the exclusion of biological variation
enables the effect(s) of these additive(s) to be concluded more effectively [Valappil et al., 2013].
Conversely, bacterial systems tend not tend to include the same emphasis on ionic composition.
However, benefits such as simplification and environmental standardisation are provided [Sissons et
al., 2007] which are not readily controlled in situ [ten Cate, 1994]. Biofilms are able to form using
human saliva as the soles substrate whereas some in vitro cultures are limited by the availability of
cannulated saliva (such as has been employed in the more basic Orofax system [Bibby and Huang,
1980; Yaari and Bibby, 1976]) and thus artificial growth media are often deemed necessary [Sissons
et al., 2007; Tatevossian, 1988]. However, multispecies biofilm communities have proven extremely
resilient [Gilbert et al., 2002]. In a global sense, human oral biofilms are ubiquitous and develop
regardless of natural influences on the oral environment.

General Introduction | Ch.1
21
Figure 1.9 (Constant Depth Film Fermenter; CDFF): Cross-sectional view; a) inoculum inlet, b) medium inlet, c) adjunct agent inlet, d) sampling port cap, e) sampling port, f) air vent (without filter), g) spring-loaded scrapper blade, h) PTFE sample pan, i) rotating turn-table, j) perspex cylinder (cross-section for illustrative purposes), k) motor-unit and l) effluent drain.
One of the most advanced model systems available is the constant depth film ferment (CDFF; Figure
1.9) [Peters and Wimpenny, 1988]. This model is able to support microbial growth and enables a
high degree of control over the almost all extraneous variables [Kinniment et al., 1996; Peters and
Wimpenny, 1988]. This, in turn, allows for control over the environment in which the biofilms are
produced which is not possible in vivo [Sissons, 1997; Tatevossian, 1988]. Further to this, physical
parameters are also accounted for within the CDFF which are not in other biological models [Pratten,
2005]. The entire unit is sealed and sterilised before inoculation with filtered vents to allow for gas

General Introduction | Ch.1
22
exchange whilst ensuring against air-borne contamination (Figure 1.9f). The inoculum (Figure 1.9a),
growth medium (Figure 1.9b), and any combination of additional exposure solutions (Figure 1.9c)
can be introduced by a series of inlet ports which feed-out onto a rotating turntable (Figure 1.9i)
which supports microbial growth. The area for biofilm growth is permitted by a recessed area (Figure
1.9h) within the turntable itself.
Due to the benefits of using microcosm inoculum [Wimpenny, 1988] and the problems associated
with the reproducibility of microcosm plaques [Sissons, 1997] the use of a shared inoculum between
multiple CDFF units has been proposed [Hope et al., 2012]. This had led to the development of the
dual CDFF (dCDFF) model which provides a powerful tool for applications where highly variable
multispecies biofilms are required [Hope et al., 2012]. However, technical limitations are an issue as
the distribution of the inoculant across an increasing number of units leads to heterogenicity in the
fraction which reaches either unit [Spratt, Personal Communication] therefore limiting the
expansion of this design past 3 concurrent CDFFs. However, as noted above the microcosm biofilm
inoculum (and thus the microcosm biofilm) is inclusive of the entire potential of natural plaque
biofilms [Wimpenny, 1988] and as such an enormous adaptive capacity is also afforded.
Nevertheless, the CDFF can provide a simulation of physical parameters which are not provided by
other currently available biological caries models [Sissons, 1997; Tatevossian, 1988]. The rotating
action of the turntable ensures biofilm thickness is kept constant (Figure 1.9g). Starvation periods,
proximity to atmosphere, sheering forces and growth medium or adjunct agent exposures can all be
maintained at a constant or varies depending on the requirements of the study at hand. Thus, an
environment for oral biofilm growth can be modelled in a precise fashion without the need for an in
situ or in vivo approach. To date, enamel caries lesions have not been simulated within a CDFF
although the model itself is currently gaining increased popularity within the field of dental research
as the importance of considering both the mineral dynamics and the state of biofilm ecology in
unison is becoming more widely appreciated. To this end, dentine lesions have been produced
within the CDFF system [Deng and ten Cate, 2004; Deng et al., 2005; Zaura et al., 2011] and the CDFF
has been used to produce biofilms which have subsequently induced demineralisation in enamel
samples [Arthur et al., 2013]. However, the production of enamel lesion within the model has not
yet been demonstrated. Further to this, approaches which have aimed to monitor parameters which
would be likely to induce demineralisation or the augment the caries process have also been
explored [Cenci et al., 2009; Deng et al., 2005; McBain et al., 2003; Pratten et al., 1998b; Vroom et
al., 1999; Zaura et al., 2011].
General Introduction | Ch.1
23
Several other methods have been developed in the pursuit of developing an orally representative
situation. Modifications of the chemostat [Bradshaw et al., 1996], are particularly useful as the
conditions within can be controlled and dictated directly by the investigator. In this system (the
chemostat) the indirect effects of microbial metabolism are not able to significantly alter growth
conditions but with modifications which introduce surfaces for biofilm formation, biofilms form.
Thus whilst the general composition of the growth medium in bulk solution can be maintained,
microenvironments within the biofilms would exist. Whist the chemostat has provided extremely
useful information and unequivocally proven relationships such as the dependency of pH on
cariogenic population shifts as opposed to the affinity of cariogenic species for sugar substrates
[Bradshaw et al., 1989]. However, film fermenters offer the distinct advantages in that the physical
properties of life in the biofilms are reproduced [Tatevossian, 1988]. Oxygen tension, the diffusion of
substrates, the a biphasic formation area up to a controlled volume are all provided within the CDFF
[Peters and Wimpenny, 1988] Clearly, the reproduction of these parameters is not always necessary
or appropriate as any specific interaction can be modelled by a specific experimental design.
However, for a disease which is known to result from the accumulation of a biofilm [Marsh, 1995b],
a biofilm model is ultimately a central aspect which is worth of study.
The fact that a model is currently in use which enables the production and, to a large degree, the
controlled growth of oral biofilms [Kinniment et al., 1996] creates exiting opportunities to contribute
to the current state of understating within carious lesion development and in elucidating the
protective effects of anti-caries ages or strategies. In the case of the former, the production of
enamel caries has not yet been demonstrated within the CDFF model although the model certainly
retains the capacity for this function. Moreover, the production of orally representive caries lesions
may be improved with further refinements to the CDFF system, particularly with greater control over
the chemical parameters within. Nevertheless, a powerful model is demonstrated for the study of
the effects of recommended sodium fluoride (NaF) exposures [Parnell and O'Mullane, 2013] on the
microbial ecology, metabolic activity and cariogenicity. Furthermore, methods which aim to enhance
the plaque-bound oral fluoride reservoirs in vivo or in situ [Vogel, 2011] typically lack the degree of
control or ability to simulate biological aspects of the caries process (respectively) which is afforded
by the use of a model such as the CDFF. In a controlled setting, the variably antimicrobial and robust
anticaries properties of NaF are observable as is the mechanistic action of strategies which enhance
the calcium and fluoride reservoirs within natural plaque. Although the anticaries activity of such
methods are debatable, they are nonetheless worthy of further investigation.

General Introduction | Ch.1
24
1.5 General Objectives and Thesis Structure The general aims of this thesis are to further develop the CDFF model specifically for the study of
occlusal caries whereas secondary aims were to test the efficacy of this model on both known and
proposed anti-caries strategies. In order to develop the model in this way, a full account of the
operating conditions must be gained. Whilst it has been accepted that biological caries models may
be subject to high levels of variation, an attempt to find common response factors by interpretation
of the most relevant aspects of the particular situation will be made. The influence of the plaque
biology on the abiotic foundations of caries production and protection is of direct interest. In
essence, a holistic approach towards the caries process will be adopted within an in vitro model.
As noted above, the CDFF will also be used to investigate known cariogenic mechanisms and anti-
caries strategies. Specifically, the relationship between sucrose exposures and the presence or
persistence of fluorides within plaque-bound reservoirs will be investigated. Moreover, the
applicability of the CDFF for providing an approximation to the natural situation will also be
evaluated and possible improvements implemented for the benefit of future research.
Figure 1.10 (Thesis Structure): Non-experimental sections are illustrated in grey, abiotic investigations are illustrated in blue and investigations which employ a biological element are illustrated in purple. Non biological models were used to help define a practical basis for biological systems which were in turn used to investigate atrocities agents. An alternative strategy for investigating the effects of these agents was also explored in relation to the primary mode of investigation.
The general structure of this thesis (Figure 1.10) follows a logical progression through the use of non-
biological models to develop the CDFF to simulate of occlusal caries (Chapters 2 and 3) and further
characterisation of the previously unknown parameters of the CDFF model (Chapter 4) so as that it
can be used to accurately assess factors which may influence enamel caries lesion formation
(Chapter 5). The primary aim of this thesis is met through the use of a dCDFF model and adjunct
agent exposures during biofilm formation (Chapters 6 to 8) however the secondary aims are
investigated further within an alternative model (sCDFF) in order to quantify their effect on both
fully-formed and cariogenic plaque biofilms (Chapter 9).

25
Chapter 2: Artificial Occlusal Surface Morphology and Enamel
Demineralisation
2.1.0 Introduction Occlusal surfaces of human molar (and pre-molar) teeth are some of the most prone to the
formation of dental caries [Aoba, 2004; Kidd and Fejerskov, 2004]. Furthermore, these surfaces also
exhibit an extremely diverse and complicated structure [Ekstrand et al., 1991; Juhl, 1983b]. The
structure of the occlusal surfaces (illustrated in Figure 2.1.1) results from the process of
ameoleogensis [Shore et al., 1995a] whereby the lobes of developing surfaces contact producing
jagged ridges on these biting surfaces of the teeth thus serving to aide in mastication. During this
period of development hard tissue deposition also occurs. As a result, fusion of the lobes is
incomplete and the result is a complex network of pits and groves which extend further into fossas
and fissures respectively. This structure thus provides stagnation sites which form a convenient
habitat for the accumulation of bacteria and the persistence of food particles. The finer areas of
these structures also prevent removal by conventional oral hygiene methods and therefore
drastically increase the probability of caries developing.
Figure 2.1.1 (Inverted Occlusal Surfaces): SEM images of a cast made from an occlusal surface of a 3
rd human molar following HCl
digestion of the tooth’s structure. The perspective is tilted at an angle 60° to the planer surface of the tooth. a) mesial view; b) distal view; c) lingual view. Reconstructed from Juhl [1983a].
Modelling of the occlusal surfaces has thus been a focus of modern research both in vitro [Deng et
al., 2004; Deng et al., 2005; Smits and Arends, 1986] and in situ [Zaura et al., 2002; Zaura et al.,
2005] as the unique anatomy and microbiology of these sites distinctly separates occlusal caries
from their smooth-surface counterpart. However one fundamental disconnect between these
models and the natural situation arises from the physical structure of the enamel tissue.
Lesion progression is known to follow the orientation of the enamel prisms [Bjørndal and Thylstrup,
1995; Kidd and Fejerskov, 2004] due to higher solubility of inter-prismic enamel in relation to that of
the enamel prisms themselves facilitating diffusion along the path of the prism structures. These
structure are generally oriented length-wise between the enamel surface and the enamel-dentine
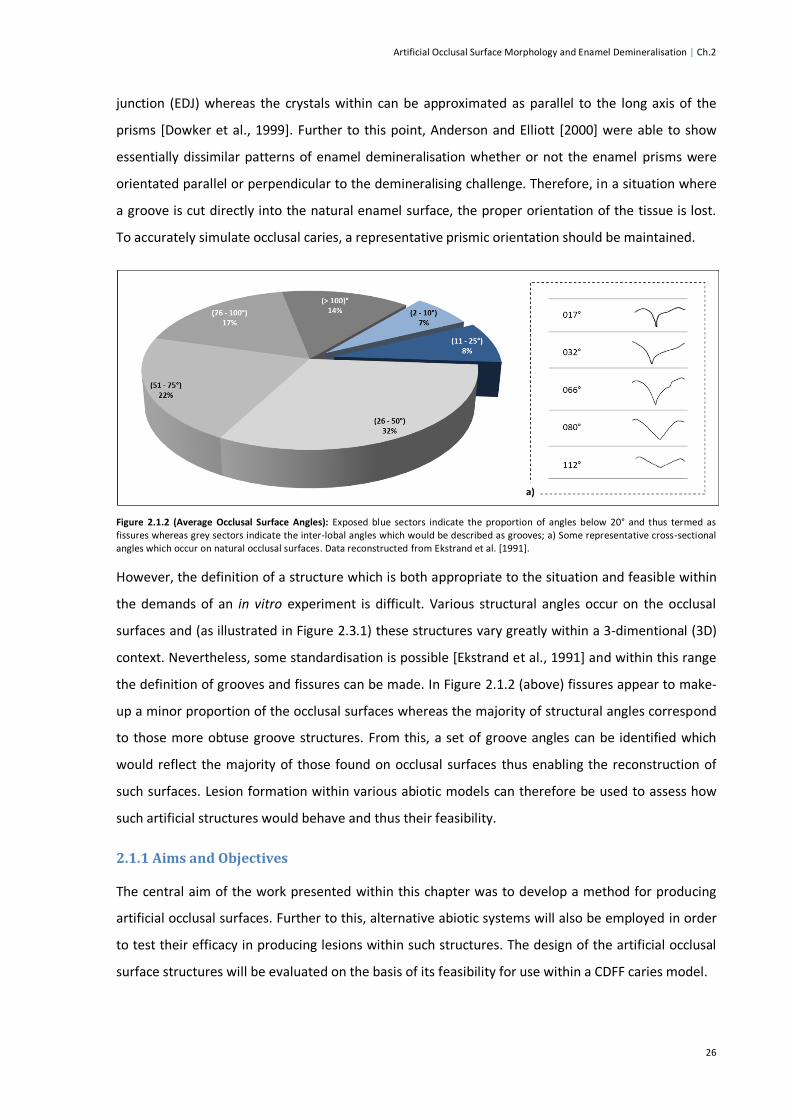
Artificial Occlusal Surface Morphology and Enamel Demineralisation | Ch.2
26
junction (EDJ) whereas the crystals within can be approximated as parallel to the long axis of the
prisms [Dowker et al., 1999]. Further to this point, Anderson and Elliott [2000] were able to show
essentially dissimilar patterns of enamel demineralisation whether or not the enamel prisms were
orientated parallel or perpendicular to the demineralising challenge. Therefore, in a situation where
a groove is cut directly into the natural enamel surface, the proper orientation of the tissue is lost.
To accurately simulate occlusal caries, a representative prismic orientation should be maintained.
Figure 2.1.2 (Average Occlusal Surface Angles): Exposed blue sectors indicate the proportion of angles below 20° and thus termed as fissures whereas grey sectors indicate the inter-lobal angles which would be described as grooves; a) Some representative cross-sectional angles which occur on natural occlusal surfaces. Data reconstructed from Ekstrand et al. [1991].
However, the definition of a structure which is both appropriate to the situation and feasible within
the demands of an in vitro experiment is difficult. Various structural angles occur on the occlusal
surfaces and (as illustrated in Figure 2.3.1) these structures vary greatly within a 3-dimentional (3D)
context. Nevertheless, some standardisation is possible [Ekstrand et al., 1991] and within this range
the definition of grooves and fissures can be made. In Figure 2.1.2 (above) fissures appear to make-
up a minor proportion of the occlusal surfaces whereas the majority of structural angles correspond
to those more obtuse groove structures. From this, a set of groove angles can be identified which
would reflect the majority of those found on occlusal surfaces thus enabling the reconstruction of
such surfaces. Lesion formation within various abiotic models can therefore be used to assess how
such artificial structures would behave and thus their feasibility.
2.1.1 Aims and Objectives
The central aim of the work presented within this chapter was to develop a method for producing
artificial occlusal surfaces. Further to this, alternative abiotic systems will also be employed in order
to test their efficacy in producing lesions within such structures. The design of the artificial occlusal
surface structures will be evaluated on the basis of its feasibility for use within a CDFF caries model.

Artificial Occlusal Surface Morphology and Enamel Demineralisation | Ch.2
27
2.2.0 Materials and Methods
Bovine incisors were sourced from cattle aged ≤ 36 months old (Batllefield Road Abattoir, Harlescott,
United Kingdom) reared in the absence of known fluoridated water sources. Teeth were stored in a
fully de-ionised 0.1 % w/v thymol solution before use (BDH Laboratory Supplies, Poole, UK) to avoid
decomposition or tissue alteration. All teeth were examined under a dissecting microscope (Nikon
SMZ-10; Nikon UK Ltd., Surrey, UK) and by quantitative light induced fluorescence (QLF) to ensure
they were initially caries- and defect- free. For QLF assessment, enamel surfaces were examined
under a custom-made workstation (Inspektor Research Systems BV., Amsterdam) equipped with a
SLR camera (Cannon EOS 450D; Cannon UK Ltd., Surrey, UK) and a working light emission
wavelength of 405 nm (QLF-D; C3 Version 1.20.0.0; Inspektor Research Systems BV., Amsterdam).
Figure 2.2.1 (Initial Enamel Sectioning Process): a) cross-sectional view of an upper bovine incisor. Dashed white lines indicated the areas from which BEBs were sectioned; b) enhanced cross-sectional view of the areas which were fashioned into BEBs.
When required, teeth were first sectioned into blocks of approximate dimensions 8 x 5 x 3 mm using
a hand-held diamond-coated cutting disk (Skillbond Direct Ltd., High Wycombe, UK) connected to
Marathon-N7 micromotor (Saeyang Microtech, Daegu, Korea) so as to result in an enamel surface of
8 x 5 mm. The source of each section as it relates to the incisors surface are illustrated in Figure
2.2.1. Once fashioned into blocks, the enamel surfaces were then successively abraded on
carburundum paper using a Buehler 8-inch Ecomet Grinder (Buehler GmbH., Düsseldorf, Germany).
Curvature in the enamel surface was first levelled using 240-P abrasive sheets (Wet and Dry Abrasive
Sheets; ABL Resin and Glass, Cheshire, UK) and subsequently finished with 1200-P paper (Rhynowet
Sheets; Insasa, Indústria de Abrasivos, Spain).
Prepared BEBs were then painted in an acid resistant varnish (MaxFactor Nailfinity; Procter and
Gamble, Weybridge, UK) with the use of a 6 x 3 mm or 6 x 4 mm piece of non-residual masking tape
(Guangzhou Broadya Adhesive Products Co., Ltd., Guangdong, China) stencil placed over the enamel
surface and immediately adjacent and central to one of the 8 mm edges of the enamel surface.
Figure 2.2.2 illustrates this process. Once the varnish had begun to dry, the masking-tape was

Artificial Occlusal Surface Morphology and Enamel Demineralisation | Ch.2
28
removed using fine-tipped tweezers leaving a highly-polished area of enamel exposed. This process
was then repeated to create both left- and right- hand sets. In total 24 BEBs were prepared for both
the 90 and 180° conditions and 6 for the 20° condition.
Figure 2.2.2 (BEBs Painting Process): a) Bovine incisors were first sectioned into BEBs; b) non-residual masking-tape was cut and placed over the enamel surface immediately adjacent to edges; c) making-tape was then smoothed down to ensure it met flush with the enamel surface; d) the entire BEB pained in an acid-resistant varnish; e) approximately 15 min was allowed to pass so as that the varnish became tacky; f) the masking-tape “stencil” was removed leaving an exact area of 6 x 3 mm or 6 x 4 mm of enamel the enamel surface exposed.
2.2.1 Hydrogel Investigation Model (AGS)
Once dried, painted BEB pairs with a 6 x 3 mm window were mounted in Green-Stick impression
compound (Kerr Corporation, California, United States) at 20, 90, and 180° angles so as to
correspond to the mean fissure angles of natural occlusal surfaces defined above (Figure 2.1.2). A
specifically-made plastic wedge was used for each given angle so as to ensure that the BEBs were
mounted correctly and in as reproducible as of a way as possible (Figure 2.2.3). Each angle was
investigated in at least triplicate conditions. [ten Cate et al., 1996]
Assembled BEB pairs were then placed in acid-gel systems (AGSs) based on the “Laboratory D”
method described previously by ten Cate et al. [1996]. In brief, an 8% (w/v) MeC gel (15000cp at 2%
w/v in 20 °C dH2O; Sigma-Aldrich Ltd., Dorset, UK) was created by dispersing the MeC powder in
dH2O at approximately 80°C. During this time, one of each angle condition was placed into the
bottom of a disposable 50 mL Sterilin container (Sterilin Ltd. Newport, UK) and secured in place with
Carding Wax (Associated Dental Products Ltd., Kemdent Works, Swindon, UK).

Artificial Occlusal Surface Morphology and Enamel Demineralisation | Ch.2
29
Figure 2.2.3 (BEB Groove Assembly Method): a) Painted BEBs were paired and aligned at angle Ѳ (20, 90 or 180°); b) Exact alignment of the BEBBs at the chosen angle was achieved by the use of a plastic wedge cut to an exact angle (Ѳ) and placed within the groove; c) BEBs were secured in position with green-stick impression compound. Once the impression compound has hardened, the plastic wedge could be removed with BEB pairs secured at the exact angle of the wedge used.
Once cooled to approximately 50°C, 20 g volumes of the MeC gels were poured into each of the
Sterilin containers and allowed to set. A further 20g of 0.1M lactic acid solution (Sigma-Aldrich Ltd.,
Dorset, UK) containing 10mM phosphate (KH2PO4; Sigma-Aldrich Ltd., Dorset, UK) was then poured
over the gel. The completed acid-gel systems were then incubated for 12 d at 37 °C before the BEBs
were carefully extracted from the AGS and rinsed in dH2O to remove residual gel.
2.2.2 pH Cycling Investigation Model
With a slight difference from the procedure described in Section 2.2.1, fixed BEB pairs were created
with a window of 6 x 4 mm (comparable to Figure 2.2.2) and placed, one of each angle condition (20,
90 and 180° sets), into the bottom of a disposable 50 mL Sterilin container (Sterilin Ltd. Newport,
UK) and secured with Carding Wax (Associated Dental Products Ltd., Kemdent Works, Swindon, UK)
as in Section 2.2.1. Each Sterilin then formed the basis of a pH-cycled demineralisation model
exposed to 2 (de- and re-mineralising) solutions described in Table 2.2.1.
Ingredient Solution A Solution B Supplier
Glacial Acetic Acid 75 mM - Sigma-Aldrich Ltd., Poole, UK
Calcium Chloride (CaCl2.2H2O) 2 mM 1.5 mM Sigma-Aldrich Ltd., Poole, UK
Sodium Phosphate (NaH2PO4) 2 mM 0.9 mM Sigma-Aldrich Ltd., Poole, UK
HEPES Buffer (C8H18N2O4S) - 20 mM Sigma-Aldrich Ltd., Poole, UK
Sodium Chloride (NaCl) - 130 mM Sigma-Aldrich Ltd., Poole, UK
Sodium Fluoride (NaF) 0.03 ppm 0.05 ppm Sigma-Aldrich Ltd., Poole, UK
Final Acidity Adjusted (NaOH) pH 4.6 pH 7.2 Sigma-Aldrich Ltd., Poole, UK
DSHA 0.1776 7.2047 IPQ3 [Shellis, 1988]
DSFAP 0.6248 13.854 IPQ3 [Shellis, 1988]
Table 2.2.1 (Composition of De- and Re-Mineralising Solutions): Solution A was sued for demineralisation stages of the pH-cycling system whereas Solution B was used during the remineralisation stages. Each reagent and the concentrations in which they were added to the solutions are listed along with the supplier from which they were sourced.
The pH cycling system employed in this experiment consisted of a 24 h cycle of 6 h exposure to 40
mL of demineralisation solution (Solution A) followed by 18 h exposure to 20mL of remineralisation

Artificial Occlusal Surface Morphology and Enamel Demineralisation | Ch.2
30
solution (Solution B) [ten Cate and Duijsters, 1982]. Solutions were added to each Sterilin for the
corresponding phase of the cycle and the system was subject to continual agitation using a magnetic
stirrer (Stuart SB301; Bibby Scientific Ltd., Staffordshire, UK) and flea. Between solution changes the
Sterilin vessel (Sterilin Ltd., Newport, UK) was briefly rinsed 3 times with dH2O. This cycle continued
for 6 days following which, all Sterilins were filled with 20 mL of Solution B and left for 24 h. BEBs
were then removed and separated according to condition before sectioning and analysis by TMR.
2.2.3 Transverse Micro-Radiography
BEBs were first marked with a small groove cut into the out-facing sides of each pair using a hand-
held diamond-coated cutting disk (Skillbond Direct Ltd., High Wycombe, UK) connected to
Marathon-N7 micromotor (Saeyang Microtech, Daegu, Korea). The purpose of this was so as that
the inner and outer edges of enamel surface could be distinguished following thin section
preparations. Separated BEBs were first mounted in Green-Stick impression compound (Kerr
Corporation, California, USA) onto a ceramic anvil and sectioned to an approximate thickness of 1.2
mm at an angle transverse to the exposed enamel surfaces using a precision diamond wire saw
(Model 3241; Well Diamantdrahtsagen GmbH., Mannheim, Germany). These sections were then
fixed lengthwise to 10 mm brass anvils using the same varnish as was used to create the exposed
enamel windows and polished on a diamond impregnated grinding disc (Custom-Made with a 15 µm
particles size; Buehler, Illinois, USA; Figure 2.2.4) to a thickness of 250 µm. Sections were then
removed with analytical-grade acetone (AnalaR; VWR Instruments, Poole, UK) and re-mounted on
the opposite side before being ground to a final thickness of 80 µm to be consistent with an
appropriate thickness for radiographic analysis [Angmar et al., 1963].
Each thin section was then removed from the anvils and mounted on a plastic template using double
sided sticky-tape (Q-Connect, Derbystraat, Belgium). The outer surface of the template was then
covered in an X-ray film membrane (3525 Ultralene; Spex Sample Prep, New York, USA) to complete
the frame (Figure 2.2.5). Frames were assembled as necessary. Each completed frame was placed
film-side down on high-resolution x-ray film plates (Kodak type 1A High-Resolution Plates; Kodak,
Rochester, USA) along with a 13-piece aluminium step-wedge and exposed to a CuKα X-ray source
operating at 10 mA and 30 kV (Figure 2.2.6). Exposure time was 25 min and the distance from source
to sample frame was 300mm. X-ray sensitive films were developed in solutions provided by the
manufacturer (Kodak D-19 Professional Developer; Kodak, Rochester, UK and Kodak Unifix; Kodak,
Rochester, UK) as per standard instruction which were also provided.

Artificial Occlusal Surface Morphology and Enamel Demineralisation | Ch.2
31
Figure 2.2.4 (Diamond- Impregnated Grinding Disks): Thin enamel sections were mounted a brass anvil with a height of exactly 11 mm. The anvil was attached to a top plate which was placed over an end plate so as that the brass anvil faced a diamond-impregnated disk (15 µm particle size). The top plate was supported by steel ball bearings each with an exact diameter (11.25 mm, 11.13mm or 11.08 mm). The excess diameter of the ball bearings determined the final thickness of the enamel sections; a) assembly view; b; assembled view.
Figure 2.2.5 (Sample Frame Assembly): Thin-sections were secured to the frame with their enamel surfaces facing into the voids of the frame. The membrane was placed over the thin sections protecting the x-ray film during radiographic imaging; a) assembly view; b) assemble view.

Artificial Occlusal Surface Morphology and Enamel Demineralisation | Ch.2
32
Examination of the radiographic image subsequently produced was performed by use of an optical
microscope (Leica, Wetzlar, Germany) fitted with a CCD camera (Sony, Tokyo, Japan). Before
acquisition of the lesion images, the exposure of the radiograph itself was first calibrated by the
aluminium step-wedge. Following slide calibration, 5 to 6 images (depending on the homogeneity of
the lesion) were acquired at magnifications of x5/0.11, x10/0.22 and x20/0.40 (thus capturing an
area of 1200 µm, 600 µm and 300 µm respectively). All images and step-wedge calibration curves
were acquired on TMR 2000 software (Version 2.0.27.16; Inspektor Research Systems BV.,
Amsterdam) and parameters of integrated mineral loss (∆Z), lesion depth (LD), SL mineralisation
(SMax) and average mineral loss (R; calculated as the product of ΔZ divided by LD) were quantified by
TMR 2006 (Version 3.0.0.10; Inspektor Research Systems BV., Amsterdam). Although a straight
surface was ground into the initial BEBs, corrections for curvature were enabled to account for
defects resulting from the preparation process itself.
Figure 2.2.6 (Sample Frame Radiography): a) front view; b) side view. Assembled sample frames were laid membrane-side down on the x-ray film plates. Samples were imaged in conjunction with a 13-piece aluminium step-wedge.
Limits set within TMR 2006 were a maximum sample thickness of 162 µm and a appropriate
minimum thickness of 25 µm to account for variations in the section preparations process leading to
an altered final thickness from that which was expected (80 µm). Samples which fell outside of this
range were rejected on the basis of being outside of an accurate calibration range set by the 13-
piece aluminium stepwedge. Likewise, maximum inhomogeneity was set to 1.5%, samples which
failed to meet this criteria were rejcted due to the potential for excessive deviations in the scan
profiles generated. However, in the event that sample scan profile deviations from the step-wedge
calibration curve occurred outside of the lesion and sound patch measures, TMR results were
accepted as just on the basis that the areas which were analyses were done so within calibration.

Artificial Occlusal Surface Morphology and Enamel Demineralisation | Ch.2
33
Depth profiles were calculated from an enamel surface defined as 20 %Vol assuming 87 %Vol of
sound mineral (calculated by the sound patch) and were normalised in relation to a zero patch
placed adjacent to the enamel surface; as opposed to the normalising measurements to the step-
wedge zero-point calibration. The depth of the lesion (LD) was measured as the depth at which 95
%Vol was reached with respect to sound enamel (87 %Vol) patch [Ruben and Arends, 1993].
In the event that caries lesions were not produced or that enamel surfaces had disintegrated over
the course of the experiment, 2-step image analysis [Amaechi et al., 1998] was applied to the images
captured from the micro-radiographs. This entailed specifically capturing the exposed surface along
with an area of un-exposed sound enamel. Under these circumstances all analysis was applied using
the TMR 2000 software (Version 2.0.27.16; Inspektor Research Systems BV., Amsterdam). Analysis
was first applied to the area of sound enamel immediately adjacent to the crater; this was used to
define the starting point of the enamel surface (20 %Vol), an un-shielded area on the radiographs
and an area of sound enamel beneath the point which the crater progressed to. Once these points
were defined, the analysis window was moved over to cover the crater and thus ΔZ and LD were be
quantified by theoretical reconstruction of the enamel surface.
2.2.3.1 TMR Experimental Specifics
Several equidistant images were captured across the length of the exposed enamel surface at a
magnification of x10/0.22. This comprised a step of approximately 600 µm from the peripheral edge
of the lesions towards the apex of the artificial groove. Due to the relative difference in the size of
the enamel windows, this enabled 5 areas to be captured in AGS-exposed BEBs and 6 areas to be
captured in those BEBs which were exposed to the pH-cycling system. Due to the exact trapezoid
shape of the grooves this meant that the inner 5 areas of each of grooves which were created in
either system were directly comparable topographically
2.2.4 Statistical Analysis
Analysis of data was performed using SPSS Statistics 20 (Version 20.0.0.1; IBM UK Ltd., Portsmouth,
UK) and Microsoft Excel 2010 (Version 14.6112.5000; Microsoft Office Professional Plus; Microsoft
Ltd., Berkshire, UK). Calculations for the mean and standard deviation (SD) were performed using
functions within SPSS Statistics 20 whereas, where appropriate, the standard error (SE) and t-
distribution based confidence intervals were generated within Microsoft Excel 2010 using the mean
and SD values calculated as described above. Analysis of Variance (ANOVA) was applied to all data
sets and, if applicable, on ascending levels of increasingly focused matrices (e.g. 1-Way, 2-Way and
3-Way ANOVA). In the event that significant differences were found within groups containing more
than 2 sets, Tukey’s HSD post-hoc test was applied. For all statistical tests, correlations and
confidence intervals a 95% certainty was applied (α = 0.05).

Artificial Occlusal Surface Morphology and Enamel Demineralisation | Ch.2
34
2.3.0 Results
2.3.1 QLF-D Inspection of Enamel Tissue Quality
Following examination using QLF-D, approximately 10 % of bovine incisors were rejected. None of
the BEBs brought to inspection were rejected before fluorescent imaging however defects were
sometimes noted under QLF-D which were initially missed when examined under white-light alone.
Examples of enamel surfaces which were initially deemed acceptable but which were later
reconsidered when inspected under QLF-D are given in Figure 2.3.1. The example in Figure 2.3.1a
and 2.3.1c were rejected following QLF-D inspection. In Figure 2.3.1a the areas indicated by
directional arrows were possible carious demineralisation although the central arrow indicates a
fracture. The defects noted in Figure 2.3.1c are almost certainly carious however in Figure 2.3.1b,
these same arrows point towards suspected fractures (although this particular BEB was not rejected
and therefore still used within the present work). In general, suspected carious demineralisation
occurred most often in BEBs which were sectioned from areas which were closet to the gingival
margin whereas fractures were more common in tissues which were sectioned from close to the
incisal edge. As a result, the majority of tissue came from between these 2 areas.
Figure 2.3.1 (QLF-D-Aided Inspection of Enamel Tissue Quality): In all cases the a white-light image is shown on the left and a QLF-D image is shown in the right: a) BEB which was rejected after inspection, b) BEB which was accepted after inspection and c) BEB which was rejected after inspection. Directional arrows indicate possible defects which have become visible under QLF-D.

Artificial Occlusal Surface Morphology and Enamel Demineralisation | Ch.2
35
2.3.2 Demineralisation at various Groove Depth in Static AGSs
For each angle condition, multiple thin sections survived the sectioning process at an acceptable
quality to allow for image analysis by TMR. Each of these analyses were then combined on the basis
of the BEB from which they were sectioned and parameters of ΔZ, LD, R and SMax recorded for each
and these data are presented in Table 2.3.1. Each condition and analysis point (ie. distance from the
peripheral edge of the artificial groove) defined groups and the number of measurements were
taken to be the number of separate enamel blocks which were analysed. No significant difference
was found between left- and right-hand sets at each analysis point for any of the parameters
measured (P ≥ 0.362).
θ° Step n (BEBs) ΔZ ± SD LD ± SD R ± SD SMax ± SD
20 1 (0.6 mm) 6 2536.67 ± 274.65 88.48 ± 9.84 28.72 ± 1.37 56.53 ± 3.68
20 2 (1.2 mm) 6 1031.67 ± 51.320 52.57 ± 3.83 19.75 ± 0.46 67.20 ± 1.47
20 3 (1.8 mm) 5 601.67 ± 184.820 28.53 ± 9.19 23.82 ± 2.70 72.37 ± 2.79
20 4 (2.4 mm) 4 425.00 ± 241.920 16.88 ± 11.1 26.52 ± 1.75 71.02 ± 14.47
20 5 (3.0 mm) 4 425.00 ± 230.920 13.32 ± 6.73 31.28 ± 1.94 66.93 ± 4.65
90 1 (0.6 mm) 5 3240.00 ± 250.87 92.55 ± 5.74 34.89 ± 1.14 55.81 ± 2.24
90 2 (1.2 mm) 5 2018.67 ± 103.85 72.86 ± 4.21 27.59 ± 0.49 59.30 ± 0.47
90 3 (1.8 mm) 5 1470.67 ± 181.78 61.61 ± 5.53 23.66 ± 2.01 62.83 ± 2.11
90 4 (2.4 mm) 5 1091.50 ± 167.50 55.67 ± 8.80 19.57 ± 1.59 66.21 ± 3.39
90 5 (3.0 mm) 5 808.00 ± 187.570 48.91 ± 11.7 16.58 ± 1.41 70.28 ± 3.10
180 1 (0.6 mm) 5 3434.00 ± 319.86 95.11 ± 3.96 36.05 ± 2.21 51.91 ± 4.26
180 2 (1.2 mm) 5 2187.17 ± 181.89 76.66 ± 4.02 28.44 ± 1.34 56.46 ± 2.71
180 3 (1.8 mm) 5 1850.33 ± 114.43 71.49 ± 2.85 25.83 ± 0.79 62.75 ± 8.94
180 4 (2.4 mm) 6 1792.36 ± 284.57 71.66 ± 9.52 24.79 ± 1.65 59.10 ± 3.82
180 5 (3.0 mm) 5 1771.67 ± 439.77 68.33 ± 7.37 25.71 ± 4.61 59.38 ± 3.19
Table 2.3.1 (TMR Parameters from AGS-exposed Grooves): The number of BEBs used (n) are presented for each condition at steps 1 to 5 correspond to measurements made from the peripheral edge of the enamel lesion in towards the inner crevice of the groove.
Viewing results based only on θ (ie. surmising all steps along the length of the lesions) determined
significant difference in ΔZ, LD and SMax (P < 0.001). Multiple comparisons revealed that ΔZ and LD
increased significantly (P ≤ 0.016) between 20° and 90° sets whereas no difference was determined
in R or SMax (P ≥ 0.082). Between 90° and 180° sets, ΔZ, LD and R were all seen in increase (P ≤ 0.042)
however SMax decreased (P = 0.004). These results are illustrated in Figure 2.3.2 where a clear
increase is visible in the mean values for LD and ΔZ. However, R does appear to remain relatively
steady. On average, SMax followed an inverse relationship to θ.

Artificial Occlusal Surface Morphology and Enamel Demineralisation | Ch.2
36
Figure 2.3.2 (TMR Parameters in Relation to θ): Parameters of LD (µm), R (%Vol), SMax (%Vol) and ΔZ (%Vol.µm) are presented as combined measurements for each groove angle condition (θ). Error bars represent the SD on the sample set. The number of individual values (n) for each series is listed in Table 2.3.1.
Separating each set on the basis of distance from the peripheral edge (Figure 2.3.3), θ had a
significant effect at each step on ΔZ, LD, R and SMax (P ≤ 0.041), the only exceptions to this were in
the outermost measurement for LD (Step 1; P = 0.292) and in the central measurements of R (Step 3;
P = 0.306).
Considering the steps in Figure 2.3.3 separately, ΔZ displays a clear relationship with both θ and
distance from the peripheral edge (Figure 2.3.4). ΔZ decreases to a baseline value; this decrease is
most pronounced in the 20° set and least pronounced in the 180° set with the 90° occupying an
intermediate position. This relationship is also mirrored in Figure 2.3.5 when LD is plotted by the
same division. However, results for R showed a much more variable trend (Figure 2.3.6) particularly
in the 20° sets.
In the first 2 steps from the peripheral edge, an extremely close relationship was observed between
the 90° and 180° sets with respect to ΔZ, LD and R (P ≥ 0.167) and, with respect to R, this close
association continued to the 3 step (P = 0.194). However, further into the groove delineation was no
longer possible on the basis of these parameters (P ≤ 0.019). In comparing the 20° sets with the 90°
and 180° sets, the 20° sets were found to be significantly different with respect to ΔZ, LD and R (P ≤
0.050) with the expectation of the LD measurements made at the peripheral edge (P ≤ 0.215) and R
from the 3rd step onwards (P ≤ 0.100). In viewing these result visually, the gradual decline from a
0
10
20
30
40
50
60
70
80
90
0
500
1000
1500
2000
2500
3000
3500
ΔZ LD R SMax
De
pth
(µ
m)
/ M
ine
ral V
olu
me
(%
Vo
l)
Inte
rgra
ted
Min
era
l Lo
ss (
ΔZ;
%V
ol.
µm
)
Parameter
θ = 20° θ = 90° θ = 180°

Artificial Occlusal Surface Morphology and Enamel Demineralisation | Ch.2
37
point at the outer edge can be seen with a hierarchal order for ΔZ (Figure 2.3.4), LD (Figure 2.3.5)
and R (Figure 2.3.6). A unique trend in R was also observed in the 20° sets where measurements
initially declined but then proceed to rise (Figure 2.3.6).
Figure 2.3.3 (Reconstructed Micro-Radiographs): Dotted white lines indicate the analysis window for each step position. Green areas () indicate the patch which was taken as sound enamel and red indicates () patch which was sued for zero-point calibration; a) 20° left- and right-hand sets; b) 90° left- and right-hand sets; c) 180° left- and right-hand sets.
Figure 2.3.4 (ΔZ Measured across the Length of the Enamel Lesions): ΔZ (%Vol.µm) measurements are presented for each step from the peripheral edge of the enamel lesion. Series are separated by groove angle condition (θ). Error bars represent the SD of the sample set. The number of individual values (n) for each series is listed in Table 3.3.1 Multiple comparisons for significant difference between θ groups at like positions are denoted alphabetically where a = 20° vs. 90°, b = 20° vs. 180° and c = 90° vs. 180° sets.
a,b
a,b
a,b,c a.b,c
b,c
0
500
1000
1500
2000
2500
3000
3500
4000
1 (0.6 mm) 2 (1.2 mm) 3 (1.8 mm) 4 (2.4 mm) 5 (3.0 mm)
Inte
rgra
ted
Min
era
l Lo
ss (
ΔZ;
%V
ol.
µm
)
Step (Distance from the Peripheral Edge)
θ = 20° θ = 90° θ = 180°

Artificial Occlusal Surface Morphology and Enamel Demineralisation | Ch.2
38
Figure 2.3.5 (LD Measured across the Length of the Enamel Lesions): LD (µm) measurements are presented for each step from the peripheral edge of the enamel lesion. Series are separated by groove angle condition (θ). Error bars represent the SD of the sample set. The number of individual values (n) for each series is listed in Table 3.3.1. Multiple comparisons for significant difference between θ groups at like positions are denoted alphabetically where a = 20° vs. 90°, b = 20° vs. 180° and c = 90° vs. 180° sets.
Figure 2.3.6 (R Measured across the Length of the Enamel Lesions): R (%Vol) measurements are presented for each step from the peripheral edge of the enamel lesion. Series are separated by groove angle condition (θ). Error bars represent the SD of the sample set. The number of individual values (n) for each series is listed in Table 3.3.1. Multiple comparisons for significant difference between θ groups at like positions are denoted alphabetically where a = 20° vs. 90°, b = 20° vs. 180° and c = 90° vs. 180° sets.
a,b,c a,b,c a,b,c a,b,c
0
20
40
60
80
100
120
1 (0.6 mm) 2 (1.2 mm) 3 (1.8 mm) 4 (2.4 mm) 5 (3.0 mm)
De
pth
(µ
m)
Step (Distance from the Peripheral Edge)
θ = 20° θ = 90° θ = 180°
a,b
a,b
a,c
a,c
15
20
25
30
35
40
1 (0.6 mm) 2 (1.2 mm) 3 (1.8 mm) 4 (2.4 mm) 5 (3.0 mm)
Min
era
l Vo
lum
e (
%V
oil)
Step (Distance from the Peripheral Edge)
θ = 20° θ = 90° θ = 180°

Artificial Occlusal Surface Morphology and Enamel Demineralisation | Ch.2
39
Figure 2.3.7 (SMax Measured across the Length of the Enamel Lesions): SMax (%Vol) measurements are presented for each step from the peripheral edge of the enamel lesion. Series are separated by groove angle condition (θ). Error bars represent the SD of the sample set. The number of individual values (n) for each series is listed in Table 3.3.1. Multiple comparisons for significant difference between θ groups at like positions are denoted alphabetically where a = 20° vs. 90°, b = 20° vs. 180° and c = 90° vs. 180° sets
Measurements made for SMax (Figure 2.3.7) were highly variable and although some points were
determined as significant (P < 0.050), no clear relationship could be established for either. Figure
2.3.7 illustrates the relationships graphically in SMax. Here a linear increase with recession from the
peripheral edge was visible in the 90° set whereas in the 20° and 180° sets, measurements reached a
maximum in the central areas of the lesions. For the majority of points, no statistically significant
differences were found (Figure 2.3.7).
2.3.3 Demineralisation at various Groove Depths in pH-Cycled Systems
From each BEB multiple thin sections survived the sectioning process. These sections were analysed
and the results aggregated on the basis of the BEB from which they came. Parameters of ΔZ, LD, R
and SMax were recorded for each BEB and are presented in Table 2.3.2. Within this this data, each
condition and analysis point (i.e. distance from the peripheral edge of the artificial groove) defined
groups and the number of measurements was taken to be the number of enamel blocks which were
analysed. No significant difference was found between left- and right-hand sets at each analysis
point for any of the parameters measured (P ≥ 0.362).
a,b
b,c
45
50
55
60
65
70
75
80
1 (0.6 mm) 2 (1.2 mm) 3 (1.8 mm) 4 (2.4 mm) 5 (3.0 mm)
Min
era
l Vo
lum
e (
%V
ol)
Step (Distance from the Peripheral Edge)
θ = 20° θ = 90° θ = 180°

Artificial Occlusal Surface Morphology and Enamel Demineralisation | Ch.2
40
θ° Step n (BEBs) ΔZ ± SD LD ± SD R ± SD SMax ± SD
20 1 (0.6 mm) 6 2075.00 ± 585.73 55.29 ± 7.97 36.76 ± 4.81 44.69 ± 8.23
20 2 (1.2 mm) 5 1992.44 ± 221.19 52.15 ± 5.10 38.20 ± 1.94 41.67 ± 4.48
20 3 (1.8 mm) 5 1879.50 ± 59.820 50.19 ± 0.58 37.53 ± 0.73 36.22 ± 3.59
20 4 (2.4 mm) 6 1292.78 ± 146.25 42.96 ± 1.96 30.38 ± 4.24 39.65 ± 4.19
20 5 (3.0 mm) 6 500.00 ± 106.420 22.31 ± 5.38 22.69 ± 1.95 63.10 ± 3.02
20 6 (3.6 mm) 6 311.67 ± 41.0600 15.36 ± 1.28 21.69 ± 0.92 66.71 ± 1.93
90 1 (0.6 mm) 6 1416.33 ± 62.290 47.44 ± 1.08 29.72 ± 1.84 65.12 ± 4.73
90 2 (1.2 mm) 6 1496.67 ± 221.11 47.80 ± 3.85 31.21 ± 1.98 60.16 ± 6.34
90 3 (1.8 mm) 5 1368.89 ± 149.23 46.60 ± 2.67 29.25 ± 1.37 62.99 ± 4.74
90 4 (2.4 mm) 5 1419.17 ± 180.59 49.29 ± 3.39 28.87 ± 1.72 62.63 ± 5.64
90 5 (3.0 mm) 5 1018.61 ± 229.29 39.66 ± 6.96 24.23 ± 2.76 67.96 ± 1.56
90 6 (3.6 mm) 5 501.94 ± 242.970 25.49 ± 9.50 19.97 ± 3.58 71.04 ± 7.13
180 1 (0.6 mm) 6 1344.67 ± 324.57 51.88 ± 1.65 25.65 ± 5.93 71.10 ± 8.50
180 2 (1.2 mm) 6 1290.00 ± 119.15 47.07 ± 2.29 26.83 ± 2.30 65.81 ± 4.62
180 3 (1.8 mm) 6 1368.67 ± 132.31 46.53 ± 3.94 29.11 ± 1.01 64.52 ± 5.04
180 4 (2.4 mm) 6 1458.67 ± 13.320 46.65 ± 0.51 31.01 ± 0.36 63.8 ± 2.33
180 5 (3.0 mm) 6 1475.78 ± 74.480 47.56 ± 1.92 30.92 ± 1.90 62.83 ± 2.04
180 6 (3.6 mm) 6 1406.50 ± 161.54 48.81 ± 5.45 28.86 ± 1.36 64.24 ± 2.01
Table 2.3.2 (TMR Parameters from pH-Cycling Exposed Grooves): The numbers of BEBs used (n) are presented for each condition at steps
1 to 6 correspond to measurements made from the peripheral edge of the enamel lesion in towards the inner crevice of the groove.
Aggregating results based on θ, significant differences were found between R, LD and SMax (P <
0.027) however no significant difference was found between measurements of ΔZ (P = 0.285).
Multiple comparisons revealed that the average LD was significantly higher (P 0.010) in the 180° set
when compared to the 20° set whereas no difference was determined between the 90° set an either
of the other two groups (P ≥ 0.702) however a decrease in the average LD was observed as θ was
reduced (Figure 2.3.8). R was significantly lower between the 20° and 90° sets (P = 0.025) and
although a numerical decrease was observed as θ was increased, no significant difference was found
between the 180° and 90° sets (P = 0.655). Significant difference were found between the average
value of SMax between the 20° set and each of the other 2 angle conditions (P ≤ 0.001) however,
between the 180° and 90° sets, no differences were seen between the values obtained for this
parameter; this applied to both numerical comparisons and statistical tests (P = 0.991).
Finer analysis applied to each set on recession from the peripheral edge found ΔZ to behave in a way
which appeared linked to the structure of the grooves (Figure 2.3.9). This was very dissimilar to that
which was obtained from the lesions which were produced in the AGSs (Figure 2.3.4). Concerning
the present data set (Figure 2.3.9), significant differences were found between θ at each step (P ≤
0.001) apart from at the 4th step (2.4 mm from the peripheral edge (P = 0.616).

Artificial Occlusal Surface Morphology and Enamel Demineralisation | Ch.2
41
Figure 2.3.8 (TMR Parameters in Relation to θ): Parameters of LD (µm), R (%Vol), SMax (%Vol) and ΔZ (%Vol.µm) are presented as combined measurements for each groove angle condition (θ). Error bars represent a 95% t -distribution based confidence interval. The number of individual values (n) for each series is listed in Table 2.3.2.
Figure 2.3.9 (ΔZ Measured across the Length of the Enamel Lesions): ΔZ (%Vol.µm) measurements are presented for each step from the peripheral edge of the enamel lesion. Series are separated by groove angle condition (θ). Error bars represent the SD of the sample set. The number of individual values (n) for each series is listed in Table 2.3.2. Multiple comparisons for significant difference between θ groups at like positions are denoted alphabetically where a = 20° vs. 90°, b = 20° vs. 180° and c = 90° vs. 180° sets.
0
10
20
30
40
50
60
70
80
90
0
500
1000
1500
2000
2500
ΔZ LD R SMax
De
pth
(µ
m)
/ M
ine
ral V
olu
me
(%
Vo
l)
Inte
rgra
ted
Min
era
l Lo
ss (
ΔZ;
%V
ol.
µm
)
Parameter
θ = 20° θ = 90° θ = 180°
a, b
a, b a, b
b, c b, c
0
500
1000
1500
2000
2500
1 (0.6 mm) 2 (1.2 mm) 3 (1.8 mm) 4 (2.4 mm) 5 (3.0 mm) 6 (3.6 mm)
Inte
rgra
ted
Min
era
l Lo
ss (
ΔZ;
%V
ol.
µm
)
Step (Distance from the Peripheral Edge)
θ = 20° θ = 90° θ = 180°

Artificial Occlusal Surface Morphology and Enamel Demineralisation | Ch.2
42
In the other three steps (1 – 3), no significant difference were found between the 90° and 180° sets
(P ≥ 0.752) was however ΔZ was significantly higher in the 20° set (P ≤ 0.011). From the 5th step
onwards, the trend in ΔZ behaved much more similarly between the 90° and 20° sets where the
reduction was similar in both conditions and the difference between groups could not be
distinguished statistically (P ≥ 0.056). Conversely, ΔZ remained a steady value across this same
period in the 180° set therefore differentiating the values obtained from that of either of the other
two conditions (P ≤ 0.032).
Figure 2.3.10 (LD Measured across the Length of the Enamel Lesions): LD (µm) measurements are presented for each step from the peripheral edge of the enamel lesion. Series are separated by groove angle condition (θ). Error bars represent the SD of the sample set. The number of individual values (n) for each series is listed in Table 2.3.2. Multiple comparisons for significant difference between θ groups at like positions are denoted alphabetically where a = 20° vs. 90°, b = 20° vs. 180° and c = 90° vs. 180° sets.
LD followed a similar pattern to ΔZ however the difference between the 20° set and the other two
angle conditions were much less pronounced (Figure 2.3.10). In the outer 4 sets of the grooves (1 –
4), no significant differences were found between and of the angle conditions (P ≥ 0.101). However
past this point, an obvious divergence in these parameters occurred. In the 20° set, LD decreased
markedly and was significantly lower than was found in either of the other 2 conditions (P = 0.044).
LD in the 90° set was significantly lower than was found in the 180° set but higher than in the 20° set
(P ≤ 0.049). Therefore confirming the visual observations made in that LD behaved differently
between angle conditions in the inner areas of the grooves.
a, b a, b, c
0
10
20
30
40
50
60
70
1 (0.6 mm) 2 (1.2 mm) 3 (1.8 mm) 4 (2.4 mm) 5 (3.0 mm) 6 (3.6 mm)
De
pth
(µ
m)
Step (Distance form the Peripheral Edge)
θ = 20° θ = 90° θ = 180°

Artificial Occlusal Surface Morphology and Enamel Demineralisation | Ch.2
43
The results determined for R (Figure 2.3.11) again demonstrated a similar relationship as was found
for LD and ΔZ. Both the 90° and 180° sets were not found to be significantly different between each
other in the outer 4 steps (P ≥ 0.137) although R degrease in the inner 2 steps of the groove (5 – 6)
from the 90° set resulting a significantly lower value being determined in the set (P ≤ 0.024).
However, the decrease in R meant that an initially dissimilar set of values (P ≤ 0.007) between the
90° and 20° sets in the outer 1.8 mm of the groove (steps 1 – 3) was no longer dissimilar in the inner
1.2 mm (P ≥ 0.557) as the trend in the 90° groups diverged from that in the 180° group (steps 4 – 6)
and followed a course more similar to what occurred in the 20° set. As with LD and ΔZ, no significant
difference were found between an of the angle conditions in the 4th step from the peripheral edge (P
= 0.768).
Figure 2.3.11 (R Measured across the Length of the Enamel Lesions): R (%Vol) measurements are presented for each step from the peripheral edge of the enamel lesion. Series are separated by groove angle condition (θ). Error bars represent the SD of the sample set. The number of individual values (n) for each series is listed in Table 2.3.2. Multiple comparisons for significant difference between θ groups at like positions are denoted alphabetically where a = 20° vs. 90°, b = 20° vs. 180° and c = 90° vs. 180° sets.
Interesting results were obtained for SMax from this experiment (Figure 2.3.12), these were
essentially very different to that which occurred in the AGSs (Figure 2.3.7). In the pH-cycling exposed
structures, a much more definitive trend in SMax was observed. The degree of mineralisation in the SL
(SMax) was notably lower in the 20° set than in either of the other 2 groove angle (θ) conditions (P ≤
0.001) however in the inner 2 steps of the grooves, no difference could be determined (P ≤ 0.547)
between each of the 3 angle conditions with respect to this parameter.
a, B a, b a, b
b, c
b, c
5
10
15
20
25
30
35
40
45
1 (0.6 mm) 2 (1.2 mm) 3 (1.8 mm) 4 (2.4 mm) 5 (3.0 mm) 6 (3.6 mm)
Min
era
l Vo
lum
e (
%V
ol)
Step (Distance form the Peripheral Edge)
θ = 20° θ = 90° θ = 180°

Artificial Occlusal Surface Morphology and Enamel Demineralisation | Ch.2
44
Figure 2.3.12 (SMax Measured across the Length of the Enamel Lesions): SMax (%Vol) measurements are presented for each step from the peripheral edge of the enamel lesion. Series are separated by groove angle condition (θ). Error bars represent the SD of the sample set. The number of individual values (n) for each series is listed in Table 2.3.2. Multiple comparisons for significant difference between θ groups at like positions are denoted alphabetically where a = 20° vs. 90°, b = 20° vs. 180° and c = 90° vs. 180° sets.
However, during the collection of this data, it was noted that lesion formation appeared to be
hindered in the inner 2 steps of the grooves within the pH-cycling model for both the 90° and 20°
sets. This result was confirmed by the low LD and ΔZ measurements presented above (Figure 2.3.9
and Figure 2.3.10 respectively). In the case of an obvious SL, the TMR software was used to
determine where the SL appeared and in this case, an imperfect process may have led the observed
results. However, clearly definable SLs were apparent in the outer areas of the lesions produced in
all conditions, therefore the measurements of SMax can be confirmed as lower in the 20° set as was
indicated by the date present above (Figure 2.3.12).
a, b
a, b a, b a, b
25
35
45
55
65
75
85
1 (0.6 mm) 2 (1.2 mm) 3 (1.8 mm) 4 (2.4 mm) 5 (3.0 mm) 6 (3.6 mm)
Min
era
l Vo
lum
e (
%V
ol)
Step (Distance form the Peripheral Edge)
θ = 20° θ = 90° θ = 180°

Artificial Occlusal Surface Morphology and Enamel Demineralisation | Ch.2
45
2.4.0 Discussion In the AGS-exposed BEBs, ΔZ (Figure 2.3.4) and LD (Figure 2.3.5) decreased on recession from the
peripheral edge of the both 20° and 90° sets. This finding was expected as work which has
investigated the demineralisation within similar (albeit smaller scale) structures found similar
results. Within artificially created grooves the majority of demineralisation occurs in the outermost
regions [Lagerweij et al., 1996; Smits and Arends, 1986] and in reference to natural situation,
fluoride accumulates in the outer-most region of the entrance to occlusal fissures [Pearce et al.,
1999] therefore indicating past history of demineralising challenges in this area. Within other works
this pattern of demineralisation was also found [Deng et al., 2004; Deng et al., 2005; Zaura et al.,
2005]. Zaura et al. [2002] attributed this to the buffering capacity of the enamel tissue within the
groove [Zaura et al., 2002] and within a static AGS system these same factors would be at work.
However, within a pH cycled system, the fluidity of the medium, solution turnover and the rinsing
stages should reduce the effect of the accumulation of mineral ions within this space [Buzalaf et al.,
2010; White, 1995] although this may not have been the case completely.
Lesion character also varied on recession from the peripheral edge of the grooved in the AGS-
exposed BEBs as was the case in those exposed to the pH cycling system although the character was
essentially dissimilar in the lesions produced within either system. The viscosity of the solution was
minimal within the pH-cycling system therefore allowing greater penetration of the de-and re-
mineralising challenges whereas the gel within the AGS hindered the movement of mineral ions
within the system [Lagerweij et al., 1996]. This therefore provides an obvious explanation of the
marked reduction in total demineralisation in those BEBs which were exposed to the AGS as
compared to those which were subjected to the pH-cycling system.
An unusual result was also noted within the AGS-exposed BEBs from the 180° set. Apparently
greater demineralisation occurred in the outer areas of the lesions (Figure 2.3.4) and this result did
not occur in the same structures which were subject to the pH-cycled model (Figure 2.3.9). Within an
AGS this phenomenon is not uncommon. Known as flaring [Lynch, 2006], it results from a
comparatively greater deficit in the ionic stagnation layer at the periphery of the lesion [Ruben et al.,
1999]. Interestingly, the incremental measurements made for the purposes of this experiment show
that the effect of this was limited to the outer 1 mm of the lesions edge and that across the main
body of the lesion the difference were not significant in-line with that estimated by Ruben et al.
[1999]. However, within a system which aims to visualise how small changes in the topography of
the tissue effect the development and progression of caries lesions, this effect may be significant.
Therefore, with respect to the applicability in simulating groove or fissured structures a pH-cycled
abiotic model would be more appropriate than a static AGS.

Artificial Occlusal Surface Morphology and Enamel Demineralisation | Ch.2
46
In terms of R values, initially unusual results were also found in lesions created within the 20°
condition from the AGSs (Figure 2.3.6). Between all groove angle conditions these values were
similar in the outer regions but, within the 20° set, a pronounced decrease in R was observed which
then proceeded to increase sharply. However, in relations to lesion character, the reasons for these
observed results became clear. At surface softening stages [Arends and Christoffersen, 1986], the
measurement of R increases as the lesion progresses as R is the average mineral lost over a given
area [Arends, 1995] and therefore, as surface softening gives way to initial lesion formation, R
decreases as LD increases at greater rate. As the subsurface lesion then begins to grown, R continues
to increase once again. LD is limited by the penetration of the un-dissociated acid but R represents
the extent of demineralisation over the duration of demineralising challenges. As demineralisation
was expected to be hindered by both diffusion [Bollet-Quivogne et al., 2005; Lagerweij et al., 1996]
and buffering [Zaura et al., 2002] within the narrow grooves, this relationship can explain the
observed trend in R seen. Conversely, the more open structure of the 90° and 180° sets and the
fluidity of the medium within the pH-cycling model would have allowed for maintenance of an ionic
deficit sufficient for the formation of a more advanced lesion character [Ruben et al., 1999].
No differences were found between any of the angle conditions in outermost areas of the grooves
which within the pH-cycled model but, in the 20° and 90° sets, a sharp decline was seen in the
parameters of ΔZ (Figure 2.3.9), LD (Figure 2.3.10) and R (Figure 2.3.11) in the inner 1.5 mm of the
structure. This may have been due to the residual fluid which remained within these areas. With an
expected volume of 160 µL over a length of 8 mm, it is would be reasonable to assume that residual
liquid could have remained and therefore prevented the complete action of the rinsing stages. This
would result in mixing and a degree of neutralisation of the 2 buffer solutions and a greater time
within which the tissue would be exposed to higher fluoride concentrations (Solution B). Diffusion
into the porous enamel tissue would be expectedly greater and the demineralising challenged would
be lower. This effect is analogous to that experience by Matsunda et al. [2005, 2006] where more
narrow structures were found to inhibit demineralisation even within a pH-cycling system.
Moreover, no exact relationships could be determined for SL measurements within either model. In
the AGS-exposed BEBs, SL measurements were significantly different at some points but only in the
minority of the measurements (Figure 2.3.7). Under pH-cycling conditions, the SL was much lower in
areas which were closer to the periphery of the groove (Figure 2.3.12) and between groove angle
conditions exposed within this condition, much less variation was seen. This relationship is hard to
explain as the consistency of the measured areas do show some pattern in the lesions which were
created in the pH-cycling system. It is possible that the difference results from chance however some
explanation may lay in the concept that solution residue remained within the grooves of the more

Artificial Occlusal Surface Morphology and Enamel Demineralisation | Ch.2
47
acute 20° set. In much the same way that fine angle in the crevice of the 20°set may have held onto
either solution for longer periods of time, this lack of turnover may have led to greater fluoridation
of the enamel tissue in the base of the groove would have protected the tissue from dissolution and
therefore may have been equivalent to exposing a smaller area of mineral to the bulk solution. The
bulk solution would have therefore presented a greater deficit and the demineralising challenges
would have been greater leading to a lower mineral volume in the SL. However, further work would
be needed in order to confirm that this mechanism was in fact responsible for the observed results.
As was noted for the point of flaring evident in the AGS-exposed BEBs, lesions produced in the 180°
set of the pH-cycling model were much less variable along their length (Figure 3.3.9). This was true
for the measurements of LD and R therefore supporting the view that the pH-cycling system is able
to produce more homogenous lesions [Ruben et al., 1999]. Further to this, a direct relationship can
be seen for decreasing ΔZ on recession from the peripheral edge in lesions produced within both
systems. Furthermore, this relationship became more pronounced as the groove angle (θ) was
reduced therefore supporting the view that the topography of the surface was a key determiner of
demineralisation within both systems.
Although the model provides an approximation, several aspects of the natural surface are not
accounted for. For example, carious demineralisation usually occurs at areas where accessibility is
lowest [Juhl, 1983a]. This is due to the inaccessibility of stagnations sites and the susceptibility of the
tissue within such areas [Carvalho et al., 1989; Pearce et al., 1999; Robinson et al., 1995a]. In the
current models, the smallest groove angles which was investigated were the 20° set which is actually
larger than any fissure would be [Ekstrand and Bjørndal, 1997; Ekstrand et al., 1991] and therefore,
more acute angles should be investigated. Secondly, the current model simulates groove structure is
cross-section only whereas in actuality, the area within the groove was trapezoid. The deficit
produced at either face of the groove was compensated by analysis of central area however the
stark geometry of these structures which are in contrast to the natural occlusal surfaces. Moreover,
as is also evident from the Figure 2.1.2a that the definition of a groove based on the apex angle
alone should be interpreted with caution as the slope of enamel surfaces is seldom straight.
The fluidity of the medium in the pH-cycling model creates an unrealistic situation in that the
turnover of mineral ions within the groove is high. On the other hand, the static AGS leads to a build-
up of mineral ions which would presumably occur within natural plaques [Duckworth and Gao,
2006]. However the direction of the acidic challenge and concurrent dissolution process [Lagerweij
et al., 1996] mean that lesion formation is significantly different from the cycles of acidification
which occur in vivo. This is an inescapable shortfall of these abiotic models. In order to afford the

Artificial Occlusal Surface Morphology and Enamel Demineralisation | Ch.2
48
process of de- and remineralisation challenges along with process of ionic stagnation and
confinement within a microenvironment, a living biofilm is ultimately required. In this sense, the
relative efficacy of either system is not important. However what was shown by the comparison
between systems was that somewhat heterogeneous lesion are produced as a result of the
topography of the surface and with the use of a gelatinous demineralisation system (AGS).
The assembly of the artificial groove structures proved time consuming and technically difficult due
to the manufacture of these groove structures resulted in an extremely low-throughput design due
to the tissue required and the extent of preparation involved. Fashioning the enamel tissue into
perfectly cuboidal shapes was not always possible and although these technical difficulties were
overcome with persistence, a large number of BEBs did not meet the standards required by
preparation process. The fact that an entire edge was required so as that adjacent BEB pairs met
flush led to the rejection of several BEBs and due to the value of enamel sections, such losses
created a limiting situation. However, the grove structures did prove useful in providing a basic
experimental model for investigating enamel demineralisation within such areas. However, the
removal of one of the main benefits of in vitro research (the requirement of relatively little
resources) was ultimately an inescapable shortfall. Moreover, it should also be noted that the
difficulties were encountered when using relative simple structures and these differed markedly
from natural occlusal surfaces (Figure 2.1.1). Nevertheless, the initial aim of simulating the occlusal
surface in a standardised and reproducible way was met albeit with requirements which may prove
contradictory to the latter. In summation, less resource-intensive approaches should be explored.

Artificial Occlusal Surface Morphology and Enamel Demineralisation | Ch.2
49
2.5.0 Conclusions Both pH cycling systems and AGSs provided useful information over the production of caries within
groove structures. However, these were essentially dissimilar to what could be expected within a
biological model and this was principally due to the directional aspect of the systems. Interestingly,
the pH cycling systems provided a noticeably greater degree uniformity within the resultant lesions
although these did not prove any more effective than AGSs in that neither fully simulated the
pattern of lesion progression exhibited by natural plaque biofilms. The artificial occlusal surface
design was, however, effective in providing a basic model to simulate occlusal surfaces although its
efficacy was low in comparison to simpler methods as the benefits which could be gained were
outweighed by the demands of production.
Moreover, comparisons of the two systems used (AGS and pH-cycling) showed benefits and
weaknesses on both sides. Within the present work, a pH-cycling model proved more effective as
the fluidity of the medium and penetration into the groove structure was greatly improved although,
ultimately, neither met the full criteria of natural plaque biofilm with respect to ionic stagnation,
penetration into the occlusal structure and defined episodes of de- and re-mineralisation.
Essentially, the lesion character exhibited down the length of the groove structures was, in both
cases, significantly different from that which is produced in vivo. As either model was shown to
possess some of these aspects, a hybrid system could prove more effective in the absence of a true
cariogenic biofilm community.
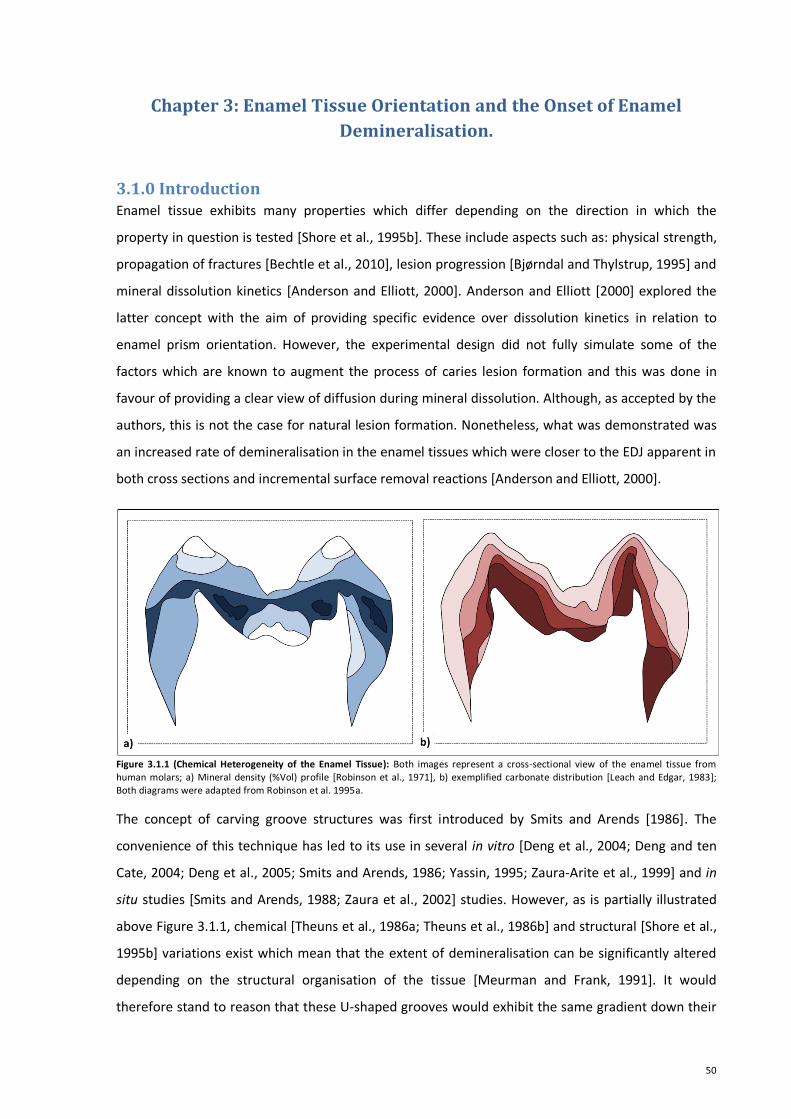
50
Chapter 3: Enamel Tissue Orientation and the Onset of Enamel
Demineralisation.
3.1.0 Introduction Enamel tissue exhibits many properties which differ depending on the direction in which the
property in question is tested [Shore et al., 1995b]. These include aspects such as: physical strength,
propagation of fractures [Bechtle et al., 2010], lesion progression [Bjørndal and Thylstrup, 1995] and
mineral dissolution kinetics [Anderson and Elliott, 2000]. Anderson and Elliott [2000] explored the
latter concept with the aim of providing specific evidence over dissolution kinetics in relation to
enamel prism orientation. However, the experimental design did not fully simulate some of the
factors which are known to augment the process of caries lesion formation and this was done in
favour of providing a clear view of diffusion during mineral dissolution. Although, as accepted by the
authors, this is not the case for natural lesion formation. Nonetheless, what was demonstrated was
an increased rate of demineralisation in the enamel tissues which were closer to the EDJ apparent in
both cross sections and incremental surface removal reactions [Anderson and Elliott, 2000].
Figure 3.1.1 (Chemical Heterogeneity of the Enamel Tissue): Both images represent a cross-sectional view of the enamel tissue from human molars; a) Mineral density (%Vol) profile [Robinson et al., 1971], b) exemplified carbonate distribution [Leach and Edgar, 1983]; Both diagrams were adapted from Robinson et al. 1995a.
The concept of carving groove structures was first introduced by Smits and Arends [1986]. The
convenience of this technique has led to its use in several in vitro [Deng et al., 2004; Deng and ten
Cate, 2004; Deng et al., 2005; Smits and Arends, 1986; Yassin, 1995; Zaura-Arite et al., 1999] and in
situ studies [Smits and Arends, 1988; Zaura et al., 2002] studies. However, as is partially illustrated
above Figure 3.1.1, chemical [Theuns et al., 1986a; Theuns et al., 1986b] and structural [Shore et al.,
1995b] variations exist which mean that the extent of demineralisation can be significantly altered
depending on the structural organisation of the tissue [Meurman and Frank, 1991]. It would
therefore stand to reason that these U-shaped grooves would exhibit the same gradient down their

Enamel Tissue Orientation and the Onset of Enamel Demineralisation | Ch. 3
51
length as was as was found on recession from the natural surface [Anderson and Elliott, 2000]. In
effect, a groove cut perpendicular to the natural surface of the enamel would penetrate downwards
through the natural structure and it is therefore possible that this would influence lesion formation
within such grooves.
Diffusion and buffering capacity have also been identified as factors which may augment lesion
progression within artificial groove structures [Zaura et al., 2002]. Initially, these factors alone would
not result in any alteration as to what would be found between a natural occlusal structure and
artificial grooves of the same dimensions and so would provide a reasonable comparison. However,
the prismic orientation of enamel tissue varies depending on the site of the tooth which is
encountered [Shore et al., 1995b]. Generally, enamel prisms are orientated transverse between the
natural enamel surface and the underlying dentine [Frazier, 1968]. However, due to the deposition
of tissue during ameoleogenisis, several layers are formed which slant toward the cuspal edge of the
labial surfaces [Hillson, 2005] (as illustrated in Figure 2.2.1).
In natural occlusal surface, the orientation of the enamel prisms approaches an acute angle of
almost 20° to the surface at the entrance to the fissure [Shore et al., 1995b] although as the shape of
these sites varies as does the orientation of the prisms and, depending on the intersection of the
developing lobes (which dictates the depth and shape of the fissure), this may result in enamel
prisms which are orientated almost perpendicular to the enamel surface. For the purposes of
producing artificial fissures the specific site which the enamel tissue was sourced from would
therefore be important to consider as this would have an influence on the orientation of the enamel
prisms as well as the chemical composition within the tissue [Robinson et al., 1995a; Weatherell et
al., 1974; Weatherell et al., 1967] or susceptibility [de Groot et al., 1986; Macpherson et al., 1991]. In
this case, the assumption that enamel mineral will possess the same characteristics on recession
down its depth would be incorrect. If such structures are to be used, the contribution of this to the
lesions which are produced within should be investigated.
3.1.1 Aims and Objectives
Investigations into the relationship between prism orientation and carious lesion formation will be
conducted with the aim of exploring the patterns of enamel demineralisation within U-shaped
grooves. A combination of abiotic demineralisation systems will be employed in order to provide a
greater comparison. The strengths and weaknesses of using enamel tissue (specifically bovine incisal
tissue) will also be evaluated as they would relate to natural occlusal surface demineralisation.
Specifically, microstructural and chemical gradients within natural bovine tissue will be investigated
for their influence demineralisation within an artificial carved groove structure.

Enamel Tissue Orientation and the Onset of Enamel Demineralisation | Ch. 3
52
3.2.0 Materials and Methods
3.2.1 Prism Orientation and Enamel Demineralisation
As described in previous sections (Section 2.2.0), bovine incisors were sourced and fashioned into
BEBs. Specific to this protocol, BEBs were approximately 8 x 5 x 5mm in size with an enamel surface
being 8 x 5mm and were selected on the basis of the thickness of this enamel layer; this being the
measured by the distance from the enamel surface and the enamel-dentine junction (EDJ) on all four
visible sides. To this end, a depth in excess of 1 mm was deemed acceptable.
Those BEBs which met this criterion were then polished on each 8 mm side composed of both
enamel and dentine layers. Surfaces were levelled 240-P carburundumpaper (Wet and Dry Abrasive
Sheets; ABL Resin and Glass, Cheshire, UK) and subsequently polished with 1200-P sheets (Rhynowet
Sheets; Insasa, Indústria de Abrasivos, Spain). Non-residual making tape (Guangzhou Broadya
Adhesive Products Co., Ltd., Guangdong, China) was then cut into rectangles 1 x 6mm and placed
over either the side of the enamel sections immediately above the enamel-dentine junction or on
the enamel surface of the BEBs. BEBs were then painted in acid-resistant varnish (MaxFactor
Nailfinity; Procter and Gamble, Weybridge, UK) and once dried (approx. 15 min) the masking tape
was carefully removed leaving an exact area of enamel exposed. Figure 3.2.1 and Figure 3.2.2
illustrate this process for natural surface and lateral demineralisation windows respectively.
Figure 3.2.1 (BEBs Painting Process): a) Bovine incisors were first sectioned into BEBs; b) a 1 x 6 mm piece of non-residual masking-tape was cut and placed central over the enamel surface; c) the making-tape was then smoothed down to ensure it met flush with the enamel surface; d) the entire BEB pained in an acid-resistant varnish; e) a period of approximately 15 min was allowed to pass so as that the varnish became tacky; f) the masking-tape “stencil” was removed leaving an exact area of 1 x 6 mm of the enamel surface exposed.

Enamel Tissue Orientation and the Onset of Enamel Demineralisation | Ch. 3
53
Figure 3.2.2 (BEBs Painting Process: Continued): g) Bovine incisors were first sectioned into BEBs; h) a 1 x 6 mm piece of non-residual masking-tape was cut and placed lateral to the enamel surface an equal distance between the enamel surface and the EDJ; i) the making-tape was then smoothed down to ensure it met flush with the enamel surface; j) the entire BEB pained in an acid -resistant varnish; k) a period of approximately 15 min was allowed to pass so as that the varnish became tacky; l) the masking-tape “stencil” was removed leaving an exact area of 1 x 6 mm of the side of the enamel surface exposed.
3.2.1.1 Static Hydrogel Demineralisation Model
Abiotic demineralisation systems used in this experiment were similar to those used in previous
sections. In brief, 2 mM phosphate from NaH2PO4 (Sigma-Aldrich Ltd., Poole, UK) and 2 mM calcium
from CaCl2.2H2O (Sigma-Aldrich Ltd., Poole, UK) were added to both the gel and the liquid phases.
The gel consisted of MeC (Sigma-Aldrich Ltd., Poole, UK) at 8% w/v and the liquid consisted of 100
mM lactic acid adjusted to pH 4.6 by titration with 1 M NaOH (Sigma-Aldrich Ltd., Poole, UK). Six
BEBs (3 of type “l” and 3 of type “f”; Figure 3.3.2 and Figure 3.3.1 respectively) were affixed to the
bottom of a disposable 50mL Sterilin container using Carding Wax (Associated Dental Products Ltd.,
Kemdent Works, Swindon, UK) so as the exposed enamel surface faced upwards. Approximately 20 g
of the gel was first poured into the containers immersing the BEBs completely and was allowed to
set before a further 20 g of the acid solution was poured over each gel. In total 9 BEBs of each type
were used ensuring that both acid-gel systems and internal replicates could each be considered in
triplicate. Completed systems were incubated at 37 °C for 10 days before being carefully removed,
rinsed in dH2O and stored with a moist cotton pellet before further analysis.
3.2.2 Demineralisation within U-Shaped Grooves
BEBs were prepared to dimensions of approximately 8 x 5 x 5 mm so as that an enamel surface of 8 x
5 mm was exposed and were selected on the basis of the thickness of the enamel layer which was

Enamel Tissue Orientation and the Onset of Enamel Demineralisation | Ch. 3
54
visible on the adjacent sides of each BEB. Depth was indicated as the distance of the enamel surface
to the enamel-dentine junction (EDJ) and a depth in excess of 1.5 mm was deemed acceptable
however it was noted at this point that curvature of the initial tooth structure may still be apparent
in the EDJ after correction of the enamel surface by polishing; therefore a uniform distance of < 2
mm could not be guaranteed from inspection of the depth of the EDJ using the visible side alone.
Nevertheless, in the absence of a more definitive technique this method was accepted and those
BEBs which met with the criterion were selected.
BEBs were then painted completely in acid resistant varnish and allowed to dry for approximately 1
h. Once the varnish had dried completely, BEBs were fixed onto ceramic anvils using Green-Stick
(Kerr Corporation, California, USA) and a small groove cut into the enamel surface to a depth of less
than 2 mm using a precision wire saw equipped with a 100 µm (width) diamond wire (Model 3241;
Well Diamantdrahtsagen GmbH., Mannheim, Germany). Great care was taken to ensure that the
groove cut did not penetrate past the EDJ however, as described above, it was not always sufficient
to ensure depth in relation to an unknown maximum (the EDJ with respect to the enamel surface).
The groove preparation process is illustrated in Figure 3.2.3.
Figure 3.2.3 (BEBs Painting and Groove-Caving Process): a) Bovine incisors were first sectioned into BEBs; b) the entered bed section was then pained in an acid resistant varnish; c) after approximately 30 minutes (when the varnish had dried) a cut was made into the surface the enamel surface of the pained BEB using a precision diamond wire saw and to an approximate depth of 1.5 mm.
3.2.2.1 Enamel Demineralisation Systems
Various demineralisation systems were used in this experiment with the aim of providing as
representative as possible examples of how carved groove structures would behave when faced with
a demineralising challenge. The systems used where base on 2 of those used previously and a
combination of both: static acid-gel (Section 2.2.1), pH cycling (Section 2.2.2) and pH-cycling with an
ionic stagnation layer (Combination of the method used in Sections 2.2.1 and 2.2.2).
For all conditions 4 BEBs with carved grooves were fixed into the bottom of 50 mL Sterilin (Sterilin
Ltd., Newport, UK) containers using Carding wax (Associated Dental Products Ltd., Kemdent Works,
Swindon, UK). For static acid-gel systems (Model #1), an 8% MeC w/v gel was made containing 10

Enamel Tissue Orientation and the Onset of Enamel Demineralisation | Ch. 3
55
mM phosphate from NaH2PO4 and approximately 20 g of the gel was poured into each Sterilin so as
that the BEBs were completely covered. Once the gel had set, a further 20 g of 100 mM lactic acid
solution, also containing 10 mM phosphate from NaH2PO4, was poured over the gel layer and the
completed acid-gel system left at 20 °C (thermostatically controlled room temperature) for 10 d.
BEBs selected for pH cycling (Model #2) were exposed to a cycle consisting of demineralising
(Solution A) and remineralising (Solution B) solutions for 6 days and were left under to Solution B for
the entire of the 7th day before the experiment was stopped. The cycle consisted of 6 h exposure to
Solution A followed by 18 h exposure to Solution B. The compositions of each of these solutions are
listed in Table 2.2.1. BEBs in the 3rd condition (pH cycling with an ionic stagnation layer; Model #3)
were exposed to these same conditions however a MeC gel layer consisting of 8% w/v MeC, and
with a mass of 20 g, was introduced first so as that, like Condition #1, the BEBs were completely
immersed. Figure 3.2.4 depicts this experimental design schematically.
Figure 3.2.4 (Comparison of the Various Demineralisation Systems Used): a) BEBs immersed in remineralisation solution (ie. Solution B from Table 3.2.1); b) BEBs immersed in demineralisation phase (ie. Solution A from Table 3.2.1); BEBs immersed in an MeC gel layer beneath a remineralisation solution; d) BEBs immersed in an MeC gel layer beneath a demineralisation solution (Model #1). The pH-cycling rhythms used for both models #2 and #3 are indication.
3.2.3 Scanning Electron Microscopy
Scanning Electron Microscopy (SEM) was used to provide a confirmation of the supposed tissue
orientation sectioning process in Section 3.2.1. BEBs were taken and sectioned along their transverse
axis and the cut plane was then ground smooth on custom made diamond impregnated disks with a
15 µm particle size (Buehler, Illinois, USA). At this point, the smoothened surface was then scanned
on Hitachi TM3000 desktop Scanning Electron Microscope (SEM; Hitachi High-technologies Europe

Enamel Tissue Orientation and the Onset of Enamel Demineralisation | Ch. 3
56
GmbH., Berkshire, UK) up to magnifications of up to x2000. No coating procedures were required to
image using this equipment.
Images were captured on software provided by the manufacturer (Version 02.03.02) using several
scan points descending from the enamel surface inward towards the EDJ; these images were
interpreted with respect to the prism orientation in the samples. The samples were then removed
from the their mount with the SEM and surfaces acid-etched in 100 mM HCl (Sigma-Aldrich Ltd.,
Poole, UK) for 30 seconds before being rinsed x3 in dH2O and scanned a second time at similar
positions and to the same magnifications. As with the initial scans performed (those before the acid
etching procedure), all images were captured on software provided by the manufacture and
interpreted with respect to the orientation of the enamel prisms.
3.2.4 TMR Experimental Specifics
Due to the fact that BEBs were group according to condition it was possible to distinguish the
orientation of the lesion by the visual appearance of the EDJ. Therefore, BEBs from the experiment
described in Section 3.2.1 were first separated according to group before sectioning for TMR.
Sectioning into the transverse orientation and preparation to the point of sample mounting onto the
acetate sample frame was performed exactly as described in Section 2.2.3 for all BEBs. Statistics
were performed as described in Section 2.2.4.

Enamel Tissue Orientation and the Onset of Enamel Demineralisation | Ch. 3
57
3.3.0 Results
3.3.1 SEM of Transverse Enamel Sections
Representative examples of the SEM images captured before acid etching of the transverse enamel
sections are shown in Figure 3.3.1. At an initial magnification of x250 (Figure 3.3.1a), a grain is visible
on both the enamel and the dentine layers of the section. This proceeds un-interrupted from the
lower right of the section to the upper left. Also visible at this magnification are what appear to be
damaged areas on the enamel surface. The darkened areas, resulting from a less electron-dense
signal, serve as an indication of: depth of field, the density of the area which is viewed and the
perspective dude to electron deflection. It is concluded from the appearance of these darker areas
at the enamel surface that they are the result of latter (damage to the enamel section during the
TMR preparation process and not a result of reduced electron density by tissue demineralisation).
Higher magnification (x2000) of the apparent tissue grain was also performed (Figure 3.3.1b). This
higher magnification (x2000) relates to the central portion of the same transverse section as the
x250 magnification was made from.
Figure 3.3.1 (SEM Images of the Transverse Section before Acid-Etching): a) x250 magnification of the transverse section of an enamel section following grinding on a diamond impregnated disk (scale bar = 300 µm), orange arrows () indicate possibly damaged areas at the enamel surface, inter-globular dentine is presented on false-colour orange (); b) x2000 (scale bar = 30 µm) magnification of the central portion of the same enamel section illustrated in “a”. Enamel prisms are not visible in either image. Striated lines proceed at an angle of approximately 20° to the enamel surface and continue uninterrupted from the enamel portion through the EDJ and across the dentine.
Closer inspection of the grain in the tissue revealed it to be the composed of many small grooves
approximately 1 – 3 µm in diameter. Both the uniform and straight alignment of these grooves is
indicative of scuff marks. Examination of the dentine layers of these same sections was able to pick
out further structures which were characteristic of this tissue. In Figure 3.3.2, the grain which
proceeded from lower right to upper left in the example images of Figure 3.3.1 can be seen; this
time proceeding almost horizontally with a slight upward-left slop. However, in this image, the grain
is almost hidden by a much larger grain-like pattern in the tissue; this time proceeding from the
lower left to the upper right of the image. This image was captured at an area immediately blow the

Enamel Tissue Orientation and the Onset of Enamel Demineralisation | Ch. 3
58
inter-globular dentine regions indicated on Figure 3.3.1a. Both the size and positions of these larger
lines are consistent with what would be expected to be found in transverse sections of bovine
dentine when in close proximity to the EDJ [Lopes et al., 2009].
Figure 3.3.2 (SEM Image of Dentine before Acid-Etching): x1200 magnification of the dentine portion of a BEB sectioned along its transverse axis. The image is captured immediately below the EDJ (scale bar = 50 µm). The orientation of the image with respect to the enamel surface is indicated. Dentine tubules are visible as wide (5 µm) striated lines running at approximately 45° to the enamel surface
Transverse sections viewed following acid-etching (100 mM HCl; 30 sec) are presented below in
Figure 3.3.3. An x250 magnification is illustrated (Figure 3.3.3a), and in comparison to images which
were captured before exposure to the acid-etch, a distinctly dissimilar pattern can be seen in both
the enamel and the dentine portions of the transverse sections. In the outer 200 µm of the enamel
layer, a uniform grain is apparent. This pattern continues to the inner 200 µm of the tissue however
in less uniform of an arrangement. In the inner 200 µm, the grain as a whole becomes separated by
less ordered areas approximately 120 µm apart. Closer inspections of the inner and outer enamel
layers are presented in Figure 3.3.3c and 3.3.3b respectively. The areas to which they related are
indicated by expansion boxes relative to Figure 3.3.3a.
Magnification at x1000 for these inner and outer enamel layers was able to confirm their identity as
enamel prisms which had been exposed by exposure to the acid-etch. In the outer areas of the
enamel tissue (approximately 390 µm from the EDJ; Figure 3.3.3c), the orientation of the enamel
prisms are highly ordered; they proceed at an angle of approximately 45° to the enamel surface.
Their orientation also appears slanted toward the transvers plane of view although it is not possible
to conclude at what angle this forward slant existed. In close proximity to the EDJ (approximately 30
µm), the enamel prisms are again visible however in this area of the enamel tissue their order was
found to be markedly dissimilar to the outer region described above.

Enamel Tissue Orientation and the Onset of Enamel Demineralisation | Ch. 3
59
Figure 3.3.3 (SEM Images of the Transverse Section after Acid-Etching): a) x250 magnification of the transverse section of a BEB following acid-etching in 100 mM HCl for 30 Sec (scale bar = 300 µm); b) x1000 magnification of the enamel area indicated on “a” (scale bar = 100 µm); c) x 1000 magnification of the enamel area indicated on “a” (scale bar = 100 µm). The generalised orientation of enamel prisms is visible in all images as lines running approximately 45° from the enamel surface. This order appears greater at close proximity to the enamel surface as shown in “c” however breaks down on approach to the EDJ as shown in “b”.
The view of the structures within Figure 3.3.3b was enhanced further to a magnification of x2000
and viewed in more detail. On this closer inspection, the visible ends of the enamel prisms are
approximately 4 µm in diameter however due to the un-quantified forward slant of the transverses
sections it is not possible to determine the length of the prisms. The arrangement of the enamel
prisms in Figure 3.3.3 appears cross-hatched; the ends of the prism structures, although frayed, can
clearly be identified at between 40 and 60° angles with both left- and right-oriented slopes. From

Enamel Tissue Orientation and the Onset of Enamel Demineralisation | Ch. 3
60
this view, uniform lines can be made-out within the enamel prisms themselves. These lines run
generally parallel to the prisms structure and are therefore indicative of enamel crystal clusters
within the prisms themselves.
3.3.2 TMR of both Lateral- and Surface-Created Enamel Lesions
Of the 9 BEBs which were used for each condition (i.e. surface and lateral), 5 thin sections were cut
across the length of the exposed enamel window. However, as was common during the TMR
preparation, some thin sections were lost mainly due to damage to the fragile corners of the
sections (Figure 3.3.5b). However the effects of this were marginal as only the central portions of the
lesion were analysed initially (Figure 3.3.5) and in all, representative data sets (n = 9) were gained.
Figure 3.3.5 (Reconstructed Micro-Radiographs): Examples of the radiographs obtained from lesions created on the lateral enamel surfaces. Dotted white lines indicated the analysis area which was used to generate TMR data. Green areas () represent the area taken as sound enamel and red areas () indicate a dark used for zero-point calibration; a) an example of a lateral lesion confined to the enamel only; b) an example of a lateral lesion which progressed past the EDJ; c) an example of an enamel surface lesion; d) an enamel lesion which was formed on an irregular surface.
Some irregularities were also noted in the enamel surfaces which lesions were created on (Figure
3.3.5d). In these case the lesion body invariably followed the contours of the enamel surface,
therefore the source of the irregularity must have existed before lesion creation, and as no lack of
section integrity could be determined, these section were not rejected. Mean measurements of ΔZ,
LD and SMax are listed in Table 3.3.1.
Condition (BEBs) ∆Z ± SD LD ± SD R ± SD SMax ± SD
Natural Surface 9 1148.16 ± 222.34 51.32 ± 8.01 22.37 ± 2.58 66.85 ± 4.23
Lateral Surface 9 1651.61 ± 454.76 62.52 ± 13.25 28.87 ± 13.25 64.21 ± 5.70
Table 3.3.1 (TMR Parameters from Natural and Lateral Enamel Surfaces): Integrated mineral loss (ΔZ), lesion depth (LD), average mineral loss (R), SL mineralisation (SMax) and the number of transverse sections analysed along with the number of BEBs assigned to each condition. SDs for both lesion types (Surface and Lateral) are also presented for each TMR parameter measured.
Significant differences was detected (P = 0.009) between ΔZ values taken from either condition. This
parameter was lower in lesions created on the natural enamel surface than in lesions created on the
lateral sides of the enamel sections. Further to this, differences in LD measurements also reached
significance (P = 0.045) and LD was greater in the lateral lesions than in the natural surface lesions.
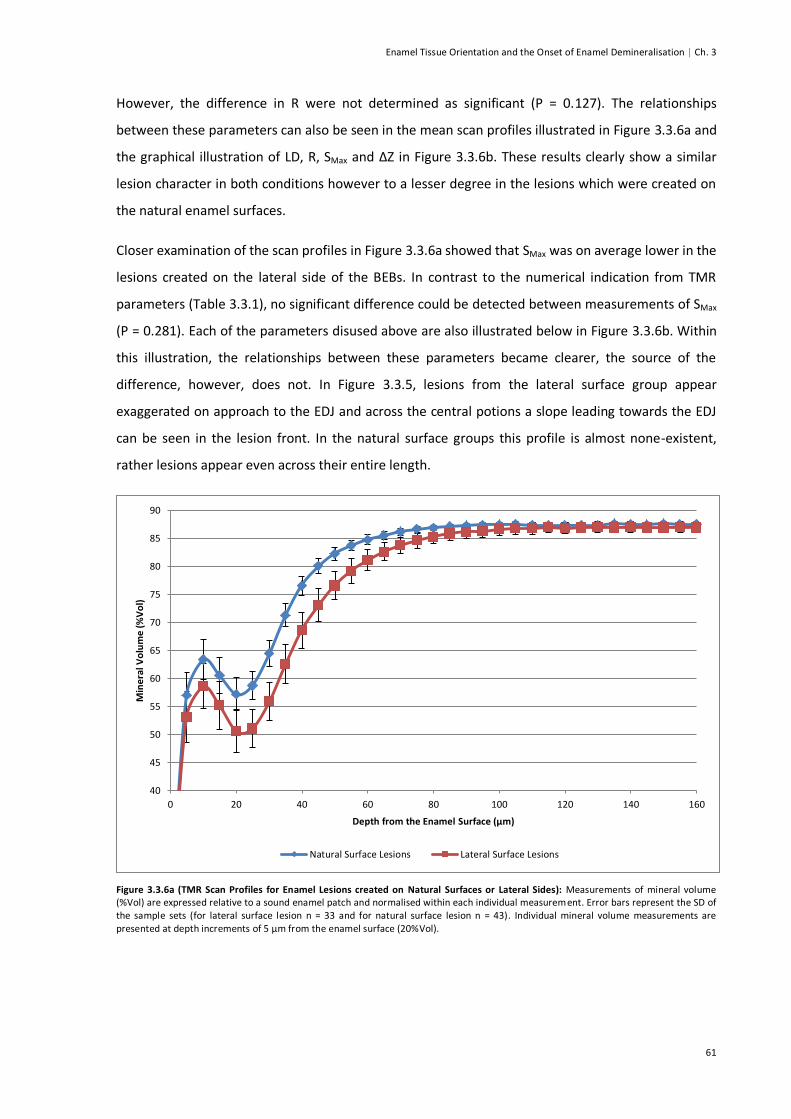
Enamel Tissue Orientation and the Onset of Enamel Demineralisation | Ch. 3
61
However, the difference in R were not determined as significant (P = 0.127). The relationships
between these parameters can also be seen in the mean scan profiles illustrated in Figure 3.3.6a and
the graphical illustration of LD, R, SMax and ΔZ in Figure 3.3.6b. These results clearly show a similar
lesion character in both conditions however to a lesser degree in the lesions which were created on
the natural enamel surfaces.
Closer examination of the scan profiles in Figure 3.3.6a showed that SMax was on average lower in the
lesions created on the lateral side of the BEBs. In contrast to the numerical indication from TMR
parameters (Table 3.3.1), no significant difference could be detected between measurements of SMax
(P = 0.281). Each of the parameters disused above are also illustrated below in Figure 3.3.6b. Within
this illustration, the relationships between these parameters became clearer, the source of the
difference, however, does not. In Figure 3.3.5, lesions from the lateral surface group appear
exaggerated on approach to the EDJ and across the central potions a slope leading towards the EDJ
can be seen in the lesion front. In the natural surface groups this profile is almost none-existent,
rather lesions appear even across their entire length.
Figure 3.3.6a (TMR Scan Profiles for Enamel Lesions created on Natural Surfaces or Lateral Sides): Measurements of mineral volume (%Vol) are expressed relative to a sound enamel patch and normalised within each individual measurement. Error bars represent the SD of the sample sets (for lateral surface lesion n = 33 and for natural surface lesion n = 43). Individual mineral volume measurements are presented at depth increments of 5 µm from the enamel surface (20%Vol).
40
45
50
55
60
65
70
75
80
85
90
0 20 40 60 80 100 120 140 160
Min
era
l Vo
lum
e (
%V
ol)
Depth from the Enamel Surface (µm)
Natural Surface Lesions Lateral Surface Lesions

Enamel Tissue Orientation and the Onset of Enamel Demineralisation | Ch. 3
62
Figure 3.3.6b (TMR Parameters for Lesions Created on Natural Surface or Lateral Sides): LD (µm), R (%Vol) and SMax (%Vol) measurements both share the left axis due to their relative magnitude. ΔZ (%Vol.µm) measurements are plotted on the right axis for the pur poses of clarity. Error bars represent the SD of the sample set (n = 9) listed in Table 3.3.1. An asterisk (*) indicated a significant difference (P < 0.050) between sample sets.
Statistical analysis of the lesions proceeding at a step approximately 300 µm from the EDJ (in the
lesions analysed from the lateral condition) or indiscriminate with respect to direction (for lesions
taken from the enamel surface conditions) was performed on a subset of 6 randomly selected
enamel sections from each condition. These analyses revealed marked difference in the ΔZ
measurements taken across the length of lesions created on lateral surfaces and this difference (P <
0.001) was found to exist in the first step (immediately adjacent to the EDJ; Figure 3.3.7a). A similar
trend was also observed between LD measurements (Figure 3.3.7b) taken from this same group (P <
0.001). However, no significant difference (P ≥ 0.135) could be determined for any other parameter
(R or SMax) within the subset chosen of the lateral lesion group. For the lesions which were created
on the natural enamel surfaces, no significant differences (P ≥ 0.456) were determined for any of the
TMR parameters across the entire length of the lesions.
0
10
20
30
40
50
60
70
80
90
100
0
500
1000
1500
2000
2500
ΔZ LD R SMax
Lesi
on
De
pth
(µ
m)
/ M
ine
ral
Vo
lum
e (
%V
ol)
Inte
rgra
ted
Min
era
l Lo
ss (
ΔZ;
%V
ol.
µm
)
Parameter
Lateral Surface Natural Surface
*
*

Enamel Tissue Orientation and the Onset of Enamel Demineralisation | Ch. 3
63
Figure 3.3.7a (∆Z Measurements at increments from the EDJ): The step size used was approximately 300 µm and t image analysis window captured an area of approximately 600 µm. Error bars represent a 95% confidence interval based on a t-distribution (n = 6).
Figure 3.3.7b (LD Measurements at increments from the EDJ): The step size used was approximately 300 µm and t image analysis window captured an area of approximately 600 µm. Error bars represent a 95% confidence interval based on a t-distribution (n = 6). Dotted orange lines indicate a significant difference between sample sets.
750
950
1150
1350
1550
1750
1950
2150
1 (EDJ - Inner) 2 (Centre) 3 (Outer)
Inte
rgra
ted
Min
era
l Lo
ss (
∆Z;
%V
ol.
µm
)
Step (Analysis Position)
ΔZ (%Vol.µm) - Lateral ΔZ (%Vol.µm) - Surface
30
40
50
60
70
80
90
100
1 (EDJ - Inner) 2 (Centre) 3 (Outer)
De
pth
(µ
m)
Step (Analysis Position)
LD (µm) - Lateral LD (µm) - Surface

Enamel Tissue Orientation and the Onset of Enamel Demineralisation | Ch. 3
64
3.3.3 TMR of U-Shaped Grooves
Of the 9 BEBs used in these experiments, 4 thin sections were initially cut. Upon removal from their
respective demineralisation systems, thick deposits of residual nail varnish were found within the
carved grooves. As the entry to the groove was blocked it was concluded that the action of the
demineralisation systems would have been altered and the BEBs were therefore discarded. This
resulted in 1 BEB being rejected from each group. During TMR preparation, several thin sections
were also lost due to damage during the mounting process or because areas of the groove were
notable cracked or had otherwise disintegrated. Ultimately, each condition (or demineralisation
system) was left with 6 remaining samples from 3 BEBs (2 from each block).
Initial TMR image analysis, performed at x5/0.11 magnification, revealed that residual nail varnish
remained within the grooves and was visible post-imaging (Figure 3.3.8). In all, 7 microradiographs
exhibited nail varnish residue which made statistical analysis by TMR impossible. Nevertheless, some
useful information was gained from the visual inspection of the sections.
Figure 3.3.8 (Example Micro-Radiographs): Residual varnish is apparent within the grooves of each transverse section illustrated. Also
shown are carved grooves which pass the EDJ and those which come close. Fractures on the enamel sections are also indicated by orange
directional arrows (); a) Model #1; b) Model #2; c) Model #3.
Firstly, the grooves which were carved into the enamels surface did not appear consistent with
respect to depth, shape or orientation within the tissue. Some grooves exhibited variable width
down their shafts (which were expected to be parallel). In Figure 3.3.8, examples of this can be seen
in each of the images presented. Further to this, the grooves did not proceed in a straight line from
the enamel surface in towards the dentine layers. In Figure 3.3.8a a relative wide entrance fades into

Enamel Tissue Orientation and the Onset of Enamel Demineralisation | Ch. 3
65
a narrow groove at the base, the trajectory or path of this groove also veers left to right several
times along its length. Also illustrated across all 3 example images is difference in orientation within
the enamel tissue itself. The groove in Figure 3.3.8a cuts the enamel surface at approximately 80°
and continues past the EDJ and into the dentine layers itself. In Figure 3.3.8b, the groove cuts at
approximate right angles (90°) to the surface and approaches, but does not cross, the EDJ. The
groove cut in Figure 3.3.8c crosses the enamel surface at an angle of almost 85° however appears to
be relatively distant from the EDJ.
The actual depth to which each groove was cut also varied greatly in these sections. Measurements
made from microscopic analysis of the radiographic images (Figure 3.3.9) determined mean groove
depth to be 1.544 mm ± 0.386SD and the mean distance of the base of the groove from the EDJ as
0.335 mm ± 0.481SD (in instances where the groove cut past the EDJ a negative value was recorded).
Combining the sum of each set provides the enamel layer thickness (ELT) for which a mean was
calculated as 1.879 ± 0.223SD. Comparisons of the actual groove structures by ANOVA found no
significant difference between any of the 3 conditions when testing these parameters (P = 0.900, P =
0.605 and P = 0.371 respectively).
Figure 3.3.9 (Groove Depth Plotted against Distance from the EDJ): The sum of groove depth and distance from the EDJ provides the measurement of ELT. Dotted grey lines represent a 95% confidence interval generated from a Pearson’s correlation.
From the data illustrated in Figure 3.3.9, a strong negative correlation was found between grove
depth and the distance of the groove from the EDJ (R2 = -0.890; P < 0.001). However in comparing
ELT, opposing relationships were found. ELT showed a weak but non-significant correlation with
R² = 0.7916
-1000
-500
0
500
1000
1500
500 1000 1500 2000 2500 3000
Gro
ove
Dis
tan
ce f
rom
th
e E
DJ
(µm
)
Groove Depth from the Enamel Surface (µm)
Model #1 Model #2 Model #3 Linear Fitline

Enamel Tissue Orientation and the Onset of Enamel Demineralisation | Ch. 3
66
groove depth (R2 = -0.188; P = 0.455) whereas distance from the EDJ was found to have a significant
correlation with ELT (R2 = 0.616; P = 0.007).
In an effort to counteract the presence of residual nail varnish, enamel sections were again soaked in
acetone (as described in the TMR method section; Section 2.2.4) and radiographed a second time in
exactly the same manner as was done during the initial preparation. The same sections presented in
Figure 3.3.8 are illustrated again (following the second round of preparation) in Figure 3.3.10.
3.3.3.1 Secondary TMR Analysis
Subsequent radiographic analysis performed following a repetition of the acetone treatments
described in Section 2.2.3 (in this instance, no further cutting or polishing of the 80 µm thin sections
was applied) confirmed that the majority of residual nail varnish had been removed from the
grooves although some areas did remain at the deepest points of the carved grooves. In comparing
like sections from Figure 3.3.10 (below) to those in Figure 3.3.8 (above), the vast majority of residue
was clearly removed by repeated processing of the sections. However, some further damage to the
enamel surfaces also occurred as a result.
Figure 3.3.10 (Example Micro-Radiographs): Residual varnish is no longer apparent within the grooves illustrated. Each section related to
those in Figure 3.3.8. Areas of lost tissue are indicated in false colour orange (); a) Model #1; b) Model #2; c) Model #3.
Areas of demineralisation appeared to be present only in the outermost areas of the groove (with
respect to enamel surface) although some suspect areas were noted in the base of the grooves
when the EDJ had been breached. The most relevant areas were therefore analysed as 2 equidistant
steps in the outer 600 µm of the each groove (x20/0.40 magnification) and the results listed below in
Table 3.3.2. Deeper areas of suspected demineralisation are illustrated separately.
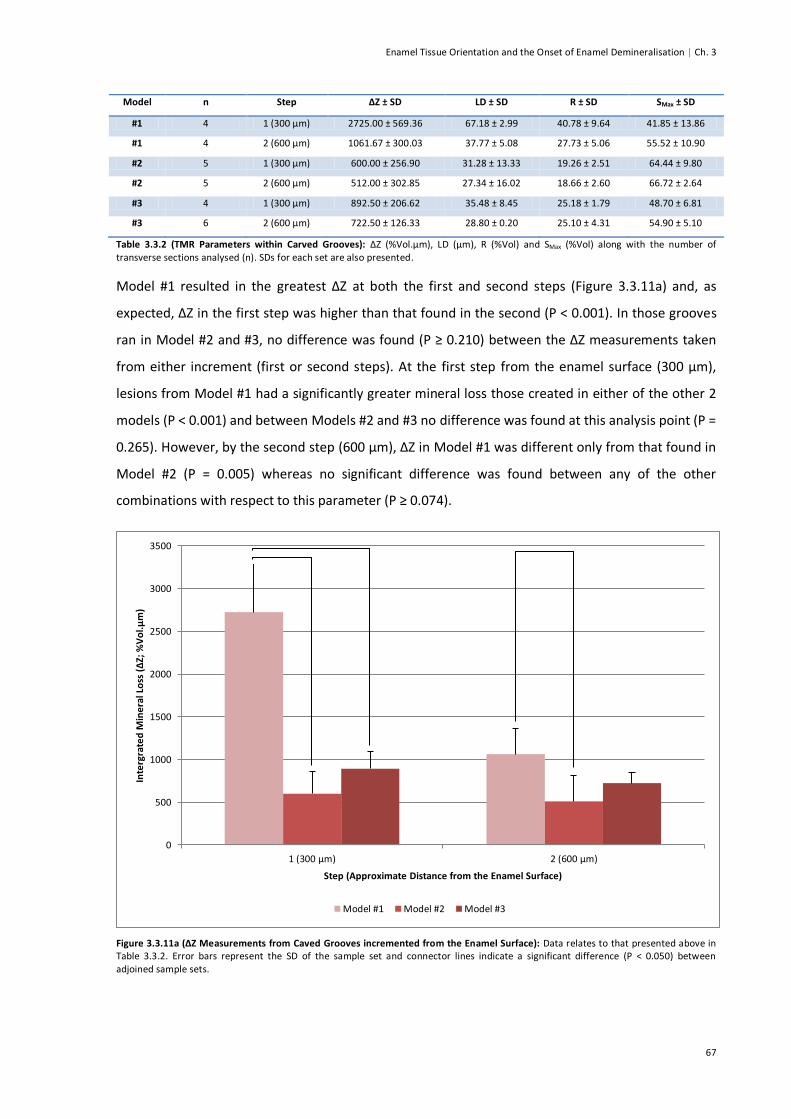
Enamel Tissue Orientation and the Onset of Enamel Demineralisation | Ch. 3
67
Model n Step ΔZ ± SD LD ± SD R ± SD SMax ± SD
#1 4 1 (300 µm) 2725.00 ± 569.36 67.18 ± 2.99 40.78 ± 9.64 41.85 ± 13.86
#1 4 2 (600 µm) 1061.67 ± 300.03 37.77 ± 5.08 27.73 ± 5.06 55.52 ± 10.90
#2 5 1 (300 µm) 600.00 ± 256.90 31.28 ± 13.33 19.26 ± 2.51 64.44 ± 9.80
#2 5 2 (600 µm) 512.00 ± 302.85 27.34 ± 16.02 18.66 ± 2.60 66.72 ± 2.64
#3 4 1 (300 µm) 892.50 ± 206.62 35.48 ± 8.45 25.18 ± 1.79 48.70 ± 6.81
#3 6 2 (600 µm) 722.50 ± 126.33 28.80 ± 0.20 25.10 ± 4.31 54.90 ± 5.10
Table 3.3.2 (TMR Parameters within Carved Grooves): ΔZ (%Vol.µm), LD (µm), R (%Vol) and SMax (%Vol) along with the number of transverse sections analysed (n). SDs for each set are also presented.
Model #1 resulted in the greatest ΔZ at both the first and second steps (Figure 3.3.11a) and, as
expected, ΔZ in the first step was higher than that found in the second (P < 0.001). In those grooves
ran in Model #2 and #3, no difference was found (P ≥ 0.210) between the ΔZ measurements taken
from either increment (first or second steps). At the first step from the enamel surface (300 µm),
lesions from Model #1 had a significantly greater mineral loss those created in either of the other 2
models (P < 0.001) and between Models #2 and #3 no difference was found at this analysis point (P =
0.265). However, by the second step (600 µm), ΔZ in Model #1 was different only from that found in
Model #2 (P = 0.005) whereas no significant difference was found between any of the other
combinations with respect to this parameter (P ≥ 0.074).
Figure 3.3.11a (ΔZ Measurements from Caved Grooves incremented from the Enamel Surface): Data relates to that presented above in Table 3.3.2. Error bars represent the SD of the sample set and connector lines indicate a significant difference (P < 0.050) between adjoined sample sets.
0
500
1000
1500
2000
2500
3000
3500
1 (300 µm) 2 (600 µm)
Inte
rgra
ted
Min
era
l Lo
ss (
ΔZ;
%V
ol.
µm
)
Step (Approximate Distance from the Enamel Surface)
Model #1 Model #2 Model #3
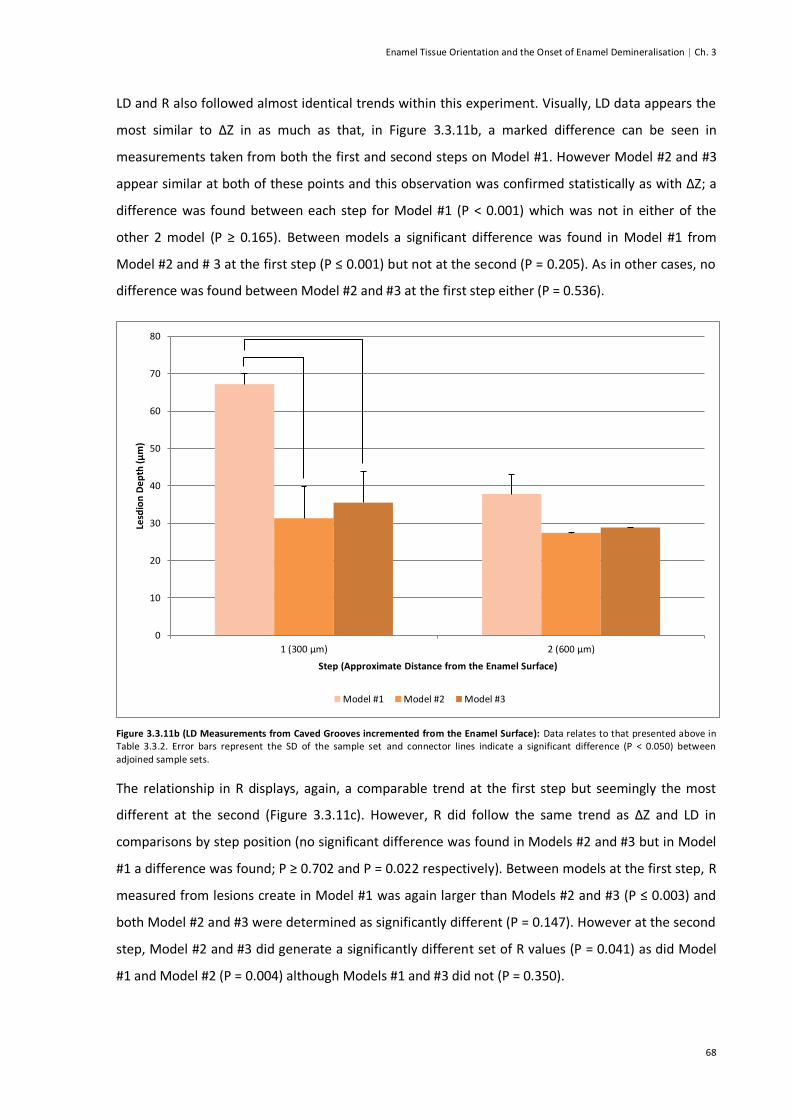
Enamel Tissue Orientation and the Onset of Enamel Demineralisation | Ch. 3
68
LD and R also followed almost identical trends within this experiment. Visually, LD data appears the
most similar to ΔZ in as much as that, in Figure 3.3.11b, a marked difference can be seen in
measurements taken from both the first and second steps on Model #1. However Model #2 and #3
appear similar at both of these points and this observation was confirmed statistically as with ΔZ; a
difference was found between each step for Model #1 (P < 0.001) which was not in either of the
other 2 model (P ≥ 0.165). Between models a significant difference was found in Model #1 from
Model #2 and # 3 at the first step (P ≤ 0.001) but not at the second (P = 0.205). As in other cases, no
difference was found between Model #2 and #3 at the first step either (P = 0.536).
Figure 3.3.11b (LD Measurements from Caved Grooves incremented from the Enamel Surface): Data relates to that presented above in Table 3.3.2. Error bars represent the SD of the sample set and connector lines indicate a significant difference (P < 0.050) between adjoined sample sets.
The relationship in R displays, again, a comparable trend at the first step but seemingly the most
different at the second (Figure 3.3.11c). However, R did follow the same trend as ΔZ and LD in
comparisons by step position (no significant difference was found in Models #2 and #3 but in Model
#1 a difference was found; P ≥ 0.702 and P = 0.022 respectively). Between models at the first step, R
measured from lesions create in Model #1 was again larger than Models #2 and #3 (P ≤ 0.003) and
both Model #2 and #3 were determined as significantly different (P = 0.147). However at the second
step, Model #2 and #3 did generate a significantly different set of R values (P = 0.041) as did Model
#1 and Model #2 (P = 0.004) although Models #1 and #3 did not (P = 0.350).
0
10
20
30
40
50
60
70
80
1 (300 µm) 2 (600 µm)
Lesd
ion
De
pth
(µ
m)
Step (Approximate Distance from the Enamel Surface)
Model #1 Model #2 Model #3

Enamel Tissue Orientation and the Onset of Enamel Demineralisation | Ch. 3
69
Figure 3.3.11c (R Measurements from Caved Grooves incremented from the Enamel Surface): Data relates to that presented above in Table 3.3.2. Error bars represent the SD of the sample set and connector lines indicate a significant difference (P < 0.050) between adjoined sample sets.
Figure 3.3.11d (SMax Measurements from Caved Grooves incremented from the Enamel Surface): Data relates to that presented above in Table 3.3.2. Error bars represent the SD of the sample set and connector lines indicate a significant difference (P < 0.050) between adjoined sample sets.
0
10
20
30
40
50
60
1 (300 µm) 2 (600 µm)
Ave
rage
Min
era
l Lo
dd
(R
; %V
ol)
Step (Approximate Distance from the Enamel Surface)
Model #1 Model #2 Model #3
0
10
20
30
40
50
60
70
80
1 (300 µm) 2 (600 µm)
Min
era
l Vo
lum
e (
%V
ol)
Step (Approximate Distance from the Enamel Surface)
Model #1 Model #2 Model #3

Enamel Tissue Orientation and the Onset of Enamel Demineralisation | Ch. 3
70
For the remaining parameter of SMax (Figure 3.3.11d), statistical tests were unable to determine any
difference between lesions measured at either step for each model tested (P ≥ 0.118 and P ≥ 0.265
respectively). Between models, there was no significant difference found in SMax at the second step
(P ≥ 0.060). However, in the first step, SMax was higher in the lesions extracted from Model #1 when
compared to Model #2 (P = 0.009) although not when compared to Model #3 (P = 0.377). Likewise,
no significant difference was found between Models #2 and #3 (P = 0.049).

Enamel Tissue Orientation and the Onset of Enamel Demineralisation | Ch. 3
71
3.4.0 Discussion The initial SEM images which were captured of transverse enamel sections (Figure 3.3.1) showed
striated lines which proceeded across both enamel and dentine portions of the tissues. Due to this
continuity and the fact that they bore no resemblance to any other structure which is commonly
associated with the enamel/dentine tissue, it was concluded that the most likely source was an
artefact of the preparation process. Namely scuffs which resulted from the abrasive action of the
diamond impregnated grinding disk (Figure 2.2.4). However, the particle size of the grinding disks
was made to a specification of 15 µm and close examination of the SEM images estimates the width
of the particulate to be between 1 and 3 µm. Initially this would rule-out a forensic link to the source
of the artefact however the actual grinding disks which were used were over 10-years old. It is
therefore likely that the disks themselves had become worn down which would provide finer
grinding surface such as the one that is evident from the marks left in the enamel sections. Further
to this, during the successive removal of the tissue a build-up of fine residue occurs on the surface of
the grinding disk. This is controlled by rinsing with dH2O however removal may not be complete
meaning that only the more jagged points of the diamond particles protrude; these points being
smaller than the actual particle size. Lastly, the multi-directional action used during grinding creates
an overlap in the grinding plane, as with the build-up of residue, the result would be that only the
grain carved by the tips of the more jagged points would be visible. In reality, it is likely that all three
of these factors contributed to the observe result. Even without further preparation some of the
natural structures of the dentine layer were visible under the high (x1200) magnification. The
structures visible in Figure 3.3.2 are consistent with the size and direction of that which would be
expected from the dentine tubules within bovine enamel [Lopes et al., 2009].
Post-acid-etching, the structure and orientation of the enamel prisms was exceptionally clear (Figure
3.3.3). In the outer region of the enamel the prisms were generally more ordered that was found in
the areas which were closer to the EDJ and this was in-line with what would expected of enamel
tissue [Bechtle et al., 2010]. From the cross-sectional incisal image captured in Figure 2.2.1, Striae of
Retzius are visible and these would correspond to the perikymata structures in Figure 3.3.3 [Hillson,
2005]. Although, in the transverse section the enamel prisms did not project the entire length of the
enamel tissue, this was most likely due to the orientation of the traverse section. Closer inspection
of the prism structures reveals a series of overlapping structures with those closer to the EDJ and
above those closer to the natural enamel surface. This would be consistent with a transverse section
which was slanted towards the viewing plane. Unfortunately, fully 3-dimentional aspects cannot be
accounted for when viewing enamel sections in a single transverse plane however it should be
remembered that bovine enamel may exhibit a more disorder structure than human tissue.

Enamel Tissue Orientation and the Onset of Enamel Demineralisation | Ch. 3
72
3.4.1 Lesion Progression on Lateral and Natural Surfaces
Given relatively small sample sets, the fact that a greater amount of demineralisation was observed
in the lateral surface lesion group when compared to the lesions produced on natural enamel
surfaces variation in the chemical composition of the enamel tissue itself (Figure 3.1.1) is likely to
have played a prominent role in modulating the results. However the effect of this should have been
minimised by the use of the relatively flat labial sections. Producing the BEBs from these surfaces
would give the added advantage that, generally, the broader and flatter regions of the enamel tissue
possess a greater mineral content and, hence would be subject to less variation from the inclusion of
organic components or chemical variations [Robinson et al., 1995a; Weatherell et al., 1974].
Shellis [1984] attributed an enhanced rate of lesion progression to a greater disorder of the enamel
prisms in human enamel (as measured by mean prism junction density) and in-line with this
assertion, the results of the present work show both an increase in disorder (Figure 3.3.3) and
greater mineral loss (Figure 3.3.7a) on approach to the EDJ. Consequently this increased creates
available space within the enamel tissue and thus allows for a greater inclusion of organic matrix
and, enamel H2O and various other inorganic impurities [Robinson et al., 1995a]. Whilst the intra-
oral history of the bovine incisors themselves may have contributed to chemical alterations of the
enamel tissue [de Groot et al., 1986; Weatherell et al., 1974], the removal of the natural enamel
surface [Macpherson et al., 1991] and the controlled sources of the bovine substrate should have
limited the influence of these extraneous factors.
The contribution of the structural variations in prismic order on approach to the EDJ has also been
identified in previous work [Anderson and Elliott, 2000; Shellis, 1984] however further histological
factors were also identified in the present work; these being the prismic orientation across the
entire thickness of the enamel layer and, more specifically, the prismsic orientation with respect to
the natural enamel surface. The assumption that enamel prisms are aligned more or less transverse
to the natural enamel surface was applied when planning the current experiments although this
assumption was wrong. Instead, the enamel prisms were orientation around 45° to a true transvers
line running normal to the natural surface and parallel to the aproximal viewing-plane (Figure 3.3.3).
However this finding would serve to validate the use of such samples in that due to the slope of the
enamel prisms, their orientation with respect to natural or lateral surface lesions would be more
similar than was previously thought. Therefore, the greater level of demineralisation seen on
approach to the EDJ and the apparent lack of any such trend across the length of the natural surface
created lesions (Figure 3.3.7a and Figure 3.3.7b) may have not in fact have been due to the
orientation of the enamel prisms. Rather, when using sections produced from the labial surfaces, a
comparative prismic orientation is maintained between both natural surface and groove structures.

Enamel Tissue Orientation and the Onset of Enamel Demineralisation | Ch. 3
73
This would serve the purpose of direct comparisons between demineralisation within grooves or
polished smooth surfaces with anisotropic properties removed as a contributing factor. However, it
should also be noted that in natural occlusal surfaces, prismic orientation may be closer to parallel in
some areas of the groove than they would be perpendicular [Shore et al., 1995b].
Moreover, the lack of any mineral loss gradient across the lesions created on the natural enamel
surface also raised an interesting point with respect to the process of flaring [Lynch, 2006]. As was
noted in previous AGS experiments, an exaggerated point of demineralisation can develop at the
periphery of the enamel window and feature as an artefact in static acid gel systems but this was not
the case in the current work. Rather, flaring appeared as an artefact which was absent. An
explanation of this may lie in size of the enamel windows which were used [Ruben et al., 1999]. The
experiments performed in Chapter 2 provided detailed information on the occurrence of flaring in
an almost identical AGS. It was found from these that flaring was limited to the outer 1 mm of the
lesions. Due to the smaller enamel widows used in the present study (1 x 6 mm), the effects of this
would be evenly distributed across the lesion and thus the effects would be mitigated.
Interestingly, in examples taken from the lateral surface group, where the demineralisation window
crossed the EDJ, much less mineral loss was observed than would be expected form gradients in the
susceptibility of the tissue (Figure 3.3.5b). Initially this result may prove contradictory however, with
further consideration, this can be explained o the very same basis as that which is responsible for
the points of flaring observed previously. Dentine tissue is more soluble than enamel [Shore et al.,
1995b], therefore, under exposure to an acidic challenge dentine shows a greater propensity to
demineralise than does the adjacent enamel tissue [Lynch and ten Cate, 2006b]. Within the present
study, the effect of this would be a greater contribution to the concentration of dissolved ions in the
vicinity of the EDJ. In this case, the DS of the tissue with respect to enamel would be increased as a
result of mineral ions liberated by the dissolving dentine tissue [Lynch and ten Cate, 2006b] and
thus, the greater susceptibility of the enamel tissue in this particular area (on approach to the EDJ)
would be balance by a reduction in the driving force for demineralisation.
3.4.2 Preparation and Production of Lesions within U-Shaped Grooves
Server fractures to the walls of carved grooves were continually apparent as a result of processing to
TMR analysis. Clearly the production of grooves within enamel surfaces is an intricate process. Not
least TMR analysis of the structures but also the initial carving procedure. From what was gathered
in the present work, the actual depth of each groove varied and more importantly, so did the
proximity and penetration of the EDJ (Figure 3.3.9). However, the fact that groove depth and the
distance from the EDJ correlated negatively demonstrates that ELT was relatively constant. This was

Enamel Tissue Orientation and the Onset of Enamel Demineralisation | Ch. 3
74
an unexpected finding as the natural tooth structure was expected to be the major contributor to
variation in the results. It would therefore appear that the concern over this issue was, to some
extent, unfounded as the controls imposed (by the selection process) proved highly effective.
As was described in the preparation methods (Section 3.2.2), the ELT was controlled by inspection of
the sides of each BEB where the EDJ was visible. However it was accepted that the labial surfaces of
bovine incisors possess a convex curvature which can vary in itself and can also become more
pronounced on approach to the root. Within the labial surfaces, the source of the BEBs was not
strictly controlled although in choosing relatively equal ELTs (on either side of the BEB in question)
inadvertently selected specimens which were closer to the central plane of the labial surface and
which therefore possessed an EDJ which was relatively flat (Figure 3.4.1).
Figure 3.4.1 (Variation in the EDJ with Respect to the Enamel Surface): Enamel is shown semi-transparent in order to visualise the orientation of the enamel and dentine tissues with respect to each other; a) EDJ is perfectly parallel to polished enamel surface; b) some variation exists resulting from a natural curvature which was removed from the enamel surface by the polishing process; c) example of high variation in ELT.
Further to prismic orientation, it should also be noted that the structural integrity of enamel tissue
is, in part, afforded by the prismsic structures [Shore et al., 1995a]. The prismsic orientation of
fractured samples was not ascertained directly although it is perfectly possible that a source of the
fragility experienced may have been due to this. Previous studies which have used carved grooves to
simulate fissures have done so using dentine as a substrate [Deng et al., 2004; Deng and ten Cate,
2004; Deng et al., 2005; Zaura et al., 2002; Zaura et al., 2005], and to the authors knowledge enamel
is employed much less often. The amenability of fragile enamel sections to the higher level of
processing required for TMR analysis may be a potential reason for this as was identified within a
comprehensive study performed by Lagerweij et al [1996]. These authors reported that all attempts
to produce grooves within bovine enamel failed due to a propensity to fracture during the
preparation process.
Yassin [1995] performed experiments which related directly to the fragility of these structures,
Lesion were formed under a slightly higher demineralising challenges however what was found was
that relatively weak physical stresses were able to significant damage the demineralised areas within

Enamel Tissue Orientation and the Onset of Enamel Demineralisation | Ch. 3
75
the grooves whereas sound enamel surfaces remained intact. In the present work, fractures
occurred due to the preparation process in both demineralised and sound areas of the tissue (Figure
3.3.8) and, further to this, secondary preparation performed in an effort to remove residue from
within the groove and thus enable TMR analysis resulted in further destruction of the tissue (Figure
3.3.10). It should also be noted that the secondary analysis did not involve polishing and mounting
stages rather the sections were immersed in acetone and gently brushed within the groove to
remove the residue and the areas which were subsequently destroy by this process were often
identified as possessing some level of structural damage upon initial TMR analysis. It would
therefore appear that the process of carving grooves into enamel surfaces results in an extremely
fragile structure and that the extent of sample preparation severely increases the likelihood of
damage to the sections. This effect would be expected to be increased further when lesions are
produced within the samples. Thus, sample preparation should be kept to a minimum with the
inclusion of the maximum number samples possible to counteract losses which may inevitably occur.
The fact that nail varnish residue remained within the grooves was a cause for concern (Figure 3.3.8
and Figure 3.3.10). However, areas of demineralisation noted beneath the residue indicated that the
source of this was most likely to have come from the mounting and polishing process as if the acid
resistant varnish had entered the groove before the demineralising challenged then
demineralisation would not have occurred beneath this layer. As noted above, effective removal of
residue should be applied in order to maximise the output from each experiment and thus provide
the most robust data sets possible.
It appeared from these results that demineralisation was most effective in the AGS-exposed BEBs
(Model #1). Very little demineralisation was observed within the grooves of the BEBs which were
exposed to the pH-cycling system (Model # 2) and those which were exposed to the combination or
hybrid system (Model # 3). As described in the Chapter 3, the efficacy of pH-cycling model is reduced
when more narrow structures are employed [Matsunda et al., 2005; Matsunda et al., 2006] and this
can be attributed to residual fluid which remains within the grooves between either de- or re-
mineralising challenges. However, the results from Model #3 may contradict this theory. An ionic
stagnation layer was included within this model on top of which the solutions of the pH-cycling
system were applied. The high viscosity of this layer would have served to stabilise the liquid within
the matrix [Larsen, 1991]. Therefore, between either challenge, a degree of neutralisation or
acidification would have to occur within the matrix before the conditions imposed would reach the
actual surface of the enamel. In this way, the introduction of a gel phase tested the assertion that
residue from either solution was responsible for the lack of demineralisation within the base of more

Enamel Tissue Orientation and the Onset of Enamel Demineralisation | Ch. 3
76
acute structures and found this conclusion to be insufficient to wholly explain the observed results.
Interference between either solution is nevertheless plausible as a contributing factor although the
buffering capacity afforded by the mineral itself [Zaura et al., 2002] is likely to have a had a stronger
influence on the results than previously thought. If the de- and re-mineralising challenges can be
assumed to penetrate completely into the depth of the groove whilst failing to result in
demineralisation then buffering effects of the enamel tissue should not be underestimated if such
structures are to be used within biological in vitro models.
3.5.0 Conclusions The use of enamel grooves is a more effective way of modelling occlusal surface due to the relative
feasibility of their manufacture. Ultimately, the practicality of this aspect is essential for their use in
a model such as the CDFF. However, the structural integrity of carved grooves is a significant issue as
their propensity to fracture may lead to a reduction in the data which is able to be extracted from
studies in which they are used. Great care should therefore be taken in their preparation and use in
future studies with alternative smooth surface samples being included as a contingency. Specifically
with enamel tissues, physical gradients in the solubility of the tissue should be considered as on
recession from the entrance of the groove, the response of the tissue itself to a demineralising
challenged is likely to be altered and therefore may contribute to the observed results (as opposed
to the challenge itself being the sole factor responsible).
Of the abiotic model systems chosen to explore enamel demineralisation within such carved groove
structures, the greatest extend of demineralisation was found with the use of the AGS model.
However, the challenge imposed by this system may have been comparably greater and therefore
qualification of the efficacy of a system based on this aspect alone is ultimately illegitimate process.
Surprisingly, the hybrid system was able to perform on a comparable level to the pH-cycling model.
Further to this, penetration into the narrow groove structure was not improved to any meaningful
extent over either of the other models chosen. Thus, from the results obtained, it can be concluded
that the degree of neutralisation between exposure solutions used in the pH-cycling models does
not significantly hinder their ability to function as the gel layer incorporated into the hybrid model
would be expect to exacerbate this effect. In reference to the latter observation, it was also found
that the fluidity of the pH-cycling systems does not provide any further benefit when more narrow
groove structures are employed. As neutralisation between exposure solutions is thought to have a
much less significant effect, residual solution within the groove is an unlikely source of the observed
results but rather diffusive access to the bulk solution (inclusive of buffering provided by the mineral
tissue itself) exerts a much greater effect.

77
Chapter 4: Abiotic Considerations for Biological Caries Models
4.1.0 Introduction The CDFF is essentially a biological model for simulating biofilm growth [Peters and Wimpenny,
1988] and factors which would be expected to effect cariogenicity of the biofilm [Cenci et al., 2009;
Deng et al., 2005; Vroom et al., 1999]. However, in investigating the caries process the composition
of the PF is one of the most important factors to consider [Nyvad et al., 2013] as this is medium
which is immediate contact with the tooth’s surface (and therefore the medium which most
influence the DS of the liquid within the enamel tissue). As saliva forms the basis of the PF in vivo
[Margolis and Moreno, 1994], its composition is also important to consider. The growth medium
which is fed into the CDFF would also have the same influence over the PF within the in vitro biofilms
grown within the CDFF. However, the composition of salivary analogues used to support microbial
populations are often constructed from natural products and these themselves are known to vary
[Wong and Sissions, 2001]. Shellis et al. [1978] approached this problem from the point-of-view that
consistency and buffering capacity were the most desirable aspects to be controlled [Shellis, 1978].
However, these authors and others [Gal et al., 2001; Wong and Sissions, 2001] also accepted that
the demands on producing a synthetic salivary analogue are higher and therefore the use of a
relatively undefined medium may still retain its own merit. The accessibility of ingredients, cost and
ease with which the medium can be produced all support its use when running a model biofilm
system.
An indication as to the ionic composition of the growth medium is nevertheless desirable due to the
importance of the ions which would be delivered to the biofilm and thus would directly influence the
caries process. Furthermore, one key component of natural saliva is the buffering capacity which it
affords [Tenovuo, 2004] and so a secondary influence can occur along with the effects of various
other molecular components [Bardow et al., 2000]. Combined, these properties provide protection
from essentially inorganic process such as erosion [Hannig, 2002] and the progression of carious
demineralisation [Lenander-Lumikari and Loimaranta, 2000]. With the buffering capacity of the
saliva being so central, this property was also investigated within the salivary growth medium.
4.1.1 Aims and Objectives
Attempts to study the physiochemical relationships within biological models also require that the
composition of unknown entities are characterised to the greatest extent possible. Thus, the ionic
composition and buffering capacity of the STGM will be investigated both in absolute terms in
comparisons to natural saliva in order to provide a basis for further discussion and to preclude its
use in CDFF experiments which aim to ascertain physiochemical relationships within in vitro biofilms.

Abiotic Considerations for Biological Caries Models | Ch. 4
78
4.2.0 Materials and Methods
4.2.1 Buffering Capacity of Salivary Growth Medium (STGM)
The buffering capacity of the STGM was investigated using a protocol adapted from investigations
into the buffering capacity of stimulated and unstimulated human saliva [Bardow et al., 2000]. A
single 2 L batch of the STGM was prepared from the ingredients listed below in Table 4.2.1 [Pratten
et al., 1998a; Pratten, 2005]. From this, the batch was divided into two and one batch subsequently
autoclaved (121 °C and 2200 mBar for 15 min) in a Touchclave-Lab K200s (LTE Scientific Ltd.,
Oldham, UK) whereas the other, stored at 4 °C in a BioCold laboratory refrigerator (Scientific
Laboratory Supplies Ltd., Yorkshire, UK) until needed.
Nutrient Concentration Supplier
Lab Lemco Powder 1.0 g.L-1
Oxoid, Basingstoke, UK
Bacteriological Peptone 5.0 g.L-1
Oxoid, Basingstoke, UK
Yeast Extract 2.0 g.L-1
Oxoid, Basingstoke, UK
Hog Gastric Mucin (Type III) 2.5 g.L-1
Sigma-Aldrich, Poole, UK
Potassium Chloride 0.2 g.L-1
(2.683 mM) Sigma-Aldrich, Poole, UK
Sodium Chloride 0.2 g.L-1
(3.422 mM) Sigma-Aldrich, Poole, UK
Calcium Chloride Di-Hydrate 0.3 g.L-1
(2.041 mM) Sigma-Aldrich, Poole, UK
Table 4.2.1 (Composition of STGM): All ingredient of the Saliva-Type Growth Medium (STGM) are listed along with their relative quantities per litre of the medium in-line with their sources. Once weighed out, the STGM was made-up to volume using dH2O.
Once the autoclaved batch had cooled to room temperature (21 °C), 50 mL aliquots were separated
into three 50 mL Sterilin containers (Sterilin Ltd., Newport, UK). These containers were then sealed
and placed into a water bath (Fisher Scientific DMU12 Water Bath; Fisher Scientific UK Ltd.,
Leicestershire, UK) at 37 °C for approximately 2h so that the STGM within was able to reach an
equilibrium with the temperature of the bath. During this time, three 50mL volumes of the STGM
which was not autoclaved were also poured into 50 mL Sterilin containers and the temperature
brought up to 37 °C in the same way as the autoclaved samples. Whilst remaining within the water
bath, a pH electrode (Jenway 924-047; Bibby Scientific Ltd., Staffordshire, UK) was used to measure
the initial pH of each STGM and these values recorded before being adjusted to neutrality (pH 7) by
titration with 1 M NaOH (Sigma-Aldrich Ltd., Poole, UK) or 1 M HCl (Sigma-Aldrich Ltd., Poole, UK) as
required. Once neutrality was reached, 50 µl volumes of 1 M HCL were added to the STGM with the
resultant pH recorded after the addition of each. This process continued across the range 7 ≥ pH ≥ 3.
Results were expressed as measured pH against mmol H+ per litre of STGM (mmol H+.L-1). From this
information the buffering capacity (β) of the STGM both before and following autoclaving was also
calculated using the equation given below in Figure 4.2.1. Data were then compared as buffering
capacity (β; mmol H+.L-1) against the pH of the STGM at the time of the addition of the acid.

Abiotic Considerations for Biological Caries Models | Ch. 4
79
Figure 4.2.1 (Calculation of Buffering Capacity): Buffering capacity (β) is defined as the change in the amount of acid added expressed in mmol units (Δ CA; for the strong acid HCl, Δ CA = Δ H
+) per litre of STGM(ie. mmol H
+.L
-1) and Δ pH is the change in pH following the
addition of the acid [Bardow et al., 2000].
4.2.2 Analysis of the Salivary Growth Medium (STGM)
Further from the information provided by the manufactures of the individual nutrients listed in
above in Table 4.2.1, the composition of the STGM was investigated using Capillary Electrophoresis
(CE; Figure 4.2.2) using a P/ACE-MDQ system (Beckman-Coulter UK Ltd., High Wycombe, UK). Six 10
mL samples were first collected under a laminar air flow hood (Bassaire P5H Cabinet; Bassaire Ltd.,
Southampton, UK) from 6 sterile (121 °C and 2200 mBar for 15 min in a Touchclave-Lab K200s
autoclave; LTE Scientific Ltd., Oldham, UK) 10 L STGM batches. Each of the six 10 mL samples were
then passed through a 0.2 µm disposable syringe filter (Minisart; Sigma-Aldrich Ltd., Poole, UK)
leaving approximately 2 mL of the filtered STGM available for analysis. The 2 mL filtered STGM
aliquots were then stored at 4 °C whilst 2 internal standard solutions were prepared; these filtered
samples were then used for both anion and cation analysis using the CE technique.
Figure 4.2.2 (Schematic Design of the CE Technique): Both the inlet and outlet vials and the capillary tubing are filled with a buffer solution. Samples are injected into the capillary by replacement of the inlet vial with that of a sample and the application of air pressure. An electrical current is then applied moving charged analytes through the capillary and past a detection window.
For, anion analysis Na-Azide (Sigma-Aldrich Ltd., Poole, UK) at a concentration of 250 µm was used
as the internal standard and bacteriostatic agent. A solution was first made up to a concentration of
333.33 µM Na-Azide in dH2O and 15 µL of this added to a single PCR tube along with 5 µL of the
filtered STGM sample; therefore leaving a final concentration of 250 µM Na-Azide standard in a x4

Abiotic Considerations for Biological Caries Models | Ch. 4
80
diluted STGM sample. This process was repeated for each of the 6 STGM samples. Each PCR tube
was then loaded into the CE system. In the case of preparation for cation analysis, an internal
standard was added in the form of Lithium from LiCl2. A 0.2 M stock solution (Beckman Coulter UK
Ltd., High Wycombe, UK) was diluted down to 5 mM in dH2O and 5 µL of this added to 5 µL of the
filtered STGM samples along with 15 µL dH2O; therefore leaving a final concentration of 1 mM
Lithium in an x5 diluted STGM sample. PCR tubes holding samples were then loaded into the CE
system as described for the anion analysis procedure (Figure 4.2.3).
Figure 4.2.3 (CE Sample Preparation): a) 5µL sample to be used for either anion or cation analysis; b) the sample is diluted in 15 µL of 333.33 µM Na-Azide for anion analysis or 15 µL dH2O for cation analysis (at this point samples are read for anion analysis); c) a further 5µL of 5 mM LiCl2 is added for samples to be run under cation analysis (at this point samples are ready for cation analysis).
In both cases (anion and cation analyses) samples were run within buffers provided by the
manufacturer as part of specific analysis kits sold separately (Anion Analysis Kit A53537 and Cation
Analysis Kit A53540; Beck Coulter Ltd., High Wycombe, UK). All separation procedures were
performed as detailed within the analysis kits provided by the manufacturer and the electrophoretic
UV absorbance traces were captured on 32 Karat Software (Version 8.0; Beckman Coulter Ltd., High
Wycombe, UK). For both separation procedures bare-fused silica capillaries were used with an
effective length (distance from the sample to the detector) of 50 cm and a total length of 57 cm. The
internal capillary diameter was 75 µm and the outer diameter was 375 µm (eCAP Capillary Tubing;
Beckman Coulter Ltd., High Wycombe, UK).
Analytes chosen for analysis by this technique were chloride, nitrate, sulphate, fluoride, formate,
succinate, acetate, lactate, propionate, phosphate, butyrate, ammonium, sodium, potassium,
magnesium and calcium (each was introduced in the form of a sodium or chloride salt and supplied
by Sigma Aldrich Ltd., Poole, UK). Two stock solutions were first made at the concentrations also
listed in the proceeding table. These solutions were made up to a volume of 900 mL and, in the case
of anion stock solutions, the pH was adjusted to approximately 6.5 with 1 M NaOH (Sigma-Aldrich

Abiotic Considerations for Biological Caries Models | Ch. 4
81
Ltd., Poole, UK) before being brought up to a final volume of 1 L. For cation stock solutions, the
initial pH in dH2O was approximately 3.2. Cation standard solutions were therefore diluted in the
cation separation buffer supplied along with the analysis kit.
4.2.2.1 Qualitative vs. Quantitative Analysis
In order to enable qualitative analysis of the of the STGM samples the minimum detection limits of
the CE system were first established. These were investigated in mixed solutions as opposed to
individually to control for peak ambiguities resulting from potential close migrations times and,
furthermore, to provide an insight into shoulder sensitivity limits in the case of any ambiguity. Thus,
separate dilutions were made at an initial level of x10 from anion and cation stock solutions. Nitrate,
sulphate, succinate, propionate, butyrate, potassium and calcium were introduced to the initial
stock solution at a concentration of 10 mM whereas chloride, fluoride, formate, acetate, lactate,
phosphate, ammonium, sodium and magnesium were introduced at a concentration of 20 mM. In all
cases chloride and sodium slats were chosen for cations and anions respectively (Sigma-Aldrich Ltd.,
Poole, UK). Each of these was then serially diluted at a 2-fold decrease to a final dilution of x5120 (10
detection limit calibration levels). These dilutions were then run using their respective separation
kits and the minimum detection limits (MDLs) were established. Qualitative analysis was thus
performed on the basis of positive (+) or negative (-) for whether or not the analytes were above or
below the MDL respectively.
Quantitative analysis was performed by manual integration over detectable peaks (i.e. above the
MDL) based on the corrected area (relative to an internal standard). Calibration curves were first
constructed over 4 Levels at the following stock solution dilutions: x10 (Level 1), x20 (Level 2), x40
(Level 3) and x80 (Level 4). In all cases the internal standard were kept constant at 250 µM Azide for
anion solutions and 1 mM Lithium for cation solutions. Calibration sequences were run within the 32
Karat software and all sample traces analysed in triplicate. For anion traces, shoulder sensitivity,
peak threshold and width were set to 500, 350 and 0.05 and for cation traces these parameters were
set to 0.1, 1000 and 9999 respectively. From these analyses, corrected area values were generated
for each of the trace peaks (based on a known constant value from the internal standard peak). The
calibration curves were then analysed for goodness of fit and any alterations applied as necessary
using the parameter options within the 32 Karat software. Once, appropriate fits were decided,
these calibrations were applied to each of the sample traces. Data values for each analyte were then
exported and reconstructed in Microsoft Excel 2010 (Version 14.6112.5000; Microsoft Office
Professional Plus; Microsoft Ltd., Berkshire, UK).

Abiotic Considerations for Biological Caries Models | Ch. 4
82
4.3.0 Results
4.3.1 Buffering Capacity of Salivary growth Medium (STGM)
Buffering capacity of the STGM followed a similar trend both before and after sterilisation and these
results are illustrated below in Figure 4.3.1. Around neutral (pH 7), there was no significant
difference (P < 0.05) between either group (pre- or post-autoclave) however by approach to pH 6
and continuing past the (putative) critical pH of dental enamel (pH 5.5), a gradual divergence in the β
was seen between that of post-autoclaving STGM and the un-sterilised samples, the buffing capacity
was relatively higher before sterilisation. Once the critical pH of dental enamel had been reached,
there was a difference in β of 0.5 mmolH+.LSTGM-1. Further down these trends, an increase in
buffering capacity was found at pH 4.85 followed by a decreased at pH 4.5 in the pre-autoclave
condition; an occurrence which was absent post-autoclave. A slight depression was seen also seen in
the post-autoclaved STGM at pH 3.95 however with the exception of these points noted, the general
trend in both appeared similar but with a greater capacity consistently found before the STGM was
autoclaved. The greatest difference in buffering capacity was seen at the end of the titration assay
where a difference of 3.0 mmol H+.LSTGM-1 was found.
Figure 4.3.1 (STGM Buffering Capacity both Before and After Sterilisation): Mean (n = 3) buffering capacity (β) measurements of the STGM both before and after sterilisation by autoclaving (ie. the ability of the STGM to withstand a change in pH measured by mmol.L
-1 H
+
adsorbed within the STGM at a given pH). The dotted red line indicates the (putative) critical pH of dental enamel (5.5).
0
1
2
3
4
5
6
7
8
2 3 4 5 6 7 8
Bu
ffe
rin
g C
apac
ity
(β;
mm
ol H
+ .L S
TGM
-1.p
H-1
)
STGM pH
STGM (Post-Autoclave) STGM (Pre-Autoclave) Critical pH (Enamel)

Abiotic Considerations for Biological Caries Models | Ch. 4
83
4.3.2.1CE Qualitative Composition of the Salivary Growth Medium (STGM)
Qualitative analysis of the STGM found detectable levels of chloride, sulphate, formate, acetate,
lactate, propionate, phosphate and butyrate. Fluoride was not detected in any of 6 STGM samples
(Table 4.3.1). However, both fluoride and formate peaks were found to appear in close proximity to
each other (Figure 4.3.3), therefore, given small variations in sample mobility times and the potential
presence of one of these analytes in the absence of the other, it was not possible to determine the
identity of singular peak which would have arose around this time point. The identity of the formate
peaks within the samples was therefore based on the secondary analysis of the STGM by
potentiometric measurement with a fluoride-specific probe. These results detected fluoride as
below 0.01 ppm (0.621 µM ± 0.009SD; n = 6). Given the x4 dilution which was applied to STGM
samples during anion analysis, a peak resulting from fluoride within the STGM would be below the
MDL and therefore, the assignment of these peaks as formate could be justified. However, when
present together, fluoride and formate peaks were discernible by shoulder sensitivity and this
reference point was detectable even at very low calibration levels (62.5 µM fluoride or formate).
Sample Cl- NO3
- SO4
2- F
- Formate Succinate Acetate Lactate Propionate PO4
3- Butyrate
1 + - + - + + + + + + +
2 + - + - + + + + + + +
3 + - + - + + + + + + +
4 + - + - + + + + + + +
5 + - + - + + + + + + +
6 + - + - + + + + + + +
MDL 15.62 7.81 7.81 15.62 15.62 7.81 15.62 15.62 7.81 15.62 7.81
Table 4.3.1 (Qualitative Analysis of Anions within the STGM): Positive signs (+) represent the presence of a given analyte above the MDL define above. Negative signs (-) confer the opposite (ie. concentrations of the sample were below its MDL). Note that within all samples
both fluoride and nitrates were not detected. Minimum detection limits (MDLs) are expressed in µM.
Figure 4.3.2 (Electropherogram of Anions Separated from the STGM): Trace relates to the STGM Sample 1. Azide was added to each sample as an internal standard in the amount of 250 µm. Proceeding from left to right, peaks can be identified for chloride, sulphate, azide, formate, succinate, acetate, lactate, phosphate and butyrate. Unresolved peaks are present between formate and succinate (4 min) and following butyrate (6 min and 7 min approximately). # indicates an uncharacterised analyte.

Abiotic Considerations for Biological Caries Models | Ch. 4
84
Further to the ambiguity of fluoride / formate peaks, phosphate peaks also show an unusual shape
when traces were gained from STGM samples but not from the standard solutions. The phosphate
peak in Figure 4.3.2 provides a typical example of this. In this trace, the phosphate peak shows highly
pronounced shoulders on both the leading and following edges, and a stark contrast is apparent
when the trace in this example is compared to the trace in Figure 4.3.3 which was created from
known standards within stock solutions.
Figure 4.3.3 (Electropherogram of the Anion Level 1 Stock Solution): a) Close migration times of fluoride and formate increasing the likelihood of incorrectly identified peaks; b) example of a well resolved phosphate peak..# indicates an uncharacterised analyte.
Ammonium, sodium, potassium, magnesium and calcium were also detected in all STGM samples as
were several other cations which were not characterised during this experiment. Figure 4.3.4 shows
a typical electropherogram trace gained from an STGM cation separation. As indicated, the unknown
analytes appeared late-on during the separation process, therefore although precise identification
was not possible these ions can be deduced to be cationic species with lower electrophoretic
mobilities than any of the other analytes noted. Of those ions which were identified fully, their
presence and MDLs are listed blow in Table 4.3.2.
Sample Ammonium Sodium Potassium Magnesium Calcium
1 + + + + +
2 + + + + +
3 + + + + +
4 + + + + +
5 + + + + +
6 + + + + +
MDL 62.50 62.50 62.50 62.50 31.25
Table 4.3.2 (Qualitative Analysis of Cations within the STGM): Positive signs (+) represent the presence of a given analyte above the MDL define above. Negative signs (-) confer the opposite (ie. concentrations of the sample were below its MDL). Note that all analytes chosen for detection were present in all of the STGM samples taken. Minimum detection limits (MDLs) are expressed in µM.

Abiotic Considerations for Biological Caries Models | Ch. 4
85
Figure 4.3.4 (Electropherogram of Cations Separated from the STGM): This individual trace relates to the STGM Sample 1. Lithium was added to each sample in the amount of 1 mM. Proceeding from left to right, peaks can be identified for ammonium, sodium, potassium, lithium, magnesium and calcium. Unresolved peaks are evident in this sample following the emergence of the calcium peak (approximately 4 min 36 sec and 4 min 42 sec).# indicates an uncharacterised analyte.
4.3.2.2 CE Quantitative Composition of the Salivary Growth Medium (STGM)
Quantification experiments of the STGM media found chloride to be present in the highest
concentration of approximately 10.99 mM. This equated roughly to the concentrations added
directly to the STGM from KCl, NaCl and CaCl2.2H2O (10.207 mM; Table 4.2.1). However,
comparisons to the bases to the chlorine salts did not follow the same direct relationship. Sodium
and potassium were each measured between x3 and x4 greater STGM than the amount which was
added directly. Calcium, on the other hand, was measured as much closer to the amount which was
added (2.9 mM measured whereas 2.041 mM were added from CaCl2.2H2O). Magnesium and
sulphate were also detected within the STGM; the concentrations of these analytes were much
lower than calcium sodium and potassium although was at a significant enough level to enable
quantification (MDLs for magnesium and sulphate were 277 µM and 417 µM respectively). Both
nitrate and fluoride were concluded as BMDL. Figure 4.3.5 illustrates each of these analytes together
for the purposes of direct comparisons.
Formate, although detected in STGM samples, was consistently below the threshold values
necessary to provide proper integration of the anion peaks. It is therefore listed as BMIL (Below
Minimum Integration Limits) in Figure 4.3.6 Further investigations at this point, also defined
ammonium as BMDL. Phosphate was measured as 1.442 mM however the form which phosphate
was present in was not detected by this CE method. Of the organic acids which were measured,
lactate was found in the highest concentrations (1.2 mM). Succinate, acetate, propionate and
butyrate were present in the STGM at a fraction (0.25) of this level (each aproximal 0.3 mM).

Abiotic Considerations for Biological Caries Models | Ch. 4
86
Figure 4.3.5 (Concentrations of Inorganic Ions within the STGM following Autoclaving): Dark () bars indicate anions and light () bars indicate cations; each group was therefore analysed separately. Error bars represent the sample SD. Analytes which were BMDL are indicated. Lithium was included as an internal standard for all cation separations in the amount of 1000 µM.
Figure 4.3.6 (Concentrations of Organic Ions within the STGM following Autoclaving): Dark () bars indicate anions and light () bars indicate cations; each group was therefore analysed separately. Error bars represent the sample SD. Analytes which were BMDL are indicated. Azide was included as an internal standard for all anion separations in the amount of 250 µm.
0.0
2.0
4.0
6.0
8.0
10.0
12.0
14.0
Chloride Nitrate Sulphate Fluoride Sodium Potassium Lithium(Standard)
Magnesium Calcium
An
alyt
e C
on
cen
trat
ion
(m
M)
0
200
400
600
800
1000
1200
1400
1600
1800
2000
Azide(Standard)
Formate Succinate Acetate Lactate Propinoate Phosphate Butyrate Ammonium
An
alyt
e C
on
cen
trat
ion
(µ
M)

Abiotic Considerations for Biological Caries Models | Ch. 4
87
4.4.0 Discussion
4.4.1 Buffering Capacity of the STGM
The STGM saliva substitute appeared to decrease in buffering capacity following the autoclaving
process. Ultimately, the buffering capacity of the STGM before sterilisation would be irrelevant for
use in the biological model which was chosen for these works (the CDFF) as a pre-requisite of its use
is that all conditions internal to the system remain sterile before the commencement of any given
experiment [Pratten, 2005]. Nevertheless, the fact that buffering capacity is reduced post-autoclave
leans towards some indication of a compositional change to the STGM which would divide this
medium further from that which is described from its constitutes alone (Table 4.2.1).
In comparison to the buffering capacity of natural saliva, markedly different curves are produced
when samples of human saliva are investigated. Figure 4.4.1 illustrates data which was obtained
from un-stimulated human whole saliva [Bardow et al., 2000]. The authors attributed the principle
component of the buffering system within human whole saliva to be due to bicarbonate content and
the fact that carbonate exhibits maximum buffering capacity around pH 6.37 [House, 2013]
illustrated its importance in maintaining pH during a cariogenic challenge [Bardow et al., 2000].
Figure 4.4.1 (Buffering Capacity of Un-Stimulate Human Whole Saliva): Data was reconstructed from Bowden et al. [1998]. Buffering capacity (β) measurements reflect the ability of the saliva fraction to withstand a change in pH measured by mmol.L
-1 H
+ adsorbed within
the saliva at a given pH. Inlaid is the putative critical pH of dental enamel.
0
1
2
3
4
5
6
7
8
2 3 4 5 6 7 8
Bu
ffe
rin
g C
apac
ity
(β;
mm
ol H
+ .L S
TGM
-1.p
H-1
)
Saliva pH
Un-Stimulated Saliva Un-Stimulate Saliva (CO2/HCO3 Depleted) Critical pH (Enamel)

Abiotic Considerations for Biological Caries Models | Ch. 4
88
Part of the buffering system of bicarbonate involves a phase transition from liquid to gas (Figure
4.4.2) mediated by the carbonic anhydrase enzyme which is present in the oral environment [Kimoto
et al., 2006; Kivelä et al., 1999a; Leinonen et al., 1999] but this would be presumed absent or
denatured in the STGM. Nevertheless, the establishment of a bi-phasic buffer system in the absence
of catalysis would still be possible albeit to a relative limited extent. Previous works have
demonstrated that carbonic anhydrase is localised within the AEP at the earliest stages of biofilm
formation [Leinonen et al., 1999] and furthermore, the penetration of this enzyme through plaque
biofilms has been suggested to provide an anti-cariogenic effect [Kimoto et al., 2006; Kivelä et al.,
1999b]. Although, some researchers have found conflicting results whereby an increase in
cariogenicity was attributed to the buffering effects alleviating some of the self-inhibitory effects
experience by acidogenic species as result of their own metabolism [Culp et al., 2011].
Figure 4.4.2 (Bicarbonate Equilibrium): Carbonic anhydrase catalyses the reaction between CO2 and H2O [Maren, 1967] although its presence is not essential. Carbonic acid possess 2 pKa values; the first of which (pKa1 = 6.37) is illustrated above [House, 2013].
One key difference between the work conducted by Bardow et al. [1998] and the present study was
the fact that in the present work an open system was used and therefore a certain amount of
carbonate would be lost through equilibrium with the gaseous phase. Complete control over this
aspect of the system would have been an advantage however in the operating procedures for the
use of a CDFF carbonate enrichment in the growth medium is not advised [Pratten, 2005]. Further to
this, artificial salivas (both defined and undefined) generally used to support microbial growth do not
tend to include any enforced enrichment of the carbonate content either [Kinniment et al., 1996;
Kolenbrander, 2011; Pratten et al., 1998b; Shellis, 1978; Wong and Sissions, 2001]. Although this
aspect is important to the buffering capacity of the saliva in vivo, it is not introduced or would occur
within in vitro biological models such as the CDFF. Rather, the carbonate content would be present
only from equilibrium with atmospheric CO2. Therefore, the fact that STGM samples were not
shielded from CO2 during preparation does not serve to invalidate results. However, it should be
remembered that the phase buffering effect of atmospheric CO2 may have occurred during analysis
and therefore could have resulted in the measurement of a slightly higher buffering capacity than
would actually be the case (particularly as the pH of the STGM was decreased; pH ≤ 3.2).
The contribution of other constitutes to the buffering capacity of the STGM are more difficult to
ascertain. As noted above, the STGM is composed of various ingredients which themselves form
fractions of biological extracts therefore an exact identification of these was not possible by the

Abiotic Considerations for Biological Caries Models | Ch. 4
89
current methods employed. The various peptide fractions and protein extracts present in the STGM
can confer some buffering capacity around their specific isoelectric point [Bardow et al., 2000] and
to this end, an undetermined peak in buffering capacity was detected in the STGM before
autoclaving around pH 4.8. As the pH was reduced, a reduction then occurred around pH 4.5. The
magnitude of these changes was small however such deviations were not observed following
autoclaving of the samples. Therefore, components which would be sensitive to the autoclaving
process (such as the various uncharacterised polypeptide fragments) may have been responsible. As
lone molecules, amine (-NH4) and carboxylic (-COOH) groups can contribute to the buffer capacity of
the media and, within proteins or peptide fragments, charged residues may also contribute (Figure
4.4.3). Denaturation following autoclaving may have led to the exposure or shieling of residues such
as these as a result of conformational changes or covalent chemical reactions.
Figure 4.4.3 (Amino Acids): Some of the amino acids from which the residue may contribute to buffering capacity. Amine (-NH4) and carboxylic (-COOH) may also contribute; a) amino acids with basic side chains; b) amino acids with acidic side chains.
Furthermore, the loss of this aspect of the buffering capacity post-autoclaving illustrates the possible
impact of such molecular changes during the autoclaving process. Therefore theoretical calculations
of ionic composition should not be conducted as these may lead to the false assumption that
chemical activity can be defined from the added concentration alone. Urea is included in many
synthetic salivary growth media [Sissons, 1997] as both an energy source and to help to afford
accurate biofilm ecology through self-induced enzymatic activity and subsequent production of
ammonia which thus mediates the pH response of the biofilm [Wijeyeweera and Kleinberg, 1989a].
This additive was not specifically added to the STGM due to the requirement that urea must first be
filter sterilised and added to the medium post-autoclave [Pratten et al., 1998b] and therefore
presents a significant hazard for airborne contamination. However, yeast extract, lab lemco powder
(beef extract) and bacteriological peptone all provide a potential source for a microbial source of
ammonia. Mucin was also included in the STGM to provide a principle energy source for oral
bacteria [Bradshaw et al., 1994; Kolenbrander, 2011]. Specifically, hog gastric mucin is typically
employed due to its chemical similarity to human mucin [Herp et al., 1979]. However, human mucin

Abiotic Considerations for Biological Caries Models | Ch. 4
90
alone has been shown to exhibit a poor ability to accept H+ at low pH (pH ≈ 2) with carbonated
mineral reservoirs providing the bulk of the buffering capacity that can be detected [Mitchell, 1931].
Whilst such a physicochemical system may exist within the STGM, it would be reasonable to
conclude that that the mucin itself did not significantly contribute to the observed results.
Phosphate possess 3 distinct disassociation constants of pKa1 = 2.12, pKa2 = 7.21 and pKa3 = 12.68
[House, 2013]. When present in significant concentrations, this ion therefore exhibits buffering
capacity within each these ranges. It has been proposed that phosphate contributes some buffering
effect to natural saliva [Lendenmann et al., 2000] however the effect of this could not be detected
within the STGM as these points did not lie within the range which was investigated (Figure 4.3.1).
However the first disassociation (pKa1) may have contributed to the steep rise that occurred at lower
pH (pH ≤ 3.2). Ultimately, the contribution of a phosphate-based buffer system would not be
relevant to the situation as (although phosphate may contribute to the DS with respect to enamel
mineral) it is unable to provide any meaningful buffering capacity within the range expected of a
cariogenic challenge [ten Cate et al., 2008].
4.4.2 Ionic Composition of the STGM
Although the STGM has previously been used to sustain the growth of oral biofilms [Bakht et al.,
2011; Hope et al., 2012; Owens et al., 2013; Valappil et al., 2013] and it is similar to those which
have been used to obtain a representative state of microbial growth [Hope and Wilson, 2003a;
Pratten et al., 1998a; Pratten et al., 2000], it contains significant quantities of relatively undefined
biological extracts which themselves are known to vary [Wong and Sissions, 2001]. It therefore
follows that the constitutes detected may not have been representative of each STGM batch that
was made. However, in the present study samples were collected from 6 separately produced
batches collected over several months. Therefore, the samples collected should reflect an expected
composition for each STGM batch. Nevertheless, the ions most relevant to enamel mineral were
able to be quantified.
The prior filtration of samples was necessary to remove high molecular weight components from the
samples as it was previously identified that large molecules with a propensity for aggregation may
block the capillary tubing or prevent the efficiency of the rinsing procedures. Further to this, the
various ingredients of the STGM provide many possible substrates for bacterial metabolism or AEP
formation which are not ionised within the medium or which are not captured within the migration
time used in the current separation procedure.
Wong and Sissons [2001] explored the idea of growing oral biofilms on chemically-defined and
relatively undefined medium. From these studies, a differential expression of bacterial enzymes was

Abiotic Considerations for Biological Caries Models | Ch. 4
91
detected between biofilms grown using either media. Therefore, variations in the composition of the
salivary substitute can induce a phenotypic change in the biofilm community [Wong and Sissions,
2001]. However, as with the work produced by Pratten et al. [2000], the STGM has been shown to
support a level of biofilm growth which exhibits sufficient similarities to dental plaque to justify their
use in predicting or modelling the progression of an ecologically-based disease such as dental caries.
Several unidentified peaks were identified during both anion (Figure 4.3.2) and cation (Figure 4.3.4)
separations. Unfortunately, it was not possible to determine the identity of these components.
However, possible sources can be suggested such as citrate, sulphite and carbonate as possible
anions and iron or zinc within cation separations. Although zwitterionic macromolecules such as
peptide fragments may have passed through the detection window it is unlikely that such well
resolved peaks would have been alluded by the current separation procedure. With the absence of
peptide fragments, separations of the aforementioned ions were attempted and it was found that
elucidation of each was possible within the current separation procedures (data not shown)
although analysis was abandoned due to the fact that a suitable stock solution could not be
formulated. As noted above, a strict control of carbonate was unfeasible within the CDFF model and
therefore the analysis of this analyte would have proven unworkable however citrate cab provide an
energy source for oral bacteria (such as Lactobacillus spp. and Streptococcus spp.) thereby
promoting growth [Drinan et al., 1976]. Furthermore, both zinc [Featherstone and Nelson, 1980;
Lynch, 2011] and iron [Alves et al., 2011; Featherstone and Nelson, 1980] have demonstrated a
measureable effect of enamel mineralisation with zinc possessing further antimicrobial properties
[Pratten et al., 2003a] and iron being invariably essential to cellular metabolism [Ilbert and
Bonnefoy, 2013]. As some amount of these elements is likely to be present within the STGM, an
exact quantification would have been desirable.
Natural human saliva is highly variable [Larsen et al., 1999] although it is generally accepted that the
fluid remains saturated with calcium phosphate salts at neutral pH [ten Cate, 2004], as the pH is
lowered this can however change [Larsen and Pearce, 2003]. The saturation of natural saliva is based
on the relative proportions of free mineral ions (relevant to enamel mineral) and in this respect
comparisons can be made to the STGM. Analysis of the data [Shellis, 1988] revealed that the STGM
was supersaturated with respect to fluorapatite (DS = 41.78), HA (DS = 11.24), OCP (DS = 1.99),
monetite (DS = 1.24) and TCP (DS = 2.83) but undersaturated with respect to brushite (DS = 0.78).
Assuming the establishment of an equilibrium with atmospheric CO2, the STGM would also support
the formation of CaCO3 (DS = 3.28). These values are similar to those which have been reported
previously for natural (unstimulated) saliva [Larsen and Pearce, 2003] in a qualitatively sense

Abiotic Considerations for Biological Caries Models | Ch. 4
92
although quantitatively, they were found to be greatly in excess. The concentration of calcium (2.93
mM ± 0.46SD) was much higher than the range expected for natural saliva (0.75 mM – 1.75 mM) and
phosphate was noticeably lower (1.44 mM ± 0.32SD in the STGM compared within 2.0 mM – 5.0 mM
in natural saliva) [ten Cate, 2004]. Potentiometric measurement of fluoride found it to be present
0.01 ppm ± 0.00SD however at the lowest end of the range found in natural saliva (0.01 ppm – 0.1
ppm) [ten Cate, 2004].
Figure 4.4.4 (Saturation with respect to Calcium Salts within the STGM): DS for some of the relevant mineral phases are given as calculated by the IPQ3 computer program with charge imbalance included in the ionic strength and accounting for an equilibrium of H2CO3 with atmospheric CO2 [Shellis, 1988].
The varying levels of calcium and phosphate would lead to dissimilar thermodynamic saturation
profiles as are observed for natural saliva [Larsen and Pearce, 2003]. Therefore, the driving force for
remineralisation would not only be much higher within a biological model employing the STGM but
the dynamics of phase transition would also behave differently. Within the STGM, chemical
alteration of the mineral and remineralisation are therefore highly favoured as the solution supports
the persistence of fluoride-containing mineral phases as low as pH 4 but would allow enamel
demineralisation above pH 5.9 (KSP obtained from Patel and Brown [1975] for human enamel).
Further to this, higher concentrations of calcium support CaF2 in the mineral phase which is not this
case for natural human saliva [Larsen and Ravnholt, 1994]. However, in a biofilm model, the
demineralising challenge would take place within the PF and this fluid may differ from the bulk
solution external to the biofilm [Margolis and Moreno, 1994].
0.01
0.51
1.01
1.51
2.01
2.51
3.01
3.51
4.01
3 3.5 4 4.5 5 5.5 6 6.5 7
Log 1
0D
S w
ith
in t
he
STG
M
pH
DSHA DSFluorapatite DSOCP DSBrushite DSCaF2

Abiotic Considerations for Biological Caries Models | Ch. 4
93
The relative proportions of ions present in the STGM may also alter the microbial populations in
ways which are, as yet, unforeseen. For example, oral streptococci are known to react to elevated
levels of calcium in their environment by producing membrane associated buffering systems [Rose
and Hogg, 1995] in order to ameliorate its effects on membrane integrity [Trombe et al., 1992]. It is
therefore conceivable that the ionic composition of the STGM may induce such a phenotypic change
and thus enhance its role in the production of caries through several aspects which are relevant to
the caries process. Initially, calcium bridging of gram positive early colonisers [Rose et al., 1994] may
either be enhanced due to presence of abundant cation bridging or binding sites may become
saturated and thus this attachment mechanism may be hindered. Gradual depletion of both
biological and mineral reservoirs [Pearce, 1998] could also be augmented by the DS of the STGM.
Unfortunately it is not possibly to accurately identify how a diverse microcosm biofilm community
would react to such environmental conditions. Measurements of the PF would have to be applied in
order to confirm the effects of the STGM on biofilm formation, growth and cariogenicity. The CDFF
model may be ineffective in producing enamel caries unless a physiological environment which
permits the dynamics of the caries process is provided. Ultimately, practical application of the model
is the only way to be certain.
4.5.0 Conclusions The STGM is dissimilar to natural saliva in both its buffering capacity and in its composition.
Although the STGM is not expected to be the medium in immediate contact with the enamel
surface, its composition may have some influence on the physiological conditions within plaque
biofilms which are produced. Specifically, as the buffering effected conferred of the STGM is much
lower than natural saliva it is expected to provide less of a resistance to changes in the pH of the
biofilm PF following a cariogenic challenge within the CDFF model. Further to this, the saturation of
the STGM with respect to relevant calcium salts supports the formation of mineral phases over
dissimilar periods of physiological pH. The behaviour of such phases within a model which employs
the STGM is therefore expected to be unique from what could be observed in situ.
However, a prerequisite of biological models is their ability to produced and support the growth of
orally relevant biofilms. The STGM has been shown to meet these requirements and therefore the
use of an alternative would require a degree of validation which is outside the scope of the present
work. STGM, as is, should therefore be employed although conclusions draw with respect to the
relationship to natural in vivo biofilms should be interpreted with caution. Whether or not enamel
caries lesions can be formed within CDFF remains in question and, in the light of the results of the
present work, it ability to support in vitro enamel lesions formation should be explored.
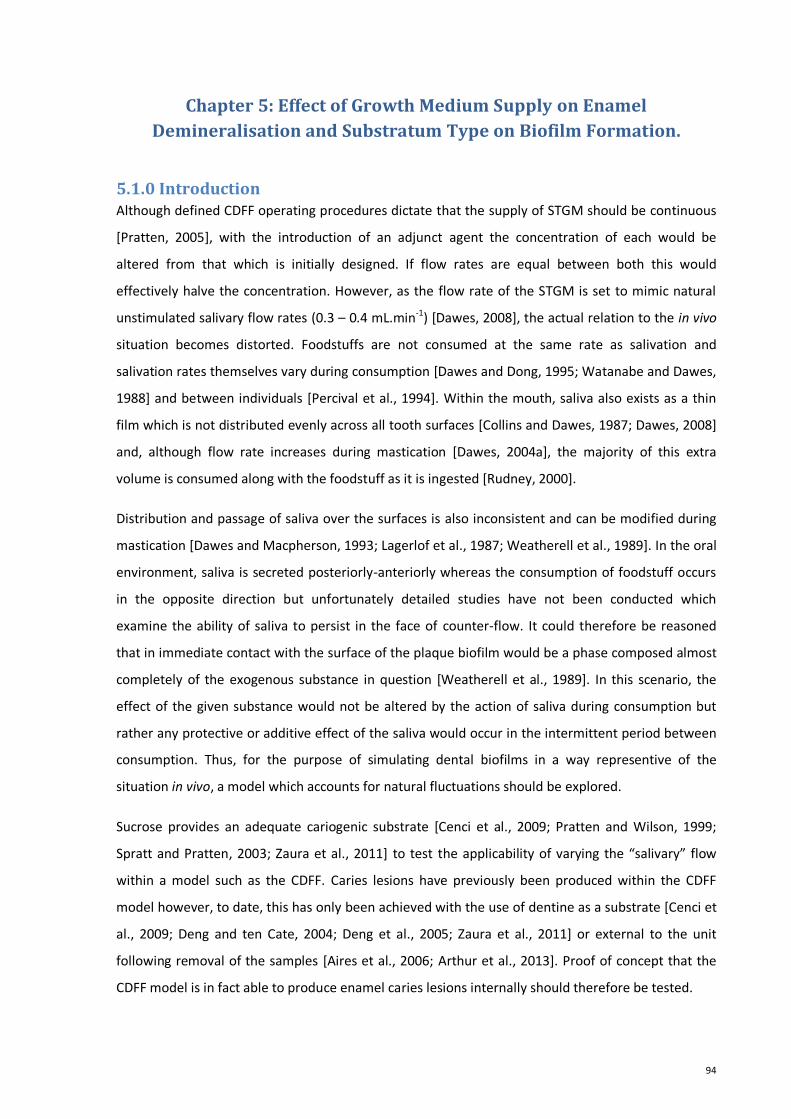
94
Chapter 5: Effect of Growth Medium Supply on Enamel
Demineralisation and Substratum Type on Biofilm Formation.
5.1.0 Introduction Although defined CDFF operating procedures dictate that the supply of STGM should be continuous
[Pratten, 2005], with the introduction of an adjunct agent the concentration of each would be
altered from that which is initially designed. If flow rates are equal between both this would
effectively halve the concentration. However, as the flow rate of the STGM is set to mimic natural
unstimulated salivary flow rates (0.3 – 0.4 mL.min-1) [Dawes, 2008], the actual relation to the in vivo
situation becomes distorted. Foodstuffs are not consumed at the same rate as salivation and
salivation rates themselves vary during consumption [Dawes and Dong, 1995; Watanabe and Dawes,
1988] and between individuals [Percival et al., 1994]. Within the mouth, saliva also exists as a thin
film which is not distributed evenly across all tooth surfaces [Collins and Dawes, 1987; Dawes, 2008]
and, although flow rate increases during mastication [Dawes, 2004a], the majority of this extra
volume is consumed along with the foodstuff as it is ingested [Rudney, 2000].
Distribution and passage of saliva over the surfaces is also inconsistent and can be modified during
mastication [Dawes and Macpherson, 1993; Lagerlof et al., 1987; Weatherell et al., 1989]. In the oral
environment, saliva is secreted posteriorly-anteriorly whereas the consumption of foodstuff occurs
in the opposite direction but unfortunately detailed studies have not been conducted which
examine the ability of saliva to persist in the face of counter-flow. It could therefore be reasoned
that in immediate contact with the surface of the plaque biofilm would be a phase composed almost
completely of the exogenous substance in question [Weatherell et al., 1989]. In this scenario, the
effect of the given substance would not be altered by the action of saliva during consumption but
rather any protective or additive effect of the saliva would occur in the intermittent period between
consumption. Thus, for the purpose of simulating dental biofilms in a way representive of the
situation in vivo, a model which accounts for natural fluctuations should be explored.
Sucrose provides an adequate cariogenic substrate [Cenci et al., 2009; Pratten and Wilson, 1999;
Spratt and Pratten, 2003; Zaura et al., 2011] to test the applicability of varying the “salivary” flow
within a model such as the CDFF. Caries lesions have previously been produced within the CDFF
model however, to date, this has only been achieved with the use of dentine as a substrate [Cenci et
al., 2009; Deng and ten Cate, 2004; Deng et al., 2005; Zaura et al., 2011] or external to the unit
following removal of the samples [Aires et al., 2006; Arthur et al., 2013]. Proof of concept that the
CDFF model is in fact able to produce enamel caries lesions internally should therefore be tested.

Effect of Growth Medium Supply and Substratum on In Vitro Enamel Demineralisation and Biofilm Formation | Ch. 5
95
The preparation involved in the manufacture of enamel sections is also extremely difficult. Due to
the hard tissues fragility, defects in the enamel are easily incurred [Lagerweij et al., 1996] and the
availability of high quality tissue itself can be relatively scarce [Mellberg, 1992]. For these reasons,
prefabrication of enamel into disks of an exact specification is required. However, this creates a cost
associated with their production and, consequently, adds to their value. As a result, hydroxyapatite
(HA) disks have been employed as an alternative to support microbial growth [Bradshaw et al., 1996;
Hope and Wilson, 2003b; Pratten et al., 1998a; Valappil et al., 2013]. HA is often used for the
purposes of studying dental enamel and the similarities between these substrates (with respect to
their physical nature and chemical composition) has led to the widely-accepted view of HA as an
acceptable analogue for dental enamel [Driessens, 1982]. With respect to events which preclude
biofilm formation, the HA mineral shares a similar electronegativity to enamel and therefore
possesses the potential to simulate the natural processes of pellicle formation and bacterial
colonisation. However, from a more precise point of view, HA and dental enamel also exhibit major
differences which could have an influence on biofilm formation.
5.1.1 Aims and Objectives
The study presented within this chapter aims to validate the use of HA as a substrate for biofilm
formation in direct comparison to bovine enamel. Creating true-caries lesions within the unit will
also be investigated whilst monitoring the effects of sucrose exposures on the microbial ecology
within the plaque biofilms which are produced and effectively determining whether or not the CDFF
is able to produced enamel caries lesions. In addition to this, a further objective will be to investigate
to what extent altering the supply of growth medium will impose on both biofilm formation and
enamel demineralisation which will be investigated with the use of the a dual constant depth film
fermenter (dCDFF) model [Hope et al., 2012]

Effect of Growth Medium Supply and Substratum on In Vitro Enamel Demineralisation and Biofilm Formation | Ch. 5
96
5.2.0 Materials and Methods
The in vitro effect of both growth medium supply and biofilm substratum were investigated in a dual
constant depth film fermenter (dCDFF) model [Hope et al., 2012] for their effect on biofilm growth
and, with respect to the former, enamel demineralisation. Pooled human saliva was used as a source
for the microbial inoculum [Dietz, 1943]. Both HA (Clarkson Chromatography Products Inc., South
Willaimsport, PA. USA) and bovine enamel (Modus Laboratories, University of Reading, Reading, UK)
disks were used as a substratum. Each CDFF unit was run under strict operating conditions which
consisted of a sucrose pulsing strategy described below and differed only with respect to their
growth medium supply during pulsing phases (Figure 5.2.2).
5.2.1 Inoculum Preparation
A human saliva pool was first created by collecting whole, unstimulated saliva samples from a
random subset of healthy volunteers enlisted from the University of Liverpool’s School of Dentistry
(n = 23, 23 ≤ age ≤ 54; Ethical Approval: University of Liverpool Research Governance Office,
Physical Interventions Sub-committee, RETH000377). Firstly, volunteers were asked to expectorate ≥
5 mL saliva into 20 mL Sterilin containers (Sterilin Ltd., Newport, UK). From each of these samples, 3
mL aliquots were extracted, pooled and homogenised by stirring for approximately 30 min with a
magnetic stirrer and sterile flea. An equal volume of sterile skim milk powder (Oxoid, Basingstoke,
UK) was then added to a final concentration of 10% w/v in order to act as a cryoprotectant during
storage [Cody et al., 2008]. The resultant mixture was then split into a number of 1.8 mL aliquots and
stored at -80°C until required. Each step of the preparation procedure was undertaken as quickly as
possible in order to avoid possible cytotoxicity resulting from the exposure of strict anaerobic
organisms to the ambient oxygenated environment. Sterile technique was also adopted, operating
under laminar air flow (P5H Cabinet equipped with HEPA filter; Bassaire Ltd., Southampton, UK)
whenever possible, to avoid contamination.
5.2.2 CDFF design and dCDFF Set-Up
The dCDFF model described previously [Hope et al., 2012] was adapted for the purposes of this
experiment. With regard to these works, two identical CDFF units were commissioned (J. Abbott,
West Kirby, Merseyside, UK) to fit side-by-side within a standard laboratory incubator (IP250-U; LTE
Scientific Ltd., Oldham, UK). Each unit was able to hold a maximum of 8 polytetrafluoroethylene
(PTFE) sample pans which, in turn, were each able to hold 5 substratum disks 5 mm in diameter.
Each disk sat atop a PTFE plug allowing for alteration of the substratum depth by providing a
resistance to stop the substratum from falling too deep within the recess of the pan. Variable depth
was achieved by applying pressure to the plug thus altering the depth of the recessed area (Figure

Effect of Growth Medium Supply and Substratum on In Vitro Enamel Demineralisation and Biofilm Formation | Ch. 5
97
5.2.1). The area between the substratum and the external environment allowed for biofilm growth
and was ensured by a scraper blade which passed immediately adjacent to the surface of the pan at
a speed of 3 rpm; this action effectively limited growth within a finite area. All sampling was
performed following the removal of whole pans using custom-made instruments and was performed
under aseptic technique.
Figure 5.2.1 (Cross-Sectional View of a Single PTFE Sample Pan): a) whole view of a single PTFE sample pan; b) cross-sectional view of a PFTE sample pan showing 5 mm HA disks as they would be supported by PTFE plugs. On the left of “b” the HA disk and the PTFE plug are separated to show their distinction and on the right, the HA disk rest direction on top of PTFE plug. The resistance of the plug within the sample pan provide support for the HA (or enamel) disk and allows the disk to be recessed to any given depth within the range of the pan.
5.2.2.1 Sterilisation Procedures
Before assembly, all liquid volumes, silicone tubings, PTFE pans designated to contain enamel and
sampling instruments were sterilised by autoclaving at 121 °C and 2200 mBar for 15 min; the only
exception to this practice were sucrose-containing liquid volumes which were autoclaved at a lower
temperature and pressure of 116°C and 1900 mBar respectively; This was so as to avoid any
degradation of the dissolved sugars. All autoclave sterilisations were performed within a Touchclave-
Lab K200s (LTE Scientific Ltd., Oldham, UK) ran on a super-atmospheric sterilisation cycle with the
exception of enamel disks were sterilised separately by gamma irradiation for 18h at 4,000Gy
(Gammacell 1000; Field Emission, Newbury, UK) as this was considered to most appropriate
sterilisation conditions [Amaechi et al., 1999].
HA disks were placed directly into PTFE pans, recessed to a chosen depth of exactly 200µm and pans
inserted into available spaces of the CDFF turntable. The entire CDFF unit was then sterilised at
140°C for 4h in a Memmert UFB500 universal fan oven (Memmert GmbH., Heilbronn, Germany).
Once the units had cooled, enamel disks were inserted into previously sterilised pans and recessed
to the same depth as the HA disks. These pans were then inserted into the CDFF units thought the
sampling port. Due to a high risk of environmental contamination, the insertion of enamel disks and
enamel-containing PTFE pans was performed with fully sterilised instruments and under laminar air
flow (Bassaire P5HCabinet; Bassaire Ltd., Southampton, UK).

Effect of Growth Medium Supply and Substratum on In Vitro Enamel Demineralisation and Biofilm Formation | Ch. 5
98
5.2.2.2 Schematic Design
As illustrated in Figure 5.2.3, an inoculation flask was prepared to contain 1 L of sterile STGM
(composition given in Table 4.2.1) with a magnetic flea added before autoclave. Once cooled, the
inoculum flask was then located in an incubator at 37°C (IP250-U; LTE Scientific Ltd., Oldham, UK)
and allowed to equilibrate for approximately 2 h before a single 1.8 mL aliquot of the saliva pool was
thawed and added. The apparatus was then fully assembled as quickly as possible using 70% ethanol
(Sigma-Aldrich Ltd., Poole, UK) with 0.5 % H2O2 (Sigma-Aldrich Ltd., Poole, UK) as a secondary
precaution to ensure the sterility of contamination prone surfaces.
Peristaltic pumps (101U/R Low Flow Peristaltic Pump; Watson Marlow, Falmouth, UK) were used to
draw the inoculum though the tubing and into each CDFF at a flow rate of 0.5 mL.min-1. The
inoculum was exhausted after approximately 15h at which point a separate 10L supply of sterile
STGM was introduced to each CDFF by the same means although at a lower flow rate (0.38 mL.min-
1). This secondary STGM supply was also isolated from each CDFF unit by the use of a grow-back
trap. At this point, a 2 L volume of 50mM sucrose (Sigma-Aldrich Ltd., Poole, United Kingdom)
solution was connected to each CDFF also isolated by grow-back traps. However, the sucrose
solution was not fed in the same manner as the STGM.
5.2.2.3 Sucrose and STGM Pulsing Strategies
Sucrose was introduced to each CDFF by a modification of a previously established pulsing pattern
developed from a protocol initially described by Deng et al. [2004]. In both Unit A and Unit B the
sucrose solution was pulsed in 8 times over 16 h of a 24 h cycle for 15 min (0.38 mL.min-1). However
in Unit A, the STGM supply remained constant (CF; Continuous Flow) whereas in Unit B the STGM
was stopped (FF; Feast-Famine) during each sucrose pulse (Figure 5.2.2).
Figure 5.2.2 (Pulsing Strategy for Feast-Famine vs. Continuous-Flow Strategies): Both dCDFF units (A and B) were subject to a sucrose (50 mM) pulsing strategy which continued over a period of 24 h. Green bars represent the flow of STGM at a rate of 0.38 ml.min
-1. Breaks in
the green bars indicate the cessation of the STGM flow. Red bars represent the flow of a 50 mM sucrose solution.

Effect of Growth Medium Supply and Substratum on In Vitro Enamel Demineralisation and Biofilm Formation | Ch. 5
99
The continued control of these pulsing strategies was achieved by the use of digitally controlled
socket timers (Draper Tools Ltd., Hampshire, UK) set to switch the corresponding pumps on and off
at the appropriate times. The cycle continued for a period of 16 d following the point at which the
inoculum was exhausted and was only paused briefly (< 1 min) on sample days as PTFE plans were
extracted. The flow rate of sucrose exposures was kept in-line with that of the STGM as frequent
exposures to high flow rates lead to disturbance of the biofilms during formation.
5.2.3 Biofilm Sampling and Substratum Extraction
The point where the inoculum had depleted completely, and thus the sucrose pulsing strategy
started, was considered as the beginning of the CDFF experiment. Due to the constraints of the 8-
pan CDFF unit, sampling was limited to 4 points for each internal condition (HA versus enamel).
Therefore, CDFF units were sampled for both HA and enamel (2 sample pans extracted) on days 2, 4,
8 and 16. The specific sample pan arrangement was ordered alternating between pans holding
enamel and HA respectively. Within the cycle, sampling occurred immediately after the 4th sucrose
pulse (2:00 PM) on the chosen day.
The sampling procedure was conducted as follows. The unit to be sampled was stopped such that
the pan to be sampled lay in an accessible area beneath the sample port; during this time, motors
were switched off as were all supply pumps. Using a fresh pair of nitrile laboratory gloves (Appleton
Woods Ltd., Birmingham, UK), one 20 mL Sterilin (Sterilin Ltd., Newport, UK) was then taken, the lid
loosened and the vessel placed inside the incubator in close proximity to the sample port. Both
gloves and the sample port were then sprayed with 70% ethanol 0.5% H2O2 solution, the port quickly
opened and the sampling instrument removed from its sterilisation pouch (UnoDent Ltd., Essex, UK).
The instrument was then used to extract the relevant pan from its place in the turntable. Using one
hand the Sterilin lid was then removed, the PTFE pan placed carefully inside, released from the
sampling instrument, the instrument removed and the Sterilin lid replaced. This process was
repeated for each pan on each sampling occasion.
5.2.4 Recovery and Enumeration of Oral Bacteria
Following sample pan extractions, all work was performed within a 30 cm radius of a blue Bunsen
Burner’s flame. Three of each of the disks supporting biofilms (HA or enamel) were carefully
removed and individually placed into a sterile 5mL Bijou (Sterilin Ltd., Newport, UK) containing 3mL
PBS solution (Sigma-Aldrich, Poole, UK) and 3 sterile glass beads (3.5 - 4.5 mm diameter; BDH-Merk
Ltd., Poole, UK). The lid was then securely fastened and the Bijou vortex mixed for 30 sec in order to
disperse the biofilms. From this dispersal, serial 10-fold dilutions were made up to a dilution of x10-6
in PBS solution (Sigma-Aldrich Ltd., Poole, UK). Each disk formed a separate dilution line providing
results per sample pan in triplicate.

Effect of Growth Medium Supply and Substratum on In Vitro Enamel Demineralisation and Biofilm Formation | Ch. 5
100
Twenty-five µl volumes of these dilutions were then spread onto a range of selective and non-
selective solid growth media. Initially, all dilutions were spread however in later stages it became
possible to pre-empt the number of colony forming units (CFUs) and therefore, in the interest of
conserving resources, only those dilutions which were deemed appropriate were used. This required
discretion during the decision making process. The community members chosen for identification
were as follows: fastidious anaerobes (FA; Section 5.2.4.1), mutans streptococci (MS; Section
5.2.4.2), Streptococcus spp. (Section 5.2.4.3), Lactobacillus spp. (Section 5.2.4.4) and Veillonella spp.
(Section 5.2.4.5). Further to this, 25 µL volumes were also extracted from the salivary inoculum
which was used to create the primary culture within the inoculum flask (Section 5.2.1). These
aliquots were sampled for FA (n = 6) and Streptococcus spp. (n = 6) as described above. Further to
this, gram stains were performed on samples of the inoculum which were extracted using a sterile
loop and on individual CFUs grown on following incubation. The results were captured using a Nikon
imaging system (Nikon Digital Sight DS-Fi2; Nikon UK Ltd., Surrey, UK) equipped with a standard
optical microscope capable of x300 magnification (Nikon Eclipse E200; Nikon UK Ltd., Surrey, UK).
Following incubation of the inoculated media, counts were made on an automatic plate counter
(Stuart SC6 Colony Counter; Bibby Scientific Ltd., Staffordshire, UK) in a typical range of 100 ≤ CFU ≤
300 if CFU counts within this range were possible. In the event that CFU counts were above or below
the target range, the plate which held the number closest to the ideal was used and this fact noted.
These numbers were first multiplied by the dilution factor with which the plate was spread in order
to obtain a value for CFU counts in the initial 3mL dispersal and expressed by unit area (mm-2) of the
surface supporting biofilm growth (19.635mm2). In contrast, results for the characterisation of the
pooled salivary inoculum were expressed by unit volume of the primary inoculum (mm-3). Statistical
analysis of the data was performed following Log10-trasformation as described in Section 2.2.4.
5.2.4.1 Fastidious Anaerobes
Viable counts of fastidious anaerobes were obtained on commercially available fastidious anaerobic
agar (FAA; Bioconnections, Leeds, UK) supplemented with 5% v/v defibrinated horse blood (TCS
Biosciences, Botolph Claydon, UK). FAA was produced according to instructions provided by the
manufacturer and poured under laminar air flow (BassAire P5H cabinet; BassAire Ltd., Southampton,
UK). Once set, plates were spread with appropriate dilutions as described above and the culture
incubated for 48h at 37°C within a temperature regulated anaerobic chamber (Whitley MG1000
Anaerobic Workstation; Don Whitley Scientific Ltd., West Yorkshire, UK) operating at 80% N2, 10% H2
and 10% CO2. All visible colonies were counted as individual CFUs and observations were made on
the various morphologies which were seen. In particular, the presence of black-pigmented
anaerobes along with any haemolysis if visually apparent (although observations and counts were

Effect of Growth Medium Supply and Substratum on In Vitro Enamel Demineralisation and Biofilm Formation | Ch. 5
101
made a 48 h, for the purposed of identifying black pigmented anaerobes, FAA media were incubated
for a further 48 h in order to confirm the presence or absence of these bacteria within the samples).
5.2.4.2 Mutans Streptococci
Members of the mutans-group streptococci were cultured on a modified TYC medium [van
Palenstein Helderman et al., 1983]. Dehydrated TYC (Lab M Ltd., Lancashire, UK) was prepared
according to the manufacturer’s guidelines but with a base of 150 mg.L-1 sterile sucrose in place of
dH2O. The sucrose base was made up from dH2O and contrary to the manufacturer’s guide the
mixture was sterilised by autoclaving at 116°C and 1900 mBar for 15 min; this modification was
made in order to avoid degradation of the sugars. The agar was then allowed to cool to 48°C before
3.5mg.L-1of Bacitracin (50KU from Bacillus licheniformis; Sigma-Aldrich, Poole, UK) solution was
added via filter sterilisation using a 0.2 µm disposable syringe filter(Minisart; Sigma-Aldrich, Poole,
UK). The resulting media was thereafter termed TYCSB. As above, plates were poured under sterile
air flow and once set, spread with appropriate volumes of microbial suspensions and incubated
anaerobically for 48h at 37°C. Colonies were identified as mutans-group on the basis of their colony
morphology (generally white-grey or cream-yellow in colour and sometimes surrounded by a fine
white edge however regular in their slight convexity and entire edge) and their ability to grow on the
TYCSB media.
5.2.4.3 Streptococcus Species
Viable counts for Streptococcus spp. were obtained on MSA (BD Difco Co., Sparks, MD, USA)
supplemented with 1mL of 1% w/v potassium tellurite solution (Sigma-Aldrich, Poole, UK). Media
was prepared following guidelines provided by the manufacturer. As above, all plates were poured
under sterile air flow and once set, spread with appropriate volumes and incubated for 48h at 37°C
under anaerobic conditions. CFUs were determined as streptococci on the basis of their ability to
grown on the MSA medium and their colony morphology: blue or dark blue “gum-drop” colonies,
enterococci exhibited smaller colonies with a much darker colour and a shine to their appearance.
5.2.4.4 Lactobacillus Species
Lactobacillus spp. were identified on Rogosa agar (Oxoid, Basingstoke, UK). Plates were prepared as
per the instructions of the manufacturer but with minor amendment to the procedure. Dried Rogosa
agar powder (82 g) was added to 1 L of near-boiling dH2O and stirred on a heated magnetic stirrer
with flea until boiling. The cap of the laboratory bottle (Duran Group GmbH., Wertheim, Germany)
was then loosely replaced on the container and the molten agar allowed to simmer for a further 5
min before being transferred under sterile air flow. 1.32 mL glacial acetic acid (Sigma-Aldrich Ltd.,
Poole, UK) was then added, the container’s lid sealed tightly and stirred with the heating element of
the magnetic stirrer switched off for a further 2 min before being poured when at approximately

Effect of Growth Medium Supply and Substratum on In Vitro Enamel Demineralisation and Biofilm Formation | Ch. 5
102
60°C under sterile air flow. Once set, plates were spread and incubated anaerobically at 37°C for
48h. Colonies appeared white, regular and approximately 2mm in diameter depending on the
degree of colony crowding.
5.2.4.5 Veillonella Species
Veillonella isolates were recovered on a medium which preferentially favoured the growth of species
within this genus (BV Agar). The specific protocol used to create this agar was formed from personal
communications between Prof. David Beighton (Department of Microbiology, Kings College London
Dental Institute, UK) and the University of Liverpool (Liverpool, UK). A base consisting of 15g bacto
agar (Oxoid, Basingstoke, UK), 5g bacto peptone (Oxoid, Basingstoke, UK), 5g yeast extract (Oxoid,
Basingstoke, UK), 0.75g sodium thioglycollate (Sigma-Aldrich Ltd., Poole, UK), 2mg basic fuchsin
(Sigma-Aldrich Ltd., Poole, UK) was weighed out and made up to a volume of 500mL with dH2O.
Twenty-one mL of 60% Sodium Lactate (Sigma-Aldrich Ltd., Poole, UK) was then added and the
volume brought up to 1L with further dH2O. When necessary, the pH was adjusted to 7.5 with 1M
NaOH (Sigma-Aldrich Ltd., Poole, UK) before autoclaving at 121°C for 900 sec. Once cooled to
approximately 48°C, 7.5mg vancomycin (Sigma-Aldrich Ltd., Poole, UK) was added via filter
sterilisation using a 0.2 µm disposable syringe filter (Minisart; Sigma-Aldrich Ltd., Poole, UK).Plates
were then poured under laminar air flow and, once set, microbial suspensions spread and incubated
as above although for a longer period of 72h. CFUs were identified as veillonella on the basis of their
ability to grow on this medium and their phenotypic appearance: typically ≥ 2mm in diameter, raised
and with an entire edge [Rogosa, 1956].
5.2.5 TMR Experimental Specifics
TMR was performed on all enamel disks used during the course of this experiment after the 5th
sucrose pulse of the day (4:00 PM). Once the disks had been vortex mixed, the surfaces were rinsed
with dH2O and stored in 1ml Eppendorf tubes (Eppendorf UK Ltd., Stevenage, UK) along with a
cotton pellet moistened with 0.1 % w/v thymol solution (BDH Laboratory Supplies, Poole, UK). Apart
from this rinsing stage prior to storage, all TMR procedures were performed as described in Section
2.2.3. Three enamel disks (those from each sample point) were sectioned into 4 to 5 thin sections
(approximately 1.2 mm thick at an angle transverse to the enamel surface) and randomised within
each sample. Four images were captured equidistant along the length of each prepared (80 µm) thin
section using TMR 2000 (Version 2.0.27.16) and at a magnification of x10/0.22. Images were
subsequently analysed using TMR 2006 (Version 3.0.0.13). Statistical analysis of the data was
performed as described in Section 2.2.4.
Effect of Growth Medium Supply and Substratum on In Vitro Enamel Demineralisation and Biofilm Formation | Ch. 5
103
Figure 5.2.3 (dCDFF Schematic Set-Up) a: Sterile Saliva-Type Growth Medium
(STGM); b: Sterile 50 mM Sucrose Solution; c: Peristaltic Pump 0.38 mL min-1
; d:
Peristaltic Pump 0.38 mL min-1
(CF); e: Peristaltic Pump 0.38 mL min-1
; f: Grow-
Back Trap; g: Peristaltic Pump 0.5 mL min-1
; h: Inoculum Flask with Magnetic
Stirrer; i: CDFF Unit A; j: CDFF Unit B; k: Effluent; *: 0.3µm Air Filter. Note that “d”
was responsible for the STGM supply to Unit A and therefore this pump
functioned continuously whereas “e” functioned only at times when “c” pumps
were inactive as this pump supplied the STGM to Unit B. Pump “c” was active for
15 min every 2 h eight times a day over a 16 h period of a 24h cycle.

Effect of Growth Medium Supply and Substratum on In Vitro Enamel Demineralisation and Biofilm Formation | Ch. 5
104
5.3.0 Results The initial assessment of the pooled salivary inoculum (following the freezing and thawing process)
showed that the fraction was composed of 8.44 ± 0.26SD Log10CFUmm-3 with respect to FA. Selective
culture of Streptococcus spp. revealed the inoculum to consist of 7.88 ± 0.27SD Log10CFU.mm-3.
Analysis of the gram stains supported these results where the vast majority of microbes consisted of
gram-positive cocci although some evidence of bacilli and gram negative species was also found.
Lactobacillus spp. were undetectable by the selective culture methods which were used as were
Veillonella ssp. and MS.
5.3.1 Enumeration of Biofilm Bacteria
Viable counts of fastidious anaerobes (FA) are presented by condition (CF and FF) and sample day in
Figure 5.3.1. In both conditions counts followed an extremely similar trend when compared by the
substratum on which the biofilms were grown (HA or enamel). The similarities in these trends were
confirmed statistically where no significant difference was detected between the vast majority of
viable counts taken from biofilms grown on either HA or enamel (P ≥ 0.053) at like sample points.
The only expectation to this was found for biofilms grown in the FF condition on sample day 4 where
the difference in counts between the 2 substrata was determined as significant (P = 0.002).
Lactobacillus spp. (Figure 5.3.2) demonstrated a clearer trend in the viable counts than was observed
for FA. A sharp increase in CFU can be seen between days 2 and 4 and this reached a maximum by
day 8 however a decline in CFU is evident in all conditions by day 16. In-line with these initial
observations, biofilm enrichment trends were reflected in the HA vs. enamel comparisons and
statistically no significant difference could be detected between any of the substratum conditions
within each dCDFF unit (P ≥ 0.165) when like sample point where compared. There was, however, a
single exception to this when the final sample day (day 16) was compared by substratum in the CF
condition. In this instance a significant difference was determined (P = 0.002).
Streptococcus spp. (Figure 5.3.3), however, did not show the same level of clarity that was seen in
the trends for Lactobacillus spp. (Figure 5.3.2). Again an increase in viable counts was visible
between days 2 and 4 but at all sample points between day 4 and day 16 the differences were not
immediately discernible. Although, like both FA and Lactobacillus spp. the choice of either HA or
enamel as a biofilm substratum was not determined to have any effect on the counts made (P ≥
0.104) in the majority of comparisons. As with the other groups examined thus far, there were
exceptions to this concordance. These exceptions occurred specifically, at days 8 and 4 in the CF and
FF conditions respectively (P ≤ 0.026).
Effect of Growth Medium Supply and Substratum on In Vitro Enamel Demineralisation and Biofilm Formation | Ch. 5
105
In contrast to the Streptococcus spp., trends in MS group were very well defined (Figure 5.3.4).
Between HA or enamel substrata no difference could be determined in any instance (P ≥ 0.66).
Again, an increase was first seen between days 2 and 4 (irrespective of the CF or FF flow-cycle
conditions). However between days 4 and 8 viable counts had diverged markedly, counts continued
to increase in the FF condition but decreased in the CF condition. By day 16, counts taken from both
conditions and on either substratum had reached similar values. Veillonella spp. (Figure 5.3.5) also
showed an extremely strong similarity between counts taken from HA or enamel disks (P ≥ 0.102).
Only one single exception was noted on sample day 4 in the FF condition (P = 0.021). Moreover, the
similarities between HA and enamel samples is highlighted best for Veillonella spp. due to the large
differences between the FF and CF conditions.
Comparing results without discriminating on the basis of substratum, significant differences between
biofilms grown in the CF and FF conditions for FA (P ≤ 0.014). On sample days 2, 4, and 16, viable
counts were higher in biofilms taken from the CF condition however on day 8 the opposite of this
trend occurred with respect to FA; viable counts were higher in the FF condition. The delineation of
these 2 conditions therefore allows greater comparison of the 2 conditions. In this respect, CFU
counts were initially lower in the FF condition an in the CF condition CFU counts increased sharply by
sample day 4, however at this stage it appeared that the increase in FA viable counts had ended. In
the FF condition the increase in viable counts was seen to continue between day 2 and 8. Following a
maximum on the 8th sample day, FA as measured by viable counts then decreased to a point which
was comparable with the CF condition. Statistically, the respective growth trends can be qualified by
a significant difference in both groups between days 4 and 8 (P ≤ 0.001) a fact with was true
between days 8 and 16 for the FF condition (P < 0.001) but not for CF condition (P = 0.684).
For Lactobacillus spp., significant differences were again found between conditions on each sample
day (P ≤ 0.003) with the exception of on day 4 (P = 0.070) where counts were lower in the FF
condition. However, both the shape of the growth curves and the absolute magnitude of viable
counts (Log10CFU.mm-2) were extremely similar between both CF and FF conditions (Figure 5.3.2).
Simple transpositions of the data sets from FF and CF conditions would be able to impose these
curves over each other without any distortion.
When combined irrespective of substratum, Streptococcus spp. showed no significant difference (P =
0.370) on sample day 2. However by day 4 onwards a divergence was found between FF and CF
conditions (P ≤ 0.005). CFU counts were higher in CF conditions on days 4 and 16 but on day 8 counts
were lower in the CF than in the FF condition. In both dCDFF conditions the number of viable
Streptococcus spp. looked to have achieved a maximum over the 16 day period of the experiment.

Effect of Growth Medium Supply and Substratum on In Vitro Enamel Demineralisation and Biofilm Formation | Ch. 5
106
Figure 5.3.1 (Fastidious Anaerobes; FA): Sample sets were taken from both HA and enamel substrata and are illustrated as separate series and in combine format. Error bars represent the SD of each sample set and an asterisk (*) indicates a significant difference (P < 0.050) and a double asterisk (**) indicates a highly significant difference (P < 0.001) between dCDFF conditions.
Figure 5.3.2 (Lactobacillus spp.): Sample sets were taken from both HA and enamel substrata and are illustrated as separate series and in combine format. Error bars represent the SD of each sample set and an asterisk (*) indicates a significant difference (P < 0.050) and a double asterisk (**) indicates a highly significant difference (P < 0.001) between dCDFF conditions.
**
** *
*
7.3
7.8
8.3
8.8
9.3
9.8
10.3
0 2 4 6 8 10 12 14 16 18
Fast
idio
us
An
aero
be
s (F
A;
Log1
0C
FU.m
m-2
)
HA Biofilm CF HA Biofilm FF Enamel Biofilm CF
Enamel Biofilm FF HA and Enamel CF HA and Enamel FF
**
*
**
2.8
3.3
3.8
4.3
4.8
5.3
5.8
6.3
6.8
7.3
0 2 4 6 8 10 12 14 16 18
Lact
ob
acill
us
spp
. (Lo
g10
CFU
.mm
-2)
HA Biofilm CF HA Biofilm FF Enamel Biofilm CF
Enamel Biofilm FF HA and Enamel CF HA and Enamel FF

Effect of Growth Medium Supply and Substratum on In Vitro Enamel Demineralisation and Biofilm Formation | Ch. 5
107
Figure 5.3.3 (Streptococcus spp.): Sample sets were taken from both HA and enamel substrata and are illustrated as separate series and in combine format. Error bars represent the SD of each sample set and an asterisk (*) indicates a significant difference (P < 0.050) between dCDFF conditions.
Figure 5.3.4 (Mutans streptococci; MS): Sample sets were taken from both HA and enamel substrata and are illustrated as separate series and in combine format. Error bars represent the SD of each sample set and an asterisk (*) indicates a significant difference (P < 0.050) and a double asterisk (**) indicates a highly significant difference (P < 0.001) between dCDFF conditions.
*
*
*
5.50
6.00
6.50
7.00
7.50
8.00
8.50
0 2 4 6 8 10 12 14 16 18
Stre
pto
cocc
us
Spe
cie
s (L
og1
0C
FU.m
m-2
)
Sample Day
HA Biofilm CF HA Biofilm FF Enamel Biofilm CF
Enamel Biofilm FF HA and Enamel CF HA and Enamel FF
**
**
**
**
3.50
4.00
4.50
5.00
5.50
6.00
6.50
7.00
7.50
8.00
8.50
0 2 4 6 8 10 12 14 16 18
Mu
tan
s st
rep
toco
cci (
MS;
Lo
g10
CFU
.mm
-2)
HA Biofilm CF HA Biofilm FF Enamel Biofilm CF
Enamel Biofilm FF HA and Enamel CF HA and Enamel FF

Effect of Growth Medium Supply and Substratum on In Vitro Enamel Demineralisation and Biofilm Formation | Ch. 5
108
Trends in MS growth were similar between both dCDFF conditions with only the exception being on
day 8 (Figure 5.3.4). In the FF condition viable counts peaked on the 8th day then immediately
entered a decline whereas in the CF condition, counts peaked by the 4th day then remained relatively
stable between days 8 and 16. No steady-state was noted for the FF condition with respect to MS.
Therefore, unique growth trends were found between the CF and FF conditions although similarities
were also apparent. With the exception of counts taken on sample day 8, both conditions exhibited
a sharp increase in growth which terminated at similar values (on average, within a single Log10 unit).
Figure 5.3.5 (Veillonella spp.): Sample sets were taken from both HA and enamel substrata and are illustrated as separate series and in combine format. Error bars represent the SD of each sample set and an asterisk (*) indicates a significant difference (P < 0.050) and a double asterisk (**) indicates a highly significant difference (P < 0.001) between dCDFF conditions.
Veillonella spp. initially showed markedly different growth trends (Figure 5.3.5). As with findings for
FA, lactobacilli spp. and MS, between dCDFF conditions CFU counts were significantly different on
each sample day (P ≤ 0.004). Both conditions a dramatic increase in viable counts between days 2
and 8 however the maximum proportion of Veillonella spp. was greater (approximately 1-Log10 unit)
in the CF condition. Furthermore, biofilms which were produced within the CF condition experienced
a decrease in viable counts between day 8 and 16. Between these sample points, biofilms in the FF
condition remained stable with respect to the numbers of viable Veillonella spp. As Veillonella spp.
growth peaked higher in the CF condition, it would therefore be suggested that the habitat which
was afforded by the biofilms in the CF condition was more amenable to the growth of Veillonella
spp. than that which was created within the CF condition.
*
**
**
*
1.70
2.20
2.70
3.20
3.70
4.20
4.70
5.20
5.70
6.20
6.70
0 2 4 6 8 10 12 14 16 18
Ve
illo
ne
lla S
pp
. (Lo
g10
CFU
.mm
-2)
Sample Day
HA Biofilm CF HA Biofilm FF Enamel Biofilm CF
Enamel Biofilm FF HA and Enamel CF HA and Enamel FF

Effect of Growth Medium Supply and Substratum on In Vitro Enamel Demineralisation and Biofilm Formation | Ch. 5
109
5.3.2 Transverse Micro-Radiography
Out of the 12 enamel disks included in each dCDFF unit (FF and CF conditions), 4 thin sections were
initially cut. Between 2 and 4 thin sections were retained from each of the 3 enamel disks which
were removed on each sampling occasion. From these sections the parameters of ΔZ, LD, R and SMax
were generated and are listed below in Table 5.3.1 in-line with each sample day and condition.
Condition Sample Day n (Enamel Disks) ΔZ ± SD LD ± SD R ± SD SMax ± SD
CF 2 3 282.23 ± 43.89 14.10 ± 2.02 19.70 ± 0.68 62.96 ± 2.88
FF 2 3 124.57 ± 45.75 7.96 ± 3.18 15.59 ± 1.32 71.39 ± 5.43
CF 4 3 483.75 ± 67.10 23.21 ± 3.40 21.14 ± 1.48 62.14 ± 2.97
FF 4 3 988.81 ± 138.22 34.92 ± 4.35 28.62 ± 1.48 51.42 ± 7.57
CF 8 3 1483.47 ± 1004.4 46.31 ± 21.96 28.14 ± 6.73 54.02 ± 5.37
FF 8 3 1602.00 ± 212.93 54.60 ± 5.37 28.20 ± 1.79 60.24 ± 6.24
CF 16 3 802.21 ± 91.40 38.86 ± 2.43 20.31 ± 3.39 62.99 ± 4.74
FF 16 3 2359.86 ± 291.96 63.12 ± 4.90 37.09 ± 2.87 50.63 ± 5.22
Table 5.3.1 (TMR Parameters): Parameters of integrated mineral loss (ΔZ), lesion depth (LD), average mineral loss (R) and SL mineralisation (SMax) listed along with the number of thin sections analysed (N) and the number of TMR images captured (n).
Mean scan profiles were also extracted for each of the enamel sections sampled. These are
illustrated for samples taken from the CF and FF conditions in Figure 5.3.7 and 5.3.8 respectively.
From these visualisations the first point which is apparent is that samples removed on day 2 did not
show any clear evidence of caries lesions in either condition. A degree of mineral loss is visible
however this was more akin to surface softening or the error of the radiographic process as opposed
to carious lesion formation. However, by day 4, the beginnings of a caries-type lesion profile was
evident in the samples taken from the CF condition albeit with an ill-defined SL. On the other hand,
in the FF condition a well-defined SL had developed and in enamel sections taken from this
condition, this trend continued. With time the caries lesion profile become more defined within the
mineral and, on average, the degree of mineralisation in the SL increased as did LD and bulk mineral
loss within the lesions themselves (ΔZ). However, this definition of character could not be applied to
lesions which were created in the CF group. As noted at day 2, the development of an SL was not
seen over the course of the experiment. A direct relationship was also missing when examining LD
and ΔZ from the scan profiles in Figure 5.3.7. The exception to an increase over time, as seen in
lesion taken from the FF group (Figure 5.3.8), were the results obtained on day 8 and 16. Both LD
and ΔZ were lower in samples removed on day 16 than in those removed on day 8. Further to this,
an erratic mean scan profile was generated from samples taken at day 8 with relatively large
confidence intervals across the length of the lesions (0 to 100 µm; Figure 5.3.7).

Effect of Growth Medium Supply and Substratum on In Vitro Enamel Demineralisation and Biofilm Formation | Ch. 5
110
Figure 5.3.7 (TMR Scan Profiles for Lesions Created under a Continuous Flow of STGM): Mineral volume (%Vol) is expressed relative to a sound enamel patch and normalised within each individual measurement. Error bars represent the sample SD. Individual mineral volume measurements are made at depth increments of 5 µm from the enamel surface (20%Vol). In the “Cont-Flow / Day 2”, “Cont-Flow / Day 4”, “Cont-Flow / Day 8” and “Cont-Flow / Day 16” conditions n = 27, n = 44, n = 37 and n = 37 respectively.
Figure 5.3.8 (TMR Scan Profiles for Lesions Created under a Fast-Famine Flow of STGM): Mineral volume (%Vol) are expressed relative to a sound enamel patch and normalised within each individual measurement. Error bars represent the sample SD. Individual mineral volume measurements are made at depth increments of 5 µm from the enamel surface (20%Vol). In the “Fast-Famine / Day 2”, “Fast-Famine / Day 4”, “Fast-Famine / Day 8” and “Fast-Famine / Day 16” conditions n = 34, n = 32, n = 26 and n = 26 respectively.
25
35
45
55
65
75
85
95
0 20 40 60 80 100 120 140 160 180 200
Min
era
l Vo
lum
e (
%V
ol)
Depth from the Enamel Surface (µm)
Cont-Flow / Day 2 Cont-Flow / Day 4 Cont-Flow / Day 8 Cont-Flow / Day 16
25
35
45
55
65
75
85
95
0 20 40 60 80 100 120 140 160 180 200
Min
era
l Vo
lum
e (
%V
ol)
Depth from the Enamel Surface (µm)
Fast-Famine / Day 2 Fast-Famine / Day 4 Feast-Famine / Day 8 Feast-Famine / Day 16

Effect of Growth Medium Supply and Substratum on In Vitro Enamel Demineralisation and Biofilm Formation | Ch. 5
111
In examining the lesion removed on sample day 8 from the CF condition, the source of the erratic
mean scan profile in Figure 5.3.7 was traced to the actual variation in lesion characters. Striated
lesions or lamination zone were apparent in some of the enamel sections taken from this condition.
Figure 5.3.9 illustrates 4 images which were captured from 4 separate thin sections removed on
sample day 8 however each of these images relates to a section removed from a single enamel disk.
Figure 5.3.9 (Radiographic Images of Transverse Enamel Sections): a) Sample 6; b) Sample 7; c) Sample 8; d) Sample 9. All samples were taken from the CF condition on day 8. Images were captured under x20/0.40 magnification (scale bars = 50 µm). Dashed white lines indicate the first SL and dashed orange lines indicate the second (lamination zone).
Adjacent enamel disks did not show the same lesion character as those noted in Figure 5.3.9
however, even given the lack of apparent lamination zones, the adjacent disks did not produce
lesions in keeping with the expected trend of greater mineral loss with time. Rather, all lesions and
areas examined were highly variable from each other.
In comparing groups directly, it was not possible to accurately extract measurements of SMax on
sample day 2 due to the lack of any distinct SL structure in these lesions. Nevertheless, ΔZ, LD and R
were able to be quantified fully. Comparing these results found that between dCDFF conditions (CF
and FF), a significant difference was found between ΔZ (P ≤ 0.013), LD (P ≤ 0.048) and R (P ≤ 0.009)
on days 2, 4 and 16. However on day 8, ANOVA was unable to find a significant difference between
any of these parameters (P ≥ 0.560) although comparison of the scan profiles in Figure 5.3.7 and
5.3.8 clearly illustrates markedly different lesion character. Parameters are presented graphically
Figures 5.3.10, 5.3.11 and 5.3.12 for ΔZ, LD and R respectively. Although, as noted above, SMax and
was not fully quantifiable in all instances, results are also presented in Figures 5.3.13 within the
same format as ΔZ, LD and R.

Effect of Growth Medium Supply and Substratum on In Vitro Enamel Demineralisation and Biofilm Formation | Ch. 5
112
Figure 5.3.10 (ΔZ Measurements taken from CF and FF Conditions): A single asterisk (*) indicates results which were significantly different between dCDFF conditions (P < 0.050) and a double asterisk indicates a highly significant difference (P < 0.001). Error bars represent the SD of the sample set. The numbers of value used at each point are listed in Table 5.3.1.
In the FF condition a progressive increase in ΔZ was seen over time (Figure 5.3.10). In comparing the
value obtained on each day to that on the previous day, confirmed that the difference between
measurements were statistically significant (P ≤ 0.022). This therefore supported what is suggested
visually in the data in Figure 5.3.10. However, this same delineation could not be applied to ΔZ in the
CF condition. Here a significant increase in ΔZ was seen between days 2 and 4 (P = 0.012) but
between days 4 and 8 and days 8 and 16 no significant difference could be confirmed statistically (P
≥ 0.161). However, in view of the trends show in Figure 5.3.10 for samples taken from the CF
condition, a gradual increase in the mean ΔZ measurement is evident up to the 8th sample day; this
then appeared to decrease by the 16th day. LD (Figure 5.3.11) also demonstrated an extremely
similar trend to ΔZ (Figure 5.3.10); measurements increased progressively over time and reached a
maximum by day 16 in the FF condition. However, in confirming this trend statistically, an increase
was determined between days 2 and 8 (P ≤ 0.008) but between days 8 and 16 the increase in LD
could not be confirmed (P = 0.112). In the CF condition, LD was greatest in lesions removed on day
8. LD increased progressively up until this point but the increase was only significant between days 2
and 4 (P = 0.016). Following the 4th sample day, no differences in LD could be confirmed (P ≥ 0.146).
*
*
**
0
500
1000
1500
2000
2500
3000
0 2 4 6 8 10 12 14 16 18
Inte
rgar
ted
Min
era
l Lo
ss (
ΔZ;
%V
ol.
µm
)
Sample Day
ΔZ CF Condition ΔZ FF Condition

Effect of Growth Medium Supply and Substratum on In Vitro Enamel Demineralisation and Biofilm Formation | Ch. 5
113
Figure 5.3.11 (LD Measurements taken from CF and FF Conditions): An asterisk indicates results which are significantly different between the dCDFF conditions (P < 0.050). Error bars represent the SD of the sample set. The numbers of value used at each point are listed in Table 5.3.1.
Figure 5.3.12 (R Measurements taken from CF and FF Conditions): An asterisk (*) indicates a significant difference between dCDFF conditions (P > 0.05). Error bars represent the SD of the sample set. The numbers of value used at each point are listed in Table 5.3.1.
*
*
*
0
10
20
30
40
50
60
70
80
0 2 4 6 8 10 12 14 16 18
De
pth
(µ
m)
Sample Day
LD CF Condition LD FF Condition
*
*
*
10
15
20
25
30
35
40
45
0 2 4 6 8 10 12 14 16 18
Min
era
l Vo
lum
e (
%V
ol)
Sample Day
R CF Condition R FF Condition
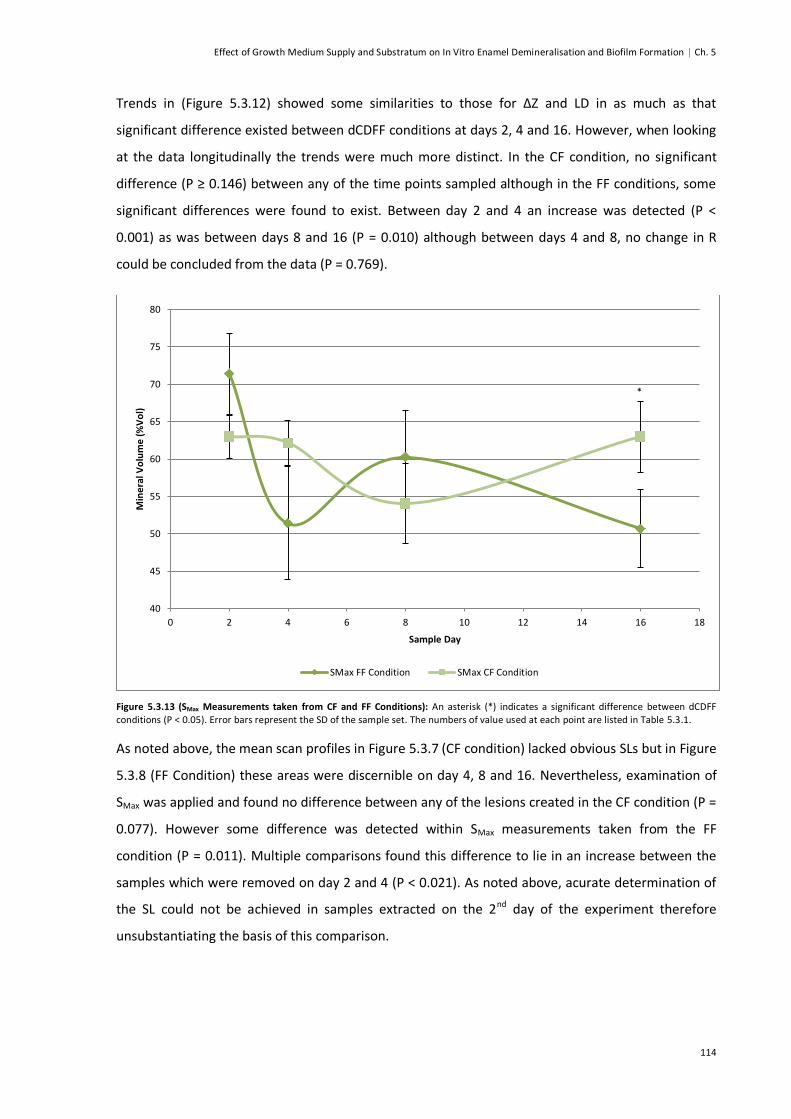
Effect of Growth Medium Supply and Substratum on In Vitro Enamel Demineralisation and Biofilm Formation | Ch. 5
114
Trends in (Figure 5.3.12) showed some similarities to those for ΔZ and LD in as much as that
significant difference existed between dCDFF conditions at days 2, 4 and 16. However, when looking
at the data longitudinally the trends were much more distinct. In the CF condition, no significant
difference (P ≥ 0.146) between any of the time points sampled although in the FF conditions, some
significant differences were found to exist. Between day 2 and 4 an increase was detected (P <
0.001) as was between days 8 and 16 (P = 0.010) although between days 4 and 8, no change in R
could be concluded from the data (P = 0.769).
Figure 5.3.13 (SMax Measurements taken from CF and FF Conditions): An asterisk (*) indicates a significant difference between dCDFF conditions (P < 0.05). Error bars represent the SD of the sample set. The numbers of value used at each point are listed in Table 5.3.1.
As noted above, the mean scan profiles in Figure 5.3.7 (CF condition) lacked obvious SLs but in Figure
5.3.8 (FF Condition) these areas were discernible on day 4, 8 and 16. Nevertheless, examination of
SMax was applied and found no difference between any of the lesions created in the CF condition (P =
0.077). However some difference was detected within SMax measurements taken from the FF
condition (P = 0.011). Multiple comparisons found this difference to lie in an increase between the
samples which were removed on day 2 and 4 (P < 0.021). As noted above, acurate determination of
the SL could not be achieved in samples extracted on the 2nd day of the experiment therefore
unsubstantiating the basis of this comparison.
*
40
45
50
55
60
65
70
75
80
0 2 4 6 8 10 12 14 16 18
Min
era
l Vo
lum
e (
%V
ol)
Sample Day
SMax FF Condition SMax CF Condition
Effect of Growth Medium Supply and Substratum on In Vitro Enamel Demineralisation and Biofilm Formation | Ch. 5
115
5.4.0 Discussion
5.4.1 Biofilm Formation on HA and Enamel Substrata
In addressing the initial aims of this experiment, bacterial enumeration found only minor differences
between viable counts made for FA (Figure 5.3.1), Lactobacillus spp. (Figure 5.3.2), Streptococcus
spp. (Figure 5.3.3) an Veillonella spp. (Figure 5.3.5) between either condition. Although some
differences were found between HA and enamel substrata at some of the time points sampled, the
vast majority showed excellent concordance and a certain level of variation can be expected due to
natural variations which occur within multispecies consortia [Sissons, 1997; Skopek et al., 1993]. To
this end, the greatest level of variation between HA or enamel substrata was found in the
enumeration of biofilm Streptococcus spp. (Figure 5.3.3). However, on closer inspection, the greatest
disparity between substrata occurred only in the FF condition on day 4 and the CF condition on day 8
whereas all of the other results were indistinguishable. Therefore, the seemingly incoherent trends
within this particular microbial group were in fact a product of the close relationship in counts made
between dCDFF conditions.
Viewing the result of microbial counts as a whole, the few variations seen within the current data set
could, in part, be attributed to natural variations in the dCDFF biofilms occurring by chance as the
overall trend in growth and maturation clearly demonstrated extremely close relationships when
counts taken from HA are compared to those made from enamel within each dCDFF unit. In
concluding the variations seen to have occurred by chance, it should be noted that within a clinical
setting, dental caries itself is a site-specific disease [Fejerskov et al., 2008a]. The causation of these
differences should therefore be considered for their applicability to the dCDFF model. The notion of
pooling plaque samples has also been regarded as an illegitimate practice [Nyvad et al., 2013]
however the reasons for this view are based on factors identified from the clinical presentation of
the disease. In this respect, the majority of differences result from intra-oral factors such as
compartmentalisation with respect to salivary flow, the persistence of food particles or the
topographic morphology of the site in question. Within a CDFF system, confounding factors such as
these are completely removed. Further to this point, the rotating action of the turntable ensures
that each biofilm would be continually re-inoculated with either actively dispersed or physically
removed microbes [Korber et al., 1995]. This would serve to maintain a level of homogeneity
between biofilm samples as a result of deliberate carryover within each unit [Deng et al., 2005] and
therefore drastically reduce the effect of compartmentalisation as a confounding factor.
It would therefore be reasonable to assume that the deviations noted were a result of random
differences in the initial colonisation of each unit. Slight disparities which can occur between

Effect of Growth Medium Supply and Substratum on In Vitro Enamel Demineralisation and Biofilm Formation | Ch. 5
116
community proliferation events [Ledder et al., 2006; Sissons et al., 1995] may have played a greater
role than the effect of substrata. The ability of microbes to initially attach to surfaces depends on
their attraction to that surface and this usually involves electrostatic interactions [Marsh and Martin,
2009a]. However both bacteria themselves and the surface of mineralised tissues are negatively
charged [Robinson et al., 2006] therefore the two entities are initially repelled. The formation of the
AEP occurs due to positively charged residues present in salivary macromolecules [Hannig, 2002] and
the subsequent attachment of bacteria to the AEP layer [Marsh and Martin, 2009c]. Although the
initial attachment of early colonising species has been observed on bare HA surfaces [Tanaka et al.,
1996] the establishment of a pellicle facilitates the process and the importance of this aspect is that
negatively charged surfaces would all support this same mechanism [Hermansson, 1999].
Furthermore, the establishment of a pellicle layer may mask any difference in the initial repulsion of
the substrata [Jendersen and Glantz, 1981]. In this respect, the concordance between HA and
enamel surfaces under identical environmental conditions is not surprising.
The results of the present study are in-line with those of several others. Pratten et al. [1998a] found
only minor difference between single species biofilms of Streptococcus sanguinis NCTC10904 when
produced on either HA, enamel or PTFE substrata. Direct comparison between bovine dentine and
poly-acrylate demonstrated marked differences in the pH response of microcosm biofilms [Deng et
al., 2004] however no significant differences were found between poly-acrylate and bovine dentine
controls with respect to either the viable counts measured or lactic acid production but were when
the biofilms were exposed to antimicrobials. These results would therefore suggest that colonisation
is least effected by substrate although the sensitivity of the microbial population may be more so. As
alluded to by Deng et al. [2004] and others [Zaura et al., 2002] buffering of a mineral substratum
may contribute to the acclimation of the microbial community and therefore influence susceptibility.
Calcium released during demineralisation can induce transformation competence [Trombe et al.,
1992] and therefore growth of acidogenic multispecies communities on mineral substrata could
provide a mechanism by which gene transfer [Molin and Tolker-Nielsen, 2003] is facilitated thus
providing some further explanation of the results observed by Deng et al. [2004]. Growth on HA
surface has also been shown to result in differential gene expression when compared to other
negatively charged substrates such as polystyrene [Shemesh et al., 2010]. Whichever the cause, it is
suggested that the chemical similarities between HA and enamel would serve best reduce the
effects.
Following the removal of biofilms, no damage was observed to the surfaces of either the HA or
enamel disks. This aspect was carefully noted as the abrasive and colloidal forces generated during

Effect of Growth Medium Supply and Substratum on In Vitro Enamel Demineralisation and Biofilm Formation | Ch. 5
117
the vortexing stages of the enumeration technique may have resulted in damage to the softened
surface of the mineral structure [Barbour and Rees, 2004]. Observations performed on a
macroscopic level did not detected any signs of fracture and further to this, the TMR scan profiles
clearly show that a SL was retained in lesions created under the FF conditions but not the CF
conditions. As both were subject to the same biofilm removal procedure, it is likely that the lack of
an SL in the CF groups was not the result of vortexing. However, some sections were lost during the
TMR preparation process and it is possible that fragile surface zones may have been weakened. The
relative safety of processing potentially fragile lesions in this way therefore remains a possible
concern and as HA demonstrates a decent analogue in terms of a surface for microbial adhesion and
growth, physiochemical interactions and is less valuable to produce, its use in place of enamel as a
biofilm substratum can be justified.
5.4.2 Biofilm Growth and Formation and Caries Lesions
The sucrose pulsing strategy used (Figure 5.2.2) equates to a daily consumption of 0.780 g.d-1 which
is far below recommended safe limits set by analysis of WHO data of 50 g.d-1 [Sreebny, 1982].
However, comparably lower cariogenic challenges have been shown to produce caries lesions within
the CDFF system [Cenci et al., 2009; Deng et al., 2005]. Crucially, these in vitro studies concentrated
on dentine as a substrate for lesion formation and dentine is intrinsically more soluble than enamel
[Robinson et al., 1995a]. It would therefore be suggested that direct exposure of the biofilm to a
cariogenic challenge is able to enhance the process of caries lesion formation.
Similar sucrose challenges have however been used to generate carious lesions in situ [Aires et al.,
2006; Ccahuana-Vásquez et al., 2007; Cury et al., 2000]. Aries et al. [2006] tested a range of sugar
concentrations using an almost identical exposure strategy. The authors found that under these
conditions a 14.60 mM sucrose exposure was sufficient for the production of carious lesion in
human enamel. Further to this, it was also noted that’s a positive correlation between mineral loss
and the concentration of the sugar exposure solution existed. In the present work, the concentration
of the sugar solution was at the higher end of the spectrum used by Aries et al. [2006]. Given the
lessened protective effects of the STGM (Section 4.4.1 and Section 4.4.2) it is perhaps not surprising
that the current model was able to form such well-defined lesions.
Within the present work, a well-defined SL occurred in those lesions which were produced under the
FF cycle (Figure 5.3.8) whereas this feature appeared absent in the lesions taken from the CF
condition (Figure 5.3.7). A possible basis for this observation may lie in chemical parameters at the
interface between the enamel surface and biofilm PF. Coupled-diffusion is known to play a
significant part in the formation of the SL [Anderson and Elliott, 1987] and a factor which is able to

Effect of Growth Medium Supply and Substratum on In Vitro Enamel Demineralisation and Biofilm Formation | Ch. 5
118
augment this process is the ionic strength of the medium at the interface [Anderson et al., 2004].
The combined introduction of STGM and the sucrose solution (CF condition) would, presumably,
result in the biofilms being exposed to a medium of higher ionic strength than if they were exposed
to sucrose in the absence of the STGM (FF condition). The ionic strength of the STGM cannot be
calculated fully however rough calculations from Figure 4.3.5 and Figure 4.3.6 determine it to be
0.1559 mM when mixed 50:50 within sucrose solution at neutral pH [Shellis, 1988]. Pure 50 mM
sucrose solution does not possess any ionic component. Therefore, the bulk solution in contact with
the biofilm during a cariogenic challenge would have a lower ionic strength in the FF conditions than
in the CF condition. It is reasonable to assume that the PF would also be effected [Margolis and
Moreno, 1994] however to what extent this would occur would only be possible if the composition
of the PF was measured during a cariogenic challenge. If the ionic strength of the PF was significantly
reduced in the FF condition then this would increase the effects of diffusive coupling within the
system [Anderson et al., 2004] and therefore could partially explain the enhanced SL feature in
lesions which were created under these conditions. However, many more factors are involved in
caries lesion formation [Anderson and Elliott, 1992]. A second aspect may have been an alteration to
the DS of the PF with respect to the enamel mineral during the FF sucrose exposure or the difference
in the cariogenic challenge due to dilution with the STGM in the CF condition.
As a biological caries model, alterations to the collective physiological state of the biofilms within is
also a factor which is likely to contribute to the lesions which are produced. Carbohydrates are
present in the STGM but it can be assumed that the concentrations of these would not be high
enough to result in significant levels of acid production to enable the selection of acidogenic and
aciduric species [Bradshaw et al., 1990; Marsh, 2003b] and ultimately create a cariogenic state. As
noted above, measurements of the PF would be necessary in order to investigate to what extent
acid production occurs in the absence of sucrose pulses. However, based on the assertion that
adjunct sucrose is sufficient for this process [Aires et al., 2006; Arthur et al., 2013; Bowden and Li,
1997; Leme et al., 2006; Marsh, 1995a; Pratten et al., 2000; Shu et al., 2000; Vroom et al., 1999], the
reduction in sucrose concentration which occurs with the effect of mixing STGM and sucrose
solution in the CF condition may have some influence on the lesions which were developed. In
effect, a 50 mM sucrose challenge in the FF condition would equate to approximately a 25 mM
challenge in the CF conditions. Although a positive correlation was indicated, Aries et al. [2006]
found no difference between these concentration ranges in their in situ model; possibly, this was
due to the inherent biological variation present in such data.

Effect of Growth Medium Supply and Substratum on In Vitro Enamel Demineralisation and Biofilm Formation | Ch. 5
119
Within the present work, microbial data did not show any strong evidence that either dCDFF
condition was able to reach a more or less cariogenic state than the other although some indications
were observed. In general, the communities within either unit resulted in remarkably similar
ecological states. The lack of any real distinction between FA, Lactobacillus spp. and Streptococcus
spp. in part demonstrates the efficacy of the dCDFF model [Hope et al., 2012]. However, in the FF
condition the proportion of MS rose higher whereas the proportion of Veillonella spp. remained
lower. As highly acidogenic species [Marsh, 2003b; Marsh and Martin, 2009b; Zero, 2004], a higher
proportion of MS can be associated within a greater cariogenicity [Hamada and Slade, 1980;
Loesche, 1986]. On the other hand, Veillonella spp. are able to metabolise lactate as an energy
source [Rogosa and Bishop, 1964], their presence within a biofilm may therefore aide in the removal
of the acids following production and therefore help to mitigate cariogenic episodes [Mikx et al.,
1976]. This would point to a less cariogenic plaque within the CF condition. However, assertions
made on the basis of selective culture are limited as more than one community structure may be
stable under a certain set of environmental conditions [Sissons, 1997]. Moreover, any alteration to
the environment is most likely to exert an effect on the biofilm phenotype whereas changes in the
composition are likely to be secondary [Kinniment et al., 1996]. Consequently, quantification of the
metabolic activity would provide a much greater insight [Nyvad et al., 2013].
Figure 5.4.1 (Successive Basis of Lamination Zone Formation): Stages of the caries process are marked by colour coding: ) Inward diffusion gradient
-, ) Demineralisation challenge ) Mineral loss (ΔZ) following the continuation of the processes; a) initial “strong”
cariogenic challenge; b) secondary “weaker” cariogenic challenge; c) resulting lesion profile (not to scale).
Lamination zones [Palamara et al., 1986] were apparent in some of the samples taken from the CF
condition (Figure 5.3.9). These could have resulted from exposures of purely chemical source
[Damato et al., 1990; Lagerweij and ten Cate, 2006; Lippert et al., 2012] but within dCDFF system,
the environmental conditions are controlled [Pratten, 2005] and it would therefore be more likely
that these structures resulted from some deviation from the uninterrupted state of biofilm growth
that was expected. Biofilms which form progressively would, in theory, react to a cariogenic
challenge in a way dependent on their state of maturity. Lamination zones may also result from the
successive formation of 2 SLs (the deeper of which being the remnants of an earlier lesion which
penetrated further as illustrated in Figure 5.4.1). In a logical progression, this histological feature

Effect of Growth Medium Supply and Substratum on In Vitro Enamel Demineralisation and Biofilm Formation | Ch. 5
120
may have formed through damage or removal of a mature cariogenic biofilm and the re-colonisation
with less cariogenic growth. If such a disturbance was to occur in situ or in vivo, subsequent re-
growth would require passage through the stages defined by the EPH [Marsh, 1994]. However,
within the dCDFF unit, continuous re-inoculation with a fully aciduric community would arise by the
action of the scraper blades although re-establishment of the biofilm structure would reduce
cariogenic potential. The proportion, composition and physical structure of the EPS may also effect
the retention of mineral ions [Cury et al., 1997; Russell, 2009] or diffusion though the structure itself
[Dibdin and Shellis, 1988; Hata and Mayanagi, 2003]. Therefore, although the community would be
re-inoculated with acidogenic and aciduric community, full cariogenicity would not immediately
develop. Thus, explaining the occurrence of these particular lamination zones (Figure 5.3.9).
Viewing lesion progression over the course of the experiment, the FF condition showed the greatest
development over time whereas the progression appeared hindered in the CF condition (Figure
5.3.10). Heightened proportions of Veillonella spp. (Figure 5.3.5) could have contributed to lower
cariogenicity [Mikx et al., 1976] however variation was also seen in the lesions created under the CF
conditions. To this end, lamination zones could have contributed but their magnitude alone would
not account for the variation. The most probable explanation therefore lies in that which was
suggested to have caused to formation of the lamination zones noted above. If mechanical
disturbance of the biofilm occurred at least once in the CF condition, then it is possible that this may
have occurred several times. Depending on the extent of such a disruption, the biofilms may have
been prevented from reaching their full cariogenic potential. Thus, mechanistic influences may have
confounded results to some extent although the reduced cariogenic challenge as a result of mixing
the sucrose solution with the STGM in the CF condition [Aires et al., 2006] may have also contributed
as was indicated by the higher proportion of MS and lower content of Veillonella spp. in the biofilms
which received a greater exposure to fermentable carbohydrates [Marsh, 1994].
Enamel tissue also exhibits variations in mineral composition [Robinson et al., 2000] but exogenous
chemical alterations are typically concentrated to the outermost layers [Li et al., 1994; Nakagaki et
al., 1987; Pearce et al., 1995] however these chemically altered layers would have been removed by
the polishing process [Arends and Christoffersen, 1986; Mellberg, 1992]. Variations in the ELT may
have created differences in the composition of the artificial surface [Anderson and Elliott, 2000;
Theuns et al., 1986a; Theuns et al., 1986b] and therefore may have also contributed to the variability
in the lesions created under the CF condition (Figure 5.3.7). Likewise, the development of the SLs
may have been subject to these same complications although whether this can be defined as the
root cause of variation in the SL measurements remains in question.

Effect of Growth Medium Supply and Substratum on In Vitro Enamel Demineralisation and Biofilm Formation | Ch. 5
121
What was demonstrated (most reliably in enamel lesions created in the FF condition) was that
enamel lesion progression was not linear within this model. These observations raise interesting
questions over the dangers associated with stagnation sites and the removal of plaque biofilms as
from this data, cariogenicity was greatest in the earlier stages of the experiment; as biofilm
maturation progressed, further demineralisation appeared more limited. This observation therefore
questions the completeness of the EEPH [Takahashi and Nyvad, 2008] as what would be observed is
a biofilm which had reached a highly cariogenic state but following which a reversion had also
occurred. Alterations in the structure and composition of the mature biofilm and the retention of
inorganic mineral ions [Cury et al., 1997; Duckworth and Gao, 2006; García-Godoy and Hicks, 2008;
Tenuta et al., 2006] could have contributed somewhat to the reduction in rate of mineral loss
observed.
As noted above, one assumption which was consistently made was that the mineral loss within each
section was considered to have progressed equally across the entire system when in actual fact the
mineral loss from each sample may have behaved differently. An advantage would therefore have
been use of techniques which allow for mineral loss to be measured within the same sample
longitudinally [Amaechi and Higham, 2002; Anderson et al., 1998; de Josselin de Jong et al., 1987].
However, the operating constraints of the CDFF do not permit the re-insertion of samples once they
have been removed. In much the same way that colonisation resistance can maintain the exclusion
of harmful microorganisms [Marsh and Martin, 2009a] airborne microorganisms could disrupt the
biofilm community to point where the representivity of the biofilm is compromised. Thus, within the
CDFF the use of multiple sections to follow mineral loss longitudinally is, to some extent, not ideal
[de Josselin de Jong et al., 1987]. The application of other, non-destructive, techniques to gauge
mineral content would not have been feasible whilst ensuring against external contamination.
In summation, it has been demonstrated that the CDFF model is able to produce caries lesions in
enamel tissues under the current operating procedures [Pratten, 2005]. Although the STGM is highly
saturated with respect to calcium phosphate salts (Figure 4.4.4), it appears the higher driving force
for remineralisation does not promote mineral deposition to the point of counteracting the effects
of the challenges imposed. There is also some indication that the biofilms produced within the CDFF
may be more highly cariogenic in the earlier stages of formation and this should therefore be
investigated further. However, in order to provide the greatest insight into the physiological state of
biofilms within the unit, methods which are able to directly capture their metabolic activity should
be employed [Nyvad et al., 2013].

Effect of Growth Medium Supply and Substratum on In Vitro Enamel Demineralisation and Biofilm Formation | Ch. 5
122
5.5.0 Conclusions
The use of HA for microbial enumeration and in conjunction with the inclusion of enamel surfaces
for the assessment of changes in mineral content is an appropriate strategy to assess both
parameters in the CDFF. Whether or not an enamel or HA substratum is used does alter biofilm
formation to any significant degree and, from this perspective, the choice of substratum does not
have any discernable effect on the biofilm which are formed. Moreover, the choice of STGM flow
cycle (CF or FF) also does not have any strong effect on the composition of the microbial community
although there is some evidence of alterations to the physiological state of the biofilm (crucially with
respect to lesion formation). Acidogenic capacity, or more specifically the acid response of biofilms
from either dCDFF condition, may be a more effective means of determining whether the microbial
community itself was significantly altered or whether the relationship seen was a product of an
inorganic change in biochemical equilibrium.
Both CF and FF strategies will allow for the formation of caries lesions however it should be
remembered that the composition of the PF may be altered by this; not only by direct equilibrium
but also by the concentration of the cariogenic substrate or any adjunct agent that is used. Within
the present study, a reduction in the ionic strength of the PF during the imposed cariogenic
challenge was identified as the cause of the differences in lesion architecture that were observed.
However, as noted above, biochemical analysis of the PF would be required to prove this assertion
unequivocally and should therefore be explored.

123
Chapter 6: Influence of Sucrose vs. dH2O on In Vitro Biofilm Formation
and Sucrose-Induced Acidogenic Capacity.
6.1.0 Introduction Fermentable carbohydrates are considered one of the principle components which are able to alter
the ecology of dental plaque [Marsh, 1995b]. Of these, the effects of sucrose are well established as
having a highly cariogenic effect [Bowen, 2002; Burt et al., 2008; Cury et al., 2000; Gustafsson et al.,
1953; Minah et al., 1985; Woodward and Walker, 1994]. Further to this, epidemiological evidence
supports a positive correlation between the frequency of sugar intake and incidence of dental caries
as opposed to the quantity which is consumed [Anderson et al., 2009].
Figure 6.1.1 (Sucrose Catabolism): Utilisation mechanisms for the formation of Pophoenolpyruvate (PEP) and Pyruvate. Enzymes and energy currency molecules are given in italics (SPH: Sucrose-6-Phospho-Hydrolase; PGM: Phospho-Gluco-Mutase; HK: Hexokinase; FK: Fructokinase; PFK: Phospho-Fructo-Kinase; SP: Sucrose-Phosporylase; PHI: Phospho-Hexose Isomerase; TPI: Triose-Phospho-Isomerase; GDHP: Glyceraldeyde-3-P Dehydrogenase; PGLK: Phospho-Glycerate-Kinase; PGLM: Phospho-Glycerate-Mutase; PKL: Pyruvate-Kinase; ATP: Adenosine Tri-Phosphate; NAD: Nicotinamide Adenine Dinucleotide) with the exception of cell membrane proteins EII and SPE..
Microbial communities also possess a wide variety of sugar utilisation systems. Further to this, the
imposition of various selective pressures and contributing mechanisms (such as horizontal gene
transfer [Molin and Tolker-Nielsen, 2003]) result in vast array of potential biochemical pathways
which, in turn, can make discussion over discrete responses to even specific environmental
conditions difficult. However, several aspects which are central to the utilisation of fermentable
carbohydrates are highly conserved [Marsh and Martin, 2009a]. Transmembrane transport of

Influence of Sucrose vs. dH2O on In Vitro Biofilm Formation and Sucrose-Induced Acidogenic Capacity | Ch. 6
124
sucrose occurs predominantly via the Phosphoenolpyruvate-Phosphotransferase (PET-PTS) and
Sucrose Permease (SP) pathways (Figure 6.1.1). Sucrose may also be degraded before entry into the
cells by sucrase enzymes located within the EPS of the biofilm [Leme et al., 2006]. In order for
cellular metabolism to take place, the sugar must first be broken down into its constitute
monosaccharides [Williams and Elliott, 1989]. Further, extracellular utilisation resulting in the
formation of EPS matrix may also contribute to cariogenicity through alterations in the PF
composition [Cury et al., 2000].
However, the formation of an EPS matrix alone is by no means the only factor which determines the
cariogenicity of plaque biofilms. To this end, the production of organic acids is central to the altering
the DS of the PF with respect to enamel mineral and thus effecting demineralisation and the onset of
dental caries [Margolis and Moreno, 1994]. Several research groups have investigated the
composition of the PF [Dibdin, 1990; Edgar and Higham, 1990; Gao et al., 2001; Higham and Edgar,
1989, 1991; Margolis and Moreno, 1992; Margolis et al., 1985; Moreno and Margolis, 1988; Oliveby
et al., 1990; Vogel et al., 1990] however these centred on direct clinical relevance and therefore
chose to focus their studies on plaque samples which were obtained in vivo. The drawback of this
approach is that samples taken from multiple individuals can be markedly dissimilar and without
control for the initial community from which the plaque came, direct comparisons of the microbial
ecology are difficult. Attempts have been made to quantify the acidogenic response of in vitro
biofilms [Deng et al., 2005; Zaura et al., 2011] although extraction of the PF to the extent of
determining both organic acid production and retention of inorganic ions has not yet been
performed within a controlled in vitro environment. Thus, the dCDFF model may provide a platform
to investigate the response of microcosm biofilms to known cariogenic substrates such as sucrose.
Further to this, methods which capture the ecology of the biofilm community in conjunction within
changes in the PF may provide greater insight into causative relationships with occur during the
onset of cariogenic biofilm formation [Marsh, 1994].
6.1.1 Aims and Objectives
The following experiments aim to demonstrate the effects of sucrose on in vitro biofilm formation
and resultant metabolic activity upon exposure to sucrose. This will be achieved with the use of a
shared microcosm inoculum in the dCDFF system [Hope et al., 2012] and subsequent analysis for
organic acids, inorganic anions and cations within centrifugally-extracted PF. PF ionic composition in
conjunction with the state of the microbial ecology will be used to compare these in vitro biofilms to
natural dental plaque and thus test the assertion that the CDFF can produced orally relevant biofilms
under the a set of standard operating conditions [Pratten, 2005]. Further to this, the relative
cariogenicity will be inferred by way of PF composition following exposure to sucrose.

Influence of Sucrose vs. dH2O on In Vitro Biofilm Formation and Sucrose-Induced Acidogenic Capacity | Ch. 6
125
6.2.0 Materials and Methods
The in vitro effect of sucrose versus dH2O pulsing on biofilm formation was investigated in the dual
constant depth film fermenter (dCDFF) model described in Section 5.2.2. Biofilms were formed from
a pooled human salivary inoculum (Sections 5.2.1). However for the purposes of this investigation,
enamel was not used as a substratum rather HA disks (Clarkson Chromatography Products Inc.,
South Willaimsport, PA, USA) were used as a sole support for biofilm growth. All available spaces
within PTFE pans were filled with HA disks so as to provide an excess of biofilm samples outside the
needs of this experiment.
Sterilisation procedure were followed exactly as described in Section 5.2.2.1 however the assembly
of the apparatus differed somewhat to that which was described previously (Section 5.2.2.2). An
inoculum flask was made-up to contain 1 L of STGM (composition given in Table 4.2.1) with a
magnetic flea added before sterilisation. The prepared inoculum was allowed to cool to 37°C for ≥ 2
h in a standard laboratory incubator (IP250-U; LTE Scientific Ltd., Oldham, UK) following which a
single 1.8 mL aliquot of the saliva pool was quickly thawed and added. The apparatus was then fully
assembled as illustrated in Figure 6.2.1.
In brief, a 10 L supply of sterile STGM was connected to both CDFF Unit A and B. A 2 L supply of
sterile 100 mM sucrose solution (Sigma-Aldrich Ltd., Poole, UK) was connected to Unit A whereas a 2
L supply of sterile dH2O was connected to Unit B. For each CDFF, grow-back traps were used to
isolate the liquid volumes from the fermenter vessels with the exception of the inoculum flask.
Peristaltic pumps (101U/R Low Flow Peristaltic Pump; Watson Marlow, Falmouth, UK) were used to
control the flow of liquids into the CDFFs. These were set to a flow rate of 0.38 mL min-1 for sucrose
solutions, dH2O and the 10 L STGM volume whereas the inoculum was set to 0.5 mL min-1. Once
assembled, the inoculum was fed in in the absence of any other agent. At the flow rate chosen, this
took approximately 15 h. At the point the inoculum was exhausted, the pumps controlling the flow
of the 10 L STGM supply were initiated as were those controlling the flow of both the dH2O and the
100 mM sucrose volumes. However, these pumps were not activated for the same periods as each
other. As illustrated in Figure 6.2.2, a 100 mM sucrose solution or dH2O was fed in 8 times daily over
a 16 h period for 15 min as part of a 24 h cycle. These pulses happened in the absence of STGM
therefore requiring the pumps controlling the STGM supply to be stopped during the periods where
the sucrose solution and dH2O pumps were active. This was achieved by the use of digitally
controlled socket timers (Draper Tools Ltd., Hampshire, UK) set to switch the corresponding pumps
on and off at the correct times.

Influence of Sucrose vs. dH2O on In Vitro Biofilm Formation and Sucrose-Induced Acidogenic Capacity | Ch. 6
126
Figure 6.2.1 (dCDFF Schematic Set-Up) a: Sterile 100 mM Sucrose Solution; b:
Sterile Saliva-Type Growth Medium (STGM); c: Sterile dH2O; d: Peristaltic Pump
running at 0.38 mL.min-1
; e: Peristaltic Pump 0.38 mL.min-1
; f: Grow-Back Trap;
g: Peristaltic Pump 0.5 mL.min-1
; h: Inoculum Flask with Magnetic Stirrer; i:
CDFF Unit A; j: CDFF Unit B; k: Effluent; *: 0.3µm Air Filter.

Influence of Sucrose vs. dH2O on In Vitro Biofilm Formation and Sucrose-Induced Acidogenic Capacity | Ch. 6
127
Figure 6.2.2 (Pulsing Strategy for 100 mM Sucrose vs. dH2O Exposures): Both dCDFF units (A and B) were subject pulsing strategy which continued over a period of 24 h. Green bars represent the flow of STGM at a rate of 0.38 mL.min
-1. Breaks in the green bars indicate the
cessation of the STGM flow. Red bars represent the flow of a 100 mM sucrose solution (0.38 mL.min-1)
within the 24 h cycle period and blue bars represent the flow of dH2O (also at 0.38 mL.min
-1)Sucrose and dH2O pulsing occurred every 2 h within 16 h of the 24 h cycle.
6.2.1 Biofilm Sampling Procedure
Biofilms were sampled at days 2, 4, 6 and 8. Immediately after the 4th sucrose or dH2O pulse of the
days cycle (2:00PM), one PTFE pan was extracted from each CDFF using the procedure describe in
Section 5.2.3. Three HA disks were selected from pans on the basis of the whether or not there was
evidence for any disruption to the biofilm. These disks were then placed in 5 mL PBS solution (Sigma-
Aldrich, Poole, UK) containing 3 sterile glass beads (3.5 - 4.5 mm diameter; BDH-Merk Ltd., Poole,
UK) and vortex mixed for 30 sec. Serial 10-fold dilutions were then made in PBS solution to final
dilution factor of x10-6.
Twenty-five µL volumes of these dilutions were then spread on both selective and non-selective
agars. Initially, all dilutions were spread however in later stages it became possible to pre-empt the
number of colony forming units (CFUs) and therefore only dilutions deemed appropriate were used.
The community members chosen for identification were: fastidious anaerobes on FAA media
supplemented with 5% defibrinated horse blood (Section 5.2.4.1), Streptococcus spp. of MSA
(Section 5.2.4.3) and Lactobacillus spp. on Rogosa agar (Section 5.2.4.4). CFU counts were then
recorded in the range 100 ≤ CFU ≤ 300 whenever possible, assuming complete dispersal of the
biofilm, these counts were correct for dilution and dispersal in PBS and expressed by unit area of the
of the HA disk’s surface within the recess provided. All statistics were performed as described in
Section 2.2.4.
6.2.2 Plaque Fluid Extraction
On the sample days indicated (2, 4, 6 and 8), PTFE pans holing HA disks were extracted immediately
before and immediately after the 5th sucrose pulse of the cycle on the given day (4:00PM). In all
cases, HA disks were quickly removed from their pans and placed side-on in 0.2 mL PCR tubes
Influence of Sucrose vs. dH2O on In Vitro Biofilm Formation and Sucrose-Induced Acidogenic Capacity | Ch. 6
128
(Eppendorf PCR Tubes; Sigma-Aldrich Ltd., Poole, UK) using sterile fine-tipped tweezers. Tubes were
then spun in a desktop centrifuge (Sanyo MSE Micro Centaur; Thermo Optek UK Ltd., Sussex, UK) for
1 min at 13000 rpm. The disks were then removed using the same fine-tipped tweezers and another
HA disk placed in the same position as the pervious and the PCR tube spun for a further 1 min at
13000 rpm. This removed the biofilm mass from the surface of the disk by the centrifugal force
generated. Once a sufficient number of disks supporting biofilms had been centrifuged
(approximately 3) the pellet collected at the bottom of the PCR tube was spun for a further 2 min at
13000 rpm before 5 µL of the supernatant was carefully removed with 0.1 – 10 µL pipette
(Eppendorf UK Ltd., Stevenage, UK). This was then added to another 0.2 mL PCR tube and stored at -
30°C until ready for analysis by capillary electrophoresis (CE). Altogether, PF collection took 7
minutes from the point at which the HA disks were removed from the CDFF unit.
6.2.3 Organic Acid, Anion and Cation Analysis
CE analysis was applied to plaque fluid samples. This was performed using a using a P/ACE-MDQ
system equipped with a UV detection system (Beckman-Coulter UK Ltd., High-Wycombe, UK). Exact
operating conditions can be found in Section 4.2.2. In brief, samples were quantitatively analysed for
both anions and cations. With respect to anions, the analytes which were chosen for identification
were chloride, nitrate, fluoride, formate, succinate, acetate, lactate, propionate, phosphate and
butyrate. Azide (from sodium azide) was used an internal standard from anion analysis. The cationic
species chosen were ammonium, sodium, potassium, magnesium and calcium with lithium (from
lithium chloride) used as an internal standard.
Samples were first thawed and diluted in 15 µL Na-Azide solution so as the azide internal standard
was constant at 250 µM. Samples were then analysed using the anion analysis kit supplied by the
manufacturer (Beckman-Coulter UK Ltd., High-Wycombe, UK). Following this, a further 5 µL of
Lithium chloride solution added so as the sample now contained 1 mM lithium as a cation internal
standard. The samples were then run using the cation analysis kit also provided by the manufacturer
(Beckman-Coulter UK Ltd., High-Wycombe, UK). Triplicate measurements were made for both runs
and the traces obtained were quantified in comparison to a set of external standards across 4
calibration levels as described in Section 4.2.2.1 using the 32 Karat software provided by the
manufacturer (Beckman-Coulter UK Ltd., High-Wycombe, UK).. As anions were analysed at an x4
dilution and cations were analysed x5, the concentrations calculated from each of the traces were
multiplied x4 and x5 for anions and cations respectively. Further, as cations were subsequent to
anions and the internal standard used for anion analysis (Na-Azide) introduced 250 µM Na+, this was
subtracted from the final concentration calculated for sodium from the cation peaks. All statistical
analyses were performed as described in Section 2.2.4.

Influence of Sucrose vs. dH2O on In Vitro Biofilm Formation and Sucrose-Induced Acidogenic Capacity | Ch. 6
129
6.3.0 Results
6.3.1 Enumeration of Biofilm Bacteria
Mean viable counts of FA were not significantly different between either dH2O or sucrose-exposure
conditions when the results taken from the same sample days were compared (P ≥ 0.061). Trends in
microbial growth patterns were also very similar regardless of whether the biofilms were exposed to
sucrose (100 mM) or dH2O pulsing strategies (Figure 6.2.2). Data for the FA group are presented
below in Figure 6.3.1. In biofilms produced under both conditions, a significant increase in FA was
seen between sample days 2 and 4 (P ≤ 0.032). However, between days 4 and 8, this increase did not
show any statistical significance (P ≥ 0.319). Visually from the data presented in Figure 6.3.1, the
biofilms in both conditions had reached a relatively stable and similar state between either dCDFF
condition with respect to this particular microbial group.
Figure 6.3.1 (Fastidious Anaerobes; FA): dCDFF units were exposed to either a 100 mM sucrose or dH2O pulsing strategy. Both conditions received a FF STGM supply. Error bars represent the SD of each sample set. No significant differences were found between either dCDFF condition.
Lactobacillus spp. showed a clear difference between dH2O and sucrose exposure conditions (Figure
6.3.2). A complete separation in viable counts was confirmed (P ≤ 0.003) between conditions on
each sampling occasion. In the sucrose condition, CFU counts of Lactobacillus spp. remained stable
between sample days 2 and 4 (P = 0.896) but between days 4 and 8, a definite increase had begun.
Between each of the remaining sample points (Sample days 4, 6 and 8) a significant increase (P ≤
0.001) was observed in the sucrose exposure condition.
6.70
6.90
7.10
7.30
7.50
7.70
7.90
8.10
1 2 3 4 5 6 7 8 9
Fast
idio
us
An
aero
be
s (F
A;
Log1
0C
FU.m
m-2
)
Sample Day
Sucrose (100 mM) dH2O

Influence of Sucrose vs. dH2O on In Vitro Biofilm Formation and Sucrose-Induced Acidogenic Capacity | Ch. 6
130
Figure 6.3.2 (Lactobacillus spp.): dCDFF units were exposed to either a 100 mM sucrose or dH2O pulsing strategy. Both conditions received a FF STGM supply. Error bars represent the SD of each sample set. An asterisk (*) indicates a significant difference (P < 0.050) and a double asterisk (**) indicates a highly significant difference (P < 0.001) between dCDFF conditions.
Figure 6.3.3 (Streptococcus spp.): dCDFF units were exposed to either a 100 mM sucrose or dH2O pulsing strategy. Both conditions received a FF STGM supply. Error bars represent the SD of each sample set. An asterisk (*) indicates a significant difference (P < 0.050) and a double asterisk (**) indicates a highly significant difference (P < 0.001) between dCDFF conditions.
**
*
**
**
2.80
3.30
3.80
4.30
4.80
5.30
5.80
6.30
6.80
1 2 3 4 5 6 7 8 9
Lact
ob
acill
us
spp
. (Lo
g10
CFU
.mm
-2)
Sucrose (100 mM) dH2O
*
**
5.80
6.00
6.20
6.40
6.60
6.80
7.00
7.20
7.40
7.60
1 2 3 4 5 6 7 8 9
Stre
pto
cocc
us
spp
. (Lo
g10
CFU
.mm
-2)
Sample Day
Sucrose (100 mM) dH2O

Influence of Sucrose vs. dH2O on In Vitro Biofilm Formation and Sucrose-Induced Acidogenic Capacity | Ch. 6
131
In the dH2O condition, viable counts of Lactobacillus spp. remained present but lower and remained
so over the entire course of the experiment. No significant difference was seen between any of the
sample points within this condition (P ≥ 0.857) hence a lack of exposure to sucrose appeared to
suppress the enrichment of Lactobacillus spp.
Viable counts of Streptococcus spp. (Figure 6.3.3) were initially indistinguishable between biofilms
extracted from either condition on days 2 and 4 (P ≥ 0.399). However, following 4 days of the pulsing
strategy, a significant divergence occurred (P ≤ 0.007). In the sucrose exposure condition, counts had
begun to increase within the biofilm samples on the 6th day (P = 0.012) whereas those in the dH2O
exposure condition remained relatively low (P = 0.999). Between sample days 6 and 8, CFU counts
increased even further under exposure to sucrose (P = 0.020) whereas those in the dH2O condition
decreased significantly (P = 0.001). This separation in growth trends is illustrated in Figure 6.3.3
where the continued increase in viable Streptococcus spp. counts is visible for the sucrose condition
and a relatively steady-state which then proceeded to a decrease is indicated in the dH2O condition.

Influence of Sucrose vs. dH2O on In Vitro Biofilm Formation and Sucrose-Induced Acidogenic Capacity | Ch. 6
132
6.3.3 Organic Acid, Anion and Cation Analysis
In the presence of sucrose pulsing, lactate was the predominate acid produced by all biofilms. The
greatest lactate production was seen 2 days into the sucrose pulsing strategy (Figure 6.2.2).
However, at later stages the concentration of lactate produced dropped to approximately half that
which was seen at day 2 (Figure 6.3.4). In the absence of sucrose pulsing, lactate was not produced
to such an extent. By day 6, the PF concentrations of lactate were BMDL that of the CE system (62.48
µM). Statistically, a significant difference was found between dCDFF unit conditions on day 2 (P <
0.001) however by day 4 this difference could no longer be confirmed (P = 0.105). Although a
decrease was observed over the course of the experiment (Figure 6.3.4), no significant differences
were found between the measures which were made on either of the 4 sampling days and this was
true for both the sucrose (P = 0.158) and dH2O (P = 0.323) exposure conditions.
Figure 6.3.4 (Lactate PF Concentrations in Comparison by CDFF Condition): Concentrations are expressed in mM quantities. Error bars represent the SD of the sample set (n=3 unless otherwise indicated). An asterisk (*) indicate a significant difference (P < 0.050) between dCDFF conditions.
The predominant organic acid produced in the absence of sucrose pulsing was acetate and this was
detected both in the presence and absence of sucrose pulsing however the levels of production
varied considerably between sampling occasions. Between dCDFF conditions, the differences were
only significant on sample day 2 where a higher proportion of acetate was found in PF samples taken
from the dH2O condition (P = 0.018). Although not statistically significant, mean acetate
concentrations were typically higher in the absence of sucrose exposure with the only exception
*
(n=2) 0
5
10
15
20
25
2 4 6 8
Lact
ate
Co
nce
ntr
atio
n (
mM
)
Sample Day
Sucrose Exposure Condition dH2O Exposure Condition

Influence of Sucrose vs. dH2O on In Vitro Biofilm Formation and Sucrose-Induced Acidogenic Capacity | Ch. 6
133
being samples extracted on the 8th day of the experiment (Figure 6.3.5). In the sucrose exposure
condition, no difference could be found between any sampling occasion (P = 0.624). However in the
dH2O condition a significant difference was found (P = 0.036) but following adjustment for multiple
comparisons (Tukey’s HSD), no specific deviation could be found (P ≥ 0.052).
Succinate was detected in small quantities in all sucrose puling conditions (approximately 200 µM)
but not within any of the PF samples which were extracted from biofilms exposed to dH2O (Figure
6.3.9a to Figure 6.3.9i). The same was true of formate, although formate was detected in slightly
greater quantities than was succinate. Interestingly, succinate did not show a direct progression with
time rather concentrations remained around a steady background level (P = 0.652) whereas this was
not true for formate. These concentrations did appear to increase but not to the point of statistical
significance (P > 0.492).
Figure 6.3.5 (Acetate PF Concentrations in Comparison by CDFF Condition): Concentrations are expressed in mM quantities. Error bars represent the SD of the sample set (n=3 unless otherwise indicated). An asterisk (*) indicates a significantly different (P < 0.050) result between dCDFF condition.
Phosphate was present in the PF phase of all biofilms (Figure 6.3.6) although the traces obtained
exhibited interference around the phosphate peaks similar to that which was noted during the
analysis of the STGM (Figure 4.3.2). This complication made phosphate peak integration difficult and,
although useable data was collected, the results may not have been as accurate as the other
analytes mentioned thus far. In the case of this analyte, no relationship between either sample days
*
0
2
4
6
8
10
12
14
16
2 4 6 8
Ace
tate
Co
nce
ntr
atio
n (
µM
)
Sample Day
Sucrose Exposure Condition dH2O Exposure Condition

Influence of Sucrose vs. dH2O on In Vitro Biofilm Formation and Sucrose-Induced Acidogenic Capacity | Ch. 6
134
or dCDFF conditions could be verified (P > 0.106) with the only exception being a relatively higher
proportion in biofilm PF extracted from the dH2O condition on sample day 2 (P = 0.040).
Propionate (Figure 6.3.9a to Figure 6.3.9i) was found in PF extracted from both sucrose and dH2O
conditions although concentrations were consistently higher in sucrose pulsing conditions (similar to
as was observed with lactate). Between dCDFF conditions, differences could only be confirmed
statistically on day 2 and 4 (P ≤ 0.004). With respect to measurements made within each condition,
no relationship could be found between propionate concentrations and the sample day (P = 0.173).
Figure 6.3.6 (Phosphate PF Concentrations in Comparison by CDFF Condition): Concentrations are expressed in mM quantities. Error bars represent the SD of the sample set (n=3 unless otherwise indicated) and an asterisk (*) indicates a significantly different result (P = 0.050) between sample sets.
Both nitrates and fluorides were not detected in any of the PF samples analysed. This is not to say
that their absence can be confirmed but rather their quantities were BMDL for the CE system (62.48
µM for both nitrate and fluoride; 1.18 ppm F-).
Sodium, potassium, and chloride were all consistently major constitutes of the biofilm PF regardless
of exposure to sucrose or dH2O pulsing. Magnesium was also present in all cases although as a minor
constitutes with respect to the former (Figure 6.3.9a to Figure 6.3.9i). However, for each of the 4
aforementioned ions, no significant differences could be determined between sample days in each
dCDFF unit condition (P ≥ 0.273, P ≥ 0.399, P ≥ 0.174 and P ≥ 164 respectively) or between dCDFF
conditions when results from the same sample days were compared (P ≥ 0.122, P ≥ 0.458, P ≥ 0.303
* (n=2)
0
1
2
3
4
5
6
7
8
9
2 4 6 8
Ph
osp
hat
e C
on
cen
trat
ion
(m
M)
Sample Day
Sucrose Exposure Condition dH2O Exposure Condition

Influence of Sucrose vs. dH2O on In Vitro Biofilm Formation and Sucrose-Induced Acidogenic Capacity | Ch. 6
135
and P ≥ 0.098 respectively) although some exceptions were found to exist. On sample day 2, both
potassium (P = 0.032) and chloride (P = 0.010) were higher following exposure to sucrose than in
samples taken from the biofilms which were exposed to dH2O condition.
Ammonia was abundant within all biofilms (between 3 and 8 mM) however, as with many of the
other analytes, no relationship could be determined for this particular sample set either between
dCDFF conditions (P = 0.232) or between samples days within conditions (P = 0.342).
Figure 6.3.7 (Butyrate PF Concentrations in Comparison by CDFF Condition): Concentrations are expressed in mM quantities. Error bars represent the SD of the sample set (n=3 unless otherwise indicated) and an asterisk (*) indicates a significantly different result (P = 0.050) between sample sets.
Butyrate was also detected in all PF samples however at much lower concentrations (between 250
and 950 µM) although, similarly to phosphate, butyrate peaks emerged within a region of the
sample traces which was subject to interference. Nonetheless, statistical comparisons were applied
and, not surprisingly, found no significant difference between sample days in the sucrose exposure
condition (P = 0.864) but did in PF samples collected from biofilms under dH2O exposure (P = 0.001).
Post-hoc testing revealed a significant increase between days 4 and 6 (P = 0.006) followed by a
decrease between days 6 and 8 (P 0.003). Between sample conditions butyrate was determined as
higher in the samples extracted from the dH2O condition on sample day 6 only (P = 0.028). Both of
these observations pointed to a relative peak in butyrate concentration at this point (Figure 6.3.7).
*
0.0
0.2
0.4
0.6
0.8
1.0
1.2
2 4 6 8
Bu
tyra
te C
on
cen
trat
ion
(µ
M)
Sample Day
Sucrose Exposure Condition dH2O Exposure Condition

Influence of Sucrose vs. dH2O on In Vitro Biofilm Formation and Sucrose-Induced Acidogenic Capacity | Ch. 6
136
Calcium was present in all of PF samples which were analysed. Furthermore, calcium was relatively
higher in samples taken from the sucrose exposure conditions (Figure 6.3.8). These results were able
to be confirmed statistically (P ≤ 0.039) with the only exception being samples taken on the 8th day.
In this instance, statistical tests could not be applied as only a single data point was available for
calcium within the PF sampled from the dH2O exposure condition. This was due to a major system
failure during the CE analysis. Traces were obtained for the rejected samples clearly indicating the
presence of calcium however an electrical fault led to an inconsistent current during the latter end
of cation separations (Figure 4.3.4) and therefore calcium peaks could not be integrated to any real
degree of accuracy. For the results which were obtained, comparisons across sample days within
each condition revealed a somewhat variable but non-significant trend (P ≥ 0.123). However, system
performance was not an issue during these separations.
Figure 6.3.8 (Calcium PF Concentrations in Comparison by CDFF Condition): Concentrations are expressed in mM quantities. Error bars represent the SD of the sample set (n=3 unless otherwise indicated). An asterisk (*) indicates a significant difference (P < 0.050) between dCDFF conditions.
Data for all analytes are presented below in Figure 6.3.9a to Figure 6.3.9i. Within these diagrams the
relative composition of the PF extracted from each condition and at each time point is presented in
their relative proportions within each biofilm. As is evident from these illustrations, a degree of
variation occurred within dCDFF conditions over the course of the experiment although several
consistent trends can be seen in the principle components described above.
(n = 2) (n = 2)
(n = 2)
(n = 1)
0
1
2
3
4
5
6
7
8
9
10
2 4 6 8
Cac
lium
Co
nce
ntr
atio
n (
mM
)
Sample Day
Sucrose Exposure Condition dH2O Exposure Condition
*
*
*

Influence of Sucrose vs. dH2O on In Vitro Biofilm Formation and Sucrose-Induced Acidogenic Capacity | Ch. 6
137
Figure 6.3.9a (Plaque Fluid Composition at 2 Days; 7 min after a 100 mM Sucrose Pulse): All detectable analytes are shown in their relative contributions to the plaque fluid composition 7 minutes after a 15 minute sucrose pulse. Concentrations (Mean ± SD; µM) for each are listed adjacent to the segment labels. Nitrate and fluoride were not detected within any of the samples analysed.
Figure 6.3.9b (Plaque Fluid Composition at 2 Days; 7 min after a dH2O Pulse): All detectable analytes are shown in their relative
contributions to the plaque fluid composition 7 minutes after a 15 minutes dH2O pulse. Concentrations (Mean ± SD; µM) for each are
listed adjacent to the segment labels. Nitrate, fluoride, formate and succinate were not detected within any of the samples analysed.
Acetate (1582.16 ± 759.51)
Ammonium (4046.99 ± 846.42)
Butyrate (278.08 ± 481.65)
Calcium (7173.00 ± 1447.7)
Chloride (6106.25 ± 882.50)
Formate (845.25 ± 341.97)
Lactate (20756.14 ± 3011.3)
Magnesium (204.16 ±
67.25)
Phosphate (1080.04 ±
258.79)
Postassium (4543.38 ± 985.24)
Propionate (1881.36 ± 320.37)
Sodium (7975.83 ± 1660.4)
Succinate (219.14 ± 37.41)
Sulphate (236.25 ±
22.71)
Day 2 (Sucrose)
Acetate (3319.41 ± 162.83)
Ammonium (4392.52 ± 1565.8)
Butyrate (326.47 ± 39.03)
Calcium (1089.04 ± 366.23)
Chloride (2899.66 ± 846.29)
Lactate (581.43 ± 355.73)
Magnesium (110.16 ±
35.11)
Phosphate (2660.41 ± 874.06)
Postassium (2453.20 ± 535.80)
Propionate (256.99 ± 17.29)
Sodium (5345.00 ± 1632.6)
Sulphate (102.45 ± 35.63)
Day 2 (dH2O)

Influence of Sucrose vs. dH2O on In Vitro Biofilm Formation and Sucrose-Induced Acidogenic Capacity | Ch. 6
138
Figure 6.3.9c (Plaque Fluid Composition at 4 Days; 7 min after a 100 mM Sucrose Pulse): All detectable analytes are shown in their relative contributions to the plaque fluid composition 7 minutes after a 15 minute sucrose pulse. Concentrations (Mean ± SD; µM) for each are listed adjacent to the segment labels. Nitrate and fluoride were not detected within any of the samples analysed.
Figure 6.3.9d (Plaque Fluid Composition at 4 Days; 7 min after a dH2O Pulse): All detectable analytes are shown in their relative
contributions to the plaque fluid composition 7 minutes after a 15 minutes dH2O pulse. Concentrations (Mean ± SD; µM) for each are
listed adjacent to the segment labels. Nitrate, fluoride, formate and succinate were not detected within any of the samples analysed.
Acetate (5297.43 ± 6817.3)
Ammonium (3416.59 ± 1078.0) Butyrate
(363.76 ± 284.05)
Calcium (5367.91 ± 285.72)
Chloride (7182.23 ± 7113.2)
Formate (1328.81 ± 1552.1)
Lactate (10793.64 ± 8336.3)
Magnesium (218.88 ±
13.05)
Phosphate (2129.40 ± 988.71)
Postassium (3840.09 ± 173.05)
Propionate (2202.41 ± 1479.4)
Sodium (6425.02 ± 984.35)
Succinate (133.67 ± 7454.6)
Sulphate (242.38 ± 159.58)
Day 4 (Sucrose)
Acetate (9233.34 ± 1390.9)
Ammonium (6375.36 ± 3206.7)
Butyrate (482.58 ± 190.85)
Calcium (2543.83 ± 763.17)
Chloride (11932.18 ± 6690.4)
Lactate (391.74 ± 678.51)
Magnesium (270.38 ± 176.06)
Phosphate (1944.51 ±
589.04)
Postassium (9843.649395.4)
Propionate (608.85 ± 168.56)
Sodium (11914.15 ± 6664.9)
Sulphate (361.25 ± 157.60)
Day 4 (dH2O)

Influence of Sucrose vs. dH2O on In Vitro Biofilm Formation and Sucrose-Induced Acidogenic Capacity | Ch. 6
139
Figure 6.3.9e (Plaque Fluid Composition at 6 Days; 7 min after a 100 mM Sucrose Pulse): All detectable analytes are shown in their relative contributions to the plaque fluid composition 7 minutes after a 15 minute sucrose pulse. Concentrations (Mean ± SD; µM) for each are listed adjacent to the segment labels. Nitrate and fluoride were not detected within any of the samples analysed.
Figure 6.3.9f (Plaque Fluid Composition at 6 Days; 7 min after a dH2O Pulse): All detectable analytes are shown in their relative
contributions to the plaque fluid composition 7 minutes after a 15 minutes dH2O pulse. Concentrations (Mean ± SD; µM) for each are
listed adjacent to the segment labels. Nitrate, fluoride, formate, succinate and lactate were not detected within any samples analysed.
Acetate (3807.71 ± 3594.2)
Ammonium (7278.98 ± 4063.1)
Butyrate (282.66 ± 65.42)
Calcium (5639.22 ± 885.81)
Chloride (7449.13 ± 4648.7)
Formate (1351.92 ± 1373.6)
Lactate (9133.27 ± 7795.6)
Magnesium (377.83 ± 94.25)
Phosphate (3583.38 ± 4228.8)
Postassium (6961.04 ± 4747.9)
Propionate (1561.32 ± 529.83) Sodium
(9721.63 ± 4607.5)
Succinate (282.20 ± 251.45)
Sulphate (255.78 ± 90.37)
Day 6 (Sucrose)
Acetate (8125.37 ± 3889.3)
Ammonium (8662.58 ± 4063.1)
Butyrate (943.51 ± 65.42)
Calcium (1559.90 ± 885.81)
Chloride (7504.09 ± 4948.7)
Magnesium (243.97 ± 173.80)
Phosphate (1792.59 ±
801.18)
Postassium (6136.41 ± 4141.9)
Propionate (718.93 ± 411.18)
Sodium (9228.20 ± 4025.4)
Sulphate (278.33 ± 170.03)
Day 6 (dH2O)

Influence of Sucrose vs. dH2O on In Vitro Biofilm Formation and Sucrose-Induced Acidogenic Capacity | Ch. 6
140
Figure 6.3.9g (Plaque Fluid Composition at 8 Days; 7 min after a 100 mM Sucrose Pulse): All detectable analytes are shown in their relative contributions to the plaque fluid composition 7 minutes after a 15 minute sucrose pulse. Concentrations (Mean ± SD; µM) for each are listed adjacent to the segment labels. Nitrate and fluoride were not detected within any of the samples analysed.
Figure 6.3.9i (Plaque Fluid Composition at 6 Days; 7 min after a dH2O Pulse): All detectable analytes are shown in their relative contributions to the plaque fluid composition 7 minutes after a 15 minutes dH2O pulse. Concentrations (Mean ± SD; µM) for each are listed adjacent to the segment labels. Nitrate, fluoride, formate, succinate and lactate were not detected within any samples analysed.
Acetate (6285.60 ± 4640.2)
Ammonium (8413.28 ± 6993.0)
Butyrate (476.54 ± 222.94)
Calcium (2889.65 ±
2829.1)
Chloride (12413.19 ± 8139.6)
Formate (2705.77 ± 2082.1)
Lactate (9339.08)
Magnesium (407.99 ± 307.56)
Phosphate (1185.17 ±
531.82)
Postassium (9947.98 ± 9322.8)
Propionate (2207.71 ± 847.79)
Sodium (11017.58 ± 8178.8)
Succinate (223.31 ± 23.11)
Sulphate (380.41 ± 210.27)
Day 8 (Sucrose)
Acetate (3886.24 ± 19.78)
Ammonium (3114.46 ± 246.85)
Butyrate (351.20 ± 42.47)
Calcium (994.23 ± 0.00)
Chloride (4893.51 ± 43.74)
Magnesium (128.42 ± 0.00)
Phosphate (734.83 ±
3.82)
Postassium (3935.49 ± 26.13)
Propionate (534.29 ± 9.31) Sodium
(5468.99 ± 3584.5)
Sulphate (198.11 ± 10.44)
Day 8 (dH2O)

Influence of Sucrose vs. dH2O on In Vitro Biofilm Formation and Sucrose-Induced Acidogenic Capacity | Ch. 6
141
6.4.0 Discussion Between either dCDFF conditions, no difference was observed in FA. Initially, this would point to the
conclusion that sucrose exposures had no measureable effect on the ecology of the plaque biofilm
when assessed by viable counts. However, a clear and obvious difference was seen between the
proportions of viable counts of Lactobacillus spp. This group of organisms are highly aciduric and are
able to performed sacchariolytic metabolism with the ultimate production of relatively high pKa
acids such as lactic acid [Marsh and Martin, 2009b; Thomas et al., 1979]. In this respect, their
enrichment within a sucrose pulsing strategy is not surprising as their selection within the biofilm
community can be accounted for by the EPH [Marsh, 2003b]. Therefore, the positive selection of
species such as Lactobacillus spp. are a strong indication that the biofilm within this dCDFF condition
had matured to a possibly cariogenic state. However, cariogenicity and acidogenicity are not
intrinsically linked. Simply the presence of a greater proportion of acidogenic species does not
necessarily mean that the pH of the biofilm would be lowered to a point that would affect mineral
dissolution. Buffering within the biofilm [Shellis and Dibdin, 1988], the utilisation of acids substrates
[Marsh and Martin, 2009c], neutralisation from the tissue and the susceptibility of the tissue [Zaura-
Arite et al., 1999; Zaura et al., 2002] may all play significant parts is determining whether or not
carious demineralisation will develop.
Streptococcus spp. also appeared to persist in higher numbers when sucrose pulsing was employed.
However, the Streptococcus spp. group is not exclusive to the more highly acidogenic microbiota
within the present study. Many different microbes such as Streptococcus salivarius, Streptococcus
mitis and Streptococcus gordonii may be isolated on the MSA media as would more highly
acidogenic species such as Streptococcus mutans and Streptococcus sobrinus. Therefore, the
supposed ecological shift which occurs during the transition to a cariogenic state [Marsh, 2003b]
would not necessarily be captured. The use of a media which would select for the more acidogenic
species would have been a further advantage as this would have helped to identify a proportion of
the Streptococcus spp. group based on their physiological characteristics. Nevertheless, the
enrichment of Streptococcus spp., which was observed in under sucrose pulsing (Figure 6.3.3), may
have been a reflection of an increase in the proportion of acidogenic species which did not occur in
the dH2O condition.
The dCDFF model is effective in controlling the variation between CDFF units [Hope et al., 2012]
however even when the same microcosm inoculum is employed between dCDFF experiments,
variation in the actual biofilms which are produced is a known complication [Sissons, 1997]. In a
sense this can be detrimental to the concept of employing an in vitro system although it has also
been identified that more than one community structure may be stable under the same set of

Influence of Sucrose vs. dH2O on In Vitro Biofilm Formation and Sucrose-Induced Acidogenic Capacity | Ch. 6
142
environmental conditions [Kinniment et al., 1996] and that the imposition of an environmental
influence is likely to exert is effect primarily on the function of the biofilm [Sissons, 1997] with the
changes in species present being dictated by their ability to function.
With this in mind, comparisons can be made between the previous dCDFF experiments which were
conducted under the same conditions (i.e. the FF condition described in Figure 5.2.2). Although the
current experiment was run over a comparatively shorter length of time and with more
concentrated exposures to sucrose, the growth between units was very similar with viable counts
somewhat lower in the present work. This may have been due to the biological variation described
above however the result of these differences on the collective physiological activity of the plaque
biofilm is unknown; this therefore an aspect which should be addressed. On the other hand, the
efficacy of selective culture and viable counts as a measure of the biofilm activity is perhaps another
issue [Pratten et al., 2003b]. The differences which were seen may have been due to the fact that
this technique not ideally suited to assessment of multispecies biofilms [Wade, 2002].
Interest in the use of molecular biology for the assessment and characterisation of biofilms has
increased with the advent of high-throughput techniques and next-generation-sequencing (NGS)
methods [Nyvad et al., 2013; Wade, 2002]. However, as recently pointed out by Nyvad et al. [2013],
major drawbacks are associated with any technique which aims to characterise the cariogenic
potential based solely on the community members present. Associations and, to some extent,
predictions can be made based on the relative diversity of a given community [Takahashi and Nyvad,
2008] but ultimately the discrete identification of community members reveals only species as
defined by their genotype (molecular biology) or partial aspects of phenotype (selective culture and
colony morphology). Thus the analysis of the metabolic end-products and mineral ions within the PF
may be a more appropriate parameter to compare.
6.4.1 Comparative Plaque-Fluid Composition
Measurements made from human plaque fluid samples [Gao et al., 2001; Higham and Edgar, 1989]
show a similar pattern of organic acid production to what was found in the present work with
respect to both acetate and lactate. However, at like times since the point of sucrose exposure (7
min), concentrations measured in vivo were typically higher [Edgar and Higham, 1990]. Lactate, for
example came much closer to that measured by Gao at al. [2001] whereas, within this same
comparison, acetate was less than half of that reported by these same authors. This is not an
uncommon finding as the preparation procedure is known to alter the measured composition of the
PF [Margolis and Moreno, 1994] and to this end, the PF extraction procedure was most similar to

Influence of Sucrose vs. dH2O on In Vitro Biofilm Formation and Sucrose-Induced Acidogenic Capacity | Ch. 6
143
that performed by Higham and Edgar [1989]. Therefore, comparisons made to studies which
employed these particular separation methods would be the most appropriate to make.
It is not possible to say to what extent the use of this particular model had on the measured PF
composition and unfortunately, PF analysis has not yet been performed on other CDFF biofilms.
Although recently, Zaura et al. [2011] were able to produce biofilms under strikingly similar
conditions and with an investment also made in measuring the metabolic activity of the microcosm
community. One significant drawback of this study was the analysis of homogenised cells in relation
to total protein content as opposed to direct analysis of the PF. This was done due to the necessity
of a high-throughput assay however inter-cellular organic acids (Figure 6.4.1) would not contribute
to the DS of the PF with respect to enamel mineral. Therefore, although a representation of
metabolic activity was achieved, it is not directly applicable to the caries process. In the present
work, the actual composition of the PF was quantified and even given that this would be secondary
to the measurement of substratum mineral content [Zaura et al., 2011], the true acidogenicity of the
biofilms was in fact captured [Edgar and Higham, 1990].
Figure 6.4.1 (Pyruvate Catabolism): Possible degradation pathways for the formation of Ethanol, Acetate, Succinate, Formate and Lactate are illustrated along with a simplified view of the TCA cycle. Contributing enzymes and energy currency molecules are given in italics (PK: Pyruvate Kinase; PDH: Pyruvate Dehydrogenase; TPP: Thiamine-Pyrophosphate; NAD: Nicotinamide-Adenine-Dinucleotide; FAD: Flavin-Adenine-Dinucleotide; PCA: Pyruvate-Carboxylase; ADH: Alcohol-Dehydrogenase; ACK: Acetate-Kinase; LDH: Lactate-Dehydrogenase).
As expected, a clear increase in lactate production was found between the sucrose exposure
condition when compared to the dH2O exposure condition (Figure 6.3.4). What is less easily
understood is the trend showing a gradual decrease in lactate production over the course of the
experiment. Final pH was not measured but the production of lactate could be indicative of the pH
that would occur however this would indicate a contradiction with reports which have shown multi-
species biofilms to increase in acidic waste products over a similar period of time [Bradshaw et al.,
1989]. Interestingly though, it is possible that this was due to existence in the biofilm state. A

Influence of Sucrose vs. dH2O on In Vitro Biofilm Formation and Sucrose-Induced Acidogenic Capacity | Ch. 6
144
relationship based around fluid transfer between the PF and the STGM may be able to explain these
results to some extent.
With decreased access to salivary exchange, the pH of a biofilms is thought to remain lower for
longer [Hudson et al., 1986; Pratten and Wilson, 1999]. If the concentration of lactate is taken to be
reflective of the acidity of the biofilm, the gradual reduction in PF lactate during the enrichment of
acidogenic species (Lactobacillus spp. and Streptococcus spp.) may be explained by the reverse of
the situation observed by Pratten and Wilson [1999] and Hudson et al. [1986]; an increased transfer
between the STGM and the biofilm PF. In theory, the effect of the rinsing the biofilm with the
sucrose solution (or dH2O) [Vogel et al., 2001] may have reduced the concentration of soluble
species within the PF although it should be remembers that other factors may have contributed.
Pratten and Wilson [1999] conducted a series of extremely similar CDFF experiments under exposure
to sucrose solution (29.21 mM). During these investigations the pH of the biofilm decreased steadily
over an 8 day period. Therefore, the logical conclusion would be that the organic acids present
within the PF (or the proportion of low-pKa acids) had increased. However, the present work
indicates that lactate production or retention decreases over this same period. The persistency of
the lower pH observed by Pratten and Wilson [1999] may thus be a combined effect of a decrease in
acid production with a further decrease in the proportion of microbial cells to EPS matrix [Cury et al.,
1997]. As the proportion of cells within the biofilm decrease as can the buffering capacity of the
biofilm [Leme et al., 2006; Margolis and Moreno, 1994; Shellis and Dibdin, 1988] and in this case the
net result would be that the biofilm pH would remain the same. There is however no direct evidence
of this in the present work, observations were made on the biofilms produced under either
conditions and the concept that enhanced sucrose exposure increased EPS matrix formation is
perfectly plausible [Russell, 2009] but would need further corroboration.
Quantification of these bacteria or others such as Wolinella spp. [Simon et al., 2006] or Veillonella
spp. which are known to be involved in cross-feeding [Marsh and Martin, 2009c; Spratt and Pratten,
2003] would have possibly shed further light on the observed results. The fact that lactate was found
in small quantities during the early phase of the dH2O condition but dropped BMDL from the 4th day
onwards could be an indication of the accumulation of microorganisms which are able to metabolise
lactate (such as the increase in Veillonella spp. which has previously occurred; Figure 5.3.5)
Regrettably, Veillonella spp. were not isolated during the present study. Nevertheless, the CDFF
model provides a high number of samples in comparison to other models [Dibdin and Wimpenny,
1999; Wilson, 1999] there are limitations which are exacerbated by the use of a physically smaller
dual model [Hope et al., 2012]. In each instance that the model is run, a decision must be made as to

Influence of Sucrose vs. dH2O on In Vitro Biofilm Formation and Sucrose-Induced Acidogenic Capacity | Ch. 6
145
which parameters are measured and which are not. In order to provide the most comprehensive
view, a reduction in the number of sampling occasions and, hence, a reduction in the resolution of
the data is inevitably the result.
An indication was also seen in that acetate was lower in the biofilms which had been exposed to
sucrose (Figure 6.3.5) and several theories exist which may be able to explain this observation. A
switch from homo- to hetero-fermentative metabolism under the exposure to sucrose [Thomas et
al., 1979], loss of the lower pKa acid through diffusion into the enamel tissue [Featherstone and
Rodgers, 1981; Geddes et al., 1984] or changes in the undefined ecology of the plaque biofilm may
have been responsible. In reality, each of these factors may have contributed however what is
alluded to is the importance of the organic acid buffer system within dental plaque [Shellis and
Dibdin, 1988]. The acidity generated by lower-pKa acids such as lactic acid is buffered by higher-pKa
acids such as acetate, propionate, succinate and butyrate [Higham and Edgar, 1989; Margolis et al.,
1985]. An elevated level of the latter 4 in the dH2O conditions would therefore indicated a less
cariogenic state of these biofilms. It should also be noted that formate was detected in the sucrose
exposure conditions but not in biofilms which were exposed to dH2O. Formate was present in very
low concentrations so its contribution to the acidity of the biofilm is not likely to be significant
however this may be an indication of an alteration in the ecology of the biofilm community. Formate
production may support the growth of Wolinella spp. [Simon et al., 2006] or likewise its absence
from the PF sample may indicate metabolism by a fraction of Wolinella spp. which has become
established in the absence of sucrose pulsing. Selective isolation of such a group would be necessary
in order to confirm such a relationship.
Nitrate was not detected within any of the samples which were analysed. This result is not surprising
as the nitrate content of the STGM was determined as BMDL (Section 4.3.2.1) and the same fact was
true for fluoride. Both of these findings were expected as neither was introduced into the system.
On the other hand, sulphate was introduced from the STGM (Figure 4.3.2) however no significant or
observed difference could be found between dCDFF conditions or within conditions on consecutive
sample days. It is possible that some trace amounts of sulphate or nitrate would be present or that
the catabolic breakdown organic components may have resulted in its detection in the PF. In order
to confirm such a relationship, a more accurate detection method would be needed.
Factors other than the acidogenicity of plaque biofilms have been identified as possible contributors
to the caries process. The retention of inorganic ions within the plaque biofilm has also been
proposed as one possible contributing factor [Cury et al., 2000]. Heightened levels of calcium can be
explained on the basis of substratum or plaque mineral dissolution [Gao et al., 2001; Vogel et al.,

Influence of Sucrose vs. dH2O on In Vitro Biofilm Formation and Sucrose-Induced Acidogenic Capacity | Ch. 6
146
2000] or the direct release of bound calcium from biofilm bacteria themselves [Rose et al., 1993] and
this coincides well with the increase in lactate production under exposure to sucrose. The same is
true for magnesium which may also exist within the same reservoirs however the detected PF
concentrations of this particular analyte were too low to make any solid inference.
PF phosphate was measured as extremely low but this was comparable to that which was found in
the STGM (Figure 4.3.6). Interference did occur around the separation of phosphate peaks and this
could have contributed to the lower readings although the interference was compensated by the
analysis software and therefore the discrepancy between this measurement and that found by other
researchers [Gao et al., 2001; Margolis and Moreno, 1994] is most likely due to the CDFF system as
opposed to the analysis method. The lower levels of PF phosphate have been explained on the basis
of metabolic activity of the microbes within the biofilm [Higham, 1986] and. as the biofilms within
these experiments were in an highly active state (as indicated by viable counts), this may be a
suitable conclusion. However, potassium and chloride were also markedly lower than what would be
expected from in vivo plaque [Margolis and Moreno, 1994]. Sodium was relatively “normal” in this
sense [Margolis and Moreno, 1994] but each was extremely similar to the STGM (Figure 4.3.5). It has
also been proposed that in vivo plaque is not in complete equilibrium with bulk saliva due to the
occurrence of a shallow slow-moving film [Dibdin et al., 1986] but, in the CDFF, the rotating
mechanism forces the continued flow of STGM and so may attain equilibrium with the bulk solution
more readily. Conversely, discrepancies may have resulted from the use of different extraction and
quantification methods [Margolis and Moreno, 1994]. In this sense, the results presented within this
chapter are the first of their kind and further work would be needed in order to compare these
results to natural in vivo biofilms.
Given the fact that urea was not included within the STGM, an appreciable amount of ammonia was
nonetheless produced by biofilms grown under both conditions. The production of ammonia can
result from the metabolism of arginine via the arginine deaminiase pathway [Wijeyeweera and
Kleinberg, 1989a, b] and it has been implicated in reducing the severity of the cariogenic challenges
following exposure to carbohydrate [Higham, 1986]. Furthermore, the production of ammonia
within natural plaque may take over an hour to occur [Margolis and Moreno, 1994] so in a sense it
was not expected within the PF samples as these were taken following a 15 min sucrose pulse and
from biofilms which had previously rested for 2 h. The fact that ammonia was found under both
dCDFF conditions indicates its production was not in response to exposure strategy used (Figure
6.2.2) but rather that an available nitrogen source was metabolised by members of the microcosm
community on the basis of capacity alone.

Influence of Sucrose vs. dH2O on In Vitro Biofilm Formation and Sucrose-Induced Acidogenic Capacity | Ch. 6
147
6.5.0 Conclusions Organic acid, anion and cation analysis of the PF provide a detailed view of the metabolic activity of
biofilms under exposure to sucrose. Analysis on the basis of viable counts was, however, much less
effective in determining the cariogenicity of the community. Nevertheless, in conjunction with
analysis of the PF composition, monitoring the microbial community present complements results
and the conclusions which are be drawn. Ultimately, quantification of the microbiota present
enables these in vitro biofilms to be related accurately to natural in vivo plaque. Therefore, these
methods should be applied in conjunction whenever possible.
In addressing the initial aim, the response of the biofilms produced within the dCDFF were extremely
similar to the natural plaque biofilms. Under exposure to sucrose, an increase in low-pKa acids
occurred at the expense of the extent of high-pKa acids. Inorganic ions also indicated a response
which was consistent with demineralisation of the mineral substratum as a result of an acidic PF
environment. However, as indicated by the difference in viable counts between the present work
and previous endeavours (Section 5.3.1), issues with the reproducibility of microcosm plaque should
be addressed. However, further sampling occasions can address this issue, particularly with the
inclusion of enamel substrata for analysis of demineralisation and thus confirmation of cariogenicity.
Ultimately, the cariogenicity of a biofilm is defined by its ability to produce carious demineralisation.
Therefore, the current set of sample points should be reduced to make way for further samples
which would enable quantification of the degree of substratum mineralisation. Nevertheless, the
dCDFF model appears effective in producing orally relevant in vitro biofilms for the study of the
processes which lead to dental caries.

148
Chapter 7: Bi-Circadian NaF vs. dH2O Exposures, Sucrose-Induced
Cariogenic Potential and Enamel Demineralisation.
7.1.0 Introduction The use of fluoride in caries control and prevention is generally accepted as the most effective
means of combating the disease currently available [Marinho, 2009; NIH, 2001; Rethman et al.,
2011]. Essentially, the ability of fluorides to recued and reverse caries is due to the physical
interactions within the enamel mineral [Robinson, 2009]. However, fluorides also possess some
antimicrobial activity [Bibby and Van Kesteren, 1940; Bowden, 1990; Buzalaf et al., 2011; Marquis,
1995b; van Loveren, 2001] although there is debate over the antimicrobial effect at the levels which
are commonly experienced within the oral cavity [Bradshaw et al., 2002; Bradshaw et al., 1990;
Marsh, 2003a; van Loveren, 2001]. Fluoride is naturally present in saliva but at levels lower than
those needed to sustain a cariostatic effect [Featherstone, 1999]. In reality, the main source of
fluoride is typically provided through the use of dentifrice [Pessan et al., 2011; WHO, 1994] or water
fluoridation [Fawell et al., 2006; Sampaio and Levy, 2011].
The antimicrobial effect of fluoride requires further investigation as within a complex microbial
community where the ecological balance is a principle determiner of the biofilms collective
metabolic activity, sub-lethal concentrations of antimicrobials could disturb the ecological balance
[Duckworth, 2013; Marsh, 2003a; Marsh and Bradshaw, 1997] or the processes involved in
community succession [Marsh, 2011] leading to drastically different community phenotypes. By
inhibiting the metabolism of acidogenic bacteria [Jenkins et al., 1969], a prophylactic effect of
fluoride exposure has also been suggested [Bradshaw et al., 2002] and the presence of a metabolic
inhibitor such as fluoride could thus indirectly deny acidogenic species their selective advantage as
the production of acids would be inhibited [Bowden, 1990].
However, during the initial phases of biofilm formation alterations to the established biofilm
community could result from a related, though essentially non-ecological, process. Inhibition of
energy metabolism would consequently reduce energy available for all cellular processes which
require it [Marquis et al., 2003]. Previous in vitro biological models have not considered the
antimicrobial effect(s) of fluoride exposures on oral biofilms in a way which reflects that which
would occur during normal oral hygiene. Therefore, the previously developed dCDFF model was
applied to the study of cariogenic community development and lesion formation using a generally
recommended (bi-circadian) fluoride exposure strategy [Parnell and O'Mullane, 2013].

Bi-Circadian NaF vs. dH2O Exposures, Sucrose-Induced Cariogenic Potential and Enamel Demineralisation | Ch. 7
149
7.1.1 Aims and Objectives
The reproducibility of in vitro microcosm biofilms will be compared in terms of their microbial
composition over the course of subsequent dCDFF experiments. This aim will be tested through
multiple repetitions of the same experimental procedure using separate microcosm inocula souced
form the same human salivary pool as has been used previously. In addition to this, each individual
dCDFF experiment itself aims to test the specific hypothesis that bi-circadian NaF exposures will
result in a significant alteration in the biofilm community present within either dCDFF unit. The
efficacy of NaF in inhibiting enamel demineralisation will also be tested as an ultimate determiner
biofilm cariogenicity although PF composition both before and after exposure to sucrose will also be
measured as means of gauging the effect of NaF exposures on the collective metabolic activity of the
microcosm biofilms within.

Bi-Circadian NaF vs. dH2O Exposures, Sucrose-Induced Cariogenic Potential and Enamel Demineralisation | Ch. 7
150
7.2.0 Materials and Methods
NaF exposures (300 ppm F-) were investigated in a dCDFF model (described in Section 5.2.2) in
comparison to dH2O. As in Section 5.2.1, biofilms were formed from a pooled human salivary
inoculum. However, in common with Section 6.2.0, enamel was not used as a substratum for all
runs. Two of the dCDFF runs were completed with HA disks (Clarkson Chromatography Products Inc.,
South Willaimsport, PA., USA) included as a sole support for biofilm growth however a third dCDFF
experiment was repeated which also included enamel disks (Modus Laboratories, University of
Reading, Reading, UK) in sufficient numbers to allow for triplicated measurements of the enamel
surface by TMR (Section 2.2.4). Similar to the methods outlined in Section 3.2.4, the orientation of
the enamel sections gained from these experiments was important as each enamel disk consisted of
an area of exposed an unexposed enamel. Prior to initial sectioning, enamel disks were marked with
a small cut made in the side of the disk so that the orientation of the transverse section could be
deciphered during the imaging and analysis stages of TMR.
Figure 7.2.1 (Enamel Disk Painting Process: Smooth Surfaces): a) Bovine enamel disks; b) a 2.5 x 5 mm piece of non-residual masking-tape was placed over one half of the enamel surface; c) the making-tape was smoothed to ensure it met flush with the enamel surface; d) the entire disk was pained in an acid-resistant varnish; c) approximately 15 min was allowed to pass so as that the varnish became tacky; c) the masking-tape “stencil” was removed leaving exactly half of the enamel surface exposed.
Enamel disks were painted in an acid resistant varnish (MaxFactor Nailfinity; Procter and Gamble,
Weybridge, UK) to protect half of the enamel surface during the CDFF runs. The procedure used to
achieve this is illustrated in Figure 7.2.1. Further to this, grooves were also cut into some enamel
disks using a precision diamond wire saw (Model 3241; Well Diamantdrahtsagen GmbH., Mannheim,
Germany). As with those unaltered enamel disks, half of the surfaces with carved groove structures

Bi-Circadian NaF vs. dH2O Exposures, Sucrose-Induced Cariogenic Potential and Enamel Demineralisation | Ch. 7
151
were also covered in varnish, again, to provide a reference area. As shown specifically in Figure
7.2.2, two grooves were cut into each enamel disk and the disk painted so that one groove was
exposed and the other was left covered by the varnish.
Figure 7.2.2 (Enamel Disk Painting Process: Fissured Surfaces): a) Bovine enamel disks; b) two grooves were cut into the enamel surface parallel to the central axis of the enamel disk; c) a 2.5 x 5 mm piece of non-residual masking-tape was cut and placed over one half of the enamel surface; d) the disk was painted in an acid-resistant varnish; c) approximately 15 min was allowed to pass so as that the varnish became tacky; c) the masking-tape “stencil” was removed leaving exactly one half of the enamel surface and one groove exposed.
In experiments where enamel was not included, all five available spaces within each PTFE pan were
filled with HA disks. HA disks were used in triplicate for the enumeration of bacteria by traditional
selective and non-selective culture techniques (Section 5.2.4) on days 2, 4, 6 and 8 of the dCDFF run.
The excess HA disks were either used to allow for discretion in choosing those biofilms which
appeared to be undisturbed for attempted extraction of PF (Section 6.2.2).
CDFF units containing HA disks were sterilised by dry heat in a Memmert UFB500 universal fan oven
(Memmert GmbH., Heilbronn, Germany) for 4 h at 140°C. The depth of HA disks was set to 200 µm
before sterilisation. All silicone tubings, custom-made sample instruments and liquid volumes were
sterilised by autoclaving(121°C, 2200 mBar, 15 min) with the exception of the sucrose-containing
volumes which was sterilised at a lower temperature and pressure (116°C and 1900 mBar). Following
preparation (Figure 7.2.1 and Figure 7.2.2), enamel disks were inserted in PTFE sample pans,
recessed to the chosen depth of 200 µm and sterilised by gamma irradiation for 18 h at 4,000 Gy
(Gammacell 1000; Field Emission, Newbury, UK) and inserted into the CDFF units as described in
Section 5.2.2.1.

Bi-Circadian NaF vs. dH2O Exposures, Sucrose-Induced Cariogenic Potential and Enamel Demineralisation | Ch. 7
152
Sterilisation procedures were performed exactly as is described in Sections 5.2.2.1 respectively and
the design of the dCDFF apparatus was constructed similar to that described in Section 5.2.2 with
the following adaptions. Figure 7.2.4 illustrates the schematic design specifically. In brief, a 50 mM
sucrose solution (Sigma-Aldrich Ltd., Poole, UK) was supplied to both Unit A and Unit B at a flow rate
of 0.38 mL.min-1 as was sterile STGM. Sucrose was pulsed in 8 times daily for 15 min every 2 h of a
16h period over a 24h cycle. Prior to the commencement of this exposure cycle (Figure 7.2.3) the
inoculum was introduced to both units at a flow rate of 0.5 mL.min-1. Further to this sucrose pulsing
strategy, a further NaF (300ppmF-; BDH-Merk Ltd., Poole, UK) or dH2O exposure was fed into the
corresponding unit immediately before and after the sucrose exposure period at a higher flow rate
of 3 mL.min-1 and for a period of 2 min (Figure 7.2.4). Sucrose- and STGM-containing volumes were
isolated from the CDFF vessels by the use of grow-back traps placed after the peristaltic pumps
(101U/R Low Flow Peristaltic Pump; Watson Marlow, Falmouth, UK) however dH2O, NaF and the
inoculum volumes were not isolated by these means.
Apart from the combination of substratum used (enamel and HA or HA alone), one key difference
between the experiments conducted lay in the supply of STGM during the sucrose whether or the
STGM supply continued during the exposure to the sucrose, dH2O or NaF solutions. In conditions
where only HA was used as a substratum for biofilm growth the STGM feed was stopped at times
when sucrose or NaF and dH2O were pulsed in (FF) and in those where enamel was present, the
STGM supply was continuous (CF). Differences between each of the experiments performed are
outlined below in Table 7.2.1.
Experiment HA Disks
Enamel Disks
Plaque-Fluid Extraction
STGM Cycle
TMR (Smooth Surface)
TMR (Fissured Surface)
Bacterial Enumeration
1 Yes No Yes FF No No Yes
2 Yes No Yes FF No No Yes
3 Yes Yes No CF Yes Yes Yes
Table 7.2.1 (Experimental Parameters): Key differences and similarities between each dCDFF experiment. Note all experiments aimed to investigate the effect of x2/day NaF (300 ppm F
-) vs. dH2O exposures on microcosm biofilm growth under x8/day 50 mM sucrose pulses.
Enumeration of biofilm bacteria was performed on sampled at days 2, 4, 6 and 8 for as described in
Section 5.2.3, immediately after the 4th sucrose pulse of the given days cycle (2:00PM). The
community members chosen for identification were: fastidious anaerobes (FAA media
supplemented with 5% defibrinated horse blood; Section 5.2.4.1), MS on (TYCSB; Section 5.2.4.2),
Streptococcus spp. (MSA; Section 5.2.4.3), Lactobacillus spp. (Rogosa agar; Section 5.2.4.4) and
Veillonella spp. (BV agar; Section 5.2.4.5).
PF was extracted from Exp. 1 and Exp. 2 (Table 7.2.1) as described in Section 6.2.2 however the
excess HA disks included in these experiments allowed for samples to be taken both before (n = 3)

Bi-Circadian NaF vs. dH2O Exposures, Sucrose-Induced Cariogenic Potential and Enamel Demineralisation | Ch. 7
153
and following (n = 9) the sucrose exposure on sample days 2, 4, 6 and providing both baseline and
post-sucrose exposure PF sample respectively. Organic acid, anion and cation analysis was
performed as described in Section 6.2.3 and the specifics of the CE analysis method can be found in
Section 4.2.2.
TMR was performed on all enamel disks extracted from Exp. 3 (Table 7.2.1) on sample days 4 and 8
as described in Section 5.2.5 with the exception that prior to initial sectioning, a small groove was
cut into the side of each enamel disk in order to distinguish exposed from un-exposed areas using a
hand-held diamond-coated cutting disk (Skillbond Direct Ltd., High Wycombe, UK) connected to
Marathon-N7 micromotor (Saeyang Microtech, Daegu, Korea). Specifics of the TMR analysis can be
found in Section 2.2.4.
Figure 7.2.3 (dCDFF Pulsing Strategy for both FF and CF Cycles: NaF vs. dH2O): Both dCDFF units (A and B) were subject to a sucrose (50 mM) pulsing strategy which continued over a period of 24 h. Green bars represent the flow of STGM at a rate of 0.38 ml.min
-1. Breaks in
the green bars indicate the cessation of the STGM flow. Red bars represent a 15 min exposure of 50 mM sucrose solution within the 24 h cycle period. Sucrose pulsing occurred every 2 h within 16 h of the 24 h cycle. Blue bars represent a 2 min dH 2O and orange bars represent a 2 min NaF exposure; a) the first 2 experiments adopted a FF STGM cycle; b) the third experiment used a CF STGM supply.

Bi-Circadian NaF vs. dH2O Exposures, Sucrose-Induced Cariogenic Potential and Enamel Demineralisation | Ch. 7
154
Figure 7.2.4 (dCDFF Schematic Set-Up) a: Sterile STGM; b: Sterile 50 mM Sucrose Solution;
c: Peristaltic Pump 3.0 mL.min-1
; d: Peristaltic Pump 0.38 mL.min-1
; e: Peristaltic Pump 0.38
mL.min-1
; f: Sterile dH2O; g: Sterile NaF Solution (300 ppm F-); h: Grow-Back Trap; i:
Peristaltic Pump 0.5 mL.min-1
; j: Y-Connector; k: Inoculum Flask with Magnetic Stirrer; l:
CDFF Unit A; m: CDFF Unit B; n: Effluent; *: 0.3µm Air Filter. Note that pumps “d” were
active 8 times every 2 h for 15 min over a 16 h period of a 24 h cycle.

Bi-Circadian NaF vs. dH2O Exposures, Sucrose-Induced Cariogenic Potential and Enamel Demineralisation | Ch. 7
155
7.3.0 Results
7.3.1 Enumeration of Biofilm Bacteria
Viable counts for FA, Lactobacillus spp., Streptococcus spp. and MS were collected for Exp. 1, Exp. 2
and Exp. 3 and the further group of Veillonella spp. were collected for Exp. 3. Comparing each
experiment together though adjusted multiple comparisons (Tukey’s HSD) revealed many
statistically significant difference between sample points. The vast majority of these differences lay
in comparisons between the FA group with Lactobacillus spp. and Streptococcus spp. occupying and
intermediate position above that of MS. Further to this, the difference between groups at like
sample day and from identical dCDFF conditions did not show any consistent relationships. For
example, when comparing the results for FA viable counts in Exp. 1 to those of Exp. 2 (which shared
like STGM flow cycles) both relative increases and decrease were determined. Results are therefore
presented separately and compared on the basis of growth trends and maturation stages between
dCDFF conditions as opposed to aggregation of the data set as whole.
Figure 7.3.1a (Fastidious Anaerobes in Exp. 1; FA): Biofilms were exposed to 50 mM sucrose pulsing strategy with either dH2O or NaF rinses. Error bars represent the SD of the sample set (n = 3). A single asterisk (*) indicates significantly different results (P < 0.050) between dCDFF conditions and a double asterisk indicates a highly significant difference (P < 0.001).
Viable counts obtained for FA are presented in comparison by dCDFF condition for Exp. 1 (Figure
7.3.2a), Exp. 2 (Figure 7.3.2b) and Exp. 3 (Figure 7.3.2c). Immediately visible is the clear separation of
viable counts taken from biofilms which were grew under the FF STGM supply (Exp. 1 and Exp. 2)
and the complete lack of separation in those which were produced under the CF cycle (Exp. 3).
* *
*
**
7.00
7.20
7.40
7.60
7.80
8.00
8.20
8.40
8.60
8.80
9.00
2 4 6 8
Fast
idio
us
An
aero
be
s (F
A;
Log1
0C
FU.m
m-2
)
Sample Day
Exp 1. dH2O Exp 1. NaF

Bi-Circadian NaF vs. dH2O Exposures, Sucrose-Induced Cariogenic Potential and Enamel Demineralisation | Ch. 7
156
However, even within those which initially exhibited similar trends on the basis of growth curve
separation, completely opposing trends were found. In Exp. 1, counts taken biofilms which were
grown under exposure to NaF were consistently higher (P ≤ 0.006) whereas in Exp. 2, biofilm grown
under exposure to NaF were consistently lower (P ≤ .0008). The growth trends seen each of these
instances were also markedly different. In Exp. 1, no change in viable counts could be determined
across any of the sample days in the dH2O condition (P = 0.066) however in the NaF conditions
significant difference were found (P = 0.005). Multiple comparisons between sample days
determined no change between day 2 and 4 (P = 0.999) followed by a gradual increase towards
maturity. No significant differences were not found between day 4 and 6 (P = 0.476) or 6 and 8 (P =
0.053) but between days 4 and 8 a significant difference was (P = 0.007). Thus, as supported by
visual inspection of the growth trends in Figure 7.3.2, a gradual increase in viable counts occurred
within biofilm which were produced under exposure to NaF.
Figure 7.3.1b (Fastidious Anaerobes in Exp. 2; FA): Biofilms were exposed to 50 mM sucrose pulsing strategy with either dH2O or NaF rinses. Error bars represent the SD of the sample set (n = 3). A single asterisk (*) indicates significantly different results (P < 0.050) between dCDFF conditions and a double asterisk indicates a highly significant difference (P < 0.001).
In Exp. 2 the (Figure 7.3.1b), FA viable counts initially showed some significant difference accross
sample days in both the NaF (P < 0.001) and dH2O (P = 0.049) conditions. However adjusted mutiple
comparrions were unable to determine difference between counts made within the dH2O condition
between any combination of the sample days (P ≥ 0.68). Nevertheless, Figure 7.3.1b appears to
show a trend in which the approach to and establihment of a steady state was achieved. In the NaF
condition a much more erratic growth trend was observed. The only significant difference was an
*
*
** *
7.20
7.40
7.60
7.80
8.00
8.20
8.40
8.60
8.80
9.00
9.20
2 4 6 8
Fast
idio
us
An
aero
be
s (F
A;
Log1
0C
FU.m
m-2
)
Sample Day
Exp 2. dH2O Exp 2. NaF

Bi-Circadian NaF vs. dH2O Exposures, Sucrose-Induced Cariogenic Potential and Enamel Demineralisation | Ch. 7
157
increase between days 4 and 6 (P = 0.06) which was preceeded by a relative starionary period (P =
0.108) and followed by what may be decribed as the same (P = 0.997). However, as noted the
variablilty observed may make estimation of the biolms developmental stages problematic. In
opposition to this, the most concurrent gorwth curves for FA were found in Exp. 3 (Figure 7.3.1c).
In both the NaF and dH2O conditions a sharp increase in FA counts was observed between day 2 and
4 (P < 0.001). In the dH2O condition, this quickly progressed to brief period of time (between days 4
and 6) where no change in viable counts was detected (P = 0.540). In the NaF exposure condition the
decrease in viable counts was found to be statistically significant (P = 0.015) between days 4 and 6.
However, following on from this, between day 6 and 8 viable counts did not decrease significantly
further in the NaF condition (P = 0.254) nor in those biofilms which were produced under the dH2O
exposure condition. In considering the growth trends over a wider period, between days 4 and 8
both conditions showed a significant decrease in viable counts with respect to FA (P ≤ 0.015)
therefore indicating a more gradual transition to an altered state.
Figure 7.3.1c (Fastidious Anaerobes in Exp. 3; FA): Biofilms were exposed to 50 mM sucrose pulsing strategy with either dH2O or NaF rinses. Error bars represent the SD of the sample set (n = 3). And an asterisk (*) indicates a significantly different result (P < 0.050) between sCDFF conditions.
Viable counts for Lactobacillus spp. for Exp. 1, Exp. 2 and Exp. 3 are presented in Figure 7.3.2a,
Figure 7.3.2b and Figure 7.3.2c respectively. In viewing these data, distinct growth trends can be
seen in Exp. 2 and Exp. 3 which differ from that seen in Exp. 1. Although complete separation of
growth the growth trends could be confirmed (P ≤ 0.049), in the dH2O condition of Exp. 1 viable
7.70
7.90
8.10
8.30
8.50
8.70
8.90
9.10
9.30
9.50
2 4 6 8
Fast
idio
us
An
aero
be
s (F
A;
Log1
0C
FU.m
m-2
)
Sample Day
Exp 3. dH2O Exp 3. NaF

Bi-Circadian NaF vs. dH2O Exposures, Sucrose-Induced Cariogenic Potential and Enamel Demineralisation | Ch. 7
158
counts increased linearly between days 2 and 8; at each step significant increases were found (P <
0.001). However, in the NaF condition of this same experiment, no difference between sample days
viable counts made on any of the 4 sample days could be detected (P = 0.051). Over the course of
the experiment, this lead to an enrichment of Lactobacillus spp. in the NaF-free condition of 4 Log10
units where the absolute number of viable Lactobacillus spp. in the dH2O condition surpassed that
within the NaF condition between the 4th and 6th sample days.
Figure 7.3.2a (Lactobacillus spp. in Exp. 1): Biofilms were exposed to 50 mM sucrose pulsing strategy with either dH2O or NaF rinses. Error bars represent the SD of the sample set (n = 3). A single asterisk (*) indicates significantly different results (P < 0.050) between dCDFF conditions and a double asterisk indicates a highly significant difference (P < 0.001).
The results obtained for Exp. 2 and Exp. 3 demonstrated a much more similar relationship in that
mean viable counts were consistently higher in the biofilms which were not exposed to NaF. With
the exception of results obtained on sample day 4 during Exp. 2, this observation was confirmed as
statistically significant throughout (P ≤ 0.035). Further to this, the shape of the growth trends were
also similar to each other (and to that of Exp. 1) for the dH2O exposed conditions. In these instances
the increase in viable counts of Lactobacillus spp. was again progressively significant between each
sample day (P ≤ 0.010). However, data from Exp.3 indicated by the reduction in the gradient of the
growth curve (Figure 7.3.2c) therefore indicating that within these biofilms, the increase of viable
Lactobacillus spp. was captured at a less active point. Viable counts from the dH2O condition in Exp.
2 also produced a slightly sigmoidal curve therefore serving as an indication of either a delay in
reaching full maturity or the influence of some other factor(s) which caused disruption to the
ecological balance of the community.
**
*
*
**
1.10
2.10
3.10
4.10
5.10
6.10
7.10
2 4 6 8
Lact
ob
acill
us
spp
.
Sample Day
Exp 1. dH2O Exp 1. NaF

Bi-Circadian NaF vs. dH2O Exposures, Sucrose-Induced Cariogenic Potential and Enamel Demineralisation | Ch. 7
159
Figure 7.3.2b (Lactobacillus spp. in Exp. 2): Biofilms were exposed to 50 mM sucrose pulsing strategy with either dH2O or NaF rinses. Error bars represent the SD of the sample set (n = 3). A single asterisk (*) indicates significantly different results (P < 0.050) between dCDFF conditions and a double asterisk indicates a highly significant difference (P < 0.001).
Figure 7.3.2c (Lactobacillus spp. in Exp. 3): Biofilms were exposed to 50 mM sucrose pulsing strategy with either dH2O or NaF rinses. Error bars represent the SD of the sample set (n = 3). A single asterisk (*) indicates significantly different results (P < 0.050) between dCDFF conditions and a double asterisk indicates a highly significant difference (P < 0.001).
**
*
*
3.60
4.10
4.60
5.10
5.60
6.10
6.60
7.10
2 4 6 8
Lact
ob
acill
us
spp
. (Lo
g10
CFU
.mm
-2)
Sample Day
Exp 2. dH2O Exp 2. NaF
*
**
**
**
4.10
4.60
5.10
5.60
6.10
6.60
7.10
7.60
2 4 6 8
Lact
ob
acill
us
spp
. (Lo
g10
CFU
.mm
-2)
Sample Day
Exp 3. dH2O Exp 3. NaF
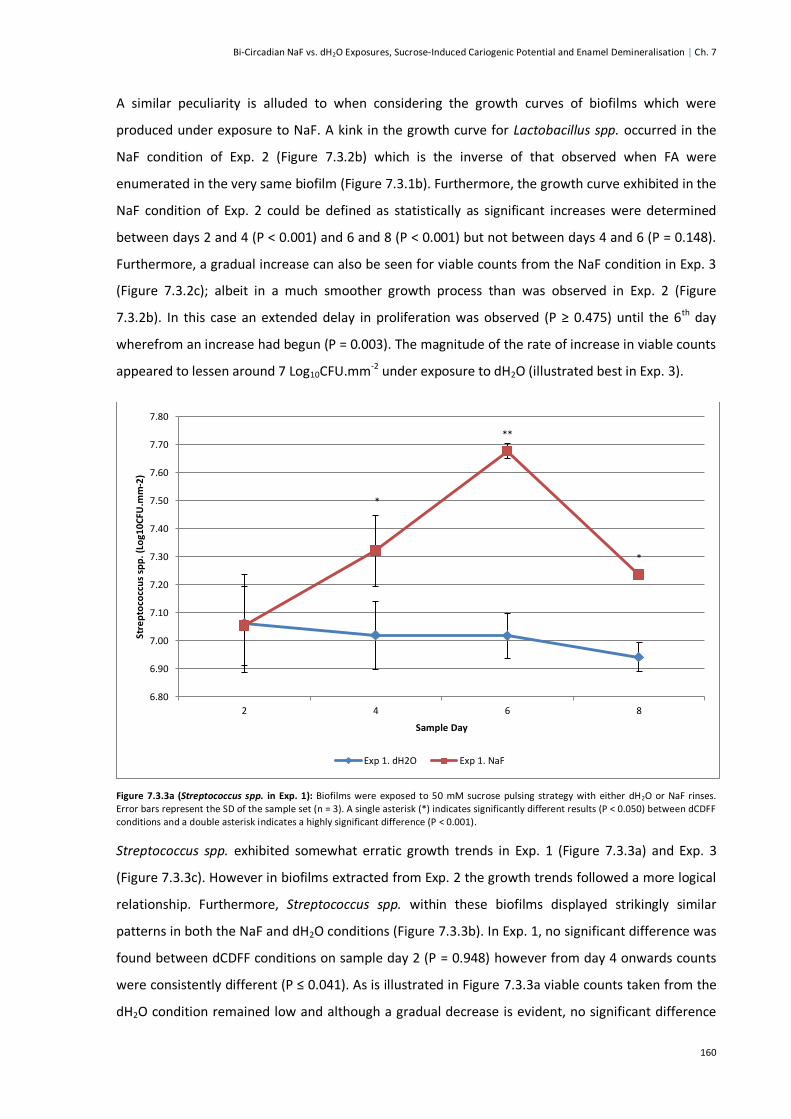
Bi-Circadian NaF vs. dH2O Exposures, Sucrose-Induced Cariogenic Potential and Enamel Demineralisation | Ch. 7
160
A similar peculiarity is alluded to when considering the growth curves of biofilms which were
produced under exposure to NaF. A kink in the growth curve for Lactobacillus spp. occurred in the
NaF condition of Exp. 2 (Figure 7.3.2b) which is the inverse of that observed when FA were
enumerated in the very same biofilm (Figure 7.3.1b). Furthermore, the growth curve exhibited in the
NaF condition of Exp. 2 could be defined as statistically as significant increases were determined
between days 2 and 4 (P < 0.001) and 6 and 8 (P < 0.001) but not between days 4 and 6 (P = 0.148).
Furthermore, a gradual increase can also be seen for viable counts from the NaF condition in Exp. 3
(Figure 7.3.2c); albeit in a much smoother growth process than was observed in Exp. 2 (Figure
7.3.2b). In this case an extended delay in proliferation was observed (P ≥ 0.475) until the 6th day
wherefrom an increase had begun (P = 0.003). The magnitude of the rate of increase in viable counts
appeared to lessen around 7 Log10CFU.mm-2 under exposure to dH2O (illustrated best in Exp. 3).
Figure 7.3.3a (Streptococcus spp. in Exp. 1): Biofilms were exposed to 50 mM sucrose pulsing strategy with either dH2O or NaF rinses. Error bars represent the SD of the sample set (n = 3). A single asterisk (*) indicates significantly different results (P < 0.050) between dCDFF conditions and a double asterisk indicates a highly significant difference (P < 0.001).
Streptococcus spp. exhibited somewhat erratic growth trends in Exp. 1 (Figure 7.3.3a) and Exp. 3
(Figure 7.3.3c). However in biofilms extracted from Exp. 2 the growth trends followed a more logical
relationship. Furthermore, Streptococcus spp. within these biofilms displayed strikingly similar
patterns in both the NaF and dH2O conditions (Figure 7.3.3b). In Exp. 1, no significant difference was
found between dCDFF conditions on sample day 2 (P = 0.948) however from day 4 onwards counts
were consistently different (P ≤ 0.041). As is illustrated in Figure 7.3.3a viable counts taken from the
dH2O condition remained low and although a gradual decrease is evident, no significant difference
*
**
*
6.80
6.90
7.00
7.10
7.20
7.30
7.40
7.50
7.60
7.70
7.80
2 4 6 8
Stre
pto
cocc
us
spp
. (Lo
g10
CFU
.mm
-2)
Sample Day
Exp 1. dH2O Exp 1. NaF

Bi-Circadian NaF vs. dH2O Exposures, Sucrose-Induced Cariogenic Potential and Enamel Demineralisation | Ch. 7
161
were found between nay of the sample point within this condition (P = 0.665). In the NaF condition
of this same experiment a very different trend was observed in viable counts. In this instance a
consistently significant increase occurred between each of the sample days up unit day 6 (P ≤ 0.036)
where a sudden decrease occurred (P = 0.002).
In both Exp. 2 and Exp. 3 viable Streptococcus spp. counts were closely related between dCDFF
conditions. As illustrated in significant difference were found between viable counts taken on
sample days 2 (P < 0.001) and 6 (P = 0.023) in Exp. 2 and on sample day 8 in Exp. 3 (P = 0.049).
However, regardless of these statistical differences growth curves clearly show a great deal of
similarity. In Exp. 2, an increase in counts was found between 2nd and 4th within samples extracted
from the NaF condition (P = 0.023). The levels of viable community members then continued to a
relatively steady-state between days 4 and 6 (P = 0.167) however following this a significant increase
occurred between days 6th and 8th sample days (P < 0.001). In the dH2O condition a more increase in
viable counts was observed in the earlier stages of the experiment; this only reaching significance
between sample days 2 and 6 (P = 0.016). However, in close concordance with the NaF condition, a
significant increase was achieved between days 6 and 8 (P < 0.001). On the whole, biofilms which
were exposed to NaF were composed of comparatively less Streptococcus spp. than those which
were not however the differences between each were of a relatively small magnitude.
Figure 7.3.3b (Streptococcus spp. in Exp. 2): Biofilms were exposed to 50 mM sucrose pulsing strategy with either dH2O or NaF rinses. Error bars represent the SD of the sample set (n = 3). A single asterisk (*) indicates significantly different results (P < 0.050) between dCDFF conditions and a double asterisk indicates a highly significant difference (P < 0.001).
**
*
6.20
6.40
6.60
6.80
7.00
7.20
7.40
7.60
7.80
8.00
8.20
2 4 6 8
Stre
pto
cocc
us
spp
. (Lo
g10
CFU
.mm
-2)
Sample Day
Exp 2. dH2O Exp 2. NaF

Bi-Circadian NaF vs. dH2O Exposures, Sucrose-Induced Cariogenic Potential and Enamel Demineralisation | Ch. 7
162
Figure 7.3.3c (Streptococcus spp. in Exp. 3): Biofilms were exposed to 50 mM sucrose pulsing strategy with either dH2O or NaF rinses. Error bars represent the SD of the sample set (n = 3) and an asterisk (*) indicates significantly different results (P < 0.050) between dCDFF conditions.
The most unusual results in the Streptococcus spp. growth curves obtained from Exp. 3 where viable
counts decreased significantly (P ≤ 0.023) in biofilms extracted from both dCDFF condition on day 6.
Furthermore, this decrease was followed by an increase between days 6 and 8 (P ≤ 0.023). In the
dH2O condition the increase in counts between day 2 and 4 was not significant (P = 0.253) but in the
NaF condition the increase was (P = 0.007). However, large deviations in the results obtained on day
4 in the dH2O condition may have reduced the statistical power of the tests which were used to
make these comparisons. In all, what is indicated from the trends in Figure 7.3.3c are what appeared
to be 2 successive phases which were reached similar states on days 4 and 8 (P ≥ 0.898). These
phases were separated by what was suggestive of a period of dispersal although from viable counts
alone a definite conclusion cannot be made for this.
MS formed a subgroup of the Streptococcus spp. and therefore, as expected, viable counts for MS
were consistently lower than those of obtained for Streptococcus spp. However, the relative
proportions of MS to that of the total group changed considerably over the course of the
experiment, in part illustrated by the variability in Streptococcus spp. counts described above in Exp.
1 (Figure 7.3.4a) and Exp. 3 (Figure 7.3.4c), viable counts for MS were greatest in the NaF conditions
however in Exp. 2 the MS proliferated best within the community in the absence of NaF. Further to
this Exp. 1 and Exp. 3 showed greater similarities in the general growth trends which were seen than
that which occurred in Exp. 2.
*
6.90
7.00
7.10
7.20
7.30
7.40
7.50
7.60
7.70
7.80
7.90
2 4 6 8
Stre
pto
cocc
us
spp
. (Lo
g10
CFU
.mm
-2)
Sample Day
Exp 3. dH2O Exp 3. NaF

Bi-Circadian NaF vs. dH2O Exposures, Sucrose-Induced Cariogenic Potential and Enamel Demineralisation | Ch. 7
163
Figure 7.3.4a (Mutans streptococci in Exp. 1; MS): Biofilms were exposed to 50 mM sucrose pulsing strategy with either dH2O or NaF rinses. Error bars represent the SD of the sample set (n = 3). A single asterisk (*) indicates significantly different results (P < 0.050) between dCDFF conditions and a double asterisk indicates a highly significant difference (P < 0.001).
Figure 7.3.4b (Mutans streptococci in Exp. 2; MS): Biofilms were exposed to 50 mM sucrose pulsing strategy with either dH2O or NaF rinses. Error bars represent the SD of the sample set (n = 3). A single asterisk (*) indicates significantly different results (P < 0.050) between dCDFF conditions and a double asterisk indicates a highly significant difference (P < 0.001).
Both of Exp. 1 and 3 demonstrated an initially dissimilar biofilm composition (P ≤ 0.017) which then
reached a state which was statistically indistinguishable between dCDFF conditions on day 4 (P ≥
*
*
**
3.00
3.50
4.00
4.50
5.00
5.50
6.00
6.50
7.00
7.50
2 4 6 8
Mu
tan
s st
rep
toco
cci (
MS;
Lo
g10
CFU
.mm
-2)
Sample Day
Exp 1. dH2O Exp 1. NaF
**
**
**
4.00
4.50
5.00
5.50
6.00
6.50
7.00
7.50
2 4 6 8
Mu
tan
s st
rep
toco
cci (
MS;
Lo
g10
CFU
.mm
-2)
Sample Day
Exp 2. dH2O Exp 2. NaF

Bi-Circadian NaF vs. dH2O Exposures, Sucrose-Induced Cariogenic Potential and Enamel Demineralisation | Ch. 7
164
0.859). Following this point the increase in viable counts continued further in the NaF conditions
(significant increases were found between day 2 and 6; P ≤ 0.001) whereas a clear reduction in the
proportion of viable MS was observed between day 4 and 6 in both of these particular dH2O
conditions (P ≤ 0.001). In the NaF conditions, the initial increase had ceased by the 6th day and viable
counts entered a decline in both Exp. 1 and Exp. 3. However, although this change was numerically
evident it was not determined as significant (P ≥ 0.149). Likewise, following the reduction noted in
dH2O conditions viable counts remained relatively (P ≥ 0.943) stable between the 6th and 8th days of
these experiments (Exp. 1 and Exp. 3).
Figure 7.3.4c (Mutans streptococci in Exp. 3; MS): Biofilms were exposed to 50 mM sucrose pulsing strategy with either dH2O or NaF rinses. Error bars represent the SD of the sample set (n = 3). A single asterisk (*) indicates significantly different results (P < 0.050) between dCDFF conditions and a double asterisk indicates a highly significant difference (P < 0.001).
In Exp. 2 (Figure 7.3.4b) a distinct pattern was seen with respect to viable counts made from the
biofilms produced in the NaF condition. However those extracted from the dH2O condition followed
a trend which was similar in both shape and magnitude to the biofilms which were extracted from
the NaF conditions in Exp. 1 (Figure 7.3.4a) and Exp. 3 (Figure 7.3.4c). In the dH2O conditions an
increase occurred between day 4 and 6 (P < 0.001) following which viable counts remained stable (P
= 0.668). Biofilms in the NaF conditions also showed a progressive increase in the numbers of viable
MS (P ≤ 0.008) up to a point which was equal to that of the dH2O condition (P = 0.153) on the final
day of the experiment.
*
** **
5.00
5.50
6.00
6.50
7.00
7.50
2 4 6 8
Mu
tan
s st
rep
toco
cci (
MS;
Lo
g10
CFU
.mm
-2)
Sample Day
Exp 3. dH2O Exp 3. NaF

Bi-Circadian NaF vs. dH2O Exposures, Sucrose-Induced Cariogenic Potential and Enamel Demineralisation | Ch. 7
165
Figure 7.3.5 (Veillonella spp. in Exp. 3): Biofilms were exposed to 50 mM sucrose pulsing strategy with either dH2O or NaF rinses. Error bars represent the SD of the sample set (n = 3) and single asterisk (*) indicates significantly different results (P < 0.050) between dCDFF conditions.
Viable counts of Veillonella spp. sampled from Exp. 3 (Figure 7.3.5) reached their highest point on
the 4th day of the experiment when under exposure to NaF. This was quickly followed by a reduction
(P = 0.007) somewhere between days 4 and 6 following which a slight increase was again seen by
day 8 (however this did not reach significance; P = 0.311). In biofilms produced under exposure to
dH2O, viable Veillonella spp. within the community increased progressively between days 2 and 4 (P
< 0.001) and days 4 and 6 (P = 0.007). From day 6 onwards counts remained stable (P = 0.900).
Between dCDFF conditions, the oscillation in the trend encountered for viable Veillonella spp. in the
NaF conditions meant that viable counts were sometimes lower and sometimes higher than those
obtained from the dH2O condition. However by the end of this experiment biofilms extracted from
both conditions had reached point which was indistinguishable between units (P = 0.542).
*
*
*
5.00
5.50
6.00
6.50
7.00
7.50
8.00
2 4 6 8
Ve
illo
ne
lla s
pp
. (L
og1
0C
FU.m
m-2
)
Sample Day
Exp 3. dH2O Exp 3. NaF

Bi-Circadian NaF vs. dH2O Exposures, Sucrose-Induced Cariogenic Potential and Enamel Demineralisation | Ch. 7
166
7.3.2 Organic Acid and Anion Analysis
Data for pre- and post-sucrose exposures was obtained from Exp.2. PF extracted on day 2 from both
the NaF and dH2O exposure conditions were analysed along with samples taken from the NaF
condition on day 4. As with previous experiments (such as those described in Section 6.3.3), nitrate
was not detected in any of the PF samples and this was true both before and after sucrose exposures
(MDL = 62.48 µM). Interestingly, both formate and fluoride were not detected in any of the earlier
sampling occasions (those on taken on day 2) but both were detected in the on the 4th day in sample
taken from the NaF condition immediately following a sucrose exposure. In this instance, fluoride
was detected at 0.465 mM ± 0.698SD (8.845 ppm F-) and formate was measured as 0.141 mM ±
0.172SD (Figure 7.3.10f).
Comparing the shift in PF composition following sucrose exposures, acetate (Figure 7.3.8) was
consistently lower (P < 0.001) in both dCDFF conditions and within the dH2O condition acetate was
consistently higher at baseline and following sucrose exposure (P ≤ 0.002) than in the NaF condition.
Between dCDFF conditions, in samples extracted on day 2 acetate was higher in the dH2O conditions
than in those which had undergone exposure to NaF; this was true both before (P < 0.001) and after
(P < 0.001) exposure to the 50 mM sucrose solution.
Figure 7.3.8 (Acetate PF Concentrations): Concentrations are expressed in mM quantities. Error bars represent the SD. For pre-sucrose measurements n = 3 and for post-sucrose measurement n = 9 (unless otherwise indicated) and an asterisk (*) indicates a significant difference (P = 0.050) between pre- and post-sucrose exposures. Solid bars represent PF samples from the NaF condition and cross-hatched bars represent those extracted from the dH2O condition.
(n = 0) (n = 0)
*
* *
0
5
10
15
20
25
30
35
Day 2 (NaF) Day 2 (dH2O) Day 4 (NaF) Day 4 (dH2O)
Ace
tate
Co
nce
ntr
atio
n (
mM
)
Sample Day (Condition)
Acetate (Pre-Sucrose) Acetate (Post-Sucrose)
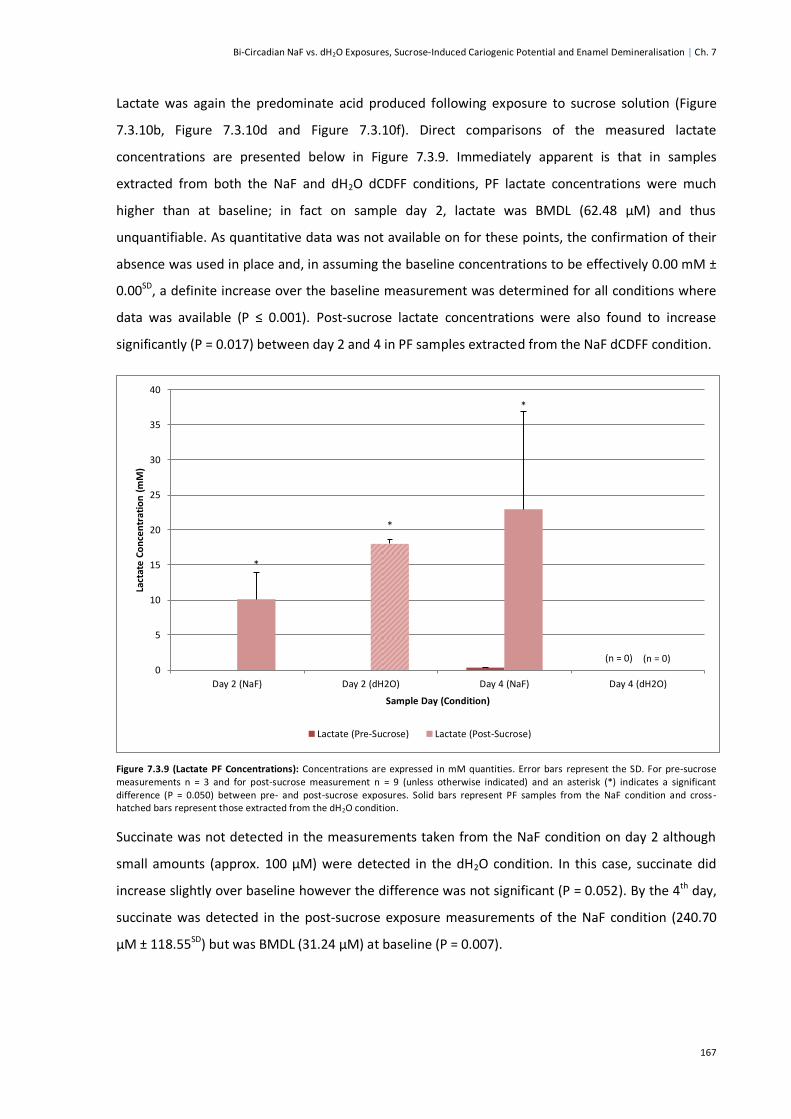
Bi-Circadian NaF vs. dH2O Exposures, Sucrose-Induced Cariogenic Potential and Enamel Demineralisation | Ch. 7
167
Lactate was again the predominate acid produced following exposure to sucrose solution (Figure
7.3.10b, Figure 7.3.10d and Figure 7.3.10f). Direct comparisons of the measured lactate
concentrations are presented below in Figure 7.3.9. Immediately apparent is that in samples
extracted from both the NaF and dH2O dCDFF conditions, PF lactate concentrations were much
higher than at baseline; in fact on sample day 2, lactate was BMDL (62.48 µM) and thus
unquantifiable. As quantitative data was not available on for these points, the confirmation of their
absence was used in place and, in assuming the baseline concentrations to be effectively 0.00 mM ±
0.00SD, a definite increase over the baseline measurement was determined for all conditions where
data was available (P ≤ 0.001). Post-sucrose lactate concentrations were also found to increase
significantly (P = 0.017) between day 2 and 4 in PF samples extracted from the NaF dCDFF condition.
Figure 7.3.9 (Lactate PF Concentrations): Concentrations are expressed in mM quantities. Error bars represent the SD. For pre-sucrose measurements n = 3 and for post-sucrose measurement n = 9 (unless otherwise indicated) and an asterisk (*) indicates a significant difference (P = 0.050) between pre- and post-sucrose exposures. Solid bars represent PF samples from the NaF condition and cross-hatched bars represent those extracted from the dH2O condition.
Succinate was not detected in the measurements taken from the NaF condition on day 2 although
small amounts (approx. 100 µM) were detected in the dH2O condition. In this case, succinate did
increase slightly over baseline however the difference was not significant (P = 0.052). By the 4th day,
succinate was detected in the post-sucrose exposure measurements of the NaF condition (240.70
µM ± 118.55SD) but was BMDL (31.24 µM) at baseline (P = 0.007).
(n = 0) (n = 0)
*
*
*
0
5
10
15
20
25
30
35
40
Day 2 (NaF) Day 2 (dH2O) Day 4 (NaF) Day 4 (dH2O)
Lact
ate
Co
nce
ntr
atio
n (
mM
)
Sample Day (Condition)
Lactate (Pre-Sucrose) Lactate (Post-Sucrose)
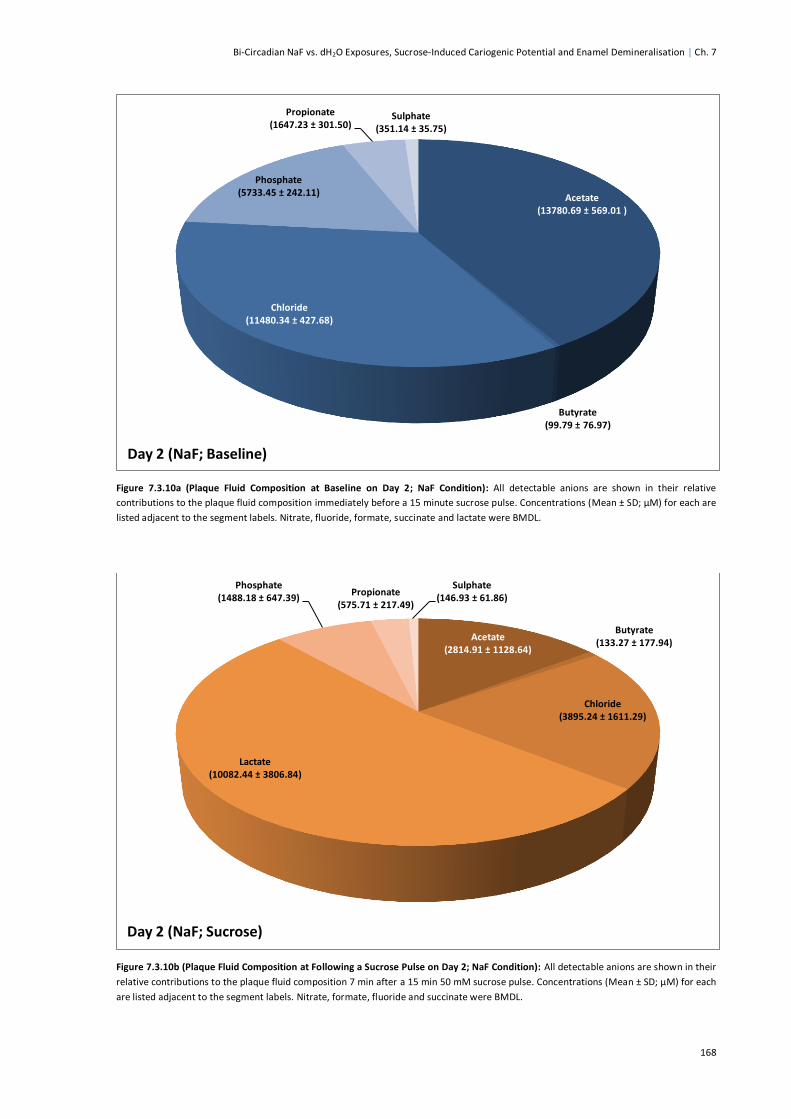
Bi-Circadian NaF vs. dH2O Exposures, Sucrose-Induced Cariogenic Potential and Enamel Demineralisation | Ch. 7
168
Figure 7.3.10a (Plaque Fluid Composition at Baseline on Day 2; NaF Condition): All detectable anions are shown in their relative
contributions to the plaque fluid composition immediately before a 15 minute sucrose pulse. Concentrations (Mean ± SD; µM) for each are
listed adjacent to the segment labels. Nitrate, fluoride, formate, succinate and lactate were BMDL.
Figure 7.3.10b (Plaque Fluid Composition at Following a Sucrose Pulse on Day 2; NaF Condition): All detectable anions are shown in their
relative contributions to the plaque fluid composition 7 min after a 15 min 50 mM sucrose pulse. Concentrations (Mean ± SD; µM) for each
are listed adjacent to the segment labels. Nitrate, formate, fluoride and succinate were BMDL.
Acetate (13780.69 ± 569.01 )
Butyrate (99.79 ± 76.97)
Chloride (11480.34 ± 427.68)
Phosphate (5733.45 ± 242.11)
Propionate (1647.23 ± 301.50)
Sulphate (351.14 ± 35.75)
Day 2 (NaF; Baseline)
Acetate (2814.91 ± 1128.64)
Butyrate (133.27 ± 177.94)
Chloride (3895.24 ± 1611.29)
Lactate (10082.44 ± 3806.84)
Phosphate (1488.18 ± 647.39)
Propionate (575.71 ± 217.49)
Sulphate (146.93 ± 61.86)
Day 2 (NaF; Sucrose)

Bi-Circadian NaF vs. dH2O Exposures, Sucrose-Induced Cariogenic Potential and Enamel Demineralisation | Ch. 7
169
Figure 7.3.10c (Plaque Fluid Composition at Baseline on Day 2; dH2O Condition): All detectable anions are shown in their relative
contributions to the plaque fluid composition immediately before a 15 minute sucrose pulse. Concentrations (Mean ± SD; µM) for each are
listed adjacent to the segment labels. Nitrate, formate, fluoride and lactate were BMDL.
Figure 7.3.10d (Plaque Fluid Composition at Following a Sucrose Pulse on Day 2; dH2O Condition): All detectable anions are shown in
their relative contributions to the plaque fluid composition 7 min after a 15 minute 50 mM sucrose pulse. Concentrations (Mean ± SD; µM)
for each are listed adjacent to the segment labels. Nitrate, formate and fluoride were BMDL.
Acetate (28566.50 ± 594.24)
Butyrate (2293.72 ± 166.94)
Chloride (19687.43 ± 677.37)
Phosphate (9677.46 ± 315.97)
Propionate (1295.10 ± 44.36)
Succinate (92.64 ± 81.33)
Sulphate (828.50 ± 52.71)
Day 2 (dH2O; Baseline)
Acetate (9205.17 ± 2185.72)
Butyrate (1448.52 ±
387.13)
Chloride (6149.92 ± 180.33)
Lactate (18012.87 ± 668.88)
Phosphate (8990.41 ± 2537.8)
Propionate (869.35 ± 164.44)
Succinate (151.13 ± 18.24)
Sulphate (242.11 ± 26.06)
Day 2 (dH2O; Sucrose)

Bi-Circadian NaF vs. dH2O Exposures, Sucrose-Induced Cariogenic Potential and Enamel Demineralisation | Ch. 7
170
Figure 7.3.10e (Plaque Fluid Composition at Baseline on Day 4; NaF Condition): All detectable anions are shown in their relative
contributions to the plaque fluid composition immediately before a 15 minute sucrose pulse. Concentrations (Mean ± SD; µM) for each are
listed adjacent to the segment labels. Nitrate, formate, fluoride and succinate were BMDL.
Figure 7.3.10f (Plaque Fluid Composition at Following a Sucrose Pulse on Day 4; NaF Condition): All detectable anions are shown in their
relative contributions to the plaque fluid composition 7 min after a 15 min 50 mM sucrose pulse. Concentrations (Mean ± SD; µM) for each
are listed adjacent to the segment labels. Nitrate was BMDL.
Acetate (19521.71 ± 897.03)
Butyrate (4310.24 ± 372.07)
Chloride (27434.77 ± 1153.9)
Lactate (335.09 ± 18.96)
Phosphate (10734.83 ± 970.87)
Propionate (1411.32 ± 35.33)
Sulphate (827.30 ± 68.46)
Day 4 (NaF; Baseline)
Acetate (7330.23 ± 3429.0)
Butyrate (1138.72 ± 671.01)
Chloride (19947.11 ± 13040.6)
Flouride (465.53 ± 698.99) Formate
(140.53 ± 171.98)
Lactate (22929.81 ± 14041.7)
Phosphate (5124.65 ±
930.82)
Propionate (1047.61 ± 622.47)
Succinate (240.70 ± 118.55)
Sulphate (604.54 ± 315.91)
Day 4 (NaF; Sucrose)
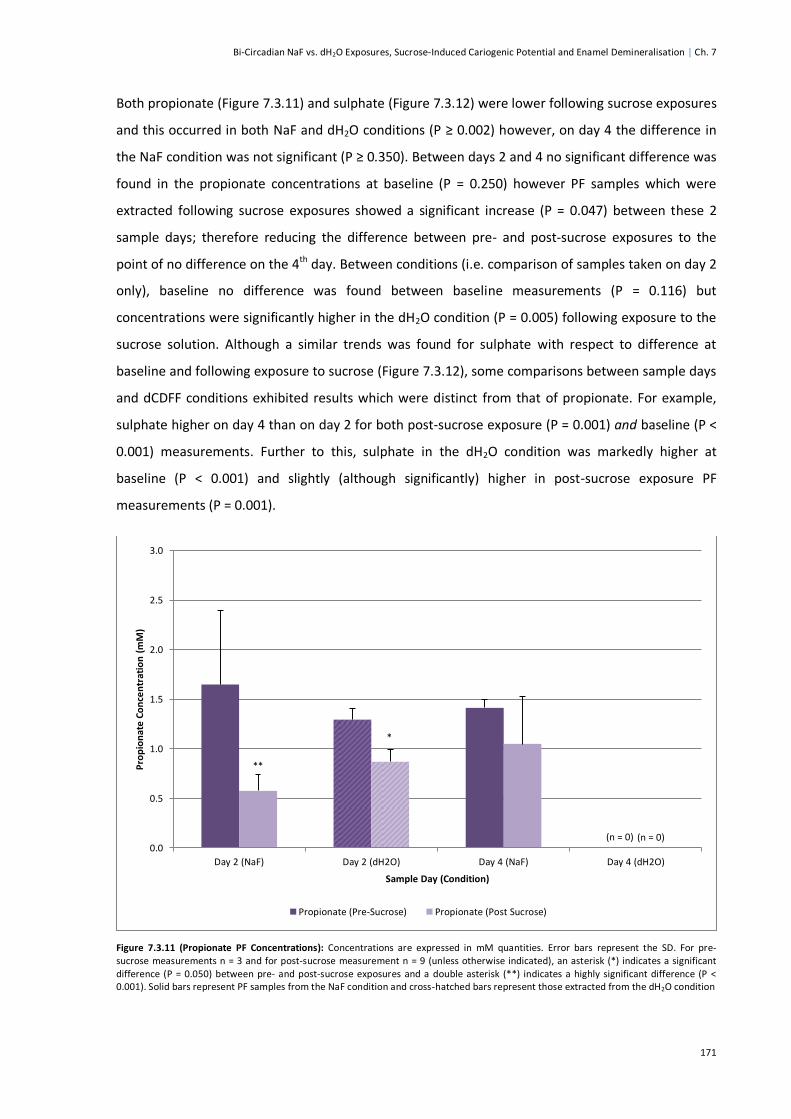
Bi-Circadian NaF vs. dH2O Exposures, Sucrose-Induced Cariogenic Potential and Enamel Demineralisation | Ch. 7
171
Both propionate (Figure 7.3.11) and sulphate (Figure 7.3.12) were lower following sucrose exposures
and this occurred in both NaF and dH2O conditions (P ≥ 0.002) however, on day 4 the difference in
the NaF condition was not significant (P ≥ 0.350). Between days 2 and 4 no significant difference was
found in the propionate concentrations at baseline (P = 0.250) however PF samples which were
extracted following sucrose exposures showed a significant increase (P = 0.047) between these 2
sample days; therefore reducing the difference between pre- and post-sucrose exposures to the
point of no difference on the 4th day. Between conditions (i.e. comparison of samples taken on day 2
only), baseline no difference was found between baseline measurements (P = 0.116) but
concentrations were significantly higher in the dH2O condition (P = 0.005) following exposure to the
sucrose solution. Although a similar trends was found for sulphate with respect to difference at
baseline and following exposure to sucrose (Figure 7.3.12), some comparisons between sample days
and dCDFF conditions exhibited results which were distinct from that of propionate. For example,
sulphate higher on day 4 than on day 2 for both post-sucrose exposure (P = 0.001) and baseline (P <
0.001) measurements. Further to this, sulphate in the dH2O condition was markedly higher at
baseline (P < 0.001) and slightly (although significantly) higher in post-sucrose exposure PF
measurements (P = 0.001).
Figure 7.3.11 (Propionate PF Concentrations): Concentrations are expressed in mM quantities. Error bars represent the SD. For pre-sucrose measurements n = 3 and for post-sucrose measurement n = 9 (unless otherwise indicated), an asterisk (*) indicates a significant difference (P = 0.050) between pre- and post-sucrose exposures and a double asterisk (**) indicates a highly significant difference (P < 0.001). Solid bars represent PF samples from the NaF condition and cross-hatched bars represent those extracted from the dH2O condition
(n = 0) (n = 0)
**
*
0.0
0.5
1.0
1.5
2.0
2.5
3.0
Day 2 (NaF) Day 2 (dH2O) Day 4 (NaF) Day 4 (dH2O)
Pro
pio
nat
e C
on
cen
trat
ion
(m
M)
Sample Day (Condition)
Propionate (Pre-Sucrose) Propionate (Post Sucrose)

Bi-Circadian NaF vs. dH2O Exposures, Sucrose-Induced Cariogenic Potential and Enamel Demineralisation | Ch. 7
172
Figure 7.3.12 (Sulphate PF Concentrations): Concentrations are expressed in mM quantities. Error bars represent the SD. For pre-sucrose measurements n = 3 and for post-sucrose measurement n = 9 (unless otherwise indicated) and a double asterisk (**) indicates a highly significant difference (P < 0.001) between pre- and post-sucrose exposures. Solid bars represent PF samples from the NaF condition and cross-hatched bars represent those extracted from the dH2O condition
No difference in butyrate was found between pre- and post-sucrose exposures on day 2 in the NaF
condition (P = 0.764) but significantly lower concentrations were found post-sucrose exposure in the
dH2O condition (P < 0.005). However, by the 4th day a significant decrease (P < 0.001) was detected
post-sucrose exposure in the NaF condition and this was due to a drastic increase (P < 0.001) in the
baseline concentration (Figure 7.3.10e) from that which was found on day 2 within the same dCDFF
condition (Figure 7.3.10a). Further to this point, the amount of butyrate detected following sucrose
exposures also increased between days 2 and 4 (P = 0.002). However, of the traces obtained,
disambiguation of peaks around the migration time of butyrate was difficult due to an ambiguity of
the traces at this point (as noted for previous PF separations in Section 6.3.3). Correspondingly,
phosphate peaks were confounded by this same difficulty only to much lesser degree.
Integration of the phosphate peaks was performed using the peak disambiguation functions within
the 32 Karat software with automatic baseline assignment (Figure 7.3.13). From these data an
interesting relationship between NaF exposure and post-sucrose phosphate concentrations was
found. Not only were concentrations significantly lower following sucrose exposures in the NaF
conditions (P < 0.001) but this reduction was due to a large decrease (approx. 5.0 mM) from the
baseline measuring which did not occur in the samples extracted from the dH2O condition (P =
0.660). However at baseline, phosphate concentrations were relatively similar between both the
(n = 0) (n = 0)
**
**
0.0
0.2
0.4
0.6
0.8
1.0
1.2
Day 2 (NaF) Day 2 (dH2O) Day 4 (NaF) Day 4 (dH2O)
Sulp
hat
e C
on
cen
trat
ion
(m
M)
Sample Day (Condition)
Sulphate (Pre-Sucrose) Sulphate (Post-Sucrose)

Bi-Circadian NaF vs. dH2O Exposures, Sucrose-Induced Cariogenic Potential and Enamel Demineralisation | Ch. 7
173
NaF and dH2O conditions (although significantly higher in the dH2O condition on sample day 2; P <
0.001). In all cases these baseline phosphate concentrations were much higher than that which was
found in the STGM (Figure 4.3.6). Therefore, an accumulation of phosphate was detected in all PF
samples which were available and a preferential reduction was observed in those which were
subjected to NaF exposures following a cariogenic challenge.
Figure 7.3.13 (Phosphate PF Concentrations): Concentrations are expressed in mM quantities. Error bars represent the SD. For pre-sucrose measurements n = 3 and for post-sucrose measurement n = 9 (unless otherwise indicated) and a double asterisk (**) indicates a highly significant difference (P < 0.001) between pre- and post-sucrose exposures. Solid bars represent PF samples from the NaF condition and cross-hatched bars represent those extracted from the dH2O condition.
As with the majority of analytes mentions thus far, PF chloride content also decreased significantly
following sucrose exposure on the 2nd sample day in both dCDFF conditions (P ≤ 0.001). However, by
the 4th sample day the proportion which was retained following the sucrose exposure had increased
to a point where no significant difference could be found within the NaF condition (P = 0.359).
Between conditions, chloride was relatively higher (P ≤ 0.001) both at baseline (Figure 7.3.10a and
Figure 7.310c) than in post-sucrose exposures (Figure 7.39b and Figure 7.39d). Over time, the mean
chloride content of PF samples from the NaF conditions increased almost double in baseline
measurements (P < 0.001) and over 5 times following exposure to sucrose (P = 0.002).
Unfortunately, the minor CE system failures which lead to the lack of full data sets for the anions
within Exp. 2 became more frequent during subsequent cation separations. As a result of this and
further technical complications, a relative index could not be determined and therefore the traces
acquired were abandoned.
(n = 0) (n = 0)
** **
0.0
2.0
4.0
6.0
8.0
10.0
12.0
14.0
Day 2 (NaF) Day 2 (dH2O) Day 4 (NaF) Day 4 (dH2O)
Ph
osp
hat
e C
on
cen
trat
ion
(m
M)
Sample Day (Condition)
Phsophate (Pre-Sucrose) Phsophate (Post-Sucrose)

Bi-Circadian NaF vs. dH2O Exposures, Sucrose-Induced Cariogenic Potential and Enamel Demineralisation | Ch. 7
174
7.3.3 TMR of dCDFF Exposed Enamel Disks
Out of the 12 enamel disks included in each dCDFF unit (NaF and dH2O exposure conditions of Exp. 3
only), between 2 and 4 thin sections were retained from each of the 6 enamel disks (3 with carved
fissures and 3 with completely smooth enamel surfaces). Measurement made from each of the
exposed surfaces were then aggregated by the individual enamel disk from which they came and
parameters of ΔZ, LD, R and SMax are presented below in Table 7.3.8 in comparison by condition and
the day on which they were extracted from the dCDFF system.
Condition Sample Day n (Enamel Disks) ΔZ ± SD LD ± SD R ± SD SMax ± SD
NaF 4 6 345.04 ± 78.82 14.13 ± 4.02 25.74 ± 2.21 79.03 ± 1.61
dH2O 4 6 308.88 ± 70.52 13.47 ± 3.08 22.92 ± 1.80 74.58 ± 4.49
NaF 8 6 195.83 ± 44.44 8.52 ± 0.95 23.08 ± 3.70 79.55 ± 2.16
dH2O 8 6 740.49 ± 190.47 30.24 ± 4.84 24.27 ± 3.21 58.57 ± 7.42
Table 7.3.2 (TMR Parameters; Exp. 3): Integrated mineral loss (ΔZ; %Vol.µm), lesion depth (LD; µm), average mineral loss (R; %Vol) and the degree of SL mineralisation (SMax; %Vol) for Exp. 3 (Table 7.2.1) listed along with the number of enamel disks which were analysed. SD refers to the SD of the sample set.
Means scan profiles of smooth surfaces were also generated from the entire data sets and were
separated on the basis of dCDFF condition and the day on which the samples were extracted. For
enamel sections extracted from the NaF condition profiles are illustrated in Figure 7.3.14a and for
the dH2O condition the same view is given in Figure 7.3.14b. From these profiles clear differences
are immediately apparent between samples which were exposed to the 2 dCDFF conditions. In
samples extracted from the NaF condition there was a small degree of surface softening however
the magnitude of this was on very small scale. Over the course of the experiment, the degree of
mineral loss which could be interpreted from the scan profiles alone did not look to increase. The
fact that dCDFF conditions were kept constant would further indicate that the mineral loss observed
in sample extracted on the 4th day may have been due to the error associate with the sampling
process. In comparison to the dH2O condition, a mean scan profile indicative of surface-softening
could be interpreted for samples extracted on sample day 4 however by day a distinct caries lesion
profile had clearly begun to develop (Figure 7.3.14b) albeit with a generally ill-defined SL. The
surface softening indicated in lesions extracted on the 4th day of the NaF-free condition was also
notably higher than that indicated on both days in condition which did include NaF.
For these same groups, the calculated parameters in Table 7.3.2 are illustrated in Figure 7.3.15a and
Figure 7.3.15b for the NaF and dH2O dCDFF conditions respectively. Although averages were
constructed differently (i.e. based on the number of enamel disks for TMR parameters) a reflection
in the magnitude of results is clearly evident between mean scan profiles and the parameters
illustrated.

Bi-Circadian NaF vs. dH2O Exposures, Sucrose-Induced Cariogenic Potential and Enamel Demineralisation | Ch. 7
175
Figure 7.3.14a (TMR Scan Profiles for Lesions Created under Exposure to NaF): Mean scan profiles taken from the 300 ppm F
- (from NaF)
exposure condition. Mineral volume (%Vol) is expressed relative to sound enamel normalised within each individual measurement. Error bars represent the SD at each depth increment. Individual mineral volume measurements are made at depth increments of 5 µm from the enamel surface (20%Vol). For the both conditions n = 44.
Figure 7.3.14b (TMR Scan Profiles for Lesions Created under Exposure to dH2O): Mean scan profiles taken from the dH2O exposure condition. Mineral volume (%Vol) is expressed relative to sound enamel normalised within each individual measurement. Error bars represent the SD at each depth increment. Individual mineral volume measurements are made at depth increments of 5 µm from the enamel surface (20%Vol). For the “dH2O / Day 4” condition n = 45 and for the “dH2O / Day 8” condition n = 34.
45
50
55
60
65
70
75
80
85
90
95
0 10 20 30 40 50 60 70 80 90 100
Min
era
l Vo
lum
e (
%V
ol)
Depth from the Enamel Surface (µm)
NaF / Day 4 (Exp. 3) NaF / Day 8 (Exp. 3)
45
50
55
60
65
70
75
80
85
90
95
0 10 20 30 40 50 60 70 80 90 100
Min
era
l Vo
lum
e (
%V
ol)
Depth from the Enamel Surface (µm)
dH2O / Day 4 (Exp. 3) dH2O / Day 8 (Exp. 3)
Bi-Circadian NaF vs. dH2O Exposures, Sucrose-Induced Cariogenic Potential and Enamel Demineralisation | Ch. 7
176
Between samples days 4 and 8 a significant decrease (P = 0.002) was found when comparing ΔZ in
the NaF group (Figure 7.3.15a) however, in the dH2O group, a significantly greater ΔZ value (P <
0.001) was found in sampled extracted on the 8th day when compared to those extracted on the 4th
(Figure 7.3.15b). The same trend was found for LD, a significant reduction in the NaF condition
between samples extracted on the 8th day when compared to those extracted on the 4th (P = 0.008)
whereas the opposite was true for the dH2O condition (P < 0.001). Numerically, these opposing
trends held true for R also however the difference between samples extracted on either day did not
reach significance (P ≥ 0.162). SL measurements were slightly different, between day 4 and 8 SMax in
the NaF condition did not change (P = 0.647) but in the dH2O condition this decreased significantly (P
= 0.001).
Between dCDFF conditions, both ΔZ and LD were not significantly different in samples extracted on
day 4 (P ≥ 0.422). However (as expected from their respective mean scan profiles) both of these
parameters were significantly higher in the enamel tissues which were exposed to the dH2O
condition after 8 days under the sucrose pulsing strategy (P < 0.001). Contrary to this, R was
significantly higher in samples extracted from the NaF condition on the 4th day (P = 0.036) but the
average decrease in the R values generated from the NaF condition coupled with the slight increase
in the dH2O condition between day 4 and 8 lead to a lack of significance (P = 0.564) so as that by the
8th day of the experiment, the lesions produced in both conditions were no different with respect to
their mean R values.
SMax was consistently higher in the NaF conditions on both sample days (P ≤ 0.045). However, in
relating results back to the individual mean scan profiles in Figure 7.3.14a and Figure 7.3.14b, the
beginnings of a true SL only became visible in samples extracted after 8 days exposure within the
dH2O exposure condition (Figure 7.3.14b). In these instances the SL was either assigned manually
from an indicative zone of apparent SL mineralisation or detected automatically by the TMR 2006
program. Either of these methods may have resulted in a bias or systematic error respectively.
Enamel groves structures exhibited a propensity to fracture as has been observed previously
[Lagerweij et al., 1996] and further to this, processing of the samples was able to remove the
majority of the residual nail varnish but statistical analysis of a representivity sample set was not
possible. However, interesting observations were made from the data which was collected.

Bi-Circadian NaF vs. dH2O Exposures, Sucrose-Induced Cariogenic Potential and Enamel Demineralisation | Ch. 7
177
Figure 7.3.15a (TMR Parameters for Lesions Created under Exposure to NaF): LD (µm), R (%Vol) and SMax (%Vol) share the left axis. ΔZ (%Vol.µm) measurements are plotted on the right for the purposes of clarity. Results correspond to data in Table 7.3.2 and error bars represent the SD of the sample set (n = 6). An asterisk indicates a significant difference (P < 0.050) between TMR parameters.
Figure 7.3.15b (TMR Parameters for Lesions Created under Exposure to sH2O): LD (µm), R (%Vol) and SMax (%Vol) share the left axis. ΔZ (%Vol.µm) measurements are plotted on the right for the purposes of clarity. Results correspond to data in Table 7.3.2 and error bars represent the SD of the sample set (n = 6). An asterisk indicates a significant difference (P < 0.050) between TMR parameters.
0
10
20
30
40
50
60
70
80
90
0
50
100
150
200
250
300
350
400
450
ΔZ LD R SMax
De
pth
(µ
m)
/ M
ine
ral V
olu
me
(%
Vo
l)
Inte
rgra
ted
Min
era
l Lo
ss (
ΔZ;
%V
ol.
µm
)
Parameter
Sample Day 4 (NaF) Sample Day 8 (NaF)
0
10
20
30
40
50
60
70
80
90
0
100
200
300
400
500
600
700
800
900
1000
ΔZ LD R SMax
De
pth
(µ
m)
/ M
ine
ral V
olu
me
(%
Vo
l)
Inte
rgra
ted
Min
era
l Lo
ss (
ΔZ;
%V
ol.
µm
)
Parameter
Sample Day 4 (dH2O) Sample Day 8 (dH2O)
*
*
*
*
*

Bi-Circadian NaF vs. dH2O Exposures, Sucrose-Induced Cariogenic Potential and Enamel Demineralisation | Ch. 7
178
Due to difference in the ELT, the groove had penetrated into the dentine layer of the tissue. In these
instances, areas of apparent demineralisation had occurred on the dentine layer. Due to the fact
that dentine specimens require specific condition for their preparation which were not provide by
the current protocol [Ruben and Arends, 1993], quantification by the methods described in Section
2.2.4 was not an appropriate means of assessment. Nevertheless, some indication was seen in that
NaF exposures did not protect the dentine tissue within the deeper areas of the grooves (Figure
7.3.16a), this only became visually apparent by the 8th day of the experiment. Sections from the
dH2O condition indicated dentine demineralisation on both sample days. In addition to this, analysis
of the images was sue to confirmed that surface loss did not occur to any meaningful extent within
these experiments (Figure 7.3.16b)
Figure 7.3.16 (Example Radiographic Images): a) Samples were extracted from lesions which were exposed to the NaF condition of Exp. 3 for 8 days. Areas indicative of dentine demineralisation are evident in the exposed areas of the tissue; b) no areas of surface loss were apparent in any of the lesions which were produced. Orange arrows indicate the point at un-exposed area met with that which was exposed to the conditions within the respective dCDFF unit.
Bi-Circadian NaF vs. dH2O Exposures, Sucrose-Induced Cariogenic Potential and Enamel Demineralisation | Ch. 7
179
7.4.0 Discussion Between concurrent dCDFF runs, variation was seen in the microbial composition as the same
patterns of biofilm growth were not found consistently. A possible reason for this could be due to
difference in the primary inoculum (and hence the physiological state of the primary culture within
the inoculum flask). The production of a steady-state biofilm has previously been accomplished with
inoculation by means of a chemostat [Kinniment et al., 1996]; this step helped to ensure that the
primary culture had reached a more definable starting point. The addition of this prior stage to the
inoculation of the dCDFF may help to improve this aspect of the present work however, the dCDFF
design [Hope et al., 2012] cannot protect from this inherent source of variation [Sissons, 1997;
Tatevossian, 1988]. Consequently, a lack of complete consistency can make assessment towards
definite conclusions difficult. Nevertheless, extensive measures were taken to control for external
contamination [Pratten, 2005] and therefore what can be assured with certainty is that each of
these biofilms would represent the capacity of the microcosm inoculum [Wimpenny, 1988].
7.4.1 Microbial Composition of Plaque Biofilms
The suppression of enrichment under frequent exposures to 300 ppm NaF was not consistent
between each of the 3 concurrent dCDFF runs. However, different combinations of initial community
members may afford an adaptive or synergistic capacity which facilitates a much greater resistance
to antimicrobials [Burmolle et al., 2006; Gilbert et al., 2002] and the effect of fluoride may be no
exception. With the use of a microcosm inoculum, various fractions are introduced to the primary
culture. These may consist of members which have previously adapted to survival under acidic
conditions or to exposure to fluoride. Acid resistance mechanisms are common among oral bacteria
[Marquis, 1995a] as is the capacity to survive exposure to fluoride [Bowden, 1990; Marquis et al.,
2003]. In Exp. 1, results for the enumeration of FA (Figure 7.3.1a) indicated that the community
within the biofilm was in a generally more proliferative state when under exposure to NaF than
when exposed to dH2O. However this group alone does not provide the information necessary to
comment on the microbial ecology within all biofilms. In this same experiment, viable counts of
Lactobacillus spp. rose to an extremely high proportion (Figure 7.3.2a). This genus has previously
been shown to exhibit a resistance to fluorides [Green and Dodd, 1957] which has led to their
exclusion from studies on defined multispecies communities due to an expected propensity to
confound results [Bradshaw et al., 2002]. However, under exposure to dH2O, Lactobacillus spp. also
performed well within this experiment. Therefore it may be that the strains which were able to
compete to a point of dominance within these biofilms possessed an ecological advantaged under
both conditions. One possible route for this may have been related to their aciduricity as both acid
tolerance and fluoride resistance function on a remarkably similar basis [Bowden, 1990].

Bi-Circadian NaF vs. dH2O Exposures, Sucrose-Induced Cariogenic Potential and Enamel Demineralisation | Ch. 7
180
Acid tolerance may need to occur within a single generation of a bacterial population [Marquis,
1995a] and in this case residence can be afforded by an up-regulation or increased activity of proton
translocating membrane-bound ATPases [Hamilton and Buckley, 1991; Marquis, 1995a] therefore
compensating for the dissipation of ΔpH across the cell membrane [Kashket and Kashket, 1985].
Likewise, acidification of the cytoplasm is also one of the principle avenues by which fluorides exert
their antimicrobial effects [Buzalaf et al., 2011]. Fluoride inhibits ATPases [Sutton et al., 1987] and
therefore can increase the susceptibility of bacteria to acidic environments though direct
cytoplasmic acidification and indirection inhibition of innate protective mechanisms. The reverse of
this would also be true in that a community of Lactobacillus spp. which possesses a more abundant
or efficient array of ATPase enzymes would perform better under acidic and fluoridated
environments than species which are less capable of maintaining a cell membrane ΔpH [Kashket and
Kashket, 1985]. Therefore, some explanation of the high rate of proliferation of Lactobacillus spp.
within the current experiment could be provided.
As a genus, Streptococcus spp. are also known to possess resistance to fluoride [Bibby and Van
Kesteren, 1940] but not to the same extent as is seen for Lactobacillus spp. [Sutton et al., 1987]. In
the results of this experiment (Exp. 1) a difference was seen in that biofilms exposed to NaF
contained greater viable counts (Figure 7.3.3a) although this difference was relatively small (< 1-
Log10 unit) and therefore no inhibitory effect could be determined. However, viable counts of MS did
appear to differentiate to some degree (Figure 7.3.4a). In this case, the greatest difference between
these counts occurred on the 4th sample day (> 2-Log10 units) but between periods of similar state of
proliferation. As the environmental conditions within all experiments remained constant, the most
likely explanation for this is a reflection of the dynamic state of the Streptococcus spp. genus. As
noted above, the viable counts of Streptococcus spp. remained relatively stable but this group
encompasses MS and therefore a change in MS would have to be counterbalanced by change in the
non-MS community for viable counts of Streptococcus spp. to remain stable. Thus, the microcosm
biofilms grown within this experiment may be reflective of that which is produced in vivo in that the
community structure is dynamic consisting of several population blooms [Skopek et al., 1993] over
the course of, and following fully mature, development.
With reference to antimicrobial activity, it should be remembered that this is dependent on the
persistence of fluorides within the environment [Buzalaf et al., 2011]. Inhibition of energy
production may provide the biofilms grown in the NaF condition with a less favourable environment
in the periods following exposure to NaF however both EPS and IPS can provide a means of energy
storage which microbes can then utilise [Zero et al., 1986] therefore allowing energy production

Bi-Circadian NaF vs. dH2O Exposures, Sucrose-Induced Cariogenic Potential and Enamel Demineralisation | Ch. 7
181
once the inhibitory agent has dissipated from the system. With this in mind, the inhibitory effect of
fluoride would be marginal in the case of the present work. Nevertheless, exposure to fluorides
would present some selective pressure and may serve to explain the instances where the
proliferation of various genera was altered
EPS matrix provides an environment which benefits the biofilm community [Flemming and
Wingender, 2010; Gilbert et al., 2002] and the inhibition of the energy production could therefore
hinder the synthesis of the GTFs and FTFs which are responsible for its production [Marsh and
Martin, 2009a; Russell, 2009; Williams and Elliott, 1989]. It thus follows that inhibition of the
production of the enzymes involved in EPS matrix formation could therefore significantly affect
plaque biofilm cariogenicity. In this way, exposure to bi-circadian NaF rinses may inhibit the earliest
stages in biofilm formation (that are not able to be accurately captured by selective culture) and
therefore may have a down-stream effect on the successive stages during maturation and growth
[Skopek et al., 1993].
The concentration of the NaF exposure (300 ppm F-) solution was slightly higher than the 228 ppm F-
which has previously been calculated to be present in saliva following the use of common 1100 ppm
F- toothpastes [Bruun et al., 1984; Bruun et al., 1987]. However, the amount of F- present in saliva is
generally proportional [Vogel, Personal Communication] to simulate that which would be expected
from toothpastes which employ a more concentrated fluoride delivery system (1450 ppm F-). In this
case, the amount present in the saliva, and hence that which could be expected to reach
undisturbed plaque, would be approximately 300 ppm F-. Moreover, when considering how fluoride
is delivered through the use of toothpastes, the action is very dissimilar from that which occurs
when mouth rise or mass transport in the saliva is the mode of delivery. The inaccessible areas of
occlusal and aproximal surfaces can result in the build-up plaque although the depth of such a
biofilm is limited to the point where the area is accessible to the individual. This is depth at which
toothbrush bristles are able to reach and, as the toothpaste is normally applied directly to the brush,
it is conceivable that more concentrated slurry actually comes into contact with the surface of the
plaque biofilm. Therefore, investigations which concentrate on higher concentrations of fluorides
may be warranted in order to provide a more complete picture.
7.4.2 Comparative Plaque Fluid Composition and Microbial Ecology
The microbial ecology within the biofilms produced from this particular experiment (Exp. 2) behaved
somewhat differently from Exp. 1. For instance, the FA indicated that the biofilms which were under
exposure to dH2O where in a more proliferative state in the dH2O condition when compared to that
of the NaF condition (Figure 7.3.1b). On the other hand, Lactobacillus spp. did not show any great

Bi-Circadian NaF vs. dH2O Exposures, Sucrose-Induced Cariogenic Potential and Enamel Demineralisation | Ch. 7
182
dissimilarity between dH2O and NaF conditions (Figure 7.3.2b). Therefore, the concept that
Lactobacillus spp. are resistant to exposure to NaF is applicable [Green and Dodd, 1957], however
another fraction of the microbial community may have been supressed in order to result in the
decrease in viable counts during exposure to NaF (Figure 7.3.1b). Streptococcus spp. were also
numerically lower in the NaF condition (Figure 7.3.3b) but no discernible difference (< 1-Log10 unit)
could be seen thus indicating that this group as a whole was not affected. However, MS did indicate
some level of suppression under exposure to NaF (Figure 7.3.4b) and this group is known to be
relatively more sensitive to NaF exposures [Kashket and Kashket, 1985; Sutton et al., 1987] although
over the course of the experiment, the relative proportions of MS reached similar values (Figure
7.3.4b). It would therefore appear that the more resistant members of the community had
proliferated as the niche within became more amenable to their existence. The concept of whether
the adaptation was phenotypic or genetic [Bowden, 1990] may have been an important element in
the observed trends. Phenotypic adaptations have the potential to persist within lineages and in this
way may be termed genotypic [Bowden, 1990] but without comparison of the genomes from the
isolates counted, it would not be possible to be sure of any such conclusion. Subculture on fluoride-
containing media such as the methods performed by Bowden et al. [1982] would have helped to
confirm the precise mechanism which was at work. Syncretically, the fact that growth curves
proceeded more slowly in comparison to the dH2O condition (Figure 7.3.4b) would indicate a
reduced capacity to withstand the presence of fluorides within their environment and therefore a
lack of genetic competency within this population. Colonisation resistance may have also been
responsible for limiting the proliferation of MS although it would be expected that not all microcosm
inocula would introduce the same set of organisms to the primary culture; the exposure of fully-
developed biofilms to the agents in question (NaF) would effectively remove colonisation resistance
or the on-going effects of inter-specific competition as confounding factors and would therefore
provide greater insight into the inhibitory effect of fluorides within such communities.
An interesting result is the immediate comparison between acetate and lactate and their relative
concentrations following a sucrose exposure. In all cases, acetate was reduced following a sucrose
challenge and a concomitant increase in lactate was observed. This relationship has been found
previously when investigating the behaviour of lactate and acetate buffers within an abiotic systems
[Featherstone and Rodgers, 1981; Walsh, 1991]. Featherstone and Rodgers [1981] were first to
identify the importance of the type and combination of acid challenges in carious lesion formation
and were also able to determine a loss of acetate in the presence of lactate. Here the authors
attributed this loss to a relationship between the lower- and higher-pKa acids (lactate and acetate
respectively) where a greater proportion of higher pKa acids would be present in their un-ionised

Bi-Circadian NaF vs. dH2O Exposures, Sucrose-Induced Cariogenic Potential and Enamel Demineralisation | Ch. 7
183
form when part of a buffer system containing lower pKa acids. This was understood to be a
demonstration of un-dissociated diffusion into the porous dental enamel tissue [Walsh, 1991].
Alternatively, surface adsorption of the acid anions has also been proposed as a mechanism by
which they may be lost from such a system [Hoppenbrouwers and Driessens, 1988]. However, in the
context of the present work these assertions are not wholly sufficient to explain the observed
results. Penetration through bovine enamel occurs approximately x3 faster than in human samples
[Featherstone and Mellberg, 1981] yet even given such an extrapolation the reduction of PF acetate
in the presence of an increase in lactate occurs much slower within an abiotic system and would
therefore not explain the observed shift over a 7 min interval as was applied in the within this
experiment (Exp. 2). Whist it is possible that the above mechanism may have had some influence on
the observed results, a biological basis of this result is more likely.
Many oral biofilm bacteria (such as Lactobacillus spp. and Streptococcus spp.) possess the capacity
for hetero-fermentative energy production whereby both acetate and lactate are produced as
metabolic end products [Davis, 1955; Marsh and Martin, 2009a; Thomas et al., 1979]. Organisms
such as Streptococcus spp. and MS are able to produce acetate, lactate, formate and ethanol via
hetero-fermentative energy production. However, the enzymes pyruvate-formate lyase (PFL) is
required to achieve hetero-fermentative metabolism and this is inhibited below pH 8 [Iwami et al.,
1992]. Therefore, during periods of cytoplasmic acidification (as may result from environmental
acidification), this pathway is inhibited with the production of lactate remaining viable [Marquis,
1995a]. In theory, cytoplasmic acidification resulting from the entry and subsequent disassociation
of HF would effect this same route. Further to this, fluoride also inhibits the activity of enolase
[Curran et al., 1994] which is essential for entry of sugars to the conserved glycolytic pathway (Figure
6.4.1). Explanation of the shift in acetate production can therefore be made on the basis of a
reduction in the pH of the biofilm whereas the relatively lower concentrations of acid anions in the
NaF condition may be attributed to residual fluoride within the PF environment and subsequent
metabolic inhibition following the accumulation of cytoplasmic base [Jenkins et al., 1969]. Although
the detection of formate in the NaF condition would initially suggest less inhibition of PFL, a full data
set was not obtained in this instance and therefore a control comparison was not available for this
particular organic acid.
For the areas where data was available, lactate at day 2 peaked higher in the dH2O condition. In the
work conducted by Bradshaw et al. [2002], the acid response was also greater in biofilms which were
grown (in both a chemostat and using a CDFF model) in the absence of NaF. However the conditions
and parameters measured were dissimilar. In chemostat experiments microbes were cultured

Bi-Circadian NaF vs. dH2O Exposures, Sucrose-Induced Cariogenic Potential and Enamel Demineralisation | Ch. 7
184
planktonically with continuous exposure to fluoride. In relation to the oral environment, these
exposures (and the effects thereof) are, to some extent, unreflective. Even given that a biofilm mode
of growth was adopted, the exposure strategy was again dissimilar in that fluoride was introduced
during each cariogenic challenge. However, what was shown was that a much lower concentration
of environmental fluoride is able to result in a significant alteration in the collective physiology of the
community [Bradshaw et al., 2002]. From the current work, it would appear that level similar to that
which would be experienced during conventional oral hygiene [Parnell and O'Mullane, 2013] is also
able to enforce a change in the acidic response to a cariogenic challenge.
Propionate production can be performed by various members of the microbial consortia including
Bifidiobacteria spp., Prevotella spp. and Veillonella spp. Further to this, cross-feeding for the
resultant production of propionate is well known within mixed bacteria communities [Hosseini et al.,
2011]. Given the plethora of microorganisms present within a microcosm inoculum (of which, those
involved in propionate production would be expected to include) [Aas et al., 2005], the individual
microbes responsible for propionate production and the effect of NaF exposures thereon is difficult
to be certain of. Following exposure to sucrose, propionate concentrations were reduced further in
the NaF exposure condition (Figure 7.3.11) possibly indicating a level sensitisation to acidic pH
[Marquis et al., 2003] although further data in relation to propionate production within the fluoride-
free condition would be necessary to be more certain. Moreover, Bifidiobacterium spp. have
recently attracted attention for their role within cariogenic biofilm ecology [Beighton et al., 2010].
The concept that metabolic products may be measured as a proxy for activity of such species may
have substantial implications but direct isolation of this genera would also be required.
Succinate and butyrate are both low-pKa acids [House, 2013] and their presence within the PF would
thus contribute to the buffering capacity during an acidic challenge [Higham and Edgar, 1989;
Margolis et al., 1985]. Succinate was not detected in any of the NaF-exposed biofilms on the 2nd
sample day but was in biofilms which were produced under the dH2O condition. However, on the 4th
day, succinate was detected following a sucrose exposure. It is possible that the levels within the PF
were of a magnitude which was BMDL for the CE system however fluoride induced inhibition of
succinate producing microbes such as Actinomyces spp. [Beighton et al., 2004] or a delay in the
proliferation of these organisms in the NaF exposure condition may be responsible for this
observation [Bowden et al., 1982]. The trend in butyrate production was much less clear and
although this particular analyte was confirmed as present, it is likely that the interference
encountered during anion separations was responsible for the incoherency of the trends in the
observed production for this analyte.

Bi-Circadian NaF vs. dH2O Exposures, Sucrose-Induced Cariogenic Potential and Enamel Demineralisation | Ch. 7
185
Fluoride was detected in relatively high concentrations by the 4th day of the NaF condition (0.465
mM ± 0.698SD). Further to this, the concentrations found were higher than that required for
antimicrobial activity [Maltz and Emilson, 1982]. As noted above, an adaptive mechanism may have
been responsible for sustainment of oral biofilms within this unit [Bowden, 1990] and the presence
of the fluoride could be due to the formation of persistent mineral phases such as CaF2-like deposits
[Christoffersen et al., 1995] which, interestingly, would be supported by the DS of the STGM (Figure
4.4.4). Further studies would be required to support the conclusion that CaF2-like deposits had in
fact formed within these biofilms. Nevertheless, the detection limits of the CE method required a
relative high MDL and therefore confidence in the presence on this analyte was complete.
The fact that phosphate was reduced following a cariogenic challenge in the NaF condition but not in
the dH2O condition indicates that a unique physiochemical response occurred within these biofilms.
Specifically, the fact that this reduction occurred at times when fluoride was detected also suggests
an implication in the mineralisation process. If the presence of fluoride was in fact due to the
breakdown and dissolution of fluoride reservoirs then the loss of phosphate during this period may
have been due to subsequent remineralisation events or the formation and fluorapatite [ten Cate,
1997]. Unfortunately, PF calcium concentrations were not available although a relative reduction in
the concentration of this analyte would provide a much stronger basis to the assertion. Loss of PF
phosphate has previously been attributed to uptake by bacterial anabolism [Higham, 1986] and
while this may be true, the unique result observed in the presence of fluoride and the speed with
which the reduction was observed would again suggest an essentially dissimilar process. Moreover,
in instances where data were able to be compared, PF phosphate was much lower in previous
experiments (Figure 6.3.6). Biological variation of the biofilm may, in part, explain this result as even
before the supposed cariogenic challenge, PF phosphate was far higher (Figure 7.3.13).
Exposure of the biofilms to either dH2O or NaF solutions would also augment the ionic composition
of the PF through purely physical means. As noted previously, the very exposure to a hypotonic
solution would have some dilution effect on the fluid phase within [Vogel et al., 2001]. This may
have been the factor which was responsible for the differences observed in PF chloride as has been
found with other constitutes such as potassium [Dibdin et al., 1986]. The finding that relative
chloride concentrations increased over time may also be an indication that the as the biofilms had
matured, a less diffusive structure had developed [Dibdin and Wimpenny, 1999]. To some extent,
this may have also been the case for PF sulphate (Figure 7.3.12) but if this were true it should be
remembered that the same assumption that diffusion was altered over the course of biofilms
growth must be applied to the evaluation of all chosen analytes.

Bi-Circadian NaF vs. dH2O Exposures, Sucrose-Induced Cariogenic Potential and Enamel Demineralisation | Ch. 7
186
The composition of the samples which were extracted at baseline was, however, markedly different
from the STGM (Figure 5.3.5 and Figure 5.3.6). The finding that PF samples exhibited a dissimilar
composition from the STGM was also true for previous experiments (Section 6.3.3) although unique
to the present study, baseline measurements were obtained for each dCDFF condition. Therefore,
the dH2O conditions of this particular run would reflect that which could be expected of the sucrose
exposure condition described in Section 6.3.3. However it is possible that the collective physiological
state of the biofilms within the dH2O condition of the present run differed from that of the sucrose
condition of the previous experiment but, with this in mind, examination by way of viable counts
showed a general similarity between the groups which were sampled.
One aspect which has not been addressed is that the time frame at which biofilms were sampled
may have led to the false conclusion that fluoride reduces acid production. In experiments
conducted by van der Hoeven and Franken [1984], the rate of organic acid production of
Streptococcus mutans biofilms was reduced under exposure to fluoride but the total organic acids
produced following a 30 mM sucrose rinse was unaffected [van der Hoeven and Franken, 1984].
Explanation of this result was given in that the utilisation of sucrose was hindered (through the
acidic sensitisation mechanisms decried above) although, given time, the populations ability to
metabolise the substrate was not effected [Bowden, 1990]. This is of direct relevance within the
context of the present work as the reduced rate of unitisation may explain why the PF concentration
of organic acids anions were lower under exposure to NaF (as F- was also detected within the PF)
whilst complete inhibition was not noted. A reduction in acid production would deny acidogenic
organisms such as MS their selective advantage [Bowden et al., 1982] to a degree. However,
consistent with the EPH, even a reduced acidogenic potential would confer the same selective
advantage [Marsh, 1994]. Organisms which are best suited to a higher environmental pH would
therefore be able to compete for longer although it would appear from the present work that the
selective advantage would remain in the favour of the more acidogenic species.
7.4.3 Microbial Ecology and Caries Lesion Formation
In Exp. 3, viable counts of FA behaved indistinguishably between dCDFF conditions (Figure 7.3.1c).
Conversely, the proportion of Lactobacillus spp. was lower within biofilms which were exposed to
NaF than in those exposed to dH2O (Figure 7.3.2c) which was consistent with that observed for the
previous experiment (Figure 7.3.2b). No difference was seen in Streptococcus spp. however viable
counts within the groups appeared to behave erectly (Figure 7.3.3c) and in a way which did not
reflect either of the previous experiments. In a sense this erratic growth trend could indicate that
the biofilms had not reach a steady-state [Kinniment et al., 1996] although the perceived steady-
state can be somewhat subjective, the erective trends seen in Streptococcus spp. could have due to

Bi-Circadian NaF vs. dH2O Exposures, Sucrose-Induced Cariogenic Potential and Enamel Demineralisation | Ch. 7
187
proliferative events [Skopek et al., 1993] which were nevertheless behaving similarly between dCDFF
conditions. Although dissimilar trends did occurred when assessing the growth of Veillonella spp.
(Figure 7.3.5), they appeared to be relatively unaffected given the introduction of NaF exposures
which is consistent with previous work that has shown their ability to tolerate environmental
fluoride to greater extent than other oral bacteria such as MS [Bowden et al., 1982]. However, the
proliferation of MS did not appear to be inhibited within this experiment (Exp. 3). Rather, evidence
for a reduction in viable counts was observed only in the dH2O condition (Figure 7.3.4c). The fact
that the reduction of this group occurred some time after the establishment of the biofilm would
again indicate an ecological basis for the observed results and in this respect further insight may be
possible when the growth trends of Streptococcus spp. are considered in relation to MS.
Comparing the results for Streptococcus spp. (Figure 7.3.3c) to that of MS (Figure 7.3.4c) shows that
on the 4th day of the experiment, the Streptococcus spp. population consisted of approx. 10% MS.
However on the 6th day, the proportion of MS had rose to 100% of the Streptococcus spp. sampled in
the NaF condition when this was not the case for the dH2O condition. Therefore, the results indicate
that the ecology within the biofilms grown under the NaF condition allowed for an opportunistic
proliferation of MS at the expense the other streptococci but that those which were initially selected
against soon recovered. The reasons for this are not clear, given the mechanisms discussed above,
the presence of fluoride within the environment should not have provided any selective advantage
to MS but a significant proportion of the viable counts made cannot be accounted for as either
Lactobacillus spp., Streptococcus spp., MS or Veillonella spp. Changes in the composition of this
unknown fraction may have afforded MS their advantage even within an NaF exposure strategy.
Central aspects of the caries process are lost when viable counts are considered alone and the above
results serve to demonstrate that the ecology should be followed in comparison to further
parameters such as the composition of the PF (Exp. 2). However, members of the community may
interact by cross-feeding and therefore alter the composition of the PF to a point were identification
of the species responsible is no longer possible. Therefore, whilst a similar plaque function may be
afforded by more than one community [Sissons, 1997], the definition of this function cannot be
made based on the environmental conditions alone. In this sense, measurement of the collective
metabolic activity of the biofilm is useful [Nyvad et al., 2013] but perhaps dimensionless unless
further parameters are also measured. Ultimately, the cariogenicity of a biofilm is not defined purely
on basis of acidogenicity [Zaura and ten Cate, 2004] although the detection of carious
demineralisation does (by definition) provide proof of this process. To this end, a protective effect
was observed under conditions which included exposure to fluoride within the present work (Exp. 3).

Bi-Circadian NaF vs. dH2O Exposures, Sucrose-Induced Cariogenic Potential and Enamel Demineralisation | Ch. 7
188
Lesions were produced within the dH2O condition (Figure 7.3.14b) however demineralisation was
not apparent until the 8th day of the experiment. This is in contrast to earlier attempts when carious
demineralisation was capture as early as the second day of the experiment (Figure 5.3.7 and Figure
5.3.8). Although PF measurements were not made during the earlier attempts, the composition of
the microbial community was monitored. Between these 2 experiment, FA were exceptionally
similar (Figure 5.3.1 compared with Figure 7.3.1c), Lactobacillus spp. were determined as slightly
higher (Figure 5.3.2 compared with Figure 7.3.2c), Streptococcus spp. were slightly lower (Figure
5.3.3 compared with Figure 7.3.3c) in the present study however the most noticeable differences
were found in the proportions of MS and Veillonella spp.
Viable counts of MS reached higher proportions in the previous experiments (Figure 5.3.4) compared
to the present work (Figure 7.3.4c) and further to this a similar depression occurred between the 4th
and 8th days of both experiments. Interestingly, this similarity was noted in the CF condition.
Conversely, the proportion of proliferative Veillonella spp. rose to higher numbers in the present
work (Figure 5.3.5 compared with Figure 7.3.5). The reduction of acidogenic species coupled with
greater proportion of lactate-consuming species may have provided a less cariogenic environment
[Mikx et al., 1976] and therefore may serve to explain the less advanced state of the lesions found
within the dH2O condition in the current context of this experiment (Figure 7.3.15b).
The fact that a CF STGM flow was employed also raises an interesting point over the architecture of
the lesions which were formed. Although the rate of formation was slower, the lesions created in
the present work (Figure 7.3.14b) did not show the district SL which was in-line with that found in
previous experiments when a CF used (Figure 5.3.7). Previously, this was explained on the basis of
coupled diffusion [Anderson and Elliott, 1987] as the comparison with the FF condition showed a
much more well-define SL. However, incongruent dissolution has also been proposed as a
mechanism which contributes to SL formation [Brown and Martin, 1999]. In compositionally variably
solid phases (such as natural bovine enamel), the process of incongruent dissolution would be
altered although not avoided [Wang and Nancollas, 2008] therefore this process is most likely
involved in the pattern of lesion formation observed in the present work (Figure 7.3.14b).
Unfortunately, a direct control condition was not included in the present study as the aim was to
assess the effect(s) of fluoride exposures but nevertheless, the fact that an SL was poorly formed in
the present study is certainly an interesting result.
It appeared that fluoride completely protected the enamel tissue from the conditions created within
the dCDFF model (Figure 7.3.15a). Although some demineralisation was detected by the TMR
system, this was only marginally outside the error (ΔZ = 200 %Vol.µm, LD = 5 µm) associated with

Bi-Circadian NaF vs. dH2O Exposures, Sucrose-Induced Cariogenic Potential and Enamel Demineralisation | Ch. 7
189
the procedure [Arends and ten Bosch, 1992]. This would, however, indicate that some level of
surface softening was occurring in the initial phases of the experiment (Figure 7.3.14a).
Unfortunately, larger sample sets would be required in order to confirm that these results were not
the product of an unusually high error measurement from an otherwise sound enamel surface.
It is possible that the demineralising challenges were initially stronger in the NaF exposure condition
however given the known inhibitory effects of NaF on microbial fermentation [Bradshaw et al.,
2002] and the reduction in organic acid production indicated from Exp. 2, this is an unlikely cause of
the mineral loss observed in Figure 7.3.15a. In all, a discernible lesion character was produced in
enamel tissues which were not exposed to NaF (Figure 7.3.14b) and this was not evident in any of
the sections extracted from the NaF condition (Figure 7.3.14a). However, an interesting observation
was made in the samples which were salvaged from the enamel grooves (Figure 7.3.16a). Here,
demineralisation was not apparent in the outer areas although evidence of mineral loss was found in
the base of the groove (specifically in within the dentine tissue). Dentine is inherently more soluble
than enamel [Robinson et al., 1995a] which would explain the evidence of mineral loss in this tissue
as opposed to the enamel layer. Further to this, the presence of fluoride may have protected the
outer areas of the groove preferentially though limited diffusion of fluoride and reactions with the
mineral phase at the entrance to the groove [Zaura-Arite et al., 1999; Zaura and ten Cate, 2004;
Zaura et al., 2005]. However, what was provide from these limited samples was some indication that
microbial fermentation did occur in the base of these grooves and to a point of cariogenicity which
effected the demineralisation of dentine but not the enamel tissue.

Bi-Circadian NaF vs. dH2O Exposures, Sucrose-Induced Cariogenic Potential and Enamel Demineralisation | Ch. 7
190
7.5.0 Conclusions Microcosm biofilms behaved very differently when assed by microbial counts alone and, because of
this variation, the antimicrobial activity of an agent on a biofilm which is in a constant state of
change cannot always be accurately determined. Within the context of the present study, this was
no expectation. However, fluoride does appear to have some modulatory effect on the ecology of
the plaque biofilm through an effect possibly imparted on the acidogenicity of the community.
Further studies on the effects of representative fluoride exposures on defined species biofilms and
on established biofilm communities should therefore be conducted as this approach would remove
individual sensitivities relative community susceptibility as confounding factors respectively.
Definite differences were observed when comparing the effects of NaF versus dH2O exposures on
carious lesion development. Furthermore, these results fell well in-line with what can be expected
from assessment of the literature. With regard to model development, monitoring the biofilm
community via metabolic activity and subsequent quantification of cariogenicity through analysis of
the degree of substratum mineralisation can also be concluded as an effective means of assessing
the collective activity of the biofilms within this particular model. Each of these methods should thus
be applied to a relatable culture therefore requiring concerted application of each within the same
dCDFF experiment.

191
Chapter 8: Influence of Ca-Lactate vs. dH2O Exposure on Biofilm
Formation and Cariogenicity under NaF Exposures.
8.1.0 Introduction Calcium is an essential part of dental mineral [Shore et al., 1995b]. Elevated levels of calcium may
inhibit the process of demineralisation and, in sufficient quantities, may promote remineralisation or
mineral deposition. In order to confer maximum protection, a sustained low level of fluoride within
the PF would also provide the optimum conditions [Featherstone, 1999]. However, excessive
ingestion of fluoride is a contentious issue due to concerns over toxicity [Den Besten and Li, 2011;
Marinho et al., 2003b] and the persistence of fluoride when supplied by conventional means
therefore becomes an attractive alternative [Vogel, 2011].
Calcium is also thought to play a role in the structural integrity of biofilm [Rose et al., 1993] whereby
carboxylate and phosphate groups on the peptidoglycan cell walls of the gram-positive bacteria are
able reversibly bind calcium [Rose et al., 1997]. The binding of these groups to calcium can occur in a
mono-dentate fashion thus enabling calcium bridging between bacteria when in immediate
proximity [Rose, 2000a] but, further to this, cell-surface antigens such as lipoteicoic acid (LTA) have
been demonstrated to have an even higher binding capacity than the cell walls [Rose et al., 1994].
The production of LTA during exposure to sucrose [Rølla et al., 1978] has also been suggested to act
as a possible calcium-buffering mechanism; shielding acidogenic microbes from the effects of
calcium stress which may result during mineral dissolution [Rose and Hogg, 1995].
Lactate can also provide an energy source for microbes such as Veillonella spp. [Rogosa and Bishop,
1964]. This was first tested by Bowden and Brownstone [Unpublished] where the addition of Na-
lactate was expected to increase the proportion of Veillonella spp. and therefore confer protection
during natural acidic episodes through the reduction PF lactate [Bowden, 1993]. Although an
increase in the proportion of Veillonella spp. was not detected, a more controlled system such as the
CDFF may be able to detect such a response more effectively. It is also thought that the increase in
available calcium would favour the formation of CaF2-like deposits within the plaque and on the
surface of the tooth; thus leading to the persistence of this phase within the oral environment and
therefore an enhanced protective effect [Pessan et al., 2006; Vogel et al., 2008]. The work presented
in this chapter consequently aims to recreate the exposure strategy devised by Vogel et al. [2008]
whereby the NaF exposure applied in the previous chapter (Figure 7.2.3) will be built upon to include
Ca-lactate pre-rinses.

Influence of Ca-Lactate vs. dH2O Exposure on Biofilm Formation and Cariogenicity under NaF Exposures | Ch. 8
192
8.1.1 Aims and Objectives
Investigating the effects of Ca-lactate pre-rinses on the retention of mineral ions within plaque
biofilms the will be investigated within the dCDFF model and the associated state of the microbial
ecology, plaque fluid composition and subsequent effect(s) on the degree of enamel substratum
mineralisation will also be monitored. The work presented within this chapter will aim to relate the
maximum number of relevant parameters together to provide insight into resultant alterations to
the caries process. Whilst testing the hypothesis that Ca-lactate exposures will increase the
abundance of mineral ions (calcium and fluoride) within the PF, further insight into the behaviour of
ionic reservoirs and the microbial ecology within in vitro dental biofilms will also be sought.

Influence of Ca-Lactate vs. dH2O Exposure on Biofilm Formation and Cariogenicity under NaF Exposures | Ch. 8
193
8.2.0 Materials and Methods
Calcium Lactate (Ca-Lactate; 150 mM) exposures were investigated in a dCDFF model (described in
Section 5.2.2) in comparison with dH2O during a sucrose (50 mM) and NaF (300 ppm F-) pulsing
strategy illustrated in the “Unit B” condition of Figure 7.2.3b. As in Section 5.2.1, biofilms were
formed from a pooled human salivary inoculum. Both enamel disks (Modus Laboratories, University
of Reading, Reading, UK) and HA (Clarkson Chromatography Products Inc., South Willaimsport, PA.,
USA) were used as a substratum for biofilm growth. Narrow grooves were also carved into each of
the enamel surface before half of the enamel surface was coated in an acid resistant nail varnish
(MaxFactor Nailfinity; Procter and Gamble, Weybridge, UK) leaving both exposed and un-exposed
areas as described in Figure 7.2.2. Further to this, artificial lesions were created in some of the
enamel disks before preparation for use in the dCDFF along with other sound enamel surfaces. The
procedures used to create these lesion types is described below in Section 8.2.0.1 (below). Following
the creation of lesions, all enamel disks were painted in an acid-resistant varnish (MaxFactor
Nailfinity; Procter and Gamble, Weybridge, UK) so that half of the enamel surface was protected
from conditions within the dCDFF unit by the same method described in Figure 7.2.1.
Figure 8.2.1 (dCDFF Sample Pan Arrangement): a) CDFF turntable where PTFE sample pans were designated to hold HA (-HA) or Enamel (-EN). Text in black indicates pans which provided biofilms for bacterial enumeration and PF analysis. Text in blue indicates pans which held substrata designated for TMR analysis; b) cross-sectional view of a single PTFE pan rotated -80° in the z-axis plane showing HA disks (grey) resting atop PTFE (white) plugs at a depth of 200 µm.
HA disks were inserted into their positions in the PTFE pans and recessed to a depth of 200 µm
before the pans were inserted into the CDFF turntables (Figure 8.2.1) and the assembled units
sterilised exactly as described previously (Section 5.2.2.1). The apparatus was then assembled as
described in Section 7.2.0 with the following adaptations that NaF (300 ppm F-; Sigma-Aldrich, Poole,
UK) was introduced to both CDFF units from the same 1 L volume of sterile NaF solution and either
Ca-Lactate (150 mM) or dH2O was fed into the units via the same silicone tubing stream as entered

Influence of Ca-Lactate vs. dH2O Exposure on Biofilm Formation and Cariogenicity under NaF Exposures | Ch. 8
194
the NaF solution immediately before the inlet to the given CDFF unit (Figure 8.2.3) at a flow rate of
10 mL.min-1 for a period of 1 min by previously calibrated peristaltic pumps (101U/R Low Flow
Peristaltic Pump; Watson Marlow, Falmouth, UK). All procedures regarding the assembly, inoculation
stage and pulsing cycle commencement were kept in line however with a further Ca-Lactate pre-
rinse stage either side of the NaF exposure (Figure 8.2.2) and a CF strategy was adopted for the
purposes of this experiment.
HA disks were extracted in triplicate for the enumeration of bacteria on days 2, 4, 8 and 16 of the
experiment (Section 5.2.3). Biofilms were sampled on days 2, 4, 8 and 16 immediately after the 4th
sucrose pulse of the given days cycle (2:00PM) using the procedure describe in Section 5.2.4. The
community members chosen for identification were: FA (FAA media supplemented with 5% horse
blood; Section 5.2.4.1), MS (TYCSB; Section 5.2.4.2), Streptococcus spp. (MSA; Section 5.2.4.3),
Lactobacillus spp. (Rogosa; Section 5.2.4.4) and Veillonella spp. (BV agar; Section 5.2.4.5). After the
5th sucrose pulse (4:00 PM), PF was also extracted in triplicated using the method described in 6.2.2
with the exceptions that samples were taken only on days 8 and 16.
TMR was performed on all enamel disks extracted at days 8 and 16. The enamel disks were removed
from their sample pans immediately before the 4th sucrose pulse (2:00PM) on the sample day and
the biofilm removed from the surface of the disks by gently washing the surface with dH2O. Disks
were stored in 1 mL Eppendorf tubes (Eppendorf UK Ltd., Stevenage, UK) along with a cotton pellet
moistened with 0.1 % w/v thymol solution (BDH Laboratory Supplies, Poole, UK) between extraction
and analysis. TMR procedures were performed as described in Section 2.2.4 with the exceptions
that, prior to initial sectioning, a small groove was cut into the side of each enamel disk in order to
mark the exposed enamel surfaces.
For the quantification of de- or remineralisation of pre-made lesions, micro-radiographic images of
the un-exposed surfaces were captured along with adjacent exposed areas. The TMR parameters
(ΔZ, LD, R and SMax) were then recorded and the values of the exposed areas were each subtracted
from their adjacent un-exposed areas. Consequently, for quantification of pre-made lesion results
were expressed as the change in each parameter (ΔΔZ, ΔLD, ΔR and ΔSMax). Negative values in these
secondary parameters therefore indicated and increase in mineral loss whereas positive values
indicated a reduction [Lippert et al., 2012].

Influence of Ca-Lactate vs. dH2O Exposure on Biofilm Formation and Cariogenicity under NaF Exposures | Ch. 8
195
Figure 8.2.2 (dCDFF Pulsing Strategies for Ca-Lactate vs. dH2O):Both dCDFF units (A and B) were subject to a 50 mM sucrose pulsing strategy (x8/day for 15 min at 0.38 mL.min
-1 every 2 h over 16 h of a 24 h cycle) with NaF (300 ppm F
-) or dH2O exposures (x2/day for 2 min
at 3 mL.min-1
immediately before and after the 16h sucrose pulsing period). Green bars represent the flow of STGM at a rate of 0.38 mL.min
-1, red bars represent sucrose exposures, blue bars represent dH2O and orange bars represent NaF (300 ppm F
-).
8.2.0.1 Artificial Lesion Creation (Hydrogel Demineralisation Model)
Acid-Gel systems were constructed as described in Section 2.2.2. In brief, an MeC (Sigma-Aldrich
Ltd., Poole, UK) gel base was made to a density of 8% (w/v) and containing 10 mM KH2PO4 (Sigma-
Aldrich Ltd., Poole, UK). Into each of three 50 mL Sterilin containers (Sterilin Ltd., Newport, UK) 3
enamel disks were placed and secured in place with tooth Carding wax (Associated Dental Products
Ltd., Swindon, UK). Twenty g of the MeC gel and, once set, a further 20 g of 100 mM Lactic acid
solution (in-depth descriptions of the preparation procedure are provided in Section 2.2.1) was
added. The lactic acid solution contained 10 mM KH2PO4 without CaCl2 and therefore initially
infinitely under-saturated with respect to calcium phosphate salts. The completed AGSs were
incubated for 14 d at 37 °C in a Memmert IN55 Precision Incubator (Memmert GmbH., Heilbronn,
Germany). Following this, enamel disks were extracted and any remnants of the gel removed by
rinsing with dH2O. Disks were then stored in 1 mL Eppendorf tubes (Eppendorf UK Ltd., Stevenage,
UK) along with a cotton pellet moistened with 0.1% (w/v) thymol solution (BDH Laboratory Supplies,
Poole, UK) until required for preparation and sterilisation for use in the dCDFF.

Influence of Ca-Lactate vs. dH2O Exposure on Biofilm Formation and Cariogenicity under NaF Exposures | Ch. 8
196
Figure 8.2.3 (dCDFF Schematic Set-Up) a: Sterile STGM; b: Peristaltic Pump 3.0
mL.min-1
; c: Sterile 50 mM Sucrose Solution; d: Sterile NaF Solution (300 ppm F-); e:
Peristaltic Pump 0.38 mL.min-1
; f: Peristaltic Pump 10.0 mL.min-1
; g: Peristaltic Pump
0.38 mL.min-1
; h: Y-Connector; i: Grow-Back Trap; j: Sterile Ca-Lactate Solution (150
mM); k: Flask Containing Sterile dH2O; l: Peristaltic Pump 0.5 mL.min-1
; m: CDFF Unit
A; n: Inoculum with Magnetic Stirrer; o: CDFF Unit B; p: Effluent; *: 0.3 µm Air Filter.

Influence of Ca-Lactate vs. dH2O Exposure on Biofilm Formation and Cariogenicity under NaF Exposures | Ch. 8
197
8.3.0 Results
8.3.1 Enumeration of Biofilm Bacteria
Initially viable counts for FA, Lactobacillus spp., Streptococcus spp., MS and Veillonella spp. showed
no significant difference between either the Ca-lactate or dH2O exposure conditions (P ≥ 0.192).
However, following an initial concordance in results, a divergence in the growth trends soon
appeared. This begun with FA (Figure 8.3.1) on sample day 4 where a significant increase in the dH2O
condition (P < 0.001) lead to a difference between dCDFF conditions which was determined as
significant (P = 0.042). This early increase progressed to sample day 8 (P = 0.001) following which
viable counts then reached a more steady-state between days 8 and 16 (P = 0.933). In the Ca-lactate
condition a very different trend was observed. Viable counts decreased between days 4 and 8 (P =
0.002) however between days 8 and 16 this lower level remained stable (P = 0.138).
Figure 8.3.1 (Fastidious Anaerobes; FA): Conditions were exposed to either Ca-Lactate (150 mM) or dH2O at 10 mL.min-1
. Error bars represent the SD of the sample set (n=3), a single asterisk (*) indicates significantly (P < 0.050) different results between dCDFF condition and a double asterisk (**) denotes a highly significant difference.
Lactobacillus spp. did not show this same level of clarity with respect to their growth trends over
time (Figure 8.3.2). As noted above, no difference could be detected between either condition on
the 2nd day of the experiment, however, in contrast to FA (Figure 8.3.1), Lactobacillus spp. showed
no difference between dCDFF condition on sample day 4 also (P = 0.843). In fact, a clear divergence
between conditions was not observed until the 8th day where viable counts were significantly higher
in the dH2O condition (P < 0.001). However, between days 8 and 16, a crossover in the growth trends
*
**
**
6.90
7.40
7.90
8.40
8.90
9.40
9.90
0 2 4 6 8 10 12 14 16 18
Fast
idio
us
An
aero
be
s (F
A;
Lo
g10
CFU
.mm
-2)
Sample Day
dH2O Ca-Lactate

Influence of Ca-Lactate vs. dH2O Exposure on Biofilm Formation and Cariogenicity under NaF Exposures | Ch. 8
198
occurred. Nevertheless, comparisons of the trends in viable counts were applied in all cases. In the
Ca-lactate condition, viable counts of Lactobacillus spp. entered a relatively stable period between
days 4 and 8 (P = 0.993) however counts were seen to increase by day 16 (P < 0.001). Over this same
time period, viable counts in the dH2O condition increased on the 8th day (P = 0.001) then decrease
slightly (but significantly) between the 8th and 16th days.
Figure 8.3.2 (Lactobacillus spp.): Conditions were exposed to either Ca-Lactate (150 mM) or dH2O at 10 mL.min
-1. Error bars represent the
SD of the sample set (n=3) and a double asterisk (*) indicates a highly significant difference between dCDFF conditions (P < 0.050).
Streptococcus spp. (Figure 8.3.3), exhibited growth trends which were much more similar to that
seen for FA (Figure 8.3.1). Viable counts were initially indistinguishable on sample day 2 (P = 0.192)
and, although a divergence in CFU counts is evident in Figure 8.3.3, no significant difference was
detected between dCDFF conditions on sample day 4 either (P = 0.057). By sample day 8, viable
counts did however show a significant divergence and this difference persisted throughout the
course of the experiment (P < 0.001). Comparing counts in the dH2O condition, growth of
Streptococcus spp. increased by the 8th day (P = 0.030) then entered a then remained for the
remainder of the experiment (P = 0.865). However, a progressive decrease was observed in the Ca-
lactate condition. This was apparent from visual interpretation of Figure 8.3.3 and was statistically
significant between days 4 and 16 (P = 0.007) although between the individual sample points over
this period did not immediately show any significance (P ≥ 0.104). Ultimately, an approximate 2Log10
difference was achieved between CFU counts from either dCDFF condition.
**
**
3.50
4.00
4.50
5.00
5.50
6.00
0 2 4 6 8 10 12 14 16 18
Lact
ob
acill
us
spp
. (Lo
g10
CFU
.mm
-2)
Sample Day
dH2O Ca-Lactate
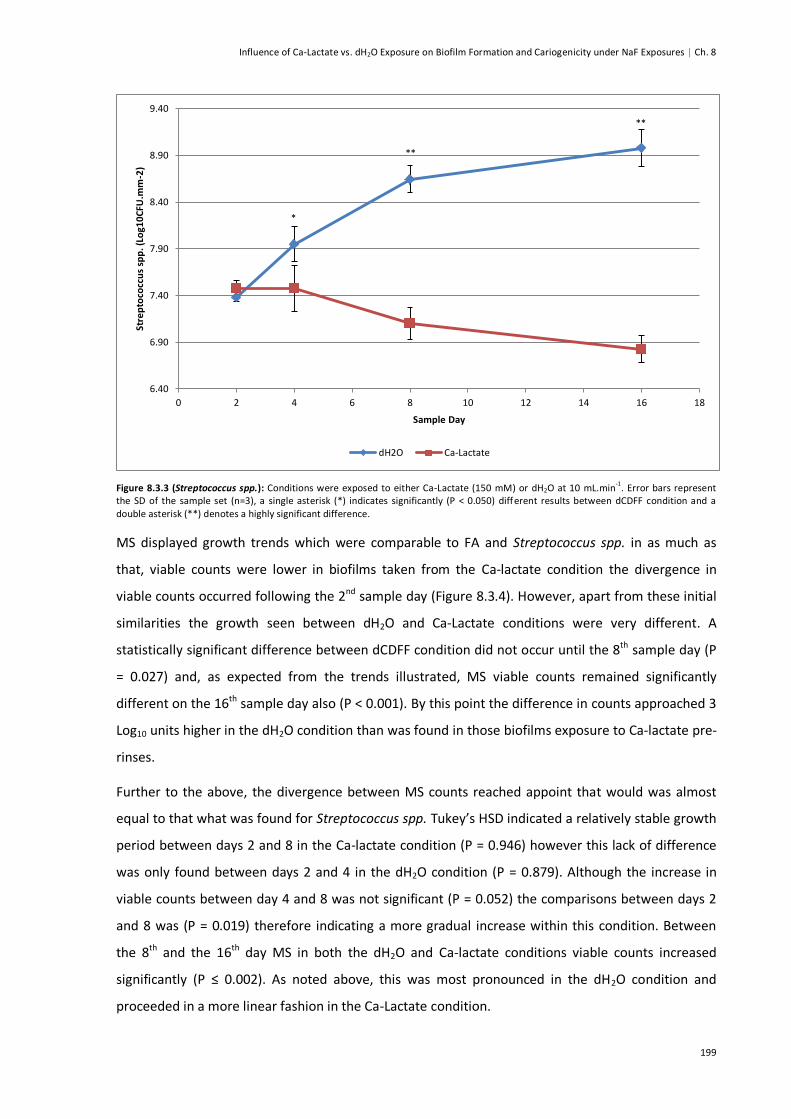
Influence of Ca-Lactate vs. dH2O Exposure on Biofilm Formation and Cariogenicity under NaF Exposures | Ch. 8
199
Figure 8.3.3 (Streptococcus spp.): Conditions were exposed to either Ca-Lactate (150 mM) or dH2O at 10 mL.min-1
. Error bars represent the SD of the sample set (n=3), a single asterisk (*) indicates significantly (P < 0.050) different results between dCDFF condition and a double asterisk (**) denotes a highly significant difference.
MS displayed growth trends which were comparable to FA and Streptococcus spp. in as much as
that, viable counts were lower in biofilms taken from the Ca-lactate condition the divergence in
viable counts occurred following the 2nd sample day (Figure 8.3.4). However, apart from these initial
similarities the growth seen between dH2O and Ca-Lactate conditions were very different. A
statistically significant difference between dCDFF condition did not occur until the 8th sample day (P
= 0.027) and, as expected from the trends illustrated, MS viable counts remained significantly
different on the 16th sample day also (P < 0.001). By this point the difference in counts approached 3
Log10 units higher in the dH2O condition than was found in those biofilms exposure to Ca-lactate pre-
rinses.
Further to the above, the divergence between MS counts reached appoint that would was almost
equal to that what was found for Streptococcus spp. Tukey’s HSD indicated a relatively stable growth
period between days 2 and 8 in the Ca-lactate condition (P = 0.946) however this lack of difference
was only found between days 2 and 4 in the dH2O condition (P = 0.879). Although the increase in
viable counts between day 4 and 8 was not significant (P = 0.052) the comparisons between days 2
and 8 was (P = 0.019) therefore indicating a more gradual increase within this condition. Between
the 8th and the 16th day MS in both the dH2O and Ca-lactate conditions viable counts increased
significantly (P ≤ 0.002). As noted above, this was most pronounced in the dH2O condition and
proceeded in a more linear fashion in the Ca-Lactate condition.
*
**
**
6.40
6.90
7.40
7.90
8.40
8.90
9.40
0 2 4 6 8 10 12 14 16 18
Stre
pto
cocc
us
spp
. (Lo
g10
CFU
.mm
-2)
Sample Day
dH2O Ca-Lactate

Influence of Ca-Lactate vs. dH2O Exposure on Biofilm Formation and Cariogenicity under NaF Exposures | Ch. 8
200
Figure 8.3.4 (Mutans streptococci; MS): Conditions were exposed to either Ca-Lactate (150 mM) or dH2O at 10 mL.min
-1. Error bars
represent the SD of the sample set (n=3), a single asterisk (*) indicates significantly (P < 0.050) different results between dCDFF condition and a double asterisk (**) denotes a highly significant difference.
Figure 8.3.5 (Veillonella spp.): Conditions were exposed to either Ca-Lactate (150 mM) or dH2O at 10 mL.min-1
. Error bars represent the SD of the sample set (n=3), a single asterisk (*) indicates significantly (P < 0.050) different results between dCDFF condition and a double asterisk (**) denotes a highly significant difference.
*
**
3.90
4.90
5.90
6.90
7.90
8.90
9.90
0 2 4 6 8 10 12 14 16 18
Mu
tan
s st
rep
toco
cci (
MS;
Lo
g10
CFU
.mm
-2)
Sample Day
dH2O Ca-Lactate
**
*
3.50
4.00
4.50
5.00
5.50
6.00
0 2 4 6 8 10 12 14 16 18
Ve
illo
ne
lla s
pp
. (L
og1
0C
FU.m
m-2
)
Sample Day
dH2O Ca-Lactate

Influence of Ca-Lactate vs. dH2O Exposure on Biofilm Formation and Cariogenicity under NaF Exposures | Ch. 8
201
Viable counts of Veillonella spp. (Figure 8.3.5) were much more similar to that of FA (Figure 8.3.1).
Although on an order of magnitude of approximately 3 Log10 units lower than CFU counts made on
FA, the actual distribution and shape of the growth curves in relation to each other and each dCDFF
condition were extremely similar for these 2 bacterial groups. In delineating trends for the
Veillonella spp., no significant difference was found up to sample day 4 (P ≥ 0.585) while viable
counts taken from biofilms extracted on days 8 and 16 were significantly different (P ≤ 0.001). In
biofilms extracted from the dH2O condition the increase in viable counts was delayed between days
2 and 4 (P = 0.985) following which marked increase occurred between the 4th and 8th days of the
experiment (P = 0.006). Viable counts did increase further by day 16 however only to a relatively
minor and hence non-significant degree (P = 0.441). In the Ca-lactate condition, biofilms were found
to be similar with respect to the proportion of Veillonella spp. at all points between sample day 2
and 8 (P ≥ 0.077) however a decrease in mean viable counts made on the 8th sample day generated a
significantly different result where counts made on the 16th day were significantly higher (P = 0.047).

Influence of Ca-Lactate vs. dH2O Exposure on Biofilm Formation and Cariogenicity under NaF Exposures | Ch. 8
202
8.3.2 TMR of dCDFF-Exposed Enamel Disks
Out of the 18 enamel disks exposed within each dCDFF unit between 4 and 5 thin sections were
initially cut. These were then analysed individually for each dCDFF condition and sample day
following which data for specific TMR parameters were collected and aggregated to the individual
enamel block from which they were sectioned. Due to the lack of any discernible SLs in the initially
sound enamel surfaces, measurements of SMax were not collected for the initially sound enamel
sections, all other TMR parameters are expressed below in relation to the sample day on which they
were extracted and the dCDFF unit condition to which they were exposed (Table 8.3.1).
Condition Sample Day n (Enamel Disks) ΔZ ± SD LD ± SD R ± SD
dH2O 8 3 220.00 ± 37.33 8.52 ± 2.44 27.14 ± 10.18
Ca-Lactate 8 3 195.56 ± 74.11 10.21 ± 2.35 18.71 ± 4.97
dH2O 16 3 280.83 ± 41.10 11.50 ± 1.11 24.09 ± 1.25
Ca-Lactate 16 1 385.00 ± -------- 19.20 ± -------- 19.00 ± --------
Table 8.3.1 (TMR Parameters of Initially Sound Enamel Surfaces): Parameters of integrated mineral loss (ΔZ), lesion depth (LD) and average mineral loss (R) along with the sample size (n) are listed in-line with same day and dCDFF condition. Hyphens (-) indicate a condition where data was not available.
Mean scan profiles were interpreted but are note presented due to the fact both no benefit was
able to gained from their interpretation (lesion architecture was not apparent). TMR parameters
(Table 8.3.1) were assessed however several thin sections were lost from the samples extracted
from the Ca-lactate condition on the 16th day of the experiment. Nevertheless, some insight was
gained from their interpretation. In the dH2O condition, no mineral loss (as measured by ΔZ) was
detected over that which could be explained by the error associated with the TMR procedure (200
%Vol.um) in samples extracted on either the 8th (Figure 8.3.6a) or the 16th (Figure 8.3.6b) day of the
experiment [Arends and ten Bosch, 1992]. This was also true for LD (5 µm) however a high level of
variation was seen within each sample set. Between sample days 8 and 16, the difference in ΔZ, LD
and R was not significant (P ≥ 0.131).
In the Ca-lactate condition, the recorded measurements of ΔZ and LD were below that associated
with the error of the TMR procedure [Arends and ten Bosch, 1992] on the 8th day (Figure 8.3.7a).
Although in measurements made from samples extracted on the 16th day (Figure 8.3.7b), it appeared
that some demineralisation did occur. However, as noted above, the sample set gained on this
occasion was severely limited (n = 1) and therefore prone to the effect of error or biological variation
in the samples. To this end, an unusual mineral density was detected in this enamel section possible
due to the ELT and the proximity of the surface to the EDJ. Statistical analyses were nonetheless
applied to these samples and it was found that no significant difference could be detected in ΔZ, LD
or R (P ≥ 0.080). In agreement with the observation of unusual mineral density profiles, LD showed
the greatest difference between each sample set (P = 0.080).

Influence of Ca-Lactate vs. dH2O Exposure on Biofilm Formation and Cariogenicity under NaF Exposures | Ch. 8
203
Figure 8.3.7a (TMR Parameters of Initially Sound Enamel Surfaces; Day 8): LD (µm) and R (%Vol) share the left axis. ΔZ (%Vol.µm) measurements are plotted on the right for the purposes of clarity. Results correspond to data in Table 8.3.1 and error bars represent the SD of the sample set (n = 3).
Figure 8.3.7b (TMR Parameters of Initially Sound Enamel Surfaces; Day 16): LD (µm) and R (%Vol) share the left axis. ΔZ (%Vol.µm) measurements are plotted on the right. Results correspond to data in Table 8.3.1 and error bars represent the SD of the sample set (n = 3 unless otherwise indicated). An asterisk indicates significant differences (P < 0.050) between parameters of the dCDFF conditions.
0
10
20
30
40
50
60
70
80
90
0
50
100
150
200
250
300
ΔZ LD R
De
pth
(µ
m)
/ M
ine
ral V
olu
me
(%
Vo
l)
Inte
rgra
ted
Min
era
l Lo
ss (
ΔZ;
%V
ol.
µm
)
Parameter
Sample Day 8 (dH2O) Sample Day 8 (Ca-Lactate)
0
10
20
30
40
50
60
70
80
90
0
50
100
150
200
250
300
350
400
450
ΔZ LD R
De
pth
(µ
m)
/ M
ine
ral V
olu
me
(%
Vo
l)
Inte
rgra
ted
Min
era
l Vo
lum
e (
ΔZ;
%V
ol.
µm
)
Parameter
Sample Day 16 (dH2O) Sample Day 16 (Ca-Lactate)
*
(n = 1) (n = 1) (n = 1)

Influence of Ca-Lactate vs. dH2O Exposure on Biofilm Formation and Cariogenicity under NaF Exposures | Ch. 8
204
Between dCDFF conditions, no significant differences were found between ΔZ, LD, or R in samples
extracted on the 8th day of the experiment (P ≥ 0.267). However, for samples extracted on the 8th
day of the experiment LD was significantly higher (P = 0.026) in the enamel sections exposure to the
Ca-lactate condition. Parameters of ΔZ and R did not differ significantly (P ≥ 0.072) between either
dCDFF condition at this point.
Condition Sample Day n (En Disks) ΔZ ± SD LD ± SD R ± SD SMax ± SD
dH2O (Base) 8 3 1689.17 ± 444.76 70.11 ± 13.58 23.94 ± 2.73 60.30 ± 7.39
Ca-Lactate (Base) 8 3 2862.50 ± 822.16 88.38 ± 9.46 32.09 ± 7.86 48.14 ± 9.60
dH2O (Base) 16 3 1890.00 ± 270.73 78.25 ± 9.40 24.62 ± 4.72 55.61 ± 3.92
Ca-Lactate (Base) 16 3 2180.56 ± 466.19 77.36 ± 14.65 28.11 ± 2.19 55.74 ± 5.61
dH2O (Post) 8 3 1749.72 ± 376.07 69.03 ± 6.92 24.96 ± 2.67 57.69 ± 4.27
Ca-Lactate (Post) 8 3 2433.33 ± 333.63 76.34 ± 7.36 32.43 ± 6.14 43.13 ± 14.35
dH2O (Post) 16 3 1397.50 ± 291.26 63.85 ± 7.44 21.85 ± 3.03 59.95 ± 2.22
Ca-Lactate (Post) 16 3 1567.78 ± 543.86 63.47 ± 12.11 24.04 ± 4.42 59.88 ± 5.00
Table 8.3.2 (TMR Parameters of Pre-Made Enamel Lesions): Parameters of integrated mineral loss (ΔZ), lesion depth (LD) , average mineral loss (R) and the degree of SL mineralisation (SMax) along with the sample size (n) are listed in-line with same day and dCDFF condition. Parameters are presented as baseline (Base) and post-exposure (Post) groups.
SL measurements were possible from the enamel sections of the artificially created enamel lesions.
The measurements made are presented in Table 8.3.2 on an aggregated basis for each enamel block
where un-exposed areas are marked as baseline measurements (Base) and exposure areas are
marked as post-exposure (Post). The calculations made for ΔΔZ, ΔLD and ΔR are also illustrated
together in Figure 8.3.8 for the purposes of comparison.
Between either dCDFF condition, no significant difference were found with respect to ΔΔZ (P =
0.216), ΔLD (P = 0.320), ΔR (P = 0.687) or ΔSMax (P = 0.726) on the 8th sample day and this was also
true when the lesions extracted from either condition on the 16th sample day were compared (P ≥
0.270). However, some differences were found when comparisons were made between samples
days. In the dH2O condition, ΔLD did not show any significant increase (P = 0.334) between samples
extracted on the 8th and 16th days although a numerical increase was apparent (Figure 8.3.8). This
was also true for ΔSMax (P = 0.143). However, ΔΔZ did indicate some significant increase (P = 0.049)
and closer inspection of the parameters found this to lie in an increase which was detected in ΔR (P =
0.030). Therefore, some evidence of remineralisation was captured between sample days in the
lesions which were exposed to the dH2O condition.
In the Ca-lactate condition, no significant differences were found between sample days for ΔΔZ, ΔLD,
ΔR or ΔSMax (P ≥ 0.234). However, from what is visually apparent from the data present in Figure
8.3.2, the cause of this was a lack of difference between samples which were extracted on either
occasion when in fact some reduction in the lesion parameters was evident for all of the pre-made

Influence of Ca-Lactate vs. dH2O Exposure on Biofilm Formation and Cariogenicity under NaF Exposures | Ch. 8
205
lesions which were included within these units. Further to this interpretation, the magnitude of the
changes in all parameters was small and given a combined error of 400 %Vol.µm for ΔΔZ and 10 µm
for ΔLD [Arends and ten Bosch, 1992], unequivocal difference following exposure of the lesions
within either dCDFF condition could not be concluded definitively.
Figure 8.3.8 (TMR Parameters of Pre-Made Lesions Following Exposure within the dCDFF): LD (µm) and R (%Vol) share the left axis. ΔZ (%Vol.µm) measurements are plotted on the right. Results correspond to data in Table 8.3.2 and error bars represent the SD of the sample set (n = 3 unless otherwise indicated).
Unfortunately, all enamel groove structures were severely damaged during the TMR sectioning
process. In this case, visual inspection was not possible due to the extent of the damage and the
limited number of section which were included. However, visual inspection was performed on the
enamel lesions which were extracted from smooth surfaces of both the initially sound enamel
tissues and those in which artificial lesions had been created prior to insertion into the dCDFF.
Inspection under radiographic examination was able to confirm that surface loss was not apparent in
any of the section as a continuous edge was visible between both exposed an un-exposed areas.
-400
-200
0
200
400
600
800
1000
-20
-10
0
10
20
30
40
50
dH2O (Day 8) Ca-Lactate (Day 8) dH2O (Day 16) Ca-Lactate (Day 16)
Ch
ange
in I
nte
rgra
ted
Min
era
l Lo
ss (
ΔΔ
Z; %
Vo
l.µ
m)
Ch
ange
in D
ep
th (
µm
) /
Ch
ange
in M
ine
ral V
olu
me
(%
Vo
l)
dCDFF Condition (Sample Day)
ΔLD (µm) ΔR (%Vol) ΔΔZ (%Vol.µm)

Influence of Ca-Lactate vs. dH2O Exposure on Biofilm Formation and Cariogenicity under NaF Exposures | Ch. 8
206
8.3.3 Organic Acid, Anion and Cation Analysis
In both anion and cation separation, all traces were able to be analysed by the CE technique.
However, an unusual area was noted around the expect zone for phosphate and butyrate peaks in
anions separations (Figure 8.3.9). Nevertheless baseline adjustments were applied to the peaks
within this area and data also collected but was interpreted with caution. Further to this, several
unidentified peaks were detected during these separations although the presence of these did not
hinder the interpretation of the chosen analytes. Cation separations performed well and thus all
traces were able to be analysed fully.
Figure 8.3.9 (CE Anion Trace): Trace relates to a PF separation from a biofilm extracted from the Ca-lactate condition on day 8. Hash (#) indicates an unidentified peak; a) distorted area hindering both identification and quantification of phosphate and butyrate peaks.
As with previous separations, lactate was the most abundant organic acid detected following the
sucrose exposures and this was true for both Ca-Lactate and dH2O condition (Figure 8.3.10). As
expected, lactate was significantly higher within the PF of samples from the Ca-Lactate condition
than in those from the dH2O condition on both sample days (P < 0.001). However, between the
samples taken on the 8th and 16th days, a significant increase in lactate was found in the Ca-Lactate
condition (P = 0.017) whereas no such difference was found between sample which were extracted
from the dH2O condition (P = 0.537). It would therefore be suggested that continued exposure to
both NaF and Ca-lactate led to a greater accumulation of the lactate ion within the PF phase than
with exposure to NaF alone. Acetate was again the second most predominant organic acid. Here
significant differences were again found between dCDFF conditions (Figure 8.3.11). However, unlike
lactate, the relationship was not found to be as consistent. Acetate was initially measured as higher
(P = 0.038) in the dH2O condition but by the 16th day of the experiment higher PF concentrations
were found in the Ca-lactate condition (P = 0.002). However, it should be noted that both the
magnitude of the difference and the absolute magnitude of the concentration also increased. To this
end, the increase between sample days 8 and 16 was highly significant in both cases (P < 0.001).

Influence of Ca-Lactate vs. dH2O Exposure on Biofilm Formation and Cariogenicity under NaF Exposures | Ch. 8
207
Figure 8.3.10 (PF Lactate Concentrations): Concentrations are expressed in mM quantities. Error bars represent the SD (n = 3). Significant differences (P < 0.050) between dCDFF conditions are denoted by a single asterisk (*) whereas a highly significant difference (P < 0.001) is denoted by a double asterisk (**).
Figure 8.3.11 (PF Acetate Concentrations): Concentrations are expressed in mM quantities. Error bars represent the SD (n = 3). Significant differences (P < 0.050) between dCDFF conditions are denoted by an asterisk (*) whereas a highly significant difference (P < 0.001) is denoted by a double asterisk (**).
**
**
0.0
5.0
10.0
15.0
20.0
25.0
30.0
35.0
8 16
Lact
ate
Co
nce
ntr
atio
n (
mM
)
Sample Day
dH2O Ca-Lactate
*
*
0.0
2.0
4.0
6.0
8.0
10.0
12.0
14.0
16.0
8 16
Ace
tate
Co
nce
ntr
atio
n (
mM
)
Sample Day
dH2O Ca-Lactate

Influence of Ca-Lactate vs. dH2O Exposure on Biofilm Formation and Cariogenicity under NaF Exposures | Ch. 8
208
Succinate and propionate were also detected in small quantities in all of the samples which were
analysed; these data are presented along with their relative contribution to PF composition in Figure
8.3.12a, 8.3.12b, 8.3.12c and 8.3.12d correspondingly for sample day and dCDFF condition. With
respect to propionate, no significant difference was found between measurements which were
made on the 8th sample day (P = 0.530) between conditions or between the 8th and 16th days of the
dH2O condition (P = 0.951). However a significant increase did occur between the 8th an 16th days
within the Ca-lactate condition (P = 0.002) which thus lead to significantly levels of acetate in the PF
of biofilms extracted from the Ca-lactate than those extracted from the dH2O condition (P = 0.003).
An increase in the levels of succinate production was also detected in both conditions between the
8th and 16th days (P ≤ 0.003) although the increase was most pronounce within the PF samples which
were extracted from the dH2O condition. On the 8th sample day, the PF concentration of succinate
was higher in the samples taken from the Ca-lactate condition (P = 0.005) however, due to the
reduced rate of accumulation (or production) noted above, significantly greater concentrations were
found in the samples extracted from the dH2O on the 16th sample day (P = 0.006).
As is evident from the Figure 8.3.12a to 8.3.12d, formate was detected but not consistently
throughout the experiment. On the 8th sample day, it was detected in both dCDFF conditions with a
significantly greater amount found in in the Ca-lactate condition (P = 0.002). However by the 16th
sample day, the concentrations within PF samples from the dH2O condition had dropped BMDL
(62.48 µM) and thus formate was only detected in one of the samples taken from the Ca-lactate
condition. Therefore, statistical comparisons within dCDFF units and between sample days were not
possible neither were comparisons between conditions on the 16th day.
As was expected from the inconsistencies noted in the anion traces (Figure 8.3.9), some unusual
results were found when analysing data which was collected for butyrate. Specifically, an unusually
large concentration was detected on the 16th sample day in the dH2O condition (Figure 8.3.12c). This
result meant that comparisons between conditions showed no significant difference between dCDFF
conditions on the 8th sample day (P = 0.217) or within the Ca-lactate condition between the 8th and
16th sample days (P = 0.247). However, the large difference was found between dCDFF conditions on
the 16th sample day (P < 0.001) and between the 8th and 16th sample days within the dH2O condition
(P < 0.001).

Influence of Ca-Lactate vs. dH2O Exposure on Biofilm Formation and Cariogenicity under NaF Exposures | Ch. 8
209
Figure 8.3.12a (Plaque Fluid Composition on Day 8; Ca-Lactate Condition): All detected analytes are shown in their relative contributions to the PF immediately after a 15 minute sucrose pulse. Concentrations (Mean ± SD; µM) for each are listed adjacent to the segment labels. Nitrate was determined as BMDL.
Figure 8.3.12b (Plaque Fluid Composition on Day 8; dH2O Condition): All detected analytes are shown in their relative contributions to the PF immediately after a 15 minute sucrose pulse. Concentrations (Mean ± SD; µM) for each are listed adjacent to the segment labels. Nitrate was determined as BMDL.
Acetate (2409.37 ± 201.29)
Ammonium (7034.60 ± 1206.64)
Butyrate (642.15 ± 30.93)
Calcium (5414.54 ± 597.48)
Chloride (9486.86 ± 653.77)
Flouride (365.19 ± 35.92)
Formate (364.27 ± 44.31)
Lactate (18354.66 ± 693.11)
Magnesium (449.69 ±
63.72)
Phosphate (651.92 ±
57.33)
Potassium (6669.22 ± 1035.5)
Propionate (256.22 ±
9.68)
Sodium (12898.31 ± 2088.12)
Succinate (565.16 ± 34.51)
Sulphate (340.69 ± 30.29)
Day 8 (Ca-Lactate; Post-Sucrose)
Acetate (3010.72 ± 275.54)
Ammonium (8689.79 ± 801.87)
Butyrate (750.61 ± 124.66)
Calcium (1849.52 ±
93.05)
Chloride (8811.91 ± 844.19)
Flouride (365.55 ± 55.92)
Formate (99.88 ± 40.00)
Lactate (8386.83 ± 604.61)
Magnesium (230.75 ± 5.23)
Phosphate (359.77 ± 144.42)
Potassium (5255.04 ± 688.57)
Propionate (267.97 ± 28.03)
Sodium (9924.35 ± 1406.98)
Succinate (420.22 ± 28.94)
Sulphate (327.06 ± 30.52)
Day 8 (dH2O; Post-Sucrose)

Influence of Ca-Lactate vs. dH2O Exposure on Biofilm Formation and Cariogenicity under NaF Exposures | Ch. 8
210
Figure 8.3.12c (Plaque Fluid Composition on Day 16; Ca-Lactate Condition): All detected analytes are shown in their relative contributions to the PF immediately after a 15 minute sucrose pulse. Concentrations (Mean ± SD; µM) for each are listed adjacent to the segment labels. Nitrate and formate were determined as BMDL.
Figure 8.3.12d (Plaque Fluid Composition on Day 16; dH2O Condition): All detected analytes are shown in their relative contributions to the PF immediately after a 15 minute sucrose pulse. Concentrations (Mean ± SD; µM) for each are listed adjacent to the segment labels. Nitrate was determined as BMDL.
Acetate (12193.52 ± 10958.9)
Ammonium (13850.29 ± 509.85)
Butyrate (459.13 ± 232.25)
Calcium (7526.21 ± 75.75)
Chloride (11281.24 ± 1008.3)
Flouride (364.13 ± 33.41)
Formate (93.16 ± 0.00)
Lactate (23604.79 ± 2219.22)
Magnesium (419.30 ± 24.07)
Phosphate (1090.57 ± 69.36)
Potassium (6968.35 ±
183.05)
Propionate (545.18 ±
68.32)
Sodium (12191.26 ± 404.18)
Succinate (874.80 ±
75.46) Sulphate
(476.86 ± 34.26)
Day 16 (Ca-Lactate; Post-Sucrose)
Acetate (7078.56 ± 617.24)
Ammonium (16053.58 ± 923.31)
Butyrate (4623.18 ± 515.39)
Calcium (1531.55 ± 85.97)
Chloride (6047.70 ± 368.56)
Flouride (158.54 ± 24.78)
Lactate (8029.94 ± 688.85)
Magnesium (380.38 ± 36.01)
Phosphate (895.38 ± 69.15) Potassium
(3735.95 ± 262.55)
Propionate (269.46 ±
28.31)
Sodium (8107.14 ± 729.19)
Succinate (1243.35 ± 94.34)
Sulphate (301.03 ± 17.44)
Day 16 (dH2O; Post-Sucrose)

Influence of Ca-Lactate vs. dH2O Exposure on Biofilm Formation and Cariogenicity under NaF Exposures | Ch. 8
211
As would be expected, fluoride was detected in both dCDFF units and on both of the sample days
(Figure 8.3.13). On the 8th sample day, no significant difference was found between dCDFF
conditions (P = 0.993). However by the 16th day, a relative reduction in the dH2O condition (P =
0.001) resulted in comparatively higher concentrations in the Ca-lactate condition (P = 0.004)
although within the Ca-lactate condition no change in PF fluoride occurred between the 8th and 16th
days (P = 0.972). Thus from these data, it appeared that the retention of fluoride was high in the
presence of NaF with or without Ca-lactate pre-rinses however in the longer term, a greater degree
of retention persisted with the inclusion of Ca-lactate within the exposure strategy.
Figure 8.3.13 (PF Fluoride Concentrations): Concentrations are expressed in mM quantities and a conversation into parts per million [ppm] is provided for each set. Error bars represent the SD (n = 3). Significant differences (P < 0.050) between dCDFF conditions are denoted by an asterisk (*) whereas a highly significant difference (P < 0.001) is denoted by a double asterisk (**).
Phosphate was significantly higher (P ≤ 0.031) on both sampling occasions in the Ca-Lactate
condition (Figure 8.3.14). Furthermore, under both exposures an increase occurred between the
sample day 8 and sample day 16 which was, again, significant in both cases (P ≤ 0.004). However, as
was noted for butyrate, the point at which phosphate peaks emerged on the CE traces was subject
to interference. This did appear consistently between all samples and automatic integration fixes
were applied to compensate but interpretation of the results did suffer. As such, inaccuracies in the
absolute magnitude of each peak may have been most affected (albeit at a minimum due to the
integration fixes applied) however, in a relative sense difference between the phosphate measured
in each condition and at each sample point were considered reliable.
[6.94 ppm]
[3.01 ppm]
[6.93 ppm] [6.91 ppm]
0
0.1
0.2
0.3
0.4
0.5
0.6
8 16
Flu
ori
de
Co
nce
ntr
atio
n (
mM
)
Sample Day
dH2O Ca-Lacate
**

Influence of Ca-Lactate vs. dH2O Exposure on Biofilm Formation and Cariogenicity under NaF Exposures | Ch. 8
212
Figure 8.3.14 (PF Phosphate Concentrations): Concentrations are expressed in mM quantities and error bars represent the SD (n = 3). Significant differences (P < 0.050) between dCDFF conditions are denoted by an asterisk (*).
Figure 8.3.15 (PF Ammonium Concentrations): Concentrations are expressed in mM quantities and error bars represent the SD (n = 3). Significant differences (P < 0.050) between dCDFF conditions are denoted by an asterisk (*) whereas a highly significant difference (P < 0.001) is denoted by a double asterisk (**).
*
*
0.0
0.2
0.4
0.6
0.8
1.0
1.2
1.4
8 16
Ph
sop
hat
e C
on
cen
trat
ion
(mM
)
Sample Day
dH2O Ca-Lactate
*
0.0
2.0
4.0
6.0
8.0
10.0
12.0
14.0
16.0
18.0
8 16
Am
mo
niu
m C
on
cen
trat
ion
(mM
)
Sample Day
dH2O Ca-Lactate

Influence of Ca-Lactate vs. dH2O Exposure on Biofilm Formation and Cariogenicity under NaF Exposures | Ch. 8
213
In both dH2O and Ca-lactate conditions, the concentration of PF ammonium almost doubled over the
course of the experiment (Figure 8.3.15). In both cases this increase was highly significant (P <
0.001). A small difference was observed between dCDFF conditions and in general, lower
concentrations were found in the PF extracted from the Ca-lactate. As is illustrated in Figure 8.3.15,
this difference did not reach significance on the 8th sample day (P = 0.119) but did between
measurements taken on the 16th (P = 0.022).
PF sulphate concentrations remained stable between the data sets which were available from the
dH2O condition (P = 0.269) however a significant increase occurred between sample day 8 and 16 in
the Ca-lactate condition (P = 0.007). This increase coupled with the steady-state within the dH2O
condition meant that initially non-dissimilar results on the 8th day (P = 0.612) had become
significantly higher in the Ca-lactate condition by the 16th day (P = 0.001).
Figure 8.3.16 (PF Calcium Concentrations): Concentrations are expressed in mM quantities and error bars represent the SD (n = 3). Significant differences (P < 0.050) between dCDFF conditions are denoted by an asterisk (*) whereas a highly significant difference (P < 0.001) is denoted by a double asterisk (**).
Calcium was higher in biofilms which were exposed to both NaF and Ca-lactate (P ≤ 0.001). ON both
sampling occasions, the concentration within the PF was over double and, on the 16th day, treble
that which was found in the condition where Ca-lactate was not included (Figure 8.3.16). However,
from the 8th day to 16th day PF calcium was significantly lower in the samples which were extracted
from the dH2O condition (P = 0.012) whereas the opposite occurred in the PF of biofilms from the
*
**
0.0
1.0
2.0
3.0
4.0
5.0
6.0
7.0
8.0
9.0
8 16
Cal
ciu
m C
on
cen
trat
ion
(m
M)
Sample Day
dH2O Ca-Lactate
Influence of Ca-Lactate vs. dH2O Exposure on Biofilm Formation and Cariogenicity under NaF Exposures | Ch. 8
214
Ca-lactate condition (P = 0.004). Therefore, the results demonstrated both a higher PF calcium
concentration and indicated a level of enrichment when exposed to Ca-lactate. However, due to lack
of resolution in the longitudinal aspect of the data, the precise relationship concerning the
enrichment of PF calcium given this external source remains to be seen.
An interesting relationship was also found within the levels of magnesium. Under exposure to NaF
alone, a gradual increase occurred within the PF (P = 0.004). In the Ca-lactate condition, no
difference was found between the sample sets from this condition (P 0.195). Furthermore, PF
magnesium was initially lower on the 8th day in the dH2O condition (P = 0.002) but the fact that an
increase occurred under these conditions meant that by the end of the experiment PF magnesium
was indistinguishable between dCDFF condition by the end of the experiment (P = 0.483). It would
therefore be indicate that the adjunct effect of Ca-lactate within this model resulted in an
accelerated accumulation of magnesium although over a 16-day period, PF magnesium was able to
reach a comparable level under exposure to NaF alone.
Chloride remained constant throughout the Ca-lactate condition (P = 0.061) however in the dH2O
condition the PF concentrations decreased significantly between the 8th and 16th days (P = 0.007). On
the 8th sample day there was no significant difference between either condition (P = 0.335) but the
reduction which occurred in PF samples from the dH2O condition meant that significantly higher
chloride concentrations were found in the Ca-Lactate condition by the end of the experiment (P =
0.001).
The remaining 2 analytes which were alluded (sodium and potassium) followed similar trends to that
which was found for chloride in that concentrations were numerically higher in PF samples from the
Ca-lactate condition and within the dH2O condition concentrations decreased over the course of the
experiment. Further to the comparisons with PF chloride, no significant change PF potassium
occurred over the course of the experiment in the Ca-lactate condition (P = 0.648) whereas a
significant decrease was detected in the dH2O condition (P = 0.023). However this was not true for
sodium, in this instance PF concentrations remained constant throughout both conditions (P ≥
0.118). Between conditions, a similarity to chloride was seen between chloride and both sodium and
potassium in that, as noted above for chloride, no significant difference was found between biofilms
which were exposed to either Ca-lactate or dH2O on the 8th day (P ≥ 0.120 ) but by the 16th sample
day concentration were comparatively lower in the dH2O condition (P ≤ 0.001)

Influence of Ca-Lactate vs. dH2O Exposure on Biofilm Formation and Cariogenicity under NaF Exposures | Ch. 8
215
8.4.0 Discussion
8.4.1 Microbial Composition of Plaque Biofilms
The inclusion of Ca-lactate into the exposure strategy appeared to have a strong effect on the
microbial populations as a whole. However, in line with the concept proposed by Bowden and
Brownstone [Unpublished], the addition of an external source of lactate did not alter the population
of Veillonella spp. (Figure 8.3.5) in any way which was not seen for any of the other microbial groups
which were sampled [Bowden, 1993]. However, it did appear that the proliferation of each of the
microbial groups was altered in some way. For FA (Figure 8.3.1), Streptococcus spp. (Figure 8.3.3),
MS (Figure 8.3.4) and Veillonella spp. (Figure 8.3.5), viable counts rose to noticeably higher
proportions in the absence of Ca-lactate exposures whereas in its presence, the proliferation of each
of these groups appeared to be suppressed. The only exception to this was for Lactobacillus spp.
(Figure 8.3.2) where the growth within the Ca-lactate condition was initially suppressed but went on
the show an increase by the end of the experiment. In explanation of this finding, it appeared that
the viable counts of Lactobacillus spp. were initially lower by the 8th day with the increase being
unusual as if the result of a population bloom [Skopek et al., 1993]. Members of this genera which
were able to best exploit the conditions within these particular biofilms would tend to proliferate
[Kinniment et al., 1996; Marsh, 1994]. However, the observed result for Lactobacillus spp. may be
distinct but within the EPH [Marsh, 1994] as the ability to actively compete would be conferred to all
aciduric organisms within a cariogenic biofilm but changes in the proportions of species within the
aciduric class can occur as a natural process of succession takes place.
Microbial communities possess a wide range of regularity mechanisms which enable them to
effectively react to their environment [Hojo et al., 2009]. One such class of reactions are known as
negative-feedback loops whereby the accumulation of an end product results in a decrease in the
production of the said product. This usually occurs when the end product is toxic in some way and
thus the continued production would be deleterious to the survival of the organism. The production
of lactate may be one such case. It has been shown that the pH which is induced by the production
of this acid can inhibit the metabolism of pH sensitive microbes [Iwami and Yamada, 1980] however
Dibdin and Shellis [1988] demonstrated that the addition of neutralised lactate to Streptococcus
mutans biofilms resulted in a marked decrease in acid production. Brudevold et al. [1985] explained
this on the basis of the buffering capacity of the lactate anion as opposed to an impact of the
microbial community directly. Nevertheless, inhibitory activity has been observed in batch culture
under controlled pH [Hongo et al., 1986] indicating that some effect on the microbial population
may exist which has yet to be described in full.

Influence of Ca-Lactate vs. dH2O Exposure on Biofilm Formation and Cariogenicity under NaF Exposures | Ch. 8
216
8.4.2 Comparative Plaque Fluid Composition
Initially, the data concerning the PF composition of the previous dCDFF experiments which included
NaF exposures (Section 7.3.3) did not allow for comparisons with the present work as the biofilms
here had reached distinctly later stages of maturity. However, the comparisons over what effect Ca-
lactate may have had are still possible. For example, an interesting observation was made for PF
acetate (Figure 8.3.11). Although viable counts of FA, Streptococcus spp. and MS appeared supressed
in the Ca-lactate condition of the present work, PF acetate was significantly higher by the 16th day of
the experiment. As was described for the additive effect of calcium and fluoride in altering biofilm
structure [Rose and Turner, 1998], if the diffusive entry of sugars was in fact increased under
exposure to Ca-lactate then this may explain the greater metabolic activity during a cariogenic
challenge [Dibdin and Shellis, 1988] suggested by elevated PF acetate. However, due to the ubiquity
of hetero-fermentative pathways [Davis, 1955; Hosseini et al., 2011; Kleinberg, 2002; Marsh and
Martin, 2009a; Thomas et al., 1979; Wijeyeweera and Kleinberg, 1989a], it is also likely that part of
the increase in lactate observed between the 8th and 16th days in the Ca-lactate condition may have
also been the result of microbial fermentation.
8.4.2.1 Organic Acid Production
An enhanced ability for fermentation is also indicated by the comparatively greater amounts of
formate and propionate detected in the Ca-lactate condition by the 16th day of the experiment.
However, contrary to this, succinate production rose to greater levels in the dH2O condition. The
reason for this may have been due to changes in the un-quantified microbial population such as
Bifidiobacterim spp., Prevotella spp. and Wollinella spp. although without quantification of these
genera it would not be possible to make any firm conclusion on how the concentrations of these
analytes were affected. In order to perform such definitive analysis, an approach inclusive of
detailed species identification in conjunction with metabolic capacity would be required [Nyvad et
al., 2013]. To this end, butyrate production may have also shed further light on changes in metabolic
activity under exposure to Ca-lactate but the difficulties which occurred during separations of this
analyte (Figure 8.3.9) did not provide an acceptable level of consistency.
Interestingly higher concentrations of PF sulphate were also found in the Ca-lactate condition
however these concentrations were very low and therefore were most likely a product of
equilibrium with STGM (Figure 4.3.5). The concentrations of PF magnesium were also unusual as
these were initially lower in the dH2O condition but, by the end of the experiment, PF concentrations
had reached statistically similar values. Magnesium was, again, a minor constitute although its
presence is unexpected as calcium is known to displace magnesium from biological reservoirs
afforded by the bacterial cells and their surface antigens [Rose, 1996; Rose and Hogg, 1995].

Influence of Ca-Lactate vs. dH2O Exposure on Biofilm Formation and Cariogenicity under NaF Exposures | Ch. 8
217
However, a greater production of negatively charged binding sites in response to the stress induced
by high calcium exposures [Rølla et al., 1978] would also provide further binding sites for
magnesium. Therefore, in biofilms which had continually been exposed Ca-lactate, a greater capacity
for magnesium binding may have also occurred in the earlier stages thus explaining the greater PF
magnesium concentrations detected throughout this condition (compared with the delay in
accumulation which was found in the biofilms produced within the dH2O condition).
PF concentrations of potassium, sodium and chloride behaved in a similar manner although the
concentrations were (as with previous results in Section 6.3.3) much lower than what would be
expected from in vivo plaque [Margolis and Moreno, 1994]. In the context of the present work,
concentrations were numerically lower in the NaF condition than in the Ca-lactate condition where
these PF concentrations remained stable over the course of the experiment. In the dH2O condition,
concentrations sequentially dropped to a point which had become significant by the 16th day. The
concept that a more diffusive structure had been maintained under exposure to Ca-lactate (which
thus allowed for equilibrium with the STGM; Figure 4.3.5) is supported by this trend.
Ammonium production increased in both conditions and, although concentrations were slightly
higher in the dH2O condition, similar values were obtained for both conditions (Figure 8.3.15). Given
a higher proportion of viable bacterial counts in the dH2O condition, greater concentrations of this
metabolic end product are not surprising. Bacteria such as Actinomyces naeslundii, Streptococcus
sanguinis and Streptococcus mutans have all been shown to possess significant arginolytic activity
within mixed cultures [Wijeyeweera and Kleinberg, 1989a]. The proportion of viable MS did increase
between the 8th and 16th days (Figure 8.3.4) although a group directly indicative of Actinomyces spp.
was not recorded. Alterations in the proportions of these bacteria may have thus occurred outside
the scope of the sampling methods applied but what is indicated by the trends in ammonium is that
the collective physiology of the biofilms shifted towards a greater capacity for ammonia production
in both dCDFF conditions. If diffusion out of the biofilm was a contributing factor then this would
have confounded results. Although, as noted previously, further structural analysis [Hope and
Wilson, 2006; Wood et al., 2000] would be necessary to quantify this aspect.
8.4.2.2 Mineral Ion Reservoirs
Chander et al. [1982] have argued that phosphate in solution may result in a gradual phase
transition of CaF2 to fluorapatite through surface adsorption of HPO42- and subsequent crystal
growth [Chander et al., 1982]. Whilst this is certainly possible, the theory lacks relevance to the in
vivo situation as a source of phosphate is ubiquitous in both plaque biofilms and saliva (this being
true in these in vitro biofilms and the STGM also). Thus, the particulates which are expected to form

Influence of Ca-Lactate vs. dH2O Exposure on Biofilm Formation and Cariogenicity under NaF Exposures | Ch. 8
218
are more similar to CaF2 with inclusion of HPO42- within the lattice and hence, CaF2-like deposits
[Christoffersen et al., 1995]. These deposits are more disordered than pure CaF2 although continued
exposure to phosphate from the oral environment increases their persistence as a result of a phase
transition in the outermost layer [Kanaya et al., 1983]. An intriguing possibility is the use of this
mechanism to aide in persistence of this reservoir so as that a source of both calcium and fluoride
remain available [Rølla and Saxegaard, 1990; ten Cate, 1997]. It therefore follows that the
production of such deposits is an advantage however the optimisation of this reservoir may require
further work [Vogel, 2011]. In addressing this problem, the current investigation demonstrated some
level of enhanced retention of fluoride under exposure to Ca-lactate (Figure 8.3.13).
By the 8th day of the experiment, no difference was found in the levels of PF fluoride following a
cariogenic challenge however, by the end of the experiment, the amount of fluoride which remained
in the biofilms from the dH2O condition was significantly less than that which was found in the Ca-
lactate condition (Figure 8.3.13). Pearce [1998] pointed out that cyclic demineralising challenges
may deplete the mineral reservoirs within plaque biofilms but the formation of a more extensive
mineral reservoir would presumably persist for longer. Depending on the surface area of the mineral
deposits within and the severity or duration of the acidic challenges, the release of fluoride from
these reservoirs need not be related to the bulk mass of the mineral but the number of acidic
challenges which the reservoir would persist under may be more closely dependent on this. Thus,
throughout the course of each 16 h exposure cycle (Figure 8.2.2), the fluoride made available from
inorganic mineral reservoirs may have lasted longer in the Ca-lactate condition although this would
not be captured at the point in the cycle where samples were taken as both conditions would,
presumably, support the formation of CaF2-like deposits (Figure 4.4.4). In this instance, PF samples
extracted at later stages in the 16 h cycle would have been an advantage. Given heightened PF
calcium concentration within the biofilms sampled from the Ca-lactate conditions (Figure 8.3.16),
the driving force for mineral precipitation and hence the propensity to form mineral deposits would
be greater in this condition. However, this does not explain the relative reduction which occurred in
PF fluoride on the 16th day of the biofilm produced in the dH2O condition (Figure 8.3.13).
The penetration of fluoride though mature biofilms is, however, limited [Watson et al., 2005].
Alteration in structure or diffusive nature of the biofilms when under exposure to Ca-lactate is one
possible avenue by which the increase in retention may have occurred. However, given the sampling
methods which were applied, direct quantification of this aspect was not possible. If a more open
structure had indeed developed in the biofilms which were produced within the Ca-lactate condition
then both a greater area for the formation of mineral deposits would have been provided along with

Influence of Ca-Lactate vs. dH2O Exposure on Biofilm Formation and Cariogenicity under NaF Exposures | Ch. 8
219
greater access to sucrose [Stewart, 2003]. In this case the net effect would be maintenance of an
enhanced release following a cariogenic challenged. Further to this, the data illustrated in Figure
8.3.13 shows that PF fluoride was initially high under both conditions but fell lower in the dH2O
condition over time. With heightened PF calcium concentrations saturation of the negatively
charged binding sites between cells may have occurred [Rose et al., 1996] and therefore acted to
reduce the capacity of mono-dentate cation bridging thus increasing the space between biofilm cells
[Rose and Turner, 1998]. It should also be noted that fluoride also possesses this same effect of
reducing cation bridging and increasing the extracellular volume [Rose and Turner, 1998] however
continually high exposures to Ca-lactate may have maintained saturation of the microbial binding
sites and therefore led to the development of a more open structure than occurred in the dH2O
condition. In effect, the penetration of fluoride would be gradually reduced in biofilms which
experienced lower exposures to calcium and hence it’s potential to form mineral or biological
reservoirs would be less than that in the biofilms produced within the Ca-lactate condition.
Free calcium within the PF has also been implicated in effecting remineralisation [ten Cate,
1994] and plaque calcium has been shown to correlate negatively with caries incidence [Ashley,
1975]. Therefore it is conceivable that any agent which introduces calcium would enhance the
process of remineralisation and inhibit demineralisation by increasing the effect imparted on the
saturation of the PF [Reussner et al., 1977; van der Hoeven et al., 1989]. However, the question over
how long these elevated levels persist within the biofilm is still open to debate [Vogel, 2011]. As
noted above, mineral reservoirs would add some increased protective effect by increasing the time
for which calcium is available as, during an acidic challenge, it would be released from these
reservoirs [ten Cate, 1997; Vogel, 2011]. However, the production of microbial calcium-binding
surface structures (such as LTA [Rølla et al., 1978]) has also been suggested to act as a possible
calcium-buffering mechanism providing protection from elevated calcium during demineralisation of
the mineral substratum [Rose and Dibdin, 1995]. Presumably, the elevated calcium which was
introduced following exposure to Ca-lactate would also elicit this same protective response and
therefore the biological reservoir active within these in vitro biofilms would be enhanced in the Ca-
lactate condition. Unfortunately, it was not possible to delineate the source of PF calcium within this
condition as heightened concentrations PF lactate were also detected (Figure 8.3.10) suggesting that
a proportion of Ca-lactate had also persisted within these biofilms. As Ca-lactate would provide
calcium and lactate in molar ratios of 1:1 and the PF lactate was essentially doubled in the Ca-lactate
condition (Figure 8.3.10) but PF calcium more than trebled (Figure 8.3.16). It could also be suggested
that a significant proportion of the calcium detected was present in some other form than as free
ions which remained following the addition of Ca-lactate [Brudevold et al., 1985] (i.e. bound within

Influence of Ca-Lactate vs. dH2O Exposure on Biofilm Formation and Cariogenicity under NaF Exposures | Ch. 8
220
mineral or biological reservoirs which were released following the cariogenic challenge). The
formation of a mineral reservoir may also explain the difference observed between the present
results and that of Kashket and Yaskell [1992] where calcium introduced from Ca-lactate was
depleted from in situ biofilms to a point equal to that of the negative control within 45 min. In the
present work, elevated PF calcium was detected some 8 h following exposure to Ca-lactate and
crucially following exposure to sucrose. Thus, the formation of mineral reservoirs may serve to
explain the detection of elevated PF calcium that occurred after such a period of time.
The influence of the overnight period on the formation of any mineral deposit is also an important
point. In comparison to the natural human mouth, the CDFF mode of operation [Pratten, 2005] is
dissimilar in that the supply of salivary growth medium is kept constant throughout a 24h period.
However, in the human mouth, salivary flow rates are known to experience fluctuations [Dawes,
2004a] whereby the salivary flow rate decreases to almost negligible during sleep [Dawes, 2008]. In
this in vitro model the changes in salivary flow rates were not accounted for in the interest of
controlling variable factors however it would be reasonable to assume that the enhanced salivary
flow rate in the period between cariogenic challenges may have altered the retention of either
exposure solution. If both calcium and fluoride were retained for extended periods of time, the
transition of relatively unstable CaF2-like mineral deposits to a more stable phase [Rølla and
Saxegaard, 1990] would be enhanced. Thus, if “sleep” patterns were included within this model,
mineral reservoirs may have formed to a greater extent or a further phase transitions to fluorapatite
may have formed therefore trapping the more soluble phase within [ten Cate, 1997; Vogel, 2011]. In
this instance, release following a cariogenic challenge would possibly be reduced. However, in order
to investigate the actual effects of this, further (possibly non-biological) experimental procedures or
tests based on alkali solubility would be required [Vogel, 2011].
Phosphate was marginally, although significantly, higher in the Ca-lactate condition when compared
to the dH2O condition (Figure 8.3.14). In this case an increase occurred within both conditions
demonstrating that PF phosphate increased over the course of the experiment. Substratum
demineralisation was not apparent in either of these conditions (Table 8.3.1) and therefore the
release of phosphate from the substrata is unlikely. A fraction which was released during the
breakdown of relatively high phosphate-containing CaF2-like deposits [Rølla and Saxegaard, 1990]
may explain the higher concentrations detected within the PF of biofilms extracted from the Ca-
lactate condition. However, anabolic uptake by the biofilm bacteria [Higham and Edgar, 1989] is
likely to be a contributing factor. As viable counts were generally higher in the dH2O condition
(Figure 8.3.1, Figure 8.3.3, Figure 8.3.4 and Figure 8.3.5), this route is also a plausible explanation of
the lower phosphate concentrations found in this condition when compared to those biofilms which

Influence of Ca-Lactate vs. dH2O Exposure on Biofilm Formation and Cariogenicity under NaF Exposures | Ch. 8
221
were grown under exposure to Ca-lactate. It should, however, be noted that phosphate
concentrations were considerably lower than those found by other authors [Edgar et al., 1986; Edgar
and Higham, 1990; Gao et al., 2001] or in previous dCDFF conditions which did not include NaF or
Ca-lactate rinses (Figure 6.3.6).
8.4.3 TMR of dCDFF Exposed Enamel Disks
From the results generated within both dCDFF units, it was clear that the addition of fluoride alone
was able to inhibit demineralisation of the enamel sections and that the added effect of Ca-lactate
showed no further advantaged over NaF alone on sound enamel surfaces (Table 8.3.1). This finding
was in agreement with the in situ experiments conducted by Furlani et al. [2009] however the
disparity in the measured retention of calcium and fluoride may have due to the extraction methods
used. The present work measures calcium and fluoride once released from (presumed) biofilm
reservoirs following a presumed cariogenic challenge whereas that performed by Furlani et al.
[2009] measured calcium and fluoride following acid extraction from liable sources. However, some
greater mineral loss was detected within the lesions extracted from the Ca-lactate condition of the
present work. Unfortunately, this particular sample set was severely limited and therefore the
differences found were attributed to an anomalous result within this sample. As discussed previously
(Section 4.4.1), the solubility, and hence density, of enamel mineral is altered on approach to the EDJ
[Anderson and Elliott, 2000; Theuns et al., 1986a] due to both the increasing disorder of the tissue
[Shellis, 1984, 1996] and chemical gradients [Theuns et al., 1986b]. ELT of the enamel disk from
which this particular surface was measured was also abnormally thin probably due to over abrasion
in the production of the disk. Further to this, the tissue also demonstrated an unusual profile which
was thought to fault the TMR analysis software although microscope inspection of the radiographs
did not indicate demineralisation.
The lack of evidence for demineralisation within either condition is not surprising as both NaF
[Biesbrock et al., 2001; Damato et al., 1990; Lynch et al., 2004; Sullivan et al., 1995] and Ca-lactate
[Brudevold et al., 1985; Furlani et al., 2009; Kashket and Yaskell, 1992] alone have been shown to
inhibit the process. In conjunction, the formation of CaF2-like deposits is thought to provide an
enhanced protective effect [Pessan et al., 2006; Vogel et al., 2008]. Given the detection of
heightened calcium (Figure 8.3.16) and fluoride (Figure 8.3.13) some 8 h after the exposure, the
production of an enhanced reservoir with the use of a Ca-lactate pre-rinse condition is easily
conceivable. However, appreciable concentrations of fluoride were also detected in the absence of
Ca-lactate (Figure 8.3.13). Therefore, the enhanced effect of the Ca-lactate pre-rinse is difficult to be
certain of. When only an initially sound surface is employed, the detection of remineralisation is
difficult but transition to a denser mineral phase may be detectable [Arends and ten Bosch, 1992].

Influence of Ca-Lactate vs. dH2O Exposure on Biofilm Formation and Cariogenicity under NaF Exposures | Ch. 8
222
Demineralisation of the initial mineral would first be required to provide an opportunity for
exchange or precipitation.
However, because the presence of Ca-lactate masked the anion lactate within the biofilm, no real
indication of the acidity was gained. It may have therefore been possible that the biofilms within this
particular condition were less acidogenic but considering acetate production (Figure 8.3.11), no
indication was found that the biofilm’s metabolism was strongly affected. Moreover, substantial
concentrations of lactate were detected in the NaF condition indicating that here, at least, an
acidogenic biofilm community was produced. In this instance, the pH of the biofilm following a
cariogenic challenge [Pratten and Wilson, 1999] would have been a desirable parameter to measure.
Alternatively, if cariogenicity can first be established within the model, alterations can be monitored
following the introduction of a given agent and this would enable confirmation of anti-caries activity
both on an established community and on active caries lesions.
The inclusion of pre-made enamel lesions was therefore a beneficial foresight as the pre-fabrication
of a demineralised tissue structure was able to capture a degree of remineralisation which differed
between either dCDFF conditions (Figure 8.3.8). Although significant differences were found
between the 8th and 16th days in the dH2O condition some level of remineralisation was apparent in
all of the enamel lesions which were analysed. The significant change in ΔΔZ was attributed to ΔR
and indicated that the major change between these lesions was in the degree of mineralisation in
the body of the lesions. However, these calculations only demonstrated that a change in lesion
character was captured and therefore, the lack of any difference between groups in the Ca-lactate
condition did not show that remineralisation failed take place but rather that the degree of
remineralisation had not increased between sample extracted on the 8th and 16th days of the
experiment. In this case, remineralisation appeared to occur at an earlier point and did not proceed
past this point in the Ca-lactate condition (Figure 8.3.8). A relatively higher SD was the cause of a
lack of significance between these measurements. Even when mineral content is assessed within the
same tissue section, variation is a known complication of the process [Lippert et al., 2012]. This
effect would be expected to be exacerbated within a complex biological model and when
considering site specific variations in the tissue [Robinson et al., 1995a; Shore et al., 1995b].
From the data collected, it appeared that the increased level of calcium (Figure 8.3.16) and fluoride
(Figure 8.3.13) afforded by the use of a Ca-lactate pre-rinse led to an enhancement of the rate of
remineralisation. However, the ultimate efficacy of this strategy was no greater than that of fluoride
exposure alone. One possible explanation for this could be enhanced remineralisation of the SL
(SMax). Although this parameter did not change to any manful degree between baseline and post

Influence of Ca-Lactate vs. dH2O Exposure on Biofilm Formation and Cariogenicity under NaF Exposures | Ch. 8
223
exposure measurements, occlusion of the diffusion pores [Pessan et al., 2011] within the outer areas
of the tissue may have resulted from the formation of de novo mineral phase which was not
detected by the current radiographic technique (TMR). SEM of the lesion surface flowing extraction
from the dCDFF may provide a better indication over such fine changes in the porosity of the tissue.
In effect, heightened concentrations of mineral ions may induce mineral deposition to a point of
preventing penetration into the tissue and thus preventing lesion remineralisation also.
Unfortunately, the analysis of artificial groove structures did not prove an effective means of
simulating aspects of the natural occlusal surface within this model. Due to the fragility of the
enamel sections [Lagerweij et al., 1996], TMR analysis was not possible on a representative sample
set. However, their inclusion did not impact on the on the assessment of smooth surface sites or on
the number of sampling occasions which can be designated for analysis (ie. PF or microbial
composition). Therefore, their exclusion in furthered studies is not necessary in an economic sense.
8.5.0 Conclusions PF analysis provides valuable information on both the mineral dynamics and metabolic activity with
plaque biofilms. However, pH may be a desirable parameter to measure but only if permitted by the
number of sampling occasions required. Ultimately, the information gained by CE analysis of the PF
provides a measure of acidogenicity and inorganic ion and thus far greater information than pH
measurements alone. Therefore, measurements of acidity at the expense of those which were
currently collected cannot be justified.
Evidently, Ca-lactate has some beneficial effects on reducing the viable proportions of bacteria when
applied during biofilm formation. However, the specific ecological modifications could not be
concluded fully. In depth studies may still be warranted to further investigate the role of this agent
in an antimicrobial or anti-biofilm sense, possibly in the absence of fluoride [Shrestha et al., 1982].
Results from the present work were however In-line with that of other authors [van der Hoeven et
al., 1989], Ca-lactate pre-rinses appeared to elevate PF calcium and F concentrations. In this way
provided a more effective means of remineralisation in the short term although no additive effect
occurs over NaF alone [Furlani et al., 2009]. This was true when considering both sound surfaces and
longer-term exposures.
Further to this, agents were only investigated on the basis of their effect on biofilm formation. In
many areas of the mouth, mature biofilms persist at inaccessible sites [Batchelor and Sheiham, 2004;
Carvalho et al., 1989; Hannigan et al., 2000]. Assessing the effects of anti-caries agents on mature
cariogenic biofilms would provide greater insight into possible alterations to established microbial
ecology and further allow their efficacy to be tested on a definitively cariogenic community.

224
Chapter 9: Effect of NaF and Ca-Lactate vs. dH2O Exposures on the
Cariogenicity of Established Biofilm Communities.
9.1.0 Introduction Deng et al. [2005] identified the importance of a lead-in period in monitoring the physiological
activity of in vitro biofilms before the introduction of an adjunct agent. In previous works within this
thesis, the onus has been on investigating the factors which effect biofilm formation however the
effects of anti-cariogenic strategies on established biofilm communities may provide further insight
into potential alterations in the biofilm community [Marsh and Bradshaw, 1997]. The establishment
of a mature biofilm community would allow the initial state of the microbial ecology before the
introduction of the agent to be compared to that following its introduction [Deng et al., 2005].
Further to this, established plaque biofilms exhibit a greater degree of anti-microbial resistance
which is afforded by the development of the biofilm structure [Gilbert et al., 2002] and therefore the
effect(s) observed previously for NaF and NaF in conjunction with Ca-lactate may differ once the
biofilm community has developed.
Difference in the ecological state of biofilms grown under exposure to NaF (Section 7.3.1) were
partially attributed to unforeseen variations in the primary culture as it would relate to the minute
difference in the inoculum used [Ledder et al., 2006]. Moreover, regular exposures to a selective
pressure such as that imposed by NaF exposure may alter the trajectory of community’s
development. Whilst this is a worthwhile avenue to consider, several aspects such as role of
colonisation resistance [Marsh and Martin, 2009a] cannot be investigated with this experimental
design. Alterations in biofilm structure during formation was also suspected to play a role in the
observed results during Ca-lactate exposures (Section 8.3.2 and Section 8.3.3). However,
investigations based on an established biofilm community would effectively remove these factors
relative to each biofilm and therefore allow for a more accurate interpretation of the results. Thus, a
sequential element has been introduced into the CDFF model [Peters and Wimpenny, 1988]
previously employed for the purposes of achieving a steady-state within the microbial ecology
[Dibdin and Wimpenny, 1999; Kinniment et al., 1996].
9.1.1 Aims and Objectives
The work present within this chapter aims to test the effects of NaF exposures on established biofilm
communities within a sequential CDFF (sCDFF) and compare the efficacy of this model to the
previously applied dCDFF design [Hope et al., 2012]. Further to this, the effect of NaF in combination
with Ca-lactate will also be investigated as they would compare to the previously observed results.

Effect of NaF and Ca-Lactate vs. dH2O Exposures on the Cariogenicity of Established Biofilm Communities | Ch. 9
225
9.2.0 Materials and Methods
The effect of Ca-Lactate (150 mM) and NaF (300 ppm F-) exposures on established biofilm
communities were investigated in comparison with dH2O in a sequential constant-depth film
fermenter (sCDFF) model. This model consisted of single CDFF units (larger 15 pan capacity;
commissioned from J. Abbott, West Kirby, Merseyside, UK) which were initially run under a 50 mM
sucrose pulsing strategy along with a FF STGM supply (Figure 5.2.2). Following 8 days of this cycle,
either NaF (300 ppm F-), Ca-Lactate (150 mM) and NaF (300 ppm F-) or no adjunct agent was
introduced by way of additional pulsing events immediately outside of the initial sucrose pulsing
strategy and for a further 8 days; the division of these pulsing strategies is also illustrated in Figure
9.2.1 (Exp. S, Exp. SN and Exp. SNC respectively). In an effort to maintain adequate hydration of the
biofilms during an FF cycle, in conditions where an adjunct agent was not included, the supply of
STGM was extended to cover the intermittent periods.
Figure 9.2.1 (sCDFF Pulsing Strategies for NaF vs. Ca-Lactate vs. dH2O): Each CDFF unit was subject to a 50 mM sucrose pulsing strategy (x8/day for 15 min at 0.72 mL.min
-1 every 2 h over 16 h of a 24 h cycle). Following this initial period, either NaF (300 ppm F-) or NaF (300
ppm F-) and Ca-Lactate (150 mM) were introduced to the cycle for a further 8 days. NaF was pulsed in x2/day for 2 min at 3 mL.min-1
immediately before and after the 16h sucrose pulsing period and Ca-Lactate was pulsed in x2/day for 1 min at 10 mL.min
-1 immediately
after each NaF exposure.

Effect of NaF and Ca-Lactate vs. dH2O Exposures on the Cariogenicity of Established Biofilm Communities | Ch. 9
226
Biofilms were formed from a pooled human salivary inoculum (Section 5.2.1) with a smaller volume
of 500 mL and a flow rate of 0.5 mL.min-1 as it was the growth kinetics within the inoculum vessel
which was considered of most importance and with the correction in the volume to account for the
inoculation of a single CDFF unit. Both enamel (Modus Laboratories, University of Reading, Reading,
UK) and HA disks (Clarkson Chromatography Products Inc., South Willaimsport, PA., USA) were used
as a substratum to support biofilm growth.
Prior to the commencement of the sCDFF experiments, all enamel disks were painted in an acid-
resistant varnish (MaxFactor Nailfinity; Procter and Gamble, Weybridge, UK) so that half of the
enamel surface was protected from the conditions within the unit. This was achieved by the same
means as described in Figures 7.2.1 and 7.2.2 for smooth and fissured enamel surfaces respectively.
Sterilisation procedures were kept identical to that previously performed (Section 5.2.2.1).
The apparatus assembly was similar to that used for the dCDFF experiments but with the following
differences (Figure 9.2.2): Firstly, the 10 L supply of sterile STGM and the 50 mM sucrose solutions
were fed in at a higher flow rate of 0.72 mL.min-1 to correct for the greater surface area of the
turntable (with respect to the number of sample pans). Given that a flow-rate of 0.38 mL.min-1 was
adopted for an 8-pan CDFF turntable, the flow rate was increased per sample pan in the larger 15-
pan CDFF. The STGM and sucrose supply flow-rates were maintained by the use of previously
calibrated peristaltic pumps (101U/R Low Flow Peristaltic Pump; Watson Marlow, Falmouth, UK) as
were the flow rates for the NaF (300 ppm F-; 3 mL.min-1) and Ca-Lactate (150 mM; 10 mL.min-1).
Enamel sections were removed from these experiments at 8 and 16 days from the start of the
pulsing strategy immediately after the 5th sucrose pulse of the day (Section 5.2.5). Sections were
then analysed by TMR as described in Section 5.2.4 and statistical analysis applied (Section 2.2.4). HA
disks were used in triplicate for the enumeration of bacteria by selective and non-selective culture
(Section 5.2.4) on days 2, 4, 8, 12 and 16 of each experiment. This was performed for FA (FAA
supplemented with 5% defibrinated horse blood; Section 5.2.4.1), MS (TYCSB; Section 5.2.4.2),
Streptococcus spp. (MSA; Section 5.2.4.3), Lactobacillus spp. (Rogosa; Section 5.2.4.4) and Veillonella
spp. (Section 5.2.4.5) following the 4th sucrose pulse of the day (2:00 PM).

Effect of NaF and Ca-Lactate vs. dH2O Exposures on the Cariogenicity of Established Biofilm Communities | Ch. 9
227
Figure 9.2.2 (sCDFF Schematic Set-Up) a: Sterile STGM; b: Sterile
50 mM Sucrose Solution; c: Peristaltic Pump 0.71mL.min-1
; d:
Peristaltic Pump 0.71mL.min-1
; e: Peristaltic Pump 5.0 mL.min-1
; f:
Peristaltic Pump 3.0 mL.min-1
; g: Peristaltic Pump 0.5 mL.min-1
; h:
Y-Connector; i: Grow-Back Trap; j: CDFF; k: Inoculum Flask with
Magnetic Stirrer; l: Sterile NaF Solution (300 ppm F-); m: Ca-
Lactate Solution (150 mM); n: Effluent; *: 0.2 µm Air Filter.

Effect of NaF and Ca-Lactate vs. dH2O Exposures on the Cariogenicity of Established Biofilm Communities | Ch. 9
228
9.3.0 Results
9.3.1 Enumeration of Biofilm Bacteria
Viable counts of FA increased throughout the initial phase of the each of the 3 experiments (Figure
9.3.1). However, counts were not collected on sample day 2 of Exp. S S-SUC and Exp. SN. Therefore,
comparisons between experiments on this particular day were not possible. From data collected for
Exp. SNC, a significant increase occurred between the 2nd and 4th sample days (P = 0.002), this
brought the magnitude of viable FA counts from each experiment within a similar range (P ≥ 0.132)
however, those from Exp. SN were significantly greater than those from EXP. S (P = 0.021). The
differences between experiments were most pronounced on the 8th sample day where comparisons
between each of the experiments reached significance (P ≤ 0.014). In all case however an increase in
viable counts was observed between days 4 and 8 (P ≤ 0.002) although, as alluded to from the
previous point, the magnitude of these changes were different between experiments, the gradient
of the growth curves between Exp. SN and Exp. SNC were strikingly similar however the increase
observed in the Exp. S experiment progressed at a noticeably lower rate.
Following the introduction of the adjunct agent (the second phase in Exp. SN and Exp. SNC), a
response was noted for each experiment. Interestingly, an alteration in the trend also occurred FA
within the within Exp. S (where no adjunct agent was introduced). At this point viable counts within
Exp. S increased further (P < 0.001) although this occurred at a faster rate between days 8 and 12
than was witnessed between days 4 and 8 (Figure 9.3.1). By the 12th day of this experiment, results
indicated that viable counts within the biofilms had become relatively stable where no further
increase could be confirmed statistically between sample days 12 and 16 (P = 0.858). In Exp. SN, the
introduction of NaF exposures appeared to trigger either dispersal or a reduction in the net viability
with respect to FA (P = 0.001). However, as with Exp. S, viable counts again became stable between
days 12 and 16 (P = 0.543). By the 16th day, the difference between biofilms which were
subsequently exposed to NaF (Exp. SN) and those which were not had reached a point which was
indistinguishable (P = 0.490) with respect to viable counts of FA. However, viable counts made from
Exp. SNC were far less similar than with the SSUC or SNAF experiments.
Following the introduction of the adjunct agents (day 8) viable counts move from an intermediate
position to one far less than either of the other experiments (P ≤ 0.001). Between sample days 8 and
12, this reduction failed to reach significance (P = 0.838) but as the trajectory of the decline
increased, the reduction in the proportion of the biofilms FA community which remained viable
undoubtedly decreased (P = 0.002).

Effect of NaF and Ca-Lactate vs. dH2O Exposures on the Cariogenicity of Established Biofilm Communities | Ch. 9
229
Figure 9.3.1 (Fastidious Anaerobes; FA): Both initial (white plot area) and secondary (grey plot area) phases are indicated. Error bars represent the SD of the sample sets (n=3). Where comparisons between sCDFF runs on like sample days were possible multiple comparisons for significant differences (P < 0.050) between experiments are denoted alphabetically where a = Exp. S vs. Exp. SN, b = Exp. S vs. Exp. SNC and c = Exp. SN vs. Exp. SNC.
As with FA, Lactobacillus spp. were, not sampled on the 2nd day of Exp. S and Exp. SN, however
where the comparisons can be made, a drastic increase in the viable proportion of Lactobacillus spp.
occurred. Between days 2 and 4 in Exp. 3 (P < 0.001) viable counts made rose higher than those
obtained from both Exp. S (P < 0.001) and Exp. SN (P = 0.047) on the 4th sample day. Between the 4th
an 8th sample days, the increase continued within all experiments (P ≤ 0.037). To this end, the most
pronounced increase was observed in Exp. S and the least so occurred in Exp. SNC with Exp. SN
occupying an intermediate position (Figure 9.3.2).
Following the introduction of the adjunct agent(s), viable counts within Exp. S (where no agent was
actually introduced) continued to increase (P < 0.001) until between the 12th and 16th day where
counts became stable (P = 0.981). However in Exp. SN, no further increase was detected, rather the
proportion of viable Lactobacillus spp. had either stabilised or was suppressed (P ≥ 0.117) by the
a
a, b, c
a, b b. c
6.00
6.50
7.00
7.50
8.00
8.50
9.00
9.50
0 2 4 6 8 10 12 14 16 18
Fast
idio
us
An
ero
be
s (F
A;
Log1
0C
FU.m
m-2
)
Sample Day
Exp. S Exp. SN Exp. SNC

Effect of NaF and Ca-Lactate vs. dH2O Exposures on the Cariogenicity of Established Biofilm Communities | Ch. 9
230
introduction of NaF exposures. This same result was found during statistical analysis of the growth
curves for Exp. SNC over this same period. Although in Figure 9.3.2 an increase in mean viable counts
is evident for samples extracted on the 12th day, multiple comparisons over the entire period
following the introduction of NaF and Ca-lactate rinses (Exp. SNC) did not show say statistically
significant differences (P ≥ 0.088). This is not to any that no difference actually occurred following
the introduction of NaF (Exp. SN) or NaF and Ca-lactate (Exp. SNC). Clearly the proportion of viable
microbes displayed some variability over this period however the difference failed statistical
significance. Ultimately the proportion of viable Lactobacillus spp. reached a state which was
indistinguishable between all 3 experimental conditions (P = 0.078).
Figure 9.3.2 (Lactobacillus spp.): Both initial (white plot area) and secondary (grey plot area) phases are indicated. Error bars represent the SD of the sample sets (n=3). Where comparisons between sCDFF runs on like sample days were possible multiple comparisons for significant differences (P < 0.050) between experiments are denoted alphabetically where a = Exp. S vs. Exp. SN, b = Exp. S vs. Exp. SNC and c = Exp. SN vs. Exp. SNC
Remarkably concordant results were observed between Exp. SN and Exp. SNC with respect to
Streptococcus spp. in the initial phase of the experiments. On days 4 and 8, significant differences
a, b,c
a, b
a, b, c
3.50
4.00
4.50
5.00
5.50
6.00
6.50
7.00
0 2 4 6 8 10 12 14 16 18
Lact
ob
acill
us
spp
. (Lo
g10
CFU
.mm
-2)
Sample Day
Exp. S Exp. SN Exp. SNC

Effect of NaF and Ca-Lactate vs. dH2O Exposures on the Cariogenicity of Established Biofilm Communities | Ch. 9
231
were found between Exp. S and the 2 other experiments (P ≤ 0.032) however no differences were
found between Exp. SN and Exp. SNC over this same period (P ≥ 0.459). Furthermore, from what was
indicated by the results obtained on day 2 in Exp. SNC, the number of viable Streptococcus spp.
underwent a marked increase between the 2nd and 4th sample days (P < 0.001). As noted above, by
the end of the first phase the numbers of viable counts had reached statistically equivalent values in
Exp. SN and Exp. SNC however Exp. S was lower. By the 12th day, counts within Exp. S increased
further (P = 0.047) and at a rate which appeared similar to that experienced in Exp. SN and Exp. SNC
between days 4 and 8.
Figure 9.3.3 (Streptococcus spp.): Both initial (white plot area) and secondary (grey plot area) phases are indicated. Error bars represent the SD of the sample sets (n=3). Where comparisons between sCDFF runs on like sample days were possible multiple comparisons for significant differences (P < 0.050) between experiments are denoted alphabetically a = Exp. S vs. Exp. SN, b = Exp. S vs. Exp. SNC and c = Exp. SN vs. Exp. SNC.
Following the highest recorded value on sample day 12, viable counts in Streptococcus spp. in Exp. S
proceeded to decrease by the 16th day of the experiment (P < 0.001) but this was not the case in Exp.
SN and Exp. SNC. In the first set of samples taken following the introduction of the adjunct agent(s),
a, b
a, b
a, b a, c
5.50
6.00
6.50
7.00
7.50
8.00
8.50
0 2 4 6 8 10 12 14 16 18
Stre
pto
cocc
us
spp
. (Lo
g10
CFU
.mm
-2)
Sample Day
Exp. S Exp. SN Exp. SNC
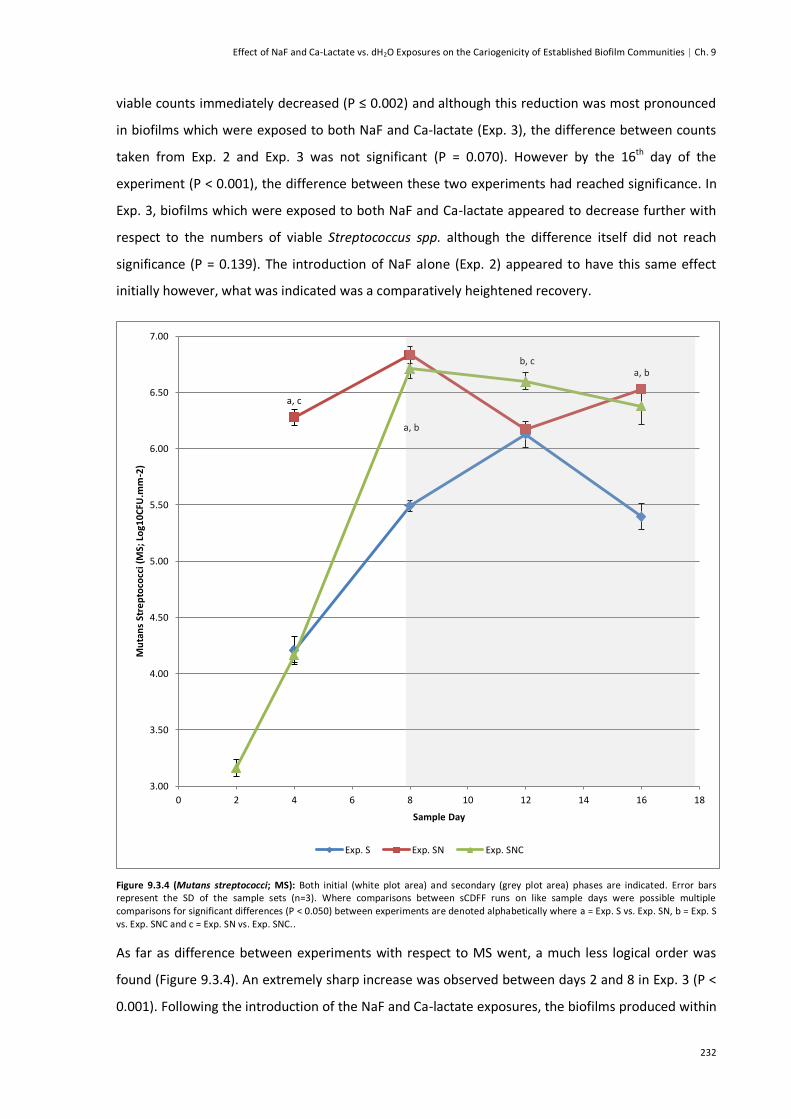
Effect of NaF and Ca-Lactate vs. dH2O Exposures on the Cariogenicity of Established Biofilm Communities | Ch. 9
232
viable counts immediately decreased (P ≤ 0.002) and although this reduction was most pronounced
in biofilms which were exposed to both NaF and Ca-lactate (Exp. 3), the difference between counts
taken from Exp. 2 and Exp. 3 was not significant (P = 0.070). However by the 16th day of the
experiment (P < 0.001), the difference between these two experiments had reached significance. In
Exp. 3, biofilms which were exposed to both NaF and Ca-lactate appeared to decrease further with
respect to the numbers of viable Streptococcus spp. although the difference itself did not reach
significance (P = 0.139). The introduction of NaF alone (Exp. 2) appeared to have this same effect
initially however, what was indicated was a comparatively heightened recovery.
Figure 9.3.4 (Mutans streptococci; MS): Both initial (white plot area) and secondary (grey plot area) phases are indicated. Error bars represent the SD of the sample sets (n=3). Where comparisons between sCDFF runs on like sample days were possible multiple comparisons for significant differences (P < 0.050) between experiments are denoted alphabetically where a = Exp. S vs. Exp. SN, b = Exp. S vs. Exp. SNC and c = Exp. SN vs. Exp. SNC..
As far as difference between experiments with respect to MS went, a much less logical order was
found (Figure 9.3.4). An extremely sharp increase was observed between days 2 and 8 in Exp. 3 (P <
0.001). Following the introduction of the NaF and Ca-lactate exposures, the biofilms produced within
a, c
a, b
b, c a, b
3.00
3.50
4.00
4.50
5.00
5.50
6.00
6.50
7.00
0 2 4 6 8 10 12 14 16 18
Mu
tan
s St
rep
toco
cci (
MS;
Lo
g10
CFU
.mm
-2)
Sample Day
Exp. S Exp. SN Exp. SNC
Effect of NaF and Ca-Lactate vs. dH2O Exposures on the Cariogenicity of Established Biofilm Communities | Ch. 9
233
this particular experiment (Exp. SNC) no significant differences were detected between days 8 and
12 and days 12 and 16 (P ≥ 0.139) although across the entire period of the secondary phase a
significant reduction did occur (P = 0.018). In Exp. S, the increase in viable counts proceeded to a
maximum on the 12th sample day (P < 0.001) and this was then followed immediately by an obvious
decrease in the viable numbers by day 16 (P < 0.001). In this instance, no alteration in the growth
trends could be attributed to the transition from the initial to the secondary phases. The growth
curves generated from Exp. SN were perhaps the most unusual out of the 3 obtained for MS. On the
4th day, viable counts were far greater than what was found in biofilms produced in Exp. S and Exp.
SNC (P ≤ 0.001), they did however reach a point at the end of the first phase which was equal to that
found in Exp. SNC (P = 0.176). Following the introduction of the second phase, counts reduced
around day 12 (P ≤ 0.001). However, the actual point at which the reduction occurred could not be
pin-pointed from the current data set. It appears that the sudden introduction of NaF to a previously
un-exposed biofilm had some effect on the viable members of the MS community although the
immediate severity of such an exposure was not captured.
In comparison of MS to the wider groups of Streptococcus spp., concordance was observed between
the growth curves obtained from these 2 groups with respect to samples taken from Exp. S. The
magnitude of CFU counts were roughly an order of 10 lower in the in MS groups (Figure 9.3.4) than
in the Streptococcus spp. group (Figure 9.3.3) however the growth curves mirrored each other well.
This same fact was true for Exp. SN; on sample days where a relative increases in viable counts
occurred, it was visible in both MS and Streptococcus spp. groups. To some extent, this relationship
was also observed in Exp. SNC although transposition of the curves as they are does not result in
such a harmonious correlation. For example, the reduction seen following the introduction of NaF in
Streptococcus spp. (Figure 9.3.3) coupled with the relative stability of the MS group would indicate
that the proportion of the latter (which was made up from the former) had increase more so than
one single curve alone would indicate.
Veillonella spp. were not sampled from Exp. SN due to complications related to the production of
the growth medium however full growth curves were obtained for Exp. S and Exp. SNC (Figure 9.3.5).
Where comparisons between experiments on like sample days were possible, Veillonella spp. within
Exp. S were consistently lower than in Exp. SNC (P ≤ 0.013) but the shape of the growth curve
distributions were similar between both experiments. Sharp increases were captured over the initial
phases (P ≤ 0.005) and upon transition into the secondary phase, viable counts remained stable
between days 8 and 12 in Exp. S (P = 0.996), between days 12 and 16 the apparent reduction in
viable counts was again not statistically significant (P = 0.085). However, the comparison between

Effect of NaF and Ca-Lactate vs. dH2O Exposures on the Cariogenicity of Established Biofilm Communities | Ch. 9
234
days 8 and 16 did show a significant reduction (P = 0.045). The weak statistical significance of these
results would initially indicate a gradual reduction in counts yet the in viewing the growth curves in
Figure 9.3.5, the reduction would be much more pronounced than would be initially suggested from
the statistical interpretation of the data alone.
Figure 9.3.5 (Veillonella spp.): Both initial (white plot area) and secondary (grey plot area) phases are indicated. Error bars represent the SD of the sample sets (n=3). Where comparisons between sCDFF runs on like sample days were possible significant differences (P < 0.050) between experiments are denoted alphabetically where c = Exp. S vs. Exp. SNC.
The increase in viable counts of Veillonella spp. in Exp. SNC reached a point on day 4 which was
similar the numerical maximum (P = 0.584) however like Exp. S, a brief steady-state was reached on
by the 8th day of the experiment, in all samples taken from the 8th day and following the introduction
of NaF and Ca-lactate exposures, no significant difference could be determined (P ≥ 0.999). This
would therefore indicate that given an established biofilm community, the introduction of Ca-lactate
and NaF exposures help maintain a level of stability with respect to the composition of Veillonella
spp.
c
c
c
c
3.00
3.50
4.00
4.50
5.00
5.50
6.00
6.50
0 2 4 6 8 10 12 14 16 18
Vie
llon
ella
sp
p.
(Lo
g10
CFU
.mm
-2)
Sample Day
Exp. S Exp. SNC

Effect of NaF and Ca-Lactate vs. dH2O Exposures on the Cariogenicity of Established Biofilm Communities | Ch. 9
235
9.3.2 TMR of sCDFF Exposed Enamel Disks
Aggregated TMR parameters of ΔZ, LD, R and SMax are listed in Table 9.3.1 along with the number of
enamel disks (n) examined at each point. Mean scan profiles are also presented in Figure 9.3.6a,
9.3.6b and 9.3.6c for Exp. S, Exp. SN and Exp. SNC respectively.
Condition Sample Day n (Enamel Disks) ΔZ ± SD LD ± SD R ± SD SMax ± SD
Exp. S 8 5 419.58 ± 194.51 18.84 ± 6.08 21.29 ± 3.33 67.70 ± 9.06
Exp. S 16 6 754.08 ± 346.22 34.75 ± 13.23 20.78 ± 2.45 63.12 ± 4.67
Exp. SN 8 6 867.92 ± 198.04 36.75 ± 5.94 23.29 ± 2.19 58.60 ± 3.91
Exp. SN 16 5 817.33 ± 69.19 32.93 ± 2.91 24.85 ± 1.47 53.76 ± 4.34
Exp. SNC 8 4 625.33 ± 177.02 28.38 ± 10.46 22.61 ± 1.95 61.40 ± 4.97
Exp. SNC 16 6 1477.50 ± 809.83 57.66 ± 26.34 23.98 ± 5.09 54.88 ± 13.37
Table 9.3.1 (TMR Parameters of sCDFF Enamel Lesions): Parameters of integrated mineral loss (ΔZ), lesion depth (LD), average mineral loss (R), and the degree of SL mineralisation (SMax) along with the sample size (n) are listed in-line with sample day and dCDFF condition.
Immediately from the interpretation of the generated mean scan profiles, some level of
demineralisation was apparent for each of the experimental conditions. However, the degree which
is indicated by the end of the initial phase (day 8) was less than that from the previous experiments
(Section 5.3.2). Variation between individual profiles was reasonable in the lesions produced in Exp.
S (Figure 9.3.6a) and Exp. SN (Figure 9.3.6b) but was much higher between the lesions which were
extracted on the 16th day of Exp. SNC (Figure 9.3.6c).
Figure 9.3.6a (Mean Scan Profiles of Lesions Created in Exp. S): Mean scan profiles taken from the sucrose only (Exp. S) exposure condition. Mineral volume (%Vol) is expressed relative to sound enamel normalised within each individual measurement. Error bars represent the SD of the sample set. For day 8, n= 13 and for day 16, n = 23).
25
35
45
55
65
75
85
95
0 10 20 30 40 50 60 70 80 90 100
Min
era
l Vo
lum
e (
%V
ol)
Depth (µm)
Exp. S / Day 8 Exp. S / Day 16

Effect of NaF and Ca-Lactate vs. dH2O Exposures on the Cariogenicity of Established Biofilm Communities | Ch. 9
236
Figure 9.3.6ba (Mean Scan Profiles of Lesions Created in Exp. SN): Mean scan profiles taken from the sucrose and NaF (Exp. SN) exposure condition. Mineral volume (%Vol) is expressed relative to sound enamel normalised within each individual measurement.. Error bars represent the SD of the sample set. For day 8, n =20 and for day 16, n = 15.
Figure 9.3.6c (Mean Scan Profiles of Lesions Created in Exp. SNC): Mean scan profiles taken from the sucrose, NaF and Ca-lactate (Exp. SNC) exposure condition. Mineral volume (%Vol) is expressed relative to sound enamel normalised within each individual measureme nt. Error bars represent the SD of the sample set. For day 8, n = 11 and for day 16, n = 8).
25
35
45
55
65
75
85
95
0 10 20 30 40 50 60 70 80 90 100
Min
era
l Vo
lum
e (
%V
ol)
Depth (µm)
Exp. SN / Day 8 Exp. SN / Day 16
25
35
45
55
65
75
85
95
0 10 20 30 40 50 60 70 80 90 100
Min
era
l Vo
lum
e (
%V
ol)
Depth (µm)
Exp. SNC / Day 8 Exp. SNC / Day 16

Effect of NaF and Ca-Lactate vs. dH2O Exposures on the Cariogenicity of Established Biofilm Communities | Ch. 9
237
Interestingly, these lesions also differed from those previously created (Section 5.3.2) in that the SL
had not formed to the same degree which was created in these earlier experiments under the same
FF STGM flow cycle. In the Sucrose only condition (Exp. S) a progression was noted between samples
extracted on the 8th and 16th days as expected (Figure 9.3.6a). In Exp. SN, some change in lesion
architecture was indicated following the introduction of NaF exposures in that LD and the SL
appeared to increase (Figure 9.3.6b). However, in the conditions which included both NaF and Ca-
lactate exposures (Figure 9.3.6c), the effect of the introduction of the combined exposures was more
difficult to ascertain. As noted above, a high degree of variation occurred within the samples
extracted on the 16th day of the experiment (Exp. SNC). However, variation was not the result of
error associated with the TMR process itself and further, ELT did not appear to be a contributing
factor. Therefore, these sections were not rejected from the sample set.
Figure 9.3.7a (TMR Parameters of from Lesions Created in Exp. S): LD (µm), SMax (%Vol) and R (%Vol) share the left axis. ΔZ (%Vol.µm) measurements are plotted on the right for the purposes of clarity. Results correspond to data in Table 9.3.1 and error bars represent the SD of the sample set.
Statistically, very little differences were found between the enamel lesion both within sCDFF
experiments and between conditions. Within Exp. S, no significant difference was found between ΔZ
(P = 0.121) or LD (P = 0.057) although these parameters were numerically higher in samples
extracted on the 16th day when compared to those extracted on the 8th (Figure 9.3.7a). R remained
steady between these sample point (P = 0.789) as did SMax (P = 0.318). Although a decrease in SMax
occurred, its origin can be traced to a change in lesion character (Figure 9.3.6a).
0
10
20
30
40
50
60
70
80
90
0
200
400
600
800
1000
1200
ΔZ LD R SMax
De
pth
(µ
) /
Min
era
l Vo
lum
e (
%V
ol)
Inte
rgra
ted
Min
era
l Lo
ss (
ΔZ;
%V
ol.
µm
)
Parameter
Sample Day 8 (Exp. S) Sample Day 16 (Exp. S)

Effect of NaF and Ca-Lactate vs. dH2O Exposures on the Cariogenicity of Established Biofilm Communities | Ch. 9
238
Figure 9.3.7b (TMR Parameters of from Lesions Created in Exp. SN): LD (µm), SMax (%Vol) and R (%Vol) share the left axis. ΔZ (%Vol.µm) measurements are plotted on the right for the purposes of clarity. Results correspond to data in Table 9.3.1 and error bars represent the SD of the sample set.
Figure 9.3.7c (TMR Parameters of from Lesions Created in Exp. SNC): LD (µm), SMax (%Vol) and R (%Vol) share the left axis. ΔZ (%Vol.µm) measurements are plotted on the right for the purposes of clarity. Results correspond to data in Table 9.3.1 and error bars represent the SD of the sample set. An asterisk indicated a significant difference (P < 0.050) between sample sets.
0
10
20
30
40
50
60
70
80
90
0
200
400
600
800
1000
1200
ΔZ LD R SMax
De
pth
(µ
m)
/ M
ine
ral V
olu
me
(%
Vo
l)
Inte
rgra
ted
Min
era
l Lo
ss (
ΔZ;
%V
ol.
µm
)
Parameter
Sample Day 8 (Exp. SN) Sample Day 16 (Exp. SN)
0
10
20
30
40
50
60
70
80
90
0
500
1000
1500
2000
2500
ΔZ LD R SMax
De
pth
(µ
m)
/ M
ine
ral V
olu
me
(%
Vo
l)
Inte
rgra
ted
Min
era
l Lo
ss (
ΔZ;
%V
ol.
µm
)
Parameter
Sample Day 8 (Exp. SNC) Sample Day 16 (Exp. SNC)
* *

Effect of NaF and Ca-Lactate vs. dH2O Exposures on the Cariogenicity of Established Biofilm Communities | Ch. 9
239
Within Exp. SN (Figure 9.3.7b), no significant difference was found between ΔZ (P = 0.602), LD (P =
0.225), R (P = 0.207) or SMax (P = 0.083). Therefore, it was suggested from these results that NaF
exposure prevented the progression of an otherwise active enamel lesion. However, dissimilar
results were found when comparing the lesions extracted from Exp. SNC (Figure 9.3.7c). In this case,
ΔZ was significantly higher on by the 16th day of the experiment (P = 0.048) and the cause of this
increase appeared to be related to a relatively greater LD between these lesions (P = 0.045) as R did
not show any significant difference between either sample day (P = 0.587). These results are echoed
in the numerical difference apparent in Figure 9.3.7c. In addition, SMax was also not significantly
different (P = 0.332) between sample extracted on either day from this condition.
Between experiments, ΔZ measured from the samples extracted on the 8th day (before the
introduction of the adjunct agents), were significantly lower in the Exp. S and Exp. SNC than was
found Exp. SN (P ≤ 0.009) however Exp. S and Exp. SNC were not significantly different from each
other (P = 0.279) indicating that the lesion within Exp. SN (Figure 9.3.7b) had progressed to a more
advance state by the end of the initial phase of the experiment. In samples extracted on the 16th day
of each experiment, the no significant difference could be found between any of the experiments
which were conducted (P = 0.063). These same relationships were true of LD where significant
differences were found between the lesions which were created in the initial phase of the three
experiments (P = 0.013) although it was not possible to confirmed any difference statistically
between the lesions extracted on the 16th day (P = 0.058). Both R and SMax did not show any
significant difference between experiments when the lesions extracted on the 8th or 16th days where
compared (P ≥ 0.096).

Effect of NaF and Ca-Lactate vs. dH2O Exposures on the Cariogenicity of Established Biofilm Communities | Ch. 9
240
9.4.0 Discussion In the present work, a steady-state [Kinniment et al., 1996] was not strictly achieved before the
introduction of the adjunct agent(s). As all biofilm sampled were composed of those genera which
are commonly found in the oral environment [Marsh and Martin, 2009a] and no one run lacked
these populations entirely. In refection, a more stable microbial population may have been achieved
if the sCDFF was allowed to for a longer period of time. However, it is generally accepted that the
risk of contamination increases if the CDFF is allowed to remain in operation for extended periods of
time. If external contamination could have been avoided completely then factors relating to the
physiological state of the biofilm may have also achieved greater concordance in the initial phases of
the experiment and hence, would have provided greater resolution of the effects following the
introduction of their respective adjunct agent in the secondary phase. Although for the purposes of
studying the degree of substratum mineralisation, the length of time for the sections are exposed is
an important aspect to control. Therefore, the continuation of an experiment which includes enamel
lesions as an assessable parameter with the hopes of achieving a steady state would result in an
incompatibility of, arguably, the most important aspect of the caries process (the lesions which are
ultimately produced).
9.4.1 Microbial Composition in Response to Agent Exposures
Nevertheless, some interesting observations were made based on viable counts of the biofilms
which were produced. FA (Figure 9.3.1) continued to increase in Exp. S until a relatively stable state
was reached between the 14th and 16th days of the experiment. In comparison, the introduction of
NaF resulted in a reduction in viable counts indicating some antimicrobial effect of NaF on the wider
biofilm community [Bowden, 1990; Marquis, 1995b]. However, the introduction of NaF with Ca-
lactate did not show this immediate reduction (Figure 9.3.1). This may have been due to the relative
availability of fluoride within the biofilm. For fluoride to exhibit its antimicrobial or inhibitory effects,
it must be present as the free ion in solution so to allow for the formation of HF and therefore cross
microbial cell membranes where its effect of dissipating ΔpH [Kashket and Kashket, 1985; Sutton et
al., 1987], cytoplasmic acidification and enzyme inhibition [Curran et al., 1994] can occur. If the
formation of mineral reservoirs is favoured (such as during the addition of Ca-lactate) then less
fluoride would be available to partake in the processes of metabolic inhibition.
Assuming that a reduction in the antimicrobial activity of the fluoride ion was in fact the source of
this depression in viable counts, the comparative effects on a more resistant population may serve
to support this view. Lactobacillus spp. are known to possess resistance to NaF exposure [Green and
Dodd, 1957; Sutton et al., 1987] and the lack of any noticeable change following the introduction of
NaF would support this capacity (Figure 9.3.2) although there did appear to be some level of

Effect of NaF and Ca-Lactate vs. dH2O Exposures on the Cariogenicity of Established Biofilm Communities | Ch. 9
241
suppression at work where viable counts within both Exp. S and Exp. SNC, appeared to increase.
However, it should be noted that a reduced susceptibility to fluoride does not equate to total
residence. The fact that viable counts did not increase further in Exp. SN but did in Exp. S and Exp.
SNC may be in some way related to the removal of the antimicrobial effect of fluoride.
A much more obvious change was seen in Streptococcus spp. following both the introduction of NaF
and NaF in conjunction with Ca-lactate (Figure 9.3.3). Interestingly, this effect appeared more
pronounced in the Ca-lactate condition. Further to this, MS appeared to be least effected by the
combined exposure of Ca-lactate and NaF (Figure 9.3.4). These relationships therefore become more
difficult to explain. As discussed previously, cation binding may play a role in bridging gram positive
cocci such as Streptococcus spp. [Rose, 2000a] and although the EPS provides a matrix in which these
cell are embedded [Leme et al., 2006], disruption of the calcium bridging mechanism can lead to an
increase in the volume between cells [Rose and Turner, 1998]. Further to this, fluoride may disrupt
this mechanism [Rose et al., 1996]. The introduction of fluoride may have therefore promoted
dispersal whereas excess calcium led to saturation of the mono-dentate calcium bridges.
Alternatively, this particular community may have been more sensitive to the deleterious effects of
fluoride [Marquis et al., 2003] or calcium [Trombe et al., 1992]; these mechanisms could have
induced dispersal of Streptococcus spp. either mechanistically or in response to the environmental
stress respectively.
Within the MS group, as similar reduction occurred in the biofilms exposed to sucrose only (Exp. S)
as to what was found in the for Streptococcus spp. as a whole indicating that the proportion of MS to
Streptococcus spp. did not change significantly in this group and, on closer inspection, the same was
true within Exp. SN. To this end, the only clear difference was when the Streptococcus spp. in Exp.
SNC were compared to MS within this same experiment. In this instance, the proportion of non-MS
bacteria fell to an extremely small proportion of the Streptococcus spp. group. A similar albeit lesser
effect was also noted in previous dCDFF experiments (Figure 8.3.3 compared with Figure 8.3.4).
However, an enrichment of MS occurred in both conditions and therefore the actual effect of a
combined Ca-lactate exposure may not have been responsible. Rather, natural population shifts
[Skopek et al., 1993] may have exerted a combined effect with a decrease in the ionic fluoride within
the biofilm. If the inhibitory effects of fluoride were lifted following exposure to NaF and Ca-lactate
then the ecological advantage of MS would be afforded as described within the EPH [Marsh, 1994].
However, without measurements of PF fluoride, the exact cause of this relationship remains unclear
although a reduction in the non-MS bacteria in favour of MS is nevertheless indicative of a more
acidic or cariogenic biofilm [Bradshaw and Marsh, 1998].

Effect of NaF and Ca-Lactate vs. dH2O Exposures on the Cariogenicity of Established Biofilm Communities | Ch. 9
242
Viable counts of Veillonella spp. were obtained only for Exp. S and Exp. SNC (Figure 9.3.5). Here,
viable counts were variable but appeared to remain higher under exposure to NaF and Ca-lactate
whereas in the absence of these agents viable counts of Veillonella spp. were reduced over the
course of the experiment. This result was not observed previously and would therefore indicate that
Veillonella spp. within these biofilms performed differently than was previously noted (Figure 8.3.5).
As with previously described groups, analysis of the PF may have shed further light on the reasons
for this result. However, in addressing the initial aims of this study, the use of a lead-in phase before
the introduction of the adjunct agents [Deng et al., 2005] was effective in a sense that the variations
in the microbial were able to be compared to a period before the agent was introduced. However,
comparisons between conditions were limited in that the microbial composition between
subsequent sCDFF experiments was initially dissimilar. Factors such as these are known to
complicate matters when using microcosm inocula [Sissons, 1997; Tatevossian, 1988] and although a
relatively comparable culture can be created [Kinniment et al., 1996] the control of this by way of
sharing the inoculum is the most effective means described to date [Deng and ten Cate, 2004; Hope
et al., 2012]. Therefore, the use of a shared microsomal inoculum within a sCDFF design may prove
more effective in controlling variation between the initial phases of the experiments.
9.4.2 TMR of sCDFF Exposed Enamel Disks
In continuation of this point, differences were apparent in the initial state of the lesions which were
produced in each of the sCDFF experiments. This may have contributed to the progression of the
lesions as caries lesions have been shown to respond differently given their initial condition [Lynch
and ten Cate, 2006a]. In explanation of the difference, viable counts of highly acidogenic
Lactobacillus spp. (Figure 9.3.2) were higher in the initial phase of Exp. SNC indicating a more
cariogenic state of the biofilm within this condition. However, Veillonella spp. were also higher
(Figure 9.3.5) and these species have been shown to augment cariogenicity, reducing caries when
present in elevated proportions of the biofilm community [Mikx et al., 1972]. However, the balance
between acid production and consumption is central to this process [Mikx et al., 1976] and therefore
the actual metabolic activity within these biofilms is important to consider.
Ultimately, cariogenicity is defined by the ability to produce cares lesions and to this end, caries
lesions were produced within each of the enamel sections which were sampled. Further to this, the
introduction of NaF and NaF in conjunction with Ca-lactate appeared to inhibit demineralisation of
what can be defined as cariogenic biofilm as opposed to inhibiting the production of a cariogenic
state as was observed during investigations under conditions of biofilm formation.

Effect of NaF and Ca-Lactate vs. dH2O Exposures on the Cariogenicity of Established Biofilm Communities | Ch. 9
243
The results are similar to previous experiments which have shown that the introduction of NaF
exposures prevent demineralisation by elevating fluoride within the plaque biofilm [Tenuta et al.,
2008; Vogel et al., 2000]. Furthermore, the increased demineralisation which was seen during
exposure to both NaF and Ca-lactate when compared to NaF alone (Table 8.3.1) was previously
attributed to natural variations in the enamel tissue (Section 8.4.3) however, this result was again
found in the present study. It is therefore less reasonable to assume that the additive effect of Ca-
lactate was purely beneficial and therefore some negative effect may occur as a result of the
introduction of this agent. Negative effects of Ca-lactate itself have not been demonstrated on
enamel mineralisation although the Ca-lactate salt has been shown to be less effective than other
possible alternative such as Ca-acetate or Ca-propionate [Brudevold et al., 1985]. The reasons for
this were explained on the basis of both disassociate of the calcium ion and the buffering capacity of
the salt base. Lactate may complex with calcium [Gray and Francis, 1963] with a relatively higher
affinity than other bases which do not contribute to buffering capacity but for which complete
disassociation would be expected [Brudevold et al., 1985]. However, within a saturated solution,
neutralised lactate alone would not promote demineralisation.
Brief exposure of plaque biofilm to fluoride is restricted with the greatest concentration found in the
surface of the biofilm [Watson et al., 2005] and under higher driving forces for mineral precipitation
(ie. elevated plaque calcium), a greater proportion of fluoride deposition may have occurred in the
outer layers of the biofilm which were exposure (Figure 9.4.1). Therefore, fluoride-containing
mineral deposits may also be restricted away from the enamel surface. The release of mineral ions
from these reservoirs [Pearce, 1998] may also be partially limited to the areas in which they form.
Figure 9.4.1 (Fluoride Penetration as a Function of Plaque Calcium): Hypothetical illustration of fluoride deposition with or without elevated calcium; a) Plaque biofilm relatively lower in free calcium ions; b) Plaque biofilm relatively higher in free calcium ions; c) key relating calcium and fluoride concentrations as indicated by the intensity of the gradient.
Analysis of the entire biofilm structure would not capture the spatial distribution of these reservoirs
as they would exist within the biofilm and therefore the results obtained in the previous studies
Effect of NaF and Ca-Lactate vs. dH2O Exposures on the Cariogenicity of Established Biofilm Communities | Ch. 9
244
(Section 8.3.5) which centred on PF analysis would not provide a measure of the ionic composition
of the phase in immediate contact with then enamel surface. Rather an average composition of the
entire fluid phase within the plaque would be collected. In some respects, this can be regarded as a
limitation of the analysis methods which were previously applied however, as discussed above,
analysis of the degree of mineralisation within the enamel substratum provides a definitive results
concerning the ultimate efficacy of any given agent.
Nevertheless, one fundamental limitation of the experimental design of the sCDFF is the assumption
that each biofilm within each condition behaved in a similar manner. Continual inoculation by way of
the scraper blade would help to maintain a relatively constant environment within each unit
however sites-specific variations in the ecology between samples is a possibility. This may have led
to a greater degree of mineral loss in the sections which were extracted on the 16th day of Exp. SNC
before the agent was introduced. Thus, the additive effect of Ca-lactate may have in fact been to
reverse the effects of, or inhibit, demineralisation although this was not captured in the samples
which were analysed. It should also be noted that heterogeneity between biofilm samples is likely to
be exacerbated by the use of a larger (15 pan) CDFF when compared to the smaller units (8 pan)
used in previous dCDFF experiments.
Ultimately, proof of concept was achieved [Deng et al., 2005] in that a period of growth prior to the
commencement of the exposure period provide further information thus enabling a period of
quantification irrespective of exposure to adjust agents. However, issues with the variability of the
microcosm biofilms [Sissons, 1997; Tatevossian, 1988] were nevertheless identified as a cause
disparity between the activity of the biofilms in the initial phase of the experiments. Furthermore, in
the case of biological models which include a lead-in period [Deng et al., 2005] such as the sCDFF,
the use of non-biological models to produced pre-made lesions (as was applied in Section 8.2.0) may
not be an effective means of controlling this issue as even pre-made lesions would be subject to
these same issues. In this case, variability may be controlled by moving away from the use of a
microcosm inoculum and testing the effects of a given agent (or agents) on single- [Deng et al., 2005;
Pratten, 2005; Pratten et al., 1998b] or multi-species [Bradshaw et al., 2002; McKee et al., 1985]
biofilms should be applied. However, contrary to the benefits of this strategy, key interactions of the
microcosm inoculum may be lost when such defined cultures are used [Burmolle et al., 2006;
Sissons, 1997; Tatevossian, 1988; Wimpenny, 1988] and therefore any presumed effects should also
be tested with the use of a microcosm [Pratten et al., 1998b; Sissons, 1997] as even given a
propensity for variation, the microcosm is ultimately a closer approximation to the natural in vivo
situation and therefore provides the greatest clinical relevance of an in vitro model.
Effect of NaF and Ca-Lactate vs. dH2O Exposures on the Cariogenicity of Established Biofilm Communities | Ch. 9
245
9.5.0 Conclusions Ca-Lactate pre-rinses within resulted in a reduction of the viable counts of key microbial species
within biofilms when compared to pre-rinses consisting of dH2O. Given the parameters introduced, it
is concluded that an effect of increased plaque lactate may provide some inhibitory effect on
microorganisms which use the cytoplasmic expulsion of this end product to generate energy by
proton motive force (ΔpH) [Hamilton and Ng, 1983]. However, microbial groups which do not
depend on this mechanism for energy production (eg. Veillonella spp.) were also affected. Therefore,
it appears that the effect of Ca-lactate on the microbial community reach further than this
mechanism alone. Elevated calcium, the persistence of biological an inorganic mineral reservoirs and
variation in the primary culture [Ledder et al., 2006] may all contribute to the observed results and
therefore deserve further investigation.
Comparisons between the results obtained from the initial and secondary phases for each
experiment also enable true relationships to be identified within the particular communies present
within each sCDFF run. From this, the concept of a lead-in period before the introduction of the
agent to be tested is also concluded as an effective means of assessing the effect(s) of an exposure
strategy [Deng et al., 2005]. However, the variation in the biofilm community is still a significant
issue; particularly with the use of microcosm biofilms. Ultimately, further information can be gained
from the use of more complex inocula [Sissons, 1997] but this benefit is gained at a cost of the
resolution in the results that are collected.
As the results of the sCDFF experiments were somewhat dissimilar to that of the dCDFF experiments
which focused on exposure during biofilm formation, entire comparisons were not possible also a
significant insight was achieved in that the protection conferred by Ca-lactate pre-rinses is less
effective on fully formed biofilms. Thus, further work is needed in order to ascertain the effects of
Ca-lactate pre-rinses on both biofilm formation and, in particular, the relative efficacy of this
strategy in preventing enamel demineralisation. In particular, spatial organisation of mineral
deposits should be investigated as a function of the DS of the biofilm with respect to relevant
mineral phases.
Interestingly, Ca-lactate pre-rinses were no more effective that NaF exposures alone when
considering remineralisation efficacy. In this instance, elevation of biofilm calcium may have
resulted in an excessive driving force for remineralisation and therefore limited the depth at which
such supposed mineral deposits form within the biofilm itself. However, the negative effects
observed may have been the result of a limitation of the CDFF model as the behaviour of mineral
phases within this system is expected to be different from the conditions in vivo.

246
Chapter 10: General Discussion
Abiotic model systems afford a level of clarity in their use which enables specific chemical
interactions to be investigated in detail [Arends, 1995; Arends and Christoffersen, 1986; White,
1995]. However, these systems are unable to simulate dental caries in its entirety due to the fact
that a biological element is purposefully removed. Nevertheless, well-designed abiotic experiments
may be used to accurately determine the effects of individual aspects of a complex process [Vogel,
2011]. Their ease of use allows their application whilst consuming minimal resources and, with this
in mind, abiotic model systems were initially employed to produce caries lesions in artificial groove
structures. Ultimately this led to the rejection of assembled grooves on the basis of the efficacy of
the method itself however the fact that such an intricate surface was able to be explored provides
further support for this view [Arends, 1995; White, 1995]; elucidation of the factors responsible for
the results observed would not have been possible had a biological caries model been used in this
instance as the behaviour of the demineralising challenges would have lacked the level of conformity
needed.
Further to this, abiotic systems were also used to investigate enamel demineralisation within
narrowed grooves carved directly into the surface of polished sections of bovine incisal tissue. These
result were able to indicate that enamel demineralisation within the groove was possible, as has
been produced by others [Smits and Arends, 1986; Yassin, 1995], but the processing of enamel
sections for analysis by TMR is difficult due to the fragility of the tissue [Lagerweij et al., 1996]. Albeit
indiscriminate with respect to the sections that were affected, the propensity to fracture was
identified early on. This again provided an advantage in that further studies can anticipate this
complication and adjustments were made to quantify further aspects of the biological systems, thus
reducing losses. It addition to this, the specifics of the processes involved in using enamel sections
were also able to be investigated. Even given the previous reports of fragility noted above, an
attempt to apply this protocol was not without merit as further development of skill may have, or
may still allow for, the extraction of high quality data. The reports of Anderson and Elliot [2000] were
also corroborated and incorporated into the theoretical progression within enamel groove
structures. Had enamel grooves proved effective for analysis by TMR, patterns of demineralisation
should be interpreted on the basis of variable rates of mineral loss on the approach to the EDJ due
both to prism junction density [Shellis, 1984, 1996] and composition variations in the tissue itself
[Theuns et al., 1986a; Theuns et al., 1986b].

General Discussion and Conclusions | Ch. 10
247
Abiotic systems may also be used in conjunction with biological models to address the issues
associated with the reproducibility of plaque biofilms [Sissons, 1997; Tatevossian, 1988]. Within the
context of the experiments presented, this was applied in instances where remineralisation was
expected such as under dual exposure to caries inhibiting agents (Chapter 8). However, caries lesions
may also be produced within the CDFF before the introduction of an agent and this approach would
allow for the effects of the agent to be assessed on both an active lesion and on a cariogenic biofilm
community. Deng et al. [2005] were first to explore this concept. With the use of a microcosm
inoculum, issues relating to the reproducibility of the biofilm community between runs [Hope et al.,
2012] was most likely the cause of difference in the state of the lesions before the introduction of
the agents tested (Chapter 9). However, within each of the sCDFF experiments, proof of concept
[Deng et al., 2005] was achieved in that it was possible to ascertain more definite relationships
without the confounding effects of the adjunct agent(s) on the processes of initial attachment and
biofilm development; the differences upon maturity which may result from alterations in initial
colonisation [Ledder et al., 2006; Sissons et al., 1995] were effectively removed.
10.1 Efficacy of the CDFF Models for Caries Research Several other model systems are available which include a microbial element [Dibdin and
Wimpenny, 1999; Sissons, 1997; Wilson, 1999]. In theory, the relationships which have been
demonstrated in the current work could also be demonstrated with the use of other in vitro
biological models although unlike the other systems currently available, the CDFF is able to mimic a
pattern of acid production which is similar to that which results in natural microbial biofilm
communities as was demonstrated in Chapter 6. By design [Peters and Wimpenny, 1988], the CDFF
mimics aspect of the oral environment through the flow of the growth medium (STGM) over the
surfaces of the microbial biofilms in much the same way as would occur in the natural oral
environment [Sissons, 1997; Wilson, 1999]. Further to this, what has been proven throughout the
studies presented in this thesis is that this model is able to produce enamel caries lesions which are
ultimately the most definitive marker of biofilm cariogenicity.
This was similar to the experiments conducted by Zaura et al. [2011] however, within the model we
have designed, PF composition was measured as opposed to the total organic acid content of the
biofilm (including that within the cells themselves). Whilst the work of Zaura et al. [2011] provides
great insight into the metabolic activity of the collective community, the PF concentrations of
organic acid species were not determined in the form which they would interact with the enamel
tissue. Further to this, mineral ions relevant to the caries process were also collected within the
works presented in this thesis. To date, such a comprehensive analysis of organic acids and inorganic
ions has not been performed within the CDFF model.

General Discussion and Conclusions | Ch. 10
248
The production of caries lesions has been shown in various in vitro biological models [Arthur et al.,
2013; Deng and ten Cate, 2004; Deng et al., 2005; Fontana et al., 1996; Shu et al., 2000; Zaura et al.,
2002; Zaura and ten Cate, 2004; Zaura et al., 2005] however the production of enamel caries within
the CDFF model has not previously been shown. Of the CDFF studies conducted, dentine was
employed as a substrate [Deng et al., 2004; Deng and ten Cate, 2004; Deng et al., 2005; Zaura et al.,
2011; Zaura et al., 2002; Zaura and ten Cate, 2004; Zaura et al., 2005] or enamel lesion were
produced following a cariogenic challenge external to the CDFF unit [Aires et al., 2006; Arthur et al.,
2013].
High levels of microbial variation occur with the use of a pooled salivary inoculum [Sissons, 1997]
however the use of this pooled source should ensure a degree of conformity between aliquots
[Dietz, 1943]. Even when a relatively extensive level of processing is applied, bacterial aggregation
invariably results in some level of inhomogeneity [Hope et al., 2012] and although the vast majority
of parameters are controlled with the use of a CDFF [Pratten, 2005], even minor differences in the
inoculum can be amplified in primary culture [Ledder et al., 2006] and hence in the biofilms which
are produced. In a sense the difference observed between biofilm compositions in Chapter 9 (before
the introduction of the adjunct agent) and between sequential repeats in Chapter 7 could be
attributed to this source.
The dCDFF model was developed to prevent variation as much as possible between microcosm
inocula [Hope et al., 2012]. However, in a robust series of experiments conducted by Hope et al.
[2012] variation was apparent between both CDFF units on the dCDFF model although this variation
was considerably less than that which occur between CDFF units which did not share the same
primary culture (i.e. those which made use of separate a inoculum between each run). The cause of
this residual variation is yet to be described in full however this may be due to chance variations in
the initial colonisation stages [Ledder et al., 2006]. In much the same way that aggregates can lead
to differences in the primary inoculum, aggregation within the primary culture could also lead to an
inhomogeneity in the inoculum which is fed into either unit of the dCDFF model.
Controlling this variation is an extremely difficult process and, to some extent, may not be achieved
with consistency when using the current operating procedures. However, further precautions such
as the use of a steady-state culture within chemostat to inoculate both dCDFF units [Bradshaw et al.,
2002; Kinniment et al., 1996] would help to control for variations which arise from an altered
microbial composition within the inoculum [Bakht et al., 2009; Ledder et al., 2006]. For these
reasons, assessment of the microbial population alone may provide much less information on the
factors which relate to caries lesion formation than could be gained from in-depth chemical analysis

General Discussion and Conclusions | Ch. 10
249
of the system. In the present works, the lesions which were produced exhibited a level of biological
variation which was reflective of that which was observed in the microbial population. Moreover,
organic acid responses also appeared somewhat variable however within the context of each
experimental design. The consideration of these parameters in conjunction did prove an effective
means of meeting the initial aims and objective of each. Thus, microcosm biofilm may be inherently
variable but nevertheless represent laboratory models of the natural system from which relevant
relationships originate and may also evolve [Wimpenny, 1988]. In this sense, each of the responses
which were investigated were able to demonstrate a valid relationship although it should be
remembered that other responses may also be possible due to an in-built adaptive capacity of the
microcosm biofilm [Buchen, 2010; Molin and Tolker-Nielsen, 2003].
One limitation of the CDFF model is the sampling constraints which are associated. This relates to
both the treatment and handling of the samples within proper operating conditions [Pratten, 2005]
and the number of sampling occasions which are provided by each CDFF run. The most appropriate
in vitro biological models should provide high number of samples [Dibdin and Wimpenny, 1999]
however, the CDFF is only able to provide samples to a limited extent. Each unit allows for only finite
number of sampling occasions and these are defined by the number of sample pans. Aseptic removal
is another prerequisite of operation [Dibdin and Wimpenny, 1999; Pratten, 2005] and therefore does
not permit the re-insertion of sample pan once removed because of the risk of external
contamination once the unit has commenced operation. Without the range of endogenous factors
present in vivo [Auschill et al., 2004], external contamination has the potential to result in
overgrowth of organisms which are not typical of the oral environment and thus a form of
colonisation resistance [Marsh and Martin, 2009a] from the formation or maintenance of a
cariogenic biofilm. In such situations, concomitant measurements of acidogenicity and substratum
mineralisation would be possible but would, almost by definition, be un-representative of the
situation caries occurring in vivo.
Nevertheless the ability of the CDFF to produce an adequate amount of data is for the interpretation
of the effects of anti-caries agents or strategies was possible; when interdisciplinary techniques are
applied (such as measurements of the microbial ecology, PF composition and the degree of sub
strum mineralisation), a wealth of information can be acquired. However, due to the sampling
constraints discussed above, the choice of which techniques should be applied must be considered
carefully. In fact the sheer number of parameters which have been collected from the current work
may have been investigated from several angles and to this end the conclusions drawn from this

General Discussion and Conclusions | Ch. 10
250
thesis are by no means exhaustive but, relative to this caries process, these factors should be viewed
as a whole.
If the variation which exists between biofilms can be controlled in a more effective way then the
potential of the CDFF model may be even greater. As was attempted within the study presented in
Chapter 9, the production of a reproducible culture was investigated by the use of a lead-in period
[Deng et al., 2005] before the introduction of any adjunct agent (sCDFF) and afford a much greater
level of confidence in the results which are produced. Variation between sCDFF runs was an issue
[Hope et al., 2012] however within each experiment, the comparisons made following the
introduction of the agents alone or in combination was able to demonstrate an interesting
relationship in that the combined effect of NaF and Ca-lactate appeared to be less beneficial than
the effect of NaF exposures alone. Technical complications aside, the CDFF provides a powerful
means by which both existing chemical relationships and new adjunct agent(s) can be tested within
a biological context. This provides a great advantage over the use of in situ trial in that the cost of
producing a single run is much less than that which is would be needed to provide a similar advance
if an in situ model or clinical trials were in place.
10.2 Investigating the Effects of Adjunct Agents Previously established relationships can be demonstrated within the CDFF model (Chapter 6).
Previously, the CDFF has however been used as a tool to investigate dental caries and has also
demonstrated the effects adjunct agents on cariogenic biofilms by way of the degree of dentine
demineralisation [Deng and ten Cate, 2004; Deng et al., 2005; Zaura et al., 2011]. However, with
respect to enamel caries, the work present within this thesis is the first to be conducted and to this
end, definitive caries lesions [Arends and Christoffersen, 1986] were produced. In refection, the
diversity of these lesions was at times considerable although in comparisons to that which occurs in
in vivo [Fejerskov et al., 2008b], the CDFF model was seen to exert a degree of control over the
suggestively uncontrollable [White, 1995] process of biological lesion formation.
Some authors were able to induce remineralisation in dentine grooves when both 0.2%
chlorhexidine digluconate and 135 ppm F- (from NaF) were introduced to a mono-species culture of
Streptococcus mutans C180-2 [Deng et al., 2005]. Interestingly a much greater reduction in lactic
acid was induced under exposure to NaF in their studies illustrating the susceptibility of this species
to NaF exposures. However, within the present works MS appeared much less susceptible to NaF
exposures indicating the greater resistance of microcosm biofilms when compared to their single
species counterparts [Gilbert et al., 2002; Sissons, 1997] and further supporting the need for
applications of microcosm biofilm research within caries research. Whether the observed results

General Discussion and Conclusions | Ch. 10
251
were a product of interactions between members the microcosm community or due to variations in
the initial microbial lineage which gave rise to the particular plaque biofilm remains to be explored.
As was demonstrated in Chapter 7 and Chapter 9, NaF exposures which are representative of those
suggested for normal oral hygiene [Parnell and O'Mullane, 2013] provide some modulatory effect on
the plaque community within the CDFF model, however this response was not consistent with
respect to the microbial composition of the biofilms which were reproduced. Nevertheless, a
consistent response was seen in the inhibition of demineralisation. This aspect of the system was
therefore shown to provide the most definitive response factor. Whereas others such as the PF
composition and the state of the microbial ecology mentioned above may be more sensitive, their
relation to the caries by definition (i.e. the production of caries lesions) is limited within a dynamic
model system such as the CDFF.
Ca-lactate exposures show some inhibitory activity on the microbial community and this may be a
result of the inhibitory effect of lactate exposure on bacterial cells [Hamilton and Ng, 1983] although
the heightened concentrations of calcium may also play some role within this response. It should be
noted that killing efficacy was not measured within the present studies and therefore the results
based on viable counts would only be a reflection of growth or the potential to grow. Thus,
antimicrobial activity of either of the agents involved (or in conjunction with each other) cannot be
confirmed. An inhibitory effect on the biofilm (antibiofilm) or the proliferation within
(antiproliferative) was however observed following exposure to Ca-lactate which was less apparent
under NaF exposures alone. In this sense, the anticaries effect of Ca-lactate pre-rinse may reach
further than the essentially inorganic mechanisms proposed thus far [Pessan et al., 2006; Vogel et
al., 2008].
Unfortunately it was not possible to determine exactly to what extent the STGM would alter
bacterial adhesion and thus biofilm formation from that which would be expected in vivo. However
the medium was known to consist of several substances which would help to mediate adhesion to
the surface of and HA or enamel substrate. Furthermore, it should be noted that some early
colonisers (Streptococcus spp.) are able to adhere to bare HA surfaces [Tanaka et al., 1996].
Nevertheless, given the fact that a CDFF model enables the strict control almost every parameter
associated with its operation, the model lends itself well to many of the applications which have
previously required the use of non-biological systems. For example, providing evidence of strict
physiochemical mechanisms involved in caries lesion formation as was applied in Chapter 5,
contributing the knowledge of an ambivalent response within a fixed environment (Chapter 6), or
investigating plaque-mediated reservoirs as was conducted in Chapter 7, Chapter 8 and Chapter 9.

General Discussion and Conclusions | Ch. 10
252
For future applications in such research, the growth medium used should however be altered as
without complete knowledge of the medium to which the biofilms are exposed, the applicability of
this model to in vivo situations is limited [Shellis, 1978; Wong and Sissions, 2001].
Of course, the pooled salivary samples [Dietz, 1943] used to inoculate CDFFs introduce some of the
factors which can confound in situ and clinical trials; this being variation in the microbial consort
[Ledder et al., 2006]. However, the human element of this situation is reduced by the removal of the
personal factors. Factors specific to the oral environment such as the flow rate of saliva, the physical
structure of the surface, and the composition of the medium in contact within the plaque biofilm
(Figure 1.1) are effectively controlled. However, with the use of a microcosm inoculum the microbial
element appears to remain problematic with respect to interpretations and possibly function
although defining the activity of the biofilm based on the latter may be a more effective means by
which to contribute to this area of research [Sissons, 1997].
The relatively recent appreciation of microbial biofilms and the myriad of interactions which can
take place within calls for a microbial community which retains the collective physiological capacity
of a natural plaque biofilm and therefore the use of a microcosm inoculum to study the effects of
preventative agents [Sissons, 1997] such as NaF and Ca-lactate and their relationships within such
biofilms should be explored further.
What remains to be seen is can the plaque biofilm revert back to a less cariogenic state once the
ecology has been directed towards the induction of caries? Microbial populations have
demonstrated the ability to regenerate following severe destruction of the original community
[Buchen, 2010] and, within the EPH [Marsh, 1994], the physiological state is determined by the
plaque ecology which is dictated by the relative advantages or disadvantages of members within the
community. In the case of caries, acid production (acidogenicity) and acid tolerance (aciduricity)
provide an advantage over those organisms which lack such capacities. However, although some
acid sensitive oral streptococci, such as Streptococcus sanguinis, have a greater affinity for sucrose
than cariogenic species such as Streptococcus mutans [van der Hoeven et al., 1985], it has been
demonstrated that the acidity of the medium is responsible for the advantage posed by acidogenic
microorganisms as opposed to their ability to utilise sugars [Bradshaw et al., 1989]. Thus, logically,
the removal of this advantage may result in a reversion to a less cariogenic state as the microbial
community adjusts to suit the members for which the environmental conditions are optimal. The
exact response of biofilm under these or any conditions which are imposed is only truly able to be
demonstrated once all relevant species are included within the community. Thus, the microcosm
biofilm comprises a difficult although essential avenue for in vitro research.

General Discussion and Conclusions | Ch. 10
253
10.3 Clinical Relevance In planning clinical trials, difficulties are met in that cost of running such an investigation adds a
significant weight to each of the decisions which are made during this process. Often, the need to
ensure that the most effective avenue of research is met through extensive literature search and
comparisons of other, presumably, similar interventions. However, this approach, whilst accepted on
the basis of need, is by no means the most effective way to proceed as the plethora of extraneous
variables inherent in such situations can easily lead to unexpected results. Although this is not
always the case, any such unknown quantity has the potential to invalidate the outcome. The CDFF
can be used to estimate the outcome of a specific intervention to a much greater degree of accuracy
that has previously been thought. Thus, the clinical relevance of a fully functional biological caries
model such as those described within this thesis would prove extremely valuable for predicting the
role of multispecies oral biofilm communities in the cares process.
In addition to this, an agent may be expected to show some effect in a clinical setting form data
which is available from more simple in vitro models. In this case, clinical trials may be justified only
to find that the agent is not effective when tested on a microcosm community or on cariogenic
biofilms living in the true biofilm form. An example of such an instance can be found in studies cited
previously and in the outcomes which were observed. Bradshaw et al. [1990] demonstrated that, in
a defined multispecies community, exposure to fluoride caused a significant alteration to the
ecology within their biological model. Initially, it could be concluded that such an exposure would
have the same effect clinically. However, as was observed within the works presented within this
thesis, this was certainly not the case when a more complex biological model was applied. In the
case of fluoride, this result may perhaps not have been surprising as fluoride has been in use for over
50 years; thus a definitive effect on enamel demineralisation with a variable effect on plaque
ecology has been well document within the literature [Duckworth, 2013] but the fact that extensive
clinical research has been conducted in the past only serves to strengthen the use of the CDFF as a
concordance with observations from a clinical setting was found. In essence, any new agent or
exposure strategy can first be tested within the CDFF model before embarking on costly clinical trials
therefore saving funds which can then be spend more appropriately; furthering wider areas of
research by removing, arguably, the most prominent limitation of clinical research [NIH, 2001].
10.4 Future Perspectives One of the most interesting results to be captured within the present work was apparent
remineralisation upon exposure NaF and NaF following Ca-Lactate pre-rinses (Figure 8.3.8). In these
instances, not only was enamel remineralisation captured within the CDFF system but fine
differences between the effectiveness of Ca-Lactate pre-rinses and NaF exposures alone were also

General Discussion and Conclusions | Ch. 10
254
identified. As discussed above, these observations provided a substantial level on insight into the
possibly benefits (or lack thereof) of the use of a Ca-Lactate pre-rinse in vivo. However, the foresight
to include pre-made enamel lesions within the CDFF system may have much further implications
than this particular example alone. Exploring the effects of therapeutic agents which are thought to
augment the process of enamel demineralisation clearly has its own merit in that the discovery of an
agent or strategy which can inhibit demineralisation may have important uses in the fight against
dental decay. However, the fact of the matter remains that carious demineralisation occurs world-
wide and for many individuals. Therefore, the reversal of the demineralisation experience would be
necessary to restore affected individuals to their optimum state of oral health. Thus, exploring
strategies or agents which may promote remineralisation is of particular interest and, as has been
demonstrated in the experiments presented thus far, is also a distinct possibility.
Figure 10.1 (Control of Bi-Phasic Fluoride Exposures): By varying the flow rates of two solutions fed into the same CDFF inlet (300 ppm F
-
and dH2O) a bi-phasic fluoride exposure can be set to mimic that found within the oral environment. In the above example, the net flow rate is maintained at 3 mL.min
-1 for the purposes of clarity however, salivary flow rates can be introduced by simple manipulation of the
mathematical equations used (as can reservoir release stages). Bi-phasic fluoride release data obtained from Duckworth [1993].
One of the original perspectives provided by the work presented within this thesis was that the
effect of fluorides on biofilm ecology were investigated using an exposure strategy which could be
expected of the average individual [Parnell and O'Mullane, 2013] living in a non-fluoridated area.
Another interesting area to explore would thus be a continuation of this theme. Although exposure
from dentifrice would be limited to the time with which the slurry persisted within the oral cavity, it
0.1
1
10
100
0.00
0.50
1.00
1.50
2.00
2.50
3.00
3.50
0 20 40 60 80 100 120 140
Flu
ori
de
Co
nce
ntr
atio
n (
pp
m)
Flo
w R
ate
(m
L.m
in-1
)
Time (Minutes)
Flow Rate (dH2O) Flow Rate (300 ppm NaF) Net Fluoride Exposure (ppm)

General Discussion and Conclusions | Ch. 10
255
is now well understood that exposure to fluoride is not [Duckworth, 1993]. In the majority of
individuals, fluoride persists within the oral cavity from gradual release of multiple reservoirs
resulting in a bi-phasic delivery (Figure 10.1) [Duckworth, 1993, 2013]. Simple modifications to the
equipment could easily enable this aspect of in vivo persistence to be explored. For example, by
having one solution consisting of dH2O and another of 300 ppm F- fed into the same inlet port,
varying the flow rate between the two solutions during a during an exposure would allow for the
amount of F- delivered to each biofilm to be precisely controlled (Figure 10.1) therefore enabling
investigations on the effects of this phenomenon to be explored.
Variation with respect viable counts of microcosm communities was without a doubt a significant
issue within the present work. However, it was concluded that initial variation between dCDFF units
was, in part, responsible for the observed results. As discussed above, this argument formed the
pretence which led to the development of the sCDFF model. In practice, initial variation between
biofilms may also play a significant part within this model however the potential of the sCDFF to
enable much more accurate comparisons between CDFF experiments remains. Unfortunately,
development past this point was not pursued although integration of the sCDFF and dCDFF models
may have provided a major advance in the effective functionality of the CDFF. With a sequential
element within the dCDFF apparatus, the reduction in variable afforded by the use of a shared
microcosm inoculum [Hope et al., 2012] could be qualified within each experiment by an initial lead-
in period [Deng and ten Cate, 2004]. With this amendment, not only would initial variation be
expected to be reduced but all benefits provided by the sCDFF would be conferred to the dCDFF
model. Cariogenicity, metabolic activity and microbial composition could all be compared in much
greater confidence than ever before with the additional benefit of a relative point to compared
between completely separate experiments. In effect, the best of both approaches would be
available therefore providing an extremely powerful system for use in future research.
Moreover, past endeavours which sought to address the issues associated with multi-species
biofilms [Bradshaw et al., 2002; Deng et al., 2004; Mattos-Graner et al., 2000; Pratten et al., 1998b;
Shu et al., 2000; Valappil et al., 2013] are by no means redundant. With the use of a microcosm
inoculum, ambiguity in the results obtained may remain an unavoidable complication and therefore
the discovery of discrete interactions may continue to prove elusive. With this in mind, a pertinent
step would be not to dismiss the use of simpler microbial innocula but rather to run systems
consisting of a defined culture based on evidence gained through experiments based on microcosa.
However, in many respects the practical implications of such efforts may prove to be a sever
limitation and would therefore need to be based on sound scientific reasoning; judging the cost of

General Discussion and Conclusions | Ch. 10
256
time spent against the potential for scientific discovery. Within the present work, this was not a
particular issue as all events witness were able to be explained on the basis of information which
was already available although, had such a situation arose, dissection of the superoragnism [Buchen,
2010] to reveal the basis of an observed functionality would certainly have been pursued.
However, the ability to employ a microcosm biofilm would always be an essential quality for any
system which aims to fully simulate the natural oral environment. In this sense, a simplified model
would never possess the full capacity of one which includes a microcosm source [Wimpenny, 1988].
But if such an all-inclusive approach is to be maintained, analytical techniques which are able to
accurately capture changes to this community must also be employed [Nyvad et al., 2013]. To this
end, the assessment of full community profiles should be applied [Aas et al., 2005] in place of the
traditional culture techniques used within the present work. The wealth of information which would
thus be gained from each run may, to some extent, be clouded by those which serve no purpose
toward the function of the biofilm. Nevertheless, if this information is not available then no further
insight can be gained. Furthermore, traditional culture was used within the present works to serve
as a marker of the generalised community structure; to link these in vitro biofilms to those which are
found in vivo and to further provide an indication as to plaque function based on the relative
proportions of acidogenic, aciduric or cross-feeding community members [Marsh and Martin, 2009a;
Spratt and Pratten, 2003] and the fact remains that, if molecular biology approaches were applied,
this same information could be attained with the further potential for much more and at no expense
to the current functionality of the model itself.
One aspect which was not presently addressed was the role of biofilm thickness on the caries
process. Recently, mathematical modelling has demonstrated that a relationship exists between
caries lesion formation and thickness of the plaque layer [Ilie et al., 2013]. Analogous to the efforts
of Bollet-Quivogne et al. [2005], investigations into the effect of the thickness of the diffusion layer
(in the present case, the plaque biofilm itself) may also be warranted as this could reveal previously
unknown relationships that exist between such a dimension and the development of caries.
Moreover, the accurate determination of such a parameter may also show direct clinical relevance in
that the diagnostic ability of healthcare professionals would be improved. Until now, no model
system has been able to provide the level of controlled afforded by the CDFF but, with its advent,
such a parameter could easily be tested. In summation, the perspectives discussed above are by no
means exhaustive. Some amendments to the model may be within closer reach than others but
ultimately, the application of this system is limited only the imagination of the investigator.

General Discussion and Conclusions | Ch. 10
257
10.5 General Conclusions In developing a fully functional biological caries model, the aims of this thesis were met in full. Not
only were carious lesions formed within the dCDFF model but the aim was, in fact, surpassed by the
further development of an alternative model, the sCDFF. In all cases, representative microbial
cultures were produced that exhibited the full range of responses expected on natural in vivo or in
situ plaque. However, the current composition of the STGM should be reviewed although, with the
drawbacks associated with a complete re-design of this medium, the fact that its commotion has
been analysed extensively now means that its use can be justified within an approximation to the
physiochemical relationships within this in vitro model being an acceptable compromise.
The extension of biochemical analyses to the PF itself also served to strengthen confidence in the
CDFF model as an extremely close approximation to natural oral biofilms in that, even given a
disparity between STGM and natural human saliva, microbial biofilm homeostasis was observed to
maintain a PF environment irrespective of the external fluid medium. In addition to this, PF
composition was found to be exceptionally similar to that found in natural oral biofilms when
subjected to comparable nutritional circumstances [Gao et al., 2001; Higham and Edgar, 1989].
Conversely, in modelling occlusal surfaces, this was not entirely the case as significant technical
limitations were experienced. However, the ability to monitor remineralisation was achieved. Had
occlusal surface been modelled more effectively, remineralisation within these structures could also
have been explored thus serving to demonstrate the breadth of functionality provided by the
models which were developed. Technical complications aside [Lagerweij et al., 1996], the successful
modelling of occlusal surface is an easily conceivable possibility and thus remains an avenue which
can be pursued with complete certainty in the not so distant future.
In elucidating a discrete quantifiable effect of NaF exposures, the aims were also not fully met.
However, the reasons for this could be traced directly back to the massive adaptive capacity of the
oral biofilm itself. In a sense, a discrete effect on the microbial ecology of a microcosm biofilm was
never expected to be achieved within the present work. More likely, was capturing an effect
imparted on the plaque function [Sissons, 1997]. Nevertheless, strategies for which their effects
could be viewed though alterations to the specific microbial ecology were found. Unfortunately,
further biochemical analyses of the PF were not possible within the current operating conditions of
this model however measurements of plaque pH and tests for alkali solubility of inorganic mineral
reservoirs would have been a clear advantage. Although, at the expense of other aspect of the
system (such as a reduction in sampling occasions), these parameters can be assessed; possibly at a
later stage in a process which can be expected to require continual extension.

258
Reference List
Aas JA, Paster BJ, Stokes LN, Olsen I, Dewhirst FE: Defining the normal bacterial flora of the oral cavity. J Clin Microbiol 2005;43:5721-5732.
Aires CP, Tabchoury CPM, Del Bel Cury AA, Koo H, Cury JA: Effect of sucrose concentration on dental biofilm formed in situ and on enamel demineralization. Caries Research 2006;40:28-32.
Alves KMRP, Franco KS, Sassaki KT, Buzalaf MAR, Delbem ACB: Effect of iron on enamel demineralization and remineralization in vitro. Archives of Oral Biology 2011;56:1192-1198.
Amaechi BT, Higham SM: Quantitative light-induced fluorescence: A potential tool for general dental assessment. Journal of Biomedical Optics 2002;7:7-13.
Amaechi BT, Higham SM, Edgar WM: Use of transverse microradiography to quantify mineral loss by erosion in bovine enamel. Caries Research 1998;32:351-356.
Amaechi BT, Higham SM, Edgar WM: The use of gamma irradiation for the sterilization of enamel for intra-oral cariogenicity tests. Journal of Oral Rehabilitation 1999;26:809-813.
Amerongen AVN, Veerman ECI: Saliva – the defender of the oral cavity. Oral Diseases 2002;8:12-22.
Anderson CA, Curzon MEJ, Van Loveren C, Tatsi C, Duggal MS: Sucrose and dental caries: A review of the evidence. Obesity Reviews 2009;10:41-54.
Anderson P, Bollet-Quivogne FRG, Dowker SEP, Elliott JC: Demineralization in enamel and hydroxyapatite aggregates at increasing ionic strengths. Archives of Oral Biology 2004;49:199-207.
Anderson P, Elliott JC: Coupled diffusion as basis for subsurface demineralization in dental caries (short communication). Caries Research 1987;21:522-525.
Anderson P, Elliott JC: Subsurface demineralization in dental enamel and other permeable solids during acid dissolution. Journal of Dental Research 1992;71:1473-1481.
Anderson P, Elliott JC: Rates of mineral loss in human enamel during in vitro demineralization perpendicular and parallel to the natural surface. Caries Research 2000;34:33-40.
Anderson P, Levinkind M, Elliott JC: Scanning microradiographic studies of rates of in vitro demineralization in human and bovine dental enamel. Archives of Oral Biology 1998;43:649-656.
Angmar B, Carlström D, Glas JE: Studies on the ultrastructure of dental enamel: Iv. The mineralization of normal human enamel. Journal of Ultrastructure Research 1963;8:12-23.
Aoba T: The effect of fluoride on apatite structure and growth. Critical Reviews in Oral Biology & Medicine 1997;8:136-153.
Aoba T: Solubility properties of human tooth mineral and pathogenesis of dental caries. Oral Diseases 2004;10:249-257.
Aoba T, Shimazu Y, Taya Y, Soeno Y, Sato K, Miake Y: Fluoride and apatite formation in vivo and in vitro. Journal of Electron Microscopy 2003;52:615-625.
259
Arends J: The application of in vitro models to research on demineralization and remineralization of the teeth: Reaction paper. Advances in Dental Research 1995;9:194-197.
Arends J, Christoffersen J: Invited review article: The nature of early caries lesions in enamel. Journal of Dental Research 1986;65:2-11.
Arends J, ten Bosch JJ: Demineralization and remineralization evaluation techniques. Journal of Dental Research 1992;71 Spec No:924-928.
Arif N, Sheehy EC, Do T, Beighton D: Diversity of veillonella spp. From sound and carious sites in children. Journal of Dental Research 2008;87:278-282.
Arthur RA, Waeiss RA, Hara AT, Lippert F, Eckert GJ, Zero DT: A defined-multispecies microbial model for studying enamel caries development. Caries Research 2013;47:318-324.
Ashley FP: Calcium and phosphorus concentrations of dental plaque related to dental caries in 11- to 14-year-old male subjects. Caries Research 1975;9:351-362.
Auschill TM, Hellwig E, Sculean A, Hein N, Arweiler NB: Impact of the intraoral location on the rate of biofilm growth. Clin Oral Invest 2004;8:97-101.
Bagramian RA, Garcia-Godoy F, Volpe AR: The global increase in dental caries. A pending public health crisis. American Dental Journal 2009;22:3-8.
Bakht K, de Josselin de Jong E, Higham SM, Martin GC, Burnett G, Hope CK: Understanding the microbiological aspect of constant depth film fermenter inoculation; in: BSODR. Glasgow, Internaltional Association of Dental Research, 2009.
Bakht K, Hope CK, de Josselin de Jong E, Martin GC, Burnett G, Higham SM: Effect of sucrose concentration on oral biofilm composition: An in vitro mode (abstract #35); in: 58th Annual ORCA Congress. Lithuania, Caries Research, 2011, vol 45, pp 174-242.
Balakrishnan M, Simmonds RS, Tagg JR: Dental caries is a preventable infectious disease. Australian Dental Journal 2000;45:235-245.
Banas JA, Vickerman MM: Glucan-binding proteins of the oral streptococci. Critical Reviews in Oral Biology & Medicine 2003;14:89-99.
Barbour ME, Rees JS: The laboratory assessment of enamel erosion: A review. Journal of Dentistry 2004;32:591-602.
Bardow A, Lagerlof BN, Tenovuo J: The role of saliva; in Fejerskov O, Kidd EAM (eds): Dental caries: The disease and its clinical management. Oxford, UK., Blackwell Publishing, 2008, pp 189 - 207.
Bardow A, Moe D, Nyvad B, Nauntofte B: The buffer capacity and buffer systems of human whole saliva measured without loss of co2. Archives of Oral Biology 2000;45:1-12.
Batchelor P, Sheiham A: Grouping of tooth surfaces by susceptibility to caries: A study in 5-16 year-old children. BMC Oral Health 2004;4:2.
Bechtle S, Habelitz S, Klocke A, Fett T, Schneider GA: The fracture behaviour of dental enamel. Biomaterials 2010;31:375-384.
260
Becker MR, Paster BJ, Leys EJ, Moeschberger ML, Kenyon SG, Galvin JL, Boches SK, Dewhirst FE, Griffen AL: Molecular analysis of bacterial species associated with childhood caries. Journal of Clinical Microbiology 2002;40:1001-1009.
Bedi R, Pitts NB, Horowitz AM, Phantumvaint P, Blinkhorn A, Evans W, Allukian M, Twetman S, Niederman R, Schulte A, Ellwood RP, Kleinman D, Evans C, Douglas C: Stop caries now for a caries-free future. http://www.allianceforacavityfreefuture.org/Caries/Tools/en/us/images-locale/ACFF_Declaration.pdf, 2013.
Beer D, Stoodley P: Microbial biofilms; in Dworkin M, Falkow S, Rosenberg E, Schleifer K-H, Stackebrandt E (eds): The prokaryotes. Springer New York, 2006, pp 904-937.
Beighton D, Al-Haboubi M, Mantzourani M, Gilbert SC, Clark D, Zoitopoulos L, Gallagher JE: Oral bifidobacteria: Caries-associated bacteria in older adults. Journal of Dental Research 2010;89:970-974.
Beighton D, Brailsford SR, Gilbert SC, Clark DT, Rao S, Wilkins JC, Tarelli E, Homer KA: Intra-oral acid production associated with eating whole or pulped raw fruits. Caries Research 2004;38:341-349.
Beltrán-Aguilar ED, Barker LK, Canto MT, Dye BA, Gooch BF, Griffin SO, Hyman J, Jaramillo F, Kingman A, Nowjack-Raymer R, Selwitz RH, Wu T: Surveillance for dental caries, dental sealants, tooth retention, edentulism, and enamel fluorosis: United states, 1988 - 1994 and 1999 - 2002. Surveillance Summaries 2005;54:1-44.
Berman DS, Slack GL: Susceptibility of tooth surfaces to carious attack. A longitudinal study. Br Dent J 1973;134:135-139.
Bibby BG, Huang CT: Some observations on in vitro dental plaques. Journal of Dental Research 1980;59:1946-1952.
Bibby BG, Van Kesteren M: The effect of fluorine on mouth bacteria. Journal of Dental Research 1940;19:391-402.
Biesbrock AR, Gerlach RW, Bollmer BW, Faller RV, Jacobs SA, Bartizek RD: Relative anti-caries efficacy of 1100, 1700, 2200, and 2800 ppm fluoride ion in a sodium fluoride dentifrice over 1 year. Community Dentistry And Oral Epidemiology 2001;29:382-389.
Bjørndal L, Thylstrup A: A structural analysis of approximal enamel caries lesions and subjacent dentin reactions. European Journal of Oral Sciences 1995;103:25-31.
Bollet-Quivogne FRG, Anderson P, Dowker SEP, Elliott JC: Scanning microradiographic study on the influence of diffusion in the external liquid on the rate of demineralization in hydroxyapatite aggregates. European Journal of Oral Sciences 2005;113:53-59.
Bowden GH: Effects of fluoride on the microbial ecology of dental plaque. Journal of Dental Research 1990;69 Spec No:653-659.
Bowden GH: Promoting the disposition of acid in dental plaque; in Bowden GH, Tabak LA (eds): Cariology for the ninties. Rochester, NY, University of Rochester, 1993, pp 421 - 439.
Bowden GHW, Li YH: Nutritional influences on biofilm development. Advances in Dental Research 1997;11:81-99.

261
Bowden GHW, Odlum O, Nolette N, Hamilton IR: Microbial populations growing in the presence of fluoride at low ph isolated from dental plaque of children living in an area with fluoridated water. Infection and Immunity 1982;36:247-254.
Bowen WH: Vaccine against dental caries--a personal view. Journal of Dental Research 1996;75:1530-1533.
Bowen WH: Do we need to be concerned about dental caries in the coming millennium? Critical Reviews in Oral Biology & Medicine 2002;13:126-131.
Bowen WH, Koo H: Biology of streptococcus mutans-derived glucosyltransferases: Role in extracellular matrix formation of cariogenic biofilms. Caries Research 2011;45:69-86.
Bradshaw D, Marsh PD: Analysis of ph–driven disruption of oral microbial communities in vitro. Caries Research 1998;32:456-462.
Bradshaw DJ, Homer KA, Marsh PD, Beighton D: Metabolic cooperation in oral microbial communities during growth on mucin. Microbiology 1994;140:3407-3412.
Bradshaw DJ, Marsh PD, Hodgson RJ, Visser JM: Effects of glucose and fluoride on competition and metabolism within in vitro dental bacterial communities and biofilms. Caries Research 2002;36:81-86.
Bradshaw DJ, McKee AS, Marsh PD: Effects of carbohydrate pulses and ph on population shifts within oral microbial communities in vitro. Journal of Dental Research 1989;68:1298-1302.
Bradshaw DJ, McKee AS, Marsh PD: Prevention of population shifts in oral microbial communities in vitro by low fluoride concentrations. Journal of Dental Research 1990;69:436-441.
Bradshaw DU, Marsh PD, Schilling KM, Cummins D: A modified chemostat system to study the ecology of oral biofilms. Journal of Applied Bacteriology 1996;80:124-130.
Brown LJ, Selwitz RH: The impact of recent changes in the epidemiology of dental caries on guidelines for the use of dental sealants. Journal of Public Health Dentistry 1995;55:274-291.
Brown PW, Martin RI: An analysis of hydroxyapatite surface layer formation. The Journal of Physical Chemistry B 1999;103:1671-1675.
Brudevold F, Tehrani A, Attarzadeh F, Goulet D, Van Houte J: Effect of some salts of calcium, sodium, potassium, and strontium on intra-oral enamel demineralization. Journal of Dental Research 1985;64:24-27.
Bruun C, Givskov H, Thylstrup A: Whole saliva fluoride after toothbrushing with naf and mfp dentifrices with different f concentrations. Caries Research 1984;18:282-288.
Bruun C, Qvist V, Thylstrup A: Effect of flavour and detergent on fluoride availability in whole saliva after use of naf and mfp dentifrices. Caries Research 1987;21:427-434.
Buchen L: Microbiology: The new germ theory. Nature 2010;468:492 - 495.
Burmolle M, Webb JS, Rao D, Hansen LH, Sorensen SJ, Kjelleberg S: Enhanced biofilm formation and increased resistance to antimicrobial agents and bacterial invasion are caused by synergistic interactions in multispecies biofilms. Applied and Environmental Microbiology 2006;72:3916-3923.
Burne RA: Oral ecological disaster: The role of short-term strorage polysassharides; in Bowden WH, Tabak LA (eds): Cariology for the nineties. Rochester, MN., University of Rochester, 1991, pp 351 - 364.

262
Burt BA, Baelum V, Fejerskov O: The epidemiology of dental caries; in Fejerskov O, Kidd EAM (eds): Dental caries: The disease and its clinical management. Oxford, UK., Blackwell Publishing, 2008, pp 123 - 145.
Buzalaf MAR, Hannas AR, Magalhães AC, Rios D, Honório HM, Delbem ACB: Ph-cycling models for in vitro evaluation of the efficacy of fluoridated dentifrices for caries control: Strengths and limitations. Journal of Applied Oral Science 2010;18:316-334.
Buzalaf MAR, Pessan JP, Honório HM, ten Cate JM: Mechanisms of action of fluoride for caries control; in Buzalaf MAR (ed): Fluoride and the oral environment: Monographs in oral science. Basel, Karger, 2011, vol 22, pp 97-114.
Caplan D, Weintraub J: The oral health burden in the united states: A summary of recent epidemiologic studies. J Dent Educ 1993;57:853-862.
Carvalho JC, Ekstrand KR, Thylstrup A: Dental plaque and caries on occlusal surfaces of first permanent molars in relation to stage of eruption. Journal of Dental Research 1989;68:773-779.
Caufield PW, Li Y, Dasanayake A: Dental caries: An infectious and transmissible disease. Compendium of continuing education in dentistry (Jamesburg, NJ : 1995) 2005;26:10-16.
Ccahuana-Vásquez RA, Tabchoury CPM, Tenuta LMA, Del Bel Cury AA, Vale GC, Cury JA: Effect of frequency of sucrose exposure on dental biofilm composition and enamel demineralization in the presence of fluoride. Caries Research 2007;41:9-15.
Cenci MS, Pereira-Cenci T, Cury JA, ten Cate JM: Relationship between gap size and dentine secondary caries formation assessed in a microcosm biofilm model. Caries Research 2009;43:97-102.
Chander S, Chiao CC, Fuerstenau DW: Transformation of calcium fluoride for caries prevention. Journal of Dental Research 1982;61:403-407.
Chhour K-L, Nadkarni MA, Byun R, Martin FE, Jacques NA, Hunter N: Molecular analysis of microbial diversity in advanced caries. Journal of Clinical Microbiology 2005;43:843-849.
Christoffersen J, Christoffersen MR, Arends J, Leonardsen ES: Formation of phosphate-containing calcium fluoride at the expense of enamel, hydroxyapatite and fluorapatite. Caries Research 1995;29:223-230.
Cochrane NJ, Saranathan S, Cai F, Cross KJ, Reynolds EC: Enamel subsurface lesion remineralisation with casein phosphopeptide stabilised solutions of calcium, phosphate and fluoride. Caries Research 2008;42:88-97.
Cody WL, Wilson JW, Hendrixson DR, McIver KS, Hagman KE, Ott CM, Nickerson CA, Schurr MJ: Skim milk enhances the preservation of thawed -80°c bacterial stocks. Journal of Microbiological Methods 2008;75:135-138.
Collins LM, Dawes C: The surface area of the adult human mouth and thickness of the salivary film covering the teeth and oral mucosa. Journal of Dental Research 1987;66:1300-1302.
Culp DJ, Robinson B, Parkkila S, Pan P, Cash MN, Truong HN, Hussey TW, Gullett SL: Oral colonization by streptococcus mutans and caries development is reduced upon deletion of carbonic anhydrase vi expression in saliva. Biochimica et Biophysica Acta (BBA) - Molecular Basis of Disease 2011;1812:1567-1576.
Curran TM, Buckley DH, Marquis RE: Quasi-irreversible inhibition of enolase of <i>streptococcus mutans</i> by flouride. FEMS Microbiology Letters 1994;119:283-288.

263
Cury JA, Rebello MAB, DelBelCury AA: In situ relationship between sucrose exposure and the composition of dental plaque. Caries Research 1997;31:356-360.
Cury JA, Rebelo MAB, Cury AAD, Derbyshire M, Tabchoury CPM: Biochemical composition and cariogenicity of dental plaque formed in the presence of sucrose or glucose and fructose. Caries Research 2000;34:491-497.
Damato FA, Strang R, Stephen KW: Effect of fluoride concentration on remineralization of carious enamel an in vitro ph-cycling study. Caries Research 1990;24:174-180.
Davis GHG: The classification of lactobacilli from the human mouth. Journal of General Microbiology 1955;13:481-493.
Dawes C: Factors influencing salivary flow rate and composition; in Edagr WM, Dawes C, O'Mullane D (eds): Saliva and oral health. London, British Dental Association, 2004a, pp 32 - 49.
Dawes C: Salivary clearence and its effects on oral health; in Edgar WM, Dawes C, O'Mullane D (eds): Saliva and oral health. London, UK., British Dental Journal, 2004b, pp 71 - 75.
Dawes C: Salivary flow patterns and the health of hard and soft oral tissues. The Journal of the American Dental Association 2008;139:18S-24S.
Dawes C, Dong C: The flow rate and electrolyte composition of whole saliva elicited by the use of sucrose-containing and sugar-free chewing-gums. Archives of Oral Biology 1995;40:699-705.
Dawes C, Macpherson LMD: The distribution of saliva and sucrose around the mouth during the use of chewing gum and the implications for the site-specificity of caries and calculus deposition. Journal of Dental Research 1993;72:852-857.
de Groot JF, Borggreven JM, Driessens FC: Some aspects of artificial caries lesion formation of human dental enamel in vitro. Journal de biologie buccale 1986;14:125-131.
de Josselin de Jong E, van der Linden A, ten Bosch J: Longitudinal microradiography: A non-destructive automated quantitative method to follow mineral changes in mineralised tissue slices. Physics in Medicine and Biology 1987;32:1209.
Delgado-Angulo E, Hobdell M, Bernabe E: Poverty, social exclusion and dental caries of 12-year-old children: A cross-sectional study in lima, peru. BMC Oral Health 2009;9:16.
Den Besten PK, Li W: Chronic fluoride toxicity: Dental fluorosis; in Buzalaf MAR (ed): Fluoride and the oral environment: Monographs in oral science. Basel, Karger, 2011, vol 22, pp 81 - 96.
Deng DM, Buijs MJ, Ten Cate JM: The effects of substratum on the ph response of streptococcus mutans biofilms and on the susceptibility to 0.2% chlorhexidine. European Journal of Oral Sciences 2004;112:42-47.
Deng DM, ten Cate JM: Demineralization of dentin by <i>streptococcus mutans</i> biofilms grown in the constant depth film fermentor. Caries Research 2004;38:54-61.
Deng DM, van Maele C, ten Cate JM: Caries-preventive agents induce remineralization of dentin in a biofilm model. Caries Research 2005;39:216-223.
Dibdin G, Wimpenny J: Steady-state biofilm: Practical and theoretical models; in Ron JD (ed): Methods in enzymology. Academic Press, 1999, vol Volume 310, pp 296-322.

264
Dibdin GH: Plaque fluid and diffusion: Study of the cariogenic challenge by computer modeling. Journal of Dental Research 1990;69:1324-1331.
Dibdin GH, Shellis RP: Physical and biochemical studies of streptococcus mutans sediments suggest new factors linking the cariogenicity of plaque with its extracellular polysaccharide content. Journal of Dental Research 1988;67:890-895.
Dibdin GH, Shellis RP, Dawes C: A comparison of the potassium content and osmolality of plaque fluid and saliva, and the effects of plaque storage. Journal of Dental Research 1986;65:1053-1056.
Dietz VH: In vitro production of plaques and caries. Journal of Dental Research 1943;22:423-440.
Dodds MWJ, Johnson DA, Yeh C-K: Health benefits of saliva: A review. Journal of Dentistry 2005;33:223-233.
Dowd FJ: Saliva and dental caries. Dent Clin North Am 1999;43:579-597.
Dowker SEP, Anderson P, Elliott JC, Gao XJ: Crystal chemistry and dissolution of calcium phosphate in dental enamel. Mineralogical Magazine 1999;63:791-791.
Driessens FCM: Mineral aspects of dentistry; in Myers JM (ed): Monographs in oral science. Basel, Karger, 1982., 1982, vol 10.
Drinan DF, Robin S, Cogan TM: Citric acid metabolism in hetero- and homofermentative lactic acid bacteria. Applied and Environmental Microbiology 1976;31:481-486.
Duckworth RM: Fluoride in plaque and saliva; in. Amsterdam, University of Amsterdam, 1993, vol PhD.
Duckworth RM: Pharmokinetics in the oral cavity: Fluoruide and other active ingredients; in van Loveren C (ed): Toothpastes: Monographs in oral science. Basel, Karger, 2013, vol 23, p 125 139.
Duckworth RM, Gao XJ: Plaque fluid as a resivoir for active ingredients; in Duckworth RM (ed): The teeth and thier environment: Monographs in oral science. Basel, Karger, 2006, vol 19.
Edgar WM, Dodds MWJ, Higham SM: Changes in carboxylic acid and free amino acid profiles in human dental plaque after a carbohydrate challenge in situ. Biochem Soc Trans 1986;14:977.
Edgar WM, Higham SM: Plaque fluid as a bacterial milieu. Journal of Dental Research 1990;69:1332-1336.
Edgar WM, Higham SM: Role of saliva in caries models. Advances in Dental Research 1995;9:235-238.
Edgar WM, Higham SM: Saliva and the control of plaque ph; in Edgar WM, Dawes C, O'Mullane D (eds): Saliva and oral health. London, UK., Britich Dental Journal, 2004, pp 86 - 102.
Edgar WM, Tatevossian A: The aqueous phase of dental plaque; in Fearnhead RW, Stack MV (eds): Tooth enamel ii: Composition, properties and fundamental structure. Bristol, John Wright and Sons Ltd., 1971.
Ekstrand KR, Bjørndal L: Structural analyses of plaque and caries in relation to the morphology of the groove-fossa system on erupting mandibular third molars. Caries Research 1997;31:336-348.
Ekstrand KR, Garlsen OLE, Thylstrup A: Morphometric analysis of occlusal groove-fossa-system in mandibular third molar. European Journal of Oral Sciences 1991;99:196-204.

265
Fawell JK, Bailey K, Chilton J, Dahi E, Fewtrell L, Magara Y: Environmental occurance, geochemistry and exposure; in Fawell JK, Bailey K, Chilton J, Dahi E, Fewtrell L, Magara Y (eds): Fluoride in drinking water (who drinking water quality series). London, IWA Pub., 2006., 2006, pp 5 - 27.
Featherstone J, Nelson D: The effect of fluoride, zinc, strontium, magnesium and iron on the crystal-structural disorder in synthetic carbonated apatites. Australian Journal of Chemistry 1980;33:2363-2368.
Featherstone JDB: Diffusion phenomena during artificial carious lesion formation. Journal of Dental Research 1977;56:D48-D52.
Featherstone JDB: Prevention and reversal of dental caries: Role of low level fluoride. Community Dentistry And Oral Epidemiology 1999;27:31-40.
Featherstone JDB: Dental caries: A dynamic disease process. Australian Dental Journal 2008;53:286-291.
Featherstone JDB, Behrman JM, Bell JE: Effect of whole saliva components on enamel demineralization in vitro. Critical Reviews in Oral Biology & Medicine 1993;4:357-362.
Featherstone JDB, Mellberg JR: Relative rates of progress of artificial carious lesions in bovine, ovine and human enamel. Caries Research 1981;15:109-114.
Featherstone JDB, Rodgers BE: Effect of acetic, lactic and other organic acids on the formation of artificial carious lesions. Caries Research 1981;15:377-385.
Fejerskov O: Changing paradigms in concepts on dental caries: Consequences for oral health care. Caries Research 2004;38:182-191.
Fejerskov O, Larsen MJ, Richards A, Baelum V: Dental tissue effects of fluoride. Advances in Dental Research 1994;8:15-31.
Fejerskov O, Manji F: Risk assesemnt in dental caires; in Bader JD (ed): Risk assessment in dentistry. Chappel Hill, University of North Carolina Dental Ecology, 1990, pp 215 - 217.
Fejerskov O, Nyvad B, Kidd EAM: Pathology of dental caries; in Kidd EAM, Fejerskov O (eds): Dental caries: The disease and its clinical management. Oxford, UK., Wiley-Blackwell, 2008a, pp 20 - 49.
Fejerskov O, Nyvad B, Kidd EAM: Clinical appearences of caries leisons; in Fejerskov O, Kidd EAM (eds): Dental caries: The disease and its clinical management. Oxford UK., Blackwell Publishing, 2008b, pp 7 - 18.
Filoche S, Wong L, Sissons CH: Oral biofilms: Emerging concepts in microbial ecology. Journal of Dental Research 2010;89:8-18.
Fitzgerald RJ, Jordan HV, Archard HO: Dental caries in gnotobiotic rats infected with a variety of lactobacillus acidophilus. Archives of Oral Biology 1966;11:473-476,IN471-IN472.
Flannigan NL: In situ studies of acidogenicity and cariogenicity in relation to caries aetiology; in: School of Dentistry. Liverpool, UK., University of Liverpool, 2005, vol PhD, pp 8 - 15.
Flemming H-C, Wingender J: The biofilm matrix. Nat Rev Micro 2010;8:623-633.
Fontana M, Dunipace AJ, Gregory RL, Noblitt TW, Li Y, Park KK, Stookey GK: An in vitro microbial model for studying secondary caries formation. Caries Research 1996;30:112-118.

266
Frandsen EVG, Pedrazzoli V, Kilian M: Ecology of viridans streptococci in the oral cavity and pharynx. Oral Microbiology and Immunology 1991;6:129-133.
Frazier PD: Adult human enamel: An electron microscopic study of crystallite size and morphology. Journal of Ultrastructure Research 1968;22:1-11.
Furlani TA, Magalhães AC, Iano FG, da Silva Cardoso VE, Delbem ACB, Buzalaf MAR: Effect of calcium pre-rinse and fluoride dentifrice on enamel and on dental plaque formed in situ. Oral Health & Preventive Dentistry 2009;7:23-28.
Gal J-Y, Fovet Y, Adib-Yadzi M: About a synthetic saliva for in vitro studies. Talanta 2001;53:1103-1115.
Gao XJ, Fan Y, Kent RL, Van Houte J, Margolis HC: Association of caries activity with the composition of dental plaque fluid. Journal of Dental Research 2001;80:1834-1839.
García-Godoy F, Hicks MJ: Maintaining the integrity of the enamel surface: The role of dental biofilm, saliva and preventive agents in enamel demineralization and remineralization. The Journal of the American Dental Association 2008;139:25S-34S.
Geddes DAM, Weetman DA, Featherstone JDB: Preferential loss of acetic acid from plaque fermentation in the presence of enamel (short communication). Caries Research 1984;18:430-433.
Gerritsen A, Allen PF, Witter D, Bronkhorst E, Creugers N: Tooth loss and oral health-related quality of life: A systematic review and meta-analysis. Health and Quality of Life Outcomes 2010;8:126.
Gibbons RJ, Cohen L, Hay DI: Strains of streptococcus mutans and streptococcus sobrinus attach to different pellicle receptors. Infection and Immunity 1986;52:555-561.
Gibbons RJ, Hay DI: Human salivary acidic proline-rich proteins and statherin promote the attachment of actinomyces viscosus ly7 to apatitic surfaces. Infection and Immunity 1988;56:439-445.
Gibbons RJ, Hay DI: Adsorbed salivary acidic proline-rich proteins contribute to the adhesion of streptococcus mutans jbp to apatitic surfaces. Journal of Dental Research 1989;68:1303-1307.
Gibbons RJ, Hay DI, Cisar JO, Clark WB: Adsorbed salivary proline-rich protein 1 and statherin: Receptors for type 1 fimbriae of actinomyces viscosus t14v-j1 on apatitic surfaces. Infection and Immunity 1988;56:2990-2993.
Gilbert P, Maira-Litran T, McBain AJ, Rickard AH, Whyte FW: The physiology and collective recalcitrance of microbial biofilm communities; in: Advances in microbial physiology. Academic Press, 2002, vol Volume 46, pp 203-256.
Gray JA, Francis MD: Physical chemistry of enamel dissolution; in Sognnaes RF (ed): Mechanisms of hard tissue destruction. Washington D. C., American Association for the Advancemnet of Science, 1963, pp 213 - 260.
Green GE, Dodd MC: Resistance of oral lactobacilli to sodium fluoride. J Am Dent Assoc 1957;54:654-656.
Gustafsson BE, Quensel C-E, Lanke LS, Lundqvist C, Grahnén H, Bonow BE, Krasse B: The effect of different levels of carbohydrate intake on caries activity in 436 individuals observed for five years. Acta Odontologica Scandinavica 1953;11:232 - 364.
Hamada S, Slade HD: Biology, immunology, and cariogenicity of streptococcus mutans. Microbiology and Molecular Biology Reviews 1980;44:331-384.

267
Hamilton IR, Buckley ND: Adaptation by streptococcus mutans to acid tolerance. Oral Microbiology and Immunology 1991;6:65-71.
Hamilton IR, Ng SKC: Stimulation of glycolysis through lactate consumption in a resting cell mixture of streptococcus salivarius and veillonella parvula. FEMS Microbiology Letters 1983;20:61-65.
Hanada N: Current understanding of the cause of dental caries. Japanese journal of infectious diseases 2000;53:1-5.
Hannig M: The protective nature of the salivary pellicle. International Dental Journal 2002;52:417-423.
Hannigan A, O’Mullane DM, Barry D, Schäfer F, Roberts AJ: A caries susceptibility classification of tooth surfaces by survival time. Caries Research 2000;34:103-108.
Hata S, Mayanagi H: Acid diffusion through extracellular polysaccharides produced by various mutants of streptococcus mutans. Archives of Oral Biology 2003;48:431-438.
Hay DI, Schluckebier SK, Moreno EC: Equilibrium dialysis and ultrafiltration studies of calcium and phosphate binding by human salivary proteins. Implications for salivary supersaturation with respect to calcium phosphate salts. Calcified Tissue International 1982;34:531-538.
Hermansson M: The dlvo theory in microbial adhesion. Colloids and Surfaces B: Biointerfaces 1999;14:105-119.
Herp A, Wu A, Moschera J: Current concepts of the structure and nature of mammalian salivary mucous glycoproteins. Mol Cell Biochem 1979;23:27-44.
Higham SM: Studies in relationships between ph, carbohydrate and nitrogen metabolism in dental plaque; in: Department of Dental Sciences. Liverpool, UK, University of Liverpool, 1986, vol PhD, pp 27-28.
Higham SM, Edgar WM: Human dental plaque ph, and the organic acid and free amino acid profiles in plaque fluid, after sucrose rinsing. Archives of Oral Biology 1989;34:329-334.
Higham SM, Edgar WM: Extracellular administration of lactate dehydrogenase and its effects on human plaque ph and acid anion concentrations. Caries Research 1991;25:197-200.
Hillson SW: Dental anthropology. Cambridge, UK, Cambridge University Press, 1996.
Hillson SW: Dental enamel; in Hillson SW (ed): Teeth. Cambriudge manual in archeology. Cambridge, Cambridge University Press, 2005, pp 155 - 165.
Hillson SW: The current state of dental decay; in Irish JD, Nelson GC (eds): Technique and application in dental antropology. Cambridge studies in biological and evolutionary antropology. Cambridge, UK, Cambridge University Press, 2008, pp 111 - 135.
Hojo K, Nagaoka S, Ohshima T, Maeda N: Bacterial interactions in dental biofilm development. Journal of Dental Research 2009;88:982-990.
Hongo M, Nomura Y, Iwahara M: Novel method of lactic acid production by electrodialysis fermentation. Applied and Environmental Microbiology 1986;52:314-319.
Hope CK, Bakht K, Burnside G, Martin GC, Burnett G, de Josselin de Jong E, Higham SM: Reducing the variability between constant-depth film fermenter experiments when modelling oral biofilm. Journal of Applied Microbiology 2012;113:601-608.

268
Hope CK, Wilson M: Effects of dynamic fluid activity from an electric toothbrush on in vitro oral biofilms. Journal Of Clinical Periodontology 2003a;30:624-629.
Hope CK, Wilson M: Measuring the thickness of an outer layer of viable bacteria in an oral biofilm by viability mapping. Journal of Microbiological Methods 2003b;54:403-410.
Hope CK, Wilson M: Biofilm structure and cell vitality in a laboratory model of subgingival plaque. Journal of Microbiological Methods 2006;66:390-398.
Hoppenbrouwers PM, Driessens FC: The effect of lactic and acetic acid on the formation of artificial caries lesions. Journal of Dental Research 1988;67:1466-1467.
Hosseini E, Grootaert C, Verstraete W, Van de Wiele T: Propionate as a health-promoting microbial metabolite in the human gut. Nutrition Reviews 2011;69:245-258.
House JE: Acid–base chemistry; in James H (ed): Inorganic chemistry (second edition). Academic Press, 2013, pp 273-312.
Hsu SD, Cole MF: Structural integrity of host defense factors in dental plaque. Infection and Immunity 1985;50:398-402.
Hudson DE, Donoghue HD, Perrons CJ: A laboratory microcosm (artificial mouth) for the culture and continuous ph measurement of oral bacteria on surfaces. Journal of Applied Microbiology 1986;60:301-310.
Igarachi K, Lee IK, Schachtele CF: Comparison of in vivo human dental plaque ph changes within artificial fissures and at interproximal sites. Caries Research 1989;23:417-422.
Ilbert M, Bonnefoy V: Insight into the evolution of the iron oxidation pathways. Biochimica et Biophysica Acta (BBA) - Bioenergetics 2013;1827:161-175.
Ilie O, van Turnhout AG, van Loosdrecht MCM, Picioreanu C: Numerical modelling of tooth enamel subsurface lesion formation induced by dental plaque. Caries Research 2013;48:73-89.
Ingram GS: Chemical events during tooth dissolution. Journal of Dental Research 1990;69 Spec No:581-586.
Iwami Y, Abbe K, Takahashi-Abbe S, Yamada T: Acid production by streptococci growing at low ph in a chemostat under anaerobic conditions. Oral Microbiology and Immunology 1992;7:304-308.
Iwami Y, Yamada T: Rate-limiting steps of the glycolytic pathway in the oral bacteria streptococcus mutans and streptococcus sanguis and the influence of acidic ph on the glucose metabolism. Archives of Oral Biology 1980;25:163-169.
Jendersen MD, Glantz PO: Clinical adhesiveness of selected dental materials. Acta Odontologica Scandinavica 1981;39:39-45.
Jenkins GN: The influence of environmental fluids on enamel solubility. Journal of Dental Research 1966;45:662-669.
Jenkins GN, Edgar WM, Ferguson DB: The distribution and metabolic effects of human plaque fluorine. Archives of Oral Biology 1969;14:105-119.
Juhl M: Localization of carious lesions in occlusal pits and fissures of human premolars. European Journal of Oral Sciences 1983a;91:251-255.

269
Juhl M: Three-dimensional replicas of pit and fissure morphology in human teeth. European Journal of Oral Sciences 1983b;91:90-95.
Kanaya Y, Spooner P, Fox JL, Higuchi WI, Muhammad NA: Mechanistic studies on the bioavailability of calcium fluoride for remineralization of dental enamel. International Journal of Pharmaceutics 1983;16:171-179.
Kashket S, Kashket ER: Dissipation of the proton motive force in oral streptococci by fluoride. Infection and Immunity 1985;48:19-22.
Kashket S, Yaskell T: Effect of timing of administered calcium lactate on the sucrose-induced intraoral demineralization of bovine enamel. Archives of Oral Biology 1992;37:187-191.
Kay MI, Young RA, Posner AS: Crystal structure of hydroxyapatite. Nature 1964;204:1050-1052.
Kidd EAM, Fejerskov O: What constitutes dental caries? Histopathology of carious enamel and dentin related to the action of cariogenic biofilms. Journal of Dental Research 2004;83:C35-38.
Kimoto M, Kishino M, Yura Y, Ogawa Y: A role of salivary carbonic anhydrase vi in dental plaque. Archives of Oral Biology 2006;51:117-122.
Kinniment SL, Wimpenny JWT, Adams D, Marsh PD: Development of a steady-state oral microbial biofilm community using the constant-depth film fermenter. Microbiology 1996;142:631-638.
Kivelä J, Parkkila S, Parkkila A-K, Leinonen J, Rajaniemi H: Salivary carbonic anhydrase isoenzyme vi. The Journal of Physiology 1999a;520:315-320.
Kivelä J, Parkkila S, Parkkila AK, Rajaniemi H: A low concentration of carbonic anhydrase isoenzyme vi in whole saliva is associated with caries prevalence. Caries Research 1999b;33:178-184.
Kleinberg I: A mixed-bacterial ecological approach to understanding the role of the oral bacteria in dental caries causation: An alternative to streptococcus mutans and the specific-plaque hypothesis. Critical Reviews in Oral Biology & Medicine 2002;13:108-125.
Köhler W: W. D. Miller (1853-1907), the micro-organisms of the human mouth (unaltered reprint of the original work published in 1890 in philadelphia). X + 390 s. 128 abb., 3 tafeln. Basel-münchen-paris-london-new york-sydney 1973: S. Karger, dm 56. Zeitschrift für allgemeine Mikrobiologie 1974;14:84-84.
Kolenbrander PE: Multispecies communities: Interspecies interactions influence growth on saliva as sole nutritional source. International Journal of Oral Science 2011;3:34-54.
Kolenbrander PE, Andersen RN, Kazmerzak K, Wu R, Palmer Jr RJ: Spatial organization of oral bacteria in biofilms; in Ron JD (ed): Methods in enzymology. Academic Press, 1999, vol Volume 310, pp 322-332.
Kolenbrander PE, London J: Adhere today, here tomorrow: Oral bacterial adherence. Journal of Bacteriology 1993;175:3247-3252.
Kolenbrander PE, Palmer RJ, Rickard AH, Jakubovics NS, Chalmers NI, Diaz PI: Bacterial interactions and successions during plaque development. Periodontology 2000 2006;42:47-79.
Korber DR, Lawrence JR, Lappin-Scott HM, Costerton JW: Growth of microorganisms on surfaces; in Lappin-Scott HM, Costerton JW (eds): Microbial biofilms. Cambridge, UK., Cambridge University Press, 1995, pp 15 - 45.

270
Kumar JV: Is water fluoridation still necessary? Advances in Dental Research 2008;20:8-12.
Lagerlof F, Oliveby A, Ekstrand J: Physiological factors influencing salivary clearance of sugar and fluoride. Journal of Dental Research 1987;66:430-435.
Lagerweij MD, Damen JJM, ten Cate JM: Demineralization of dentine grooves in vitro. Caries Research 1996;30:231-236.
Lagerweij MD, ten Cate JM: Acid susceptibility at various depths of ph-cycled enamel and dentine specimens. Caries Research 2006;40:33-37.
Lanfranco LP, Eggers S: Caries through time: An anthropological overview; in Li M-Y (ed): Contempory approach to dental caries. Rijeka, Croatia, InTech Europe, 2012, pp 1 - 24.
Langdon DJ, Elliott JC, Fearnhead RW: Microradiographic observation of acidic subsurface decalcification in synthetic apatite aggregates. Caries Research 1980;14:359-366.
Larsen JM: Effect of diffusion layer on the nature of enamel demineralisation. Caries Research 1991;25:161-165.
Larsen MJ: An investigation of the theoretical background for the stability of the calcium-phosphate salts and their mutual conversion in aqueous solutions. Archives of Oral Biology 1986;31:757-761.
Larsen MJ, Jensen AF, Madsen DM, Pearce EIF: Individual variations of ph, buffer capacity, and concentrations of calcium and phosphate in unstimulated whole saliva. Archives of Oral Biology 1999;44:111-117.
Larsen MJ, Pearce EIF: Saturation of human saliva with respect to calcium salts. Archives of Oral Biology 2003;48:317-322.
Larsen MJ, Ravnholt G: Dissolution of various calcium fluoride preparations in inorganic solutions and in stimulated human saliva. Caries Research 1994;28:447-454.
Leach SA, Edgar WM: Demineralisation and remineralisation of the teeth edited by s.A. Leach, w.M. Edgar, Oxford: IRL, 1983., 1983.
Ledder RG, Gilbert P, Pluen A, Sreenivasan PK, De Vizio W, McBain AJ: Individual microflora beget unique oral microcosms. Journal of Applied Microbiology 2006;100:1123-1131.
LeGeros R: Apatites in biological systems. Progress in Crystal Growth and Characterization 1981;4:1-45.
Leinonen J, Kivelä J, Parkkila S, Parkkila AK, Rajaniemi H: Salivary carbonic anhydrase isoenzyme vi is located in the human enamel pellicle. Caries Research 1999;33:185-190.
Leme AFP, Koo H, Bellato CM, Bedi G, Cury JA: The role of sucrose in cariogenic dental biofilm formation—new insight. Journal of Dental Research 2006;85:878-887.
Lenander-Lumikari M, Loimaranta V: Saliva and dental caries. Advances in Dental Research 2000;14:40-47.
Lendenmann U, Grogan J, Oppenheim FG: Saliva and dental pellicle-a review. Advances in Dental Research 2000;14:22-28.
Li J, Nakagaki H, Tsuboi S, Kato S, Huang S, Mukai M, Robinson C, Strong M: Fluoride profiles in different surfaces of human permanent molar enamels from a naturally fluoridated and a non-fluoridated area. Archives of Oral Biology 1994;39:727-731.

271
Lippert F, Butler A, Lynch RJM, Hara AT: Effect of fluoride, lesion baseline severity and mineral distribution on lesion progression. Caries Research 2012;46:23-30.
Locker D: The burden of oral disorders in a population of older adults. Community dental health 1992;9:109-124.
Loesche WJ: Chemotherapy of dental plaque infections. Oral Sci Rev 1976;9:65-107.
Loesche WJ: Role of streptococcus mutans in human dental decay. Microbiology and Molecular Biology Reviews 1986;50:353-380.
Lopes MB, Sinhoreti MA, Gonini-Junior A, Consani S, McCabe JF: Comparative study of tubular diameter and quantity for human and bovin dentin at different depths. Brazilian Dental Journal 2009;20:279-283.
Lynch RJM: Model parameters and their influence on the outcome of in vitro demineralisation and remineralisation studies; in Duckworth RM (ed): The teeth and their environment monographs in oral science. Basel, Karger, 2006, vol 19, pp 65-85.
Lynch RJM: Zinc in the mouth, its interactions with dental enamel and possible effects on caries; a review of the literature. International Dental Journal 2011;61:46-54.
Lynch RJM, Churchley D, Butler A, Kearns S, Thomas GV, Badrock TC, Cooper L, Higham SM: Effects of zinc and fluoride on the remineralisation of artificial carious lesions under simulated plaque fluid conditions. Caries Research 2011;45:313-322.
Lynch RJM, Mony U, ten Cate JM: The effect of fluoride at plaque fluid concentrations on enamel de- and remineralisation at low ph. Caries Research 2006;40:522-529.
Lynch RJM, Navada R, Walia R: Low-levels of fluoride in plaque and saliva and their effects on the demineralisation and remineralisation of enamel; role of fluoride toothpastes. Int Dent J 2004;8:304-309.
Lynch RJM, ten Cate JM: The effect of lesion characteristics at baseline on subsequent de- and remineralisation behaviour. Caries Research 2006a;40:530-535.
Lynch RJM, ten Cate JM: The effect of adjacent dentine blocks on the demineralisation and remineralisation of enamel in vitro. Caries Research 2006b;40:38-42.
Macpherson LMD, Damato FA, MacFarlane TW, Strang R, Stephen KW: Variation in the susceptibility of enamel to an in vitro demineralization system (short communication). Caries Research 1991;25:143-145.
Main C, Geddes DAM, McNee SG, Collins WJN, Smith DC, Weetman DA: Instrumentation for measurement of dental plaque thickness in situ. Journal of Biomedical Engineering 1984;6:151-154.
Maltz M, Emilson CG: Susceptibility of oral bacteria to various fluoride salts. Journal of Dental Research 1982;61:786-790.
Mandel ID: The functions of saliva. Journal of Dental Research 1987;66 Spec No:623-627.
Manji F, Fejerskov O, Nagelkerke NJD, Baelum V: A random effects model for some epidemiological features of dental caries. Community Dentistry And Oral Epidemiology 1991;19:324-328.
Maren TH: Carbonic anhydrase: Chemistry, physiology, and inhibition. Physiological Reviews 1967;47:595-781.

272
Margolis HC, Moreno EC: Kinetic and thermodynamic aspects of enamel demineralization. Caries Research 1985;19:22-35.
Margolis HC, Moreno EC: Composition of pooled plaque fluid from caries-free and caries-positive individuals following sucrose exposure. Journal of Dental Research 1992;71:1776-1784.
Margolis HC, Moreno EC: Composition and cariogenic potential of dental plaque fluid. Critical Reviews in Oral Biology & Medicine 1994;5:1-25.
Margolis HC, Moreno EC, Murphy BJ: Basic biological sciences importance of high pka acids in cariogenic potential of plaque. Journal of Dental Research 1985;64:786-792.
Margolis HC, Moreno EC, Murphy BJ: Effect of low levels of fluoride in solution on enamel demineralization in vitro. Journal of Dental Research 1986;65:23-29.
Marinho VCC: Cochrance reviews of randomised trials of fluoride therapies for preventing dental caries. European Archives of Paediatric Densitry 2009;10:183-191.
Marinho VCC, Higgins JPT, Logan S, Sheiham A: Fluoride mouthrinses for preventing dental caries in children and adolescents. Cochrane Database of Systematic Reviews 2003a.
Marinho VCC, Higgins JPT, Logan S, Sheiham A: Fluoride toothpastes for preventing dental caries in children and adolescents. Cochrane Database of Systematic Reviews 2003b.
Marquis RE: Oxygen metabolism, oxidative stress and acid-base physiology of dental plaque biofilms. Journal of Industrial Microbiology 1995a;15:198-207.
Marquis RE: Antimicrobial actions of fluoride for oral bacteria. Canadian Journal of Microbiology 1995b;41:955-964.
Marquis RE, Clock SA, Mota-Meira M: Fluoride and organic weak acids as modulators of microbial physiology. FEMS Microbiology Reviews 2003;26:493-510.
Marsh PD: Microbial ecology of dental plaque and its significance in health and disease. Advances in Dental Research 1994;8:263-271.
Marsh PD: The role of microbiology in models of dental caries. Advances in Dental Research 1995a;9:244-254.
Marsh PD: Dental plaque; in Lappin-Scott HM, Costerton JW (eds): Microbial biofilms. Cambridge, UK., Cambridge University Press, 1995b, pp 282 - 300.
Marsh PD: Plaque as a biofilm: Pharmacological principles of drug delivery and action in the sub- and supragingival environment. Oral Diseases 2003a;9:16-22.
Marsh PD: Are dental diseases examples of ecological catastrophes? Microbiology 2003b;149:279-294.
Marsh PD: Dental plaque as a microbial biofilm. Caries Research 2004;38:204-211.
Marsh PD: Dental plaque as a biofilm and a microbial community - implications for health and disease. BMC Oral Health 2006;6 Suppl 1:S14.
Marsh PD: Controlling the oral biofilm with antimicrobials. Journal of Dentistry 2011;38:S11-S15.
Marsh PD, Bradshaw DJ: Dental plaque as a biofilm. Journal of Industrial Microbiology 1995;15:169-175.

273
Marsh PD, Bradshaw DJ: Physiological approaches to the control of oral biofilms. Advances in Dental Research 1997;11:176-185.
Marsh PD, Martin MV: Aquisition, adherence, distribution and metabolism of the oral microflora; in Marsh PD, Martin MV (eds): Oral microbiology. Edinbourgh, UK., Elsiver Ltd., 2009a, pp 45 - 73.
Marsh PD, Martin MV: The mouth and a microbial habitat; in Marsh PD, Martin MV (eds): Oral microbiology. Edinbourgh, UK., Elsiver Ltd., 2009b, pp 8 - 23.
Marsh PD, Martin MV: Dental plaque; in Marsh PD, Martin MV (eds): Oral microbiology. Edinbourgh, Elsiver Ltd., 2009c, pp 74 - 102.
Marsh PD, Nyvad B: The oral microflora and biofilms on teeth; in Fejerskov O, Kidd EAM (eds): Dental caries: The disease and its clinical managment. Oxford, UK., Blackwell Publishing, 2008, pp 161 - 185.
Matsunda Y, Komatsu H, Murata Y, Sano H: Effect of the width of grooves on caries progression using an automatic ph-cycling system. Japanese Journal of Conservative Dentistry 2005;48:828 - 834.
Matsunda Y, Komatsu H, Murata Y, Tanaka T, Sano H: The demineralization of dentin grooves using an automatic ph-cycling system; in: IADR. Birsbane, J. Dent Res, 2006.
Mattos-Graner RO, Smith DJ, King WF, Mayer MPA: Water-insoluble glucan synthesis by mutans streptococcal strains correlates with caries incidence in 12- to 30-month-old children. Journal of Dental Research 2000;79:1371-1377.
McBain AJ, Bartolo RG, Catrenich CE, Charbonneau D, Ledder RG, Gilbert P: Growth and molecular characterization of dental plaque microcosms. Journal of Applied Microbiology 2003;94:655-664.
McKee AS, McDermid AS, Ellwood DC, Marsh PD: The establishment of reproducible, complex communities of oral bacteria in the chemostat using defined inocula. Journal of Applied Microbiology 1985;59:263-275.
Mellberg JR: Hard-tissue substrates for evaluation of cariogenic and anti-cariogenic activity in situ. Journal of Dental Research 1992;71 Spec No:913-919.
Meurman JH, Frank RM: Progression and surface ultrastructure of in vitro caused erosive lesions in human and bovine enamel. Caries Research 1991;25:81-87.
Mikx FHM, van der Hoeven JS, König KG, Plasschaert AJM, Guggenheim B: Establishment of defined microbial ecosystems in germ-free rats. Caries Research 1972;6:211-223.
Mikx FHM, Van der Hoeven JS, Walker GJ: Microbial symbiosis in dental plaque in gnotobiotic rats and in the chemostat; in Stiles HM, Loesche WJ, O'Brien TC (eds): Microbial aspects of dental caries: Proceedings of a workshop on microbial aspects of dental caries. Washington D.C., Information Retrieval Inc., 1976, vol 3, pp 763 - 771.
Minah GE, Solomon ES, Chu K: The association between dietary sucrose consumption and microbial population shifts at six oral sites in man. Archives of Oral Biology 1985;30:397-401.
Mitchell TC: The buffer substances of the gastric juice, and their relation to gastric mucus. The Journal of Physiology 1931;73:427-443.
Molin S, Tolker-Nielsen T: Gene transfer occurs with enhanced efficiency in biofilms and induces enhanced stabilisation of the biofilm structure. Current Opinion in Biotechnology 2003;14:255-261.
274
Moreno EC, Kresak M, Zahradnik RT: Fluoridated hydroxyapatite solubility and caries formation. Nature 1974;247:64-65.
Moreno EC, Margolis HC: Composition of human plaque fluid. Journal of Dental Research 1988;67:1181-1189.
Moynihan PJ: Diet and dental health; in: Human Nutrition and Health. Newcastle upon Tyne, Newcastle University, 2009.
Nakagaki H, Koyama Y, Sakakibara Y, Weatherell JA, Robinson C: Distribution of fluoride across human dental enamel, dentine and cementum. Archives of Oral Biology 1987;32:651-654.
Newman HN, Morgan WJ: Topographical relationship between plaque and approximal caries. Caries Research 1980;14:428 - 433.
NIH: Diagnosis and management of dental caries throughout life. NIH consensus statement 2001;18:1-23.
Nyvad B, Crielaard W, Mira A, Takahashi N, Beighton D: Dental caries from a molecular microbiological perspective. Caries Research 2013;47:89-102.
Oliveby A, Weetman DA, Geddes DAM, Lagerlöf F: The effect of salivary clearance of sucrose and fluoride on human dental plaque acidogenicity. Archives of Oral Biology 1990;35:907-911.
Orland FJ, Blayney JR, Harrison RW, Reyniers JA, Trexler PC, Wagner M, Gordon HA, Luckey TD: Use of the germfree animal technic in the study of experimental dental caries. I. Basic observations on rats reared free of all microorganisms. Journal of Dental Research 1954;33:147-174.
Owens GJ, Lynch RJM, Hope CK, Higham SM, Valappil SP: In vitrol biofilm formation: Naf exposures within a sucrose pulsing strategy (abstract #26); in Beighton D (ed): 60th Annual ORCA Congress. Liverpool, UK, Caries Research, 2013, vol 47, pp 433 - 531.
Palamara J, Phakey PP, Rachinger WA, Orams HJ: Laminated zones in carious human dental enamel. Journal of Oral Pathology & Medicine 1986;15:109-114.
Palmer RJ, Diaz PI, Kolenbrander PE: Rapid succession within the veillonella population of a developing human oral biofilm in situ. Journal of Bacteriology 2006;188:4117-4124.
Parnell C, O'Mullane D: After-brush rinsing protocols. Frequency of toothpaste use: Fluoride and other active ingredients; in Van Loveren C (ed): Toothpastes: Monographs in oral science. Basel, Karger, 2013, vol 23, pp 140 - 153.
Paster BJ, Boches SK, Galvin JL, Ericson RE, Lau CN, Levanos VA, Sahasrabudhe A, Dewhirst FE: Bacterial diversity in human subgingival plaque. Journal of Bacteriology 2001;183:3770-3783.
Patel PR, Brown WE: Thermodynamic solubility product of human tooth enamel: Powdered sample. Journal of Dental Research 1975;54:728-736.
Pearce E: Plaque minerals and dental caries. The New Zealand dental journal 1998;94:12-15.
Pearce EIF, Coote GE, Larsen MJ: The distribution of fluoride in carious human enamel. Journal of Dental Research 1995;74:1775-1782.
Pearce EIF, Larsen M, Coote G: Fluoride in enamel lining pits and fissures of the occlusal groove–fossa system in human molar teeth. Caries Research 1999;33:196-205.

275
Percival RS, Challacombe SJ, Marsh PD: Flow rates of resting whole and stimulated parotid saliva in relation to age and gender. Journal of Dental Research 1994;73:1416-1420.
Periasamy S, Kolenbrander PE: Central role of the early colonizer veillonella sp. In establishing multispecies biofilm communities with initial, middle, and late colonizers of enamel. Journal of Bacteriology 2010;192:2965-2972.
Pessan JP, Sicca CM, De Souza TS, Da Silva SMB, Whitford GM, Buzalaf MAR: Fluoride concentrations in dental plaque and saliva after the use of a fluoride dentifrice preceded by a calcium lactate rinse. European Journal of Oral Sciences 2006;114:489-493.
Pessan JP, Toumba KJ, Buzalaf MAR: Topical use of fluorides for caries control; in Buzalaf MAR (ed): Fluoride and the oral environment: Monographs in oral science. Basel, Karger, 2011, vol 22, pp 115 - 132.
Peters AC, Wimpenny JWT: A constant-depth laboratory model film fermentor. Biotechnology and Bioengineering 1988;32:263-270.
Petersen PE: Continuous improvement of oral health in the 21st century the approach of the who global oral health programme. The World Oral Health Report 2003.
Pratten, Wills, Barnett, Wilson: In vitro studies of the effect of antiseptic-containing mouthwashes on the formation and viability of streptococcus sanguis biofilms. Journal of Applied Microbiology 1998a;84:1149-1155.
Pratten J: Growing oral biofilms in a constant depth film fermentor (cdff); in: Current protocols in microbiology. John Wiley & Sons, Inc., 2005.
Pratten J, Andrews CS, Craig DQM, Wilson M: Structural studies of microcosm dental plaques grown under different nutritional conditions. FEMS Microbiology Letters 2000;189:215-218.
Pratten J, Pasu M, Jackson G, Flanagan A, Wilson M: Modelling oral malodour in a longitudinal study. Archives of Oral Biology 2003a;48:737-743.
Pratten J, Smith AW, Wilson M: Response of single species biofilms and microcosm dental plaques to pulsing with chlorhexidine. Journal of Antimicrobial Chemotherapy 1998b;42:453-459.
Pratten J, Wilson M: Antimicrobial susceptibility and composition of microcosm dental plaques supplemented with sucrose. Antimicrob Agents Chemother 1999;43:1595-1599.
Pratten J, Wilson M, Spratt DA: Characterization of in vitro oral bacterial biofilms by traditional and molecular methods. Oral Microbiology and Immunology 2003b;18:45-49.
Reisine S, Psoter W: Socioeconomic status and selected behavioral determinants as risk factors for dental caries. Journal of Dental Education 2001;65:1009-1016.
Rethman MP, Beltrán-Aguilar ED, Billings RJ, Burne RA, Clark M, Donly KJ, Hujoel PP, Katz BP, Milgrom P, Sohn W, Stamm JW, Watson G, Wolff M, Wright JT, Zero D, Aravamudhan K, Frantsve-Hawley J, Meyer DM: Nonfluoride caries-preventive agents: Executive summary of evidence-based clinical recommendations. The Journal of the American Dental Association 2011;142:1065-1071.
Reussner GH, Galimidi A, Coccodrilli G: Effects of calcium on smooth surface carious lesions in rats. Journal of Dental Research 1977;56:90.

276
Robinson C: Fluoride and the caries lesion: Interactions and mechanism of action. European Archives Of Paediatric Dentistry: Official Journal Of The European Academy Of Paediatric Dentistry 2009;10:136-140.
Robinson C, Kirkham J, Brookes SJ, Shore R: Chemistry of mature enamel; in Robinson C, Kirkham J, Shore RC (eds): Dental enamel: Fomration to destruction. Boca Raton (Fla), CRC P, 1995a, pp 167 - 192.
Robinson C, Shore RC, Brookes SJ, Strafford S, Wood SR, Kirkham J: The chemistry of enamel caries. Critical Reviews in Oral Biology & Medicine 2000;11:481-495.
Robinson C, Weatherell JA, Hallsworth AS: Variation in composition of dental enamel within thin ground tooth sections. Caries Research 1971;5:44-57.
Robinson C, Weatherell JA, Kirkham J: The chemistry of dental caries; in Robinson C, Kirkham J, Shore RC (eds): Dental enamel: Formation to destruction. Boca Raton (Fla), CRC P, 1995b, pp 223 - 243.
Robinson C, Yamamoto K, Connell SD, Kirkham J, Nakagaki H, Smith AD: The effects of fluoride on the nanostructure and surface pk of enamel crystals: An atomic force microscopy study of human and rat enamel. European Journal of Oral Sciences 2006;114:99-104.
Rogosa M: A selective medium for the isolation and enumberation of the veillonella from the oral cavity. Journal of Bacteriology 1956;72:533-536.
Rogosa M, Bishop FS: The genus veillonella ii. : Nutritional studies. Journal of Bacteriology 1964;87:574-580.
Rølla G, Iversen OJ, Bonesvoll P: Lipoteichoic acid — the key to the adhesiveness of sucrose grown streptococcus mutans; in McGhee J, Mestecky J, Babb J (eds): Secretory immunity and infection. Advances in experimental medicine and biology. Springer US, 1978, vol 107, pp 607-617.
Rølla G, Saxegaard E: Critical evaluation of the composition and use of topical fluorides, with emphasis on the role of calcium fluoride in caries inhibition. Journal of Dental Research 1990;69 Spec No:780-785.
Rose RK: Competitive binding of calcium, magnesium and zinc to streptococcus sanguis and purified s. Sanguis cell walls. Caries Research 1996;30:71-75.
Rose RK: The role of calcium in oral streptococcal aggregation and the implications for biofilm formation and retention. Biochimica et Biophysica Acta (BBA) - General Subjects 2000a;1475:76-82.
Rose RK: Binding characteristics of streptococcus mutans for calcium and casein phosphopeptide. Caries Research 2000b;34:427-431.
Rose RK, Dibdin GH: Calcium and water diffusion in single-species model bacterial plaques. Archives of Oral Biology 1995;40:385-391.
Rose RK, Dibdin GH, Shellis RP: A quantitative study of calcium binding and aggregation in selected oral bacteria. Journal of Dental Research 1993;72:78-84.
Rose RK, Hogg SD: Competitive binding of calcium and magnesium to streptococcal lipoteichoic acid. Biochimica et Biophysica Acta (BBA) - General Subjects 1995;1245:94-98.
Rose RK, Hogg SD, Shellis RP: A quantitative study of calcium binding by isolated streptococcal cell walls and lipoteichoic acid: Comparison with whole cells. Journal of Dental Research 1994;73:1742-1747.

277
Rose RK, Matthews SP, Hall RC: Investigation of calcium-binding sites on the surfaces of selected gram- positive oral organisms. Archives of Oral Biology 1997;42:595-599.
Rose RK, Shellis RP, Lee AR: The role of cation bridging in microbial fluoride binding. Caries Research 1996;30:458-464.
Rose RK, Turner SJ: Extracellular volume in streptococcal model biofilms: Effects of ph, calcium and fluoride. Biochimica et Biophysica Acta - General Subjects 1998;1379:185-190.
Ruben J, Arends J: Shrinkage prevention of in vitro demineralized human dentine in transverse microradiography. Caries Research 1993;27:262-265.
Ruben J, Arends J, Christoffersen J: The effect of window width on the demineralization of human dentine and enamel. Caries Research 1999;33:214-219.
Rudney JD: Saliva and dental plaque. Advances in Dental Research 2000;14:29-39.
Russell RRB: Bacterial polysaccharides in dental plaque; in Ullrich M (ed): Bacterial polysaccharides. Norfolk, UK., Caister Academic Press, 2009, pp 143 - 156.
Sampaio FC, Levy SM: Systemic fluoride; in Buzalaf MAR (ed): Fluoride and the oral environment: Monographs in oral science. Basel, Karger, 2011, vol 22, pp 97-114.
Selwitz RH, Ismail AI, Pitts NB: Dental caries. The Lancet 2007;369:51-59.
Shellis RP: A synthetic saliva for cultural studies of dental plaque. Archives of Oral Biology 1978;23:485-489.
Shellis RP: Relationship between human enamel structure and the formation of caries-like lesions in vitro. Archives of Oral Biology 1984;29:975-981.
Shellis RP: A microcomputer program to evaluate the saturation of complex solutions with respect to biominerals. Computer applications in the biosciences : CABIOS 1988;4:373-379.
Shellis RP: A scanning electron-microscopic study of solubility variations in human enamel and dentine. Archives of Oral Biology 1996;41:473-484.
Shellis RP, Dibdin GH: Analysis of the buffering systems in dental plaque. Journal of Dental Research 1988;67:438-446.
Shemesh M, Tam A, Aharoni R, Steinberg D: Genetic adaptation of streptococcus mutans during biofilm formation on different types of surfaces. BMC Microbiology 2010;10:51.
Ship JA: Xerostomia: Aetilogy, diagnosis and clinical implication; in Edgar M, Dawes C, O'Mullane D (eds): Saliva and oral health. London, UK., British Dental Journal, 2004, pp 50 - 70.
Shore RC, Robinson C, Kirkham J, Brookes SJ: Structure of developing enamel; in Robinson C, Kirkham J, Shore RC (eds): Dental enamel: Formation to destruction. Boca Raton (Fla), CRC Press, 1995a, pp 135 - 150.
Shore RC, Robinson C, Kirkham J, Brookes SJ: Structure of mature enamel; in Robinson C, Kirkham J, Shore RC (eds): Dental enamel: Formation to destruction. Boca Raton (Fla), CRC Press, 1995b, pp 151 - 168.
Shrestha BM, Mundorff SA, Bibby BG: Preliminary studies on calcium lactate as an anticaries food additive. Caries Research 1982;16:12-17.
278
Shu M, Wong L, Miller JH, Sissons CH: Development of multi-species consortia biofilms of oral bacteria as an enamel and root caries model system. Archives of Oral Biology 2000;45:27-40.
Silverstone LM: The surface zone in caries and in caries-like lesions produced in vitro. British Dental Journal 1968;125:145-157.
Simon J, Gross R, Klimmek O, Kröger A: The genus wolinella; in Dworkin M, Falkow S, Rosenberg E, Schleifer K-H, Stackebrandt E (eds): The prokaryotes. Springer New York, 2006, pp 178-191.
Sissons CH: Artificial dental plaque biofilm model systems. Advances in Dental Research 1997;11:110-126.
Sissons CH, Anderson SA, Wong L, Coleman MJ, White DC: Microbiota of plaque microcosm biofilms: Effect of three times daily sucrose pulses in different simulated oral environments. Caries Research 2007;41:413-422.
Sissons CH, Wong L, Cutress TW: Patterns and rates of growth of microcosm dental plaque biofilms. Oral Microbiology and Immunology 1995;10:160-167.
Skopek RJ, Liljemark WF, Bloomquist CG, Rudney JD: Dental plaque development on defined streptococcal surfaces. Oral Microbiology and Immunology 1993;8:16-23.
Smits MT, Arends J: In vitro demineralization of human enamel in artificial u-shaped grooves. Caries Research 1986;20:217-222.
Smits MT, Arends J: Influence of extraoral xylitol and sucrose dippings on enamel demineralization in vivo. Caries Research 1988;22:160-165.
Spratt DA, Pratten J: Biofilms and the oral cavity. Re/Views in Environmental Science and Bio/Technology 2003;2:109-120.
Sreebny LM: Sugar availability, sugar consumption and dental caries. Community Dentistry And Oral Epidemiology 1982;10:1-7.
Stewart PS: Diffusion in biofilms. Journal of Bacteriology 2003;185:1485-1491.
Stoodley P, Sauer K, Davies DG, Costerton JW: Biofilms as complex differentiated communities. Annual Review of Microbiology 2002;56:187-209.
Stookey GK: The effect of saliva on dental caries. Journal of the American Dental Association 2008;139:11S-17S.
Sullivan RJ, Fletcher R, Bachiman R, Penugonda B, LeGeros RZ: Intra-oral comparison and evaluation of the ability of fluoride dentifrices to promote the remineralization of caries-like lesions in dentin and enamel. Journal of Clinical Dentistry 1995;6:135-138.
Sutton SV, Bender GR, Marquis RE: Fluoride inhibition of proton-translocating atpases of oral bacteria. Infect Immun 1987;55:2597-2603.
Takahashi N, Nyvad B: Caries ecology revisited: Microbial dynamics and the caries process. Caries Research 2008;42:409-418.
Tanaka H, Ebara S, Otsuka K, Hayashi K: Adsorption of saliva-coated and plain streptococcal cells to the surfaces of hydroxyapatite beads. Archives of Oral Biology 1996;41:505-508.

279
Tatevossian A: Film fermenters in dental research; in Wimpenny JWT (ed): Crc handbook of laboratory model systems for microbial ecosystems. Boca Raton (Fla), CRC P, 1988., 1988, pp 197 - 227.
Tatevossian A, Gould CT: The composition of the aqueous phase in human dental plaque. Archives of Oral Biology 1976;21:319-323.
ten Cate JM: In situ models, physico-chemical aspects. Advances in Dental Research 1994;8:125-133.
ten Cate JM: Review on fluoride, with special emphasis on calcium fluoride mechanisms in caries prevention. European Journal of Oral Sciences 1997;105:461-465.
ten Cate JM: The role of saliva in mineral equilibria - caries erosion and calculus formation; in Edgar WM, Dawes C, O'Mullane D (eds): Saliva and oral health. London, UK., British Dental Journal, 2004, pp 120 - 135.
ten Cate JM: The need for antibacterial approaches to improve caries control. Advances in Dental Research 2009;21:8-12.
ten Cate JM, Duijsters PPE: Alternating demineralization and remineralization of artificial enamel lesions. Caries Research 1982;16:201-210.
ten Cate JM, Dundon KA, Vernon PG, Damato FA, Huntington E, Exterkate RAM, Wefel JS, Jordan T, Stephen KW, Roberts AJ: Preparation and measurement of artificial enamel lesions, a four-laboratory ring-test. Caries Research 1996;30:400-407.
ten Cate JM, Larsen JM, Pearce E, Fejerskov O: Chemical interactions between the tooth and oral fluids; in Fejerskov O, Kidd EAM (eds): Dental caries: The disease and its clinical managment. Oxford, UK., Blackwell Publishing, 2008, pp 209 - 230.
Tenovuo J: Protective functions of saliva; in Edagr WM, Dawes C, O'Mullane D (eds): Saliva and oral health. London, UK., Britich Dental Journal, 2004, pp 103 - 119.
Tenuta LMA, Cerezetti RV, Del Bel Cury AA, Tabchoury CPM, Cury JA: Fluoride release from caf2 and enamel demineralization. Journal of Dental Research 2008;87:1032-1036.
Tenuta LMA, Del Bel Cury AA, Bortolin MC, Vogel GL, Cury JA: Ca, pi, and f in the fluid of biofilm formed under sucrose. Journal of Dental Research 2006;85:834-838.
Theilade E: The non-specific theory in microbial etiology of inflammatory periodontal diseases. Journal Of Clinical Periodontology 1986;13:905-911.
Theuns HM, Driessens FC, van Dijk JW: Lesion formation in abraded human enamel. Influence of the gradient in solubility and the degree of saturation of buffer solutions on the lesion characteristics. Caries Res 1986a;20:510-517.
Theuns HM, Driessens FC, van Dijk JW, Groeneveld A: Experimental evidence for a gradient in the solubility and in the rate of dissolution of human enamel. Caries Res 1986b;20:24-31.
Theuns HM, van Dijk JWE, Driessens FCM, Groeneveld A: The influence of the composition of demineralizing buffers on the surface layers of artificial carious lesions. Caries Research 1984;18:509-518.
Thomas TD, Ellwood DC, Longyear VMC: Change from homo- to heterolactic fermentation by streptococcus lactis resulting from glucose limitation in anaerobic chemostat cultures. Journal of Bacteriology 1979;138:109-117.

280
Tomazic BB, Tung MS, Gregory TM, Brown WE: Mechanism of hydrolysis of octacalcium phosphate. Scanning Microscopy 1989;3:119-127.
Tong H, Chen W, Merritt J, Qi F, Shi W, Dong X: Streptococcus oligofermentans inhibits streptococcus mutans through conversion of lactic acid into inhibitory h2o2: A possible counteroffensive strategy for interspecies competition. Molecular Microbiology 2007;63:872-880.
Trombe M-C, Clave C, Manias J-M: Calcium regulation of growth and differentiation in streptococcus pneumoniae. Journal of General Microbiology 1992;138:77-84.
Valappil SP, Coombes M, Wright L, Owens GJ, Lynch RJM, Hope CK, Higham SM: Role of gallium and silver from phosphate-based glasses on in vitro dual species oral biofilm models of porphyromonas gingivalis and streptococcus gordonii. Acta Biomaterialia 2012;8:1957-1965.
Valappil SP, Owens GJ, Miles EJ, Farmer N, Cooper L, Miller G, Clowes R, Higham SM: Effect of gallium on growth of streptococcus mutans nctc10449 and dental tissues. Caries Research 2013;In Press.
van der Hoeven JS, de Jong MH, Camp PJM, van den Kieboom CWA: Competition between oral streptococcus species in the chemostat under alternating conditions of glucose limitation and excess. FEMS Microbiology Letters 1985;31:373-379.
van der Hoeven JS, Franken HC: Effect of fluoride on growth and acid production by streptococcus mutans in dental plaque. Infection and Immunity 1984;45:356-359.
van der Hoeven JS, Schaeken MJM, Creugers TJ: Effect of a mouthrinse containing calcium lactate on the formation and mineralization of dental plaque. Caries Research 1989;23:146-150.
van Loveren C: Antimicrobial activity of fluoride and its in vivo importance: Identification of research questions. Caries Research 2001;35:65-70.
van Palenstein Helderman WH, Ijsseldijk M, Huis in 't Veld JHJ: A selective medium for the two major subgroups of the bacterium streptococcus mutans isolated from human dental plaque and saliva. Archives of Oral Biology 1983;28:599-603.
Vogel GL: Oral fluoride reservoirs and the prevention of dental caries; in Buzalaf MAR (ed): Fluoride and the oral environment: Monographs in oral science. Basel, Karger, 2011, vol 22, pp 146 - 157.
Vogel GL, Carey CM, Chow LC, Tatevossian A: Micro-analysis of plaque fluid from single-site fasted plaque. Journal of Dental Research 1990;69:1316-1323.
Vogel GL, Chow LC, Carey CM: Calcium pre-rinse greatly increases overnight salivary fluoride after a 228 ppm fluoride rinse. Caries Research 2008;42:401-404.
Vogel GL, Mao Y, Chow LC, Proskin HM: Fluoride in plaque fluid, plaque, and saliva measured for 2 hours after a sodium fluoride monofluorophosphate rinse. Caries Research 2000;34:404-411.
Vogel GL, Tenuta LMA, Schumacher GE, Chow LC: No calcium-fluoride-like deposits detected in plaque shortly after a sodium fluoride mouthrinse. Caries Research 2010;44:108-115.
Vogel GL, Zhang Z, Chow LC, Schumacher GE: Effect of a water rinse on ‘labile’ fluoride and other ions in plaque and saliva before and after conventional and experimental fluoride rinses. Caries Research 2001;35:116-124.

281
Vroom JM, De Grauw KJ, Gerritsen HC, Bradshaw DJ, Marsh PD, Watson GK, Birmingham JJ, Allison C: Depth penetration and detection of ph gradients in biofilms by two-photon excitation microscopy. Applied and Environmental Microbiology 1999;65:3502-3511.
Wade W: Unculturable bacteria--the uncharacterized organisms that cause oral infections. J R Soc Med 2002;95:81-83.
Walsh P: Acid permeation into dental enamel and hydroxyapatite; in: School of Dentistry. Liverpool. UK, University of Liverpool, 1991, vol PhD, pp 45 - 47.
Walsh T, Worthington HV, Glenny AM, Appelbe P, Marinho VCC, Shi X: Fluoride toothpastes of different concentrations for preventing dental caries in children and adolescents. Cochrane Database of Systematic Reviews 2010.
Wang L, Nancollas GH: Calcium orthophosphates: Crystallization and dissolution. Chemical Reviews 2008;108:4628-4669.
Watanabe S, Dawes C: The effects of different foods and concentrations of citric acid on the flow rate of whole saliva in man. Archives of Oral Biology 1988;33:1-5.
Watson PS, Pontefract HA, Devine DA, Shore RC, Nattress BR, Kirkham J, Robinson C: Penetration of fluoride into natural plaque biofilms. Journal of Dental Research 2005;84:451-455.
Weatherell JA, Robinson C, Hallsworth AS: Variations in the chemical composition of human enamel. Journal of Dental Research 1974;53:180-192.
Weatherell JA, Robinson C, Nattress BR: Site-specific variations in the concentrations of substances in the mouth. Br Dent J 1989;167:289-292.
Weatherell JA, Weidmann SM, Hamm SM: Density patterns in enamel. Caries Research 1967;1:42-51.
White DJ: The application of in vitro models to research on demineralization and remineralization of the teeth. Advances in Dental Research 1995;9:175-193.
White DJ, Faller RV, Bowman WD: Demineralization and remineralization evaluation techniques--added considerations. Journal of Dental Research 1992;71 Spec No:929-933.
WHO: Fluorides and oral health (oral health status and fluroide use); in: WHO Technical Report Series. Geneva, World Health Organisation, 1994.
WHO: Global data on dental caries prevalence (pmft) in children aged 12 year; in: Global Oral Data Bank (Oral Health Contry / Area Profile Programme). Geneva, World Health Organisation, 2000.
Wijeyeweera RL, Kleinberg I: Arginolytic and ureolytic activities of pure cultures of human oral bacteria and their effects on the ph response of salivary sediment and dental plaque in vitro. Archives of Oral Biology 1989a;34:43-53.
Wijeyeweera RL, Kleinberg I: Acid-base ph curves in vitro with mixtures of pure cultures of human oral microorganisms. Archives of Oral Biology 1989b;34:55-64.
Williams RAD, Elliott JC: Biological polymers: Carbohydrates; in: Basic and applied biochemistry. Edinburgh, UK., Churchll Livingstone, 1989, pp 65 - 91.

282
Wilson M: Use of constant depth film fermentor in studies of biofilms of oral bacteria; in Ron JD (ed): Methods in enzymology. Academic Press, 1999, vol Volume 310, pp 264-279.
Wimpenny JWT: Introduction; in Wimpenny JWT (ed): Crc handbook of laboratory model systems for microbial ecosystems. Boca Raton (Fla), CRC Press, 1988, pp 1 - 17.
Wong L, Sissions CH: A comparison of human dental plaque microcosm biofilms grown in an undefined medium and a chemically defined artificial saliva. Archives of Oral Biology 2001;46:477-486.
Wood SR, Kirkham J, Marsh PD, Shore RC, Nattress B, Robinson C: Architecture of intact natural human plaque biofilms studied by confocal laser scanning microscopy. Journal of Dental Research 2000;79:21-27.
Woodward M, Walker AR: Sugar consumption and dental caries: Evidence from 90 countries. Br Dent J 1994;176:297-302.
Yaari A, Bibby BG: Production of plaques and initiation of caries in vitro. Journal of Dental Research 1976;55:30-36.
Yamazaki H, Margolis HC: Enhanced enamel remineralization under acidic conditions in vitro. Journal of Dental Research 2008;87:569-574.
Yassin OM: In vitro studies of the effect of a dental explorer on the formation of an artificial carious lesion. ASDC journal of dentistry for children 1995;62:111-117.
Zahradnik RT, Moreno EC, Burke EJ: Effect of salivary pellicle on enamel subsurface demineralization in vitro. Journal of Dental Research 1976;55:664-670.
Zaura-Arite E, Exterkate RAM, Cate JMt: Effect of high fluoride concentration on bovine dentin demineralization in narrow grooves in vitro. European Journal of Oral Sciences 1999;107:455-460.
Zaura E, Buijs MJ, Hoogenkamp MA, Ciric L, Papetti A, Signoretto C, Stauder M, Lingstrom P, Pratten J, Spratt DA, Wilson M: The effects of fractions from shiitake mushroom on composition and cariogenicity of dental plaque microcosms in an in vitro caries model. Journal of Biomedicine and Biotechnology 2011;2011:10.
Zaura E, Buijs MJ, ten Cate JM: The effects of the solubility of artificial fissures on plaque ph. Journal of Dental Research 2002;81:567-571.
Zaura E, ten Cate JM: Dental plaque as a biofilm: A pilot study of the effects of nutrients on plaque ph and dentin demineralization. Caries Research 2004;38:9-15.
Zaura E, van Loveren C, ten Cate JM: Efficacy of fluoride toothpaste in preventing demineralization of smooth dentin surfaces and narrow grooves in situ under frequent exposures to sucrose or bananas. Caries Research 2005;39:116-122.
Zero DT: Sugars – the arch criminal? Caries Research 2004;38:277-285.
Zero DT, van Houte J, Russo J: Enamel demineralization by acid produced from endogenous substrate in oral streptococci. Archives of Oral Biology 1986;31:229-234.
Copyright © 2022 FDOKUMEN