Saliva microbiota carry caries-specific functional gene signatures
Upload
khangminh22Category
view
4download
0
Optimal Exposure Time for
Diagnosis of Approximal Caries
Lesions on Digital X-rays
Mark Lindholm and Jonas Niklasson
Tutor: Eva Levring Jäghagen
Co-tutor: Fredrik Bryndahl
ABSTRACT
In digital radiography the image can be enhanced and thereby an incorrect
exposed radiograph can appear to have optimal brightness but with limited
information and possibility to diagnose e.g. caries.
The primary aim of this study was to determine if different exposure times have
an impact on the accuracy in diagnosis of approximal caries lesions in bitewing
radiographs using a CMOS system. If so, what the optimal exposure time was.
A total of 40 extracted human teeth were selected and evaluated with a digital
CMOS system. The teeth were exposed with different exposure times. CBCT
was used to validate the presence and degree of approximal caries lesions on
every individual tooth surface. The radiographs were evaluated by 11 general
dentists and 4 specialists in oral and maxillofacial radiology.
The choice of exposure time did affect the diagnostic accuracy. A higher
diagnostic accuracy was achieved when a longer exposure time (> 0.1 sec) was
used when comparing kappa values and ROC curves among the observers.
The radiologists had a higher diagnostic accuracy than the general dentists. A
substantial variation in individual diagnostic accuracy between observers was
found.
In conclusion; approximal caries was found to be easier to diagnose when the
evaluated longer exposure times were used in the studied digital CMOS
system. There was some decline in the longest exposures of the time span.
However, when selecting optimal exposure time the patient's age and size
should also be taken into consideration.

3
INTRODUCTION
Radiography has been used in the field of dentistry since the beginning of the
20th century and is an established method to diagnose caries. Especially when
diagnosing approximal caries where visual access usually is restricted,
radiography has been proven to be a good aid (Young and Featherstone, 2005;
Hopcraft and Morgan, 2005; Newman et al., 2009).
Digital radiography has become common during the last decade in the general
dental practice. The increased use of digital radiography is due to the lower
dose of radiation required to accurately evaluate and diagnose dental
pathology. The shorter time span between exposure and display of the
radiograph compared to analogue radiography is another benefit. The mean
exposure time reduction for digital radiography is 55% compared to analogue
radiography. When subjective image quality was compared with analogue
radiographs in a study, a majority of the dentists answered that digital image
quality was the same as analogue radiographs or even better (Wenzel and
Møystad, 2001). Another positive consequence when using digital radiography
is the absence of chemicals that are used when developing analogue
radiographs (Wenzel, 2004), thereby the environmental impact decreases when
choosing digital radiography. Further, there is less need of physical space for
archiving digital radiographs.
When exposure parameters are adjusted poorly the radiograph either becomes
too dark due to overexposure, or too bright due to underexposure. This was
more evident when analogue radiographs were used since it was not possible
to enhance analogue radiographs by software as in today’s digital imaging.
There are also differences between type of sensor used, a CCD (Charge-
Coupled Device) or a CMOS (Complementary Metal Oxide Semiconductor)
sensor. Generally the CCD sensor is more sensitive to overexposure compared
to the CMOS sensor. As a consequence, overexposure can lead to a
redistribution of the charge on neighbouring pixels with image artifacts

4
(“blooming”) (Bottenberg et al., 2011).
The analogue radiograph is permanent and cannot be enhanced and if the
practitioner cannot make a judgement due to over- or underexposure, another
film has to be exposed and further radiation is thereby distributed to the patient.
Clinicians always strive to follow the ALADA philosophy (as low as
diagnostically acceptable) (Bushberg, 2014) when using radiography for
diagnostics. The digital systems allow clinicians to follow this philosophy further.
The software is able to enhance radiographs to an extent where the clinician
might not need to do retakes due to over- or underexposure. The radiographic
image is automatically getting processed by the software and before it is
displayed on the screen, optimization has been made by the computer. The
software will try to compensate for over- or underexposure, and normalize the
radiograph by adjusting contrast, and brightness.
The raw data in a radiograph exposed with inadequate exposure parameters,
will not be optimal, the noise increases the non-useful information in the
radiographic image. Radiographic noise can be described as unwanted
variations within an image leading to loss of detail in the image (Hayakawa et
al., 1996). This noise will affect the practitioner's judgment when i.e. looking for
caries lesions.
The primary aim of this study was to determine if different exposure times have
an impact on the accuracy in diagnosis of approximal caries lesions in bitewing
radiographs using a CMOS system. If so, what the optimal exposure time or
time span was.
MATERIALS & METHODS
Material
The material comprised of 40 extracted human teeth, all premolars. Only one
tooth had a restoration. To identify caries lesions on approximal surfaces, visual
inspection preceded a scan in a Computed Cone Beam Tomograph (CBCT).

5
When the teeth were chosen the aim was to select an equal distribution of teeth
with sound and/or carious (white/brownish discolorations, sometimes with
cavitation) approximal surfaces to be scanned in the CBCT.
CBCT examination
The CBCT used was a Morita 3D Accuitomo XYZ Slice View Tomograph model
MCT-1 (J. Morita Mfg. Corp., Kyoto, Japan).
CBCT examinations were chosen as the gold standard to diagnose approximal
caries lesions. Every tooth was placed in a block of clay and scanned
individually to minimize artifacts from other teeth and to achieve as good image
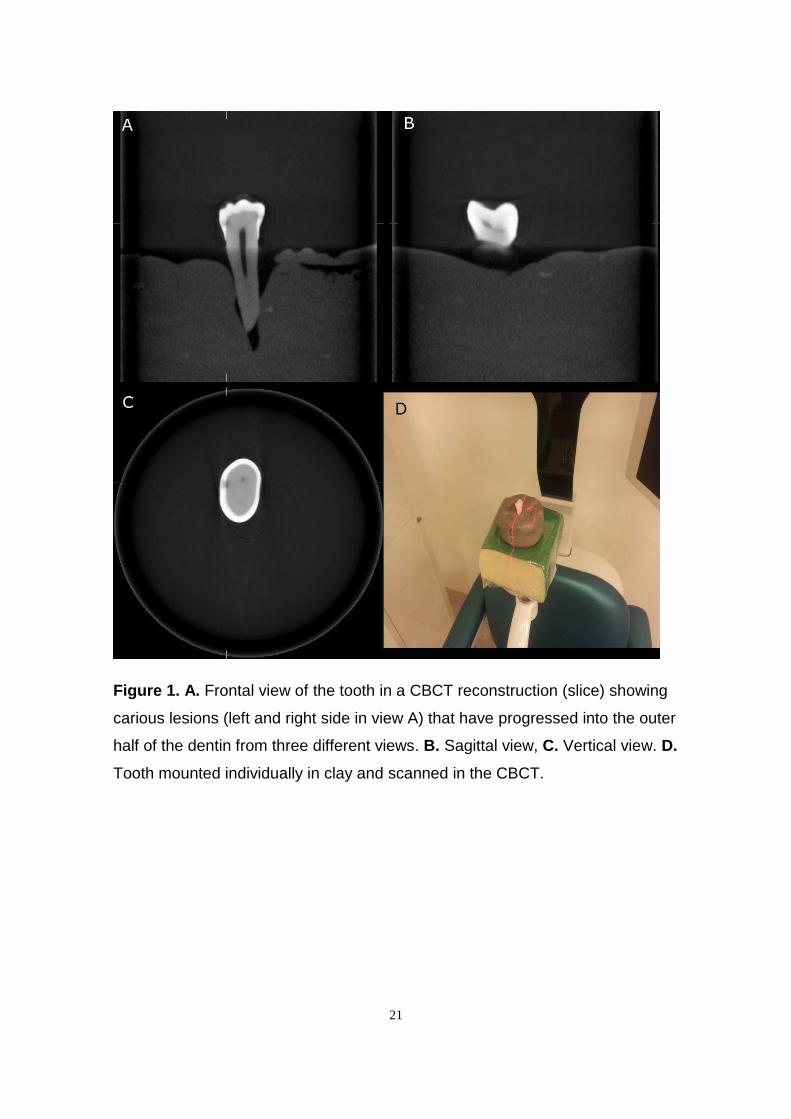
quality as possible (Figure 1D). Every tooth was scanned for 30.8 sec with slice
thickness 0.240 mm, using the high resolution setting (Figure 1). The voltage
and electric current were set to 80 kV and 8 mA respectively.
Every CBCT scan was examined by both authors of this article, one
undergraduate student in dentistry and one dentist specialized in oral and
maxillofacial radiology. A consensus was made for every approximal surface
according to a 5-point scale.
Caries scale
The scale used when diagnosing caries and evaluating the degree of the caries
lesion was a standardized scale ranging from 0 to 4 (Figure 2A).
0 = the surface was sound.
1 = the caries lesion was localized to the outer half of the enamel.
2 = the caries lesion had progressed into the inner half of the enamel and not
crossing the dentino-enamel junction.
3 = the caries lesion had progressed into the outer half of the dentin.
4 = the caries lesion had progressed into the inner half of the dentin.
Bitewing
The dental x-ray unit used was a Focus 50720 (GE Healthcare, Tuusula,
Finland). The sensor used was a Schick CDR Elite (Schick Technologies, Long

6
Island City, NY, USA), which is based on CMOS technology.
Bitewing examinations were performed with teeth mounted in ten clay blocks.
One block consisted of four teeth placed in a line with the approximal surfaces
in contact with each other, simulating a patient's dental arch (Figure 2B, C, D
and E). The clay block was supported by a gypsum holder. The clay surrounded
the roots and the upper border of the clay was just below the level of the
cementoenamel junction on the teeth, resembling the marginal bone. The
sensor was placed in putty silicone impression material, in the same gypsum
holder as the teeth (Figure 2E). An acrylic block measuring 19 mm in thickness
and equivalent to soft tissue attenuation, was placed in front of the teeth to
simulate the cheek. The distance between the sensor and the x-ray tube was
standardized to 36 mm.
All ten blocks were exposed using 60 kV and 7 mA. The exposure times
selected for analysis were 0.04, 0.05, 0.063, 0.08, 0.1, 0.125, 0.16, 0.2, 0.25,
0.32, 0.4 and 0.5 sec.
Observers
25 observers were asked to diagnose the radiographs during a six-week period,
where the only observer requirement was to be a general dentist. 15 of the 25
observers completed the entire task.
Evaluation and Questionnaire
20 radiographs (two different exposures/block) were evaluated per week using
the Schick CDR DICOM (Student CDR) system. The radiographs were placed
in a randomized order to reduce the risk of bias (e.g. remembering caries
lesions from one image to another) when diagnosing. All observers were asked
to diagnose caries using the standardized scale described earlier. They were
allowed to adjust brightness, contrast and/or any other function available in the
Schick CDR software. They were asked to report what monitor model they used
when diagnosing the teeth and also requested to use the same monitor
throughout the whole study.
7
The observers received a questionnaire regarding their clinical experience and
methods concerning radiographical habits (see appendix).
Literature search
Pubmed and Google Scholar were the databases used for searching and
collecting references for the study. Multiple combinations of the following
keywords were used: analog radiography, cbct, caries, dental, dentistry, digital
dental radiography, diagnostic accuracy, digital x-ray radiography, exposure
time, monitor and noise.
References from selected articles were also used.
Statistical methods
The data from our observers was stored in an excel file. IBM SPSS Statistics
(v22.0.0) and RStudio (v0.98.501) were used for statistical analysis and
visualization.
Cohen’s kappa coefficient was used to measure agreement between gold
standard and observer (Cohen, 1960). The method takes agreement occurring
by chance into account. Kappa values were calculated for every exposure time
and agreement between each observer and the gold standard determined by
the CBCT examination. From these values, boxplots were made.
Two sets of kappa values were calculated. The first set was based on the
original data. The second one was weighted by determining all caries lesions
located in the outer half of the enamel (1) as being sound surfaces (0). From
each set of kappa values, two box plots were generated (Figure 3), one to show
the difference in individual diagnostic performance among the observers and
the second to present kappa values (diagnostic accuracy) sorted by exposure
times.
In addition, an interpretation of the obtained values of kappa was made, dividing
the exposure times in two groups (≤ 0.1 sec and > 0.1 sec) based on their

8
diagnostic performance (kappa values). From these two groups six ROC curves
were made (Figure 4).
ROC curves are made to illustrate the sensitivity and specificity for the
observers’ ability to diagnose caries. An area under the curve (AUC) equal to
one corresponds to a perfect test whereas an AUC that is equal to 0.5 or less
corresponds to a random guess or worse (Metz 1978).
The six presented ROC curves visualize the differences in diagnostic accuracy
between the two groups of observers, the two groups of exposure times and the
different degrees of caries lesions.
Ethics
The radiographic exposures were performed under controlled circumstances,
meaning that nobody was exposed to harmful radiation. “The Swedish Act on
Biobanks” (“Biobankslagen”) states that a sample (in this case human teeth)
requires consent from the donor if the sample is to be used in research. The act
is not applicable in this study since the teeth can't be traced back to the donors.
The Ethics Forum at the Department of Odontology found that appropriate
ethics considerations had been made in this degree project.
RESULTS
The diagnostic accuracy at different exposure times was compared. The results
indicated that longer exposure times resulted in both higher values of kappa
(Figure 3C and D) and values of AUC in the ROC curves. An interval with
higher kappa values was found between the exposure times 0.125 sec and 0.5
sec, since the values for the non-weighted kappa values were notably higher for
exposure times exceeding 0.1 sec. The weighted kappa values also showed
higher scores than the non-weighted kappa values. The kappa values ranged
from -0.051 to 0.481 and the weighted kappa values ranged from -0.026 to
0.62.

9
The ROC curves displayed that specialists in radiology scored a higher AUC
than the general dentists did in the majority of caries lesions and exposure
times. The AUC showed lower values for lesions in the outer enamel. The AUC
was fairly similar when comparing the caries lesions extending into the inner
enamel and outer dentin. Though caries lesions extending into the inner enamel
showed slightly higher AUC than lesions that had progressed into the outer
dentin.
Observer 10 was excluded since the kappa values were much lower compared
to the other observers, which may indicate that this observer had
misunderstood the task.
Participants and Questionnaire
Of the 25 observers who were asked to participate, 3 observers declined to
participate and 7 observers dropped out. Of the remaining fifteen observers who
participated in this study, 11 were general dentists (including two dentists in
other specialities than radiology) and 4 were specialists in oral and maxillofacial
radiology. They had been practising dentistry for 9 months to 35 years with a
mean experience of 21.4 years.
Eleven observers answered that they regularly dim their lighting while
evaluating radiographs. One observer had no formal education in digital x-ray
diagnostics. Two observers used medical grade monitors. Four observers used
additional lighting dampening such as window blinds. Ten observers used
utilities in the Schick software to alter the radiographs, the most frequently used
was contrast/brightness (window/level in Schick software), flashlight and
revealer.
All but one observer adjusted the exposure time according to the patient's size,
and four observers did not adjust the voltage depending on the type of
radiograph (bitewing or apical).
10
DISCUSSION
Our null hypothesis was that there is no difference in accuracy in caries
diagnosis between different exposure times and no difference in diagnostic
performance between observers. Also, that the degree of a caries lesion does
not affect the detection of the lesion. This was disproven in our study.
The results of the present study showed that caries was easier to diagnose in
radiographs that had longer exposure times in the evaluated time span. A time
interval for the radiographs that resulted in higher diagnostic accuracy was
obtained since the observers didn’t perform exceptionally better at one single
exposure time, when diagnosing caries. Previous studies made with storage
phosphor-plates support this finding (Önem et al., 2012, Svanæs et al., 2000).
Our study indicates that there is a greater chance to detect approximal caries
lesions while using the evaluated longer exposure times. This is in agreement
with the ALADA principle since, in the long run, it is a justifiable decision as this
results in better diagnostics and less retakes due to underexposure. The patient
will also acquire earlier prophylactic intervention and avoid invasive treatment.
Questionnaires
Only two observers reported that they used medical diagnostic monitors during
assessment of the radiographs and they both scored kappa values above
average. However, the number was too small to draw any conclusions on
whether the monitor's quality influenced caries diagnostics. The general opinion
is that medical grade monitors, often used by radiologists, are more optimal in
diagnostics than less advanced monitors. This has been shown not to be the
case (Isidor et al., 2009). However, monitor calibration is of great importance to
achieve similar results, independent on quality of monitors (Yoshimura et al.,
2011). To avoid any influence due to quality or calibration of monitor, it would
have been optimal if all the observers had used the same model and type of
monitor.
11
Eleven observers reported that they regularly dimmed the light while diagnosing
the radiographs. This is a factor proven to be important while diagnosing caries
lesions, especially when the caries lesion has progressed into the dentin
(Hellén-Halme et al., 2008; Hellén-Halme and Lith, 2012). We did not include a
question if the light was actually dimmed during assessment of the radiographs
in this study, and therefore no comparison of diagnostics performance on group
level was performed.
Gold standard
In our study, CBCT was chosen as the gold standard to validate the caries
lesions. Usually histologic validation is chosen as the gold standard when
validating caries lesions, as it has been shown to fulfil the criteria for a robust
gold standard (Wenzel et al., 1999). In our study we did not have the resources
to conduct histologic validations of the teeth, which is why CBCT was chosen as
gold standard.
The amount of teeth with restorations, especially metallic restorations, was
minimized to one tooth. Restorations lead to artifacts when scanned in a CBCT,
which may in turn lead to misinterpretations when diagnosing caries (Cheng et
al., 2011).
CBCT has been shown to be better than analogue digital radiography in
determining the degree of small approximal caries lesions (Figure 1) in non-
restored dentitions (Akdeniz et al., 2005). Therefore it was chosen as the gold
standard for diagnosing caries. Other studies on the other hand indicate that
CBCT does not show better diagnostic accuracy compared to analogue
radiography, especially when the caries lesions are confined to the enamel
(Young et al., 2009). In all these studies, though, the teeth diagnosed with the
CBCT have been mounted in blocks with several teeth, and not individually as
in our study. Artifacts from adjacent teeth most probably influenced their results.

12
Agreement
Longer exposure times resulted in higher kappa values, i.e. better caries
diagnostics.
The kappa values were rather low, at best 0.62 (weighted) (0.49 non-weighted),
which corresponds to substantial agreement, but the most frequent values were
in the range of 0.21-0.4, which correspond to fair agreement (Viera and Garrett,
2005). One explanation to the low kappa values is that all interpretations from
all radiographs were included and some of the radiographs were too bright to
interpret and therefore the observers scored worse on them. Another might be
that the most frequent caries lesions in this study were lesions extending into
the outer half of the enamel. These lesions have been shown to be hard to
diagnose correctly (Hintze et al., 1994). Therefore we produced a weighted
kappa value which meant that all the caries lesions extending into the outer half
of the enamel (1) were made equivalent to not having any caries lesion (0), both
for the answers of the observers and the gold standard. This resulted in slightly
higher kappa values.
In the boxplot illustrating the weighted kappa values (Figure 3D) the result of
diagnosing caries has improved for 0.1 sec and a decline in diagnostics is seen
for exposures > 0.4 sec. This indicates that detection of caries decreases with
overexposure > 0.4 sec. If the ROC curves had been calculated using weighted
kappa values with exposures 0.1-0.32 sec the values for sensitivity and
specificity would probably have been higher.
The ROC curves were calculated with a cut-off at > 0.1 sec using the kappa
values in the boxplot with the non-weighted kappa values (Figure 3C) that
included caries in the outer half of the enamel. The decline in diagnostics was
not as evident for the longer exposures, which is why results from both 0.4 sec
and 0.5 sec were included in the ROC curves. It could however be argued that
0.5 sec should have been excluded, using an interval of 0.125-0.4 sec as
optimal exposure times.

13
As seen in the box plot (Figure 3A and B) the kappa values varied a lot between
the observers. There might have been several factors that affected the outcome
such as experience (Hellén-Halme and Petersson, 2010), lighting conditions
and/or further education involving digital radiography.
Distribution of caries lesions
There were 47 sound enamel surfaces, 15 caries lesions extending into the
outer half of the enamel, 12 that had progressed into the inner half of the
enamel, 6 into the outer half of the dentin and 0 into the inner half of the dentin.
Three teeth had occlusal caries that had progressed into the outer half of the
dentin.
Most of the caries lesions were confined to the enamel, explained by the fact
that the majority of teeth were extracted because of orthodontic reasons and
originated from young patients with low caries/restoration rate. The fact that
caries lesions confined to the enamel is difficult to diagnose correctly (Hintze et
al., 1994) might have had an impact on the results, mainly resulting in lower
kappa values and lower AUC in the ROC curves. It would have been better to
have more lesions extending into the dentin since these are somewhat more
clinically important when determining whether invasive treatment should be
performed or not. On the other hand, the enamel lesions are harder to detect
which means that the differences in the quality of the radiograph that the
different exposure times lead to, are more important since these lesions are
very subtle. It is especially important since there usually is an over-
/underestimation of the caries lesion compared to the true lesion depth
(Jacobsen et al., 2004).
We have shown that differences in diagnostic performance among observers
exist and also depending on the degree of caries lesions using ROC curves.
Because there was only 6 caries lesions extending into dentin, most of them
were early dentin caries lesions which may explain why the ROC curve for
caries extending into the inner half of the enamel (grade 2) had a higher AUC
than caries extending into the dentin (grade 3). This is usually not the case,

14
lesions that have progressed into dentin normally result in higher diagnostic
accuracy than lesions confined to the enamel (Okano et al., 1987).
A couple observers reported that they noticed root surface caries. This was
registered as if they hadn’t seen any approximal caries since root caries was
not to be evaluated in this study. Instructions that root surface caries should not
be registered should have been stated more clearly, since some observers
might have registered these lesions as caries and incorrect registrations lead to
a less accurate result.
ROC curves
The ROC curves illustrate diagnostic accuracy for dentomaxillofacial (DMF)
radiologists and dentists for different degrees of caries lesions. DMF
radiologists showed slightly higher sensitivity and specificity than the general
dentists, this could be explained by a higher level of education and experience
(Hellén-Halme and Petersson, 2010) and has also been shown in other studies
(Syriopoulos et al., 2000). Further, the general practitioners have to perform the
excavation and restoration as result of their diagnosis, and in order to reach
high specificity, they might underestimate the lesions to a higher degree. This is
in accordance with figure 4C and D where a notch can be seen in the lower left
corner. This can be explained by the fact that the scale is composed of several
categories and that the observers have underestimated or missed the caries
lesions in the inner half of the enamel.
In all diagnostic methods, a combined high sensitivity and specificity is optimal.
If that is not achievable, the importance of high sensitivity compared to high
specificity in diagnostic tests differs depending on the severity of missed
disease compared to treating healthy.
Caries can progress if missed, but invasive treatment of sound teeth should be
avoided. Therefore high specificity is important in a population with low caries
prevalence.

15
Considerations
Several circumstances differed between diagnosing caries in our study
compared to everyday practice. First, the availability of additional radiographs
with different projections of the same teeth exposed at the same occasion.
Second, there were no records and earlier radiographs exposed at different
occasions over a longer period of time that could have contributed to evaluate
the progression of the lesion. Finally, it was not possible to perform a clinical
examination of a patient. It is easier to interpret radiographs if the clinician has
access to more information.
The diagnostic accuracy in this study does not measure root surface caries, but
as seen in figure 2D, the root surface suffers a great amount of burnout
(overexposure of the lateral portion of the cervical part of the root, between the
cementoenamel junction and the alveolar ridge) due to high exposure time,
leading to possible masking of root surface caries (White and Pharoah, 2008).
Seven observers did not diagnose all radiographs, which led to dropouts of
observers. These observers reported a lack of time as a major reason. This is
understandable since many observers did not have additional time to everyday
work for contribution to our study. This fact could also have contributed to stress
among the participating observers during diagnosis of caries, which could have
affected the kappa value results.
Conclusion
In conclusion, our main finding was that approximal caries was easier to
diagnose when a longer exposure time (> 0.1 sec) was used in the studied
digital CMOS system. An improvement of caries diagnosing performance was
seen with longer exposure times, but with some decline in the longest
exposures of the time span. However, the patient's age and size should also be
taken into consideration when selecting optimal exposure times.

16
ACKNOWLEDGMENTS
The authors would like to thank the following people for their help and support in
contribution to this study. Eva Levring Jäghagen for her dedication, quick
responses and for being a great tutor. Fredrik Bryndahl for his sharp ideas and
for helping us getting started. Lina Schelin for her skillful statistical assistance.
Department of Endodontics at Umeå University for providing us with the teeth
used in this study. Lina Holmström for help with the administrative work. All the
participating observers for contributing with their time and effort to make this
study possible. Jennifer Borys for helping us with the data collection.

17
REFERENCES
Akdeniz BG, Gröndahl H-G, Magnusson B (2005). Accuracy of proximal caries
depth measurements: Comparison between limited cone beam computed
tomography, storage phosphor and film radiography. Caries Res 40:202-7.
Bottenberg P, Jacquet W, Stachniss V, Wellnitz J, Schulte AG (2011). Detection
of cavitated or non-cavitated approximal enamel caries lesions using CMOS
and CCD digital X-ray sensors and conventional D and F-speed films at
different exposure conditions. Am J Dent 24:74-8.
Bushberg JT (2014). Science, Radiation Protection, and the NCRP: Building on
the Past, Looking to the Future. NCRP: Achievements of the Past 50 Years and
Addressing the Needs of the Future. Mar 10-11, 2014, Bethesda, MD. National
Council on Radiation Protection & Measurements, pp. 5-7.
Cheng J-G, Zhang Z-L, Wang X-Y, Zhang Z-Y, Ma X-C, Li G (2011). Detection
accuracy of proximal caries by phosphor plate and cone-beam computed
tomography images scanned with different resolutions. Clin Oral Invest
16:1015-21.
Cohen J (1960). A coefficient of agreement for nominal scales. Educ Psychol
Meas 20:37-46.
Hayakawa Y, Farman AG, Scarfe WC, Kuroyanagi K, Rumack PM, Schick DB
(1996). Optimum exposure ranges for computed dental radiography.
Dentomaxillofac Radiol 25:71-5.
Hellén-Halme K, Lith A (2012). Effect of ambient light level at the monitor
surface on digital radiographic evaluation of approximal carious lesions: an in
vitro study. Dentomaxillofac Radiol 41:192-6.
Hellén-Halme K, Petersson GH (2010). Influence of education level and
experience on detection of approximal caries in digital dental radiographs. An in
vitro study. Swed Dent J 34:63-9.

18
Hellén-Halme K, Petersson A, Warfvinge G, Nilsson M (2008). Effect of ambient
light and monitor brightness and contrast settings on the detection of
approximal caries in digital radiographs: an in vitro study. Dentomaxillofac
Radiol 37:380-4.
Hintze H, Wenzel A, Jones C (1994). In vitro comparison of D- and E-speed film
radiography, RVG, and visualix digital radiography for the detection of enamel
approximal and dentinal occlusal caries lesions. Caries Res 28:363-7.
Hopcraft MS, Morgan MV (2005). Comparison of radiographic and clinical
diagnosis of approximal and occlusal dental caries in a young adult population.
Community Dent Oral Epidemiol 33:212-8.
Isidor S, Faaborg-Andersen M, Hintze H, Kirkevang LL, Frydenberg M, Haiter-
Neto F, Wenzel A (2009). Effect of monitor display on detection of approximal
caries lesions in digital radiographs. Dentomaxillofac Radiol 38:537-41.
Jacobsen JH, Hansen B, Wenzel A, Hintze H (2004). Relationship between
histological and radiographic caries lesion depth measured in images from four
digital radiography systems. Caries Res 38:34-8.
Metz, CE (1978). Basic principles of ROC analysis. Semi Nucl Med 8:283-98.
Newman B, Seow WK, Kazoullis S, Ford D, Holcombe T (2009). Clinical
detection of caries in the primary dentition with and without bitewing
radiography. Aust Dent J 54:23-30.
Okano T, Ohki M, Huang H-J, Yamada N (1987). Diagnosis of non-cavernous
posterior proximal caries: Radiographic observer performance. Oral Radiol 3:1-
6.
Svanæs DB, Møystad A, Larheim TA (2000). Approximal caries depth
assessment with storage phosphor versus film radiography. Evaluation of the
caries-specific Oslo enhancement procedure. Caries Res 34:448-53.

19
Syriopoulos K, Sanderink GCH, Velders XL, Van Der Stelt PF (2000).
Radiographic detection of approximal caries: a comparison of dental films and
digital imaging systems. Dentomaxillofac Radiol 29:312-18.
Viera AJ, Garrett JM (2005). Understanding interobserver agreement: the kappa
statistic. Fam Med 37:360-3.
Wenzel A (2004). Bitewing and digital bitewing radiography for detection of
caries lesions. Caries Res 83 Spec No C:C72-5.
Wenzel A, Hintze H (1999). The choice of gold standard for evaluating tests for
caries diagnosis. Dentomaxillofac Radiol 28:132-6.
Wenzel A, Møystad A (2001). Experience of Norwegian general dental
practitioners with solid state and storage phosphor detectors. Dentomaxillofac
Radiol 30:203-208
White SC, Pharoah MJ (2008). Oral Radiology: Principles and Treatment. 6th
ed. Philadelphia: Mosby.
Yoshimura K, Shimamoto K, Ikeda M, Ichikawa K, Naganawa S (2011). A
comparative contrast perception phantom image of brain CT study between
high-grade and low-grade liquid crystal displays (LCDs) in electronic medical
charts. Phys Med 27:109-16.
Young DA, Featherstone JD (2005). Digital imaging fiber-optic trans-
illumination, F-speed radiographic film and depth of approximal lesions. J Am
Dent Assoc 136:1682-7.
Young SM, Lee JT, Hodges RT, Chang T-L, Elashoff DA, White SC (2009). A
comparative study of high-resolution cone beam computed tomography and
charge-coupled device sensors for detecting caries. Dentomaxillofac Radiol
38:445-51.

20
Önem E, Baksi BG, Sen BH, Mert A (2012). Diagnostic accuracy of Digora
Optime storage phosphor plates for proximal subsurface demineralization:
effect of different exposure times. Oral Surg Oral Med Oral Pathol Oral Radiol
114:e78-84.
21
Figure 1. A. Frontal view of the tooth in a CBCT reconstruction (slice) showing
carious lesions (left and right side in view A) that have progressed into the outer
half of the dentin from three different views. B. Sagittal view, C. Vertical view. D.
Tooth mounted individually in clay and scanned in the CBCT.

22
Figure 2. A. Radiograph illustrating the scale used for diagnosing caries.
B, C and D. Example of a bitewing projection of the teeth that the observers
were asked to assess with an exposure time of 0.04 sec (B), 0.125 sec (C) and
0.5 sec (D). E. Teeth mounted in a row in clay to simulate a dental arch with an
acrylic block corresponding to the attenuation of the patient’s cheek, all to
enable different exposures of bitewing radiographs. The sensor was placed in a
putty silicone material.

23
Figure 3. A. Boxplot depicting kappa values for the observer performance (note: in this boxplot observer
10 is included, which is not the case in the other boxplots and ROC curves) B. Boxplot depicting weighted
kappa values for the observer performance (note: in this boxplot observer 10 is included, which is not the
case in the other boxplots and ROC curves) C. Boxplot showing the kappa values for different exposure
times at 60 kV. D. Boxplot showing the weighted kappa values for different exposure times at 60 kV.

24
Figure 4. A. and B. ROC curve depicting general dentists’ and specialists’
assessment of caries that was localized to the outer half of the enamel when
the exposure time was equal to or less than 0.1 sec (A) and more than 0.1 sec

25
(B). The AUC for the general dentists was 0.478 (≤ 0.1 sec) and 0.523 (> 0.1
sec). The AUC for the specialists was 0.484 (≤ 0.1 sec) and 0.527 (> 0.1 sec).
C. and D. ROC curve depicting general dentists’ and specialists’ assessment of
caries that had progressed into the inner half of the enamel but not crossing the
dentino-enamel junction when the exposure time was equal to or less than 0.1
sec (C) and more than 0.1 sec (D). The AUC for the general dentists was 0.651
(≤ 0.1 sec) and 0.694 (> 0.1 sec). The AUC for the specialists was 0.747 (≤ 0.1
sec) and 0.770 (> 0.1 sec).
E. and F. ROC curve depicting general dentists’ and specialists’ assessment of
caries that had progressed into the outer half of the dentin when the exposure
time was equal to or less than 0.1 sec (E) and more than 0.1 sec (F). The AUC
for the general dentists was 0.649 (≤ 0.1 sec) and 0.686 (> 0.1 sec). The AUC
for the specialists was 0.611 (≤ 0.1 sec) and 0.729 (> 0.1 sec).

26
Appendix
Frågeformulär till granskare i undersökning av exponeringsparametrars påverkan på kariesdiagnostik.
(Skicka ditt svar i separat kuvert)
1. Hur länge har du arbetat som tandläkare? ______________________
2. Brukar du dämpa belysningen vid granskning av röntgenbilder?
☐ Nej ☐ Ja
3. Vilken skärm använder du vid granskningen (Ange märke och modell) ___________________________________________
4. Använder du annat hjälpmedel för att skärma av ljus vid granskning av röntgenbilder? Om ja, vad?
☐ Nej ☐ Ja,______________________
5. Har du någon utbildning i digitalröntgen (ex. i grundutbildningen eller externa kurser)?
☐ Nej ☐ Ja,______________________
6. Använder du regelbundet bildbehandling eller verktyg vid granskning av digitala röntgenbilderna?
Om ja, vilken/vilka funktioner?
☐ Nej ☐ Ja,______________________

27
7. Är du specialist eller disputerad inom odontologi? Om ja, i vilket ämne?
☐ Nej ☐ Ja,______________________
8. Brukar du välja olika exponeringstider beroende på patientens storlek, ålder etc?
Om ja, ge exempel
☐ Nej ☐ Ja,______________________
9. Brukar du välja olika spänning beroende på om du tar bite-wing eller apikalbilder?
☐ Nej ☐ Ja, Bite-wing ________kV, apikalbilder __________kV
10. Om du upplever att en bild blir mörk brukar du då ta om den?
☐ Nej ☐ Ja
11. Om du upplever att en bild blir ljus brukar du då ta om den?
☐ Nej ☐ Ja Eventuell kommentar______________________
Copyright © 2022 FDOKUMEN