Recent trends in surface sensible heat flux on the Tibetan Plateau
10
SCIENCE CHINA Earth Sciences © Science China Press and Springer-Verlag Berlin Heidelberg 2010 earth.scichina.com www.springerlink.com *Corresponding author (email: [email protected]) • RESEARCH PAPER • January 2011 Vol.54 No.1: 19–28 doi: 10.1007/s11430-010-4036-6 Recent trends in surface sensible heat flux on the Tibetan Plateau YANG Kun 1* , GUO XiaoFeng 1 & WU BingYi 2 1 Laboratory of Tibetan Environment Changes and Land Surface Processes, Institute of Tibetan Plateau Research, Chinese Academy of Sciences, Beijing 100085, China; 2 Chinese Academy of Meteorological Sciences, China Meteorological Administration, Beijing 100081, China Received March 18, 2010; accepted May 5, 2010; published online August 6, 2010 Over the last three decades, the Tibetan Plateau has exhibited a significant increase in air temperature and a significant de- crease in wind speed. How the surface heat source has changed is an important issue in monsoon research. Based on routine meteorological data, this study investigates the differences between methods for estimating trends in surface sensible heat flux on the Tibetan Plateau for the period 1984–2006. One is a physical method based on micro-meteorological theory and experi- ments, and takes into account both atmospheric stability and thermal roughness length. The other approach includes conven- tional empirical methods that assume the heat transfer coefficient is a constant value or a simple function of wind speed. The latter method is used widely in climatologic studies. Results from the physical method show that annual mean sensible heat flux has weakened by 2% per decade, and flux seasonal mean has weakened by ~2%–4% except in winter. The two commonly used empirical methods showed high uncertainties in heat flux trend estimates, although they produced similar climatologies. Annual mean heat flux has weakened by 7% per decade when a fixed transfer coefficient is used, whereas the trend is negligi- ble when the transfer coefficient is assumed a function of wind speed. Conventional empirical methods may therefore misrep- resent the trend in sensible heat flux. Tibetan Plateau, atmospheric stability, flux parameterization, heat flux trend Citation: Yang K, Guo X F, Wu B Y. Recent trends in surface sensible heat flux on the Tibetan Plateau. Sci China Earth Sci, 2011, 54: 19–28, doi: 10.1007/s11430-010-4036-6 The Tibetan Plateau (TP) provides a huge heat source to the atmosphere, compared with other regions at similar Northern Hemisphere latitudes [1, 2]. This heat source enhances the Asian Monsoon and further influences precipitation in China [3–10]. Surface sensible heat flux is a major component of the heat source, and its estimation has been addressed exten- sively over the last three decades. In parallel with global warming, temperature has increased more rapidly over the TP than in surrounding regions [11, 12], and wind speed has slowed significantly. How water and energy cycles and the Asian monsoon are changing is an important issue to be clarified. Recently, Duan and Wu [13] concluded that the sensible heat flux on the TP has been weakening. In their study, an empirical method was applied to calculate heat flux, without accounting for atmospheric stability effects on the heat transfer coefficient. It is thus worth clarifying the reliability of and uncertainties in their conclusions. Based on micro-meteorological theory, this study focuses on investi- gating the limitations of conventional empirical methods and re-examining the trends in TP sensible heat flux. 1 Tibetan Plateau meteorological data and cli- mate change The data set used in this study was routine meteorological
Transcript of Recent trends in surface sensible heat flux on the Tibetan Plateau

SCIENCE CHINA Earth Sciences
© Science China Press and Springer-Verlag Berlin Heidelberg 2010 earth.scichina.com www.springerlink.com
*Corresponding author (email: [email protected])
• RESEARCH PAPER • January 2011 Vol.54 No.1: 19–28
doi: 10.1007/s11430-010-4036-6
Recent trends in surface sensible heat flux on the Tibetan Plateau
YANG Kun1*, GUO XiaoFeng1 & WU BingYi2
1 Laboratory of Tibetan Environment Changes and Land Surface Processes, Institute of Tibetan Plateau Research, Chinese Academy of Sciences, Beijing 100085, China;
2 Chinese Academy of Meteorological Sciences, China Meteorological Administration, Beijing 100081, China
Received March 18, 2010; accepted May 5, 2010; published online August 6, 2010
Over the last three decades, the Tibetan Plateau has exhibited a significant increase in air temperature and a significant de-crease in wind speed. How the surface heat source has changed is an important issue in monsoon research. Based on routine meteorological data, this study investigates the differences between methods for estimating trends in surface sensible heat flux on the Tibetan Plateau for the period 1984–2006. One is a physical method based on micro-meteorological theory and experi-ments, and takes into account both atmospheric stability and thermal roughness length. The other approach includes conven-tional empirical methods that assume the heat transfer coefficient is a constant value or a simple function of wind speed. The latter method is used widely in climatologic studies. Results from the physical method show that annual mean sensible heat flux has weakened by 2% per decade, and flux seasonal mean has weakened by ~2%–4% except in winter. The two commonly used empirical methods showed high uncertainties in heat flux trend estimates, although they produced similar climatologies. Annual mean heat flux has weakened by 7% per decade when a fixed transfer coefficient is used, whereas the trend is negligi-ble when the transfer coefficient is assumed a function of wind speed. Conventional empirical methods may therefore misrep-resent the trend in sensible heat flux.
Tibetan Plateau, atmospheric stability, flux parameterization, heat flux trend
Citation: Yang K, Guo X F, Wu B Y. Recent trends in surface sensible heat flux on the Tibetan Plateau. Sci China Earth Sci, 2011, 54: 19–28, doi: 10.1007/s11430-010-4036-6
The Tibetan Plateau (TP) provides a huge heat source to the atmosphere, compared with other regions at similar Northern Hemisphere latitudes [1, 2]. This heat source enhances the Asian Monsoon and further influences precipitation in China [3–10]. Surface sensible heat flux is a major component of the heat source, and its estimation has been addressed exten-sively over the last three decades. In parallel with global warming, temperature has increased more rapidly over the TP than in surrounding regions [11, 12], and wind speed has slowed significantly. How water and energy cycles and the Asian monsoon are changing is an important issue to be clarified. Recently, Duan and Wu [13] concluded that the
sensible heat flux on the TP has been weakening. In their study, an empirical method was applied to calculate heat flux, without accounting for atmospheric stability effects on the heat transfer coefficient. It is thus worth clarifying the reliability of and uncertainties in their conclusions. Based on micro-meteorological theory, this study focuses on investi-gating the limitations of conventional empirical methods and re-examining the trends in TP sensible heat flux.
1 Tibetan Plateau meteorological data and cli-mate change
The data set used in this study was routine meteorological

20 Yang K, et al. Sci China Earth Sci January (2011) Vol.54 No.1
data published by the China Meteorological Administration (CMA). Figure 1 shows the meteorological station distribu-tion on the TP. These stations were established in different years, and some measurements were missing or not avail-able in the earlier periods. According to our statistics, 21 stations have “good” data records (defined as data records that are available for >300 days in every year) in the period 1961–2006, but the number increases to 78 in the period 1984–2006. To obtain representative results, this study ana-lyzed the period 1984–2006. Precipitation over the TP in-creases considerably from west to east (Figure 1), therefore several climate zones were analyzed: dry western TP or W-TP (west of 85°E), transitional central TP or C-TP (85°E–95°E), and wet eastern TP or E-TP (east of 95°E). We analyzed heat flux separately for the three sub-regions.
The surface sensible heat flux depends on wind speed and ground-air temperature differences. In general, the flux increases with increase of both wind speed and ground-air temperature gradient. In the period 1984–2006, wind speed
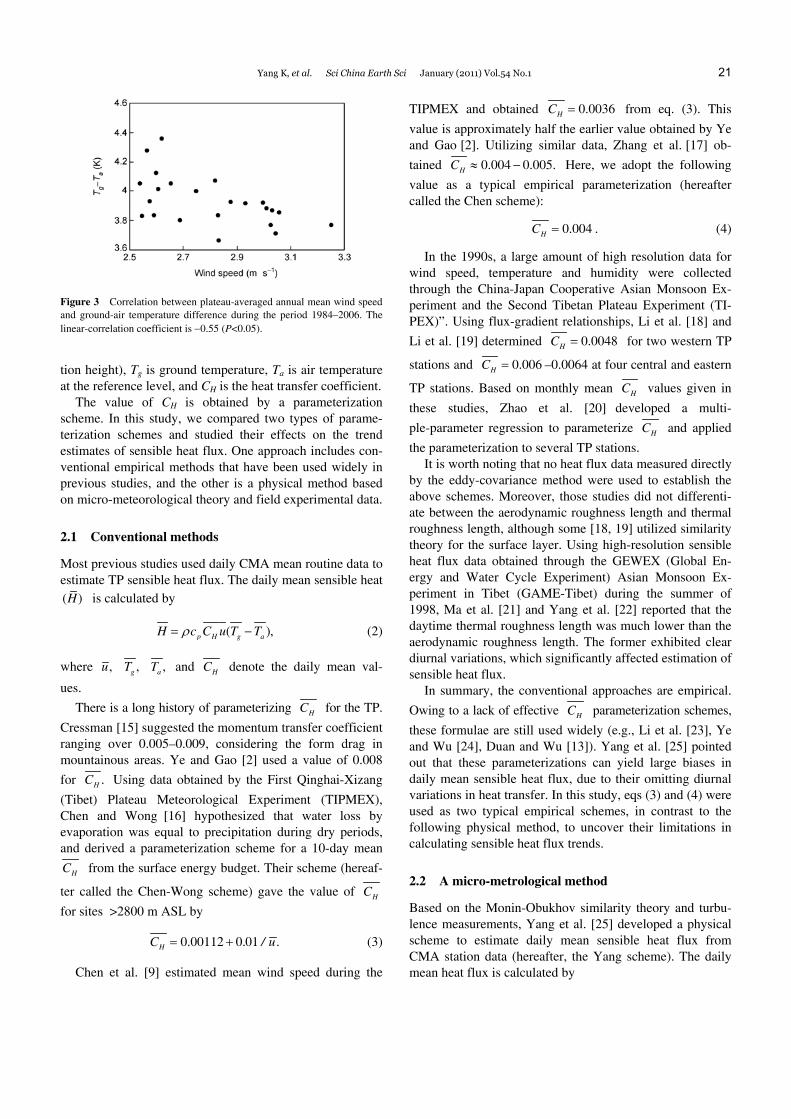
over the three sub-regions decreased significantly while ground-air temperature difference tended to increase (Figure 2). There was a negative correlation between plateau-aver- aged annual mean wind speed and annual mean ground-air temperature difference (Figure 3). Therefore, the trend in sensible heat flux is not distinguished readily. In this study, we focused on how the TP heat flux changed with changing climate.
2 Methods of sensible heat flux estimation
Given the wind speed and ground-air temperature difference, sensible heat flux can be calculated by
( ),p H g aH c C u T Tρ= − (1)
where ρ is air density, cp is the specific heat at a constant pressure, u is the wind speed at a reference level (observa-
Figure 1 Locations and elevations of China Meteorological Administration stations on the Tibetan Plateau. The annual mean precipitation contours (mm) during the period 1984–2006 have been corrected by Ye et al. [14] to account for measurement errors.
Figure 2 Trends in (a) annual mean wind speed and (b) annual mean ground-air temperature difference during the period 1984–2006 at China Meteoro-logical Administration stations in the western, central, and eastern areas of the Tibetan Plateau.
Yang K, et al. Sci China Earth Sci January (2011) Vol.54 No.1 21
Figure 3 Correlation between plateau-averaged annual mean wind speed and ground-air temperature difference during the period 1984–2006. The linear-correlation coefficient is −0.55 (P<0.05).
tion height), Tg is ground temperature, Ta is air temperature at the reference level, and CH is the heat transfer coefficient.
The value of CH is obtained by a parameterization scheme. In this study, we compared two types of parame-terization schemes and studied their effects on the trend estimates of sensible heat flux. One approach includes con-ventional empirical methods that have been used widely in previous studies, and the other is a physical method based on micro-meteorological theory and field experimental data.
2.1 Conventional methods
Most previous studies used daily CMA mean routine data to estimate TP sensible heat flux. The daily mean sensible heat ( )H is calculated by
( ),p H g aH c C u T Tρ= − (2)
where ,u ,gT ,aT and HC denote the daily mean val-
ues.
There is a long history of parameterizing HC for the TP.
Cressman [15] suggested the momentum transfer coefficient ranging over 0.005–0.009, considering the form drag in mountainous areas. Ye and Gao [2] used a value of 0.008
for .HC Using data obtained by the First Qinghai-Xizang
(Tibet) Plateau Meteorological Experiment (TIPMEX), Chen and Wong [16] hypothesized that water loss by evaporation was equal to precipitation during dry periods, and derived a parameterization scheme for a 10-day mean
HC from the surface energy budget. Their scheme (hereaf-
ter called the Chen-Wong scheme) gave the value of HC
for sites >2800 m ASL by
0.00112 0.01 .HC / u= + (3)
Chen et al. [9] estimated mean wind speed during the
TIPMEX and obtained 0.0036HC = from eq. (3). This
value is approximately half the earlier value obtained by Ye and Gao [2]. Utilizing similar data, Zhang et al. [17] ob-
tained 0.004 0.005.HC ≈ − Here, we adopt the following
value as a typical empirical parameterization (hereafter called the Chen scheme):
0.004HC = . (4)
In the 1990s, a large amount of high resolution data for wind speed, temperature and humidity were collected through the China-Japan Cooperative Asian Monsoon Ex-periment and the Second Tibetan Plateau Experiment (TI-PEX)”. Using flux-gradient relationships, Li et al. [18] and
Li et al. [19] determined 0.0048HC = for two western TP
stations and 0.006HC = –0.0064 at four central and eastern
TP stations. Based on monthly mean HC values given in
these studies, Zhao et al. [20] developed a multi-
ple-parameter regression to parameterize HC and applied
the parameterization to several TP stations. It is worth noting that no heat flux data measured directly
by the eddy-covariance method were used to establish the above schemes. Moreover, those studies did not differenti-ate between the aerodynamic roughness length and thermal roughness length, although some [18, 19] utilized similarity theory for the surface layer. Using high-resolution sensible heat flux data obtained through the GEWEX (Global En-ergy and Water Cycle Experiment) Asian Monsoon Ex-periment in Tibet (GAME-Tibet) during the summer of 1998, Ma et al. [21] and Yang et al. [22] reported that the daytime thermal roughness length was much lower than the aerodynamic roughness length. The former exhibited clear diurnal variations, which significantly affected estimation of sensible heat flux.
In summary, the conventional approaches are empirical.
Owing to a lack of effective HC parameterization schemes,
these formulae are still used widely (e.g., Li et al. [23], Ye and Wu [24], Duan and Wu [13]). Yang et al. [25] pointed out that these parameterizations can yield large biases in daily mean sensible heat flux, due to their omitting diurnal variations in heat transfer. In this study, eqs (3) and (4) were used as two typical empirical schemes, in contrast to the following physical method, to uncover their limitations in calculating sensible heat flux trends.
2.2 A micro-metrological method
Based on the Monin-Obukhov similarity theory and turbu-lence measurements, Yang et al. [25] developed a physical scheme to estimate daily mean sensible heat flux from CMA station data (hereafter, the Yang scheme). The daily mean heat flux is calculated by

22 Yang K, et al. Sci China Earth Sci January (2011) Vol.54 No.1
( )p H g aH c C u T Tρ= − . (5)
In this equation, both wind speed and ground-air tempera-ture difference data have a resolution of 30 min, obtained by statistical downscaling from original CMA data (see section 2.2.2). Accordingly, CH is the heat transfer coefficient esti-mated from the high-resolution downscaled data, and can account for diurnal variation effects of both atmospheric stability and thermal roughness length. The daily mean heat flux is then obtained by averaging 48 half-hourly estimates in each day. As Yang et al. [25] presented the method de-velopment in detail, only the most relevant formulae from their work are presented here for readers’ convenience.
2.2.1 Parameterization of CH
Given meteorological parameters, aerodynamic roughness length (z0m), and thermal roughness length (z0h), the heat transfer coefficient (CH) is calculated by
12
0
0 0
1
0
0
ln ,
ln , ,
m m mH m
m
h h hh
h
z z zkC
Pr z L L
z z z
z L L
ψ
ψ
−
−
⎡ ⎤⎛ ⎞ ⎛ ⎞= −⎢ ⎥⎜ ⎟ ⎜ ⎟⎝ ⎠⎢ ⎥⎝ ⎠⎣ ⎦
⎡ ⎤⎛ ⎞ ⎛ ⎞× −⎢ ⎥⎜ ⎟ ⎜ ⎟⎝ ⎠⎢ ⎥⎝ ⎠⎣ ⎦
(6)
where k is the von Karman constant (0.4), Pr0 is the Prandtl number (=1 if z/L≥0; =0.95 if z/L<0), 3
* / [ ( /L u k g≡ −
)( / )]a pT H cρ is the Obukhov length with g=9.81 m s−2, zm
and zh are the measurement levels (observation heights) for wind velocity and air temperature respectively, and ψm and ψh are the integrated stability correction terms for wind and temperature profiles respectively.
Following the mathematical forms in Paulson [26] and the universal functions in Högström [27], the stability cor-rection terms for a stable surface layer are
00, 5.3( ) / ,m m
m m m
z zz z L
L Lψ ⎛ ⎞ = − −⎜ ⎟
⎝ ⎠ (7a)
00, 8.0( ) / .h h
h h h
z zz z L
L Lψ ⎛ ⎞ = − −⎜ ⎟
⎝ ⎠ (7b)
For an unstable surface layer, the stability correction terms are
0
0
21 1
020
1, 2 ln
1
1 ln 2 tan 2 tan ,
1
m mm
z z x
L L x
xx x
x
ψ
− −
⎛ ⎞+⎛ ⎞ = ⎜ ⎟⎜ ⎟ +⎝ ⎠ ⎝ ⎠⎛ ⎞+
+ − +⎜ ⎟+⎝ ⎠
(8a)
0
0
1, 2 ln ,
1h h
h
z z y
L L yψ
⎛ ⎞+⎛ ⎞ = ⎜ ⎟⎜ ⎟ +⎝ ⎠ ⎝ ⎠ (8b)
where 1/ 4(1 19 / ) ,mx z L= − 1/40 0(1 19 / ) ,mx z L= − (1y = −
1/211.6 / )hz L , and 1/20 0(1 11.6 / )hy z L= − .
Recent field studies have shown that the aerodynamic roughness length (z0m) varies between 1 and 10 mm on TP bare-soil and low-vegetation surfaces. In this study, its logarithmic average value (~3 mm) was adopted in the fol-lowing calculations. The thermal roughness length (z0h) at the TP sites exhibits significant diurnal variations [21, 22]. These diurnal variations are greater than those observed over lowland areas [28] and must be accounted for in calcu-lating the sensible heat flux. Yang et al. [28] recommended the following parameterization for z0h:
1/41/2
0 * **
70exp( )hz u T
u
ν β= − , (9)
where the fluid kinematical viscosity (ν) is equal to 1.754
5 0
0
1.328 10p T
p T− ⎛ ⎞⎛ ⎞
× ⎜ ⎟⎜ ⎟⎝ ⎠⎝ ⎠
with p0=1.013×10⁵ Pa, T0=
273.15 K, p (Pa) is surface pressure, T (K) is air temperature, β=7.2 s1/2 m−1/2 K−1/4 is an empirical constant, u* is the fric-tional velocity, and T* is the temperature scale defined by
* */ pT H c uρ≡ − .
The calculation of z0h in eq. (9) uses T*, which in turn depends on H. Because of this complexity, the solution of sensible heat flux involves an iterative algorithm:
(1) Assume z0h = z0m; (2) Given z0m, z0h, zm, zh, Ta, Tg, and u, the Obukhov
length L is derived from:
( )( )
0 0
0
2
0
0
0
20
ln ,
ln ,
.
m m h h hh
h
m m mm
m
m m a g
a
z z z z z
L L z L L
z z z
z L L
g z z T T
u T Pr
ψ
ψ
⎡ ⎤⎛ ⎞⎛ ⎞ ⎛ ⎞− −⎢ ⎥⎜ ⎟⎜ ⎟ ⎜ ⎟⎝ ⎠ ⎝ ⎠⎝ ⎠⎣ ⎦
⎡ ⎤⎛ ⎞ ⎛ ⎞−⎢ ⎥⎜ ⎟ ⎜ ⎟⎝ ⎠⎝ ⎠⎣ ⎦
− −=
(10)
The derivation of eq. (10) stems from the equations gov-erning wind speed and temperature profiles, ψm and ψh are given by eqs. (7) and (8), and L is the only unknown. The analytical solution of eq. (10) can be found in Yang et al. [29];
(3) Calculate CH by eq. (6), and then H by eq. (1); (4) Calculate u* by 3
* / [ ( / )( / )]a pL u k g T H cρ≡ − and T*
by * */ pT H c uρ≡ − ;
(5) Calculate z0h by eq. (9); (6) Go to step (2) until the solution of H is converged. This algorithm is efficient since H converges after three
iterations.

Yang K, et al. Sci China Earth Sci January (2011) Vol.54 No.1 23
2.2.2 Downscaling meteorological data
Because of diurnal variations in heat transfer, meteorologi-cal data with high temporal resolution are required to calcu-late daily mean heat flux. Based on high-resolution experi-mental data obtained from the TP, Yang et al. [25] devel-oped a statistical downscaling approach for individual me-teorological parameters. CMA data relevant to calculating heat flux consist of: 1) 6-hourly (02, 08, 14, 20 Beijing Standard Time (BST). BST=UTC+8) ground temperature, air temperature, wind speed, and pressure; 2) daily mini-mum, maximum, and mean air temperature; and 3) 10-min maximum wind speed. The pressure value in eq. (5) was interpolated linearly from the 6-hourly observations, as its diurnal variation does not affect significantly the accuracy of sensible heat flux estimation. However, it is crucial to disaggregate the observed air temperature, ground tempera-ture, and wind speed to obtain their diurnal variations.
The temporal downscaling of air temperature needs in-puts of daily mean, maximum and minimum air temperature observations. Based on statistics of high-resolution data, the occurrence times of these values on the TP were estimated below (unit: local solar hours):
,min rise0.842 0.71,at t= + (11a)
,max 14.59,at = (11b)
,am 8.4,at = (11c)
,pm 19.7,at = (11d)
where trise is sunrise time, ta,min and ta,max are the times for occurrence of minimum air temperature (Ta,min) and maxi-mum air temperature (Ta,max), respectively, ta,am and ta,pm are the times when daily mean temperature occurs in the morn-ing and in the afternoon, respectively.
Considering the rapid warming and slow cooling of air temperature in a diurnal cycle, we separated the down-scaling into two phases.
During the warming period (from Ta,min to Ta,max), the air temperature was described with respect to time by
2 3, 0 1 2 3 ,a i i i iT a a t a t a t= + + + (12)
where a0−a3 are coefficients to be determined, and Ta,i is air temperature at the ith local solar hour.
The coefficients a0−a3 are determined by eqs. (11a)–(11c) combined with the following condition for the temporal derivative of eq. (12) at ta,max:
21 2 ,max 3 ,max2 3 0a aa a t a t+ + = . (13)
During the cooling phase (from Ta,max to Ta,min), we assume Ta,i meets
2, 0 1 2 ,max/ [1 ( ) ]a i i aT b b b t t= + + − , (14)
where coefficients b0−b2 are determined by eqs. (11a), (11b) and (11d). Note that eq. (14) satisfies naturally the deriva-tion of eq. (14) being equal to zero at ta,max.
Downscaling of ground temperature also used the 6-hourly observations. Data indicated that minimum ground temperature (Tg,min) occurs usually in early morning and maximum (Tg,max) occurs near noon. Their corresponding times are described by
,min rise0.885 0.35,gt t= + (15a)
,max 12.2gt = . (15b)
Although Tg,min and Tg,max are not available in the CMA data, their corresponding times tg,min and tg,max in Tibet were coincidentally close to observation times (08 BST and 14 BST). Thus Tg,min was interpolated linearly from observa-tions at 08BST and 14 BST. Tg,max was interpolated by a quadratic equation which intersects data at 08 BST and 14 BST and satisfies the condition that the derivative at tg,max is equal to zero. The diurnal variation in ground temperature was interpolated by a cubic-spline curve intersecting six points: four 6-hourly values, maximum value, and minimum value.
Downscaling of wind speed used the 6-hourly values and the maximum value. Data showed that maximum wind speed occurs usually at 15.5 local time. Similarly, diurnal variation in wind speed was interpolated by a cubic-spline curve which intersects five points: four 6-hourly values and 10-min mean maximum data.
In summary, the physical method presented by Yang et al. [28] accounted for diurnal variations in heat transfer proc-esses. First, coarse-resolution CMA observations were dis-aggregated statistically into high-resolution data to model diurnal variations in input meteorological parameters. The heat transfer coefficient was then obtained considering di-urnal variations in atmospheric stability and thermal rough-ness length. Finally, heat flux was estimated for each 30-min, and daily mean flux obtained through eq. (5). This method is justified in Yang et al. [25]. In this study, it was used as a baseline to estimate trends in sensible heat flux on the TP and to further investigate the errors of previous esti-mates.
3 Results
Figure 4 shows the climatology of sensible heat flux in the western, central and eastern sub-regions (W-TP, C-TP and E-TP, respectively) and the entire TP. Values in each sub-region are averaged over all stations in that sub-region, and values for the entire TP are the average of the three sub-regions. As expected, all three schemes show that sen-sible heat flux in W-TP (in summer and pre-monsoon sea-son) is higher than that in E-TP (in winter and monsoon

24 Yang K, et al. Sci China Earth Sci January (2011) Vol.54 No.1
Figure 4 Climatology of monthly mean sensible heat fluxes during the period 1984–2006 at China Meteorological Administration stations in the western (a), central (b), and eastern (c) areas of the Tibetan Plateau, and their overall average (d). Sensible heat flux is estimated using the Chen, Chen-Wong and Yang schemes.
season). In all regions, the Yang scheme yields heat fluxes different from previous schemes. In particular, the Yang scheme flux is higher than that given by previous schemes, because it considers diurnal variations of heat transfer effi-ciency. Turbulent exchange is strong during the day and weak at night, with heat transfer from the ground to the at-mosphere during the day being much higher than that from the atmosphere to the ground at night. This leads generally to daily net heat flux being upward even in winter, as ob-served by Ma et al. [30].
Nevertheless, attention needs to be paid to inherent errors related to the observation approach at CMA stations, and these errors cannot be eliminated by any flux parameteriza-tion scheme. First, CMA stations are distributed irregularly on the TP; there are many more stations on the C-TP and E-TP than on the W-TP. There are more stations located at low elevations than high elevations, and no station is lo-cated above 4800 m ASL. Second, the CMA ground tem-perature is basically a parameter for bare soil surfaces. At vegetated C-TP and E-TP sites, the measured temperature does not represent actual conditions, and the use of this measurement leads to over-estimates of sensible heat flux. Last, some stations are covered occasionally by snow in winter, burying the thermometer. Due to adiabatic effects of the snow cover, the measured ground temperature can be higher than the true surface temperature, resulting in an es-timate of sensible heat flux higher than its true value. Heat flux calculated by these schemes therefore cannot be deemed the true heat flux value on the TP. Nevertheless, the trend in observed ground temperature, air temperature, and wind speed should be plausible, and we assumed that the above-mentioned errors do not systematically change the sensible heat flux trend. In the following, we investigate
trends given by the three schemes. Figure 5(a)–(d) shows annual mean sensible heat flux
values in the three sub-regions and the entire TP. Table 1 shows the linear trends of sensible heat flux and the corre-sponding coefficients of determination. The Chen scheme, which was used in Duan and Wu [13], produces very strong weakening trends, ranging roughly over 5%–10% per dec-ade in the individual sub-regions. The trend for the entire TP is ~7%. The Chen-Wong scheme does not explicitly take into account atmospheric stability. Although the effect of wind speed was included in the parameterization of the heat transfer coefficient, it is still an empirical scheme. This scheme yields a weak decreasing trend of sensible heat flux in C-TP, and a slight increasing trend in other regions. No trends given by this scheme passed the significance test at P<0.05. The trends of sensible heat flux from the two em-pirical schemes are the converse of each other, and the un-certainties are large. The Yang scheme shows a trend simi-lar to that given by the Chen scheme (i.e., the result of Duan and Wu [13]), but the magnitude is much weaker than the latter. The weakening trend given by the Yang scheme ranges from 1% to 3% per decade for individual sub-regions. The trends in both C-TP and E-TP are higher than that in W-TP, and the TP-averaged trend is ~2%. As the Yang scheme has a better theoretical basis, and is also validated by experimental data, it should have produced a more reli-able trend than empirical schemes.
Figure 6 shows the TP-averaged sensible heat flux values in each season. Table 2 shows the linear trends of sensible heat flux and the corresponding coefficients of determina-tion. Significant decreasing trends in heat flux using a 3-year running average are observed in all seasons except in winter (DJF), when a very weak increasing trend is seen.

Yang K, et al. Sci China Earth Sci January (2011) Vol.54 No.1 25
Figure 5 Trends in annual mean sensible heat fluxes during the period 1984–2006 at China Meteorological Administration stations in the western (a), central (b), and eastern (c) areas of the Tibetan Plateau, and their average (d) estimated using the Chen, Chen-Wong and Yang schemes. All trends are de-rived from linear least-squares regressions.
Table 1 Linear trends of annual mean sensible heat fluxes in three sub-regions of the Tibetan Plateau, using the Chen, Chen-Wong and Yang schemes during the period 1984–2006a)
Chen Chen-Wong Yang
Zone Trend (W m−2)
Trend (%)
R2 Trend
(W m−2) Trend (%)
R2 Trend
(W m−2) Trend (%)
R2
Western −2.7 −5.5 0.22 0.6 1.2 0.11 −0.8 −1.2 0.04
Central −3.5 −9.5 0.74 −0.4 −1.0 0.19 −1.6 −2.8 0.44 Eastern −1.3 −5.5 0.25 0.8 2.4 0.29 −1.1 −2.5 0.21 Average −2.5 −6.9 0.57 0.3 0.7 0.15 −1.1 −2.0 0.33
a) Numbers in bold denote significant linear regressions passing student’s t-test at the level of P<0.05. The trends are denoted by W m−2 and % per dec-ade. R2 is the coefficient of determination. The same bellow.
The trend in spring (MAM, i.e., pre-monsoon period) is ~−2% per decade. It is in summer (JJA, i.e., monsoon pe-riod) that the trend is most notable, ~−4% per decade. The trend in autumn (SON) is comparably strong, ~−3% per decade.
4 Discussion
Why did the different schemes produce different sensible
heat flux trends? The climatologic values from the Chen and Chen-Wong schemes are similar, but the trends given by the two schemes are exactly opposite. The following investigates the causes of such differences.
Eq. (1) is a direct application of the Monin-Obukhov similarity theory [31]. This theory can be applied only to a horizontal steady and homogenous flow [32]. This prereq-uisite can be satisfied roughly for a short time scale (e.g., 30 min), and the heat transfer coefficient CH can be deemed a constant. This coefficient depends on atmospheric stability,

26 Yang K, et al. Sci China Earth Sci January (2011) Vol.54 No.1
Figure 6 Trends in seasonal mean sensible heat fluxes estimated by the Yang scheme during the period 1984–2006 for the entire Tibetan Plateau. Thick lines show the seasonal average in a single year, and thin lines de-note the seasonal 3-year average.
Table 2 Linear trends of plateau-averaged seasonal mean sensible heat fluxes based on the physical Yang schemea)
Trend
(W m−2) Trend (%)
R12 R3
2
Spring −1.3 −1.8 0.14 0.38
Summer −2.6 −4.1 0.34 0.67
Autumn −1.5 −3.2 0.27 0.72
Winter 0.5 1.3 0.05 0.15
a) R12 and R3
2 are the coefficient of determination of the linear trend for the annual average and the 3-year average, respectively.
as indicated in eq. (6). The atmospheric stability is in turn determined by wind speed and ground-air temperature dif-ference. The lower the wind speed and larger the ground-air temperature difference, the more unstable is the atmosphere and larger the CH value.
The Chen scheme assumes the heat transfer coefficient is a constant value, and the heat flux trend is simply a result of wind speed multiplied by the ground-air temperature dif-ference. Because wind speed has changed more signifi-cantly than ground-air temperature difference in the last three decades, Duan and Wu [13] concluded that decreasing wind speed is the major cause of the weakening sensible heat flux. However, the decrease in wind speed and the in-crease in ground-air temperature difference may moderate the trend of the heat transfer coefficient. Figure 7 shows that the bulk Richardson number in each season has decreased significantly over the Tibetan Plateau, i.e., atmospheric instability in the surface layer has been enhanced. Because the heat transfer coefficient depends on stability and the two roughness lengths (see eq. (6)), the decrease in Richardson number must have resulted in an increase in heat transfer
Figure 7 Trends in Richardson number (RiB) calculated from pla-teau-averaged annual mean ground-air temperature difference and wind speed during the period 1984–2006. Note RiB values are negative.
coefficient, given negligible variations in surface roughness lengths. This increase in heat transfer coefficient to some extent retarded the effects of weakening wind speed on the sensible heat flux trend. Duan and Wu [13] applied the Chen scheme and thus omitted this effect, resulting in an excessively weakening trend in sensible heat flux.
The Chen-Wong scheme considered the effect of wind speed on heat transfer, but their formulation is not based on the fundamental micro-meteorological theory, resulting in the heat transfer coefficient being overly dependent on wind speed. When wind speed decreases, the heat transfer coeffi-cient increases so rapidly that sensible heat flux barely de-creases or even increases. In the Yang scheme, CH is deter-mined from micro-meteorological theory and experimental analysis.
To further clarify differences between the three schemes, we discuss the concept of heat transfer resistance. This re-sistance is defined as
1 /H Hr C u= . (16)
Eq. (1) for sensible heat flux is transformed to
( ) /p g a HH c T T rρ= − . (17)
Figures 8(a)–(c) show variations in heat transfer coeffi-cient, resistance and heat flux with respect to wind speed using the three schemes. The computational conditions are: ground temperature is 300 K, air temperature is 290 K, air pressure is 580 hPa, the reference level for wind speed and air is 2 m, and the aerodynamic roughness length is 3 mm. As indicated in Figure 8, CH given by the Chen-Wong scheme increases most rapidly with weakening wind speed, leading to the smallest increase in resistance and the small-

Yang K, et al. Sci China Earth Sci January (2011) Vol.54 No.1 27
Figure 8 Dependence of (a) heat transfer coefficient, (b) heat transfer resistance and (c) sensible heat fluxes on wind speed using the Chen, Chen-Wong and Yang schemes. Given conditions: Tg=300 K, Ta=290 K, P=580 hPa, zm=zh=2 m, z0m=3 mm.
est decrease in heat flux with respect to weakening wind speed. In contrast, CH given by the Chen scheme does not vary with respect to wind speed, resulting in the most rapid increase in resistance and most rapid decrease in heat flux with respect to weakening wind speed. According to the Yang scheme, the change in CH and resistance lies between the two empirical schemes. Consequently, the heat flux de-pendence on wind speed given by the Yang scheme lies between the two empirical schemes, as shown in Figure 8(c).
5 Concluding remarks
In the last three decades, the TP experienced rapid warming which has resulted in severe consequences for the TP’s cryosphere and hydrosphere. As one of the major drivers of the Asian monsoon, how the heat source intensity has been changing is a key focus of monsoon studies. The recent study by Duan and Wu [13] reported that sensible heat flux
has been weakening significantly. This study confirms this conclusion. However, we found that the weakening trend is ~2% per decade, which is only one third of Duan and Wu’s estimate [13]. Their over-estimate of the trend is due to the assumption that the heat transfer coefficient is a constant, but instead it is altered considerably by atmospheric stabil-ity. In reality, the weakening of wind speed over the TP tends to increase heat transfer resistance, but both the weakening of wind speed and the increasing of ground-air temperature difference weaken atmospheric stability, which in turn tends to reduce the resistance. The latter effect would partially cancel out the former. The Yang scheme used in this study is based on micro-meteorological theory and experimental data, and thus is able to account physi-cally for their inter-dependence and to produce more realistic results.
Finally, this study demonstrates that an empirical scheme, although widely used to date, may lead to significant biases (even opposite results) and uncertainties in climate change studies. This further highlights the importance of field work and experimental data analysis. In particular, the develop-ment of reliable parameterizations may effectively reduce possible uncertainties in climate change research.
China Meteorological Administration Meteorological Information Center kindly provided the station data used in this paper. Dr. Xiaofeng Guo gratefully acknowledges the support of the K. C. Wong Education Founda-tion, Hong Kong. This work was supported by National Natural Science Foundation of China (Grant Nos. 40875009, 40810059006), Key Innova-tion Project of Chinese Academy of Sciences (Grant No. KZCX2-YW- Q11-01) and “100-Talent” Program of Chinese Academy of Sciences.
1 Flohn H. Large-scale aspects of the “summer monsoon” in south and east Asia. J Meteorol Soc Jpn, 1957, 35: 180–186
2 Ye D, Gao Y. The Meteorology of the Qinghai-Xizang (Tibet) Pla-teau (in Chinese), Beijing, Science Press, 1979. 278
3 He H, McGinnis J W, Song Z, et al. Onset of the Asian summer mon-soon in 1979 and the effect of Tibetan Plateau. Mon Weather Rev, 1987, 115: 1966–1994
4 Yanai M, Li C, Song Z. Seasonal heating of the Tibetan Plateau and its effects on the evolution of the Asian summer monsoon. J Meteor Soc Jpn, 1992, 70: 319–351
5 Wu G X, Zhang Y S. Tibetan Plateau forcing and timing of the mon-soon onset over South Asia and South China Sea. Mon Weather Rev, 1998, 126: 913–927
6 Zhao P, Chen L. Climate features of atmospheric heat source/sink over the Qinghai-Xizang Plateau in 35 years and its relation to rain-fall in China. Sci China Ser D-Earth Sci, 2001, 44: 858–864
7 Qian Y, Zhang Y, Huang Y, et al. The effects of the thermal anoma-lies over the Tibetan Plateau and its vicinities on climate variability in China. Adv Atmos Sci, 2004, 21: 369–381
8 Duan A, Liu Y, Wu G. Heating status of the Tibetan Plateau from April to June and rainfall and atmospheric circulation anomaly over East Asia in midsummer. Sci China Ser D-Earth Sci, 2005, 48: 250–257
9 Chen L, Reiter E R, Feng Z. The atmospheric heat source over the Tibetan Plateau: May-August 1979. Mon Weather Rev, 1985, 113: 1771–1790
10 Feng Z, Reiter R E, Chen L. The atmospheric heat budget over the western part of the Tibetan Plateau during MONEX, 1979. Adv At-mos Sci, 1985, 2: 454–468
11 Liu X D, Chen B D. Climatic warming in the Tibetan Plateau during

28 Yang K, et al. Sci China Earth Sci January (2011) Vol.54 No.1
recent decades. Int J Climatol, 2000, 20: 1729–1742 12 Qin J, Yang K, Liang S L, et al. The altitudinal dependence of recent
rapid warming over the Tibetan Plateau. Clim Change, 2009, 97: 321–327
13 Duan A, Wu G. Weakening trend in the atmospheric heat source over the Tibetan Plateau during recent decades. Part I: Observations. J Clim, 2008, 21: 3149–3164
14 Ye B, Yang D, Ding Y, et al. A bias-corrected precipitation clima-tology for China. J Hydrometeorol, 2004, 5: 1147–1160
15 Cressman G P. Improved terrain effects in barotropic forecasts. Mon Weather Rev, 1960, 88: 327–342
16 Chen W, Wong D. A preliminary study on the computational method of 10-day mean sensible heat and latent heat on the Tibetan Plateau. Collected works of the Qinghai-Xizang Plateau Meteorological Ex-periment (Series 2) (in Chinese). Beijing: Science Press, 1984. 35–45
17 Zhang J, Zhu B, Zhu F, et al. Advances in the Qinghai-Xizang Pla-teau Meteorology––The Qinghai-Xizang Plateau Meteorological Ex-periment (1979) and Research (in Chinese). Beijing: Science Press, 1988. 262
18 Li G, Duan T, Gong Y. The bulk transfer coefficients and surface fluxes on the western Tibetan Plateau. Chin Sci Bull, 2000, 45: 1221–1226
19 Li G, Duan T, Gong Y, et al. Estimates of the bulk transfer coeffi-cients and surface fluxes over the Tibetan Plateau using AWS data. J Meteorol Soc Jpn, 2001, 79: 625–635
20 Zhao P, Chen L. Study on climatic features of surface turbulent heat exchange coefficients and surface thermal sources over the Qing-hai-Xizang Plateau. Acta Meteorol Sin, 2000, 14: 13–29
21 Ma Y, Tsukamoto O, Wang J, et al. Analysis of aerodynamic and thermodynamic parameters on the grassy marshland surface of Ti-
betan Plateau. Prog Nat Sci, 2002, 12: 36–40 22 Yang K, Koike T, Yang D. Surface flux parameterization in the Ti-
betan Plateau. Bound-Layer Meteor, 2003, 116: 245– 262 23 Li D, Zhang J, Wu H. A diagnostic study on surface sensible heat
flux anomaly in summer over the Qinghai-Xizang Plateau (in Chinese). Plateau Meteorol, 1997, 16: 367–375
24 Ye D Z, Wu G X. The role of the heat source of the Tibetan Plateau in the general circulation. Meteorol Atmos Phys, 1998, 67: 181–198
25 Yang K, Qin J, Guo X F, et al. Method development for estimating sensible heat flux over the Tibetan Plateau from CMA data. J Appl Meteorol Clim, 2009, 48: 2474–2486
26 Paulson C A. The mathematical representation of wind speed and temperature profiles in the unstable atmospheric surface layer. J Appl Meteorol, 1970, 9: 857–861
27 Högström, U L F. Review of some basic characteristics of the at-mospheric surface layer. Bound-Layer Meteor, 1996, 78: 215–246
28 Yang K, Koike T, Ishikawa H, et al. Turbulent flux transfer over bare soil surfaces: Characteristics and parameterization. J Appl Meteorol Clim, 2008, 40: 276–290
29 Yang K, Tamai N, Koike T. Analytical solution of surface layer similarity equations. J Appl Meteorol, 2001, 40: 1647–1653
30 Ma Y, Fan S, Ishikawa H, et al. Diurnal and inter-monthly variation of land surface heat fluxes over the central Tibetan Plateau area. Theor Appl Climatol, 2005, 80: 259–273
31 Monin A S, Obukhov A M. Basic laws of turbulent mixing in the at-mosphere near the ground. Turdy Akad Nauk SSSR Geofiz Inst, 1954, 24: 163–187
32 Arya S P. Introduction to Micrometeorology. London: Academic Press, 1988. 307