
Investigation of a hybrid system of nocturnal radiative cooling and direct evaporative cooling
Journal of the Meteorological Society of Japan, Vol. 85A, pp. 295--309, 2007 295
Estimation of the Regional Evaporative Fraction over the Tibetan
Plateau Area by Using Landsat-7 ETM Data and the Field Observations
Yaoming MA
Institute of Tibetan Plateau Research, Chinese Academy of Sciences, Beijing, ChinaSchool of Geography and Remote Sensing, Beijing Normal University, Beijing, China
Cold and Arid Regions Environmental and Engineering Research Institute, Chinese Academy of Sciences,Lanzhou, China
Minhong SONG
Cold and Arid Regions Environmental and Engineering Research Institute, Chinese Academy of Sciences,Lanzhou, China
Hirohiko ISHIKAWA
Disaster Prevention Research Institute, Kyoto University, Kyoto, Japan
Kun YANG, Toshio KOIKE
Department of Civil Engineering, University of Tokyo, Tokyo, Japan
Li JIA
Alterra, Wageningen University and Research Center, Wageningen, The Netherlands
Massimo MENETI
Laboratoire des Sciences de l’Image, de l’Informatique et de la Teledetection (LSIIT), Universite Louis Pasteur,France
and
Zhongbo SU
International Institute for Geo-Information Science and Earth Observation, The Netherlands
(Manuscript received 14 February 2006, in final form 1 November 2006)
Corresponding author: Yaoming Ma, Institute ofTibetan Plateau Research, Chinese Academy ofSciences, 18 Shuangqing Road, P.O. Box 2871, Bei-jing 100085, P. R. China.Email: [email protected]( 2007, Meteorological Society of Japan
Abstract
This study proposed a parameterization methodology based on Landsat-7 ETM data and field obser-vations and tested it for deriving an evaporative fraction (EF) over a heterogeneous landscape. As a casestudy, the methodology was applied to the experimental area of CAMP/Tibet located on the central Tibe-tan Plateau. Four scenes of Landsat-7 ETM data were used in the study. Scenes of 9 June 2002 and 28August 2002 were selected as case examples of summer and autumn, respectively; the scene of 2 Decem-ber 2002 was selected as a winter case; and 24 March 2003 was selected as a spring case (or pre-monsoonperiod). To validate the proposed methodology, the Landsat-7 ETM derived EFs were compared toground-measured values in four different months that spanned a wide range of surface conditions andsurface features. This comparison revealed that the predictions were in good accordance with the groundmeasurements with absolute percent differences of less than 9.5%. It was concluded that the proposedmethodology successfully facilitates the retrieval of EF using Landsat-7 ETM data and field observationsover the study area.
1. Introduction
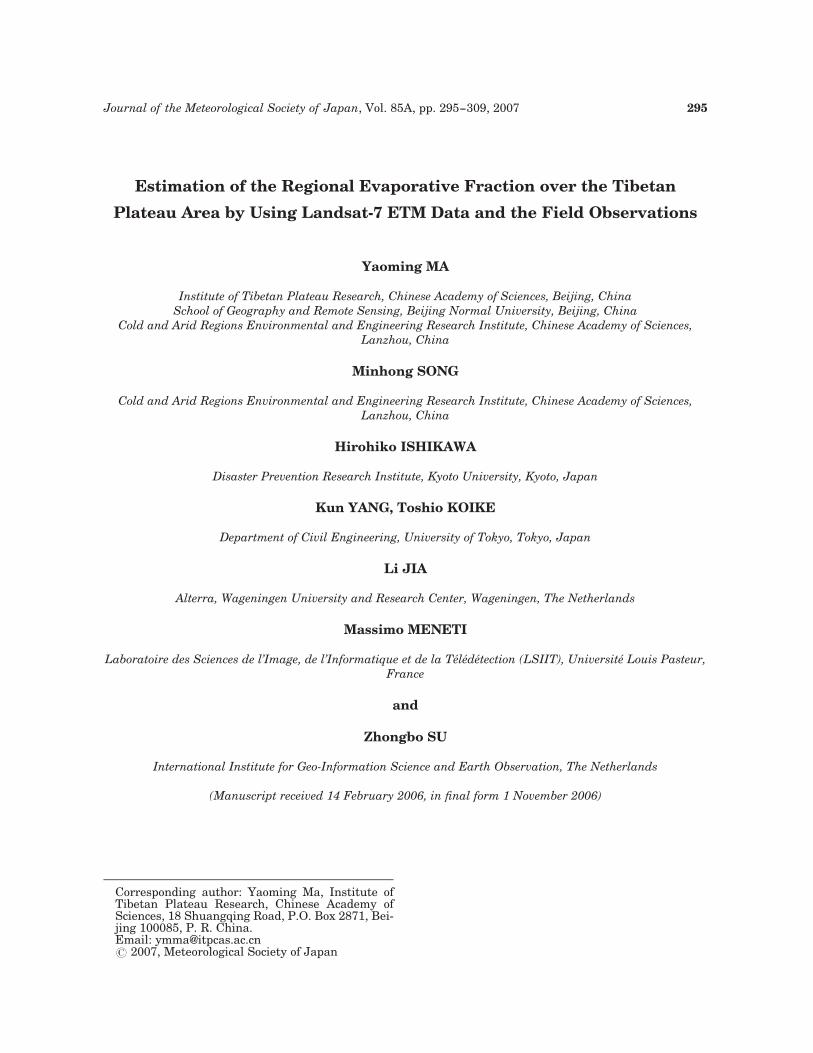
Fluxes of sensible heat and evapotranspira-tion (ET) between the land surface and atmo-sphere over the Tibetan Plateau play an impor-tant role in the Asian Monsoon system, whichin turn is a major component involved in theenergy and water cycles of the global climatesystem. The study of heat and ET fluxes be-tween the land surface and atmosphere hasthus been of paramount importance for the Co-ordinated Enhanced Observing Period (CEOP)Asia-Australia Monsoon Project (CAMP) on theTibetan Plateau (CAMP/Tibet, 2001–2005)(e.g., Ma et al. 2003a; Ma et al. 2005). This proj-ect included an intensive observation period(IOP) in addition to the longer-term observa-tion at CAMP/Tibet. The experimental region,about 150 � 250 km2, includes a variety of landsurfaces such as a large area of grassy marsh-land, some desertification grass-land areas,many small rivers and several lakes (Fig. 1).The large amount of data collected during thesecampaigns provides the best opportunity tostudy energy and water cycles over the TibetanPlateau.
Numerous studies have detailed land surfacesensible heat and ET fluxes over the CAMP/Tibet area in the past several years (e.g., Yanget al. 2002; Ma et al. 2002a; Ma et al. 2003a;Yang et al. 2003; Yang et al. 2004; Choi et al.2004; Zuo et al. 2005; Ma et al. 2005). Thesestudies were, however, at point-level or thelocal-patch-level. Since areal rather than point-wise information of land-surface atmosphereinteraction is required, the aggregation of thepoint-scale results to a regional scale is there-fore necessary.
Remote sensing from satellites however of-fers the possibility to derive regional distribu-tions of land surface heat fluxes and ET overheterogeneous land surfaces in combinationwith sparse field experimental stations. Ourpurpose in this study is to estimate the regionaldistribution of ET with the aid of high resolu-tion (30 � 30 m) Landsat-7 ETM data and in-situ data. ET from land is essential for under-standing climate dynamics and ecosystemproductivity (e.g., Churkina et al. 1999) and italso has applications in areas such as water re-source management. We will introduce ‘‘evapo-rative fraction (EF)’’ as an index for ET afterShuttleworth et al. (1989). EF is defined hereas:
L ¼ lE
H þ lE¼ lE
Rn � G0ð1Þ
Where H is the sensible heat flux, lE the latentheat flux, Rn net radiation flux and G0 the soilheat flux.
Our goal is not estimation of ET but that ofrather EF in the CAMP/Tibet area. This is dueto two reasons. First, EF is more suitable as anindex for surface moisture condition than ET.Because ET is a function not only of the landsurface conditions (e.g., soil moisture and vege-tation) but also of surface available energyRn � G0 (¼ H þ lE), ET cannot easily interpretsoil moisture conditions or drought status. Con-trarily, EF can be more directly related to theseland surface conditions. Second, EF is usefulfor scaling up instantaneous observations tolonger time periods. Except for geostationarysatellites, remote sensing observations of theland surface are often only available for a very
296 Journal of the Meteorological Society of Japan Vol. 85A
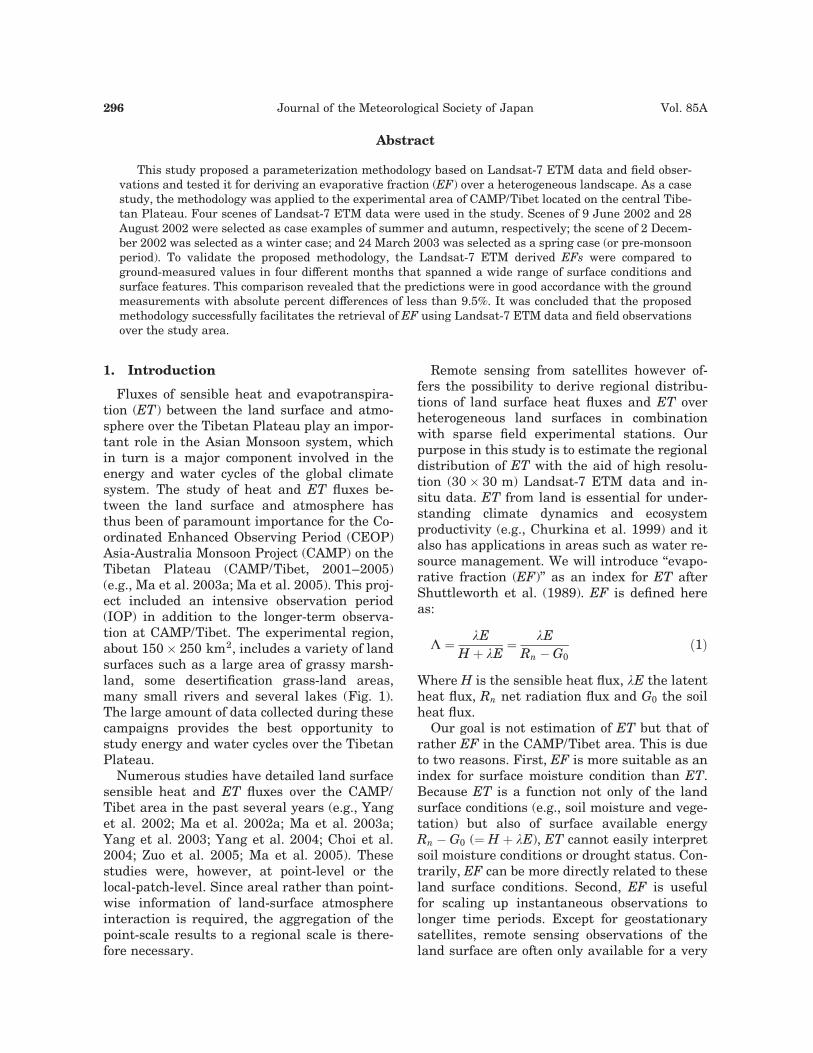
brief period of the day. ET, however, canchange drastically during a day because ofchanges in the angle of the sun and from cloudcoverage. Therefore, even if we can accuratelyestimate ET at the moment of satellite over-pass, it cannot be directly related to daily ordaytime average ET. Contrarily, EF is wellknown to be nearly constant during most ofthe daytime period (e.g., Shuttleworth et al.1989; Sugita and Brutsaert 1991; Crago 1996).We have found that EF is nearly constant fromsunrise to sunset at the BJ station of CAMP/Tibet during one day of both the dry season (18April 2004) and the wet season (12 June 2004)(see Fig. 2). Therefore, if we can estimate dailyor daytime average Rn � G0, we can estimatedaily or daytime average ET from Eq. 1 byusing instantaneous EF derived by satellite.
In this study, the regional distribution of EFwill be estimated using a combination ofLandsat-7 ETM observations and ground-baseddata and validated using eddy covariancemeasurements of latent heat exchange. We firstdescribe the methodology and the data used inSection 2. The application of the methodologyto the CAMP/Tibet period is presented in Sec-tion 3, where the distributions of EF are esti-
mated for four different phases, spring, sum-mer, autumn and winter by using four scenesof Landsat-7 ETM data. Discussions are alsopresented in this section.
2. Data and methodology
2.1 DataThe Landsat-7 Enhanced Thematic Mapper
(ETM) provides a spectral radiance in sevennarrow bands, with a spatial resolution ofabout 30 � 30 m for three visible bands (Bands1, 2, 3), three near infrared bands (Bands 4, 5,7), and 60 � 60 m for the thermal infraredBand 6. It is best to select the satellite data onclear days to study the distribution and inter-monthly variation of EF and energy budgetcomponents. Unfortunately, it is rather difficultto select this kind of satellite data over theTibetan Plateau area because of the strongconvective clouds when Landsat-7 ETM obser-vations take place. Only four scenes of ETMimages could be selected during the intensiveobservation period of the CAMP/Tibet. Theyare at 10:00 (local time), 9 June 2002 (summer),28 August 2002 (autumn), 2 December 2002(winter) and 24 March 2003 (spring) over theCAMP/Tibet area.
Fig. 1. Geographic map and site layout for CAMP/Tibet.
February 2007 Y. MA et al. 297
The most relevant field data, collected at theCAMP/Tibet surface stations to support the pa-rameterization of EF and analysis of ETM im-ages in this paper, consist of surface radiationbudget components, surface radiation tempera-ture, surface reflectance, vertical profiles of airtemperature, humidity, wind speed and di-rection measured at the Automatic WeatherStations (AWSs), Atmospheric Boundary Layer(ABL) tower, radio-sonde, turbulent fluxesmeasured by the eddy-correlation technique,soil heat flux, soil temperature profiles, soilmoisture profiles, and the vegetation state.
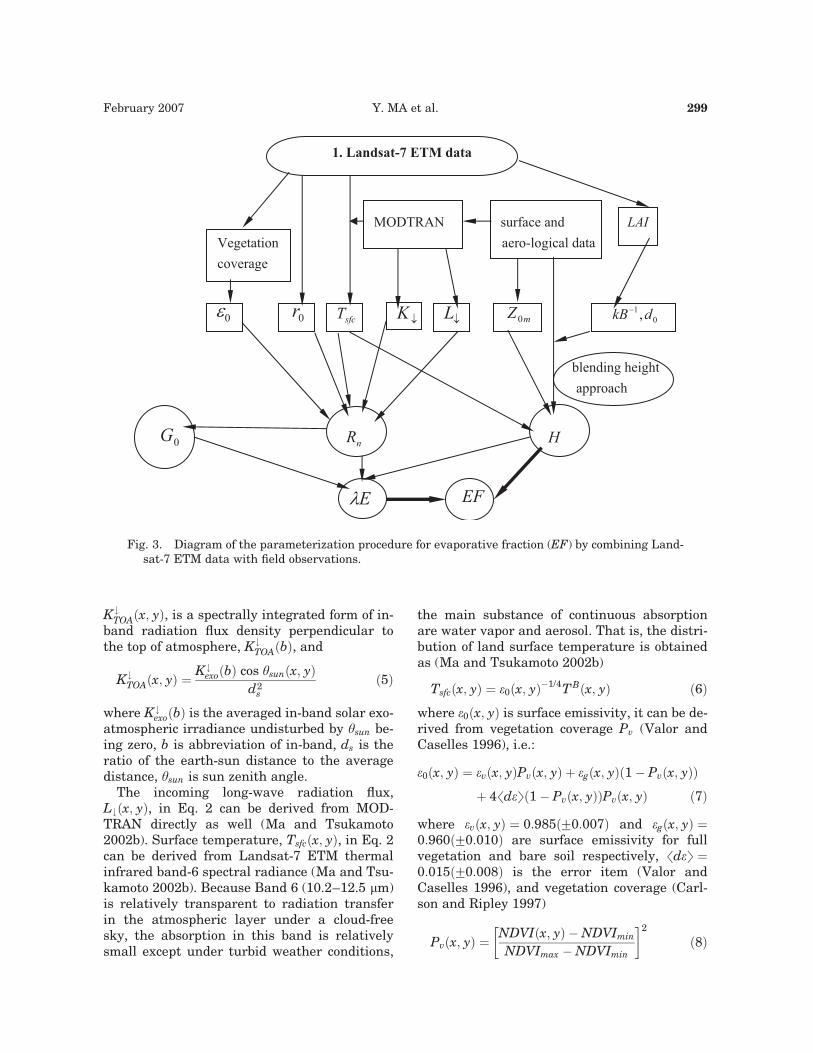
2.2 Theory and schemeThe general concept of the methodology of de-
termining EF is shown in Fig. 3. It has twosteps: The first one is to determine the surfacevariables (surface reflectance and surface tem-perature) and surface heat fluxes (net radiationflux, surface soil heat flux, sensible heat fluxand latent heat flux). The second is to estimatethe EF by Eq. 1 using the derived sensible heatand latent heat fluxes.
a Surface heat fluxesThe regional distribution of net radiation flux
ðRnÞ, soil heat flux ðG0Þ, sensible heat flux ðHÞand latent heat flux ðlEÞ over heterogeneousland surface of the CAMP/Tibet area can bederived by combining the Landsat-7 ETMdata with field observations. The methodologyis same as the heat fluxes derived from theNOAA/AVHRR data, except the determination
of soil heat flux (Ma et al. 2003b). The method-ology is as follows.
Net radiationThe regional net radiation flux can be de-
rived from
Rnðx; yÞ ¼ ð1 � r0ðx; yÞÞ � K#ðx; yÞ
þ L#ðx; yÞ � e0ðx; yÞsT4sfcðx; yÞ ð2Þ
where e0ðx; yÞ is surface emissivity, K repre-sents the short-wave (0.3–3 mm), and L is thelong wave (3–100 mm) radiation components,respectively. Surface reflectance, r0ðx; yÞ, canbe derived from integrated hemispherical plan-etary reflectance (e.g., Koepke et al. 1985; Me-nenti et al. 1989; Bastiaanssen 1995; Wanget al. 1995; Ma et al. 1999). However the linearregression relationships between surface reflec-tance, r0ðx; yÞ, and integrated hemisphericalplanetary reflectance, rpðx; yÞ, are in doubt, be-cause: 1) the ground measurement is only apoint value, while satellite pixels are the aver-age of many point values, and 2) fewer groundobservation data have a coincident relationshipwith satellite data (Wen 1999). A four-streamradiative transfer assumption for atmosphericcorrection in solar spectral bands (Verhoef1997) is introduced to derive the surface reflec-tance over the CAMP/Tibet area in this study.This means that the distribution of land sur-face reflectance can be derived as (Ma and Tsu-kamoto 2002b)
rbs ðx; yÞ ¼
X7ði06Þ
i¼1
wðiÞrisðx; yÞ ð3Þ
where wðiÞ is the weight of each band at sur-face, rb
s is the broadband surface reflectance, ris
is the band reflectance of Landsat-7 ETM.The incoming short-wave radiation flux,
K#ðx; yÞ, in Eq. 2 can be derived from the radia-tive transfer model MODTRAN (Kneizys et al.1996), where atmospheric short-wave transmit-tance, tsw, is obtained, and the atmosphericprofiles of air temperature and humidity mea-surements measured by a radio sonde systemhave been used here. Hence K#ðx; yÞ can be ob-tained as
K#ðx; yÞ ¼ tswK#TOAðx; yÞ ð4Þ
where the regional variation of radiation fluxperpendicular to the top of atmosphere,
Fig. 2. Diurnal variation of evaporativefraction at BJ station of CAMP/Tibet.
298 Journal of the Meteorological Society of Japan Vol. 85A
K#TOAðx; yÞ, is a spectrally integrated form of in-
band radiation flux density perpendicular tothe top of atmosphere, K#
TOAðbÞ, and
K#TOAðx; yÞ ¼ K#
exoðbÞ cos ysunðx; yÞd2
s
ð5Þ
where K#exoðbÞ is the averaged in-band solar exo-
atmospheric irradiance undisturbed by ysun be-ing zero, b is abbreviation of in-band, ds is theratio of the earth-sun distance to the averagedistance, ysun is sun zenith angle.
The incoming long-wave radiation flux,L#ðx; yÞ, in Eq. 2 can be derived from MOD-TRAN directly as well (Ma and Tsukamoto2002b). Surface temperature, Tsfcðx; yÞ, in Eq. 2can be derived from Landsat-7 ETM thermalinfrared band-6 spectral radiance (Ma and Tsu-kamoto 2002b). Because Band 6 (10.2–12.5 mm)is relatively transparent to radiation transferin the atmospheric layer under a cloud-freesky, the absorption in this band is relativelysmall except under turbid weather conditions,
the main substance of continuous absorptionare water vapor and aerosol. That is, the distri-bution of land surface temperature is obtainedas (Ma and Tsukamoto 2002b)
Tsfcðx; yÞ ¼ e0ðx; yÞ�1/4T Bðx; yÞ ð6Þ
where e0ðx; yÞ is surface emissivity, it can be de-rived from vegetation coverage Pv (Valor andCaselles 1996), i.e.:
e0ðx; yÞ ¼ evðx; yÞPvðx; yÞ þ egðx; yÞð1 � Pvðx; yÞÞ
þ 4hdeið1 � Pvðx; yÞÞPvðx; yÞ ð7Þ
where evðx; yÞ ¼ 0:985ðG0:007Þ and egðx; yÞ ¼0:960ðG0:010Þ are surface emissivity for fullvegetation and bare soil respectively, hdei ¼0:015ðG0:008Þ is the error item (Valor andCaselles 1996), and vegetation coverage (Carl-son and Ripley 1997)
Pvðx; yÞ ¼ NDVIðx; yÞ � NDVImin
NDVImax � NDVImin
� �2
ð8Þ
Fig. 3. Diagram of the parameterization procedure for evaporative fraction (EF) by combining Land-sat-7 ETM data with field observations.
February 2007 Y. MA et al. 299
where NDVImin and NDVImax are the NDVIvalues for bare soil and full vegetation respec-tively.
Soil heat fluxThe soil heat flux can be determined from
knowledge of the soil temperature profile andthe resistance to heat transfer in the soil (e.g.,Choudhury and Montheith 1988). However,this approach cannot be used with satellite ob-servations due to the difficulty in determiningsoil temperature at depth and soil resistance toheat transfer from remote sensing observations(e.g., Bastiaanssen 1995; Ma et al. 2002c). Asan alternative, many investigations haveshown that the mid-day G0/Rn ratio, G, isreasonably predictable from special vegeta-tion indices (Daughtry et al. 1990). G can beconsidered as a function F which relatesG0/Rn to other variables (Ma and Tsukamoto2002b). Some researchers have concluded thatG0/Rn ¼ G ¼ FðNDVIÞ (Clothier et al. 1986;Kustas and Daughtry 1990). A better ratio ofG0/Rn ¼ G ¼ Fðr0;Tsfc;NDVIÞ was also found(e.g., Choudhury et al. 1987; Menenti et al.1991; Bastiaanssen 1995). The relationship be-tween G0ðx; yÞ and Rnðx; yÞ derived in the Tibe-tan Plateau area (Ma et al. 2002c) will be usedto determine regional soil heat flux over theCAMP/Tibet area here, and
G0ðx; yÞ ¼ 0:35462ðG0:00235ÞRnðx; yÞ
� 47:79ðG0:7005Þ ð9Þ
with a correlation coefficient r ¼ 0:93 and stan-dard deviation SD ¼ 36:32234 (field data num-ber N ¼ 3619). The accuracy of Eq. 9 will in-crease with the number of the field data.
Sensible heat fluxThe regional distribution of sensible heat flux
is calculated from
Hðx; yÞ ¼ rCpTsfcðx; yÞ � Taðx; yÞ
raðx; yÞ ð10Þ
where aerodynamic resistance is
raðx; yÞ ¼ 1
ku�ðx; yÞ ln
�z � d0ðx; yÞZ0mðx; yÞ
� �
þ kB�1ðx; yÞ � chðx; yÞ�
ð11Þ
where k is Von-Karman constant, u� is frictionvelocity, z is reference height, d0 is zero-plane
displacement height, Z0m is the aerodynamicroughness, kB�1 is the excess resistance forheat transportation, ch is the stability correc-tion function for heat. The friction velocity, u�,can be derived from
uðx; yÞ ¼ u�ðx; yÞk
ln
�z � d0ðx; yÞZ0mðx; yÞ
� �
� cmðx; yÞ�
ð12Þwhere cm is the stability correction function formomentum.
From Eqs. 10, 11, and 12Hðx; yÞ
¼ rCpk2uðx; yÞ Tsfcðx; yÞ � Taðx; yÞ
lnz � d0ðx; yÞZ0mðx; yÞ þ kB�1ðx; yÞ � chðx; yÞ
� �� ln
z � d0ðx; yÞZ0mðx; yÞ � cmðx; yÞ
� �
ð13Þ
One approach to simulate sensible heat fluxon a large scale is to scale-up or aggregate theregional sensible flux by a weighted average ofthe contributions from different surface ele-ments, based on the principle of flux conserva-tion. In this study, we propose a method of‘‘blending height’’ to derive the regional sensi-ble heat flux. If the local-scale advection iscomparatively small during the period of theLandsat-7 ETM observation taking place, thedevelopment of a Convection Boundary Layer(CBL) may adjust to the surface-disorganizedvariability at a ‘‘blending height’’, where the at-mospheric characteristics become proximatelyindependent of the horizontal position. The cor-responding ‘effective’ surface variables can bedetermined accordingly (Mason 1988). Thisapproach has proved to be successful for calcu-lating areally averaged surface fluxes in recentreports (e.g., Lhomme et al. 1994; Bastiaassen1995; Wang et al. 1995; Ma and Tsukamoto2002b; Ma et al. 2002d; Ma et al. 2003b). Basedon this approach, the regional sensible heatflux, Hðx; yÞ, can be described asHðx; yÞ
¼ rCpk2uBTsfcðx; yÞ � Ta�B
lnzB � d0ðx; yÞ
Z 00m
þ kB�1ðx; yÞ � chðx; yÞ� �
� lnzB � d0ðx; yÞ
Z 00m
� cmðx; yÞ� �
ð14Þ
where ZB is blending height, uB and Ta�B is thewind speed and air temperature at the blend-ing height. In this study, ZB, Ta�B and uB aredetermined with the aid of field measurementsmade by the radio sounding system. We knowthat the vertical u-profile can be measured
300 Journal of the Meteorological Society of Japan Vol. 85A
using a radio sounding system; that is, u chang-ing with the height can be determined. Nor-mally, wind speed increases with height, andbecomes a constant at height Z. The wind speedmeasured using a radio sounding system at theheight Z is called uB and the height Z is namedZB here. The air temperature at the blendingheight, ZB, is Ta�B. Effective aerodynamicroughness, Z 0
0m, in Eq. 14 over the CAMP/Tibetarea includes the effect of topography and lowvegetation (e.g., grass). It is calculated by usingTaylor’s model (Taylor et al. 1989), i.e.:
lnZ 0
0m
Z0m
� �¼ 3:5 a
2p
l1
� �2
lnl1
Z0m
� �ð15Þ
where a is the amplitude of relief and l1 is thewavelength of periodic relief. In other words,the local roughness length, Z0m, over theexperiment area can be determined using theturbulent measurements of an anemometer-thermometer (Ma et al. 2002a). Then the effec-tive aerodynamic roughness length, Z 0
0m, can bedetermined from Eq. 15. The excess resistanceto heat transfer, kB�1, is shown as a functionof surface temperature over the Tibetan Pla-teau area, and kB�1ðx; yÞ ¼ 0:52ðTsfcðx; yÞ�Tairðx; yÞÞ � 1:85 (Ma et al. 2002a). d0 is a zero-plane displacement, which can be calculatedfrom the leaf area index (LAI) using Raupach’smodel (Raupach 1994), i.e.:
1 � d0ðx; yÞhðx; yÞ ¼ 1 � expð�
ffiffiffiffiffiffiffiffiffiffiffiffiffiffiffiffiffiffiffiffiffiffiffiffiffifficd1LAIðx; yÞ
pÞffiffiffiffiffiffiffiffiffiffiffiffiffiffiffiffiffiffiffiffiffiffiffiffiffiffi
cd1LAIðx; yÞp ð16Þ
where h is the vegetation height, and it is10 cm over our experimental area. cd1 in Eq.16 is a free parameter, and for a range of par-tial vegetation cover, Raupach (1994) proposedto use cd1 ¼ 7:5. LAI was determined from veg-etation coverage (Kustas and Norman 1997). Inother words, LAI ¼ �2 lnð1 � PvÞ:chðx; yÞ andcmðx; yÞ in Eq. 14 are the integrated stabilityfunctions. For unstable conditions, the inte-grated stability functions, chðx; yÞ and cmðx; yÞ,can be written as (Paulson 1970)
cmðx; yÞ ¼ 2 ln½ð1 þ XÞ/2�þ ln½ð1 þ X 2Þ/2�� 2 arctanðXÞ þ 0:5p
chðx; yÞ ¼ 2 ln½ð1 þ X 2Þ/2�
8>><>>:
ð17Þ
where X ¼ f1 � 16½z � d0ðx; yÞ�/Lðx; yÞg0:25. Forstable conditions, the integrated stability func-tions cmðx; yÞ and chðx; yÞ become (Webb 1970)
cmðx; yÞ ¼ chðx; yÞ
¼ �5½z � d0ðx; yÞ�/Lðx; yÞ ð18Þ
The stability function ½z � d0ðx; yÞ�/Lðx; yÞ iscalculated by Businger’s method (Businger,1988).
½z � d0ðx; yÞ�/Lðx; yÞ¼ Riðx; yÞ ðunstableÞ
½z � d0ðx; yÞ�/Lðx; yÞ¼ Riðx; yÞ/½1 � 5:2Riðx; yÞ� ðstableÞ
8>><>>:
ð19Þ
where Riðx; yÞ is the Richardson number, by thedefinition of Richardson number. The approxi-
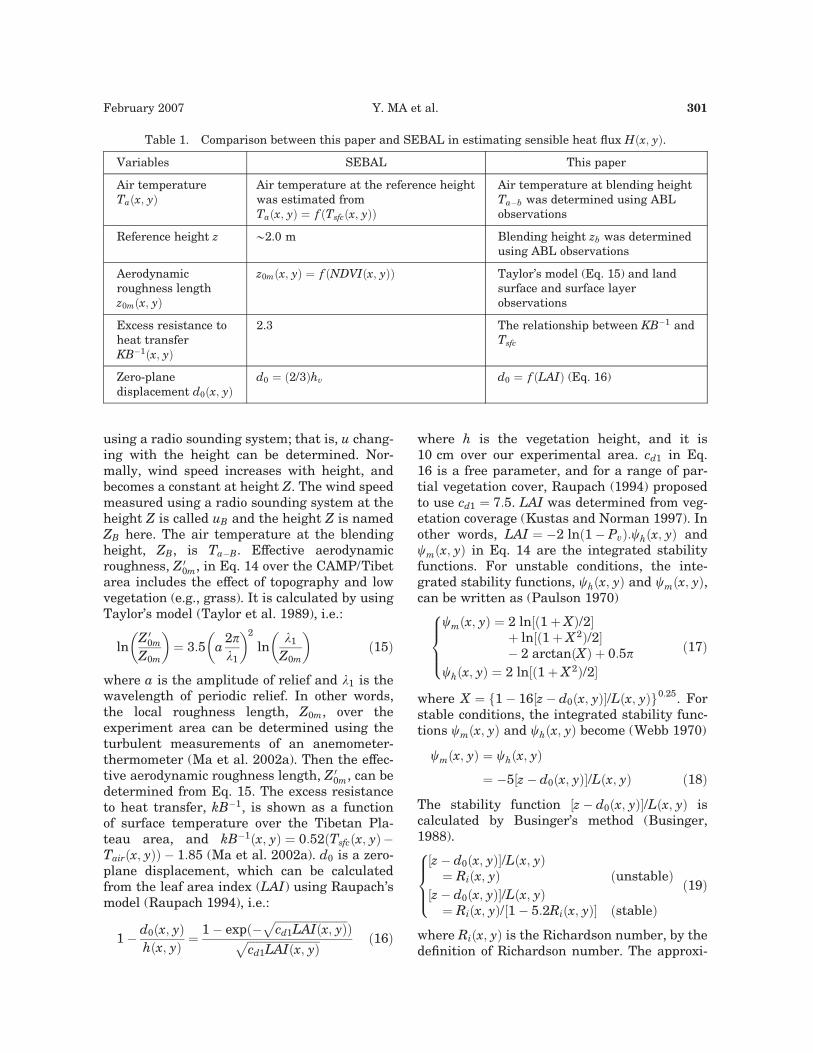
Table 1. Comparison between this paper and SEBAL in estimating sensible heat flux Hðx; yÞ.
Variables SEBAL This paper
Air temperatureTaðx; yÞ
Air temperature at the reference heightwas estimated fromTaðx; yÞ ¼ f ðTsfcðx; yÞÞ
Air temperature at blending heightTa�b was determined using ABLobservations
Reference height z @2.0 m Blending height zb was determinedusing ABL observations
Aerodynamicroughness lengthz0mðx; yÞ
z0mðx; yÞ ¼ f ðNDVIðx; yÞÞ Taylor’s model (Eq. 15) and landsurface and surface layerobservations
Excess resistance toheat transferKB�1ðx; yÞ
2.3 The relationship between KB�1 andTsfc
Zero-planedisplacement d0ðx; yÞ
d0 ¼ ð2/3Þhv d0 ¼ f ðLAIÞ (Eq. 16)
February 2007 Y. MA et al. 301
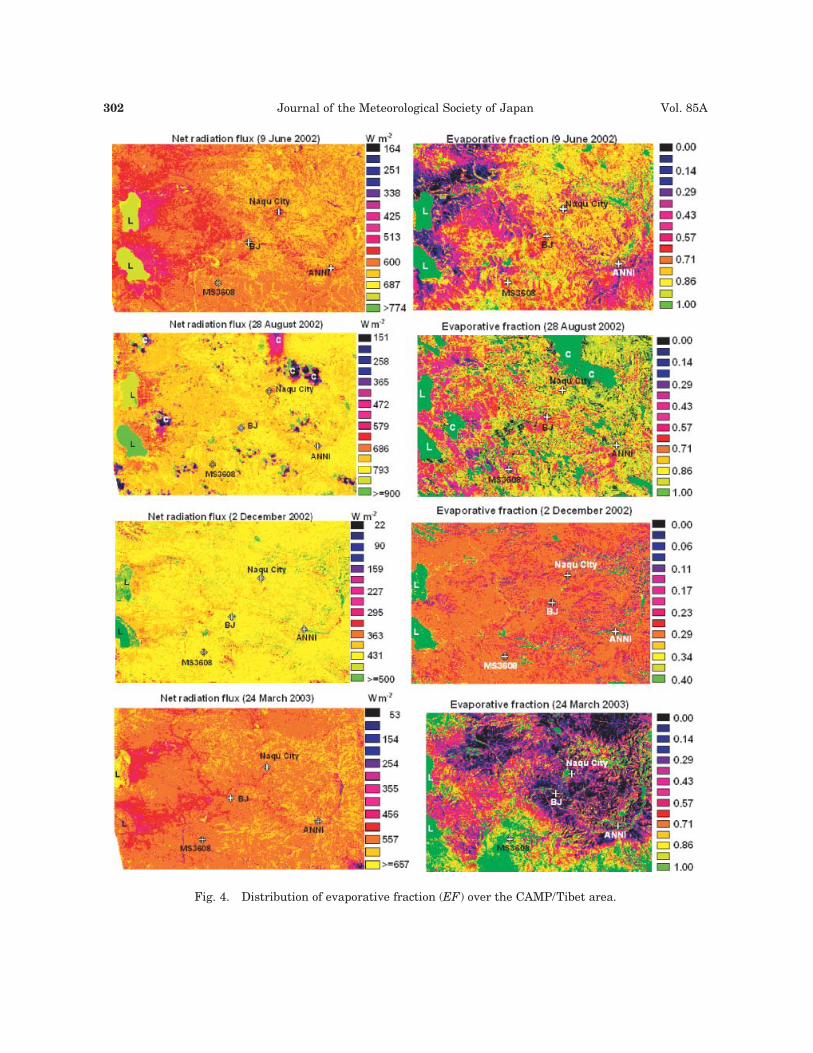
Fig. 4. Distribution of evaporative fraction (EF) over the CAMP/Tibet area.
302 Journal of the Meteorological Society of Japan Vol. 85A
mate analytical solutions of Ri found by Yang etal. (2001) will be used here.
The difference between this paper and theSEBAL model (Bastiaanssen 1995) in estimat-ing the sensible heat flux, Hðx; yÞ, is shown inTable 1. The advantages of the method pre-sented in this paper will be documentedthrough the following case studies.
Latent heat fluxThe regional latent heat flux lEðx; yÞ can be
derived as the residual of the energy budgettheorem for land surface based on the conditionof zero horizontal advection at z < zsur, i.e.:
lEðx; yÞ ¼ Rnðx; yÞ � Hðx; yÞ � G0ðx; yÞ ð20Þ
b Evaporative fraction EFIf the evaporative fraction (EF) defining
equation (Eq. 1) is used to the ETM pixel scale,it will become
Lðx; yÞ ¼ lEðx; yÞHðx; yÞ þ lEðx; yÞ ð21Þ
The EF value is between 0.0 and 1.0. L equal-ing 0.0 means that the surface is very dry (e.g.,the very dry sand desert surface), and there isno evapotranspiration from the surface. Lequaling 1.0 means that surface is very wet(e.g. water surface), and there is maximumevapotranspiration from the surface.
3. Case studies and validation
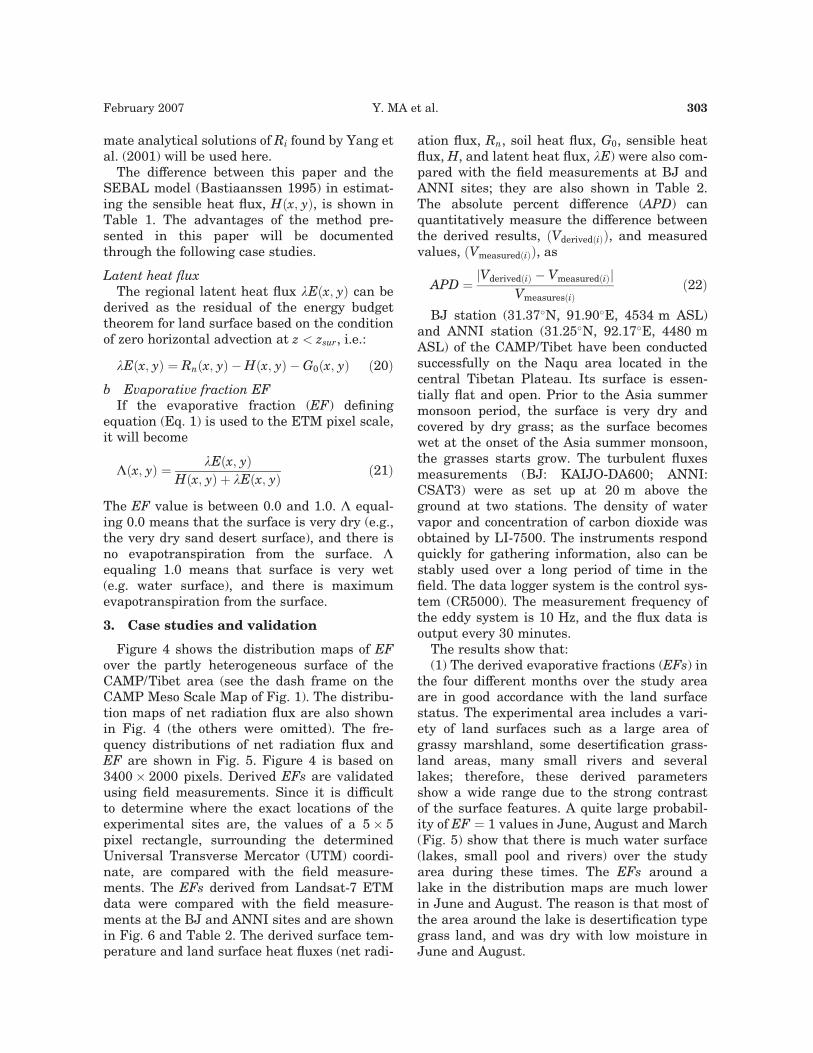
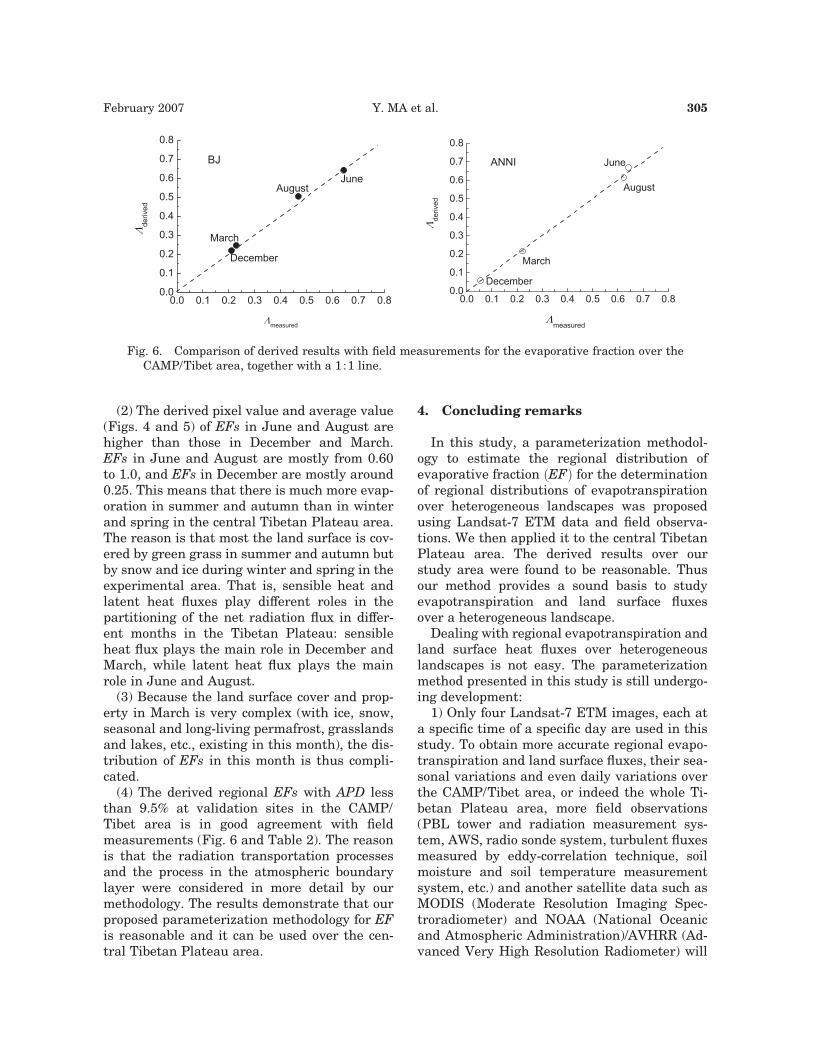
Figure 4 shows the distribution maps of EFover the partly heterogeneous surface of theCAMP/Tibet area (see the dash frame on theCAMP Meso Scale Map of Fig. 1). The distribu-tion maps of net radiation flux are also shownin Fig. 4 (the others were omitted). The fre-quency distributions of net radiation flux andEF are shown in Fig. 5. Figure 4 is based on3400 � 2000 pixels. Derived EFs are validatedusing field measurements. Since it is difficultto determine where the exact locations of theexperimental sites are, the values of a 5 � 5pixel rectangle, surrounding the determinedUniversal Transverse Mercator (UTM) coordi-nate, are compared with the field measure-ments. The EFs derived from Landsat-7 ETMdata were compared with the field measure-ments at the BJ and ANNI sites and are shownin Fig. 6 and Table 2. The derived surface tem-perature and land surface heat fluxes (net radi-
ation flux, Rn, soil heat flux, G0, sensible heatflux, H, and latent heat flux, lE) were also com-pared with the field measurements at BJ andANNI sites; they are also shown in Table 2.The absolute percent difference (APD) canquantitatively measure the difference betweenthe derived results, ðVderivedðiÞÞ, and measuredvalues, ðVmeasuredðiÞÞ, as
APD ¼jVderivedðiÞ � VmeasuredðiÞj
VmeasuresðiÞð22Þ
BJ station (31.37�N, 91.90�E, 4534 m ASL)and ANNI station (31.25�N, 92.17�E, 4480 mASL) of the CAMP/Tibet have been conductedsuccessfully on the Naqu area located in thecentral Tibetan Plateau. Its surface is essen-tially flat and open. Prior to the Asia summermonsoon period, the surface is very dry andcovered by dry grass; as the surface becomeswet at the onset of the Asia summer monsoon,the grasses starts grow. The turbulent fluxesmeasurements (BJ: KAIJO-DA600; ANNI:CSAT3) were as set up at 20 m above theground at two stations. The density of watervapor and concentration of carbon dioxide wasobtained by LI-7500. The instruments respondquickly for gathering information, also can bestably used over a long period of time in thefield. The data logger system is the control sys-tem (CR5000). The measurement frequency ofthe eddy system is 10 Hz, and the flux data isoutput every 30 minutes.
The results show that:(1) The derived evaporative fractions (EFs) in
the four different months over the study areaare in good accordance with the land surfacestatus. The experimental area includes a vari-ety of land surfaces such as a large area ofgrassy marshland, some desertification grass-land areas, many small rivers and severallakes; therefore, these derived parametersshow a wide range due to the strong contrastof the surface features. A quite large probabil-ity of EF ¼ 1 values in June, August and March(Fig. 5) show that there is much water surface(lakes, small pool and rivers) over the studyarea during these times. The EFs around alake in the distribution maps are much lowerin June and August. The reason is that most ofthe area around the lake is desertification typegrass land, and was dry with low moisture inJune and August.
February 2007 Y. MA et al. 303
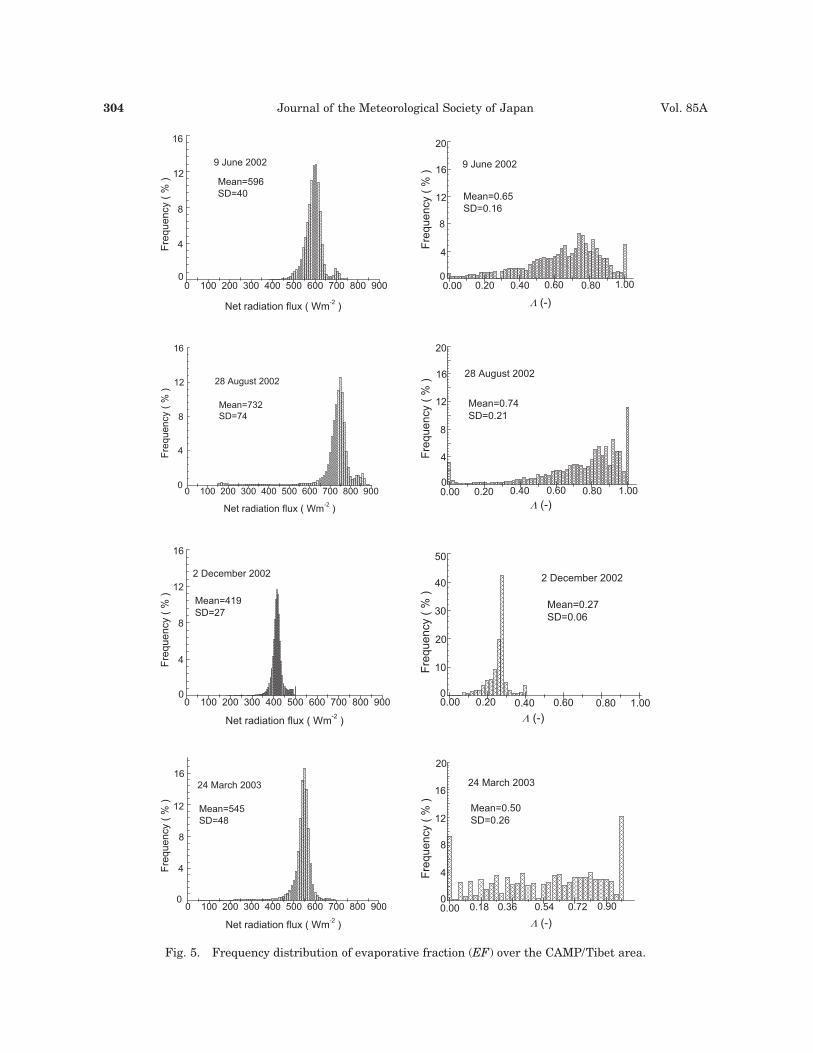
Fig. 5. Frequency distribution of evaporative fraction (EF) over the CAMP/Tibet area.
304 Journal of the Meteorological Society of Japan Vol. 85A
(2) The derived pixel value and average value(Figs. 4 and 5) of EFs in June and August arehigher than those in December and March.EFs in June and August are mostly from 0.60to 1.0, and EFs in December are mostly around0.25. This means that there is much more evap-oration in summer and autumn than in winterand spring in the central Tibetan Plateau area.The reason is that most the land surface is cov-ered by green grass in summer and autumn butby snow and ice during winter and spring in theexperimental area. That is, sensible heat andlatent heat fluxes play different roles in thepartitioning of the net radiation flux in differ-ent months in the Tibetan Plateau: sensibleheat flux plays the main role in December andMarch, while latent heat flux plays the mainrole in June and August.
(3) Because the land surface cover and prop-erty in March is very complex (with ice, snow,seasonal and long-living permafrost, grasslandsand lakes, etc., existing in this month), the dis-tribution of EFs in this month is thus compli-cated.
(4) The derived regional EFs with APD lessthan 9.5% at validation sites in the CAMP/Tibet area is in good agreement with fieldmeasurements (Fig. 6 and Table 2). The reasonis that the radiation transportation processesand the process in the atmospheric boundarylayer were considered in more detail by ourmethodology. The results demonstrate that ourproposed parameterization methodology for EFis reasonable and it can be used over the cen-tral Tibetan Plateau area.
4. Concluding remarks
In this study, a parameterization methodol-ogy to estimate the regional distribution ofevaporative fraction ðEFÞ for the determinationof regional distributions of evapotranspirationover heterogeneous landscapes was proposedusing Landsat-7 ETM data and field observa-tions. We then applied it to the central TibetanPlateau area. The derived results over ourstudy area were found to be reasonable. Thusour method provides a sound basis to studyevapotranspiration and land surface fluxesover a heterogeneous landscape.
Dealing with regional evapotranspiration andland surface heat fluxes over heterogeneouslandscapes is not easy. The parameterizationmethod presented in this study is still undergo-ing development:
1) Only four Landsat-7 ETM images, each ata specific time of a specific day are used in thisstudy. To obtain more accurate regional evapo-transpiration and land surface fluxes, their sea-sonal variations and even daily variations overthe CAMP/Tibet area, or indeed the whole Ti-betan Plateau area, more field observations(PBL tower and radiation measurement sys-tem, AWS, radio sonde system, turbulent fluxesmeasured by eddy-correlation technique, soilmoisture and soil temperature measurementsystem, etc.) and another satellite data such asMODIS (Moderate Resolution Imaging Spec-troradiometer) and NOAA (National Oceanicand Atmospheric Administration)/AVHRR (Ad-vanced Very High Resolution Radiometer) will
Fig. 6. Comparison of derived results with field measurements for the evaporative fraction over theCAMP/Tibet area, together with a 1 :1 line.
February 2007 Y. MA et al. 305
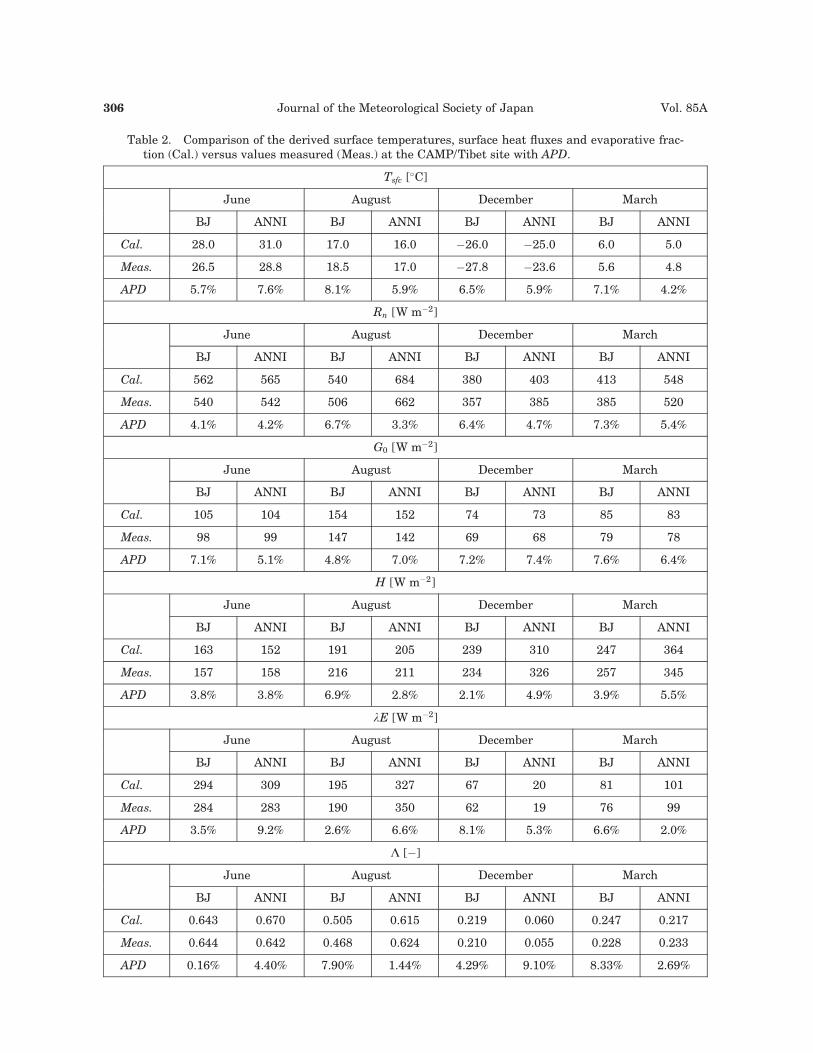
Table 2. Comparison of the derived surface temperatures, surface heat fluxes and evaporative frac-tion (Cal.) versus values measured (Meas.) at the CAMP/Tibet site with APD.
Tsfc [�C]
June August December March
BJ ANNI BJ ANNI BJ ANNI BJ ANNI
Cal. 28.0 31.0 17.0 16.0 �26.0 �25.0 6.0 5.0
Meas. 26.5 28.8 18.5 17.0 �27.8 �23.6 5.6 4.8
APD 5.7% 7.6% 8.1% 5.9% 6.5% 5.9% 7.1% 4.2%
Rn [W m�2]
June August December March
BJ ANNI BJ ANNI BJ ANNI BJ ANNI
Cal. 562 565 540 684 380 403 413 548
Meas. 540 542 506 662 357 385 385 520
APD 4.1% 4.2% 6.7% 3.3% 6.4% 4.7% 7.3% 5.4%
G0 [W m�2]
June August December March
BJ ANNI BJ ANNI BJ ANNI BJ ANNI
Cal. 105 104 154 152 74 73 85 83
Meas. 98 99 147 142 69 68 79 78
APD 7.1% 5.1% 4.8% 7.0% 7.2% 7.4% 7.6% 6.4%
H [W m�2]
June August December March
BJ ANNI BJ ANNI BJ ANNI BJ ANNI
Cal. 163 152 191 205 239 310 247 364
Meas. 157 158 216 211 234 326 257 345
APD 3.8% 3.8% 6.9% 2.8% 2.1% 4.9% 3.9% 5.5%
lE [W m�2]
June August December March
BJ ANNI BJ ANNI BJ ANNI BJ ANNI
Cal. 294 309 195 327 67 20 81 101
Meas. 284 283 190 350 62 19 76 99
APD 3.5% 9.2% 2.6% 6.6% 8.1% 5.3% 6.6% 2.0%
L [�]
June August December March
BJ ANNI BJ ANNI BJ ANNI BJ ANNI
Cal. 0.643 0.670 0.505 0.615 0.219 0.060 0.247 0.217
Meas. 0.644 0.642 0.468 0.624 0.210 0.055 0.228 0.233
APD 0.16% 4.40% 7.90% 1.44% 4.29% 9.10% 8.33% 2.69%
306 Journal of the Meteorological Society of Japan Vol. 85A
have to be used. It will also be worthwhile toapply the SEBI (Surface Energy Balance Index,Menenti and Choudhury 1993) method andSEBS (Surface Energy Balance System, Su2002).
2) This study implies that the parameteriza-tion method is only applicable to clear-skydays (to apply MODTRAN and detect surfacetemperature). To extend its applicability tocloudy skies, we should consider using micro-wave remote sensing to derive surface temper-atures and other land surface variables.
We intend to undertake all these works inour ongoing studies.
Acknowledgements
This work was under the auspices of theChinese National Key Programme for Develop-ing Basic Sciences (2005CB422003), the Na-tional Natural Science Foundation of China(40520140126 and 40675012), the InnovationProject of Chinese Academy of Sciences(KZCX3-SW-231) and the CAMP/Tibet projectfounded by Japan Science and TechnologyAgency (JST). Most of this work was done atAlterra, Wageningen University and ResearchCenter, The Netherlands (it was supported bythe EC FP6 GMES EAGLE project (contractno. 502057)) and the International Institute forGeo-Information Science and Earth Observa-tion, The Netherlands. The authors thank allthe scientists in the CAMP/Tibet group fromChina and Japan for their hard work collectingfield data.
References
Bastiaanssen, W.G.M., 1995: Regionalization of sur-face flux densities and moisture indicators incomposite terrain. PhD thesis, WageningenAgricultural University, Wageningen, theNetherlands, 143–161.
Businger, J.A., 1988: A note on the Businger-Dyerprofiles. Bound-Layer Meteor., 42, 145–151.
Carlson, T.N. and D.A. Ripley, 1997: On the relationbetween NDVI, fractional vegetation cover,and leaf area index. Remote Sens. Environ.,62, 241–252.
Choi, T., J. Hong, J. Kim, H. Lee, J. Asanuma, H.Ishikawa, O. Tsukamoto, Z. Gao, Y. Ma, K.Ueno, J. Wang, T. Koike, and T. Yasunari,2004: Turbulent exchange of heat, water vapor,and momentum over a Tibetan prairie by eddycovariance and flux variance measurements.
J. Geophys. Res., 109(D21106), 10.1029/2004JD004767.
Choudhury, B.J., S.B. Idso, and R.J. Reginato, 1987:Analysis of an empirical model for soil heatflux under a growing wheat crop for estimatingevaporation by infrared-temperature based en-ergy balance equation. Agric. For. Meteor., 39,283–297.
Choudhury, B.J. and J.L. Monteith, 1988: A four-layer model for the heat budget of homoge-neous land surfaces, Quart. J. Roy-Meteor.Soc., 114, 373–398.
Churkina, G., S.W. Running, A.L. Schloss, and theParticipants of the Potsdam NPP Model Inter-comparison, 1999: Comparing global modelsof terrestrial net primary productivity (NPP):the importance of water availability. GlobalChange Biology, 5(Suppl. 1), 46–55.
Clothier, B.E., K.L. Clawson, P.J. Pinter, M.S.Moran, R.J. Reginato, and R.D. Jackson, 1986:Estimating of soil heat flux from net radiationduring the growth of alfalfa. Agric. For. Me-teor., 37, 319–329.
Crago, R.D., 1996: Comparison of the evaporativefraction and the Priestley-Taylor a for parame-terizing daytime evaporation. Water ResourcesResearch, 32(5), 1403–1409.
Daughtry, C.S.T., W.P. Kustas, M.S. Moran, P.J.Pinter, R.D. Jackson, P.W. Brown, W.D. Nich-ols, and L.W. Gay, 1990: Spectral estimates ofnet radiation and soil heat flux. Remote Sens.Environ., 32, 111–124.
Kenizys, F.X., L.W. Abreu, G.P. Anderson, J.H.,Chetwynd, E.P. Shettle, A. Berk, L.S. Bern-stein, D.C. Robertson, P. Acharya, L.S. Roth-man, J.E.A. Selby, W.O. Gallery, and S.A.Clough, 1996: The MODTRAN3/2 report andLODTRAN 7 Model. [L.W. Abreu and G.P.Andson, (eds.)], Ontar Corp., North Andover,MA, for Phillips Laboratory, Geophysical Di-rectorate, Hanscom AFB, MA, Contract No.F19628-91-C-0132.
Koepke, P., K.T. Kriebel, and B. Dietrich, 1985: Theeffect of surface reflection and of atmosphericparameters on the short wave radiation bud-get. Adv. Space Res., 5, 353–354.
Kustas, W.P. and C.S.T. Daughtry, 1990: Estimationof the soil heat flux /net radiation ratio fromspectral data. Agric. For. Meteor., 39, 205–223.
Kustas, W.P. and J.M. Norman, 1997: A two-sourceapproach for estimating turbulent fluxes usingmultiple angle thermal infrared observations.Water Resources Research, 33, 1495–1508.
Lhomme, J.-P., A. Chehbouni, and B. Monteny, 1994:Effective parameters of surface energy balancein heterogeneous landscape. Bound.-Layer Me-teor., 71, 297–310.
February 2007 Y. MA et al. 307
Ma, Y., J. Wang, M. Menenti, and W.G.M. Bastiaans-sen, 1999: Estimation of fluxes over the hetero-geneous land surface with the aid of satelliteremote sensing and field observation. ACTAMeteor. Sinica, 57, 180–189, (in Chinese withEnglish abstract).
Ma, Y., O. Tsukamoto, J. Wang, H. Ishikawa, and I.Tamagawa, 2002a: Analysis of aerodynamicand thermodynamic parameters over thegrassy marshland surface of Tibetan Plateau,Progress in Natural Sci., 12, 36–40.
Ma, Y. and O. Tsukamoto, 2002b: Combining satel-lite remote sensing with field observations forland surface heat fluxes over inhomogeneouslandscape, China Meteorological Press, Bei-jing, China.
Ma, Y., Z. Su, Z.-L. Li, T. Koike, and M. Menenti,2002c: Determination of regional net radiationand soil heat flux densities over heterogeneouslandscape of the Tibetan Plateau. HydrologicalProcesses, 16(15), 2963–2971.
Ma, Y., O. Tsukamoto, H. Ishikawa, Z. Su, M. Me-nenti, J. Wang, and J. Wen, 2002d: Determina-tion of Regional land surface heat flux den-sities over heterogeneous landscape of HEIFEIntegrating satellite remote sensing with fieldobservations. J. Meteor. Soc. Japan, 80(3),485–501.
Ma, Y., Z. Su, T. Koike, T. Yao, H. Ishikawa, K.Ueno, and M. Menenti, 2003a: On measuringand remote sensing surface energy partitioningover the Tibetan Plateau-from GAME/Tibet toCAMP/Tibet. Physics and Chemistry of theEarth, 28, 63–74.
Ma, Y., H. Ishikawa, O. Tsukamoto, M. Menenti, Z.Su, T. Yao, T. Koike, and T. Yasunari, 2003b:Regionalization of surface fluxes over heteroge-neous landscape of the Tibetan Plateau byusing satellite remote sensing. J. Meteor. Soc.Japan, 81(2), 277–293.
Ma, Y., S. Fan, H. Ishikawa, O. Tsukamoto, T. Yao,T. Koike, H. Zuo, Z. Hu, and Z. Su, 2005: Diur-nal and inter-monthly variation of land surfaceheat fluxes over the central Tibetan Plateauarea. Theoretical and Applied Climatology, 80,259–273.
Mason, P., 1988: The formation of areally averagedroughness lengths. Quart. J. Roy. Meteor. Soc.,114, 399–420.
Menenti, M., W.G.M. Bastiaanssen, and D. Van Eick,1989: Determination of hemispheric reflec-tance with Thematic Mapper data, RemoteSens. Environ., 28, 327–337.
Menenti, M., W.G.M. Bastiaanssen, K. Hefny, andM.H. Abd EI Karim, 1991: Mapping of groundwater losses by evaporation in the WesternDesert of Egypt. DLO Winand Staring Centre,
Report no. 43, Wageningen, The Netherlands,1–116.
Menenti, M. and B.J. Choudhury, 1993: Parameter-ization of land surface evaporation by meansof location dependent potential evaporationand surface temperature range. In: Exchangeprocesses at the land surface for a range ofspace and time scales. [Bolle, Feddes andKalma, (eds.)], IAHS Publ., 212, 561–568.
Paulson, C.A., 1970: The mathematic representationof wind speed and temperature profiles in theunstable atmospheric surface layer. J. Appl.Meteor., 9, 856–861.
Raupach, M.R., 1994: Simplified expressions for veg-etation roughness length and zero-plane dis-placements as functions of canopy heightand area index. Bound.-Layer Meteor., 71,211–216.
Shuttleworth, W.J., R.J. Gurney, A.Y. Hsu, and J.P.Ormsby, 1989: FIFE: the variation in energypartition at surface flux sites. IAHS Publica-tion, 186, 67–74.
Sugita, M. and W. Brutsaert, 1991: Daily evapora-tion over a region from lower boundary-layerprofiles measured with radiosondes. Water Re-sources Research, 27(5), 747–752.
Su, Z., 2002: The Surface Energy Balance System(SEBS) for estimation of turbulent heat fluxes.Hydrology and Earth System Sci., 6, 85–99.
Taylor, P.A., R.I. Sykes, and P.J. Mason, 1989: Onthe parameterization of drag over small scaletopography in neutrally stratified Boundaryflow. Bound.-Layer Meteor., 48, 409–422.
Valor, E. and V. Caselles, 1996: Mapping land sur-face emissivity from NDVI: application to Eu-ropean, African, and South American areas.Remote Sens. Environ., 57, 167–184.
Verhoef, W., 1997: Theory of radiative transfermodels applied in optical remote sensing ofvegetation canopies. PhD thesis, Remote Sens-ing Department of National Aerospace Labora-tory, The Netherlands, 290 pp.
Wang, J., Y. Ma, M. Menenti, W.G.M. Bastiaanssen,and Y. Mistsuta, 1995: The scaling-up ofprocesses in the heterogeneous landscape ofHEIFE with the aid of satellite remote sensing,J. Meteor. Soc. Japan., 73, 1235–1244.
Webb, E.K., 1970: Profile relationships: the log-linerrange and extension to strong stability. Quart.J. Roy. Meteor. Soc., 96, 67–90.
Wen, J., 1999: Land surface variables estimatedfrom remote sensing and the correction of at-mospheric effects. Ph.D. Thesis, Lanzhou Insti-tute of Plateau Atmospheric Physics, The Chi-nese Academy of Sciences, Lanzhou, China,115 pp, (in Chinese with English abstract).
Yang, K., N. Tamai, and T. Koike, 2001: Analytical
308 Journal of the Meteorological Society of Japan Vol. 85A
solution of surface layer similarity equations.J. Appl. Meteorol., 40, 1647–1653.
Yang, K., T. Koike, H. Fujii, K. Tamagawa, andN. Hirose, 2002: Improvement of surface fluxparameterizations with a turbulence-relatedlength. Quart. J. Roy. Meteor. Soc., 128B,2073–2088.
Yang, K., T. Koike, and D. Yang, 2003: Surface fluxparameterization in the Tibetan Plateau.
Bound.-Layer Meteor., 116, 245–262.Yang, K., T. Koike, H. Ishikawa, and Y. Ma, 2004:
Analysis of the surface energy budget at a siteof GAME/Tibet using a single-source model.J Meteor Soc of Japan., 82, 131–153.
Zuo, H., Y. Hu, D. Li, S. Lu, and Y. Ma, 2005: Sea-sonal transition and its boundary characteris-tics in Amdo area of Tibetan Plateau. Progressin Natural Sci., 15, 239–245.
February 2007 Y. MA et al. 309
Copyright © 2022 FDOKUMEN