Remote sensing techniques using Landsat ETM+ applied to the detection of iron ore deposits in...
20
1 23 Arabian Journal of Geosciences ISSN 1866-7511 Arab J Geosci DOI 10.1007/s12517-012-0725-0 Remote sensing techniques using Landsat ETM+ applied to the detection of iron ore deposits in Western Africa Andrea Ciampalini, Francesca Garfagnoli, Benedetta Antonielli, Sandro Moretti & Gaia Righini
-
Upload
independent -
Category
Documents
-
view
0 -
download
0
Transcript of Remote sensing techniques using Landsat ETM+ applied to the detection of iron ore deposits in...
1 23
Arabian Journal of Geosciences ISSN 1866-7511 Arab J GeosciDOI 10.1007/s12517-012-0725-0
Remote sensing techniques using LandsatETM+ applied to the detection of iron oredeposits in Western Africa
Andrea Ciampalini, FrancescaGarfagnoli, Benedetta Antonielli,Sandro Moretti & Gaia Righini

1 23
Your article is protected by copyright and all
rights are held exclusively by Saudi Society
for Geosciences. This e-offprint is for personal
use only and shall not be self-archived in
electronic repositories. If you wish to self-
archive your work, please use the accepted
author’s version for posting to your own
website or your institution’s repository. You
may further deposit the accepted author’s
version on a funder’s repository at a funder’s
request, provided it is not made publicly
available until 12 months after publication.

ORIGINAL PAPER
Remote sensing techniques using Landsat ETM+ appliedto the detection of iron ore deposits in Western Africa
Andrea Ciampalini & Francesca Garfagnoli &Benedetta Antonielli & Sandro Moretti & Gaia Righini
Received: 27 February 2012 /Accepted: 16 October 2012# Saudi Society for Geosciences 2012
Abstract Remote sensing methods enable the rapid andinexpensive mapping of surface geological and mineralogi-cal features. This capability proves highly useful whenworking on isolated or inaccessible areas. In this study,several enhancements of Landsat Enhanced ThematicMapper plus (i.e. band ratios, false colour composites andprincipal component analysis) were used and evaluated toobtain the best possible visualisation of iron deposits hostedin the Devonian sedimentary rocks of northwestern Africa.In particular, two test sites were chosen: southern Algeria(Djebilet area), where the literature mineralogical and geo-logical data on iron mine fields were already available, andthe Western Sahara (the southern flank of Tindouf Basin),which was investigated during a field campaign and waswhere the occurrence of an analogous sedimentary succes-sion led us to hypothesise the possible presence of exploit-able iron deposits. This work demonstrates the usefulness ofmultispectral imagery in the detection of iron-rich areasand establishes a full remote sensing procedure, whichcan be profitably applied to a wider region of WesternSahara and can provide interesting perspectives on thepossibility of detecting new exploitable iron ore depositsin arid environments.
Keywords Iron .Western Sahara . Landsat 7 ETM+ .
Mineral detection . PCA . OIF
Introduction
The extraction of metallic minerals (e.g. hematite, limonite,goethite and magnetite) derived from iron ores is importantfor the product industries utilising iron and steel and for theinfrastructure requirements of agriculture, where the orescan be used as fertilisers. The determination of the spatialdistribution of iron oxyhydroxides becomes crucial in plan-ning for the exploration of mineral resources. In remotesensing, satellite and airborne multispectral or hyperspectralsensors are used to measure the properties of the land, seaand atmosphere. Compared to the most traditional methods,this technique offers the possibility of covering large areasquickly and often at a relatively low cost. This method isgenerally used to monitor the state of the environment, toobserve and study Earth surface processes and to maplithologies and natural resources, such as iron ore deposits.The multispectral sensors carried by the Thematic Mapper(TM) and the Enhanced Thematic Mapper plus (ETM+)mounted on the Landsat satellites are the most used inmineral exploration (Salem et al. 2011). Interesting resultswere obtained using the TM/ETM+ data in mapping iron-rich deposits (Dogan 2008, 2009; Ferrari 1992; Kaufmann1988; Kenea 1997; Kenea and Haenisch 1996; Sabins1999). For instance, iron oxides were mapped in theZagros Belt (Tangestani and Moore 2000), in Sudan(Elsayed Zeinelabdein and Albiely 2008) and in Egypt(Ramadan and Kotny 2004).Various image-processing tech-niques (band ratios, colour composites, principal componenttransformation, intensity hue saturation decorrelation pro-cessing) aimed at emphasising band spectral contrast havebeen used to map mineral distributions, such as those of ironoxides (Al Rawashdeh et al. 2006; Dehnavi et al. 2010;Madani 2009; Shalaby et al. 2010). Other more recentremote sensing data have been used to enhance the detectionof iron ore deposits but must be purchased, while the
A. Ciampalini (*) : F. Garfagnoli :B. Antonielli : S. MorettiDepartment of Earth Sciences, University of Firenze,Via La Pira 4,50121 Firenze, Italye-mail: [email protected]
G. RighiniENEA (Italian National Agency for New Technologies,Energy and Sustainable Economic Development),Via Martiri di Monte Sole 4,40129 Bologna, Italy
Arab J GeosciDOI 10.1007/s12517-012-0725-0
Author's personal copy

Landsat ETM+ data are free. The correct choice of enhance-ment method is crucial to highlight the target mineral. Theresearch described in this paper has been conducted in theframework of a project executed in cooperation with theCooperation Office of the Saharawi Arab DemocraticRepublic (SADR), which has the final goal of enhancing thedevelopment and emancipation of the Saharawi populationthrough the discovery of new economic mineral deposits. Theaim of this work is to evaluate the presence of iron ore depositsin the northeastern part of the Western Sahara using remotesensing techniques (Landsat ETM+ imagery). The selectedarea (Fig. 1) is not easily accessible due to the present politicalsituation in that area and remains almost completely unex-plored, with few detailed geological maps and other ancillarydata. To overcome these problems, a field campaign wasperformed in the primary test area in the SADR. A secondtest site 350 km to the east in the Djebilet area of southernAlgeria (Fig. 1) was chosen as a comparison and studied withthe same techniques; it was characterised by the same lithol-ogies and hosted three well-known iron ore deposits. Two ofthem (Gara Centre and Gara East) were considered in thisstudy. The data collected in Western Sahara during the fieldcampaign, the bibliographic data regarding the mineralogyand geochemistry of the Algeria test site (Guerrak 1988a, b,1991) and the processed images of Algeria have been used toadjust the results obtained from the Western Sahara images.This adjustment was made given the assumptions that thesame succession outcropping in Western Sahara has similarspectral properties and may host iron deposits, as well. Thesamples collected in the Western Sahara test site for ground
truth have been used to validate the remotely sensed imagesthat have been processed. We present the results as colourcomposites from the most suitable enhancements using bandratioing, as principal component analysis (PCA) and to notethe occurrence of possible iron ore deposits inWestern Sahara.ITTVS software ENVI® 4.7 and ILWIS 3.3 were used toenhance the selected images.
Geological setting
After a preliminary interpretation of the ETM + multispec-tral images, two test sites have been selected. The first islocated in southwestern Algeria near the border withMauritania (Fig. 1). The second area is located in the north-ern part of the Liberated Territories of Western Sahara and issurrounded by the Moroccan defence wall to the north andthe Mauritanian frontier to the south (Fig. 1). The Algeriansite was selected because it is formed by the samePalaeozoic sedimentary sequence outcropping in WesternSahara. In Algeria, the stratigraphy and the location of themajor oolitic iron ore deposits (hematite–chamosite–sider-ite-bearing formations with an oolitic texture and lenticularbeds) are well-known (Guerrak 1988a, b, 1991; Guerrak andChauvel 1985; Lubeseder et al. 2009), whereas no detailedstudies of the geology of Western Sahara exist. Both areasare located along the southern flank of the WSW–ENE-oriented Tindouf Basin, which is approximately 800 kmlong (Fig. 1). The sediments deposited in the TindoufBasin range date from the Cambrian to Quaternary
Fig. 1 Schematic geological map of Western Africa and locations of the study areas (modified from Guerrak 1988b)
Arab J Geosci
Author's personal copy

(Villeneuve 2005), but the complete sedimentary successionis exposed only along the flanks of the basin. While thenorthern flank has been extensively studied, detailed geo-logical findings about the southern flank have yet to bepublished. The sedimentary succession of the TindoufBasin overlaps the Reguibat Shield southwards along thesouthern flank, where the succession is thinnest and almostundisturbed (Guerrak 1988b). The Precambrian ReguibatShield is formed by Archaean terrains older than 3.5 Ga(Potrel et al. 1996). The sedimentary wedge deepens gentlynorthward toward the basin depocentre (Lubeseder et al.2009). The sediments of the southern flank have been stud-ied in detail in Algeria near the village of Djebilet (Fig. 2)(Guerrak 1988a, b), where a representative sequence cropsout. The target of this paper concerns the Ordovician–LowerDevonian part of the sedimentary sequence, where iron oredeposits have been detected in Algeria. The oldest sedi-ments occurring in the study area consist of Cambro-Ordovician continental sandstones, which have a thicknessthat varies between 0 and 70 m (Guerrak 1988a, b). Thesedeposits comprise a coarsening upwards sequence depositedwithin shallow shelf environments (Guerrak 1991). TheSilurian deposits, 80 to 200 m thick, correspond to a finingupward sequence representing a marine transgressionformed by green and purple shales rich in graptolites(Legrand 1969). The Silurian deposits are overlain by athick sequence (as much as 650 m) of Devonian sediments(Guerrak 1988b; Villeneuve 2005). Within the LowerDevonian deposits, three coarsening upward sequencesand one fining upward sequence were recognised (Guerrak1988a, b).
The first Devonian sequence (Lochkovian) represents aprogradation of the environments from offshore to a shorefaceand consists of mudstones with fine-grained sandstone layers.These sediments measuring 6 to 30 m in thickness are partic-ularly rich in fossils (e.g. Brachiopods, Tentaculites, Bivalves,Corals and Crinoids). In the Djebilet area, the uppermostsediments are characterised by the lenticular calcareous sand-stones of the shoreface environment, which are considered tobe local ironstones deposits (LOIDs) by Guerrak (1991; seebelow) but are lacking in economic interest. The Lochkovianmudstones, which are notably rich in fossils, were recognisedduring the field survey in the Western Sahara test site, but thesequence was lacking in calcareous sandstones.
The second coarsening upward sequence has a transgres-sive base and shows progradation of the depositional envi-ronments, passing from the offshore mudstones andsiltstones to the shoreface sandstones (barrier island envi-ronment), foreshore sandstones characterised by tabularcross-bedding (beach sediments) and finally to continentaldeposits, which consist of aeolian dunes with tabular–planarcross-bedding and fossil vegetation (Lemoigne 1967). In theWestern Sahara test site, this coarsening upwards sequenceis primarily composed of offshore mudstones and siltstonesand shoreface sandstones.
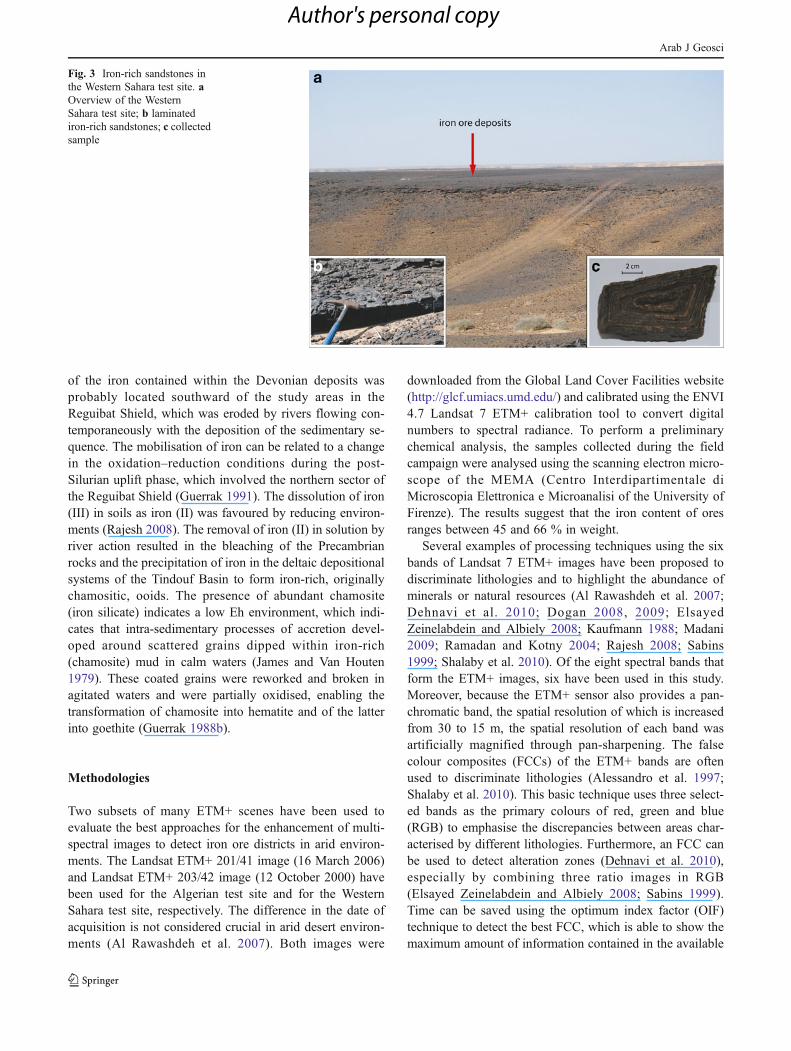
The last coarsening upward sequence (Pragian), measur-ing 6 to 30 m in thickness, shows a transition from theforeshore, parallel laminated argillaceous sandstones to thesandstones containing iron ore ooliths (Fig. 3), depositedwithin a lagoon or embayment environment and character-ised by an upward decrease in quartz content to form richiron ore. The iron-rich sandstones are widespread in theWestern Sahara test site, where they were recognised andsampled (Fig. 3).
During the Emsian stage (Lower Devonian), a new trans-gression covered the entire Sahara platform, allowing thedeposition of a fining upward sequence (Legrand 1967),formed by shallow shelf deposits (Guerrak 1988b) consist-ing of conglomerates, sandstones and siltstones and organ-ised in a 10-m-thick fining upward sequence. The lastcoarsening upward sequence is the most interesting because,in Algeria, the iron ores have also been found within it. Twotypes of oolitic ironstone sandstone deposits (OISs) wererecognised by Guerrak (1988b) near Djebilet (Algeria): theextensive iron deposits (EXID-OIS) extend over ten toseveral hundred kilometres but are only a few metres thickand the local iron deposits (LOID-OIS) characterised by arestricted extension measuring as many as 30 m thick. TheOISs classified as LOIDs (Guerrak 1988a, b) in southernAlgeria are economically more important than the EXID.
From a mineralogical point of view, the iron ore depositsconsist of magnetite, hematite, goethite, maghemite, chamo-site, siderite and pyrite, but magnetite, chamosite and hema-tite are the most representative (Guerrak 1988b). The source
Fig. 2 Schematic geological map of the Djebilet (Algeria) test site(modified from Guerrak 1988b)
Arab J Geosci
Author's personal copy
of the iron contained within the Devonian deposits wasprobably located southward of the study areas in theReguibat Shield, which was eroded by rivers flowing con-temporaneously with the deposition of the sedimentary se-quence. The mobilisation of iron can be related to a changein the oxidation–reduction conditions during the post-Silurian uplift phase, which involved the northern sector ofthe Reguibat Shield (Guerrak 1991). The dissolution of iron(III) in soils as iron (II) was favoured by reducing environ-ments (Rajesh 2008). The removal of iron (II) in solution byriver action resulted in the bleaching of the Precambrianrocks and the precipitation of iron in the deltaic depositionalsystems of the Tindouf Basin to form iron-rich, originallychamositic, ooids. The presence of abundant chamosite(iron silicate) indicates a low Eh environment, which indi-cates that intra-sedimentary processes of accretion devel-oped around scattered grains dipped within iron-rich(chamosite) mud in calm waters (James and Van Houten1979). These coated grains were reworked and broken inagitated waters and were partially oxidised, enabling thetransformation of chamosite into hematite and of the latterinto goethite (Guerrak 1988b).
Methodologies
Two subsets of many ETM+ scenes have been used toevaluate the best approaches for the enhancement of multi-spectral images to detect iron ore districts in arid environ-ments. The Landsat ETM+ 201/41 image (16 March 2006)and Landsat ETM+ 203/42 image (12 October 2000) havebeen used for the Algerian test site and for the WesternSahara test site, respectively. The difference in the date ofacquisition is not considered crucial in arid desert environ-ments (Al Rawashdeh et al. 2007). Both images were
downloaded from the Global Land Cover Facilities website(http://glcf.umiacs.umd.edu/) and calibrated using the ENVI4.7 Landsat 7 ETM+ calibration tool to convert digitalnumbers to spectral radiance. To perform a preliminarychemical analysis, the samples collected during the fieldcampaign were analysed using the scanning electron micro-scope of the MEMA (Centro Interdipartimentale diMicroscopia Elettronica e Microanalisi of the University ofFirenze). The results suggest that the iron content of oresranges between 45 and 66 % in weight.
Several examples of processing techniques using the sixbands of Landsat 7 ETM+ images have been proposed todiscriminate lithologies and to highlight the abundance ofminerals or natural resources (Al Rawashdeh et al. 2007;Dehnavi et al. 2010; Dogan 2008, 2009; ElsayedZeinelabdein and Albiely 2008; Kaufmann 1988; Madani2009; Ramadan and Kotny 2004; Rajesh 2008; Sabins1999; Shalaby et al. 2010). Of the eight spectral bands thatform the ETM+ images, six have been used in this study.Moreover, because the ETM+ sensor also provides a pan-chromatic band, the spatial resolution of which is increasedfrom 30 to 15 m, the spatial resolution of each band wasartificially magnified through pan-sharpening. The falsecolour composites (FCCs) of the ETM+ bands are oftenused to discriminate lithologies (Alessandro et al. 1997;Shalaby et al. 2010). This basic technique uses three select-ed bands as the primary colours of red, green and blue(RGB) to emphasise the discrepancies between areas char-acterised by different lithologies. Furthermore, an FCC canbe used to detect alteration zones (Dehnavi et al. 2010),especially by combining three ratio images in RGB(Elsayed Zeinelabdein and Albiely 2008; Sabins 1999).Time can be saved using the optimum index factor (OIF)technique to detect the best FCC, which is able to show themaximum amount of information contained in the available
Fig. 3 Iron-rich sandstones inthe Western Sahara test site. aOverview of the WesternSahara test site; b laminatediron-rich sandstones; c collectedsample
Arab J Geosci
Author's personal copy
bands (Alessandro et al. 1997; Chavez et al. 1982; Patel andKaushal 2011; Qaid and Basavarajappa 2008; Zumsprekeland Prinz 2000). The FCCs with the highest OIF valuestatistically correspond to the more informative band com-binations, which are composed of the less correlated bandswith the highest standard deviation. The differences in con-trast and colour tones provide information concerning thelithologies and/or the occurrence of altered zones. The cal-culation of the OIF is based on the amount of total varianceand on the correlation between bands (Chavez et al. 1982).The band ratios of Landsat ETM+ have been extensivelyused to produce geological and alteration maps because theratioing procedure reduces the effect of variations in topog-raphy and albedo, while this procedure highlights the differ-ences in shape of the spectral reflectance curves (Howari etal. 2007; Pease et al. 1999; Sabins 1999). The iron oxide andsulphate minerals associated with hydrothermally altered orweathered rocks have been extensively investigated usingband ratios (Al Rawashdeh et al. 2007; Dehnavi et al. 2010;Dogan 2008, 2009; Elsayed Zeinelabdein and Albiely 2008;Kaufmann 1988; Madani 2009; Ramadan and Kotny 2004;Sabins 1999; Shalaby et al. 2010). Usually, the six multi-spectral ETM+ bands are highly correlated and cause prob-lems in spectral redundancy. A reduction of the redundancyallows for the compression of the amount of data required todescribe a multispectral image. The PCA is generally usedto compress the multispectral data sets by calculating a newcoordinate system. This technique is a notably useful
multivariate statistical method applied to multiple correlatedbands to obtain new uncorrelated components (Loughlin1991), known as principal components (PCs), which canbe analysed and used to create FCCs in RGB (AlRawashdeh et al. 2007; Alessandro et al. 1997; Kaufmann1988; Kenea and Haenisch 1996; Siljestrom et al. 1997;Zumsprekel and Prinz 2000). The first PC accounts for asmuch of the variability in the data as possible (i.e. it has ahigh correlation). Each succeeding component axis in turn“consumes” the highest possible variance in the remainingdata space and is orthogonal to (uncorrelated with) thepreceding components. The FCCs created using the PCsobtained is considered the most revealing technique to de-tect the areas characterised by superficial alteration(Loughlin 1991). The PCA transformation can be appliedusing different procedures. The most commonly used PCAtransformation is the unstandardised PCA of the six reflec-tive bands using the covariance matrix for the entire scene(Al Rawashdeh et al. 2007; Alessandro et al. 1997; Aydal etal. 2007; Kaufmann 1988; Kenea and Haenisch 1996;Lough l in 1991 ; Zumspreke l and Pr inz 2000) .Alternatively, the standardised PCA using the correlationmatrix proposed by Kenea and Haenisch (1996) increasesthe signal-to-noise ratio (SNR; Ready and Wintz 1973;Singh and Harrison 1985) by reducing the noise distribu-tion. Alteration maps can be obtained using the selectiveprincipal component analysis (SPCA) (Loughlin 1991),which involves analysing part of the available bands
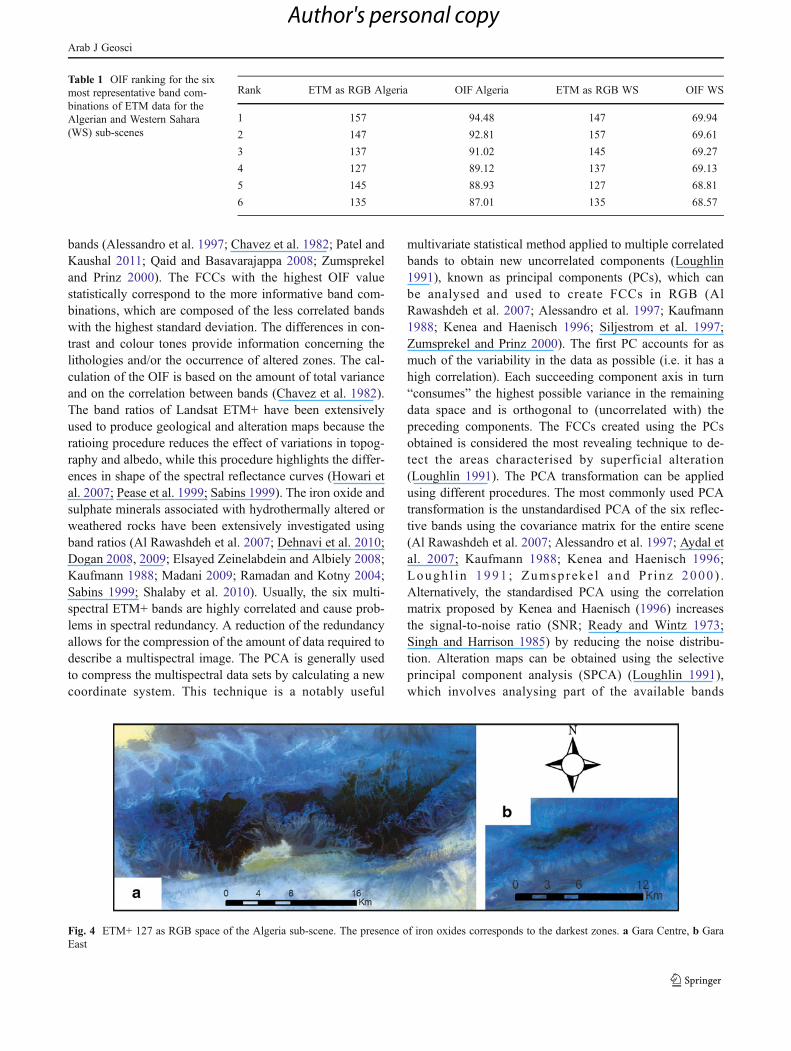
Table 1 OIF ranking for the sixmost representative band com-binations of ETM data for theAlgerian and Western Sahara(WS) sub-scenes
Rank ETM as RGB Algeria OIF Algeria ETM as RGB WS OIF WS
1 157 94.48 147 69.94
2 147 92.81 157 69.61
3 137 91.02 145 69.27
4 127 89.12 137 69.13
5 145 88.93 127 68.81
6 135 87.01 135 68.57
Fig. 4 ETM+ 127 as RGB space of the Algeria sub-scene. The presence of iron oxides corresponds to the darkest zones. a Gara Centre, b GaraEast
Arab J Geosci
Author's personal copy

(usually four) related to the spectral signatures of specifictargets.
Results
Compositing
Table 1 shows the OIF ranking of the six most significantthree-band combinations for the Algeria and Western Saharasub-scenes. The OIF for the Algerian sub-scene (Table 1)
suggests that the 157-band combination statistically con-tains the maximum information, showing a value of 94.48,whereas for Western Sahara (Table 1), the best combinationis 147 (OIF069.94). Despite the slight variation of the OIFvalues throughout the Western Sahara test site, it highlightsthe lithological boundaries, which correspond to thosereported in the 1:1,000,000 geological map of Morocco(Saadi et al. 1985) with almost complete precision; however,it is not suitable to detect the iron ore deposits. On thecontrary, for the Algerian test site, ETMs 157 and 147 asRGB highlight both the iron ore deposits in Gara East and
Fig. 5 ETM+ band ratios 3/5, 4/1 and 5/7 as RGB, respectively. The presence of iron oxides corresponds to the reddish zones. aWestern Sahara, bGara Centre, c Gara East
Fig. 6 Negation of the ratio image of ETM+ bands 4/1 in southern Algeria. The presence of iron oxides corresponds to the brightest zones. Therectangles represent the Gara Centre and Gara East test sites
Arab J Geosci
Author's personal copy
Gara Centre (Djebilet) described by Guerrak (1988b), butthe best combination for differentiating lithologies results is127 as RGB (Fig. 4). The FCCs using band ratios in RGBsuggested by Sabins (1999) used the combination of theratios 3/5, 3/1 and 5/7 in RGB, respectively, to detect alteredrocks characterised by both ferric iron and hydrothermalclays. This colour composite proved to be notably usefulin highlighting the areas characterised by the presence ofiron ore deposits both in Djebilet and in Western Sahara.
The same results were obtained by replacing the ratio 3/1with 4/1 (Fig. 5) for the reasons described in the nextparagraph. A similar output was obtained using the com-posite 5/7, 5/4 and 3/1 in RGB, respectively, as suggested byElsayed Zeinelabdein and Albiely (2008), to detect thealtered rocks containing hydroxyl and iron oxides (ferricand ferrous), whereas the FCC produced using bands 5/7,3/1 and 4/3 suggested by the same authors does not fit foreither study area. Dehnavi et al. (2010) proposed an FCC
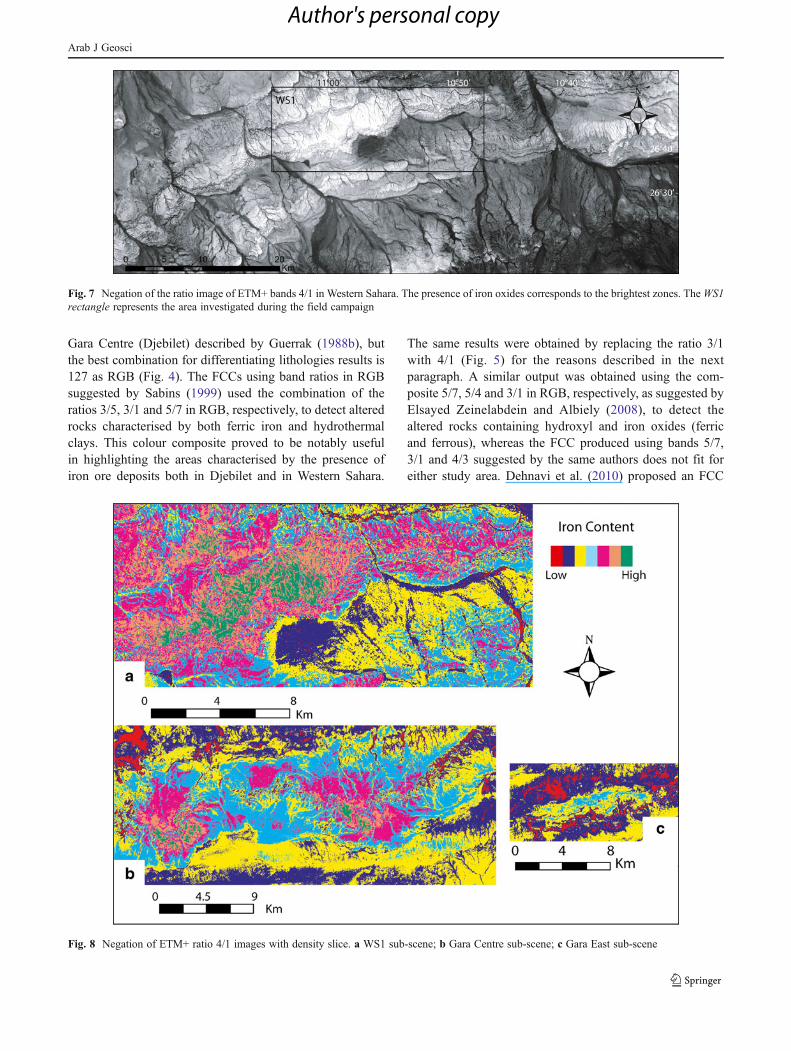
Fig. 7 Negation of the ratio image of ETM+ bands 4/1 in Western Sahara. The presence of iron oxides corresponds to the brightest zones. TheWS1rectangle represents the area investigated during the field campaign
Fig. 8 Negation of ETM+ ratio 4/1 images with density slice. a WS1 sub-scene; b Gara Centre sub-scene; c Gara East sub-scene
Arab J Geosci
Author's personal copy
based on band subtractions b1−b2 (R), b4−b2 (G) and b5−b7 (B), but this FCC is not suitable to map the iron oredeposits for the selected test sites.
Band ratioing
The 3/1 ratio image is the most used to detect iron oxy-hydroxides by enhancing their redness in natural colour (AlRawashdeh et al. 2007; Dogan 2008, 2009; ElsayedZeinelabdein and Albiely 2008; Madani 2009; Ramadanand Kotny 2004; Shalaby et al. 2010), as they usuallyexhibit low blue reflectance (band 1) and high red reflec-tance (band 3) (Dehnavi et al. 2010; Sabins 1999). Thus, the3/1 ratio image usually highlights the presence of hematite
and goethite with high values (Al Rawashdeh et al. 2007).The high concentrations of ferric iron can be emphasisedwith a colour density slice, which transforms the value ofthe 3/1 ratio in every pixel into a series of density ranges thatare assigned colours. The 3/1 ratio map and the relateddensity slice elaboration in both the Western Sahara andthe Algeria test sites partially fit to the ground truth infor-mation collected during the field investigation for the formercase and to the bibliographic data (Guerrak 1988a, b) for thelatter, respectively. As a matter of fact, the areas within thetest sites, which are characterised by the presence of ferriciron, correspond to the darkest zones in the 3/1 ratio imageinstead of the bright grey as suggested by many authors (AlRawashdeh et al. 2007; Dogan 2008, 2009; Elsayed
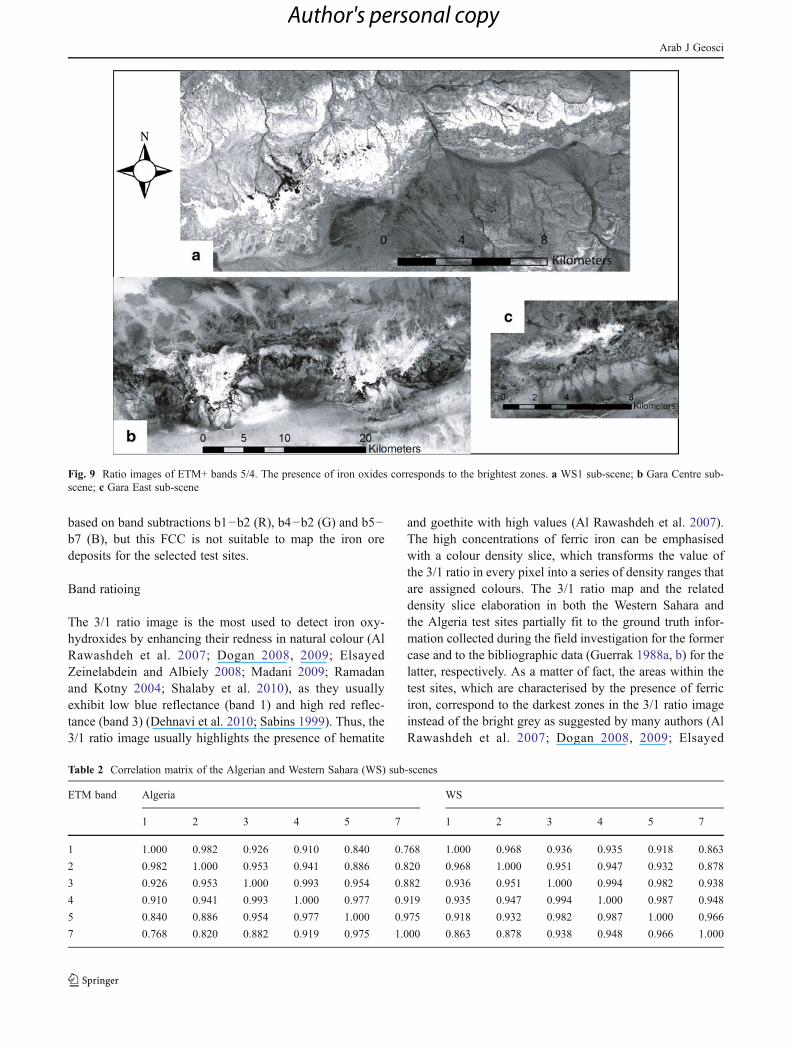
Fig. 9 Ratio images of ETM+ bands 5/4. The presence of iron oxides corresponds to the brightest zones. a WS1 sub-scene; b Gara Centre sub-scene; c Gara East sub-scene
Table 2 Correlation matrix of the Algerian and Western Sahara (WS) sub-scenes
ETM band Algeria WS
1 2 3 4 5 7 1 2 3 4 5 7
1 1.000 0.982 0.926 0.910 0.840 0.768 1.000 0.968 0.936 0.935 0.918 0.863
2 0.982 1.000 0.953 0.941 0.886 0.820 0.968 1.000 0.951 0.947 0.932 0.878
3 0.926 0.953 1.000 0.993 0.954 0.882 0.936 0.951 1.000 0.994 0.982 0.938
4 0.910 0.941 0.993 1.000 0.977 0.919 0.935 0.947 0.994 1.000 0.987 0.948
5 0.840 0.886 0.954 0.977 1.000 0.975 0.918 0.932 0.982 0.987 1.000 0.966
7 0.768 0.820 0.882 0.919 0.975 1.000 0.863 0.878 0.938 0.948 0.966 1.000
Arab J Geosci
Author's personal copy

Zeinelabdein and Albiely 2008; Madani 2009; Shalaby et al.2010). A simple negation of this ratio allows us to highlightthe presence of ferric iron. The usefulness of this band ratiomight be reduced for one or more of four main reasons: (1)the slope between bands 3 and 1 is usually weak if com-pared to the combination of the other short-wavelengthinfrared (SWIR) bands (Kaufmann 1988); (2) the ironoxides present in the test sites do not have a hydrothermalorigin, but they originated through an intra-sedimentaryaccretion mechanism developed around grains scattered iniron-rich mud in quiet water (James and Van Houten 1979;Rohrlich et al. 1969); (3) the sandstones containing the ironoxides are characterised by notably low reflectance, as theyappear very dark; and (4) the ratio of 3/1 is suitable for ferriciron, whereas the test sites could be characterised mainly byferrous oxides, although the chemical data for the GaraDjebilet area actually suggest an high concentration of ferriciron (Guerrak 1988b). Other band ratios were proposed to berelated to ferric and ferrous iron. The ratio of 4/2 proposedby Al Rawashdeh et al. (2007) to highlight ferric iron gavesimilar results with respect to the 3/1 ratio, displaying thesmallest values in the iron oxide-rich areas. The ratio of 4/5has a black image signature, as in the Bahrah area (SaudiArabia) (Madani 2009), but it is not distinctive for the ironoxide-rich zones for either the Algeria or the Western Sahara
test sites because other iron-poor areas show the sameresponse. No valuable results have been obtained using theratios 7/1 and 5/1, as suggested by Kaufmann (1988). Theband ratio 4/1, based on iron oxides, shows two mainabsorption peaks in bands 1 (0.35 μm for the ferric iron;0.45 μm for the ferrous iron) and 4 (0.82 μm for the ferriciron; approximately 1.0 μm for ferrous iron), resulting in thebest band ratio to detect iron oxide-rich zones, related to thestudied iron ore deposits, in both the Western Sahara and theAlgeria test sites. In the visual inspection of the 4/1 ratiomap, the areas characterised by the presence of iron oxidesappear as dark pixels. These images were negated (Figs. 6and 7) and associated with a density slice to enhance theoccurrence of iron oxides (Fig. 8). The better result given bythe 4/1 ratio is probably related to the high content ofchamosite (Guerrak 1988a, b). The presence of iron hydrox-ides shifts the reflectance peak toward higher wavelengthswith respect to the ferric minerals that are usually charac-terised by a reflectance peak corresponding to the ETM+band 3 (Rajesh 2004). The 5/4 band ratio can be includedamong the most used band ratios for ferrous minerals iden-tification (Dogan 2008, 2009; Elsayed Zeinelabdein andAlbiely 2008; Kaufmann 1988). This ratio shows betterresults with respect to the others mentioned, especially inAlgeria, where it highlights the iron ore deposits almost
Table 3 Covariance matrix of the Algerian and Western Sahara (WS) sub-scenes
ETMband
Algeria WS
1 2 3 4 5 7 1 2 3 4 5 7
1 661.879 743.260 553.400 682.395 425.700 318.742 440.569 500.366 432.109 349.417 196.041 106.947
2 743.260 865.544 651.401 806.750 513.346 389.533 500.366 606.438 515.476 415.207 233.636 127.928
3 553.400 651.401 540.046 672.882 436.431 330.860 432.109 515.476 484.073 389.272 219.900 121.928
4 682.395 806.750 672.882 849.468 560.600 432.247 349.417 415.207 389.272 316.682 178.779 99.622
5 425.700 513.346 436.431 560.600 387.624 309.803 196.041 233.636 219.900 178.779 103.532 58.040
7 318.742 389.533 330.860 432.247 309.803 260.429 106.947 127.928 121.928 99.622 58.040 34.876
Table 4 Eigenvector loadings for the Algerian and Western Sahara (WS) sub-scenes
ETM band Algeria WS
PC1 PC2 PC3 PC4 PC5 PC6 PC1 PC2 PC3 PC4 PC5 PC6
1 0.42 0.55 0.19 −0.69 0.01 −0.07 0.47 0.52 0.71 −0.01 0.05 −0.004
2 0.50 0.42 0.25 0.71 −0.08 0.04 0.55 0.45 −0.69 −0.08 −0.02 0.01
3 0.40 −0.10 −0.55 0.06 0.62 −0.37 0.49 −0.48 −0.003 0.52 0.49 −0.002
4 0.50 −0.29 −0.41 −0.11 −0.34 0.61 0.40 −0.41 0.09 −0.03 −0.77 0.26
5 0.32 −0.44 0.17 −0.05 −0.50 −0.64 0.23 −0.28 0.04 −0.50 0.03 −0.79
7 0.25 −0.48 0.64 −0.07 0.48 0.25 0.12 −0.21 0.04 −0.68 0.39 0.56
Eigenvalue 3,359.52 161.13 30.55 10.51 2.03 1.25 1,913.59 48.72 16.03 4.95 1.76 1.12
Variance (%) 94.24 4.52 0.85 0.30 0.05 0.04 96.35 2.44 0.81 0.25 0.09 0.06
Arab J Geosci
Author's personal copy
exactly (Fig. 9). A notably similar result was obtained usingthe 7/4 ratio proposed by Kaufmann (1988). The successfulresults obtained with the latter band ratios could be relatedto the high content in chamosite in the analysed rocks.
Principal component analysis
A descriptive statistic (correlation and covariance matrices)of the available reflective bands is needed to evaluate anddiscuss the results obtained using the PCA. The bands ofboth selected sub-scenes are strongly correlated (Table 2).Most of the total variance will be represented in the first fewcomponents.
Unstandardised PCA (covariance matrix)
The transformation was applied to both of the subsets—Algeria (Djebilet) and Western Sahara—using the relatedcovariance matrices (Table 3). PC1 shows the highest vari-ance (94.24, 96.35 %) and moderate to high positive load-ings from all of the bands containing the maximum amountof variation (Table 4). Generally, the values of PC1 dependon both topographic information and surface albedo, whichare highly correlated among all bands (Table 4) (Loughlin1991; Kaufmann 1988; Kenea and Haenisch 1996). PC2generally highlights the differences in the spectrum between
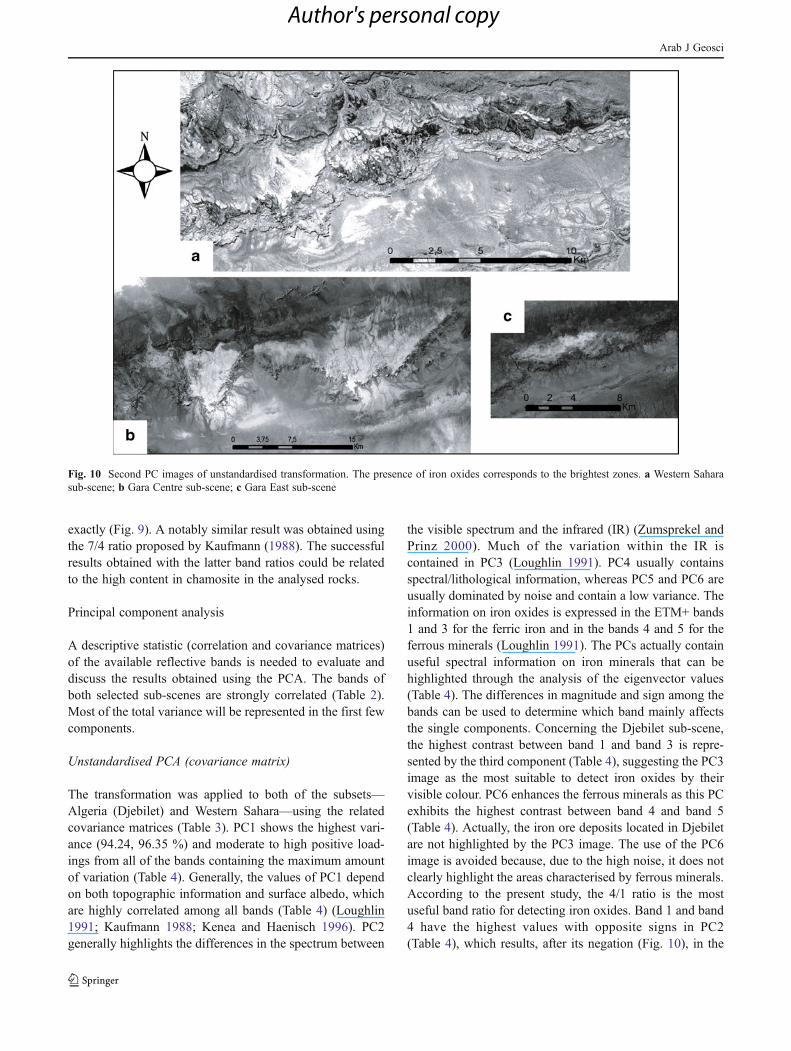
the visible spectrum and the infrared (IR) (Zumsprekel andPrinz 2000). Much of the variation within the IR iscontained in PC3 (Loughlin 1991). PC4 usually containsspectral/lithological information, whereas PC5 and PC6 areusually dominated by noise and contain a low variance. Theinformation on iron oxides is expressed in the ETM+ bands1 and 3 for the ferric iron and in the bands 4 and 5 for theferrous minerals (Loughlin 1991). The PCs actually containuseful spectral information on iron minerals that can behighlighted through the analysis of the eigenvector values(Table 4). The differences in magnitude and sign among thebands can be used to determine which band mainly affectsthe single components. Concerning the Djebilet sub-scene,the highest contrast between band 1 and band 3 is repre-sented by the third component (Table 4), suggesting the PC3image as the most suitable to detect iron oxides by theirvisible colour. PC6 enhances the ferrous minerals as this PCexhibits the highest contrast between band 4 and band 5(Table 4). Actually, the iron ore deposits located in Djebiletare not highlighted by the PC3 image. The use of the PC6image is avoided because, due to the high noise, it does notclearly highlight the areas characterised by ferrous minerals.According to the present study, the 4/1 ratio is the mostuseful band ratio for detecting iron oxides. Band 1 and band4 have the highest values with opposite signs in PC2(Table 4), which results, after its negation (Fig. 10), in the
Fig. 10 Second PC images of unstandardised transformation. The presence of iron oxides corresponds to the brightest zones. a Western Saharasub-scene; b Gara Centre sub-scene; c Gara East sub-scene
Arab J Geosci
Author's personal copy
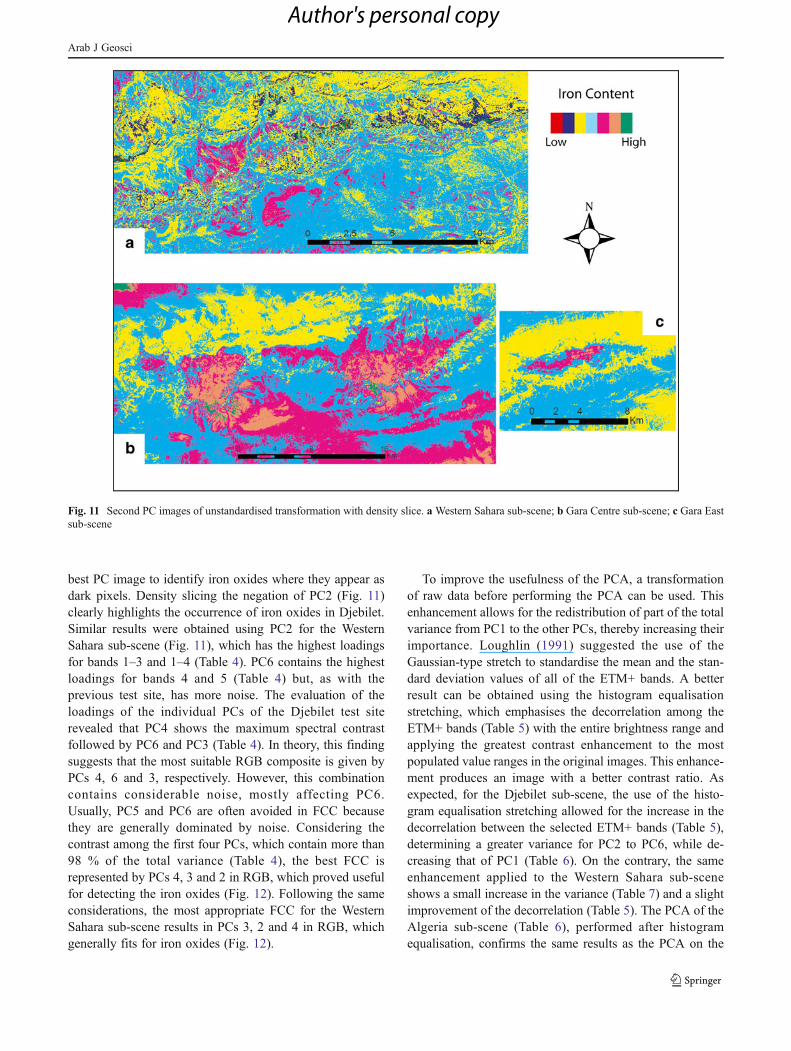
best PC image to identify iron oxides where they appear asdark pixels. Density slicing the negation of PC2 (Fig. 11)clearly highlights the occurrence of iron oxides in Djebilet.Similar results were obtained using PC2 for the WesternSahara sub-scene (Fig. 11), which has the highest loadingsfor bands 1–3 and 1–4 (Table 4). PC6 contains the highestloadings for bands 4 and 5 (Table 4) but, as with theprevious test site, has more noise. The evaluation of theloadings of the individual PCs of the Djebilet test siterevealed that PC4 shows the maximum spectral contrastfollowed by PC6 and PC3 (Table 4). In theory, this findingsuggests that the most suitable RGB composite is given byPCs 4, 6 and 3, respectively. However, this combinationcontains considerable noise, mostly affecting PC6.Usually, PC5 and PC6 are often avoided in FCC becausethey are generally dominated by noise. Considering thecontrast among the first four PCs, which contain more than98 % of the total variance (Table 4), the best FCC isrepresented by PCs 4, 3 and 2 in RGB, which proved usefulfor detecting the iron oxides (Fig. 12). Following the sameconsiderations, the most appropriate FCC for the WesternSahara sub-scene results in PCs 3, 2 and 4 in RGB, whichgenerally fits for iron oxides (Fig. 12).
To improve the usefulness of the PCA, a transformationof raw data before performing the PCA can be used. Thisenhancement allows for the redistribution of part of the totalvariance from PC1 to the other PCs, thereby increasing theirimportance. Loughlin (1991) suggested the use of theGaussian-type stretch to standardise the mean and the stan-dard deviation values of all of the ETM+ bands. A betterresult can be obtained using the histogram equalisationstretching, which emphasises the decorrelation among theETM+ bands (Table 5) with the entire brightness range andapplying the greatest contrast enhancement to the mostpopulated value ranges in the original images. This enhance-ment produces an image with a better contrast ratio. Asexpected, for the Djebilet sub-scene, the use of the histo-gram equalisation stretching allowed for the increase in thedecorrelation between the selected ETM+ bands (Table 5),determining a greater variance for PC2 to PC6, while de-creasing that of PC1 (Table 6). On the contrary, the sameenhancement applied to the Western Sahara sub-sceneshows a small increase in the variance (Table 7) and a slightimprovement of the decorrelation (Table 5). The PCA of theAlgeria sub-scene (Table 6), performed after histogramequalisation, confirms the same results as the PCA on the
Fig. 11 Second PC images of unstandardised transformation with density slice. aWestern Sahara sub-scene; b Gara Centre sub-scene; c Gara Eastsub-scene
Arab J Geosci
Author's personal copy

raw data. PC3 still shows the highest contrast between bands1 and 3. PC6 enhances the ratio of 5/4, and PC2 containsinformation about the ratio of 4/1 (Table 6). Despite theincrease in the contrast between the eigenvector loadings,PC3 and PC6, as in the case of the raw data, proved to beunsuitable for identifying a possible occurrence of ferric orferrous iron (Table 6). PC2 highlights the iron oxides in lightgrey, and the PC2 image obtained using the raw data stillseems to work better in enhancing the contrasts amongbands. In the Western Sahara sub-scene, PC3 contains thehighest contrast both for the couples of bands 3–1 and 1–4(Table 7), but it was not useful for detecting the areas rich iniron oxides. Bands 4 and 5 are represented by PC5, which is
noisy. The FCCs created using the PCs characterised by thehighest loadings could not detect the iron ore deposits ineither of the sub-scenes.
Standardised PCA (correlation matrix)
Standardised PC transformation uses the correlation matrix(Table 2) instead of the covariance matrix (Table 3) toperform the PCA. Although this technique is less used inremote sensing, it yielded valuable results with respect tothe unstandardised PCA (Kenea and Haenisch 1996; Singhand Harrison 1985). In this case, the magnitude of PC1eigenvectors is more uniform, but the contribution of IR
Fig. 12 PCs 4, 3 and 2 as RGB for the Algeria sub-scene and PCs 3, 2and 4 as RGB for the Western Sahara. The presence of iron oxidescorresponds to the reddish zones in the Western Sahara test site and the
greenish areas in both of the Djebilet test sites. a Western Sahara sub-scene; b Gara Centre sub-scene; c Gara East sub-scene
Table 5 Correlation matrix of the Algerian and Western Sahara (WS) sub-scenes after the histogram equalisation stretching
ETM band Algeria WS
1 2 3 4 5 7 1 2 3 4 5 6
1 1.000 0.937 0.842 0.802 0.657 0.467 1.000 0.966 0.935 0.935 0.917 0.861
2 0.937 1.000 0.923 0.893 0.775 0.606 0.966 1.000 0.959 0.955 0.938 0.880
3 0.842 0.923 1.000 0.989 0.923 0.787 0.935 0.959 1.000 0.994 0.982 0.936
4 0.802 0.893 0.989 1.000 0.958 0.841 0.935 0.955 0.994 1.000 0.987 0.947
5 0.657 0.775 0.923 0.958 1.000 0.948 0.917 0.938 0.982 0.987 1.000 0.965
7 0.467 0.606 0.787 0.841 0.948 1.000 0.861 0.880 0.936 0.947 0.965 1.000
Arab J Geosci
Author's personal copy

bands is increased for both of the subsets (Tables 8 and 9).The examination of the variance distribution shows an in-crease in the values of PC2 to PC5 in the Djebilet sub-scene(Table 8) and of PC2 to PC6 in the Western Sahara (Table 9)with respect to the basic unstandardised PCA (Table 4). Theeigenvectors loading of the Djebilet sub-scene shows thatPC3 has the highest contrast between bands 1 and 3, whilePC6 has the greatest contrast between bands 4 and 5 andbetween bands 1 and 4 (Table 8). In the second sub-scene,the information about ratio 3/1 is statistically contained inPC3, which on ratio 4/5 is represented by PC5 while ratio 4/1 is described by PC6 (Table 9). A visual inspection of thePCs reveals that PC4 is the best one for highlighting the ironoxide-rich areas in the sub-scene showing the highest con-trast between band 1 and band 2. This result suggests thatband 2 and band 1 should be used together in a ratio todetect the iron oxides, but this result is not directly related tothe spectral characteristics of the iron minerals. The bestFCC, removing PC5 and PC6, which are extremely noisy,corresponds to PC4, PC2 and PC3 in RGB, respectively.This composite is useful to delimit the iron oxide-rich areasin both sub-scenes. The comparison between the statisticaldata obtained using the standardised PCA and the visualinspection of the single PCA images suggests that thistechnique must be used with caution because the resultsfrom the study of the single PCs seems not to be linked tothe spectral characteristic of the target minerals. The statis-tical improvement of the PCA from the raw data to morecomplex techniques, such as the stretching of the data or
standardised PCA, can be evaluated using the SNR,expressed in decibels, which represents the ratio betweenthe first eigenvalue and the maximum spectral band covari-ance or the maximum correlation value (Ready and Wintz1973; Singh and Harrison 1985). The increase in the SNR(Tables 10 and 11), especially for the first sub-scene, indi-cates a statistical improvement in the quality of the signal,thereby encouraging the use of the standardised PCA meth-od, even if the results from the visual inspection highlightsthat the unstandardised PCA fits better compared to theothers enhancement techniques.
Selective principal component analysis
The SPCA requires the reduction of the number of reflectivebands to enhance a particular spectral contrast related to aspecific mineral class (Aydal et al. 2007; Crosta and Moore1989; Loughlin 1991). This technique increases the reliabil-ity of a specific PC to detect the target minerals. In details,the SPCA is particularly useful to map the hydroxyl and ironoxides (Kenea 1997; Kenea and Haenisch 1996; Loughlin1991; Tangestani and Moore 2000, 2002). Bands 1, 3, 4 and5 were chosen to map the iron oxides. This set of bands isthe most suitable because iron oxides exhibit strong absorp-tion in Landsat ETM+ band 1 and high reflectance in bands3 and 4. Band 5 and band 7 are almost equivalent in thisanalysis (Loughlin 1991). The SWIR bands were not con-sidered to separate the information on the iron oxides fromthe hydroxyls. PC1 in the SPCA represents the albedo and
Table 6 Eigenvector loadingsfor the Algerian sub-scene afterthe histogram equalisationstretching
ETM band PC1 PC2 PC3 PC4 PC5 PC6 Mean SD
1 0.37 0.58 0.57 0.43 0.03 0.02 125.09 73.65
2 0.41 0.39 −0.04 −0.81 −0.17 −0.03 125.29 73.59
3 0.43 −0.04 −0.49 0.14 0.56 0.49 125.32 73.80
4 0.44 −0.81 −0.39 0.25 −0.07 −0.76 125.76 74.08
5 0.42 −0.17 −0.02 0.17 −0.71 0.41 124.89 74.24
7 0.38 −0.03 0.52 −0.21 0.39 −0.12 123.77 74.66
Eigenvalue 28,134.83 4,016.15 397.34 230.07 59.87 22.31
Variance (%) 85.62 12.22 1.21 0.70 0.18 0.07
Table 7 Eigenvector loadingsfor the Western Sahara sub-sceneafter the histogram equalisationstretching
ETM band PC1 PC2 PC3 PC4 PC5 PC6 Mean SD
1 0.40 0.58 0.52 0.48 0.02 0.05 125.78 73.76
2 0.40 0.44 −0.06 −0.79 −0.09 −0.06 125.97 73.64
3 0.41 −0.03 −0.48 0.14 0.44 0.61 125.87 73.96
4 0.41 −0.09 −0.38 0.22 0.20 −0.77 125.61 74.05
5 0.41 −0.26 −0.15 0.16 −0.83 0.15 124.02 74.16
7 0.41 −0.63 0.58 −0.22 0.15 0.02 122.00 75.26
Eigenvalue 31,442.11 1,004.58 286.90 153.60 67.22 26.66
Variance (%) 95.33 3.05 0.87 0.47 0.20 0.08
Arab J Geosci
Author's personal copy
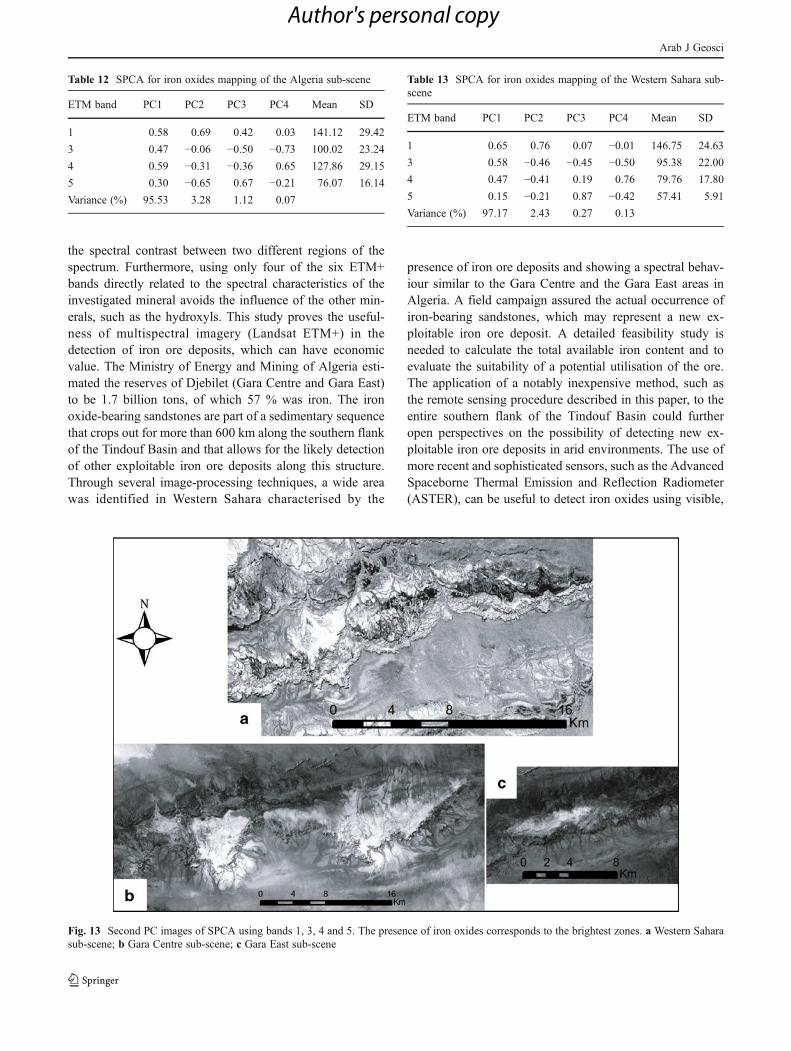
topographic shadowing (Loughlin 1991). Ratios 3/1 and 4/5have their maximum contrasts in PC3 (Table 12), whichshould highlight iron oxides as dark pixels, but visual in-spection of this PC seems not to be useful as evidence forthe presence of iron oxides. Once again, the best ratio tomap the iron-rich deposits is 4/1, which portrays them in thenegation of PC2 as bright pixels (Fig. 13). In the WesternSahara sub-scene, both the 3/1 and 4/1 ratios have theirhighest contrasts in PC2 (Table 13), thereby highlightingthe iron oxides as bright pixels (Fig. 13). This PC shows agood agreement with the field observations. On the contrary,the ratio 4/5 was not found to be useful because it isrepresented in PC4, which is notably noisy.
Discussion and conclusions
Two test sites, characterised by the presence of iron-richsandstones, were chosen to evaluate the effectiveness ofdifferent image-processing techniques to map iron oredeposits. The first test site is located near Djebilet, wheretwo iron mining areas (Gara Centre and Gara East) wereextensively studied (Guerrak 1988b). The second site, situ-ated in Western Sahara, approximately 350 km west of theDjebilet sites, is characterised by the same sedimentarysequence, and it was the target of the field campaign.Several processing techniques (band ratioing, FCC andPCA) among those described as effective to detect ironoxides were applied to two spatial subsets of the Landsat
ETM+ images to detect and map the iron ore deposits.Among the ETM+ band ratios used to highlight the occur-rence of iron oxides, the ratio of 4/1 resulted in the mosteffective detection, especially if associated with the relateddensity slicing for both the Algeria and the Western Saharasub-scenes. This ratio is not commonly described in theliterature. On the contrary, the more common 3/1 ratioyielded less satisfactory results, probably because of theorigin of the iron oxides: the 3/1 ratio is particularly suitableto highlight the iron oxides associated with hydrothermallyaltered rocks, whereas the iron oxides present in the studyareas have a syn-sedimentary origin. Certain diagnosticspectral features of iron oxides are represented in the ETM1 to ETM 4 bands. In particular, a charge transfer absorptionfeature is contained in ETM 1, a reflectance ramp is in ETM2, a crystal field absorption feature exists in ETM 3 and acrystal field absorption feature is in ETM 4. The spectralresponse may vary as a consequence of the oxidised orreduced condition of the considered iron within band 4,where the hydrothermally altered iron shows an absorptionpeak, whereas the goethite and hematite contained in theregolith show a moderate reflection. Thus, the ratio of 4/1proves to be more appropriated than that of 3/1 and givesbetter results if compared to the field observations andmineralogical information available in the literature or inprevious studies (Guerrak 1988b). The ratio of 5/4 proveduseful in highlighting the presence of ferrous minerals be-cause the greatest reflection for ferrous iron is representedwithin ETM+ band 5. Thus, the combination of ratios 4/1
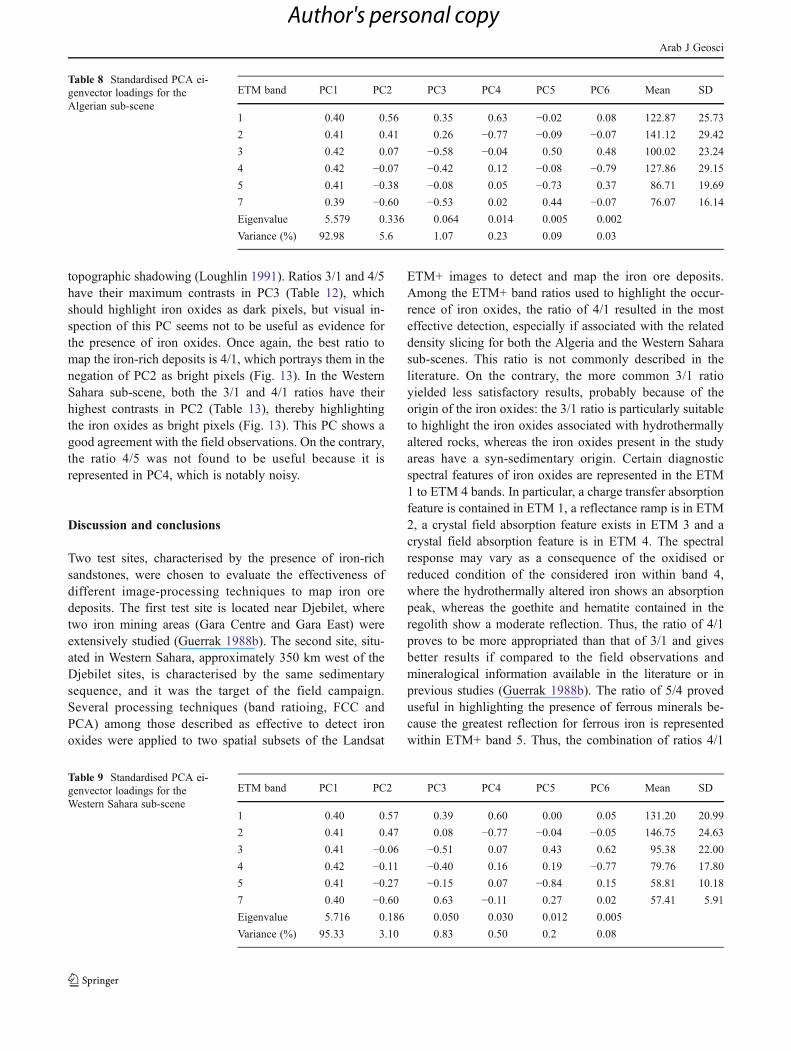
Table 8 Standardised PCA ei-genvector loadings for theAlgerian sub-scene
ETM band PC1 PC2 PC3 PC4 PC5 PC6 Mean SD
1 0.40 0.56 0.35 0.63 −0.02 0.08 122.87 25.73
2 0.41 0.41 0.26 −0.77 −0.09 −0.07 141.12 29.42
3 0.42 0.07 −0.58 −0.04 0.50 0.48 100.02 23.24
4 0.42 −0.07 −0.42 0.12 −0.08 −0.79 127.86 29.15
5 0.41 −0.38 −0.08 0.05 −0.73 0.37 86.71 19.69
7 0.39 −0.60 −0.53 0.02 0.44 −0.07 76.07 16.14
Eigenvalue 5.579 0.336 0.064 0.014 0.005 0.002
Variance (%) 92.98 5.6 1.07 0.23 0.09 0.03
Table 9 Standardised PCA ei-genvector loadings for theWestern Sahara sub-scene
ETM band PC1 PC2 PC3 PC4 PC5 PC6 Mean SD
1 0.40 0.57 0.39 0.60 0.00 0.05 131.20 20.99
2 0.41 0.47 0.08 −0.77 −0.04 −0.05 146.75 24.63
3 0.41 −0.06 −0.51 0.07 0.43 0.62 95.38 22.00
4 0.42 −0.11 −0.40 0.16 0.19 −0.77 79.76 17.80
5 0.41 −0.27 −0.15 0.07 −0.84 0.15 58.81 10.18
7 0.40 −0.60 0.63 −0.11 0.27 0.02 57.41 5.91
Eigenvalue 5.716 0.186 0.050 0.030 0.012 0.005
Variance (%) 95.33 3.10 0.83 0.50 0.2 0.08
Arab J Geosci
Author's personal copy
and 5/4 is particularly recommended to map iron oxideshaving a non-hydrothermal origin. The FCC enhancementtechnique was evaluated using the OIF to determine thestatistically most informative multispectral band combina-tion for both of the analysed ETM+ subsets. Among thepossible combinations, the 157 and 147 composites wereselected for the Djebilet and Western Sahara sub-scenes,respectively. Regarding the spatial distribution of iron oredeposits, only in the first case was there a good agreementbetween the information available from the literature(Guerrak 1988b) and either the field observations or theenhanced image. On the contrary, no correspondence wasobserved between the field data and the imagery in theWestern Sahara sub-scene. The use of raw band FCCs isgenerally suggested to discriminate different lithologies, aswell as structural features, but it is less recommendable inmineral detection because it is more interpretative withrespect to other techniques. A better result can be obtainedby constructing colour composite images using a combina-tion of three ETM+ band ratios instead of raw band compo-sites because this technique allows for the removal ofpossible brightness variations and highlights any spectraldifference between the bands. The 3/5, 4/1 and 5/7 inRGB, respectively, resulted as the most effective FCC todetect the iron ore deposits. The PCA is certainly the mostcomplex enhancement technique used in multispectral re-mote sensing. In this paper, the resulting decorrelated PCimages were used to discern effectively the iron oxides andthe related iron ore deposits with very satisfactory results.The unstandardised and standardised PCAs were comparedto evaluate the best enhancement method for the mapping ofiron ore deposits. A careful observation of the eigenvectormatrices and the visual inspection of each unstandardisedPC images suggest that PC2 is the most informative PCimage because it contains the highest contrast between band1 and band 4. Thus, the PCA confirms that the latter coupleof bands are the most informative concerning syn-sedimentary iron oxides, as also suggested by the evaluation
of the usefulness of single ratios. The equalisation histogramstretching was applied to the raw bands before performingthe PCA to increase the decorrelation between the bands. Inthis case, no sensible results were obtained with respect tothe unstandardised PCA of the raw bands, but an increase inthe noise of the PC images was observed. The standardisedPCA is usually used to obtain a significant improvement inthe SNR, thereby allowing a better definition of the PCAimages. The actual increase of the SNR from the unstandar-dised PCA to standardised PCA seems to not be related toan improvement in the PC image quality. The PCs contain-ing the highest contrasts do not exhibit a good agreementwith the field observations. The observation of the eigen-vector loadings indicates PC5 and PC6 as the most infor-mative images to map iron oxides, but they are notablynoisy, whereas a visual inspection suggests that bands 1and 2 can be used to detect iron oxides, even if no directrelationship exists between these bands and iron oxide spec-tral characteristics. Valuable results were obtained usingthree PC images to create an FCC in RGB. From a statisticalpoint of view, the best colour composite is formed by thethree selected PC images with the highest variance; thus,PC1, having the highest variance, is always part of theFCCs. This large variance is partly due to the topographicinformation contained in the first PC, which should beremoved to avoid the influence of morphological evidence.PC2, PC3 and PC4 were used to create satisfactory FCCs toenhance iron oxides. The SPCA on bands 1, 3, 4 and 5 wastested in both of the selected areas because it is consideredthe most appropriate enhancement method for iron oxidemapping in that it reduces the dimensionality of the data andminimises the loss of information. The observation of theeigenvalue loadings confirms that the PC image, containinginformation regarding the maximum contrast between band1 and band 4, is the most suitable for detecting the ironoxides in both of the studied subsets. The obtained FCCusing these PC images are visually interpreted more easilywith respect to the six bands because the SPCA enhances
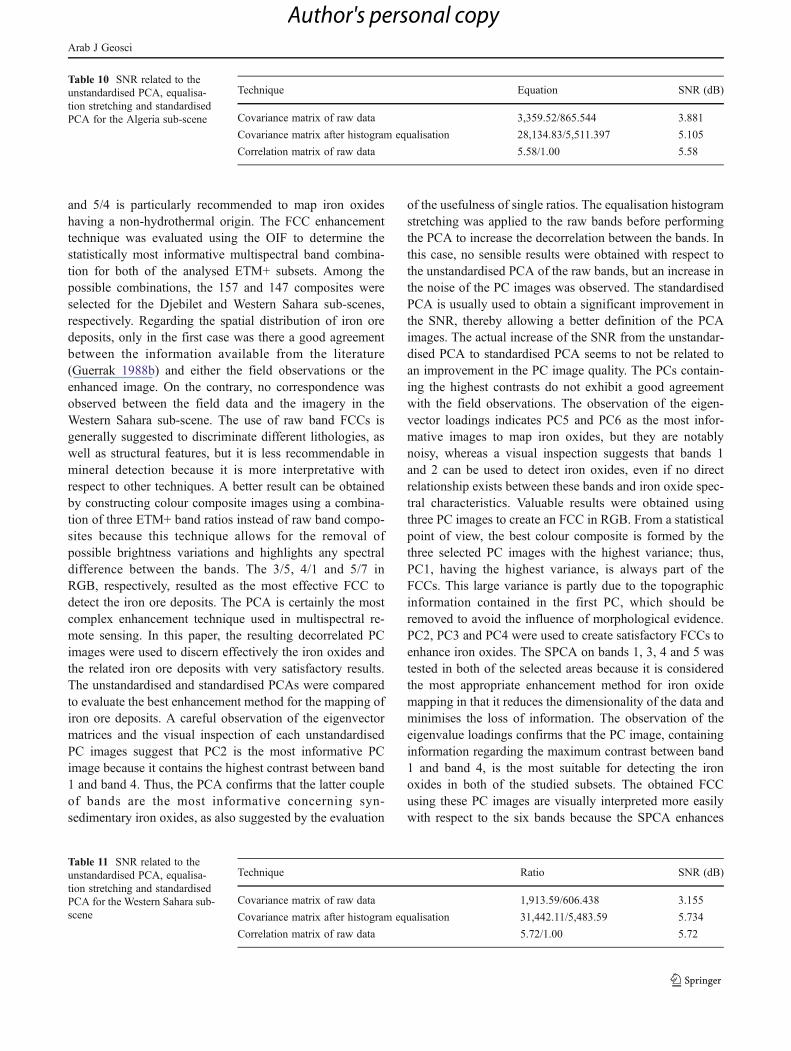
Table 10 SNR related to theunstandardised PCA, equalisa-tion stretching and standardisedPCA for the Algeria sub-scene
Technique Equation SNR (dB)
Covariance matrix of raw data 3,359.52/865.544 3.881
Covariance matrix after histogram equalisation 28,134.83/5,511.397 5.105
Correlation matrix of raw data 5.58/1.00 5.58
Table 11 SNR related to theunstandardised PCA, equalisa-tion stretching and standardisedPCA for the Western Sahara sub-scene
Technique Ratio SNR (dB)
Covariance matrix of raw data 1,913.59/606.438 3.155
Covariance matrix after histogram equalisation 31,442.11/5,483.59 5.734
Correlation matrix of raw data 5.72/1.00 5.72
Arab J Geosci
Author's personal copy
the spectral contrast between two different regions of thespectrum. Furthermore, using only four of the six ETM+bands directly related to the spectral characteristics of theinvestigated mineral avoids the influence of the other min-erals, such as the hydroxyls. This study proves the useful-ness of multispectral imagery (Landsat ETM+) in thedetection of iron ore deposits, which can have economicvalue. The Ministry of Energy and Mining of Algeria esti-mated the reserves of Djebilet (Gara Centre and Gara East)to be 1.7 billion tons, of which 57 % was iron. The ironoxide-bearing sandstones are part of a sedimentary sequencethat crops out for more than 600 km along the southern flankof the Tindouf Basin and that allows for the likely detectionof other exploitable iron ore deposits along this structure.Through several image-processing techniques, a wide areawas identified in Western Sahara characterised by the
presence of iron ore deposits and showing a spectral behav-iour similar to the Gara Centre and the Gara East areas inAlgeria. A field campaign assured the actual occurrence ofiron-bearing sandstones, which may represent a new ex-ploitable iron ore deposit. A detailed feasibility study isneeded to calculate the total available iron content and toevaluate the suitability of a potential utilisation of the ore.The application of a notably inexpensive method, such asthe remote sensing procedure described in this paper, to theentire southern flank of the Tindouf Basin could furtheropen perspectives on the possibility of detecting new ex-ploitable iron ore deposits in arid environments. The use ofmore recent and sophisticated sensors, such as the AdvancedSpaceborne Thermal Emission and Reflection Radiometer(ASTER), can be useful to detect iron oxides using visible,
Table 12 SPCA for iron oxides mapping of the Algeria sub-scene
ETM band PC1 PC2 PC3 PC4 Mean SD
1 0.58 0.69 0.42 0.03 141.12 29.42
3 0.47 −0.06 −0.50 −0.73 100.02 23.24
4 0.59 −0.31 −0.36 0.65 127.86 29.15
5 0.30 −0.65 0.67 −0.21 76.07 16.14
Variance (%) 95.53 3.28 1.12 0.07
Fig. 13 Second PC images of SPCA using bands 1, 3, 4 and 5. The presence of iron oxides corresponds to the brightest zones. a Western Saharasub-scene; b Gara Centre sub-scene; c Gara East sub-scene
Table 13 SPCA for iron oxides mapping of the Western Sahara sub-scene
ETM band PC1 PC2 PC3 PC4 Mean SD
1 0.65 0.76 0.07 −0.01 146.75 24.63
3 0.58 −0.46 −0.45 −0.50 95.38 22.00
4 0.47 −0.41 0.19 0.76 79.76 17.80
5 0.15 −0.21 0.87 −0.42 57.41 5.91
Variance (%) 97.17 2.43 0.27 0.13
Arab J Geosci
Author's personal copy

near-IR and short-wave IR reflectance data. For instance,the ASTER has been used to discriminate iron ores in high-grade granulites in southern India (Rajendran et al. 2011).The ASTER platform, combined with the Advanced LandImager, was used to detect ferric iron-bearing minerals onthe Chilean–Bolivian Altiplano (Hubbard and Crowley2005) and was compared to the data from the hyperspectralimaging spectrometer Hyperion and to those from theAirborne Visible/Infrared Imaging Spectrometer (AVIRIS).The possible use of the ASTER was evaluated in California,where Fe–muscovite-rich intrusive rocks were successfullymapped (Rowan and Mars 2003). The maps of ferric oxidesand oxyhydroxides were also produced in Colorado (USA)using the AVIRIS and laboratory measurement reflectancespectra (Farrand 1997). The use of the Landsat ETM+images was preferred with respect to the ASTER imagesbecause the former are free. Cost can be a crucial factor,especially for developing countries that want to improvetheir knowledge of the natural resources within theirborders.
Acknowledgments This research was financed by Autostrade perL'Italia S.p.a. The authors are grateful to the staff of the SADRGovernment and to Fiorella Bendoni from NGO Ban Slout Larbi forproviding general support during the field work. Dr. Patrizia Musina isacknowledged for the English revision. We are very grateful to SteveDrury, H.M. Rajesh, Prof. Biswajeet Pradhan and two anonymousreviewers for making many helpful suggestions that improved themanuscript.
References
Al Rawashdeh S, Saleh B, Hamzah M (2006) The use of remotesensing technology in geological investigation and mineral detec-tion in El Azraq-Jordan. Cybergeo Eur J Geogr Syst Modél Géo-stat 358:16
Alessandro V, Pieruccini U, Pranzini E, Righini G, Salvestrini L (1997)Elaborazione ed interpretazione di immagini Landsat TM per ladiscriminazione litologica in un area marginale dello "Zaire Cra-ton" in Angola. Riv It di Telerilev 9:43–52
Aydal D, Arda E, Dumanliar Ö (2007) Application of the Crostatechnique for alteration mapping of granitoidic rocks using ETM+ data: case study from eastern Tauride belt (SE Turkey). Int JRemote Sens 28:3895–3913
Chavez PS, Berlin GL, Sowers LB (1982) Statistical method forselecting Landsat MSS ratios. J Appl Photogr Eng 8:23–30
Crosta AP, Moore JM (1989) Enhancement of Landsat ThematicMapper imagery for residual soil mapping in SW Minais GeraisState, Brazil: a prospecting case history in Greenstone Belt ter-rain. Proceedings of the 7th (ERIM) Thematic Conference: Re-mote Sensing for Exploration Geology, Calgary, 2–6 October, pp1773–1187
Dehnavi AG, Sarikhani R, Nagaraju D (2010) Image processing andanalysis of mapping alteration zones in environmental research,East of Kurdistan, Iran. World App Sci J 11:278–283
Dogan HM (2008) Applications of remote sensing and GeographicInformation Systems to assess ferrous minerals and iron oxide ofTokat province in Turkey. Int J Remote Sens 29:221–233
Dogan HM (2009) Mineral composite assessment of Kelkit RiverBasin in Turkey by means of remote sensing. J Earth Syst Sci118:701–710
Elsayed Zeinelabdein KA, Albiely AI (2008) Ratio image processingtechniques: a prospecting tool for mineral deposits, Red Sea Hills,NE Sudan. Int Arch Photogramm Remote Sens Spat Inf Sci37:1295–1298
Farrand WH (1997) Identification and mapping of ferric oxide andoxyhydroxide minerals in imaging spectrometer data of Summit-ville, Colorado, USA and the surrounding San Juan Mountains.Int J Remote Sens 18:1543–1552
Ferrari MC (1992) Improved decorrelation stretching of TM data forgeological applications: first results in Northern Somalia. Int JRemote Sens 13:841–851
Guerrak S (1988a) Ordovician ironstone sedimentation in OugartaRanges: North Western Sahara (Algeria). J Afr Earth Sci 7:657–678
Guerrak S (1988b) Geology of the Early Devonian oolitic iron ore ofthe Gara Djebilet field, Saharan Platform, Algeria. Ore Geol Rev3:333–358
Guerrak S (1991) Paleozoic patterns of oolitic ironstone sedimentationin the Sahara. J Afr Earth Sci 12:31–39
Guerrak S, Chauvel JJ (1985) Les minéralisations ferriferes du SaharaAlgérien. Le gisement de fer oolithique de Mecheri Abdelaziz(basin de Tindouf). Miner Deposita 20:249–259
Howari FM, Baghdady A, Goodell PC (2007) Mineralogical andgeomorphological characterization of sand dunes in the easternpart of United Emirates using orbital remote sensing integratedwith field investigations. Geomorphology 83:67–81
Hubbard B, Crowley JK (2005) Mineral mapping on the Chilean–Bolivian Altiplano using co-orbital ALI, ASTER and Hyperionimagery: data dimensionality issues and solutions. Remote SensEnviron 99:173–186
James HL, Van Houten FB (1979) Miocene goethitic and chamositicoolite: northeastern Colombia. Sedimentology 26:125–133
Kaufmann H (1988) Mineral exploration along the Aqaba-LevantStructure by use of TM-data. Concepts, processing and results.Int J Remote Sens 9:1639–1658
Kenea NH (1997) Improved geological mapping using Landsat TMdata, Southern Red Sea Hills, Sudan: PC and IHS decorrelationstretching. Int J Remote Sens 18:1233–1244
Kenea NH, Haenisch H (1996) Principal component analyses forlithologic and alteration mappings: examples from the Red SeaHills, Sudan. Int Arch Photogramm Remote Sens Spat Inf Sci31:271–275
Legrand P (1967) Le Dévonien du Sahara algérien. In: Oswald DH (ed)International Symposium of the Devonian System. Alta, Calgary,pp 245–284
Legrand P (1969) Découvert de graptolites entre Gara Djebilet etAouinet el Egra (Synéclise de Tindouf, Sahara Algérien). BullSoc Hist Nat Afr Nord Algerie 59:99–114
Lemoigne Y (1967) Reconnaissance paléobotanique dans le SaharaOccidental (Région de Tindouf et Gara Djebilet). Ann Soc GeolNord Fr 87:31–38
Loughlin WP (1991) Principal component analysis for alteration map-ping. Photogramm Eng Remote Sens 57:1163–1169
Lubeseder S, Redfern J, Boutib L (2009) Mixed siliciclastic–carbonateshelf sedimentation—Lower Devonian sequences of the SWAnti-Atlas, Morocco. Sed Geol 215:13–32
Madani AA (2009) Utilization of Landsat ETM+ data for mappinggossans and iron rich zones exposed at Bahrah area, WesternArabian Shield, Saudi Arabia. J King Abdulaziz Univ Earth Sci20:25–49
Patel N, Kaushal B (2011) Classification of features selected throughOptimum Index Factor (OIF) for improving classification accura-cy. J For Res 22:99–105
Arab J Geosci
Author's personal copy

Pease PP, Bierly GD, Tchakerian VP, Tindale NW (1999) Mineralog-ical characterization and transport pathways of dune sand usingLandsat TM data, Wahiba Sand Sea, Sultanate of Oman. Geo-morphology 29:235–249
Potrel A, Pecaut J, Fanning CM, Auvray B, Burg JP, Caruba C (1996)Old terranes (3.5 Ga) in the West African Craton, Mauritania. JGeol Soc London 153:507–510
Qaid AM, Basavarajappa HT (2008) Application of index factor tech-nique to Landsat-7 data for geological mapping of North East ofHajjah, Yemen. Am-Eurasian J Sci Res 3:84–91
Rajendran S, Thirunavukkarasu A, Balamurugan G, Shankar K (2011)Discrimination of iron ore deposits of granulite terrain of South-ern Peninsular India using ASTER data. J Asian Earth Sci 41:99–106
Rajesh HM (2004) Application of remote sensing and GIS in mineralresource mapping—an overview. J Mineral Petrol Sci 99:83–103
Rajesh HM (2008) Mapping Proterozoic unconformity-related uraniumdeposits in the Rockhole area, Northern Territory, Australia usingLandsat ETM+. Ore Geol Rev 33:382–396
Ramadan TM, Kotny A (2004) Mineralogical and structural character-ization of alteration zones detected by orbital remote sensing atShalatein District, SE Desert, Egypt. J Afr Earth Sci 40:89–99
Ready PJ, Wintz PA (1973) Information extraction, SNR improvementand data compression in multi-spectral imagery. IEEE TransCommun 21:1123
Rohrlich V, Price NB, Calvert SE (1969) Chamosite in the recentsediments of Loch Etvie, Scotland. J Sed Petrol 39:624–631
Rowan LC, Mars JC (2003) Lithologic mapping in the Mountain Pass,California area using Advanced Spaceborne Thermal Emissionand Reflection Radiometer (ASTER) data. Remote Sens Environ84:350–366
Saadi M, Hilali EA, Bensaïd M, Boudda A, Dahmani M (1985) "CarteGéologique du Maroc, echelle 1/1000000," Edition du ServiceGéologique du Maroc, Notes et Mémoires n° 260
Sabins FF (1999) Remote sensing for mineral exploration. Ore GeolRev 14:157–183
Salem SM, Arafa SA, Ramadan TM, El Gammal ESA (2011) Explo-ration of copper deposits in Wadi El Regeita area, Southern Sinai,Egypt, with contribution of remote sensing and geophysical data.Arabian Journal of Geosciences. doi:10.1007/s12517-011-0346-z
Shalaby MH, Bishta AZ, Roz ME, Zalaky MA (2010) Integration ofgeologic and remote sensing studies for the discovery of uraniummineralization in some granite plutons, Eastern Desert, Egypt. JKing Abdulaziz Univ Earth Sci 21:1–25
Siljestrom PA, Moreno A, Vikgren K, Caceres LM (1997) Technicalnote The application of selective principal component analysis(SPCA) to Thematic Mapper (TM) image for the recognition ofgeomorphologic features configuration. Int J Remote Sens18:3843–3852
Singh A, Harrison A (1985) Standardized principal components. Int JRemote Sens 6:883–896
Tangestani MH, Moore F (2000) Iron oxides and hydroxyl enhance-ment using the Crosta method: a case study from the Zagros Belt,Fars Province, Iran. Int J Appl Earth Obs Geoinf 2:140–146
Tangestani MH, Moore F (2002) Porphyry copper alteration mappingat the Mediuk area, Iran. Int J Remote Sens 23:4815–4825
Villeneuve M (2005) Paleozoic basins in West Africa and Mauritanidethrust belt. J Afr Earth Sci 43:166–195
Zumsprekel H, Prinz T (2000) Computer-enhanced multispectral re-mote sensing data: a useful tool for the geological mapping ofArchean terrains in (semi)arid environments. Comput Geosci26:87–100
Arab J Geosci
Author's personal copy