Normative and Criterion-Related Standards for Shuttle Run Performance in Youth
Upload
nevada-renoCategory
view
1download
0
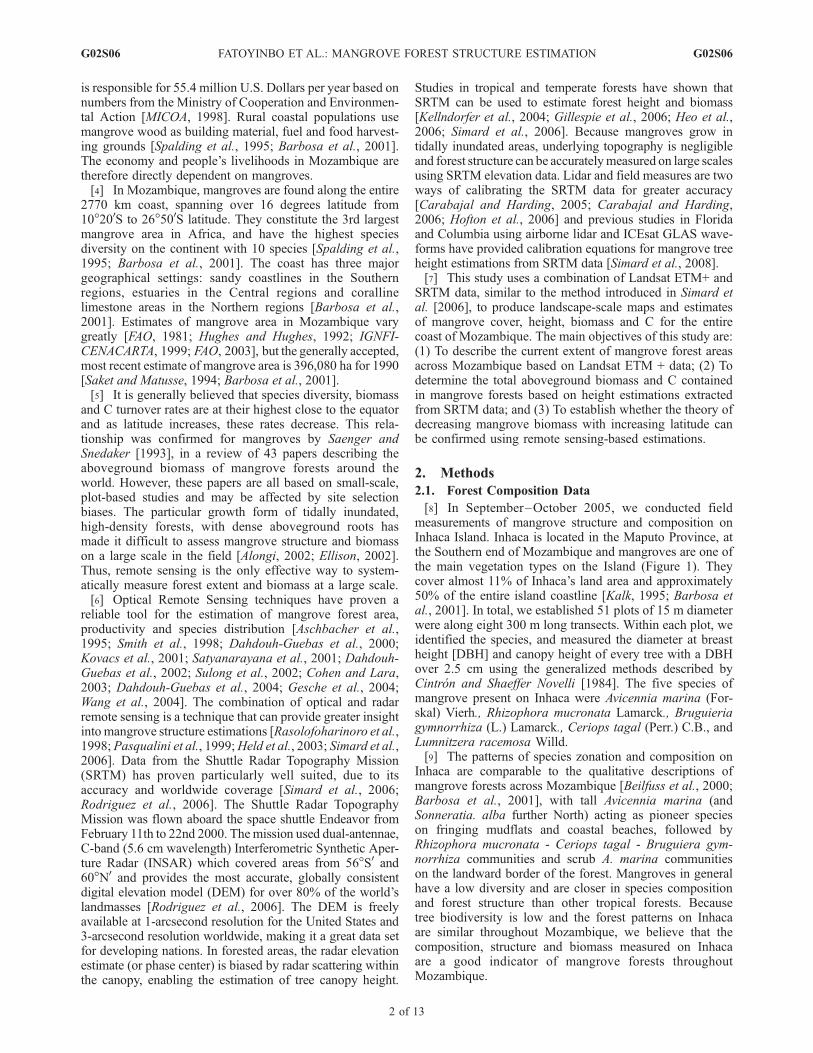
Landscape-scale extent, height, biomass, and carbon estimation of
Mozambique’s mangrove forests with Landsat ETM+ and Shuttle
Radar Topography Mission elevation data
Temilola E. Fatoyinbo,1 Marc Simard,2 Robert A. Washington-Allen,1,3
and Herman H. Shugart1
Received 19 July 2007; revised 12 December 2007; accepted 27 March 2008; published 20 June 2008.
[1] Mangroves are salt tolerant plants that grow within the intertidal zone along tropicaland subtropical coasts. They are important barriers for mitigating coastal disturbances,provide habitat for over 1300 animal species and are one of the most productiveecosystems. Mozambique’s mangroves extend along 2700 km and cover one of the largestareas in Africa. The purpose of this study was to determine the countrywide mean treeheight spatial distribution and biomass of Mozambique’s mangrove forests using LandsatETM+ and Shuttle Radar Topography Mission (SRTM) data. The SRTM data werecalibrated using the Landsat derived land-cover map and height calibration equations.Stand-specific canopy height-biomass allometric equations developed from fieldmeasurements and published height-biomass equations were used to calculateaboveground biomass of the mangrove forests on a landscape scale. The results showedthat mangrove forests covered a total of 2909 km2 in Mozambique, a 27% smaller areathan previously estimated. The SRTM calibration indicated that average tree heightschanged with geographical settings. Even though the coast of Mozambique spans across16 degrees latitude, we did not find a relationship between latitude and biomass. Theseresults confirm that geological setting has a greater influence than latitude alone onmangrove production. The total mangrove dry aboveground biomass in Mozambique was23.6 million tons and the total carbon was 11.8 million tons.
Citation: Fatoyinbo, T. E., M. Simard, R. A. Washington-Allen, and H. H. Shugart (2008), Landscape-scale extent, height, biomass,
and carbon estimation of Mozambique’s mangrove forests with Landsat ETM+ and Shuttle Radar Topography Mission elevation data,
J. Geophys. Res., 113, G02S06, doi:10.1029/2007JG000551.
1. Introduction
[2] Mangrove forests are the dominant coastal ecosystemin tropical and subtropical regions. They form an importantlink between aquatic and terrestrial ecosystems. Althoughmangroves grow in difficult environments regularly inun-dated by saltwater, their primary productivity of 2.5 gcarbon m�2 day�1 makes them the most productive aquaticecosystem [Jennerjahn and Ittekot, 2002]. The constanttidal outwelling of mangrove litter provides large amountsof carbon (C) to coastal and offshore marine ecosystems andcontributes over 10% of the dissolved organic C (DOC) toocean sediments worldwide [Cintron and Shaeffer-Novelli,1984; Dittmar et al., 2006]. Mangroves also act as coastalbuffer zones, by accumulating sediment and protectingcoastal areas from wave action, erosion, storms and tidal
waves [Cintron and Shaeffer-Novelli, 1984]. As keystonespecies, mangroves provide habitat, food and nutrients for1300 animal species, many of which are commerciallyimportant fish and shrimp [Duke, 1992]. Despite theseknown benefits, mangrove areas are being altered anddestroyed by anthropogenic impacts and their cover hasdecreased by 35% in the past 20 years [Valiela et al., 2001;Alongi, 2002]. Because of their ecological and economicalimportance mangrove forests have been estimated at200,000 USD/km2 to 900,000 USD/km2 per year by theUnited Nations Environment Programme World Conserva-tion Monitoring Center [UNEP-WCMC, 2006] for theecological services they provide. In addition, through theadoption of clean development mechanisms (CDM) andForest Carbon Credits, developing nations will receiveincome to maintain their forest resources as carbon storageto mitigate carbon (C) emissions of developed nations[Laurance, 2007]. Given the threats to this ecosystem it iscrucial to determine landscape-scale extent, distribution andbiomass of mangroves accurately from scientific, manage-ment and economical perspectives.[3] In this paper we focus on the mangroves of Mozam-
bique. Mangrove-dependent fisheries represent 40% ofMozambique’s Gross National Product. Prawn fishery alone
JOURNAL OF GEOPHYSICAL RESEARCH, VOL. 113, G02S06, doi:10.1029/2007JG000551, 2008ClickHere
for
FullArticle
1Department of Environmental Sciences, University of Virginia,Charlottesville, Virginia, USA.
2Radar and Engineering Section, Caltech-Jet Propulsion Laboratory,Pasadena, California, USA.
3Department of Ecosystem Science and Management, Texas A&MUniversity, College Station, Texas, USA.
Copyright 2008 by the American Geophysical Union.0148-0227/08/2007JG000551$09.00
G02S06 1 of 13
is responsible for 55.4 million U.S. Dollars per year based onnumbers from the Ministry of Cooperation and Environmen-tal Action [MICOA, 1998]. Rural coastal populations usemangrove wood as building material, fuel and food harvest-ing grounds [Spalding et al., 1995; Barbosa et al., 2001].The economy and people’s livelihoods in Mozambique aretherefore directly dependent on mangroves.[4] In Mozambique, mangroves are found along the entire
2770 km coast, spanning over 16 degrees latitude from10�200S to 26�500S latitude. They constitute the 3rd largestmangrove area in Africa, and have the highest speciesdiversity on the continent with 10 species [Spalding et al.,1995; Barbosa et al., 2001]. The coast has three majorgeographical settings: sandy coastlines in the Southernregions, estuaries in the Central regions and corallinelimestone areas in the Northern regions [Barbosa et al.,2001]. Estimates of mangrove area in Mozambique varygreatly [FAO, 1981; Hughes and Hughes, 1992; IGNFI-CENACARTA, 1999; FAO, 2003], but the generally accepted,most recent estimate of mangrove area is 396,080 ha for 1990[Saket and Matusse, 1994; Barbosa et al., 2001].[5] It is generally believed that species diversity, biomass
and C turnover rates are at their highest close to the equatorand as latitude increases, these rates decrease. This rela-tionship was confirmed for mangroves by Saenger andSnedaker [1993], in a review of 43 papers describing theaboveground biomass of mangrove forests around theworld. However, these papers are all based on small-scale,plot-based studies and may be affected by site selectionbiases. The particular growth form of tidally inundated,high-density forests, with dense aboveground roots hasmade it difficult to assess mangrove structure and biomasson a large scale in the field [Alongi, 2002; Ellison, 2002].Thus, remote sensing is the only effective way to system-atically measure forest extent and biomass at a large scale.[6] Optical Remote Sensing techniques have proven a
reliable tool for the estimation of mangrove forest area,productivity and species distribution [Aschbacher et al.,1995; Smith et al., 1998; Dahdouh-Guebas et al., 2000;Kovacs et al., 2001; Satyanarayana et al., 2001; Dahdouh-Guebas et al., 2002; Sulong et al., 2002; Cohen and Lara,2003; Dahdouh-Guebas et al., 2004; Gesche et al., 2004;Wang et al., 2004]. The combination of optical and radarremote sensing is a technique that can provide greater insightinto mangrove structure estimations [Rasolofoharinoro et al.,1998; Pasqualini et al., 1999;Held et al., 2003; Simard et al.,2006]. Data from the Shuttle Radar Topography Mission(SRTM) has proven particularly well suited, due to itsaccuracy and worldwide coverage [Simard et al., 2006;Rodriguez et al., 2006]. The Shuttle Radar TopographyMission was flown aboard the space shuttle Endeavor fromFebruary 11th to 22nd 2000. Themission used dual-antennae,C-band (5.6 cm wavelength) Interferometric Synthetic Aper-ture Radar (INSAR) which covered areas from 56�S0 and60�N0 and provides the most accurate, globally consistentdigital elevation model (DEM) for over 80% of the world’slandmasses [Rodriguez et al., 2006]. The DEM is freelyavailable at 1-arcsecond resolution for the United States and3-arcsecond resolution worldwide, making it a great data setfor developing nations. In forested areas, the radar elevationestimate (or phase center) is biased by radar scattering withinthe canopy, enabling the estimation of tree canopy height.
Studies in tropical and temperate forests have shown thatSRTM can be used to estimate forest height and biomass[Kellndorfer et al., 2004; Gillespie et al., 2006; Heo et al.,2006; Simard et al., 2006]. Because mangroves grow intidally inundated areas, underlying topography is negligibleand forest structure can be accuratelymeasured on large scalesusing SRTM elevation data. Lidar and field measures are twoways of calibrating the SRTM data for greater accuracy[Carabajal and Harding, 2005; Carabajal and Harding,2006; Hofton et al., 2006] and previous studies in Floridaand Columbia using airborne lidar and ICEsat GLAS wave-forms have provided calibration equations for mangrove treeheight estimations from SRTM data [Simard et al., 2008].[7] This study uses a combination of Landsat ETM+ and
SRTM data, similar to the method introduced in Simard etal. [2006], to produce landscape-scale maps and estimatesof mangrove cover, height, biomass and C for the entirecoast of Mozambique. The main objectives of this study are:(1) To describe the current extent of mangrove forest areasacross Mozambique based on Landsat ETM + data; (2) Todetermine the total aboveground biomass and C containedin mangrove forests based on height estimations extractedfrom SRTM data; and (3) To establish whether the theory ofdecreasing mangrove biomass with increasing latitude canbe confirmed using remote sensing-based estimations.
2. Methods
2.1. Forest Composition Data
[8] In September–October 2005, we conducted fieldmeasurements of mangrove structure and composition onInhaca Island. Inhaca is located in the Maputo Province, atthe Southern end of Mozambique and mangroves are one ofthe main vegetation types on the Island (Figure 1). Theycover almost 11% of Inhaca’s land area and approximately50% of the entire island coastline [Kalk, 1995; Barbosa etal., 2001]. In total, we established 51 plots of 15 m diameterwere along eight 300 m long transects. Within each plot, weidentified the species, and measured the diameter at breastheight [DBH] and canopy height of every tree with a DBHover 2.5 cm using the generalized methods described byCintron and Shaeffer Novelli [1984]. The five species ofmangrove present on Inhaca were Avicennia marina (For-skal) Vierh., Rhizophora mucronata Lamarck., Bruguieriagymnorrhiza (L.) Lamarck., Ceriops tagal (Perr.) C.B., andLumnitzera racemosa Willd.[9] The patterns of species zonation and composition on
Inhaca are comparable to the qualitative descriptions ofmangrove forests across Mozambique [Beilfuss et al., 2000;Barbosa et al., 2001], with tall Avicennia marina (andSonneratia. alba further North) acting as pioneer specieson fringing mudflats and coastal beaches, followed byRhizophora mucronata - Ceriops tagal - Bruguiera gym-norrhiza communities and scrub A. marina communitieson the landward border of the forest. Mangroves in generalhave a low diversity and are closer in species compositionand forest structure than other tropical forests. Becausetree biodiversity is low and the forest patterns on Inhacaare similar throughout Mozambique, we believe that thecomposition, structure and biomass measured on Inhacaare a good indicator of mangrove forests throughoutMozambique.
G02S06 FATOYINBO ET AL.: MANGROVE FOREST STRUCTURE ESTIMATION
2 of 13
G02S06
2.2. Remote Sensing Methods
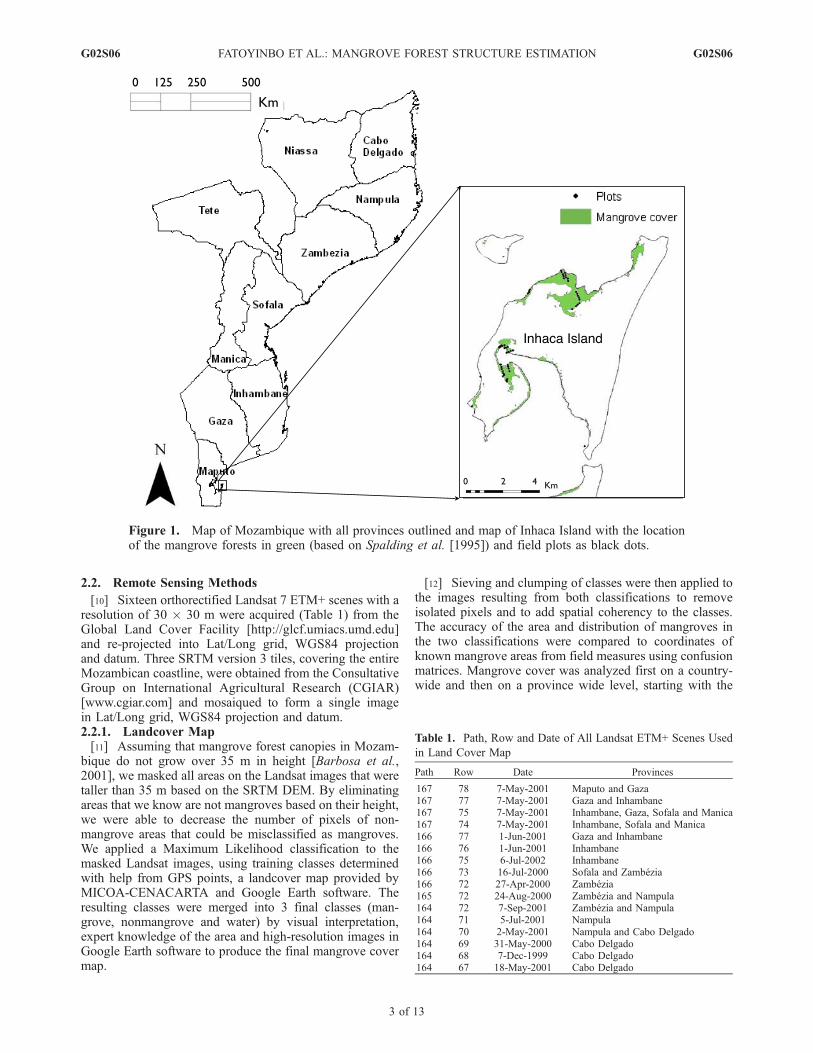
[10] Sixteen orthorectified Landsat 7 ETM+ scenes with aresolution of 30 � 30 m were acquired (Table 1) from theGlobal Land Cover Facility [http://glcf.umiacs.umd.edu]and re-projected into Lat/Long grid, WGS84 projectionand datum. Three SRTM version 3 tiles, covering the entireMozambican coastline, were obtained from the ConsultativeGroup on International Agricultural Research (CGIAR)[www.cgiar.com] and mosaiqued to form a single imagein Lat/Long grid, WGS84 projection and datum.2.2.1. Landcover Map[11] Assuming that mangrove forest canopies in Mozam-
bique do not grow over 35 m in height [Barbosa et al.,2001], we masked all areas on the Landsat images that weretaller than 35 m based on the SRTM DEM. By eliminatingareas that we know are not mangroves based on their height,we were able to decrease the number of pixels of non-mangrove areas that could be misclassified as mangroves.We applied a Maximum Likelihood classification to themasked Landsat images, using training classes determinedwith help from GPS points, a landcover map provided byMICOA-CENACARTA and Google Earth software. Theresulting classes were merged into 3 final classes (man-grove, nonmangrove and water) by visual interpretation,expert knowledge of the area and high-resolution images inGoogle Earth software to produce the final mangrove covermap.
[12] Sieving and clumping of classes were then applied tothe images resulting from both classifications to removeisolated pixels and to add spatial coherency to the classes.The accuracy of the area and distribution of mangroves inthe two classifications were compared to coordinates ofknown mangrove areas from field measures using confusionmatrices. Mangrove cover was analyzed first on a country-wide and then on a province wide level, starting with the
Figure 1. Map of Mozambique with all provinces outlined and map of Inhaca Island with the locationof the mangrove forests in green (based on Spalding et al. [1995]) and field plots as black dots.
Table 1. Path, Row and Date of All Landsat ETM+ Scenes Used
in Land Cover Map
Path Row Date Provinces
167 78 7-May-2001 Maputo and Gaza167 77 7-May-2001 Gaza and Inhambane167 75 7-May-2001 Inhambane, Gaza, Sofala and Manica167 74 7-May-2001 Inhambane, Sofala and Manica166 77 1-Jun-2001 Gaza and Inhambane166 76 1-Jun-2001 Inhambane166 75 6-Jul-2002 Inhambane166 73 16-Jul-2000 Sofala and Zambezia166 72 27-Apr-2000 Zambezia165 72 24-Aug-2000 Zambezia and Nampula164 72 7-Sep-2001 Zambezia and Nampula164 71 5-Jul-2001 Nampula164 70 2-May-2001 Nampula and Cabo Delgado164 69 31-May-2000 Cabo Delgado164 68 7-Dec-1999 Cabo Delgado164 67 18-May-2001 Cabo Delgado
G02S06 FATOYINBO ET AL.: MANGROVE FOREST STRUCTURE ESTIMATION
3 of 13
G02S06

southernmost province of Maputo and ending with thenorthernmost province of Cabo Delgado.2.2.2. Height Map[13] Using the mangrove landcover map, we masked all
areas on the SRTM that were not within the mangrove area.Mangroves only grow in tidally inundated areas, at sealevel. In Mozambique the tidal range is below 3.3 m, whichmay cause systematic errors in our SRTM tree heightestimates. For this study, we assumed that all forests growat sea level and therefore topography was not taken intoaccount. Height data for mangrove forests in areas otherthan Inhaca Island was not available; therefore we made theassumption that the calibration equation (1) from the Ca-ribbean [Simard et al., 2006] could be applied to themangrove forests of Mozambique. This assumption wasbased on the low tree biodiversity and similar structural andzonation patterns that are observed in mangroves worldwide[Chapman, 1944; Chapman, 1970; Lugo and Snedaker,1974; Smith, 1992].
[14] We compared SRTM tree height estimates calculatedfrom equation (1) with the field measurements to estimatesystematic (bias) and random error. We found a bias of �0.01 and a RMSE of 1.5 m (Figure 2). The bias for the rangeof canopy height of our field data is well below measure-ment error, thus we consider SRTM well calibrated. Finally,we used equation (1) to calibrate the SRTM elevation toestimate mangrove canopy height of the entire coastline.
H ¼ �2:19þ 1:12� HSRTM RMSE 1:5 m ð1Þ
2.3. Biomass Estimation
[15] The field data from Inhaca Island was used as a sampleto estimate the mangrove biomass of Mozambique. Thebiomasses of individual field-measured plots were calculatedby applying allometric equations based on DBH of eachindividual tree in the plot. Several allometric equations wereavailable for the species present in Mozambique (Table 2).
Figure 2. Comparison of canopy height estimates using SRTM with equation from Simard et al. [2006]and field measurements. We found a bias of �0.01 m with an RMSE of 1.5 m. These values indicate thisequation is appropriate for this region.
Table 2. Aboveground Biomass Equations for Nine Mangrove Species Present in Mozambique Based on the DBHa
Species Equations n DBH (cm) Location Author
Avicennia marina W = e^(5.551 + 2.153 ln (D)) Sri Lanka 3Avicennia marina W = 10^(�0.511) + D^(2.113) 22 Darwin Harbor, Australia 4Bruguiera gymnorrhiza W = 0.251 x 0.699 (D^2.46) 18 5.0–48.9 Thailand and Indonesia 1Bruguiera gymnorrhiza W = 10^(�0.7309) + D^2.3055 17 2.0–24.0 Queensland, Australia 2Ceriops tagal W = 0.251 x 0.746 (D^2.46) 6 5.0–48.9 Thailand and Indonesia 1Ceriops tagal W = 10^(�0.7247) + D^2.3379 26 2.0–18.0 Queensland, Australia 2Ceriops tagal W = 10^(�0.494) + D^(2.056) 12 Darwin Harbor, Australia 4Rhizophora mucronata W = e^(6.247 + 2.64 ln (D)) Sri Lanka 3Rhizophora mucronata W = 0.251 x 0.701 (D^2.46) 13 5.0–48.9 Thailand and Indonesia 1Sonneratia alba W = 0.251 x 0.475 (D^2.46) 13 5.0–48.9 Thailand and Indonesia 1Xylocarpus granatum W = 0.251 x 0.528 (D^2.46) 11 5.0–48.9 Thailand and Indonesia 1Xylocarpus granatum W = 10^(�1.0844) + D^2.5883 10 3.0–17.0 Queensland, Australia 2Laguncularia racemosa W = e^(1.095 + [0.659 x ln {D^2}] + [0.304 x ln {CW}]) 43 2.5–8.8 Florida, USA 5
aAuthor list, 1: Komiyama et al. [2005], 2: Comley and McGuinness [2005], 3: Amarasinghe and Balasubramianum, 4: Clough and Scott [1989], 5: Rosset al. [2001].
G02S06 FATOYINBO ET AL.: MANGROVE FOREST STRUCTURE ESTIMATION
4 of 13
G02S06
We selected the allometric equations based on the range ofDBH that encompassed the range of our field measurements.For R. mucronata we used an allometric equation derived forGazi Bay, Kenya [Slim et al., 1996], because of its geograph-ical proximity to the site and comparable range of DBH’s. ForA. marina, equations derived by Comley and McGuinness[2005] for Darwin Harbor, Australia were used, as they had asimilar range of DBH’s as trees on Inhaca. For C. tagal, weused equations from Clough and Scott [1989] for Australia,rather than those from Slim et al. [1996] fromKenya, becausethe size range reported for Australia was larger and closer tothe range found on Inhaca. For B. gymnorrhiza, we chose touse equations developed for Australia [Clough and Scott,1989], rather than equations derived for Thailand [Komiyamaet al., 2005], as they had the same range of sizes as found onInhaca and they were closer latitudinally. However, we couldnot find any allometric equations for Lumnitzera racemosa.As Lumnitzera racemosa and Laguncularia racemosa are inthe same family, we used allometric equations derived forLaguncularia from Southern Florida [Ross et al., 2001].
[16] We applied the field data from Inhaca Island to derivea single height-biomass regression (equation (2)). In aprevious study, Saenger and Snedaker [1993] obtained aglobal mangrove height-biomass relationship (equation (3))for mangrove forests worldwide based on a review of43 articles and reports on mangrove biomass.
B ¼ 50:7� H � 117:5
R2 ¼ 0:64 RMSE 35:5; n ¼ 51
ð2Þ
B ¼ 10:8� H þ 34:9 R2 ¼ 0:77 RMSE 43:8; n ¼ 43 ð3Þ
where B is aboveground dry mangrove biomass in Mg/haand H is average tree height in m.[17] The equation obtained from their study varies sub-
stantially from the one obtained in the field in Mozambique,as the slope of the equation derived for Mozambique isabout 5 times that of the one derived for the whole world.
Table 3. Confusion Matrix of Landsat ETM+ Classificationa
Class Mangrove Dune
Ground Truth (%)
Urban Area Water SeagrassRural Area Mudflats Forest
Unclassified 0.29 0.75 0.06 0.17 0.17 0.21 0.00 0.14Mangrove 90.86 8.66 0.49 1.00 0.10 0.05 0.00 0.00Dunes 0.71 64.55 0.90 0.56 6.65 0.75 0.00 0.00Rural Area 3.34 9.93 79.11 0.25 17.29 10.70 0.00 0.00Mudflats 3.97 1.42 0.06 72.21 0.02 0.08 0.37 0.57Forest 0.02 10.82 13.24 0.45 68.40 4.45 0.00 0.00Urban area 0.53 3.13 6.13 2.76 7.37 83.73 0.01 0.00Water 0.36 0.00 0.00 1.00 0.00 0.00 99.62 0.00Seagrass 0.22 0.75 0.00 21.61 0.00 0.01 0.00 99.28Total 100.00 100.00 100.00 100.00 100.00 100.00 100.00 100.00
aThe overall accuracy was 93.91%, and the Kappa coefficient was 0.8703.
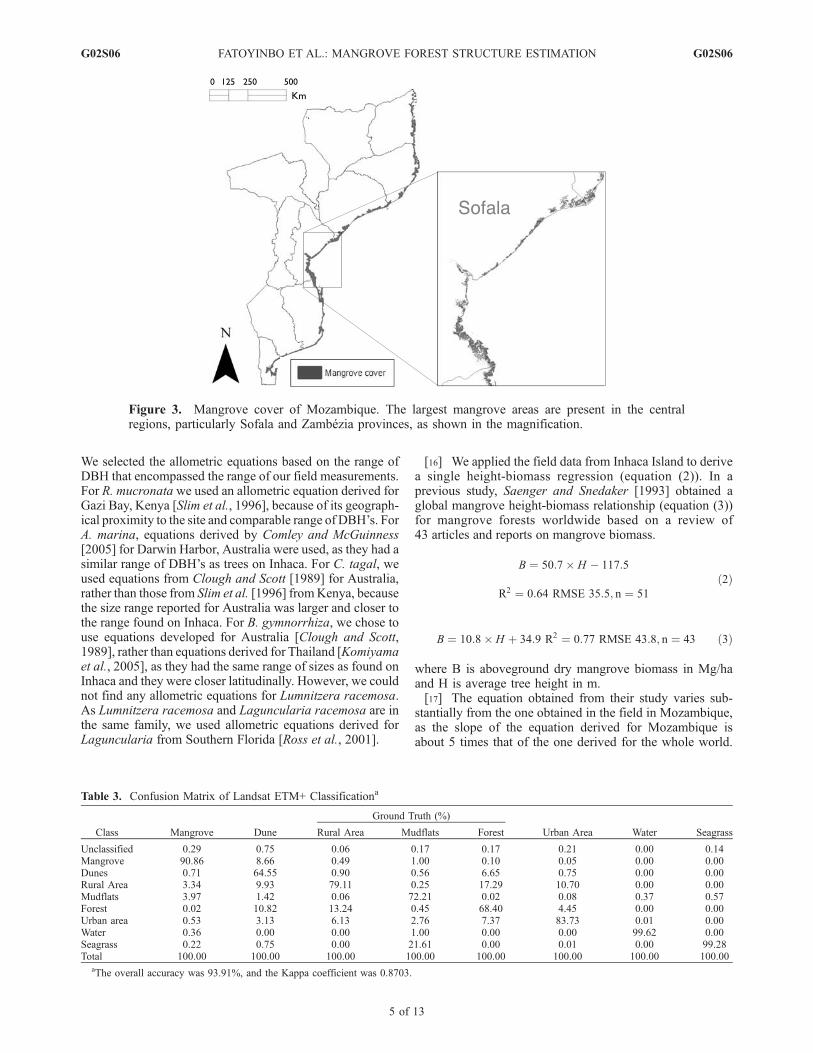
Figure 3. Mangrove cover of Mozambique. The largest mangrove areas are present in the centralregions, particularly Sofala and Zambezia provinces, as shown in the magnification.
G02S06 FATOYINBO ET AL.: MANGROVE FOREST STRUCTURE ESTIMATION
5 of 13
G02S06
However, equation (2) only applies for forests with averageheights ranging from 2.3 m to 6.4 m, whereas equation (3)applies to forests up to 40 m in height. We therefore usedthe worldwide biomass-height relationship (equation (3))derived by Saenger and Snedaker [1993] to calibrateaverage tree heights. The amount of C was then estimatedas 50% of the biomass [Lieth and Whitaker, 1975; Piao etal., 2005]. In the last published estimates of mangrove area,Saket and Matusse [1994] reported mangrove area brokendown by province. To facilitate comparison with thisestimate, we described mangrove area by province as well.Finally, we extracted all heights and biomasses and plottedthem against latitude to determine whether there is arelationship between these factors.
3. Results
3.1. Land Cover Map
[18] The total area of mangrove cover in Mozambiquewas 2909 km2 with 93% accuracy (Table 3 and Figure 3).When the Landsat data was classified without applying theSRTM mask, the classification accuracy is much lower, at71%. The final area estimate is 27% lower than previousestimates by Saket and Matusse [1994] of 3960 km2, whichwas based on the interpretation of 16 printed Landsatimages from 1973 and 1992. The largest mangrove areasare found in the Save-Zambezi River complex in Sofala andZambezia provinces with a total mangrove area of 1900 km2
and the smallest forest is found in the Limpopo Estuary inGaza province with a total area of 3.5 km2.
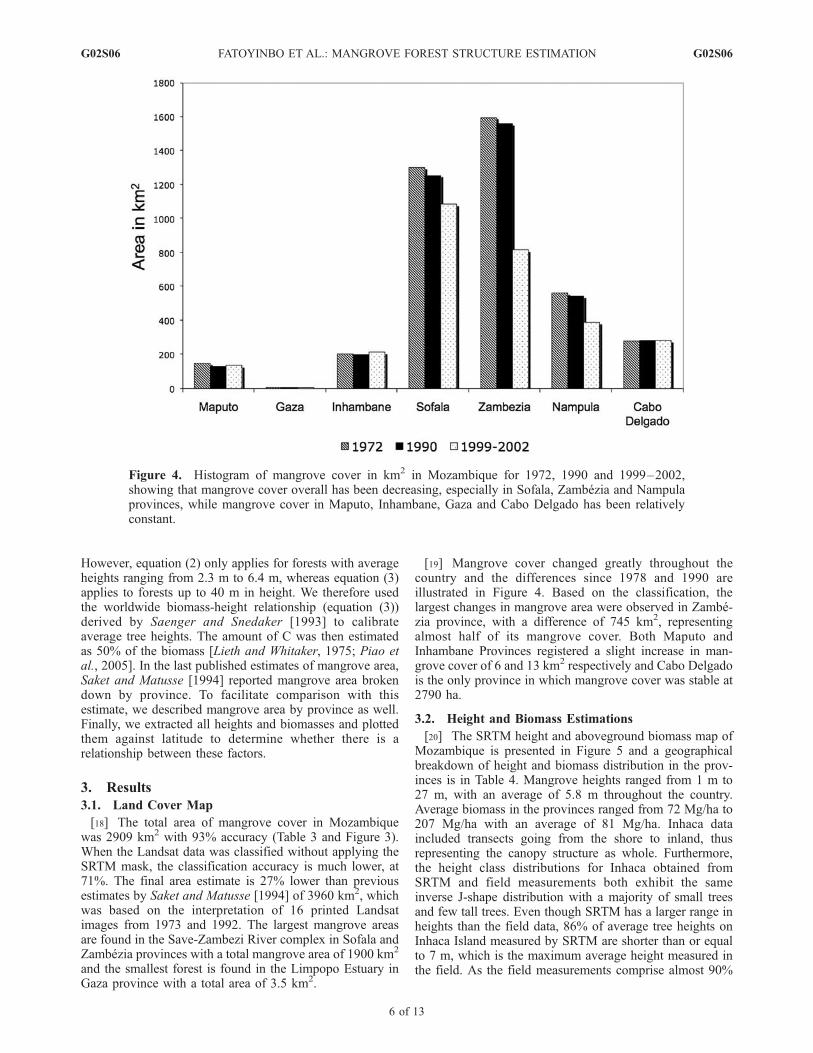
[19] Mangrove cover changed greatly throughout thecountry and the differences since 1978 and 1990 areillustrated in Figure 4. Based on the classification, thelargest changes in mangrove area were observed in Zambe-zia province, with a difference of 745 km2, representingalmost half of its mangrove cover. Both Maputo andInhambane Provinces registered a slight increase in man-grove cover of 6 and 13 km2 respectively and Cabo Delgadois the only province in which mangrove cover was stable at2790 ha.
3.2. Height and Biomass Estimations
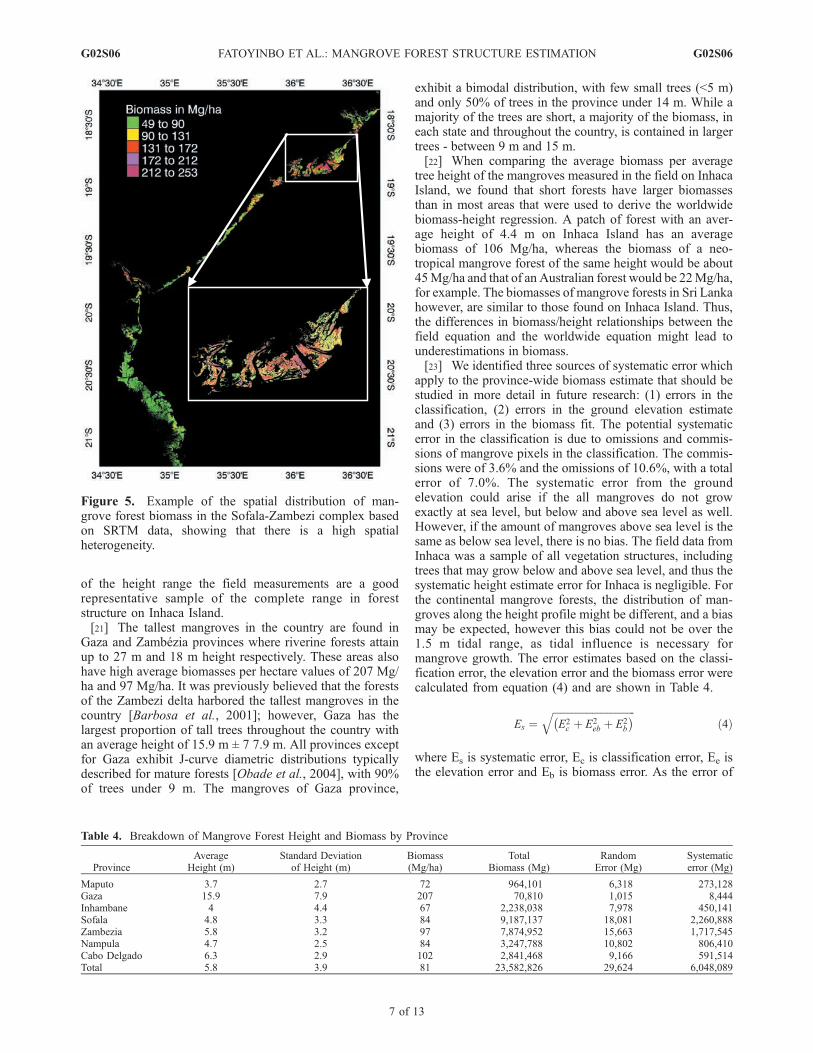
[20] The SRTM height and aboveground biomass map ofMozambique is presented in Figure 5 and a geographicalbreakdown of height and biomass distribution in the prov-inces is in Table 4. Mangrove heights ranged from 1 m to27 m, with an average of 5.8 m throughout the country.Average biomass in the provinces ranged from 72 Mg/ha to207 Mg/ha with an average of 81 Mg/ha. Inhaca dataincluded transects going from the shore to inland, thusrepresenting the canopy structure as whole. Furthermore,the height class distributions for Inhaca obtained fromSRTM and field measurements both exhibit the sameinverse J-shape distribution with a majority of small treesand few tall trees. Even though SRTM has a larger range inheights than the field data, 86% of average tree heights onInhaca Island measured by SRTM are shorter than or equalto 7 m, which is the maximum average height measured inthe field. As the field measurements comprise almost 90%
Figure 4. Histogram of mangrove cover in km2 in Mozambique for 1972, 1990 and 1999–2002,showing that mangrove cover overall has been decreasing, especially in Sofala, Zambezia and Nampulaprovinces, while mangrove cover in Maputo, Inhambane, Gaza and Cabo Delgado has been relativelyconstant.
G02S06 FATOYINBO ET AL.: MANGROVE FOREST STRUCTURE ESTIMATION
6 of 13
G02S06
of the height range the field measurements are a goodrepresentative sample of the complete range in foreststructure on Inhaca Island.[21] The tallest mangroves in the country are found in
Gaza and Zambezia provinces where riverine forests attainup to 27 m and 18 m height respectively. These areas alsohave high average biomasses per hectare values of 207 Mg/ha and 97 Mg/ha. It was previously believed that the forestsof the Zambezi delta harbored the tallest mangroves in thecountry [Barbosa et al., 2001]; however, Gaza has thelargest proportion of tall trees throughout the country withan average height of 15.9 m ± 7 7.9 m. All provinces exceptfor Gaza exhibit J-curve diametric distributions typicallydescribed for mature forests [Obade et al., 2004], with 90%of trees under 9 m. The mangroves of Gaza province,
exhibit a bimodal distribution, with few small trees (<5 m)and only 50% of trees in the province under 14 m. While amajority of the trees are short, a majority of the biomass, ineach state and throughout the country, is contained in largertrees - between 9 m and 15 m.[22] When comparing the average biomass per average
tree height of the mangroves measured in the field on InhacaIsland, we found that short forests have larger biomassesthan in most areas that were used to derive the worldwidebiomass-height regression. A patch of forest with an aver-age height of 4.4 m on Inhaca Island has an averagebiomass of 106 Mg/ha, whereas the biomass of a neo-tropical mangrove forest of the same height would be about45Mg/ha and that of an Australian forest would be 22Mg/ha,for example. The biomasses of mangrove forests in Sri Lankahowever, are similar to those found on Inhaca Island. Thus,the differences in biomass/height relationships between thefield equation and the worldwide equation might lead tounderestimations in biomass.[23] We identified three sources of systematic error which
apply to the province-wide biomass estimate that should bestudied in more detail in future research: (1) errors in theclassification, (2) errors in the ground elevation estimateand (3) errors in the biomass fit. The potential systematicerror in the classification is due to omissions and commis-sions of mangrove pixels in the classification. The commis-sions were of 3.6% and the omissions of 10.6%, with a totalerror of 7.0%. The systematic error from the groundelevation could arise if the all mangroves do not growexactly at sea level, but below and above sea level as well.However, if the amount of mangroves above sea level is thesame as below sea level, there is no bias. The field data fromInhaca was a sample of all vegetation structures, includingtrees that may grow below and above sea level, and thus thesystematic height estimate error for Inhaca is negligible. Forthe continental mangrove forests, the distribution of man-groves along the height profile might be different, and a biasmay be expected, however this bias could not be over the1.5 m tidal range, as tidal influence is necessary formangrove growth. The error estimates based on the classi-fication error, the elevation error and the biomass error werecalculated from equation (4) and are shown in Table 4.
Es ¼ffiffiffiffiffiffiffiffiffiffiffiffiffiffiffiffiffiffiffiffiffiffiffiffiffiffiffiffiffiffiffiffiffiE2c þ E2
eb þ E2b
� �qð4Þ
where Es is systematic error, Ec is classification error, Ee isthe elevation error and Eb is biomass error. As the error of
Figure 5. Example of the spatial distribution of man-grove forest biomass in the Sofala-Zambezi complex basedon SRTM data, showing that there is a high spatialheterogeneity.
Table 4. Breakdown of Mangrove Forest Height and Biomass by Province
ProvinceAverage
Height (m)Standard Deviation
of Height (m)Biomass(Mg/ha)
TotalBiomass (Mg)
RandomError (Mg)
Systematicerror (Mg)
Maputo 3.7 2.7 72 964,101 6,318 273,128Gaza 15.9 7.9 207 70,810 1,015 8,444Inhambane 4 4.4 67 2,238,038 7,978 450,141Sofala 4.8 3.3 84 9,187,137 18,081 2,260,888Zambezia 5.8 3.2 97 7,874,952 15,663 1,717,545Nampula 4.7 2.5 84 3,247,788 10,802 806,410Cabo Delgado 6.3 2.9 102 2,841,468 9,166 591,514Total 5.8 3.9 81 23,582,826 29,624 6,048,089
G02S06 FATOYINBO ET AL.: MANGROVE FOREST STRUCTURE ESTIMATION
7 of 13
G02S06
the biomass-height relationship was not reported in theSaenger and Snedaker [1993] paper, we neglected it in ourcalculations, however the estimation of the biomass errorshould be included in our future work.
3.3. Latitudinal Gradient
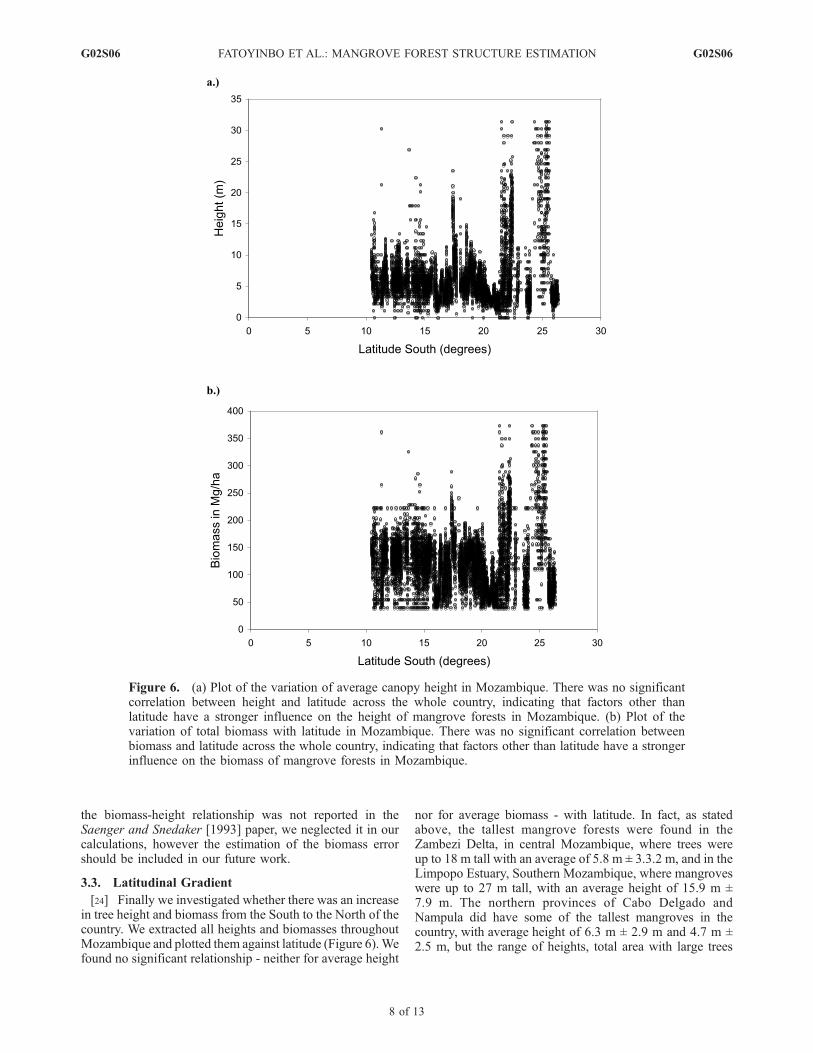
[24] Finally we investigated whether there was an increasein tree height and biomass from the South to the North of thecountry. We extracted all heights and biomasses throughoutMozambique and plotted them against latitude (Figure 6).Wefound no significant relationship - neither for average height
nor for average biomass - with latitude. In fact, as statedabove, the tallest mangrove forests were found in theZambezi Delta, in central Mozambique, where trees wereup to 18 m tall with an average of 5.8 m ± 3.3.2 m, and in theLimpopo Estuary, Southern Mozambique, where mangroveswere up to 27 m tall, with an average height of 15.9 m ±7.9 m. The northern provinces of Cabo Delgado andNampula did have some of the tallest mangroves in thecountry, with average height of 6.3 m ± 2.9 m and 4.7 m ±2.5 m, but the range of heights, total area with large trees
Figure 6. (a) Plot of the variation of average canopy height in Mozambique. There was no significantcorrelation between height and latitude across the whole country, indicating that factors other thanlatitude have a stronger influence on the height of mangrove forests in Mozambique. (b) Plot of thevariation of total biomass with latitude in Mozambique. There was no significant correlation betweenbiomass and latitude across the whole country, indicating that factors other than latitude have a strongerinfluence on the biomass of mangrove forests in Mozambique.
G02S06 FATOYINBO ET AL.: MANGROVE FOREST STRUCTURE ESTIMATION
8 of 13
G02S06
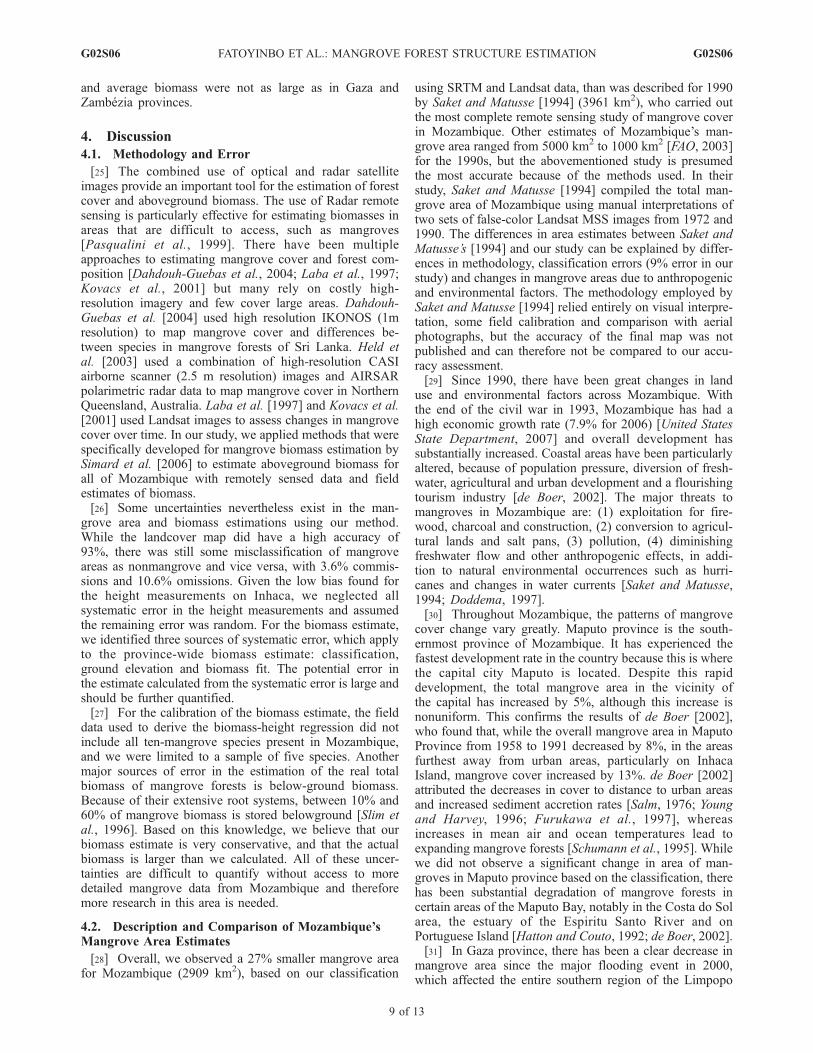
and average biomass were not as large as in Gaza andZambezia provinces.
4. Discussion
4.1. Methodology and Error
[25] The combined use of optical and radar satelliteimages provide an important tool for the estimation of forestcover and aboveground biomass. The use of Radar remotesensing is particularly effective for estimating biomasses inareas that are difficult to access, such as mangroves[Pasqualini et al., 1999]. There have been multipleapproaches to estimating mangrove cover and forest com-position [Dahdouh-Guebas et al., 2004; Laba et al., 1997;Kovacs et al., 2001] but many rely on costly high-resolution imagery and few cover large areas. Dahdouh-Guebas et al. [2004] used high resolution IKONOS (1mresolution) to map mangrove cover and differences be-tween species in mangrove forests of Sri Lanka. Held etal. [2003] used a combination of high-resolution CASIairborne scanner (2.5 m resolution) images and AIRSARpolarimetric radar data to map mangrove cover in NorthernQueensland, Australia. Laba et al. [1997] and Kovacs et al.[2001] used Landsat images to assess changes in mangrovecover over time. In our study, we applied methods that werespecifically developed for mangrove biomass estimation bySimard et al. [2006] to estimate aboveground biomass forall of Mozambique with remotely sensed data and fieldestimates of biomass.[26] Some uncertainties nevertheless exist in the man-
grove area and biomass estimations using our method.While the landcover map did have a high accuracy of93%, there was still some misclassification of mangroveareas as nonmangrove and vice versa, with 3.6% commis-sions and 10.6% omissions. Given the low bias found forthe height measurements on Inhaca, we neglected allsystematic error in the height measurements and assumedthe remaining error was random. For the biomass estimate,we identified three sources of systematic error, which applyto the province-wide biomass estimate: classification,ground elevation and biomass fit. The potential error inthe estimate calculated from the systematic error is large andshould be further quantified.[27] For the calibration of the biomass estimate, the field
data used to derive the biomass-height regression did notinclude all ten-mangrove species present in Mozambique,and we were limited to a sample of five species. Anothermajor sources of error in the estimation of the real totalbiomass of mangrove forests is below-ground biomass.Because of their extensive root systems, between 10% and60% of mangrove biomass is stored belowground [Slim etal., 1996]. Based on this knowledge, we believe that ourbiomass estimate is very conservative, and that the actualbiomass is larger than we calculated. All of these uncer-tainties are difficult to quantify without access to moredetailed mangrove data from Mozambique and thereforemore research in this area is needed.
4.2. Description and Comparison of Mozambique’sMangrove Area Estimates
[28] Overall, we observed a 27% smaller mangrove areafor Mozambique (2909 km2), based on our classification
using SRTM and Landsat data, than was described for 1990by Saket and Matusse [1994] (3961 km2), who carried outthe most complete remote sensing study of mangrove coverin Mozambique. Other estimates of Mozambique’s man-grove area ranged from 5000 km2 to 1000 km2 [FAO, 2003]for the 1990s, but the abovementioned study is presumedthe most accurate because of the methods used. In theirstudy, Saket and Matusse [1994] compiled the total man-grove area of Mozambique using manual interpretations oftwo sets of false-color Landsat MSS images from 1972 and1990. The differences in area estimates between Saket andMatusse’s [1994] and our study can be explained by differ-ences in methodology, classification errors (9% error in ourstudy) and changes in mangrove areas due to anthropogenicand environmental factors. The methodology employed bySaket and Matusse [1994] relied entirely on visual interpre-tation, some field calibration and comparison with aerialphotographs, but the accuracy of the final map was notpublished and can therefore not be compared to our accu-racy assessment.[29] Since 1990, there have been great changes in land
use and environmental factors across Mozambique. Withthe end of the civil war in 1993, Mozambique has had ahigh economic growth rate (7.9% for 2006) [United StatesState Department, 2007] and overall development hassubstantially increased. Coastal areas have been particularlyaltered, because of population pressure, diversion of fresh-water, agricultural and urban development and a flourishingtourism industry [de Boer, 2002]. The major threats tomangroves in Mozambique are: (1) exploitation for fire-wood, charcoal and construction, (2) conversion to agricul-tural lands and salt pans, (3) pollution, (4) diminishingfreshwater flow and other anthropogenic effects, in addi-tion to natural environmental occurrences such as hurri-canes and changes in water currents [Saket and Matusse,1994; Doddema, 1997].[30] Throughout Mozambique, the patterns of mangrove
cover change vary greatly. Maputo province is the south-ernmost province of Mozambique. It has experienced thefastest development rate in the country because this is wherethe capital city Maputo is located. Despite this rapiddevelopment, the total mangrove area in the vicinity ofthe capital has increased by 5%, although this increase isnonuniform. This confirms the results of de Boer [2002],who found that, while the overall mangrove area in MaputoProvince from 1958 to 1991 decreased by 8%, in the areasfurthest away from urban areas, particularly on InhacaIsland, mangrove cover increased by 13%. de Boer [2002]attributed the decreases in cover to distance to urban areasand increased sediment accretion rates [Salm, 1976; Youngand Harvey, 1996; Furukawa et al., 1997], whereasincreases in mean air and ocean temperatures lead toexpanding mangrove forests [Schumann et al., 1995]. Whilewe did not observe a significant change in area of man-groves in Maputo province based on the classification, therehas been substantial degradation of mangrove forests incertain areas of the Maputo Bay, notably in the Costa do Solarea, the estuary of the Espiritu Santo River and onPortuguese Island [Hatton and Couto, 1992; de Boer, 2002].[31] In Gaza province, there has been a clear decrease in
mangrove area since the major flooding event in 2000,which affected the entire southern region of the Limpopo
G02S06 FATOYINBO ET AL.: MANGROVE FOREST STRUCTURE ESTIMATION
9 of 13
G02S06
river basin following cyclone Eline and the subsequentopening of dams upstream [Dyson, 2000; Smithers et al.,2001]. As a result of the floods, the shape of the LimpopoEstuary changed completely, with the inundation of a 1 kmwide strip of land in front of the river mouth and thecreation of a lagoon. The mangroves on the coast werecompletely destroyed by flooding and sand intrusion andcannot be recolonized since they are now exposed to strongwaves and coastal winds. In Inhambane province, weobserved a small increase in mangrove area despite the factthat Inhambane is a popular tourist destination. Accordingto our classification, Sofala is the province with the singlelargest area of mangroves in all of Mozambique with over100 000 ha. The Sofala mangroves benefit from largeamounts of freshwater discharge and alluvium from about18 rivers [Barbosa et al., 2001]. However, there was a 14%decrease of mangrove cover from 1990 to 2000.[32] The mangroves of the Zambezi Delta have been
described by Timberlake [2000], who mapped coastalmangroves/saline mudflats/inland freshwater mangroveassociates, and Vilankulos and Marquez [2000], whomapped section of delta mangrove using 1999 SPOTimagery. Beilfuss et al. [2001] also describe the changesin vegetation cover of the Zambezi delta since 1960. Basedon a classification of the same image as the one used in thisstudy, they found that mangroves and associated speciesstretch up to 35 km inland and that mangroves alone occupyabout 100,000 ha. However, when based solely on theLandsat ETM+ image path 166 row 073 from 2000, wefound 73,000 ha of mangrove, an area much lower than the155,000 ha described by Saket and Matusse [1994] and the100,000 ha by Beilfuss et al. [2000]. We attribute these largedifferences in estimates to classification differences and theinclusion of mudflats and mangrove associated species inthe classifications by Beilfuss et al. [2000] and Saket andMatusse [1994]. In general, Beilfuss et al. [2000] foundinsignificant changes in overall mangrove area, but largeshifts in mangrove distribution, whereas we found a largedecrease in mangrove area. The construction of the KaribaDam in 1960 and the Cahora Bassa Dam in 1975 havealtered both the total flow of freshwater to the delta and thecyclical flooding of the floodplain, leading to the regressionof the coast of the delta and the surrounding 200 km [Tinley,1994], and possibly contributing to the mangrove die off. Inthe North of the country, saltpan production is particularlywidespread, with up to 50% of mangrove area converted[Barbosa et al., 2001]. We found a decrease of over 150 km2
of mangrove area in Nampula Province from previousestimates. The northernmost province of Cabo Delgado isthe only one that has not seen changes in mangrove areasince 1972. This can be attributed to the difficulty ofaccessing the area, low population pressure and the factthat there were no major natural environmental changes.
4.3. SRTM Height Map
[33] We found that the mangrove mean canopy height inMozambique ranged from 1 m to 27 m, with an averageheight of 5.8 m ± 3.9 m throughout the country. Theseresults agree with the 2.4 m to 25 m range described byother studies of mangrove structure at the same latitudes[Saenger and Snedaker, 1993].
[34] The mangroves of the Limpopo Estuary present aparticularly interesting case in Mozambique. Even thoughGaza province has the smallest area of all provinces, it hasthe tallest trees measured by SRTM and therefore thehighest biomass/ha. This can be attributed to optimalgrowing conditions due to the riverine location of themangroves. In addition, the period from February 11th to22nd, 2000 when SRTM was flown around the earth wasalso the exact time at which exceptionally heavy rains fellover Mozambique, North-East South Africa and Zimbabweand resulted in the worst floods the region had witnessed inover 100 years [Dyson, 2000; Smithers et al., 2001]. As theresult of the heavy rains from cyclone Eline and the openingof upriver dams in South Africa, the Limpopo basin inparticular was extremely heavily flooded. We believe thatthe floods resulted in the destruction of the smaller man-grove trees, while the taller, stronger trees survived, whichexplains why the size-class distribution of trees for Gazaprovince is characterized by a much larger proportion of talltrees than anywhere else in Mozambique.[35] The total biomass of mangrove forests worldwide is
estimated at 8.7 gigatons of dry weight [Twilley et al., 1992;Kathiresan and Bingham, 2001]. We estimated the totaldry Mangrove aboveground biomass of Mozambique at23.6 million tons, with an average biomass of 81 Mg/haand a RMSE of 44 Mg/ha. Assuming that 50% of the dryweight is C [Lieth and Whitaker, 1975], the standing stockof carbon stored in mangrove woody biomass is 11.8 milliontons and 40.5 Mg C/ha. The average biomass of Mozambi-que of 81 Mg/ha of mangroves is relatively low compared tothat of the mangroves of Indonesia and Malaysia withbiomasses over 300 Mg/ha [Ong et al., 1981; Komiyamaet al., 1988] but the range of 67 to 207 Mg/ha is similar tothe biomasses found by other studies for the correspondinglatitudes [Saenger and Snedaker, 1993]. As expected fromthe average height, Gaza province has the highest biomassMg/ha, but Sofala and Zambezia provinces hold 72% ofthe mangrove biomass of the whole country. These are alsothe main regions for shrimp fishery and in addition to theknowledge of the direct relationship between total mangrovearea and fishery catch [Putz and Chan, 1986], this datacould now give more insight into the relationship betweenmangrove forest quality and fishery yield.
4.4. Relationship Between Biomass and Latitude
[36] It is generally believed that forest productivity ishighest close to the equator, and decreases with increasinglatitude. In a review of 43 papers on the structure, biomassand litterfall of mangrove forests around the world, Saengerand Snedaker [1993] confirmed that mangrove tree heights,aboveground biomass and litterfall followed this pattern ofdistribution. Using SRTM to estimate aboveground biomassin Mozambique presents a unique opportunity to test theresults found by Saenger and Snedaker [1993], as it is thefirst study estimating total aboveground biomass using onemethod at this scale, covering over 16 degrees latitude.[37] Contrary to the abovementioned findings, we did not
find a significant correlation between biomass and heightdepending on latitude. Indeed, height (and biomass, whichis directly proportional to height), was much more depen-dent on proximity to freshwater, with the riverine man-groves of the Limpopo at 25 degrees latitude and the deltaic
G02S06 FATOYINBO ET AL.: MANGROVE FOREST STRUCTURE ESTIMATION
10 of 13
G02S06
mangroves of the Zambezi at 18 degrees latitude growingthe tallest. Mangrove growth is often limited by nutrientavailability [Lugo and Snedaker, 1974; Boto et al., 1984;Clough, 1992; Twilley et al., 1992] and both the Zambezidelta and the Limpopo estuary receive large amounts ofnutrient rich upstream sediments, leading to tall mangroveforests [Barbosa et al., 2001; Beilfuss et al., 2001].[38] Mozambique has a variety of environmental settings,
which have a stronger influence on mangrove growth,composition and therefore biomass, than latitude alonedoes. It would be interesting to carry out further studiesof forest structure and biomass using SRTM on an evenlarger scale to verify whether it is possible to detectsignificant trends in mangrove biomass and productivitywith latitude.
5. Conclusions
[39] Mangrove forests have been greatly degraded anddestroyed throughout the world, despite their known eco-logical and economical importance. Because they form anecosystem that is difficult to survey in the field and as theylargely grow in developing nations for which data is oftennot available, large-scale studies of their structure andbiomass have not been carried out. In this paper, a newmethod using Landsat-derived landcover maps and ShuttleRadar Topography mission data has been applied to esti-mate Mozambique’s total mangrove area, as well as spatialheight and biomass distribution. Since the coast of Mozam-bique covers a large range of latitudes, 10�20 ‘S to 26�50 ‘S,we were also able to test the biogeographical paradigm thatmangrove biomass increases with proximity to the equator[Saenger and Snedaker, 1993].[40] The mangrove map, developed from Landsat ETM+
data of Mozambique, showed that the total mangrove areaof Mozambique is 2909 km2 with an accuracy of 91%. Thearea of 2909 km2 is 27% smaller than the previous estimateof 3600 km2 [Saket and Matusse, 1994]. While the differ-ence in area can be attributed to classification errors - theclassification accuracy was increased by 22% by using theSRTM mask - we also believe that there has been a decreasein mangrove area throughout the country due to anthropo-genic and environmental factors. Indeed, mangroves inMozambique have suffered due to clearances for salt ponds,agriculture, use for firewood, construction of dams - whichresulted in the diversion of freshwater - pollution anddevelopment of the land for tourism. In addition, majorfloods, coastal erosion and sand intrusion have also lead tothe loss of mangrove forests, notably in Gaza province andin the Maputo Bay.[41] The height map derived from the field data and
SRTM data, showed that SRTM data is a good indicatorof average mangrove tree height, with a RMSE of 1.5 m.There were substantial differences in height and biomassdistributions throughout Mozambique. The average treeheight in Mozambique was 5.8 m and tree heights measuredwith SRTM ranged from 1 m to 27 m. The tallest trees werefound in the Zambezi Delta and in the Limpopo Estuary.[42] In summary, our estimates of aboveground forest
biomass and C storage are a good indicator of what theaboveground biomass of mangrove forests is in Mozambi-que. However, we do believe that more extensive ground
measures of structure and biomass are needed. Subsequentresearch should consider the ground topography in man-grove forests and determine whether there is a bias in theheight and biomass estimation. By determining the forestarea and biomass of Mozambique, we were able to providemuch needed data on Mozambique’s natural resources andwere able to prove that one of the most widespread theoriesin mangrove biogeography does not apply to this region.
[43] Acknowledgments. We would like to thank Y. Abdelilah for theediting of the drafts of this manuscript. We also thank the Center forRegional Environmental Studies at the University of Virginia, the Bureau ofEducational and Cultural Affairs of the United States Department of Stateproject ‘‘Mainstreaming Use of GIS and Remote Sensing in EnvironmentalAssessment and Sustainable Development,’’ project S-ECAAS-02-GR-294and the International Tropical Timber Association for funding this project.Part of this work was carried out at the Jet Propulsion Laboratory,California Institute of Technology, under a contract with the NationalAeronautics and Space Administration. Funding was also provided by aNSF Biocomplexity grant BCS-030846 and a Faculty Development grantfrom the Office of the Vice-Provost for Faculty Affairs, University ofVirginia.
ReferencesAlongi, D. M. (2002), Present and future of the world’s mangrove forests,Environ. Conserv., 29(3), 331–349.
Aschbacher, J., R. Ofren, J. P. Delsol, T. B. Suselo, S. Vibulsresth, andT. Charrupat (1995), An integrated comparative approach to mangrovevegetation mapping using advanced remote sensing and GIS technol-ogies: Preliminary results, Hydrobiologia, 295(1–3), 285–294.
Barbosa, F., C. Cuambe, and S. Bandeira (2001), Status and distribution ofmangroves in Mozambique, S. Afr. J. Bot., 67, 393–398.
Beilfuss, R., P. Dutton, and D. Moore (2000), Chapter 2 Land cover andland use change in the Zambezi Delta, in Zambezi Basin Wetlands VolumeIII Land Use Change and Human Impacts, Biodiversity Foundation forAfrica, Harare.
Beilfuss, R., D. Moore, C. Bento, and P. Dutton (2001), Patterns of vegeta-tion change in the Zambezi Delta, Working Paper #3 Program For theSustainable Management of Cahora Bassa Dam And The Lower ZambeziValley.
Boto, K. G., J. S. Bunt, and J. T. Wellington (1984), Variations in mangroveforest productivity in Northern Australia and Papua-New-Guinea, Estuar-ine Coastal Shelf Sci., 19(3), 321–329.
Carabajal, C. C., and D. J. Harding (2005), ICESat validation of SRTMC-Band digital elevation models, Geophys. Res. Lett., 32, L22S01,doi:10.1029/2005GL023957.
Carabajal, C. C., and D. J. Harding (2006), SRTM C-Band and ICESat laseraltimetry elevation comparisons as a function of tree cover and relief,Photogramm. Eng. Remote Sens., 72(3), 287–298.
Chapman, V. J. (1944), Cambridge Univ. expedition to Jamaica, J. LinneanSoc. Bot., 52, 407–533.
Chapman, V. J. (1970), Mangrove phytosociology, Trop. Ecol, 11, 1–19.Cintron, G., and Y. Shaeffer-Novelli (1984),Methods for studying mangrovestructure, The Mangrove Ecosystem: Research Methods, UNESCO.
Clough, B. F. (1992), Primary productivity and growth of mangrove forests,in Tropical Mangrove Ecosystems, vol. 329, AGU, Washington, D. C.
Clough, B. F., and K. Scott (1989), Allometric relationships for estimatingabove-ground biomass in six mangrove species, For. Ecol. Manage.,27(2), 117–127.
Cohen, M. C. L., and R. N. J. Lara (2003), Temporal changes of mangrovevegetation boundaries in Amazonia: Application of GIS and remote sen-sing techniques, Wetlands Ecol. Manage., 11(4), 223–231.
Comley, B. W. T., and K. A. McGuinness (2005), Above- and below-ground biomass, and allometry, of four common northern Australianmangroves, Aust. J. Bot., 53, 431–436.
Dahdouh-Guebas, F., A. Verheyden, W. De Genst, S. Hettiarachchi, andN. Koedam (2000), Four decade vegetation dynamics in Sri Lankanmangroves as detected from sequential aerial photography: A case studyin Galle, Bull. Mar. Sci., 67(2), 741–759.
Dahdouh-Guebas, F., T. Zetterstrom, P. Ronnback,M. Troell, A.Wickramasinghe,and N. Koedam (2002), Recent changes in land-use in the Pambala-Chilaw Lagoon complex (Sri Lanka) investigated using remote sensingand GIS: Conservation of mangroves vs. development of shrimp farm-ing, Environ. Dev. Sustain., 4(2), 185–200.
Dahdouh-Guebas, F., I. Van Pottelbergh, J. G. Kairo, S. Cannicci, andN. Koedam (2004), Human-impacted mangroves in Gazi (Kenya):Predicting future vegetation based on retrospective remote sensing,
G02S06 FATOYINBO ET AL.: MANGROVE FOREST STRUCTURE ESTIMATION
11 of 13
G02S06
social surveys, and tree distribution, Mar. Ecol. Prog. Ser., 272, 77–92.
de Boer, W. F. (2002), The rise and fall of the mangrove forests in MaputoBay, Mozambique, Wetlands Ecol. Manage., 10(4), 313.
Dittmar, T., N. Hertkorn, G. Kattner, and R. J. Lara (2006), Mangroves, amajor source of dissolved organic carbon to the oceans, Global Biogeo-chem. Cycles, 20, GB1012, doi:10.1029/2005GB002570.
Doddema, M. (1997), A preliminary exploratory survey of mangrove ve-getation in Northern Part of Sofala, Mozambique: Methods and informa-tion requirement for planning and management purposes, SAREC-SidaRegional Workshop on Mangrove Ecology, Physiology and Management,Zanzibar.
Duke, N. C. (1992), Tropical Mangrove Ecosystems, AGU, Washington,D. C.
Dyson, L. (2000), The heavy rainfall and floods of February 2000: Asynoptic overview, in Southern Africa Floods of February 2000, Dep.of Civ. Eng., Univ. of Pretoria, Pretoria.
Ellison, A. (2002), Macroecology of mangroves: Large-scale patterns andprocesses in tropical coastal forests, Trees Structure Function, 16(2–3),181–194.
FAO (1981), Evaluacion de los recurcos forestales de la Republica popularde Mozambique, Field Doc. MOZ/76/007, 97 pp., Rome.
FAO (2003), Status and trends in mangrove area extent worldwide, ForestResources Assessment Working Paper 63, FAO, 287, For. Resour. Div.,Rome.
Furukawa, K., E. Wolanski, and H. Mueller (1997), Currents and sedimenttransport in mangrove forests, Estuarine Coastal Shelf Sci., 44(3), 301–310.
Gesche, K., B. Michael, W. Stefan, and B. Gerald (2004), Mapping land-cover and mangrove structures with remote sensing techniques: A con-tribution to a synoptic GIS in support of coastal management in northBrazil, Environ. Manage. N. Y., 34(3), 429–440.
Gillespie, T. W., B. R. Zutta, M. K. Early, and S. Saatchi (2006), Predictingand quantifying the structure of tropical dry forests in south Florida andthe neotropics using spaceborne imagery, Glob. Ecol. Biogeogr., 15(3),225–236.
Hatton, J. C., and A. L. Couto (1992), The Effect of coastline changes onmangrove community structure, Portuguese Island, Mozambique, Hydro-biologia, 247(1), 49–57.
Held, A., C. Ticehurst, L. Lymburner, and N. Williams (2003), High reso-lution mapping of tropical mangrove ecosystems using hyperspectral andradar remote sensing, Int. J. Remote Sens., 24(13), 2739–2759.
Heo, J., J. W. Kim, S. Pattnaik, and H. G. Sohn (2006), Quality improve-ment of Loblolly Pine (Pinus Taeda) Plantation inventory GIS usingshuttle radar topography mission (SRTM) and the national elevationdataset (NED), For. Ecol. Manage., 233(1), 61–68.
Hofton, M., R. Dubayah, J. B. Blair, and D. Rabine (2006), Validation ofSRTM elevations over vegetated and nonvegetated terrain using mediumfootprint lidar, Photogramm. Eng. Remote Sens., 72(3), 279–285.
Hughes, R. H., and J. S. Hughes (1992), A Directory of African Wetlands,820, IUCN, UNEP and WCMC, Cambridge.
IGNFI-CENACARTA (1999), The classification system definition of theland cover types, Rural Rehabilitation Project.
Jennerjahn, T. C., and V. Ittekot (2002), Relevance of mangroves for theproduction and deposition of organic matter along tropical continentalmargins, Naturwissenschaften, 89, 23–30.
Kalk, M. (1995), A Natural History of Inhaca Island, Witswatersrand Univ.Press, Johannesburg.
Kathiresan, K., and B. L. Bingham (2001), Biology of mangroves andmangrove ecosystems, Adv. Mar. Biol., 40, 81–251.
Kellndorfer, J., W. Walker, L. Pierce, C. Dobson, J. A. Fites, C. Hunsaker,J. Vona, and M. Clutter (2004), Vegetation height estimation fromshuttle radar topography mission and national elevation datasets, Re-mote Sens. Environ., 93(3), 339–358.
Komiyama, A., H. Moriya, S. Prawiroatmodjo, T. Toma, and K. Ogino,(1988), Primary productivity of mangrove forest, Biologial System ofMangroves, A Report of East Indonesian Mangrove Expedition 1986,97–117, Ehime Univ., Ehime.
Komiyama, A., S. Poungparn, and S. Kato (2005), Common allometricequations for estimating the tree weight of mangroves, J. Trop. Ecol.,21, 471–477.
Kovacs, J. M., J.Wang, andM. Blanco-Correa (2001),Mapping disturbancesin a mangrove forest using multi-date Landsat TM imagery, Environ.Manage. N. Y., 27(5), 763–776.
Laba, M., S. D. Smith, and S. D. Degloria (1997), Landsat-based land covermapping in the lower Yuna River watershed in the Dominican Republic,Int. J. Remote Sens., 18, 3011–3025.
Laurance, W. F. (2007), A new initiative to use carbon trading for tropicalforest conservation, Biotropica, 39(1), 20–24.
Lieth, H., and R. H. Whitaker (1975), Primary Productivity of the Bio-sphere, Springer, New York.
Lugo, A. E., and S. C. Snedaker (1974), The ecology of mangroves, Annu.Rev. Ecol. Syst., 5(1), 39–64.
MICOA (1998), Strategy and areas for action for the conservation ofbiological diversity in Mozambique, MICOA, Maputo.
Obade, P., F. Dadouh-Guebas, N. Koedam, R. De Wulf, and J. Tack (2004),GIS-based integration of interdisciplinary ecological data to detect land-cover changes in creek mangroves at Gazi Bay, Kenya, Western IndianOcean, J. Mar. Sci., 3(1), 11–27.
Ong, J. E., W. K. Gong, and C. H. Wong (1981), Ecological Monitoring ofthe Sungai Merbok Estuarine Mangrove Ecosystem, Universiti SainsMalaysia, Penang.
Pasqualini, V., J. Iltis, N. Dessay, M. Lointier, O. Guelorget, and L. Polidori(1999), Mangrove mapping in north-western Madagascar using Spot-Xsand SIR-C Radar Data, Hydrobiologia, 413, 127–133.
Piao, S., J. Fang, B. Zhu, and K. Tan (2005), Forest biomass carbon stocksin China over the past 2 decades: Estimation based on integrated inven-tory and satellite data, J. Geophys. Res., 110, G01006, doi:10.1029/2005JG000014.
Putz, F. E., and H. T. Chan (1986), Tree growth, dynamics, and productivityin a mature mangrove forest in Malaysia, For. Ecol. Manage., 17(2–3),211–230.
Rasolofoharinoro, M., F. Blasco, M. F. Bellan, M. Aizpuru, T. Gauquelin,and J. Denis (1998), A remote sensing based methodology for mangrovestudies in Madagascar, Int. J. Remote Sens., 19(10), 1873–1886.
Rodriguez, E., E. Morris, and J. E. Belz (2006), A global assessment of theSRTM performance, Photogramm. Eng. Remote Sens., 72(3), 249–260.
Ross, M. S., P. L. Ruiz, G. J. Telesnicki, and J. F. Meeder (2001), Estimat-ing above-ground biomass and production in mangrove communities ofBiscayne National Park, Florida (U.S.A.), Wetlands Ecol. Manage., 9(1),27–37.
Saenger, P., and S. C. Snedaker (1993), Pantropical trends in mangroveaboveground biomass and annual litterfall, Oecologia, 96(3), 293–299.
Saket, M., and R. Matusse, (1994), Study for the determination of the rateof deforestation of the mangrove vegetation in Mozambique, FAO/PNUD/MOZ/92/013: 9, DNFFB.
Salm, R. (1976), The dynamics and management of the Ponta Torres CoralReef, Inhaca Island-Mocambique, Memorias do Insituto de InvestigacaoCientifica de Mocambique, 12, 25–40.
Satyanarayana, B., B. Thierry, LoD. Seen, A. V. Raman, andG.Muthusankar(2001), Remote sensing in mangrove research-relationship betweenvegetation indices and dendrometric parameters: A case for Coringa, eastcoast of India, Proceedings From the 22nd Asian Conference on RemoteSensing, Cent. for Remote Imaging, Sensing and Processing, Singapore.
Schumann, E. H., A. L. Cohen, and M. R. Jury (1995), Coastal sea-surfacetemperature variability along the south coast of South-Africa and therelationship to regional and global climate, J. Mar. Res., 53(2), 231–248.
Simard, M., K. Q. Zhang, V. H. Rivera-Monroy, M. S. Ross, P. L. Ruiz,E. Castaneda-Moya, R. R. Twilley, and E. Rodriguez (2006), Mappingheight and biomass of mangrove forests in Everglades National Parkwith SRTM elevation data, Photogramm. Eng. Remote Sens., 72(3),299–311.
Simard, M., V. H. Rivera-Monroy, J. E. Mancera-Pineda, E. Castaneda-Moya, and R. R. Twilley (2008), A systematic method for 3d mappingof mangrove forests based on shuttle radar topography mission elevationdata, ICESat/GLAS waveforms and field data: Application to CienagaGrande De Santa Marta, Colombia, Remote Sens. Environ., in press.
Slim, F. J., P. M. Gwada, M. Kodjo, and M. A. Hemminga (1996), Biomassand litterfall of Ceriops tagal and Rhizophora mucronata in the mangroveforest of Gazi Bay, Kenya, Mar. Freshwater Res., 47(8), 999–1007.
Smith, T. M. (1992), Forest structure, in Tropical Mangrove Ecosystems,vol. 329, AGU, Washington, D. C.
Smith, G. M., T. Spencer, A. L. Murray, and J. R. French (1998), Assessingseasonal vegetation change in coastal wetlands with airborne remotesensing: An outline methodology, Mangroves Salt Marshes, 2(1), 15–28.
Smithers, J. C., R. E. Schultze, A. Pike, and G. P. W. Jewitt (2001), Ahydrological perspective of the February 2000 floods: A case study in theSabie River Catchment, Water S. A., 27(3), 325–332.
Spalding, M., F. Blasco, and C. Field (1995), World Mangrove Atlas, Int.Soc. for Mangrove Ecosyst., Okinawa.
Sulong, I., H. Mohd-Lokman, K. Mohd-Tarmizi, and A. Ismail (2002),Mangrove mapping using landsat imagery and aerial photographs: Kema-man District, Terengganu, Malaysia, Environ. Dev. Sustain., 4(2), 135–152.
Tinley, K. L. (1994), Description of Gorongosa-Marromeu Natural Re-source Management Area. Section 2: Ecological Profile of the Region(Form, Content, Process), IUCN-ROSA. Harare.
G02S06 FATOYINBO ET AL.: MANGROVE FOREST STRUCTURE ESTIMATION
12 of 13
G02S06
Twilley, R. R., R. H. Chen, and T. Hargis (1992), Carbon sinks in man-groves and their implications to carbon budget of tropical coastal eco-systems, Water Air Soil Pollut., 64(1–2), 265–288.
UNEP-WCMC (2006), In the front line: Shoreline protection and otherecosystem services from mangroves and coral reefs, 33, UK UNEP-WCMC, Cambridge.
United States State Department (2007), Visited 06/16/07. (Available athttp://www.state.gov/p/af/ci/mz/)
Valiela, I., J. L. Bowen, and J. K. York (2001), Mangrove forests: One ofthe world’s threatened major tropical environments, BioScience, 51(10),807–815.
Wang, L., W. P. Sousa, P. Gong, and G. S. Biging (2004), Comparison ofIKONOS and Quickbird images for mapping mangrove species on theCaribbean coast of Panama, Remote Sens. Environ., 91(3–4), 432–440.
Young, B. M., and E. L. Harvey (1996), A spatial analysis of the relation-ship between mangrove (Avicennia Marina Var. Australasica) physiog-nomy and sediment accretion in the Hauraki Plains, New Zealand,Estuarine Coastal Shelf Sci., 42, 231–246.
�����������������������T. E. Fatoyinbo and H. H. Shugart, Department of Environmental
Sciences, University of Virginia, Charlottesville, VA 22904, USA.([email protected])M. Simard, Radar and Engineering Section, Caltech-Jet Propulsion
Laboratory, MS 300-319D, 4800 Oak Grove Drive, Pasadena, CA 91109,USA.R. A. Washington-Allen, Department of Ecosystem Science and
Management, Texas A&M University, 2138 TAMU, College Station, TX77843-2138, USA.
G02S06 FATOYINBO ET AL.: MANGROVE FOREST STRUCTURE ESTIMATION
13 of 13
G02S06
Copyright © 2022 FDOKUMEN