Normative and Criterion-Related Standards for Shuttle Run Performance in Youth
13
157 Pediatric Exercise Science, 2012, 24, 157-169 © 2012 Human Kinetics, Inc. ORIGINAL RESEARCH Silva et al. are with the Research Centre in Physical Activity, Health and Leisure, Faculty of Sport, University of Porto, Porto, Portugal. Normative and Criterion-Related Standards for Shuttle Run Performance in Youth Gustavo Silva, Luísa Aires, Jorge Mota, José Oliveira, and José Carlos Ribeiro University of Porto The purpose of this study was to calculate and validate reference standards for the 20-m shuttle run test (SR) in youths aged 10–18 years. Reference standards based on the number of completed SR laps were calculated by LMS method in a reference group of 5559 students. Cut-off values for SR laps were determined and tested by ROC curve analysis in a validation group (633 students), from which waist circumference, HDL-cholesterol, triglycerides, fasting glucose and mean arterial pressure were assessed to calculate a metabolic risk score, later dichotomized in low and high metabolic risk (HMRS). The accuracy of SR laps standards was significant for girls (AUC = 0.66; 95% CI = 0.58–0.74; p < .001) and boys (AUC = 0.71; 95% CI = 0.62–0.79; p < .001) for identifying subjects at HMRS. The 40th percentile was the best cut-off for SR laps in girls (SENS = 0.569; 1-SPEC = 0.330) and boys (SENS = 0.634; 1-SPEC = 0.266). New SR laps reference standards are able to discriminate metabolic risk levels, and may provide a valuable tool for early prevention of cardiovascular risk factors. It is well established that lower cardiorespiratory fitness (CRF) relates to poor cardio-metabolic conditions, being also a predictor of mortality and morbidity by cardiovascular diseases (CVD) and diabetes mellitus in adults (7,39). In youth, CRF might have a health protective effect since it has been inversely associated with body fat (4), features of the metabolic syndrome (8), and arterial compliance (27). Therefore, CRF evaluation is paramount to identify subjects at risk or monitoring adverse health outcomes (28–30). The best indicator for CRF is the maximal oxygen uptake (VO 2max; 34). By establishing VO 2max values to discriminate young people at high and low of cardio- metabolic risk, CRF reference standards were validated (1,23,30). However, the methods for direct assessment of VO 2max usually require a laboratory with sophis- ticated equipment, trained staff and increased costs (33). Alternatively, VO 2max can be estimated from the performance achieved in laboratory or field tests by using validated equations (17,20,21,31). On the other hand, those equations showed bias
-
Upload
independent -
Category
Documents
-
view
0 -
download
0
Transcript of Normative and Criterion-Related Standards for Shuttle Run Performance in Youth
157
Pediatric Exercise Science, 2012, 24, 157-169 © 2012 Human Kinetics, Inc.
original research
Silva et al. are with the Research Centre in Physical Activity, Health and Leisure, Faculty of Sport, University of Porto, Porto, Portugal.
Normative and Criterion-Related Standards for Shuttle Run Performance
in Youth
Gustavo Silva, Luísa Aires, Jorge Mota, José Oliveira, and José Carlos Ribeiro
University of Porto
The purpose of this study was to calculate and validate reference standards for the 20-m shuttle run test (SR) in youths aged 10–18 years. Reference standards based on the number of completed SR laps were calculated by LMS method in a reference group of 5559 students. Cut-off values for SR laps were determined and tested by ROC curve analysis in a validation group (633 students), from which waist circumference, HDL-cholesterol, triglycerides, fasting glucose and mean arterial pressure were assessed to calculate a metabolic risk score, later dichotomized in low and high metabolic risk (HMRS). The accuracy of SR laps standards was significant for girls (AUC = 0.66; 95% CI = 0.58–0.74; p < .001) and boys (AUC = 0.71; 95% CI = 0.62–0.79; p < .001) for identifying subjects at HMRS. The 40th percentile was the best cut-off for SR laps in girls (SENS = 0.569; 1-SPEC = 0.330) and boys (SENS = 0.634; 1-SPEC = 0.266). New SR laps reference standards are able to discriminate metabolic risk levels, and may provide a valuable tool for early prevention of cardiovascular risk factors.
It is well established that lower cardiorespiratory fitness (CRF) relates to poor cardio-metabolic conditions, being also a predictor of mortality and morbidity by cardiovascular diseases (CVD) and diabetes mellitus in adults (7,39). In youth, CRF might have a health protective effect since it has been inversely associated with body fat (4), features of the metabolic syndrome (8), and arterial compliance (27). Therefore, CRF evaluation is paramount to identify subjects at risk or monitoring adverse health outcomes (28–30).
The best indicator for CRF is the maximal oxygen uptake (VO2max; 34). By establishing VO2max values to discriminate young people at high and low of cardio-metabolic risk, CRF reference standards were validated (1,23,30). However, the methods for direct assessment of VO2max usually require a laboratory with sophis-ticated equipment, trained staff and increased costs (33). Alternatively, VO2max can be estimated from the performance achieved in laboratory or field tests by using validated equations (17,20,21,31). On the other hand, those equations showed bias
158 Silva et al.
and increased random error (33), especially for subjects in extreme (low) perfor-mance values, potentially leading to misclassification of the CRF and metabolic risk levels. Thus, when using submaximal or field tests it would be interesting that the raw data of the performance objectively measured (i.e., power output, stage, number of shuttles or achieved distance) could be used as a reference standard to classify the CRF levels and to identify the individual’s clinical metabolic risk status.
The 20-m Shuttle Run Test (SR) created by Léger et al. (21) is a widely used field test. The SR, or some adapted version of it, is part of several fitness tests bat-teries, like FITNESSGRAM (35). However, reference standards for CRF expressed in SR laps developed by FITNESSGRAM were calculated by regressing VO2max values associated to the risk of CVD or all-cause mortality in adults (7,13). Thus, the clinical validity of SR laps reference standards for discriminating youths with poor cardio-metabolic profiles is not known. Therefore, the purpose of the current study was to calculate population-based reference standards for SR laps in children and adolescents, and validate their clinical value in the screening of subjects with high metabolic risk.
Methods
Subjects
A total of 6192 students (3131 girls and 3031 boys) aged 10–18 years from two districts from the North of Portugal participated in this study. Participants were further divided into two groups, reference group [5559 students (2789 girls and 2770 boys)] and validation group [633 students (372 girls and 261 boys)], to calculate and validate new CRF reference standards. The study was carried out following the guidelines for Human research from the Declaration of Helsinki. The study’s purpose, nature, benefits, risks and discomforts were explained to participants, parents/guardians and teachers before running the study. Informed written consent was obtained from all participants’ parents/guardians. The institutional research review board approved the study.
Anthropometric Measurements
Body mass and height were measured following standard procedures (24). Body height was measured to the nearest mm in bare or stocking feet with adolescents’ standing upright against a stadiometer (Holtain Ltd.—Crymmych, Pembrokeshire, UK). Weight was measured to the nearest 0.10kg, with students lightly dressed, using an electronic weight scale (Tanita Inner Scan BC 532; Tanita Corporation—Tokyo, Japan). Body mass index (BMI) was calculated from the ratio of body weight (kg)/body height (m2). Waist circumference (WC) was measured to the nearest mm with a metallic tape at the superior border of the iliac crest, according to a previously described protocol (36).
Cardiovascular Disease Risk Factors
Systolic (SBP) and diastolic (DBP) blood pressures were measured using the Colin Press Mate Non-Invasive Blood Pressure Monitor (model BP 8800p; Colin Medi-
Shuttle Run Performance Standards in Youth 159
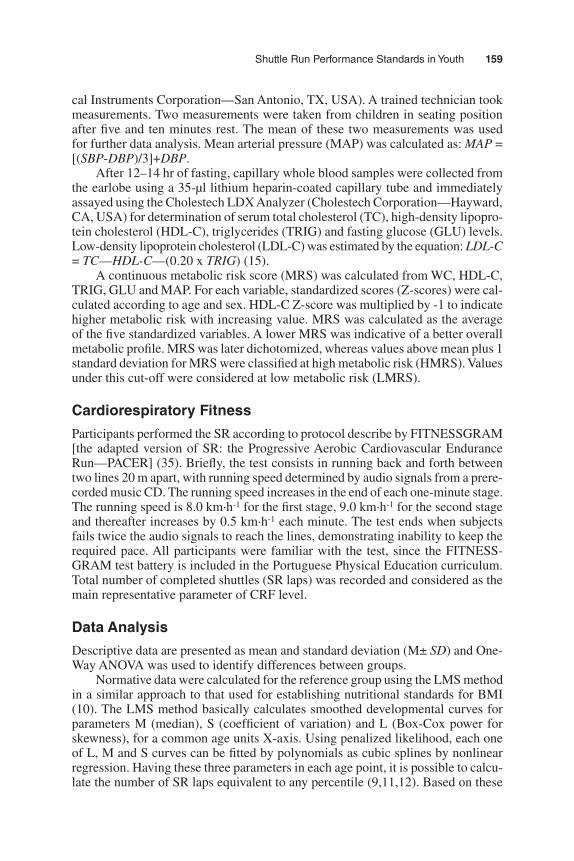
cal Instruments Corporation—San Antonio, TX, USA). A trained technician took measurements. Two measurements were taken from children in seating position after five and ten minutes rest. The mean of these two measurements was used for further data analysis. Mean arterial pressure (MAP) was calculated as: MAP = [(SBP-DBP)/3]+DBP.
After 12–14 hr of fasting, capillary whole blood samples were collected from the earlobe using a 35-μl lithium heparin-coated capillary tube and immediately assayed using the Cholestech LDX Analyzer (Cholestech Corporation—Hayward, CA, USA) for determination of serum total cholesterol (TC), high-density lipopro-tein cholesterol (HDL-C), triglycerides (TRIG) and fasting glucose (GLU) levels. Low-density lipoprotein cholesterol (LDL-C) was estimated by the equation: LDL-C = TC—HDL-C—(0.20 x TRIG) (15).
A continuous metabolic risk score (MRS) was calculated from WC, HDL-C, TRIG, GLU and MAP. For each variable, standardized scores (Z-scores) were cal-culated according to age and sex. HDL-C Z-score was multiplied by -1 to indicate higher metabolic risk with increasing value. MRS was calculated as the average of the five standardized variables. A lower MRS was indicative of a better overall metabolic profile. MRS was later dichotomized, whereas values above mean plus 1 standard deviation for MRS were classified at high metabolic risk (HMRS). Values under this cut-off were considered at low metabolic risk (LMRS).
Cardiorespiratory Fitness
Participants performed the SR according to protocol describe by FITNESSGRAM [the adapted version of SR: the Progressive Aerobic Cardiovascular Endurance Run—PACER] (35). Briefly, the test consists in running back and forth between two lines 20 m apart, with running speed determined by audio signals from a prere-corded music CD. The running speed increases in the end of each one-minute stage. The running speed is 8.0 km·h-1 for the first stage, 9.0 km·h-1 for the second stage and thereafter increases by 0.5 km·h-1 each minute. The test ends when subjects fails twice the audio signals to reach the lines, demonstrating inability to keep the required pace. All participants were familiar with the test, since the FITNESS-GRAM test battery is included in the Portuguese Physical Education curriculum. Total number of completed shuttles (SR laps) was recorded and considered as the main representative parameter of CRF level.
Data Analysis
Descriptive data are presented as mean and standard deviation (M± SD) and One-Way ANOVA was used to identify differences between groups.
Normative data were calculated for the reference group using the LMS method in a similar approach to that used for establishing nutritional standards for BMI (10). The LMS method basically calculates smoothed developmental curves for parameters M (median), S (coefficient of variation) and L (Box-Cox power for skewness), for a common age units X-axis. Using penalized likelihood, each one of L, M and S curves can be fitted by polynomials as cubic splines by nonlinear regression. Having these three parameters in each age point, it is possible to calcu-late the number of SR laps equivalent to any percentile (9,11,12). Based on these
160 Silva et al.
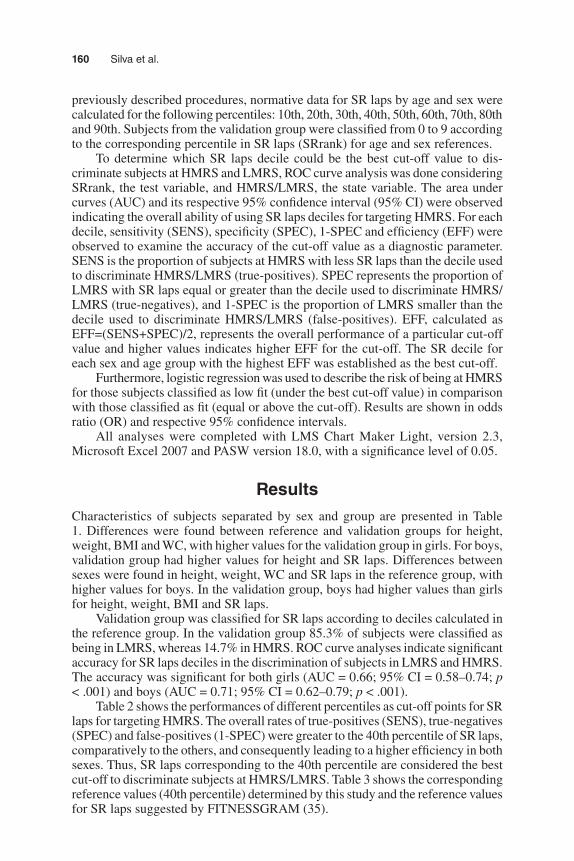
previously described procedures, normative data for SR laps by age and sex were calculated for the following percentiles: 10th, 20th, 30th, 40th, 50th, 60th, 70th, 80th and 90th. Subjects from the validation group were classified from 0 to 9 according to the corresponding percentile in SR laps (SRrank) for age and sex references.
To determine which SR laps decile could be the best cut-off value to dis-criminate subjects at HMRS and LMRS, ROC curve analysis was done considering SRrank, the test variable, and HMRS/LMRS, the state variable. The area under curves (AUC) and its respective 95% confidence interval (95% CI) were observed indicating the overall ability of using SR laps deciles for targeting HMRS. For each decile, sensitivity (SENS), specificity (SPEC), 1-SPEC and efficiency (EFF) were observed to examine the accuracy of the cut-off value as a diagnostic parameter. SENS is the proportion of subjects at HMRS with less SR laps than the decile used to discriminate HMRS/LMRS (true-positives). SPEC represents the proportion of LMRS with SR laps equal or greater than the decile used to discriminate HMRS/LMRS (true-negatives), and 1-SPEC is the proportion of LMRS smaller than the decile used to discriminate HMRS/LMRS (false-positives). EFF, calculated as EFF=(SENS+SPEC)/2, represents the overall performance of a particular cut-off value and higher values indicates higher EFF for the cut-off. The SR decile for each sex and age group with the highest EFF was established as the best cut-off.
Furthermore, logistic regression was used to describe the risk of being at HMRS for those subjects classified as low fit (under the best cut-off value) in comparison with those classified as fit (equal or above the cut-off). Results are shown in odds ratio (OR) and respective 95% confidence intervals.
All analyses were completed with LMS Chart Maker Light, version 2.3, Microsoft Excel 2007 and PASW version 18.0, with a significance level of 0.05.
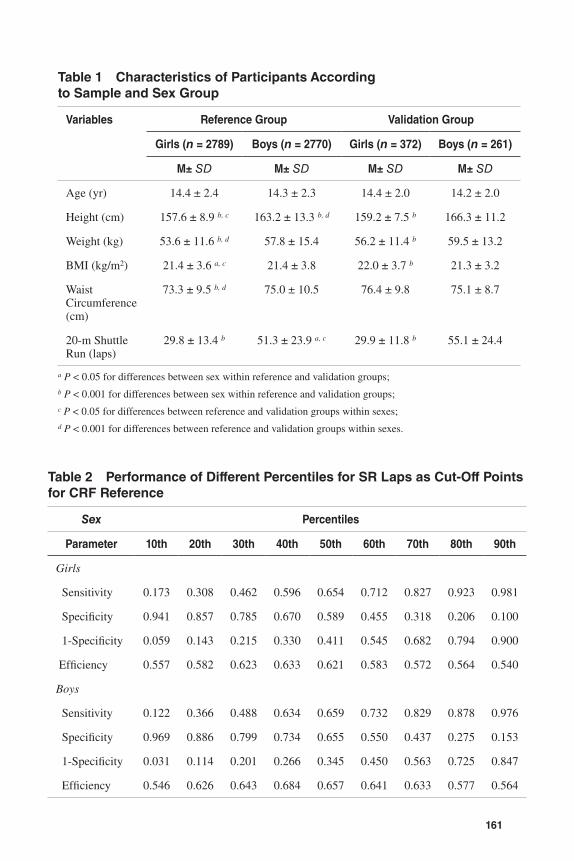
ResultsCharacteristics of subjects separated by sex and group are presented in Table 1. Differences were found between reference and validation groups for height, weight, BMI and WC, with higher values for the validation group in girls. For boys, validation group had higher values for height and SR laps. Differences between sexes were found in height, weight, WC and SR laps in the reference group, with higher values for boys. In the validation group, boys had higher values than girls for height, weight, BMI and SR laps.
Validation group was classified for SR laps according to deciles calculated in the reference group. In the validation group 85.3% of subjects were classified as being in LMRS, whereas 14.7% in HMRS. ROC curve analyses indicate significant accuracy for SR laps deciles in the discrimination of subjects in LMRS and HMRS. The accuracy was significant for both girls (AUC = 0.66; 95% CI = 0.58–0.74; p < .001) and boys (AUC = 0.71; 95% CI = 0.62–0.79; p < .001).
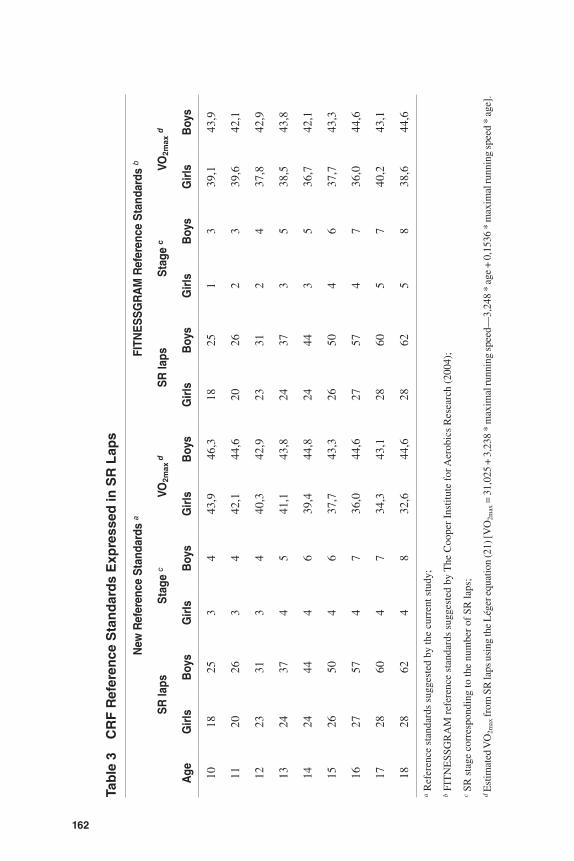
Table 2 shows the performances of different percentiles as cut-off points for SR laps for targeting HMRS. The overall rates of true-positives (SENS), true-negatives (SPEC) and false-positives (1-SPEC) were greater to the 40th percentile of SR laps, comparatively to the others, and consequently leading to a higher efficiency in both sexes. Thus, SR laps corresponding to the 40th percentile are considered the best cut-off to discriminate subjects at HMRS/LMRS. Table 3 shows the corresponding reference values (40th percentile) determined by this study and the reference values for SR laps suggested by FITNESSGRAM (35).
161
Table 1 Characteristics of Participants According to Sample and Sex Group
Variables Reference Group Validation Group
Girls (n = 2789) Boys (n = 2770) Girls (n = 372) Boys (n = 261)
M± SD M± SD M± SD M± SD
Age (yr) 14.4 ± 2.4 14.3 ± 2.3 14.4 ± 2.0 14.2 ± 2.0
Height (cm) 157.6 ± 8.9 b, c 163.2 ± 13.3 b, d 159.2 ± 7.5 b 166.3 ± 11.2
Weight (kg) 53.6 ± 11.6 b, d 57.8 ± 15.4 56.2 ± 11.4 b 59.5 ± 13.2
BMI (kg/m2) 21.4 ± 3.6 a, c 21.4 ± 3.8 22.0 ± 3.7 b 21.3 ± 3.2
Waist Circumference (cm)
73.3 ± 9.5 b, d 75.0 ± 10.5 76.4 ± 9.8 75.1 ± 8.7
20-m Shuttle Run (laps)
29.8 ± 13.4 b 51.3 ± 23.9 a, c 29.9 ± 11.8 b 55.1 ± 24.4
a P < 0.05 for differences between sex within reference and validation groups;b P < 0.001 for differences between sex within reference and validation groups;c P < 0.05 for differences between reference and validation groups within sexes;d P < 0.001 for differences between reference and validation groups within sexes.
Table 2 Performance of Different Percentiles for SR Laps as Cut-Off Points for CRF Reference
Sex Percentiles
Parameter 10th 20th 30th 40th 50th 60th 70th 80th 90th
Girls
Sensitivity 0.173 0.308 0.462 0.596 0.654 0.712 0.827 0.923 0.981
Specificity 0.941 0.857 0.785 0.670 0.589 0.455 0.318 0.206 0.100
1-Specificity 0.059 0.143 0.215 0.330 0.411 0.545 0.682 0.794 0.900
Efficiency 0.557 0.582 0.623 0.633 0.621 0.583 0.572 0.564 0.540
Boys
Sensitivity 0.122 0.366 0.488 0.634 0.659 0.732 0.829 0.878 0.976
Specificity 0.969 0.886 0.799 0.734 0.655 0.550 0.437 0.275 0.153
1-Specificity 0.031 0.114 0.201 0.266 0.345 0.450 0.563 0.725 0.847
Efficiency 0.546 0.626 0.643 0.684 0.657 0.641 0.633 0.577 0.564
162
Tab
le 3
C
RF
Ref
eren
ce S
tan
dar
ds
Exp
ress
ed in
SR
Lap
s
Age
New
Ref
eren
ce S
tand
ards
aFI
TNE
SS
GR
AM
Ref
eren
ce S
tand
ards
b
SR
laps
Sta
ge c
VO2m
ax d
SR
laps
Sta
ge c
VO2m
ax d
Girl
sB
oys
Girl
sB
oys
Girl
sB
oys
Girl
sB
oys
Girl
sB
oys
Girl
sB
oys
1018
253
443
,946
,318
251
339
,143
,9
1120
263
442
,144
,620
262
339
,642
,1
1223
313
440
,342
,923
312
437
,842
,9
1324
374
541
,143
,824
373
538
,543
,8
1424
444
639
,444
,824
443
536
,742
,1
1526
504
637
,743
,326
504
637
,743
,3
1627
574
736
,044
,627
574
736
,044
,6
1728
604
734
,343
,128
605
740
,243
,1
1828
624
832
,644
,628
625
838
,644
,6
a R
efer
ence
sta
ndar
ds s
ugge
sted
by
the
curr
ent s
tudy
;
b FI
TN
ESS
GR
AM
ref
eren
ce s
tand
ards
sug
gest
ed b
y T
he C
oope
r In
stitu
te f
or A
erob
ics
Res
earc
h (2
004)
;
c SR
sta
ge c
orre
spon
ding
to th
e nu
mbe
r of
SR
laps
;
d Est
imat
ed V
O2m
ax fr
om S
R la
ps u
sing
the
Lég
er e
quat
ion
(21)
[VO
2max
= 3
1,02
5 +
3,23
8 *
max
imal
runn
ing
spee
d—3,
248
* ag
e +
0,15
36 *
max
imal
runn
ing
spee
d *
age]
.
Shuttle Run Performance Standards in Youth 163
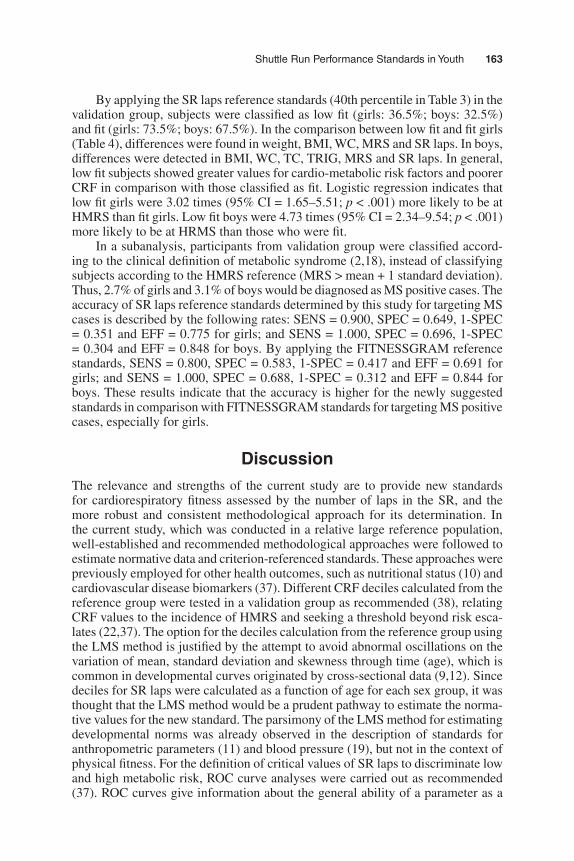
By applying the SR laps reference standards (40th percentile in Table 3) in the validation group, subjects were classified as low fit (girls: 36.5%; boys: 32.5%) and fit (girls: 73.5%; boys: 67.5%). In the comparison between low fit and fit girls (Table 4), differences were found in weight, BMI, WC, MRS and SR laps. In boys, differences were detected in BMI, WC, TC, TRIG, MRS and SR laps. In general, low fit subjects showed greater values for cardio-metabolic risk factors and poorer CRF in comparison with those classified as fit. Logistic regression indicates that low fit girls were 3.02 times (95% CI = 1.65–5.51; p < .001) more likely to be at HMRS than fit girls. Low fit boys were 4.73 times (95% CI = 2.34–9.54; p < .001) more likely to be at HRMS than those who were fit.
In a subanalysis, participants from validation group were classified accord-ing to the clinical definition of metabolic syndrome (2,18), instead of classifying subjects according to the HMRS reference (MRS > mean + 1 standard deviation). Thus, 2.7% of girls and 3.1% of boys would be diagnosed as MS positive cases. The accuracy of SR laps reference standards determined by this study for targeting MS cases is described by the following rates: SENS = 0.900, SPEC = 0.649, 1-SPEC = 0.351 and EFF = 0.775 for girls; and SENS = 1.000, SPEC = 0.696, 1-SPEC = 0.304 and EFF = 0.848 for boys. By applying the FITNESSGRAM reference standards, SENS = 0.800, SPEC = 0.583, 1-SPEC = 0.417 and EFF = 0.691 for girls; and SENS = 1.000, SPEC = 0.688, 1-SPEC = 0.312 and EFF = 0.844 for boys. These results indicate that the accuracy is higher for the newly suggested standards in comparison with FITNESSGRAM standards for targeting MS positive cases, especially for girls.
DiscussionThe relevance and strengths of the current study are to provide new standards for cardiorespiratory fitness assessed by the number of laps in the SR, and the more robust and consistent methodological approach for its determination. In the current study, which was conducted in a relative large reference population, well-established and recommended methodological approaches were followed to estimate normative data and criterion-referenced standards. These approaches were previously employed for other health outcomes, such as nutritional status (10) and cardiovascular disease biomarkers (37). Different CRF deciles calculated from the reference group were tested in a validation group as recommended (38), relating CRF values to the incidence of HMRS and seeking a threshold beyond risk esca-lates (22,37). The option for the deciles calculation from the reference group using the LMS method is justified by the attempt to avoid abnormal oscillations on the variation of mean, standard deviation and skewness through time (age), which is common in developmental curves originated by cross-sectional data (9,12). Since deciles for SR laps were calculated as a function of age for each sex group, it was thought that the LMS method would be a prudent pathway to estimate the norma-tive values for the new standard. The parsimony of the LMS method for estimating developmental norms was already observed in the description of standards for anthropometric parameters (11) and blood pressure (19), but not in the context of physical fitness. For the definition of critical values of SR laps to discriminate low and high metabolic risk, ROC curve analyses were carried out as recommended (37). ROC curves give information about the general ability of a parameter as a
164 Silva et al.
marker of health and to certify the selection of a certain value as a critical threshold by analyzing also the levels of misclassification (1,37).
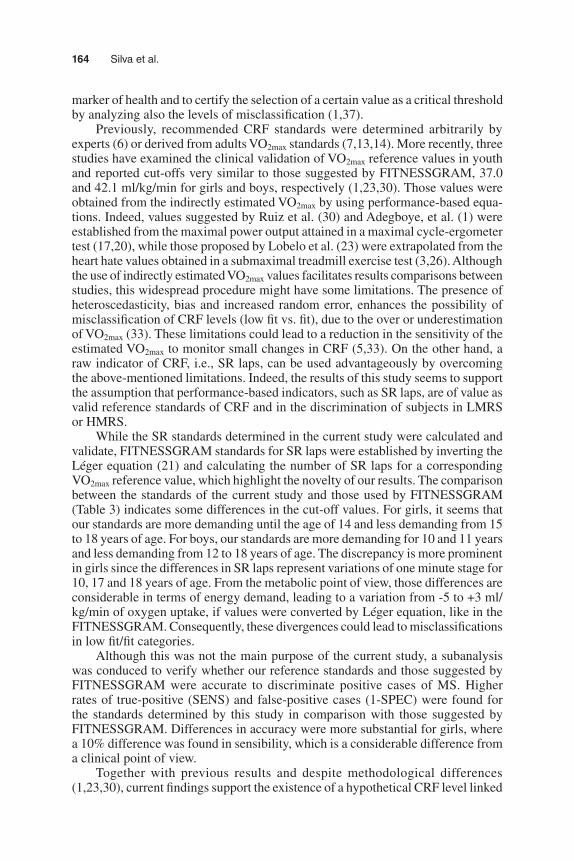
Previously, recommended CRF standards were determined arbitrarily by experts (6) or derived from adults VO2max standards (7,13,14). More recently, three studies have examined the clinical validation of VO2max reference values in youth and reported cut-offs very similar to those suggested by FITNESSGRAM, 37.0 and 42.1 ml/kg/min for girls and boys, respectively (1,23,30). Those values were obtained from the indirectly estimated VO2max by using performance-based equa-tions. Indeed, values suggested by Ruiz et al. (30) and Adegboye, et al. (1) were established from the maximal power output attained in a maximal cycle-ergometer test (17,20), while those proposed by Lobelo et al. (23) were extrapolated from the heart hate values obtained in a submaximal treadmill exercise test (3,26). Although the use of indirectly estimated VO2max values facilitates results comparisons between studies, this widespread procedure might have some limitations. The presence of heteroscedasticity, bias and increased random error, enhances the possibility of misclassification of CRF levels (low fit vs. fit), due to the over or underestimation of VO2max (33). These limitations could lead to a reduction in the sensitivity of the estimated VO2max to monitor small changes in CRF (5,33). On the other hand, a raw indicator of CRF, i.e., SR laps, can be used advantageously by overcoming the above-mentioned limitations. Indeed, the results of this study seems to support the assumption that performance-based indicators, such as SR laps, are of value as valid reference standards of CRF and in the discrimination of subjects in LMRS or HMRS.
While the SR standards determined in the current study were calculated and validate, FITNESSGRAM standards for SR laps were established by inverting the Léger equation (21) and calculating the number of SR laps for a corresponding VO2max reference value, which highlight the novelty of our results. The comparison between the standards of the current study and those used by FITNESSGRAM (Table 3) indicates some differences in the cut-off values. For girls, it seems that our standards are more demanding until the age of 14 and less demanding from 15 to 18 years of age. For boys, our standards are more demanding for 10 and 11 years and less demanding from 12 to 18 years of age. The discrepancy is more prominent in girls since the differences in SR laps represent variations of one minute stage for 10, 17 and 18 years of age. From the metabolic point of view, those differences are considerable in terms of energy demand, leading to a variation from -5 to +3 ml/kg/min of oxygen uptake, if values were converted by Léger equation, like in the FITNESSGRAM. Consequently, these divergences could lead to misclassifications in low fit/fit categories.
Although this was not the main purpose of the current study, a subanalysis was conduced to verify whether our reference standards and those suggested by FITNESSGRAM were accurate to discriminate positive cases of MS. Higher rates of true-positive (SENS) and false-positive cases (1-SPEC) were found for the standards determined by this study in comparison with those suggested by FITNESSGRAM. Differences in accuracy were more substantial for girls, where a 10% difference was found in sensibility, which is a considerable difference from a clinical point of view.
Together with previous results and despite methodological differences (1,23,30), current findings support the existence of a hypothetical CRF level linked
Shuttle Run Performance Standards in Youth 165
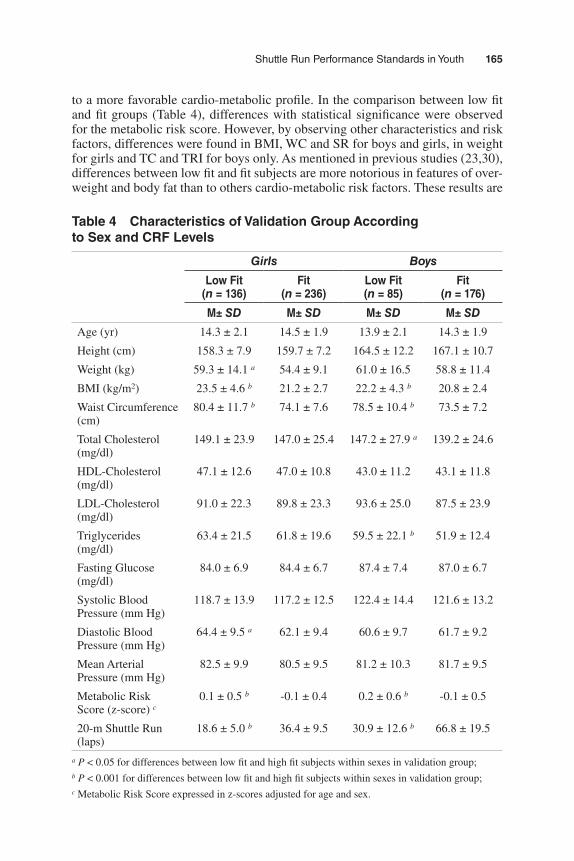
to a more favorable cardio-metabolic profile. In the comparison between low fit and fit groups (Table 4), differences with statistical significance were observed for the metabolic risk score. However, by observing other characteristics and risk factors, differences were found in BMI, WC and SR for boys and girls, in weight for girls and TC and TRI for boys only. As mentioned in previous studies (23,30), differences between low fit and fit subjects are more notorious in features of over-weight and body fat than to others cardio-metabolic risk factors. These results are
Table 4 Characteristics of Validation Group According to Sex and CRF Levels
Girls Boys
Low Fit (n = 136)
Fit (n = 236)
Low Fit (n = 85)
Fit (n = 176)
M± SD M± SD M± SD M± SD
Age (yr) 14.3 ± 2.1 14.5 ± 1.9 13.9 ± 2.1 14.3 ± 1.9
Height (cm) 158.3 ± 7.9 159.7 ± 7.2 164.5 ± 12.2 167.1 ± 10.7
Weight (kg) 59.3 ± 14.1 a 54.4 ± 9.1 61.0 ± 16.5 58.8 ± 11.4
BMI (kg/m2) 23.5 ± 4.6 b 21.2 ± 2.7 22.2 ± 4.3 b 20.8 ± 2.4
Waist Circumference (cm)
80.4 ± 11.7 b 74.1 ± 7.6 78.5 ± 10.4 b 73.5 ± 7.2
Total Cholesterol (mg/dl)
149.1 ± 23.9 147.0 ± 25.4 147.2 ± 27.9 a 139.2 ± 24.6
HDL-Cholesterol (mg/dl)
47.1 ± 12.6 47.0 ± 10.8 43.0 ± 11.2 43.1 ± 11.8
LDL-Cholesterol (mg/dl)
91.0 ± 22.3 89.8 ± 23.3 93.6 ± 25.0 87.5 ± 23.9
Triglycerides (mg/dl)
63.4 ± 21.5 61.8 ± 19.6 59.5 ± 22.1 b 51.9 ± 12.4
Fasting Glucose (mg/dl)
84.0 ± 6.9 84.4 ± 6.7 87.4 ± 7.4 87.0 ± 6.7
Systolic Blood Pressure (mm Hg)
118.7 ± 13.9 117.2 ± 12.5 122.4 ± 14.4 121.6 ± 13.2
Diastolic Blood Pressure (mm Hg)
64.4 ± 9.5 a 62.1 ± 9.4 60.6 ± 9.7 61.7 ± 9.2
Mean Arterial Pressure (mm Hg)
82.5 ± 9.9 80.5 ± 9.5 81.2 ± 10.3 81.7 ± 9.5
Metabolic Risk Score (z-score) c
0.1 ± 0.5 b -0.1 ± 0.4 0.2 ± 0.6 b -0.1 ± 0.5
20-m Shuttle Run (laps)
18.6 ± 5.0 b 36.4 ± 9.5 30.9 ± 12.6 b 66.8 ± 19.5
a P < 0.05 for differences between low fit and high fit subjects within sexes in validation group;b P < 0.001 for differences between low fit and high fit subjects within sexes in validation group;c Metabolic Risk Score expressed in z-scores adjusted for age and sex.
166 Silva et al.
in agreement with previous findings showing that WC is the strongest marker of metabolic syndrome (25).
The prevalence of low fit students (35%) in the validation group is preoc-cupying, and similar to those found in other populations (23,30). In addition, low CRF levels are associated with increased risk for HMRS (23,30). Therefore, there is enough evidence to promote intervention programs to improve physical activity levels to enhance CRF and metabolic profiles. Although CRF variation is broadly explained by genetic factors (40), there is a theoretical framework with substantial evidence pointing that physical activity and regular exercise also play an important role in the regulation of CRF levels (16,32), features of metabolic syndrome (8) and obesity (16).
The findings from the current study should be considered together with some limitations. The sample of participants was selected by convenience and the distri-butions on reference and validation groups were determined by students/parents’ acceptance for blood analysis, which is crucial for the description of cardio-metabolic risk factors. Moreover, these findings just offer a valid indication of the current metabolic condition, being impossible to confirm future development of metabolic syndrome or cardiovascular diseases.
In terms of public health, schools have a crucial position in health surveillance policies. It guarantees the access to a majority of children and adolescents and con-figures a powerful setting for primary prevention for several diseases. Concerning the cardiovascular health, the procedures to access some risk factors are invasive and not suitable for screening subjects at risk among large populations. However, performance in the 20-m shuttle run test seems to be a valid tool for targeting chil-dren and adolescents at risk for obesity and metabolic syndrome. Current findings encourage the assessment of physical fitness in schools as a key component for health monitoring systems. Physical fitness field tests like the 20-m shuttle run are suitable for school environments. It allows evaluating a large number of subjects with little equipment and reduced costs in an optimized time. In addition, schools can provide opportunities to improve healthier behaviors like physical activity and adequate diet, so that obesity and cardiovascular health could be controlled.
Conclusion
The new criterion-referenced standards for SR laps are valid and seem to discrimi-nate children and adolescents with high metabolic risk from those with healthier cardio-metabolic profiles. In addition, this study supports the clinical significance of having a high CRF from early ages. In practice, the SR together with the new reference standards constitute valid tools for monitoring cardiovascular health in youths and for targeting groups for future intervention.
Acknowledgments
The Foundation of Science and Technology (FCT) supported GS with the PhD grant refer-ence SFRH/BD/45090/2008. The study was also supported by FCT with the research project reference PTDC/DES/72424/2006. Authors declare no conflict of interest.
Shuttle Run Performance Standards in Youth 167
References 1. Adegboye, A.R., S.A. Anderssen, K. Froberg, et al. Recommended aerobic fitness level
for metabolic health in children and adolescents: a study of diagnostic accuracy. Br. J. Sports Med. 45:722–728, 2010.
2. Alberti, K.G., P. Zimmet, and J. Shaw. Metabolic syndrome - a new world-wide defini-tion. A Consensus Statement from the International Diabetes Federation. Diabet. Med. 23:469–480, 2006.
3. American College of Sports Medicine. ACSM’s Guidelines for Exercise Testing and Prescription, 7th ed. Philadelphia, PA: Lippincott Williams & Wilkins, 2005.
4. Andersen, L.B., L. Sardinha, K. Froberg, C.J. Riddoch, A.S. Page, and S.A. Anderssen. Fitness, fatness and clustering of cardiovascular risk factors in children from Denmark, Estonia and Portugal: The European Youth Heart Study. Int. J. Pediatr. Obes. 3:58–66, 2008.
5. Atkinson, G., and A.M. Nevill. Statistical methods for assessing measurement error (reliability) in variables relevant to sports medicine. Sports Med. 26:217–238, 1998.
6. Bell, R.D., M. Macek, J. Rutenfranz, and W.H.M. Saris. Health indicators and risk factors of cardiovascular diseases during childhood and adolescence. In: Children and Exercise XII, J. Rutenfranz, R. Mocellin, and F. Klimt (Eds.). Champaign, Illinois: Human Kinetics, 1986, pp. 19–27.
7. Blair, S.N., H.W. Kohl, 3rd, R.S. Paffenbarger, Jr., D.G. Clark, K.H. Cooper, and L.W. Gibbons. Physical fitness and all-cause mortality. A prospective study of healthy men and women. JAMA. 262:2395–2401, 1989.
8. Brage, S., N. Wedderkopp, U. Ekelund, et al. Features of the metabolic syndrome are associated with objectively measured physical activity and fitness in Danish children: The European Youth Heart Study (EYHS). Diabetes Care. 27:2141–2148, 2004.
9. Cole, T.J. The LMS method for constructing normalized growth standards. Eur. J. Clin. Nutr. 44:45–60, 1990.
10. Cole, T.J., M.C. Bellizzi, K.M. Flegal, and W.H. Dietz. Establishing a standard definition for child overweight and obesity worldwide: international survey. BMJ. 320:1240–1243, 2000.
11. Cole, T.J., J.V. Freeman, and M.A. Preece. British 1990 growth reference centiles for weight, height, body mass index and head circumference fitted by maximum penalized likelihood. Stat. Med. 17:407–429, 1998.
12. Cole, T.J., and P.J. Green. Smoothing reference centile curves: The LMS method and penalized likelihood. Stat. Med. 11:1305–1319, 1992.
13. Cureton, K.J., and S.A. Plowman. Aerobic capacity assessments. In: FITNESSGRAM Reference Guide, 3rd ed., G.J. Welk and M.D. Meredith (Eds.). Dallas, TX: The Cooper Institute, 2008, pp. 96–120.
14. Cureton, K.J., and G.L. Warren. Criterion-referenced standards for youth health-related fitness tests: a tutorial. Res. Q. Exerc. Sport. 61:7–19, 1990.
15. Friedewald, T., R.I. Levy, and D.S. Frederickson. Estimation of the concentration of low-density lipoprotein cholesterol in plasma, without use of the preparative ultracen-trifuge. Clin. Chem. 18:499–502, 1972.
16. Gutin, B., P. Barbeau, S. Owens, et al. Effects of exercise intensity on cardiovascular fitness, total body composition, and visceral adiposity of obese adolescents. Am. J. Clin. Nutr. 75:818–826, 2002.
17. Hansen, H.S., K. Froberg, J.R. Nielsen, and N. Hyldebrandt. A new approach to assess-ing maximal aerobic power in children: The Odense School Child Study. Eur. J. Appl. Physiol. 58:618–624, 1989.
18. IDF. The IDF consensus definition of the metabolic syndrome in children and adoles-cents. International Diabetes Federation Communications, 2007.
168 Silva et al.
19. Jackson, L.V., N.K. Thalange, and T.J. Cole. Blood pressure centiles for Great Britain. Arch. Dis. Child. 92:298–303, 2007.
20. Kolle, E., J. Steene-Johannessen, L.B. Andersen, and S.A. Anderssen. Objectively assessed physical activity and aerobic fitness in a population-based sample of Norwegian 9- and 15-year-olds. Scand J Med Sci Sports. 20:e41–e47, 2010.
21. Léger, L.A., D. Mercier, C. Gadoury, and J. Lambert. The multistage 20 metre shuttle run test for aerobic fitness. J Sports Sci. 6:93–101, 1988.
22. Lewington, S., R. Clarke, N. Qizilbash, R. Peto, and R. Collins. Age-specific relevance of usual blood pressure to vascular mortality: a meta-analysis of individual data for one million adults in 61 prospective studies. Lancet. 360:1903–1913, 2002.
23. Lobelo, F., R.R. Pate, M. Dowda, A.D. Liese, and J.R. Ruiz. Validity of cardiorespi-ratory fitness criterion-referenced standards for adolescents. Med. Sci. Sports Exerc. 41:1222–1229, 2009.
24. Lohman, T.G., A.F. Roche, and R. Martorell. Anthropometric Standardization Reference Manual. Champaign, IL: Human Kinetics, 1988.
25. Moreno, L.A., I. Pineda, G. Rodriguez, J. Fleta, A. Sarria, and M. Bueno. Waist cir-cumference for the screening of the metabolic syndrome in children. Acta Paediatr. 91:1307–1312, 2002.
26. Pate, R.R., C.Y. Wang, M. Dowda, S.W. Farrell, and J.R. O’Neill. Cardiorespiratory fitness levels among US youth 12 to 19 years of age: findings from the 1999-2002 National Health and Nutrition Examination Survey. Arch. Pediatr. Adolesc. Med. 160:1005–1012, 2006.
27. Reed, K.E., D.E.R. Warburton, R.Z. Lewanczuk, et al. Arterial compliance in young children: The role of aerobic fitness. Eur. J. Cardiovasc. Prev. Rehabil. 12:492–497, 2005.
28. Ruiz, J.R., F.B. Ortega, D. Meusel, M. Harro, P. Oja, and M. Sjöström. Cardiorespira-tory fitness is associated with features of metabolic risk factors in children. Should cardiorespiratory fitness be assessed in a European health monitoring system? The European Youth Heart Study. J Public Health. 14:94–102, 2006.
29. Ruiz, J.R., F.B. Ortega, D. Meusel, and M. Sjöström. Traditional and novel cardiovas-cular risk factors in school-aged children: A call for the further development of public health strategies with emphasis on fitness. J Public Health. 15:171–177, 2007.
30. Ruiz, J.R., F.B. Ortega, N.S. Rizzo, et al. High cardiovascular fitness is associated with low metabolic risk score in children: The European Youth Heart Study. Pediatr. Res. 61:350–355, 2007.
31. Ruiz, J.R., J. Ramirez-Lechuga, F. Ortega, et al. Artificial neural network-based equa-tion for estimating VO2max from the 20 m shuttle run test in adolescents. Artif. Intell. Med. 44:233–245, 2008.
32. Ruiz, J.R., N.S. Rizzo, A. Hürtig-Wennlöf, F.B. Ortega, J. Warnberg, and M. Sjöström. Relations of total physical activity and intensity to fitness and fatness in children: The European Youth Heart Study. Am. J. Clin. Nutr. 84:299–303, 2006.
33. Ruiz, J.R., G. Silva, N. Oliveira, J. Ribeiro, J. Oliveira, and J. Mota. Criterion-related validity of the 20-m shuttle run test in youths aged 13-19 years. J Sports Sci. 27:899–906, 2009.
34. Taylor, H.L., E. Buskirk, and A. Henschel. Maximal oxygen intake as an objective measure of cardiorespiratory performance. J. Appl. Physiol. 8:73–80, 1955.
35. The Cooper Institute for Aerobics Research. FITNESSGRAM test administration manual, 3rd ed. Champaign, Illinois: Human Kinetics, 2004.
36. The Third National Health and Nutrition Examination Survey. The Third National Health and Nutrition Examination Survey (NHANES III 1988-94) Reference Manuals and Reports. 1996.
37. Vasan, R.S. Biomarkers of cardiovascular disease: molecular basis and practical con-siderations. Circulation. 113:2335–2362, 2006.

Shuttle Run Performance Standards in Youth 169
38. Wade, A. Derivation versus validation. Arch. Dis. Child. 83:459–460, 2000. 39. Wei, M., L.W. Gibbons, J.B. Kampert, M.Z. Nichaman, and S.N. Blair. Low cardiore-
spiratory fitness and physical inactivity as predictors of mortality in men with type 2 diabetes. Ann. Intern. Med. 132:605–611, 2000.
40. Wolfarth, B., M.S. Bray, J.M. Hagberg, et al. The human gene map for performance and health-related fitness phenotypes: the 2004 update. Med. Sci. Sports Exerc. 37:881–903, 2005.