A review of evaporative cooling system concepts for engine ...
Available online at www.sciencedirect.com
Building and Environment 39 (2004) 661–676www.elsevier.com/locate/buildenv
Building bioclimatic charts for non-domestic buildings andpassive downdraught evaporative cooling
K.J. Lomas∗, D. Fiala, M.J. Cook, P.C. CropperInstitute of Energy and Sustainable Development, De Montfort University, Queens Building, The Gateway, Leicester LE1 9BH, UK
Received 21 November 2003; received in revised form 26 November 2003; accepted 4 December 2003
Abstract
The building bioclimatic charts of Givoni are used to test whether passive downdraught evaporative cooling, in conjunction with nightventilation, might yield thermal comfort in an o6ce building in Southern Europe. Dynamic thermal simulation indicated that the directevaporative cooling boundary, proposed by Givoni, was an unreliable indicator of the climatic conditions for which comfort could beprovided. New boundaries, de8ning the climatic limit of thermal comfort for direct evaporative cooling in o6ces, with di9ering levels ofinternal heat gain, are proposed. For each one, a band of climatic conditions, within which comfort is sometimes achieved and sometimesnot, is also indicated.? 2004 Elsevier Ltd. All rights reserved.
Keywords: Building bioclimatic charts; Non-domestic buildings; Evaporative cooling; Night ventilation
1. Introduction
Direct evaporative cooling entails the evaporation of wa-ter in warm dry ambient air at a high level within, or on theedge of, a building. The evaporation process lowers the airtemperature and raises its moisture content whilst maintain-ing a constant wet-bulb temperature (WBT). The air mightbe cooled by spraying water directly into an ambient airstream, as in the ‘shower tower’ reported by Givoni [1,2]and the cooling towers at the ’92 EXPO in Seville, Spain[3] or by drawing it across wet pads, as in the experimentsof Cunningham and Thompson [4]. The approach is attrac-tive because, compared to air-conditioning, the installationsare cheap, consume very little energy and produce no wasteproducts.A more re8ned strategy is to inject droplets of water, a few
microns in diameter, into a stream of ambient air. Becausethe drops are small they evaporate more easily reducing therisk of water accumulation below the point of injection, as inthe ‘shower tower’. Micronisers are commercially availableand use compressed air to drive water out of the 8ne nozzles.By switching the compressed air on and o9 the rate of droplet
∗ Corresponding author. Tel.: +44-116-257-7961;fax: +44-116-257-7977.
E-mail address: [email protected] (K.J. Lomas).
injection and thus the air temperatures can be controlled.The technology is used successfully in the textile, paper andother industries, where humidity control is required. Thiscontrollability would seem to make the technique suitablefor evaporative cooling in non-domestic buildings in hot drydeveloped countries where there is a ready supply of cleanwater.The potential of this technique, called passive down-
draught evaporative cooling (PDEC), was explored in athree-year multi-national EU project [5]. In the project,architects produced conceptual designs for o6ce buildingscooled by PDEC and the energy demands and internal com-fort conditions were assessed using a variety of manual andcomputer-based methods.Building bioclimatic charts (BBCCs) o9ered a way of
rapidly testing whether or not PDEC was likely to pro-duce comfortable conditions in the o6ces. The charts alsoenabled the likely performance of alternative passive con-trol strategies, such as night-time ventilation cooling, to beassessed.The best-known work on BBCCs is, perhaps, that under-
taken by Givoni [1,2]. His charts are readily understand-able as they are laid out on the standard psychometric chart,which is familiar to building professionals throughout theworld. This approach preserves all the psychrometric re-lationships encapsulated in the chart, which is central to
0360-1323/$ - see front matter ? 2004 Elsevier Ltd. All rights reserved.doi:10.1016/j.buildenv.2003.12.011

662 K.J. Lomas et al. / Building and Environment 39 (2004) 661–676
an understanding of PDEC cooling. The earlier charts ofOlgyay [6] plotted dry-bulb temperature (DBT) against rel-ative humidity using cartesian co-ordinates thereby losingor obscuring key temperature/moisture relationships. Fur-ther, as Givoni [1] has argued, the charts are unlikely to bereliable for thermally heavyweight buildings.Givoni’s BBCCs were developed from practical research
in Europe, the USA and Israel, using experimental buildingsof residential scale with low internal heat gains. They havetwo key components: envelopes which de8ne the tempera-ture and humidity within which occupants will be comfort-able and ‘boundaries of climatic conditions within whichvarious building design strategies and natural cooling sys-tems can provide comfort’ [2].Typically, o6ce buildings have a deeper plan, higher
areas of perimeter glazing, and less thermal mass, than do-mestic buildings. In this paper, the likely internal com-fort conditions in an o6ce, as determined using the GivoniBBCC for developed countries, are compared with the con-ditions predicted by a detailed thermal model. The di9er-ences are discussed and a strategy for producing BBCCs fordi9erent classes of non-domestic buildings and for repre-senting the climatic boundaries is proposed.
2. Passive downdraught evaporative cooling
This paper focuses on the conceptual design of the PDECsystem for a multi-storey o6ce building to be located in themiddle of Seville in Southern Spain. In Seville the summeris hot with little rain. ASHRAE [7] quotes the DBT that isexceeded for only 1% of the time as 38◦C and the corre-sponding mean WBT as 22:2◦C. The diurnal air temperatureswings can be as much as 22◦C, e.g. 38◦C maximum and16◦Cminimum in July (Fig. 1). There are 1457 h in the yearwhen the ambient temperature exceeds 25◦C and 1261 hover 27◦C. Assuming 200 week days of work for 12 h/day,this equate to around 43% of working hours over 25◦C and38% of working hours over 27◦C. By way of context, 5%of working hours with internal temperatures over 25◦C or1% of working hours over 28◦C are reasonable limits forthermal comfort in naturally ventilated buildings [8].The WBT is, however, generally less than 22◦C (e.g.
Fig. 1) and so an evaporative cooling system that cools theair to a relative humidity of, say, 70% would yield air ata DBT of around 26◦C. By delivering a su6cient qualityof such air into the occupied spaces, thermal comfort couldbe achieved. The high diurnal temperature variation sug-gests that there may be bene8ts in combining PDEC withnight-time ventilation, especially in thermally heavyweightbuildings.In a multi-storey o6ce building, in a developed country,
a PDEC system must be carefully controlled in order to: en-sure that there is a Oow of cool air to every space and to everyOoor of the building; enable contemporary standards of in-door climate quality to be met—i.e., no draughts and exces-
0
5
10
15
20
25
30
35
40
Tem
per
atur
e °C
Wet-bulb temperatureDry-bulb temperature
July 5th July 6th July 7th July 8th July 9th July 10th
Fig. 1. Illustrative DBT and WBT for a six day period in July in Seville.
sive temperature variations either in time, across a space orfrom head to foot; avoid the risk of surface condensation andmould growth (which is associated with continuous periodswith relative humidity over 80% [7]); avoid water dropletsentering occupied zones; permit reliable operation under allweather conditions (especially for all wind speeds and di-rections); make sure that indoor air quality is maintainedthrough all seasons, especially in spring and autumn whenPDEC may not be necessary (i.e., when ‘conventional’ pas-sive cooling, either by day-time ventilation or night coolingof thermal mass, could ensure comfort); permit other provenenergy saving strategies such as solar shading, daylightingand e6cient arti8cial lighting and space heating to be incor-porated. Some occupant control of the internal environmentis also desirable but this should not be complex or onerous.The building should permit Oexible internal space planningand more general architectural concerns must be resolved(such as overall building cost, net-to-gross Ooor area, andaesthetic acceptability).In the early stages of the EU PDEC project, a concept
for the Seville o6ce that could meet the above criteria wasdeveloped (Fig. 2). This hinged around injecting water at thehead of an atrium space, which can also provide daylight tothe core of the building and fresh air in the non-PDECmode.The droplets evaporate and the cooled dense air descendsinto the capture zone, building up a reservoir of cool air. Byvarying the volume Oow of water from the micronisers thetemperature of the air in the capture zone can be controlled.The micronisers are sited well above the top Ooor to becooled so that, ideally, the droplets have fully evaporatedbefore they enter the reservoir of moist air. The openings atthe head of the atrium enable fresh ambient air to enter thebuilding.This cooled air can be ‘drained o9’ by controlling the
opening sizes between the capture zone and the occupiedareas using a building energy management system thatsenses the space temperatures. The dense air 8lling theoccupied spaces displaces warm air (heated by occupants,

K.J. Lomas et al. / Building and Environment 39 (2004) 661–676 663
Fig. 2. Concept for a PDEC Building.
Fig. 3. Schematic of a passive control sequence during a hot summer day.

664 K.J. Lomas et al. / Building and Environment 39 (2004) 661–676
equipment and lights) upwards towards the ceiling and outof the high level vents into the exhaust shaft. To preservethe design concept, of air being driven through the buildingunder the static head created by the cool air reservoir, the airinlets and outlets are protected from adverse wind e9ects.The low level openings from the atrium to the occupied
spaces, and the high-level outlets from these spaces to theexhaust shaft should, in principle, enable night ventilationOows from the atrium and out of the head of the shaft (ex-hausted air being warmer and more buoyant than ambient airat night). Exposed, thermally massive, ceilings make nightventilation e9ective. However, control of airOow rates andthe pre-warming of the fresh air (necessary in a Seville win-ter) is easier if the Oow paths used for PDEC and night vent-ing are also used on cool days. To conserve water it wouldseem logical to cool the thermal mass using night ventila-tion and only switch on the PDEC system when the internaldaytime temperatures climb above the threshold of thermalcomfort (Fig. 3).On very hot summer days, when night ventilation fol-
lowed by PDEC may not deliver comfortable conditions, itis also possible, in theory, to mechanically cool the o6ces,e.g. by cassette type ceiling units or fan coil units, or indeedby 8lling the reservoir with air which is cooled by mechan-ical means. In a mechanical cooling mode, occupied zoneswould receive the minimum airOow to meet fresh air re-quirements and acceptable temperatures. However, the eco-nomics of a building with both PDEC and mechanical cool-ing would require careful scrutiny.
3. Building bioclimatic charts
Having devolved a concept for the building, the GivoniBBCCs were used to test whether it might deliver summer-time thermal comfortable under the Seville climatic condi-tions. The BBCCs incorporate envelopes, which de8ne thetemperature and humidity within which building occupantswill be comfortable and boundaries which de8ne the (ambi-ent) climatic conditions for which comfort can be achieved.In this paper the charts relating to developed countries withboundary conditions for night ventilation and direct evapo-rative cooling are of primary interest.On the basis of personal research and the work of oth-
ers, especially Humphreys [9], Givoni [1] argued that theASHRAE comfort envelopes [10], intended for use in con-ditioned buildings, were inappropriate for use in conjunc-tion with passive buildings in hotter climates. This line ofargument has gained credibility in recent years as a resultof the work of Nicol [11], de Dear [12] and, in particular,de Dear and Brager [13], and is supported by the adaptivetheory of thermal comfort. Adaptive theory acknowledges,as Givoni asserts, that individuals living in hotter countriesare more comfortable at higher temperatures than those liv-ing in a temperate climate and that building occupants willtolerate deviations from established norms for thermal com-
fort provided they are o9ered adaptive opportunities (e.g.opening windows to increase ventilation rates, ceiling fansto increase air speeds, adjustable window blinds to createshade, cooler areas to which they can move, and freedomto adjust their levels of clothing). The Givoni BBCCs o9erthermal comfort envelopes for two conditions: ‘still air’ (as-sumed to be less than 0:25 m=s), which lies between 20◦C(winter) and 27◦C (summer) and for ‘a very light breeze’(of 2:0 m=s), which extends the envelope to 30◦C, Givonicites Tanabe [14], Mclntyre [15] and Wu [16] as justi8ca-tion for this value. The upper (summer time) temperaturelimits decrease above 50% relative humidity (rh) and upperbounds are placed on rh of 80% for still air and 90% for avery light breeze.The comfort envelope for low air speeds (and developed
countries) is appropriate for the PDEC building (Fig. 4).Manual calculations indicate that the mean speed of the airtraversing the o6ces from the core to the perimeter will bewell below the so-called ‘still air speed’ even at very highvolume Oows of cooled air. Ceiling fans or other mechanicaldevices could increase speeds locally but at desktop levelthese would need to be below about 0:8 m=s to avoid paperblowing around. Ceiling fans would disrupt the displacementventilation strategy, which is central to the proposed PDECstrategy (Fig. 2).The boundary line, which de8nes the climatic conditions
below which night ventilation cooling can yield internalcomfort (Fig. 4), was developed by Givoni, primarily from8eldwork conducted in Israel. This work provided an em-pirically based formula by which the maximum, minimumand mean DBT in a sealed, well insulated, thermally mas-sive and solar shaded building can be calculated based onthe ambient daily maximum, and minimum temperature andthe average of these. Based on this work, plus data from8eld studies conducted near San Diego, California, Givoniproposed a boundary de8ning ‘the outdoor maximum tem-perature below which indoor comfort can be maintained ina well designed building [as] a function of vapour pressure’(Fig. 4)—comfort envelope. The dependence on vapourpressure (moisture content of the air) recognises that the di-urnal temperature swing diminishes as humidity levels rise.Although of less importance to this paper, the boundarywithin which daytime ventilation can yield thermal comfortis also shown in Fig. 4.Finally, Givoni’s BBCCs provide climatic boundaries for
buildings with direct evaporative cooling. In such buildings,Givoni argues, the internal conditions are determined al-most entirely by the state of the air delivered by the coolingsystem (i.e. thermal mass, night cooling and hence surfacetemperatures are of little consequence). Based primarily onthe 8eldwork of Cunningham and Thompson [4], Givoniobserves that ambient air can be cooled by 70–80% of theWBT depression (i.e. 70–80% of the di9erence between theambient DBT and WBT). This observation led him to anupper climatic boundary lying along the 22◦C WBT line upto a maximum of 42◦C DBT (Fig. 4). Givoni notes ‘as the

K.J. Lomas et al. / Building and Environment 39 (2004) 661–676 665
-10 0 10 20 30 40 50 600.000
0.002
0.004
0.006
0.008
0.010
0.012
0.014
0.016
0.018
0.020
0.022
0.024
0.026
0.028
0.030
Moi
stur
e C
onte
nt k
g/kg
(dr
y ai
r)
100% 50%
10%
-5
0
5
10
15
20
25
30
Wet
-Bul
b Te
mpe
ratu
re ° C (S
ling)
Night ventilation
Direct evaporativecooling boundary
cooling boundary
Daytime ventilationboundary
Comfort EnvelopeWintertime extensionto comfort envelope
Comfort zoneWinter extension to comfort zoneDaytime ventilation boundary
Direct evaporative cooling boundary
Night ventilation cooling boundary
Dry-bulb Temperature (°C)
Fig. 4. Building bio-climatic chart for developed countries, after Givoni, 1992 [2].
response of the indoor temperature to changes in the out-door conditions in a building cooled by direct evaporativecooling is almost instantaneous, the hourly outdoor temper-ature and WBT are the relevant ‘driving forces’ in evaluat-ing the applicability of this cooling system’. In other words,it is appropriate to plot hourly ambient temperatures on thepsychrometric chart to establish whether comfort can beachieved, which is in contrast to Giovani’s proposal that themaximum daily ambient temperature be used in associationwith the night venting envelope.
4. Using BBCC
Whilst BBCCs are conceptually simple, and appear too9er an easy route to assessing which passive environmentalcontrol strategy might be applicable, in practice, a numberof practical di6culties are encountered when trying to usethem rigorously.To assess the potential for direct evaporative cooling,
hourly values of ambient DBT and some measure of mois-ture content (WBT, relative humidity, moisture content,vapour pressure or saturation temperature) must be ob-tained. Then, data appropriate to the occupied period only,which in non-domestic buildings might exclude a mid-daybreak, siesta period or summer recess, must be 8ltered out.Finally, the data points must be plotted on a psychrometricchart and the comfort envelopes and climatic boundariesoverlaid.For evaluating the bene8ts of night ventilation, it is
the daily peak temperatures that must be plotted ignoring,
presumably, whether or not this occurs during a mid-daybreak or siesta period (the peak is merely a marker forcomparison against the night ventilation boundary). Thislevel of analysis is likely to deter most architects fromundertaking a rapid, early design stage, assessment. Thus,manual plotting of a few points, using (extreme climatic)data taken from standard design guides (e.g. ASHRAEor CIBSE) is more likely to be the chosen approach. Amore rigorous approach does however o9er additionalinsights.By way of illustration, the peak daytime temperatures for
the period June–September for Seville are plotted on theGivoni BBCC (Fig. 5). The number of data points withinthe day and night venting boundaries is also given. Thisindicates that thermal comfort will not be obtained on 60%of days in Seville, in buildings cooled by night ventilationonly (73 of the 122 data points lie outside the night ventingboundary). Plotting the hourly values for the working period(08.00 to 20.00) for these 73 ‘hot days’, yielded 308 h insideeither the daytime ventilation boundary or comfort envelope(Fig. 6): i.e., 35% of the hours if there is no siesta period, or42% of the hours if the building is unoccupied from 14.00to 16.00 (none of the 308 h lie in this hot period of theday). This suggests that even on the hot days (i.e. whenthe peak temperature is outside the night venting envelope),35% of the occupied hours, probably mostly in the earlymorning, will in fact be comfortable. This sort of analysismay, however, be stretching the chart beyond its intendeddomain of validity.To assess PDEC, the hourly values for June–September
are plotted along with the direct evaporative cooling

666 K.J. Lomas et al. / Building and Environment 39 (2004) 661–676
-10 0 10 20 30 40 50 600.000
0.002
0.004
0.006
0.008
0.010
0.012
0.014
0.016
0.018
0.020
0.022
0.024
0.026
0.028
0.030
Moi
stur
e C
onte
nt k
g/kg
(dr
y ai
r)
100% 50%
10%
-5
0
5
10
15
20
25
30
Wet
-Bul
b Te
mpe
ratu
re °C
(Slin
g)
73
3316
Comfort zoneConditions outside NV boundary
Daytime ventilation (DV) boundary
Conditions inside NV boundary
Night ventilation (NV) boundary
Conditions inside DV boundary
Dry-bulb Temperature (°C)
Fig. 5. Peak daily ambient DBT and corresponding WBT from June to September for Seville.
-10.0 0.0 10.0 20.0 30.0 40.0 50.0 60.00.000
0.002
0.004
0.006
0.008
0.010
0.012
0.014
0.016
0.018
0.020
0.022
0.024
0.026
0.028
0.030
Moi
stur
e C
onte
nt K
g/K
g (d
ry a
ir)
100% 50%
10%
-5
0
5
10
15
20
25
30
Wet
-Bul
b Te
mpe
ratu
re °C (S
ling)
429
133
6
308
Comfort zoneConditions outside NV boundary
Daytime ventilation (DV) boundary
Conditions inside NV boundary
Night ventilation (NV) boundary
Conditions inside DV boundary
Cool and humid conditions
Dry-bulb Temperature (°C)
Fig. 6. Hourly ambient conditions during working hours (08.00–20.00) on 73 hot days between June and September for Seville.
boundary. Of the 1464 values between 08.00 and 20.00,28% (i.e. 413 h) lie outside the boundary, however, the8gure falls to 24% (296 h) if the building is unoccupiedfrom 14.00 to 16.00 (Fig. 7). This analysis suggests thatPDEC would be e9ective at maintaining thermal comfortfor most of the summertime working hours (i.e. 72–76%),
but that mechanical cooling assistance may be necessary inextreme (hot and humid) conditions.Ambient conditions occasionally lie to the left and above
the comfort envelope (Figs. 6 and 7), which suggests thatheating will be needed. In practice, however, internal heatgains, together with control over the amount and duration of

K.J. Lomas et al. / Building and Environment 39 (2004) 661–676 667
-10 0 10 20 30 40 50 600.000
0.002
0.004
0.006
0.008
0.010
0.012
0.014
0.016
0.018
0.020
0.022
0.024
0.026
0.028
0.030
Moi
stur
e C
onte
nt k
g/kg
(dr
y ai
r)
100% 50%
10%
-5
0
5
10
15
20
25
30
Wet
-Bul
b Te
mpe
ratu
re °C
(Slin
g)
296
497385
42
Comfort zoneConditions outside DEC boundary
Conditions inside DEC boundary
Direct evaporative cooling (DEC) boundary
Conditions inside comfort envelope
Cool and humid conditions
Dry-bulb Temperature (°C)
Fig. 7. Hourly ambient conditions during working hours, excluding a daily siesta period (14.00–16.00) between June and September for Seville.
day and night time ventilation, would probably avoid this.Here, and throughout the paper, no special consideration isgiven to such data points, or to data points within the comfortenvelope.Scaling the result to a whole year of 200 working days,
the BBCC indicates that PDEC will be e9ective for either83% of occupied hours (no siesta period) or 85% of oc-cupied hours (siesta period from 14.00 to 16.00). As therewere no days in the year outside the June to Septemberperiod for which ambient conditions lay outside the evap-orative cooling envelope, data for the summer period onlyis plotted throughout this paper. The thermal simulationswere however conducted for the whole year to ensure thatconclusions based on plotting the summer data only wererobust.
5. Observations on BBCCs
ReOecting on the BBCCs against the backdrop of theabove analysis, a number of troubling questions emerge.Most importantly, in relation to this paper, whether the con-clusions reached about non-domestic PDEC buildings inSeville are reasonable.Firstly, how might the construction of the building (plan
form, insulation levels, thermal mass and area of glazing)a9ect the position of the climatic boundaries? Non-domesticbuildings tend to have a deeper plan than residential build-ings and ‘perimeter zones’ may well be more heavily glazed.Spaces further away from the source of PDEC air may wellnot enjoy the cooling bene8ts assumed by Givoni [1].
Secondly, how might the levels of internal heat gain inOu-ence the position of the climatic envelopes? Non-domesticbuildings tend to be much more densely occupied than resi-dential buildings, so the cooling airstreams may be warmedto more than the 1◦C or 2◦C above the temperature at whichthey leave the evaporative tower (as suggested by Givoni[1]). Night ventilation cooling may also be less e9ective asthe exposed thermal mass, relative to the occupied volume,is lower than in domestic buildings and it could be moreheavily charged with heat during the daytime.Finally, how might buildings that use a mix of passive
strategies perform? For example, as noted above, in Seville itwould seem sensible to use night-time ventilation to reduceinternal thermal mass temperatures and only switch on theevaporative cooling when the internal temperature threatensto rise above the comfort threshold.Such questions arise, in part, because the BBCCs are
based on 8eld measurements for a, necessarily, limited num-ber of residential scale buildings. Today, however, advanceddynamic thermal simulation programs o9er the possibilityof accurately predicting the likely internal conditions, andthe resulting thermal state of the occupants, for buildingsof arbitrary form and for any world location. Furthermore,hourly weather data is readily available and it is simplerto plot this directly than to use peak daily temperatures toevaluate night venting.The remainder of this paper explores the feasibility of
developing BBCCs using these advanced modelling tech-niques focussing speci8cally on PDEC buildings. The temp-tation to explore the validity of Givoni’s thermal comfortenvelopes has been resisted here. This was the subject of a
668 K.J. Lomas et al. / Building and Environment 39 (2004) 661–676
previous paper in which the impact of solar gains, air speedand occupant clothing level was studied [17].However, the exploration of the utility of BBCCs, and
the climatic boundaries in particular, remains valid. Also theconclusions reached about the method of exploration wouldremain largely valid, even if a di9erent comfort envelopewas to be used.
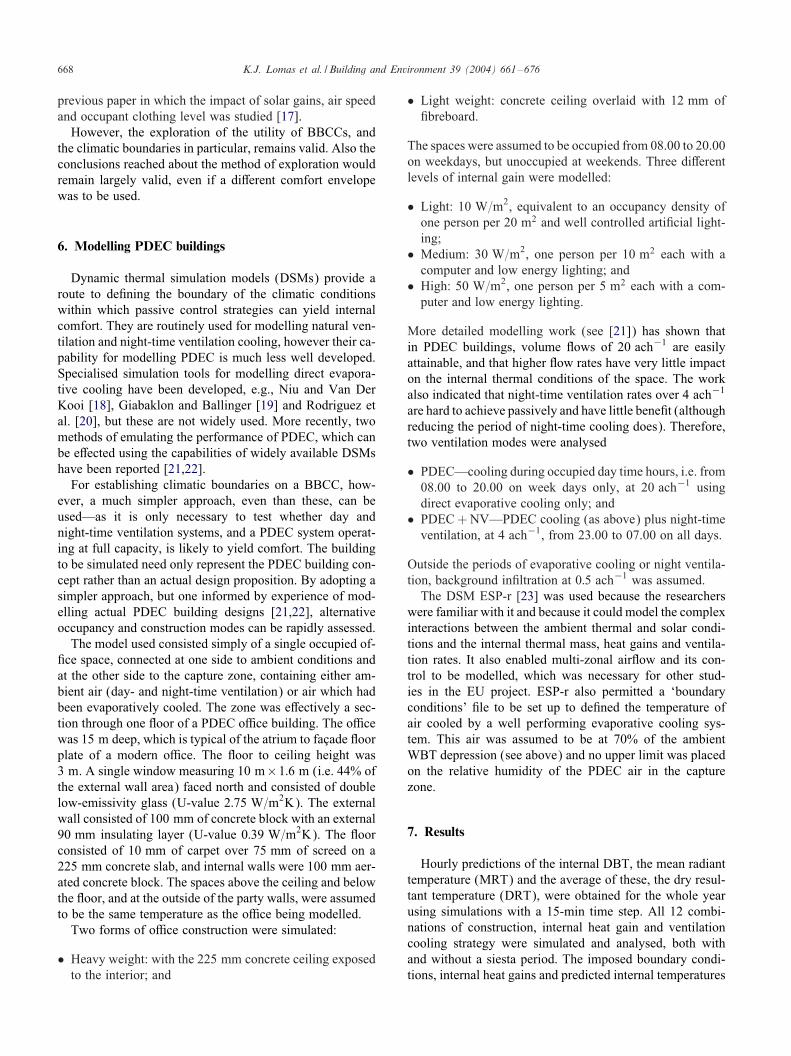
6. Modelling PDEC buildings
Dynamic thermal simulation models (DSMs) provide aroute to de8ning the boundary of the climatic conditionswithin which passive control strategies can yield internalcomfort. They are routinely used for modelling natural ven-tilation and night-time ventilation cooling, however their ca-pability for modelling PDEC is much less well developed.Specialised simulation tools for modelling direct evapora-tive cooling have been developed, e.g., Niu and Van DerKooi [18], Giabaklon and Ballinger [19] and Rodriguez etal. [20], but these are not widely used. More recently, twomethods of emulating the performance of PDEC, which canbe e9ected using the capabilities of widely available DSMshave been reported [21,22].For establishing climatic boundaries on a BBCC, how-
ever, a much simpler approach, even than these, can beused—as it is only necessary to test whether day andnight-time ventilation systems, and a PDEC system operat-ing at full capacity, is likely to yield comfort. The buildingto be simulated need only represent the PDEC building con-cept rather than an actual design proposition. By adopting asimpler approach, but one informed by experience of mod-elling actual PDEC building designs [21,22], alternativeoccupancy and construction modes can be rapidly assessed.The model used consisted simply of a single occupied of-
8ce space, connected at one side to ambient conditions andat the other side to the capture zone, containing either am-bient air (day- and night-time ventilation) or air which hadbeen evaporatively cooled. The zone was e9ectively a sec-tion through one Ooor of a PDEC o6ce building. The o6cewas 15 m deep, which is typical of the atrium to faScade Ooorplate of a modern o6ce. The Ooor to ceiling height was3 m. A single window measuring 10 m×1:6 m (i.e. 44% ofthe external wall area) faced north and consisted of doublelow-emissivity glass (U-value 2:75 W=m2K). The externalwall consisted of 100 mm of concrete block with an external90 mm insulating layer (U-value 0:39 W=m2K). The Ooorconsisted of 10 mm of carpet over 75 mm of screed on a225 mm concrete slab, and internal walls were 100 mm aer-ated concrete block. The spaces above the ceiling and belowthe Ooor, and at the outside of the party walls, were assumedto be the same temperature as the o6ce being modelled.Two forms of o6ce construction were simulated:
• Heavy weight: with the 225 mm concrete ceiling exposedto the interior; and
• Light weight: concrete ceiling overlaid with 12 mm of8breboard.
The spaces were assumed to be occupied from 08.00 to 20.00on weekdays, but unoccupied at weekends. Three di9erentlevels of internal gain were modelled:
• Light: 10 W=m2, equivalent to an occupancy density ofone person per 20 m2 and well controlled arti8cial light-ing;
• Medium: 30 W=m2, one person per 10 m2 each with acomputer and low energy lighting; and
• High: 50 W=m2, one person per 5 m2 each with a com-puter and low energy lighting.
More detailed modelling work (see [21]) has shown thatin PDEC buildings, volume Oows of 20 ach−1 are easilyattainable, and that higher Oow rates have very little impacton the internal thermal conditions of the space. The workalso indicated that night-time ventilation rates over 4 ach−1
are hard to achieve passively and have little bene8t (althoughreducing the period of night-time cooling does). Therefore,two ventilation modes were analysed
• PDEC—cooling during occupied day time hours, i.e. from08.00 to 20.00 on week days only, at 20 ach−1 usingdirect evaporative cooling only; and
• PDEC+NV—PDEC cooling (as above) plus night-timeventilation, at 4 ach−1, from 23.00 to 07.00 on all days.
Outside the periods of evaporative cooling or night ventila-tion, background in8ltration at 0:5 ach−1 was assumed.The DSM ESP-r [23] was used because the researchers
were familiar with it and because it could model the complexinteractions between the ambient thermal and solar condi-tions and the internal thermal mass, heat gains and ventila-tion rates. It also enabled multi-zonal airOow and its con-trol to be modelled, which was necessary for other stud-ies in the EU project. ESP-r also permitted a ‘boundaryconditions’ 8le to be set up to de8ned the temperature ofair cooled by a well performing evaporative cooling sys-tem. This air was assumed to be at 70% of the ambientWBT depression (see above) and no upper limit was placedon the relative humidity of the PDEC air in the capturezone.
7. Results
Hourly predictions of the internal DBT, the mean radianttemperature (MRT) and the average of these, the dry resul-tant temperature (DRT), were obtained for the whole yearusing simulations with a 15-min time step. All 12 combi-nations of construction, internal heat gain and ventilationcooling strategy were simulated and analysed, both withand without a siesta period. The imposed boundary condi-tions, internal heat gains and predicted internal temperatures

K.J. Lomas et al. / Building and Environment 39 (2004) 661–676 669
Ambient and evaporatively cooled air
15
20
25
30
35
40
45
6-Aug 7-Aug 8-Aug
6-Aug 7-Aug 8-Aug
6-Aug 7-Aug 8-Aug
6-Aug 7-Aug 8-Aug
Tem
pera
ture
°C
T
empe
ratu
re °
C
Tem
pera
ture
°C
PDEC dry-bulb temperature
Ambient dry-bulb temperature
Ambient wet-bulb temperature
heat gains and losses
-10000
-8000
-6000
-4000
-2000
0
2000
4000
6000
8000
10000
Wat
ts
Internal heat gains
Solar gain (PDEC+NV)
Ventilation
PDEC power (PDEC only)
Space temperatures PDEC+NV
20
25
30
35
40Internal dry-bulb temperature
Internal mean radiant temperature
Internal dry resultant temperature
Space temperatures PDEC only
20
25
35
40
30
Internal dry-bulb temperature
Internal mean radiant temperature
Internal dry resultant temperature
(a)
(b)
(c)
(d)
Fig. 8. Illustrative ESP-r prediction for a three day period in August in an o6ce with 50 W=m2 heat gain: (a) temperatures of ambient and evaporativelycooled air; (b) internal and solar heat gains and losses; (c) space temperatures using PDEC + NV; and (d) space temperatures using PDEC only.
for the heavyweight construction, with 50 W=m2 internalgain, are illustrated for a three-day period (Sunday, Mon-day, Tuesday) in August (Fig. 8).
The graphs (Fig. 8a) clearly illustrate the daily swing inthe DBT of the evaporatively cooled air, which has a max-imum value at around 14.00 each day. This temperature

670 K.J. Lomas et al. / Building and Environment 39 (2004) 661–676
0
10
20
30
40
50
60
70
80
90
100
PDEC PDECPDEC+NV PDEC+NV PDEC PDEC+NV
Per
cen
tag
e w
ork
ing
ho
urs
yie
ldin
g t
her
mal
co
mfo
rt
in p
erio
d J
un
e to
Sep
tem
ber
Siesta 14:00 - 16:00
No siesta
10W/m2 30W/m2 50W/m2
Givoni BBCC, Siesta
Givoni BBCC, No siesta
Fig. 9. Comparison of the hours for which the Givoni climatic boundary indicated passive cooling measures could yield internal comfort and the hoursof internal comfort predicted by ESP-r (thermally heavyweight cases).
swing results in a decrease in the cooling power of the evap-oratively cooled air in the early afternoon (Fig. 8b). Nightventing reduced the internal DBTs and MRTs below theirend-of-day values (Fig. 8c) but without night venting thetemperatures were reduced very little (Fig. 8d). When thePDEC system switched on in the early morning (at about9am), the internal DBT decreased further but not the MRT.Thereafter there was a gradual rise in the internal DBT, witha peak occurring at around 15.00 (Figs. 8c and d). The peakin MRT occurred 2 to 3 hours later at around 17.00–18.00,illustrating the e9ect of the thermal lag due to the heavy-weight construction. Most importantly, the DRTs are 1 to2◦C lower during the day when night venting is used ratherthan PDEC only.The predicted number of summertime hours, for which
the internal conditions during the occupied period lay withinthe Givoni thermal comfort envelope, were determined foreach of the 6 thermally heavyweight cases (Fig. 9). Com-fort was assessed using the predicted internal DRT and thecalculated WBT of the evaporatively cooled air—which im-plicitly assumes that, at the high airOow rate (20 ach−1),internal moisture production has negligible impact on theWBT.At low internal heat gains (10 W=m2 plus solar gain) and
with both PDEC and night venting in operation (PDEC +NV), the percentage of comfortable working hours duringthe summer was 67% with a siesta and 63% with no siesta.This level of comfort approaches the values for which theGivoni BBCC indicated comfort could be achieved, i.e. 76%and 72%, respectively (see Section 4, Fig. 7). Thus, at evenlower internal and solar heat gains, as found in residentialbuildings (data from which underpin the Givoni BBCCs)
it is possible that predictions would be in broad alignmentwith inferences about comfort drawn from Givoni’s climaticboundary for direct evaporative cooling.In o6ces, internal heat gains tend to be greater than
10 W=m2 and, as heat gains rise, evaporative cooling ispredicted to be progressively less successful (Fig. 9). At50 W=m2, plus solar gain, PDEC alone rendered only 34%of the working hours comfortable (38% with a siesta).In the thermally lightweight o6ce, all the predicted val-
ues were lower by 1 to 2 percentage points. This small dif-ference was somewhat surprising and may be a consequenceof the way the space was modelled, i.e. only a thin layerof 8breboard lined the concrete ceiling, leaving the thermalmass active. Further analyses focus on the heavy weight of-8ce only.The implications of these predictions for the design of
PDEC buildings are discussed elsewhere [21]. With regardto this paper, the results in Fig. 9 suggest that di9erentboundaries for direct evaporative cooling may be needed foruse with non-domestic buildings and that these should takeaccount of di9erent levels of internal heat gain. This propo-sition is explored in the remainder of this paper.
8. Developing climatic boundaries for o)ces
To develop the climatic boundaries, the hourly ambientconditions for the summertime occupied hours were plottedon a psychrometric chart, distinguishing between those am-bient conditions for which the corresponding internal con-ditions were comfortable and those ambient conditions forwhich the interior was uncomfortable (e.g. Figs. 10 and 11).

K.J. Lomas et al. / Building and Environment 39 (2004) 661–676 671
10 20 30 40 500.000
0.002
0.004
0.006
0.008
0.010
0.012
0.014
0.016
0.018
0.020
Moi
stur
e C
onte
nt k
g/kg
(dr
y ai
r)10
15
20
CLTC
LLTD
Dry-bulb Temperature (°C)
Dry-bulb Temperature (°C)
Wet
-Bul
b Te
mpe
ratu
re °C (S
ling)
Wet
-Bul
b Te
mpe
ratu
re °C (S
ling)
10 20 30 40 500.000
0.002
0.004
0.006
0.008
0.010
0.012
0.014
0.016
0.018
0.020
Moi
stur
e C
onte
nt k
g/kg
(dr
y ai
r)
10
15
20
CLTC
LLTD
(a)
(b)
Fig. 10. Ambient conditions and coincident internal conditions, together with the CLTC and the boundary de8ning the LLTD for direct evaporativecooling (PDEC) only: (a) 10 W=m2 internal gain; and (b) 50 W=m2 internal gain.
Comfort was based on the predicted internal DRT and thecalculated WBT of the evaporatively cooled air (as above).Plots both with, and without a siesta period were pro-
duced, however, the results were essentially the same, exceptthat there were less data when siesta hours were excluded.Therefore, only plots with no siesta period are shown. Like-wise, data from outside the June to September period gaveno further useful information and so were excluded. Analy-
ses focused on the heavyweight building, as this had supe-rior performance and it is boundaries for o6ces with goodbio-climatic design that are sought.The results displayed two clear features, which are seen
most easily in the simulations with PDEC only, i.e. no nightventing (Fig. 10a). Firstly, there is a reasonably sharp di-vision between the ambient conditions for which comfortwas never achieved and a region on the psychrometric chart

672 K.J. Lomas et al. / Building and Environment 39 (2004) 661–676
10 20 30 40 500.000
0.002
0.004
0.006
0.008
0.010
0.012
0.014
0.016
0.018
0.020
Moi
stur
e C
onte
nt k
g/kg
(dr
y ai
r)
10
15
20
CLTC
LLTD
Wet
-Bul
b Te
mpe
ratu
re °C (S
ling)
Wet
-Bul
b Te
mpe
ratu
re °C (S
ling)
Dry-bulb Temperature (°C)
Dry-bulb Temperature (°C)
10 20 30 40 500.000
0.002
0.004
0.006
0.008
0.010
0.012
0.014
0.016
0.018
0.020
Moi
stur
e C
onte
nt k
g/kg
(dr
y ai
r)
10
15
20
CLTC
LLTD
(a)
(b)
Fig. 11. Ambient conditions and coincident internal conditions, together with the CLTC and the boundary de8ning the LLTD for direct evaporativecooling with night venting (PDEC + NV): (a) 10 W=m2 internal gain; and (b) 50 W=m2 internal gain.
in which data points indicating thermal comfort are mixedwith data points indicating thermal discomfort. The bound-ary between these two regions has been termed the climaticlimit for thermal comfort (CLTC).Secondly, as noted above, there is a band of ambient
conditions below the CLTC, in which thermal comfort wassometimes achieved and sometimes not. As the internal heatgains increase this band becomes wider and contains more
hours of thermal discomfort, and less hours of thermal com-fort (Fig. 10b). Within the band, as the ambient conditionsbecome cooler, the occurrence of the internal conditions thatare comfortable increases, whilst the occurrence of uncom-fortable conditions decreases.Similar features can be seen in the data for the o6ce
cooled by a mixture of PDEC and night venting (Figs. 11aand b). However, compared to the o6ce with no night

K.J. Lomas et al. / Building and Environment 39 (2004) 661–676 673
10.0 20.0 30.0 40.0 50.00.000
0.002
0.004
0.006
0.008
0.010
0.012
0.014
0.016
0.018
0.020
Moi
stur
e C
onte
nt k
g/kg
(dr
y ai
r)
10
15
20
Wet
-Bul
b Te
mpe
ratu
re °C (S
ling)
Ambient dry-bulb temperature
PDEC dry-bulb temperatureInternal dry resultant temperature - heat gain 10W/m2
Internal dry resultant temperature - heat gain 30W/m2
Internal dry resultant temperature - heat gain 50W/m2
AB
C
D
Dry-bulb Temperature (°C)
Fig. 12. Some hourly ambient conditions, the resulting condition of the evaporatively cooled air and the corresponding hourly internal DRTs (no nightventing).
venting (Figs. 10a and b), the CLTC is at a higher WBT andthe band within which mixed internal conditions can arise isnarrower, especially at the higher heat gains. Night ventila-tion in combination with PDEC is thus delivering improvedperformance and more reliable performance, especially athigh internal heat gains.In practical terms the features described above are to be
expected. At high ambient WBTs, evaporative cooling cannever deliver air cool enough to produce internal comfort,irrespective of the internal heat gains (e.g. Fig. 12, point A).Under less severe ambient conditions (e.g. Fig. 12, point B),comfort may be obtained for lower internal heat gains butcannot be obtained for high internal heat gains. Thus, theboundary above which comfort cannot be achieved is sharplyde8ned and strongly dependent on the climate (hence theterm CLTC).The band of mixed performance arises because, although
the temperature of the evaporatively cooled air dependsclosely on the ambient conditions, the o6ce DRT is lessclosely coupled. It depends, in particular, on the time of dayand whether or not the building is ventilated at night. In themorning, night venting will mean that the surfaces are cool(lower MRT, and hence lower DRT) whereas by late after-noon the thermal mass will have heated up (see Fig. 8), espe-cially in spaces with higher heat gains. Without night venti-lation internal surfaces are generally warmer throughout theday. Thus, very similar ambient conditions may sometimesbe associated with an internally comfortable environment,and sometimes not (e.g. Fig. 2, points C and D). The widthof the band of mixed conditions is therefore sensitive to boththe climate and the building’s characteristics (e.g. design,
passive control and occupancy) and the lower boundary ofthe band is rather poorly de8ned, especially at higher heatgains. The ill-de8ned lower boundary has been termed thelower limit of thermal discomfort (LLTD).Based on the data available, it was possible to begin to
de8ne the position of the CLTC boundary for each case. Be-tween relative humidities of approximately 20% and 50%, aboundary can be produced which, roughly, follows a line ofconstant WBT. The line was positioned so that only approx-imately 10 of the data points indicating comfort, i.e., 10 hin the summer period, lay above it. However, because theupper limit of points indicating thermal comfort is sharplyde8ned the choice of 10 data point is not critical. At higherhumidities, i.e. approximately from 50% to 80%, the CLTCboundary appears to be at a shallower gradient.In a similar manner, the LLTD may be indicated by a
line of constant WBT from around 20% relative humidityto its intercept with a vertical- or angled line parallel to theleading edge of the thermal comfort envelope (Figs. 10 and11). The boundary was positioned such that only 10 datapoints indicating thermal discomfort lay below it.Due to the scarcity of the data, especially at higher relative
humidities and at very low humidities, the boundaries havebeen positioned by eye. They are therefore, a tentative 8rstattempt at de8ning climatic boundaries for o6ces with directevaporative cooling. The LLTD is particularly vague and sohas been shown by a broad grey line on Figs. 10 and 11.By way of a summary, the proposed format for climatic
boundaries appropriate to o6ces with direct evaporativecooling, is illustrated in Fig. 13, together with a table givingthe tentative positions of the CLTC, and the width of the

674 K.J. Lomas et al. / Building and Environment 39 (2004) 661–676
-10.0 0.0 10.0 20.0 30.0 40.0 50.0 60.0
Dry-bulb Temperature (°C)
0.000
0.002
0.004
0.006
0.008
0.010
0.012
0.014
0.016
0.018
0.020
0.022
0.024
0.026
0.028
0.030
Moi
stur
e C
onte
nt k
g/kg
(dr
y ai
r)
100% 50%
10%
-5
0
5
10
15
20
25
30
Limited risk of
Comfort VirtuallyNever Achieved
Band ofMixed
Comfort
Comfort InvariablyAchieved
CLTC
Lines parallel toComfort Envelope
summer timethermal discomfort
Increasing likelihood ofcomfort being achieved
Intercept
Intercept
Boundary defining climatic limitof thermal comfort (a line of
constant wet-bulb temperature)
Approx. joiningy = 0.013 kg/kg x = 30°C (50%rh)to y = 0.0148 kg/kg x = 33°C (80%rh)
x = 24°C and10% discomfort line
LLTD
Tentative values for the lines of wet bulb temperature fining CLTC and the width of the band of wet bulb
temperatures yielding mixed comfort de the
y C
nd dth
+NV LTC
Heat Gain
W/m2
PDEC onl
CLT
°C
Bawi
°C
PDEC
C
°C
Band width
°C
10 21.1 (-1.0) 21.7 (-0.5)
30 20.8 (-2.2) 21.2 (-1.7)
50 20.2 (-2.5) 21.0 (-3.0)
Fig. 13. Features of proposed BBCCs based on thermal simulation of an o6ce building in the Seville climate.
band of mixed comfort. For all three heat gains and for bothPDEC and PDEC+NV, the CLTC lies at a lower wet bulbtemperature than the climatic boundary for direct tempera-ture cooling proposed by Givoni; but the CLTC has a com-pletely di9erent meaning. Whereas the climatic boundariesof Givoni seek to indicate the conditions for which comfortcan be achieved (data points below the boundary) the CLTCseeks to de8ne the conditions for which thermal comfortcannot be achieved (data points above the boundary).
9. Discussion of results
The validity of BBCCs developed from 8eld experimentsis limited by the number of building types and climates,which due to time and cost constraints, can be studied. It isalso more di6cult to control and study the numerous inter-acting factors that inOuence thermal performance. In con-trast, simulation modelling o9ers the prospect of producingBBCCs tested over the widest possible range of buildingtypes, passive control strategies, occupancy characteristicsand climatic types.The freedom to choose the situation to bemodelled, means
that the model user is confronted with the need to explic-itly make numerous decisions. In doing this it is essentialto remain clear about the purpose of a BBCC, i.e. to indi-cate, at an early stage of design, whether or not a chosenpassive control strategy can be expected to deliver thermalcomfort under the prevailing climatic. Therefore a BBCCneeds to be sensitive to gross design parameters (such asthermal mass, passive control strategy and occupancy level)and independent of details that are ill de8ned in the early
stages of design or which change from one project to thenext.Based on the above results, it seems likely that a number
of BBCCs might be required to cover the range of build-ing types that occur in practice. The building modelled hasto be typical of the type for which the chart is being de-8ned. Therefore, assumptions should be made that reOectbuildings of good bio-climatic design and that are practi-cally achievable given ‘normal’ project cost constraints andbuilding techniques, etc. In other words, reasonable insu-lation levels, window shading strategies and glazing typesrather than lavish and unachievable ideals.The assumptions should be made explicit so that the users
of the BBCC can appreciate the extent to which their ownbuilding design problem matches the building for which thechart was devised. These assumptions may di9er from onelocality to another, for example depending on whether aBBCC is being devised for a developed country or for adeveloping country. By making the assumptions clear it isalso possible to gauge the impact on internal comfort if theintended passive systems perform di9erently from the mod-elled system, or if the building’s design (insulation, thermalmass, geometry) is signi8cantly di9erent.In this paper it was assumed that the cooled o6ce space
was not sub-divided internally, that all surrounding (unmod-elled) spaces were at a similar temperature and that the win-dow faced north (to model either north facing windows orthe solar gains for shaded windows facing other directions).In practice a PDEC building may have perimeter o6ces,which would receive almost all the solar gain and thus bewarmer than the core spaces located adjacent to the capturezone. Spaces below the roof also risk being warmer due to

K.J. Lomas et al. / Building and Environment 39 (2004) 661–676 675
solar gain. In practice therefore architects need to take greatcare in the design of perimeter areas if a PDEC building isto perform as well as the BBCC implies.It was assumed that the PDEC system could cool ambient
air by 70% of the WBT depression and that high volumeOows of this cool air (20 ach−1) could be achieved, butthere are a number of reasons why installed systems mightperform di9erently. For example, simulations have shownthat solar gain through the glazing at the top of the capturezone can re-warm the cooled air prior to its entry into theoccupied spaces and that winds can cause back pressure onair outlets or drive hot ambient air into the capture zonethrough the upper air inlets [22]. It would be possible toinclude these e9ects in the model used to create the BBCC,however, this would make the model very location, buildingdesign and PDEC system speci8c.Because the primary goal of the work was to de8ne the
climatic boundary for a direct evaporative system operatingat peak performance, essentially no control was exercisedover the volume of PDEC air delivered to the o6ces and theair was assumed to be well mixed. In practice, air could bedelivered into the o6ces at a low level, in a displacementventilation mode, and dampers or louvres would control therate of supply on the basis of internal temperatures and airquality measurements.With the building and system assumption made, it is prob-
able that the CLTC lines are reasonably accurately located,but with better air Oow control and, perhaps, improved win-dow shading, it is possible that the band between the CLTCand the LLTD could be reduced. In fact, it is the width ofthis band that might be most sensitive to the modelling as-sumptions made (and the 8nal building design).Future studies could usefully give greater emphasis to the
de8nition of the band of mixed comfort (and the position ofthe LLTC). The use of a more sophisticated thermal mod-elling strategy, such as that recently devised by the authorsof this paper [21], would be advantageous in this regard.Probably the greatest limitation to this work is its restric-
tion to one climatic data set. It would be worth exploring thereliability of the proposed CLTC boundary and associateddiscomfort bands with data from other climates. Numeroussources of such data exist—either packaged with thermalmodels, e.g. ESP-r [23], from other commercially sources,e.g. Meteonorm [24] or in industry standards, e.g. ASHRAE[25]. By selecting hotter and dryer climates, the position ofthe CLTC below the 20% relative humidity line could bebetter de8ned. Such climates may also have greater diur-nal swings which would inOuence the width of the band ofmixed comfort for buildings with PDEC and night venting.Once a thermal model is set up it is a relatively easy task toundertake analyses with di9erent climate data.Further analyses should lead to a more defensible, math-
ematical, method of de8ning the shape and position of theCLTC and LLTD. In this work, the boundaries were po-sitioned by eye through sparse data and so it seemed ap-propriate to use lines of constant WBT (except where this
was clearly inappropriate). This has the bene8t of producingeasy-to-draw climatic charts and renders manual analysis ofclimatic data plausible. However, the boundaries could havea more complex shape and this would not pose di6culties(provided they are mathematically de8ned) when analysinghourly climate data 8les.The introduction of the statistically de8ned boundary
(LLTD) paves the way, perhaps, to BBCCs that conveythe risks associated with adopting di9erent passive controlstrategies in the face of di9erent likely levels of internalheat gain. This approach seems intuitively reasonable but itwould be useful to test the concept for other passive sys-tems, such as night venting only and indirect evaporativecooling. In either case it would be advantageous to base theBBCCs on plots of hourly ambient conditions rather thandaily maximum conditions.Finally, the much bigger question concerning the appro-
priateness of the Givoni thermal comfort envelopes remains.Thermal comfort is currently the subject of much researchworldwide and sophisticated models of human beings nowexist, e.g. [26,27]. Such models pave the way for a more rig-orous approach to de8ning thermal comfort envelopes (e.g.[28]). However, the strategy for developing BBCCs out-lined in this paper can still be followed, even if a di9erentapproach is used to de8ne the envelope of thermal comfort.
10. Conclusions
A broad strategy for producing climatic boundaries forpassive cooling systems, based on thermal simulation mod-elling, has been developed. A format for building bioclimaticcharts (BBCCs), which Oow from this approach, has beenproposed and climatic boundaries for direct passive evapo-rative cooling, operating both with and without night-timeventilation, has been suggested. A number of conclusionscan be drawn.
(1) The BBCCs, proposed by Givoni, were developedlargely from measurements made on residential scalebuildings which typically have low internal heat gainsand high levels of exposed thermal mass. Dynamicthermal simulations indicated that the climatic bound-ary, proposed by Givoni, for direct evaporative cooling‘within which building design strategies and naturalcooling systems can provide comfort’ is an unreliableperformance indicator for an o6ce building in Sevillewith passive downdraught evaporative cooling.
(2) A re8ned BBCC format for analysing the performanceof direct evaporative cooling systems has been pro-posed. It retains the bene8ts of being plotted on apsychrometric chart but contains additional data. Theclimatic limit of thermal comfort (CLTC) de8nes theambient conditions above which indoor thermal com-fort is virtually never achieved. A boundary, called thelower limit of thermal discomfort (LLTD), de8nes the

676 K.J. Lomas et al. / Building and Environment 39 (2004) 661–676
ambient conditions below which there is a very lowrisk of summer time thermal discomfort. The CLTCwas rather sharply de8ned by the simulations whereasthe LLTD was not.
(3) The positions of the CLTC and the LLTDwere sensitiveto two parameters, both of which are important in theearly design stages of building design: the internal heatgains and the strategy for passive ventilation cooling.The CLTC shifted towards lower temperatures as theinternal heat gains increased. The width of the band ofmixed thermal performance (between the CLTC and theLLTD) was much narrower for lower internal heat gainsand when evaporative cooling was used in conjunctionwith night-time ventilation.
(4) The availability of hourly climatic data, and the easeof use of dynamic thermal models, makes it possible toextend the analyses reported here. It is recommended,in particular, that a wider range of climatic conditionsis studied and that the method of modelling the func-tionality and control of a Passive downdraught evap-orative cooling (PDEC) system should be improved.This should enable the boundaries de8ning the LLTDin particular, but also the CLTC, to be more accuratelyde8ned, perhaps using more rigorous statistical analysismethods.
(5) More generally, thermal simulation modelling couldbe used to derive BBCCs for many other types ofnon-domestic building cooled by di9erent passivestrategies. It also provides a route to exploring a moreprecise de8nition of thermal comfort envelopes.
Acknowledgements
We are grateful to the European Union for fundingthe project ‘Passive downdraught evaporative cooling fornon-domestic buildings’ under the Joule Fourth FrameworkProgramme (Grant JOR3CT950078); to the Universidad deSevilla, our project partners, for the provision of the hourlyclimatic data for Seville; and to De Montfort Universityfor funding the Ph.D. work of David Martinez—the ideasgenerated were a spur to this paper.
References
[1] Givoni B. Passive and low energy cooling of buildings. New York:Van Nostrand, Reinhold; 1994.
[2] Givoni B. Comfort, climate analysis and building design guidelines.Energy and Buildings 1992;18:11–23.
[3] Alverez S, Rodriguez EA, Molina JL. The Avenue of Europe atEXPO ’92: application of cool towers. Proceedings Passive andLow Energy Architecture Conference (PLEA. 99 Spain: 1991.p. 195–201.
[4] Cunningham WA, Thompson TL. Passive cooling with a naturaldraft cooling tower in combination with a solar chimney. ProceedingsPassive and Low Energy Architecture Conference (PLEA). PUecs,Hungary: 1986.
[5] Bowman NT, Eppel H, Lomas KL, Robinson D, Cook MJ. Passivedowndraught evaporative cooling—I: concept and precedents. Indoorand Built Environment 2000;9:284–90.
[6] Olgyay V. Design with climate. Princeton, NJ: Princeton UniversityPress; 1963.
[7] ASHRAE Handbook—fundamentals, SI ed. 2001; p. 27.49 Climaticdesign information, p. 23.11 Moisture in buildings.
[8] Anon. A performance speci8cation for the energy e6cient o6ce ofthe future. General information report 30. BRECSU on behalf of theUK DOE Best Practice Programme, 1995. 24 pp.
[9] Humphreys MA. Outdoor temperatures and comfort indoors.Building Research and Practice 1978;6:92–105.
[10] ASHRAE Standard 55. Thermal environmental conditions for humanoccupancy. Atlanta, USA: ASHRAE; 1992.
[11] Nichol F. Thermal comfort—a handbook for 8eld studies towardsan adaptive model. UK: University of East London; 1993.
[12] de Dear RJ. A global database of thermal comfort 8eld experiments.ASHRAE Transactions 1998;104(1b):1141–52.
[13] de Dear RJ, Branger GS. The adaptive model of thermal comfort andenergy conservation in the built environment. International Journalof Biometrology 2001;45:100–8.
[14] Tanabe SI. Thermal comfort requirement in Japan. Tokyo, Japan:Waseda University; 1988.
[15] McIntyre DA. Preferred air speeds for comfort in warm conditions.ASHRAE Transactions 1978;84:264–77.
[16] Wu H. Moisture up-take and energy e6ciency associated with theuse of evaporative coolers. Research report, Environmental TestingLaboratory, Arizona State University, Tempe, AZ; 1990.
[17] Martinez D, Fiala D, Cook MJ, Lomas KJ. Predicted comfortenvelopes for o6ce buildings with passive downdraught evaporativecooling. Proceeding ROOMVENT 2000 Conference, vol. 1. Reading,UK; 2000. p. 53–8.
[18] Niu J, van der Kool J. Dynamic simulation of combination ofevaporative cooling with cooled celling system for o6ce roomcooling. Proceedings International Building Performance SimulationAssociation 5th International Conference, Building Simulation ’97.Prague, Czech Republic: 1997. p. 407–12.
[19] Giabaklou Z, Ballinger JA. A passive evaporative cooling systemby natural ventilation. Building and Environmental 1996;6(31):503–7.
[20] Rodriguez E, Alvarez S, Martin R. Water drops as a natural coolingresource. Physical principles. Proceedings Passive and Low EnergyArchitecture Conference (PLEA). Seville, Spain; 1991.
[21] Lomas KJ, Robinson D, Cook MJ, Eppel H, Passive downdraughtevaporative cooling: thermal modelling. Indoor and BuiltEnvironment, 2004, in press.
[22] Cook MJ, Robinson D, Lomas KJ, Bowman NT, Eppel H. Passivedowndraught evaporative cooling—II airOow modelling. Indoor andBuilt Environment 2000;9:325–34.
[23] ESRU. ESP—a building and plant simulation system. Userguide. Glasgow: Energy Simulation Research Unit, University ofStrathclyde: 1998.
[24] METEONORM, Version 4.0, Edition 2000, copyright Meteotest,Bern, Switzerland. www.meteotest.ch/products/meteonorm.
[25] ASHRAE, Design weather sequence viewer 2.1, copyright ASHRAE,1997. www.ashrae.org.
[26] Fiala D, Lomas KJ, Stohrer M. A computer model of humanthermoregulation for a wide range of environmental conditions:the passive system. Journal of Applied Physiology 1999;87(5):1957–72.
[27] Fiala D, Lomas KJ, Stohrer M. Computer prediction of humanthermoregulatory and temperature responses to a wide range ofenvironmental conditions. International Journal of Biometeorology2001;45:143–59.
[28] Fiala D, Lomas KJ, Stohrer M. First principles modelling ofthermal sensation responses in steady–state and transient conditions.ASHRAE Trans 2003;109(1):179–86.
Copyright © 2022 FDOKUMEN