Variability of temperature in the Tibetan Plateau based on homogenized surface stations and...
11
INTERNATIONAL JOURNAL OF CLIMATOLOGY Int. J. Climatol. 33: 1337–1347 (2013) Published online 17 May 2012 in Wiley Online Library (wileyonlinelibrary.com) DOI: 10.1002/joc.3512 Variability of temperature in the Tibetan Plateau based on homogenized surface stations and reanalysis data Qinglong You, a,b,c * Klaus Fraedrich, b Guoyu Ren, c Nick Pepin, d and Shichang Kang c,e a Laboratory of Tibetan Environment Changes and Land Surface Processes, Institute of Tibetan Plateau Research, Chinese Academy of Sciences (CAS), Beijing, China b Meteorological Institute, Klima Campus, University of Hamburg, Hamburg, Germany c Laboratory for Climate Studies, National Climate Center, China Meteorological Administration (CMA), Beijing, China d Department of Geography, University of Portsmouth, UK e State Key Laboratory of Cryospheric Science, CAS, Lanzhou, China ABSTRACT: The Tibetan Plateau (TP) with an average elevation of over 4000 m a.s.l. is the world’s highest and most extensive highland. The scarcity of climatic observations limits our understanding of surface air temperature change in the region. Thus, we compare temperatures and their trends from 71 homogenized surface stations (with elevations above 2000 m a.s.l.) with National Centers for Environmental Prediction/National Center for Atmospheric Research (NCEP/NCAR) Reanalysis (NCEP/NCAR hereafter) and European Centre for Medium-Range Weather Forecasts (ECMWF) reanalysis (ERA-40 hereafter) in the eastern and central TP during 1961–2004. For current climatology, ERA-40 is more similar to the surface stations than NCEP/NCAR. Compared with surface stations, both NCEP/NCAR and ERA-40 reanalyses have cold biases, which are mainly a result of differences in topographical height, and station aspect and slope. Warming trends at the surface stations are on average stronger than in both reanalyses, but ERA-40 captures the surface warming more clearly than NCEP/NCAR on an annual and seasonal basis. Since ERA-40 more closely represents the surface temperatures and their trends in the central and eastern TP, ERA-40 predictions are selected to examine change in the western TP where there are few surface stations. NCEP/NCAR, on the other hand, is more representative of free air temperature conditions. The ‘observation minus reanalysis’ (OMR) method can be used to estimate the impact of surface changes on climate by computing the difference between surface observations and NCEP/NCAR (which only contains the forcing influencing the assimilated atmospheric trends). The OMR trend is significantly increasing but the extent to which the changes in local environment are responsible needs further study. Copyright 2012 Royal Meteorological Society KEY WORDS warming trend; elevation dependency; Tibetan Plateau; reanalysis Received 8 November 2011; Revised 28 February 2012; Accepted 15 April 2012 1. Introduction The Tibetan Plateau (TP) with an average elevation of over 4000 m a.s.l. and an area of approximately 2.5 × 10 6 km 2 is the highest and most extensive highland in the world. The TP exerts profound influences not only on the local climate and environment but also on the global atmospheric circulation through its thermal and mechanical forcing (Yeh and Gao, 1979; Duan and Wu, 2005). The TP has the largest area of snow and ice in the mid-latitude regions and has therefore been called the ‘Asian water tower’ (Yeh and Gao, 1979), while it gets less attention than the Arctic or Antarctic. In the context of global warming, the air temperature in the TP is increasing (Liu and Chen, 2000), with an accelerating melt of glaciers (such as Tian et al., 2006; Kang et al., 2007) corroborating that this. In the past ∗ Correspondence to: Q. You, Laboratory of Tibetan Environment Changes and Land Surface Processes, Institute of Tibetan Plateau Research, Chinese Academy of Sciences (CAS), Beijing 100085, China. E-mail: [email protected] half-century, 82% of the plateau’s glaciers have retreated and 10% of its permafrost has degraded (Qiu, 2008). These changes are expected to continue, changing the water supply for billions of people and probably altering the atmospheric circulation (Qiu, 2008). Being a crucial water resource for most of the Asian continent (Barnett et al., 2005; Zhang, 2007), the variability of water on the plateau is of critical importance. Zhu et al. (2011) found that dryness/wetness in the TP is associated with the dominance of a Scandinavian or Mediterranean/East Asia wave train, respectively. Owing to both terrain complexity and extreme envi- ronmental conditions, most surface observational stations are situated in the lower parts of the eastern and central TP, often in valley locations. Temperature in the TP has been widely studied (Liu and Chen, 2000; Wang et al., 2008; Xu et al., 2008; Bothe et al., 2010). Warming in the TP is significant and can influence the atmospheric circulation at a large scale (Wang et al., 2008). Previous studies concerning temperature variability based on raw observations, such as Liu and Chen (2000) and You et al. Copyright 2012 Royal Meteorological Society
-
Upload
independent -
Category
Documents
-
view
3 -
download
0
Transcript of Variability of temperature in the Tibetan Plateau based on homogenized surface stations and...
INTERNATIONAL JOURNAL OF CLIMATOLOGYInt. J. Climatol. 33: 1337–1347 (2013)Published online 17 May 2012 in Wiley Online Library(wileyonlinelibrary.com) DOI: 10.1002/joc.3512
Variability of temperature in the Tibetan Plateau based onhomogenized surface stations and reanalysis data
Qinglong You,a,b,c* Klaus Fraedrich,b Guoyu Ren,c Nick Pepin,d and Shichang Kangc,e
a Laboratory of Tibetan Environment Changes and Land Surface Processes, Institute of Tibetan Plateau Research, Chinese Academy of Sciences(CAS), Beijing, China
b Meteorological Institute, Klima Campus, University of Hamburg, Hamburg, Germanyc Laboratory for Climate Studies, National Climate Center, China Meteorological Administration (CMA), Beijing, China
d Department of Geography, University of Portsmouth, UKe State Key Laboratory of Cryospheric Science, CAS, Lanzhou, China
ABSTRACT: The Tibetan Plateau (TP) with an average elevation of over 4000 m a.s.l. is the world’s highest andmost extensive highland. The scarcity of climatic observations limits our understanding of surface air temperature changein the region. Thus, we compare temperatures and their trends from 71 homogenized surface stations (with elevationsabove 2000 m a.s.l.) with National Centers for Environmental Prediction/National Center for Atmospheric Research(NCEP/NCAR) Reanalysis (NCEP/NCAR hereafter) and European Centre for Medium-Range Weather Forecasts (ECMWF)reanalysis (ERA-40 hereafter) in the eastern and central TP during 1961–2004. For current climatology, ERA-40 ismore similar to the surface stations than NCEP/NCAR. Compared with surface stations, both NCEP/NCAR and ERA-40reanalyses have cold biases, which are mainly a result of differences in topographical height, and station aspect and slope.Warming trends at the surface stations are on average stronger than in both reanalyses, but ERA-40 captures the surfacewarming more clearly than NCEP/NCAR on an annual and seasonal basis. Since ERA-40 more closely represents thesurface temperatures and their trends in the central and eastern TP, ERA-40 predictions are selected to examine change inthe western TP where there are few surface stations. NCEP/NCAR, on the other hand, is more representative of free airtemperature conditions. The ‘observation minus reanalysis’ (OMR) method can be used to estimate the impact of surfacechanges on climate by computing the difference between surface observations and NCEP/NCAR (which only contains theforcing influencing the assimilated atmospheric trends). The OMR trend is significantly increasing but the extent to whichthe changes in local environment are responsible needs further study. Copyright 2012 Royal Meteorological Society
KEY WORDS warming trend; elevation dependency; Tibetan Plateau; reanalysis
Received 8 November 2011; Revised 28 February 2012; Accepted 15 April 2012
1. Introduction
The Tibetan Plateau (TP) with an average elevationof over 4000 m a.s.l. and an area of approximately2.5 × 106 km2 is the highest and most extensive highlandin the world. The TP exerts profound influences notonly on the local climate and environment but also onthe global atmospheric circulation through its thermaland mechanical forcing (Yeh and Gao, 1979; Duan andWu, 2005). The TP has the largest area of snow andice in the mid-latitude regions and has therefore beencalled the ‘Asian water tower’ (Yeh and Gao, 1979),while it gets less attention than the Arctic or Antarctic.In the context of global warming, the air temperaturein the TP is increasing (Liu and Chen, 2000), with anaccelerating melt of glaciers (such as Tian et al., 2006;Kang et al., 2007) corroborating that this. In the past
∗ Correspondence to: Q. You, Laboratory of Tibetan EnvironmentChanges and Land Surface Processes, Institute of Tibetan PlateauResearch, Chinese Academy of Sciences (CAS), Beijing 100085,China. E-mail: [email protected]
half-century, 82% of the plateau’s glaciers have retreatedand 10% of its permafrost has degraded (Qiu, 2008).These changes are expected to continue, changing thewater supply for billions of people and probably alteringthe atmospheric circulation (Qiu, 2008). Being a crucialwater resource for most of the Asian continent (Barnettet al., 2005; Zhang, 2007), the variability of water onthe plateau is of critical importance. Zhu et al. (2011)found that dryness/wetness in the TP is associated withthe dominance of a Scandinavian or Mediterranean/EastAsia wave train, respectively.
Owing to both terrain complexity and extreme envi-ronmental conditions, most surface observational stationsare situated in the lower parts of the eastern and centralTP, often in valley locations. Temperature in the TP hasbeen widely studied (Liu and Chen, 2000; Wang et al.,2008; Xu et al., 2008; Bothe et al., 2010). Warming inthe TP is significant and can influence the atmosphericcirculation at a large scale (Wang et al., 2008). Previousstudies concerning temperature variability based on rawobservations, such as Liu and Chen (2000) and You et al.
Copyright 2012 Royal Meteorological Society
1338 Q. YOU et al.
(2008a, 2008b), are spatially biased with little cover-age of the western TP and higher elevations (>4000 m).A reanalysis in theory overcomes this problem, but tobe used to assess widespread climate change it requiresvalidation against real observations where both exist.Hence temperatures retrieved from two reanalysis prod-ucts are investigated and compared with surface obser-vations in this study. Reanalyses include the NationalCenter for Environmental Prediction/National Centerfor Atmospheric Research (NCEP/NCAR) Reanalysis(NCEP/NCAR hereafter) (Kalnay et al., 1996) and theEuropean Centre for Medium-Range Weather Forecasts(ECMWF) reanalysis (ERA-40 hereafter) (Uppala et al.,2005). Frauenfeld et al. (2005) have compared ERA-40with the raw observational data in the TP and Ma et al.(2008) have investigated homogenized surface observa-tions with reanalyses over the whole China. Despitethese studies, detailed comparisons between reanalysesdata and homogenized observations are limited in the TPwhere topography is complex. Previous work (You et al.,2010a; 2010b) has analysed warming trends from bothreanalyses and surface data, examining the relationshipsbetween trend magnitudes, elevation and atmospheric cir-culation changes. This study uses similar datasets butincludes more detailed examination of local-scale andshort-term differences between them. In particular, acomparison of instantaneous climatology, the modelingof bias between observations and reanalyses, and gainingan understanding of what controls the contrasts betweenstation and reanalysis-based trends can extend under-standing of climate variability in this important region.
After data sources and methods are outlined (Sec-tion 2), the current temperature climatology of the TPfrom surface observations and both reanalyses is com-pared in Section 3.1 and the differences in trends aredescribed in Section 3.2. Based on this, ERA-40 is usedto examine trend patterns in the western TP where sur-face data are virtually non-existent (Section 4.1), andNCEP/NCAR is selected to contrast surface and free-airwarming patterns in the rest of the region (Section 4.2and 4.3). The predictability of the differences betweenthe datasets and the wider implications of our work arediscussed in Section 5.
2. Datasets and methods
A brief description of the near surface air temperaturedataset is presented. Those data provide the basis for theanalysis of TP temperature variability and its relation tosurface elevation.
2.1. Surface air temperature homogenized dataset
The surface air temperature homogenized dataset isthe China Homogenized Historical Temperature Dataset(1951–2004 period) (version 1.0), which was released in2006 by the National Meteorological Information Cen-ter, China Meteorological Administration (NMIC/CMA).The data have been homogenized to minimize the effect
of station relocations. Discontinuities have been adjusted(Li et al., 2004a; 2004b). Detailed descriptions of dataquality control and homogenization procedure are avail-able in the above papers.
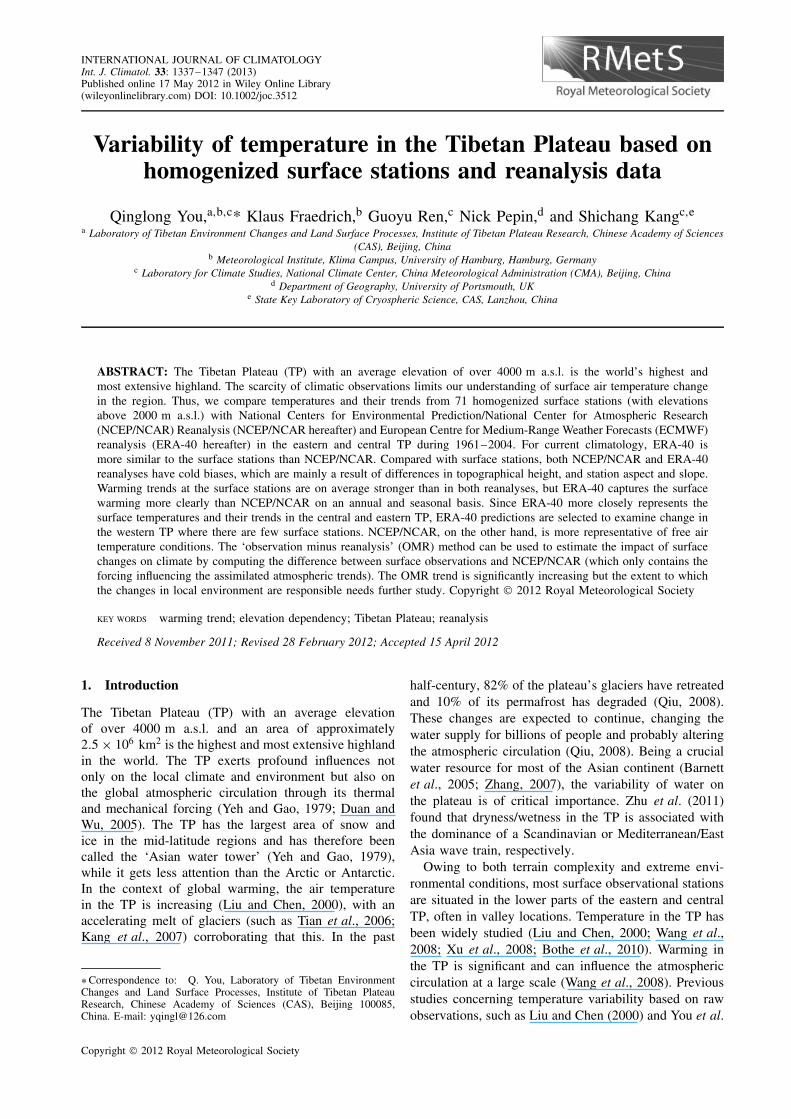
The TP in China ranges from approximately 26° to40 °N and from 73° to 105 °E (Zhang et al., 2002), andthere are 156 stations in the original dataset within thisarea. As coverage in the western TP is extremely patchy,the 71 stations above 2000 m a.s.l. are selected in theeastern and central TP with complete data for 1961–2004for comparison with the reanalysis products (Figure 1).More details regarding station selection are described inour previous papers (You et al., 2008a, 2008b).
2.2. Reanalysis datasets
Monthly mean 2 m surface air temperatures for NCEP/NCAR were downloaded from the National Oceanicand Atmospheric Administration – Cooperative Institutefor Research in Environmental Sciences (NOAA-CIRES)Climate Diagnostics Centre (http://www.cdc.noaa.gov/).The NCEP/NCAR reanalysis is a continually-updatedgridded dataset representing the state of the Earth’s atmo-sphere, incorporating observations (such as ship, raw-insonde, pibal, aircraft, satellite, and other data) withnumerical weather prediction model output, quality con-trolling and assimilating these data with a data assimi-lation system. This dataset covers January 1948 to thepresent with a spatial resolution of 2.5° × 2.5° (Kalnayet al., 1996) and sub-daily temporal resolution. TheNCEP/NCAR 2 m air temperature is a standard modelledfield, which represents a linear interpolation between thesurface skin temperature and free-air temperature at thelowest model sigma level (Kalnay et al., 1996).
Monthly mean 2 m surface air temperature ERA-40 reanalysis data were obtained from the EuropeanCentre for Medium-Range Weather Forecasts website(http://www.ecmwf.int/). ERA-40 temperatures are avail-able from September 1957 to August 2002 with a spatialresolution of 2.5° × 2.5° (Uppala et al., 2005). The datainclude satellite-borne instruments, observations from air-craft, ocean-buoys, radiosonde and other surface plat-forms, but with a declining number of radiosonde ascentssince the late 1980s. ERA-40 2 m air temperature is apost-processing product and is obtained by interpolationbetween the lowest model level and the surface (Uppalaet al., 2005). ERA-40 is the most recent comprehen-sive reanalysis and the first to provide an alternative tothe earlier NCEP/NCAR reanalysis for the years before1979 (Bengtsson et al., 2004). Periods of 1961–2004 and1961–2001 were selected from NCEP/NCAR and ERA-40 data, respectively.
2.3. Spatial comparision of datasets
To compare with surface stations, two slightly differentapproaches were investigated to identify the appropriatereanalysis value for comparison with the observed values.One is to compare the surface stations with reanalysesgrid points with at least one surface station in the
Copyright 2012 Royal Meteorological Society Int. J. Climatol. 33: 1337–1347 (2013)
HOMOGENIZED TEMPERATURE VERSUS REANALYSIS 1339
Figure 1. Topography of Tibetan Plateau (labelled 1–63). The white dots represent the 71 stations and the red numbers show the reanalysis gridpoints in the whole TP. The whole TP was subdivided into two parts by the rectangle: the eastern TP (labelled 1–28) and western TP (labelled
29–63).
immediate vicinity. This includes 29 grid points (labelled1–35 in Figure 1 with the exception of 2, 13, 14, 18, 19and 30). Surface stations are assigned to their nearest gridpoint (based on distance) and data from all the relevantstations are averaged for a given grid point. This averageis not weighted by distance or corrected according toelevation, which means that the differences in elevationand/or location distribution between the stations and thegrid point may be important (see Section 4). The other isto compare surface stations with reanalysis point obtainedfrom the weighted average of the reanalysis values ofthe four grid boxes whose centers lie closest to thestation. The average of the four grid boxes is obtainedusing the inverse distance weighted average (Mooneyet al., 2011). Both methods shows the grid points fromreanalysis have higher correlation coefficients with theobservations, and the bias between two methods arevery lower, suggesting both methods have no significantinfluence on the results (not shown). Thus, the first andsimple comparison method is adopted for subsequentstudy.
2.4. Surface elevation data and trend calculations
Surface elevations come from four datasets: (1) elevationof each surface station provided by the NMI/CMA,(2) NCEP/NCAR reanalysis model topography (availablefrom website http://www.cdc.noaa.gov/), (3) ERA-40reanalysis model topography (available fromhttp://www.ecmwf.int/), and (4) GTOPO30 digital eleva-tion data (available from http://eros.usgs.gov).
The Mann-Kendall test for a trend and Sen’s slope esti-mates were used to detect and estimate trends in annualand seasonal (winter: DJF; spring: MAM; summer: JJA;autumn: SON) mean temperature series (Sen, 1968). Atrend is considered to be statistically significant if it is
significant at the 5% level (P < 0.5). The formula is asfollows:
The Mann–Kendall statistic S is calculated as:
S =n−1∑k=1
n∑j=k+1
sgn(xj − xk) · · · sgn(xj − xk)
={ +1 if xj − xk > 0
0 if xj − xk = 01 if xj − xk < 0
}
The variance for the statistic S is defined by:
Var(S) =n(n − 1)(2n + 5) −
q∑p=1
tp(tp − 1)(2tp + 5)
18
The test statistic Z is estimated as:
Z =
S − 1√VAR(S)
if S > 0
0 if S = 0S + 1√VAR(S)
if S < 0
In which Z follows a standard normal distribution, If|Z| > Z1−α/2, where α denotes the significant level, thenthe trend is significant. Sen’s method is used to estimatethe Kendall slope, and it is defined as the median overall combinations of record pairs for the whole dataset. Itis given as follows:
Q = Median(
xj − xk
j − k
); i = 1, . . . , N.
The Mann-Kendall test is a nonparametric methodwithout considering distribution of the observational data,
Copyright 2012 Royal Meteorological Society Int. J. Climatol. 33: 1337–1347 (2013)
1340 Q. YOU et al.
and has been widely used to perform trends in climatevariables, such as temperature (Xu et al., 2008), precip-itation (Liu et al., 2011a, 2011b) and extreme climateseries (You et al., 2008a, 2008b). Meanwhile, the scien-tific communities of hydrology and water resources preferthe Mann-Kendall test. For example, the method wasapplied to analyse the river discharge during 1956–2000(Cao et al., 2006), pan evaporation and vapour pressurein the TP (Liu et al., 2011a, 2011b).
3. Comparing TP near surface air temperaturedatasets: means and trends
Climatological means and half-century trends of thetemperature datasets are analysed and compared withrelated studies before discussing the results.
3.1. Current climatology: surface stations andreanalysis data
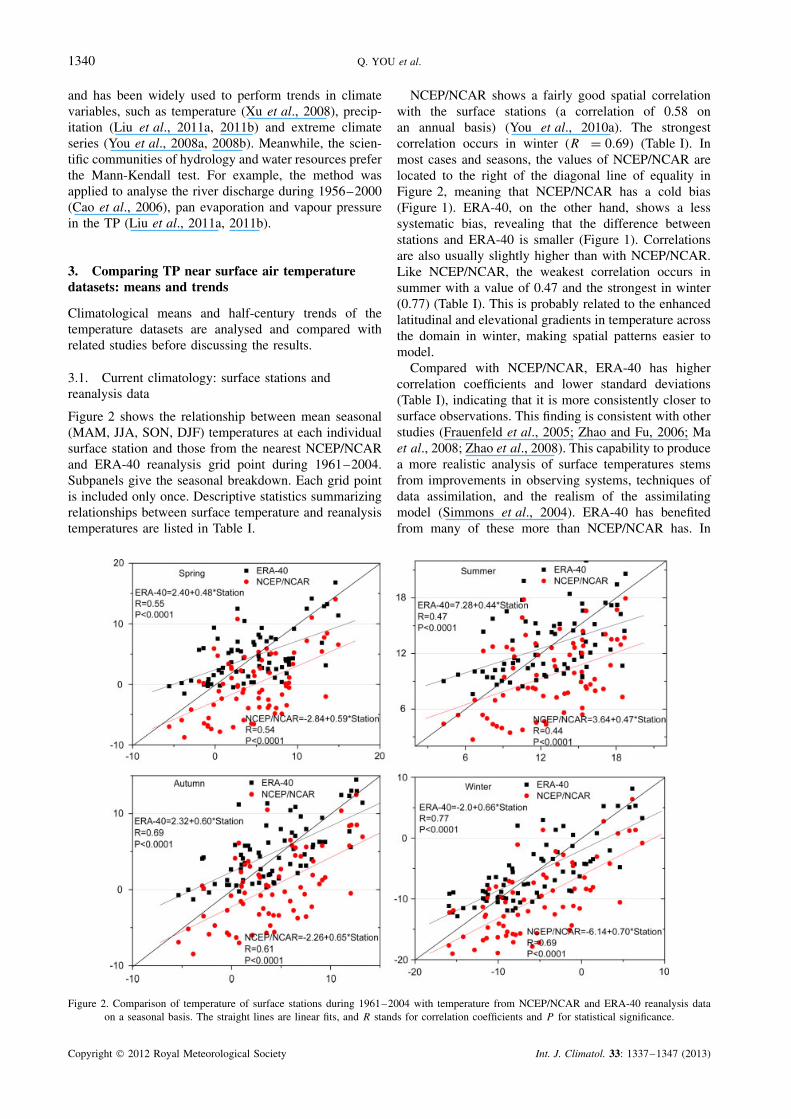
Figure 2 shows the relationship between mean seasonal(MAM, JJA, SON, DJF) temperatures at each individualsurface station and those from the nearest NCEP/NCARand ERA-40 reanalysis grid point during 1961–2004.Subpanels give the seasonal breakdown. Each grid pointis included only once. Descriptive statistics summarizingrelationships between surface temperature and reanalysistemperatures are listed in Table I.
NCEP/NCAR shows a fairly good spatial correlationwith the surface stations (a correlation of 0.58 onan annual basis) (You et al., 2010a). The strongestcorrelation occurs in winter (R = 0.69) (Table I). Inmost cases and seasons, the values of NCEP/NCAR arelocated to the right of the diagonal line of equality inFigure 2, meaning that NCEP/NCAR has a cold bias(Figure 1). ERA-40, on the other hand, shows a lesssystematic bias, revealing that the difference betweenstations and ERA-40 is smaller (Figure 1). Correlationsare also usually slightly higher than with NCEP/NCAR.Like NCEP/NCAR, the weakest correlation occurs insummer with a value of 0.47 and the strongest in winter(0.77) (Table I). This is probably related to the enhancedlatitudinal and elevational gradients in temperature acrossthe domain in winter, making spatial patterns easier tomodel.
Compared with NCEP/NCAR, ERA-40 has highercorrelation coefficients and lower standard deviations(Table I), indicating that it is more consistently closer tosurface observations. This finding is consistent with otherstudies (Frauenfeld et al., 2005; Zhao and Fu, 2006; Maet al., 2008; Zhao et al., 2008). This capability to producea more realistic analysis of surface temperatures stemsfrom improvements in observing systems, techniques ofdata assimilation, and the realism of the assimilatingmodel (Simmons et al., 2004). ERA-40 has benefitedfrom many of these more than NCEP/NCAR has. In
Figure 2. Comparison of temperature of surface stations during 1961–2004 with temperature from NCEP/NCAR and ERA-40 reanalysis dataon a seasonal basis. The straight lines are linear fits, and R stands for correlation coefficients and P for statistical significance.
Copyright 2012 Royal Meteorological Society Int. J. Climatol. 33: 1337–1347 (2013)
HOMOGENIZED TEMPERATURE VERSUS REANALYSIS 1341
Table I. Descriptive statistics of relationships between surface temperature of stations and that from reanalysis on an annualand seasonal basis. The study period periods for stations, NCEP/NCAR and ERA-40 are during 1961–2004, 1961–2004 and1961–2001. The linear fits formula (Reanalysis = a + b∗ Stations) is used. R stands for correlation coefficients and P for
statistical significance.
a b Standard deviation R P value
NCEP/NCAR Annual −2.50 0.61 3.98 0.58 <0.0001Spring −2.84 0.59 4.29 0.54 <0.0001Summer 3.65 0.47 3.50 0.44 <0.0001Autumn −2.26 0.65 3.81 0.61 <0.0001Winter −6.14 0.70 4.39 0.60 <0.0001
ERA-40 Annual 3.12 0.54 2.83 0.66 <0.0001Spring 2.40 0.48 3.42 0.55 <0.0001Summer 7.28 0.44 2.97 0.47 <0.0001Autumn 2.32 0.60 2.83 0.69 <0.0001Winter −2.0 0.66 3.31 0.77 <0.0001
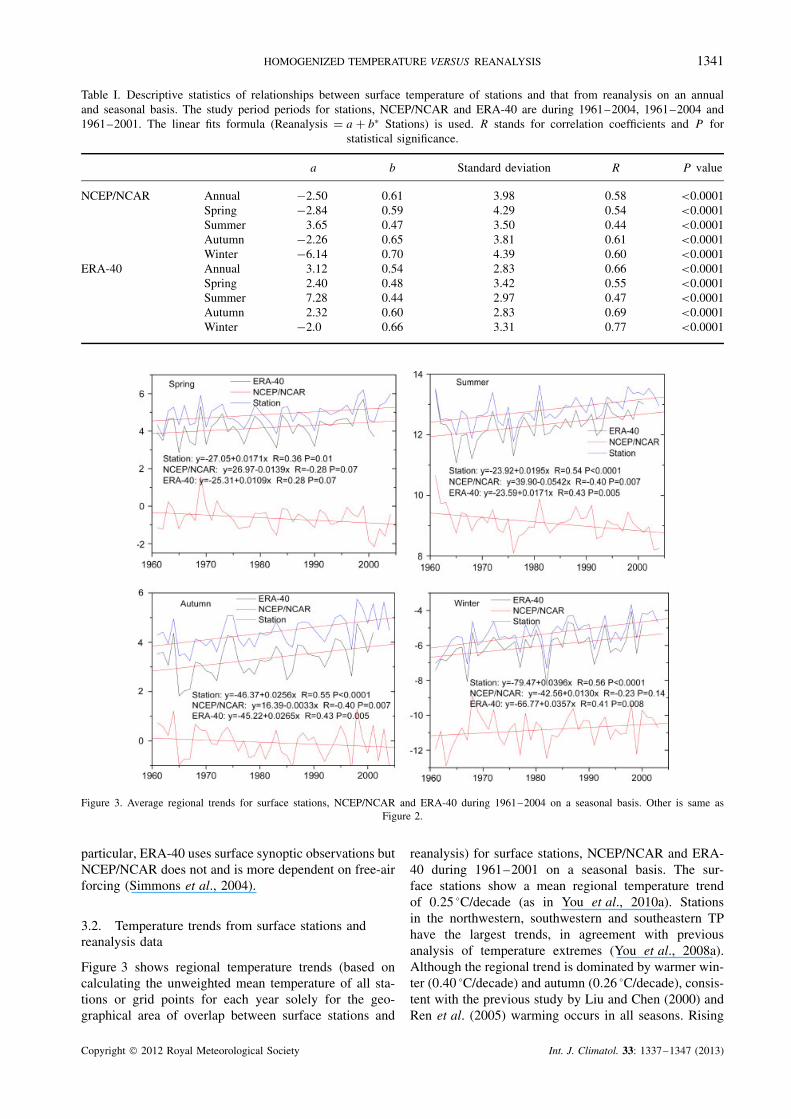
Figure 3. Average regional trends for surface stations, NCEP/NCAR and ERA-40 during 1961–2004 on a seasonal basis. Other is same asFigure 2.
particular, ERA-40 uses surface synoptic observations butNCEP/NCAR does not and is more dependent on free-airforcing (Simmons et al., 2004).
3.2. Temperature trends from surface stations andreanalysis data
Figure 3 shows regional temperature trends (based oncalculating the unweighted mean temperature of all sta-tions or grid points for each year solely for the geo-graphical area of overlap between surface stations and
reanalysis) for surface stations, NCEP/NCAR and ERA-40 during 1961–2001 on a seasonal basis. The sur-face stations show a mean regional temperature trendof 0.25 °C/decade (as in You et al., 2010a). Stationsin the northwestern, southwestern and southeastern TPhave the largest trends, in agreement with previousanalysis of temperature extremes (You et al., 2008a).Although the regional trend is dominated by warmer win-ter (0.40 °C/decade) and autumn (0.26 °C/decade), consis-tent with the previous study by Liu and Chen (2000) andRen et al. (2005) warming occurs in all seasons. Rising
Copyright 2012 Royal Meteorological Society Int. J. Climatol. 33: 1337–1347 (2013)
1342 Q. YOU et al.
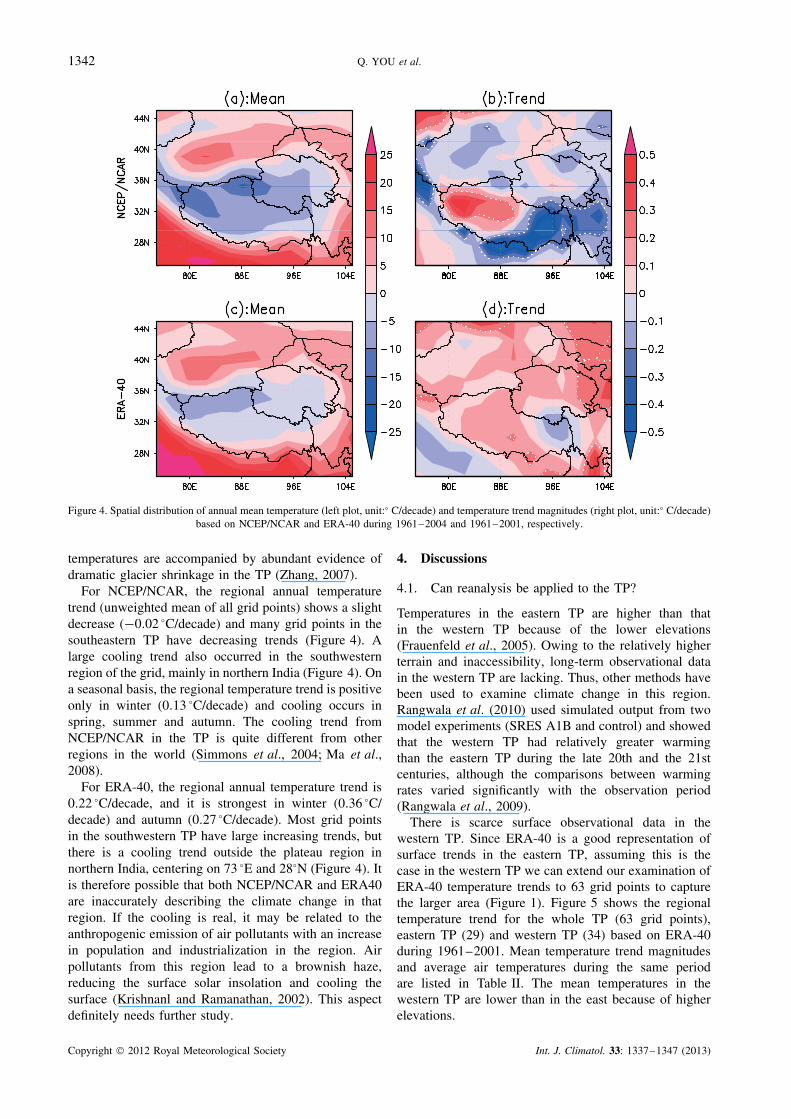
Figure 4. Spatial distribution of annual mean temperature (left plot, unit:° C/decade) and temperature trend magnitudes (right plot, unit:° C/decade)based on NCEP/NCAR and ERA-40 during 1961–2004 and 1961–2001, respectively.
temperatures are accompanied by abundant evidence ofdramatic glacier shrinkage in the TP (Zhang, 2007).
For NCEP/NCAR, the regional annual temperaturetrend (unweighted mean of all grid points) shows a slightdecrease (−0.02 °C/decade) and many grid points in thesoutheastern TP have decreasing trends (Figure 4). Alarge cooling trend also occurred in the southwesternregion of the grid, mainly in northern India (Figure 4). Ona seasonal basis, the regional temperature trend is positiveonly in winter (0.13 °C/decade) and cooling occurs inspring, summer and autumn. The cooling trend fromNCEP/NCAR in the TP is quite different from otherregions in the world (Simmons et al., 2004; Ma et al.,2008).
For ERA-40, the regional annual temperature trend is0.22 °C/decade, and it is strongest in winter (0.36 °C/decade) and autumn (0.27 °C/decade). Most grid pointsin the southwestern TP have large increasing trends, butthere is a cooling trend outside the plateau region innorthern India, centering on 73 °E and 28°N (Figure 4). Itis therefore possible that both NCEP/NCAR and ERA40are inaccurately describing the climate change in thatregion. If the cooling is real, it may be related to theanthropogenic emission of air pollutants with an increasein population and industrialization in the region. Airpollutants from this region lead to a brownish haze,reducing the surface solar insolation and cooling thesurface (Krishnanl and Ramanathan, 2002). This aspectdefinitely needs further study.
4. Discussions
4.1. Can reanalysis be applied to the TP?
Temperatures in the eastern TP are higher than thatin the western TP because of the lower elevations(Frauenfeld et al., 2005). Owing to the relatively higherterrain and inaccessibility, long-term observational datain the western TP are lacking. Thus, other methods havebeen used to examine climate change in this region.Rangwala et al. (2010) used simulated output from twomodel experiments (SRES A1B and control) and showedthat the western TP had relatively greater warmingthan the eastern TP during the late 20th and the 21stcenturies, although the comparisons between warmingrates varied significantly with the observation period(Rangwala et al., 2009).
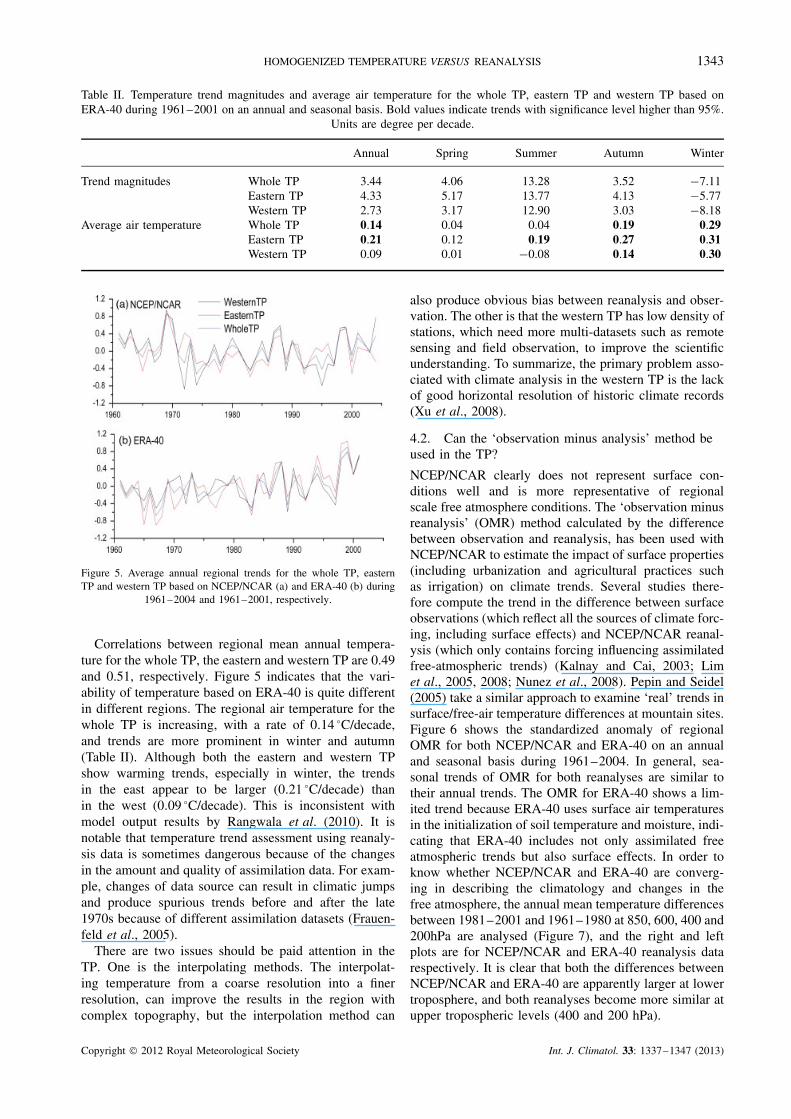
There is scarce surface observational data in thewestern TP. Since ERA-40 is a good representation ofsurface trends in the eastern TP, assuming this is thecase in the western TP we can extend our examination ofERA-40 temperature trends to 63 grid points to capturethe larger area (Figure 1). Figure 5 shows the regionaltemperature trend for the whole TP (63 grid points),eastern TP (29) and western TP (34) based on ERA-40during 1961–2001. Mean temperature trend magnitudesand average air temperatures during the same periodare listed in Table II. The mean temperatures in thewestern TP are lower than in the east because of higherelevations.
Copyright 2012 Royal Meteorological Society Int. J. Climatol. 33: 1337–1347 (2013)
HOMOGENIZED TEMPERATURE VERSUS REANALYSIS 1343
Table II. Temperature trend magnitudes and average air temperature for the whole TP, eastern TP and western TP based onERA-40 during 1961–2001 on an annual and seasonal basis. Bold values indicate trends with significance level higher than 95%.
Units are degree per decade.
Annual Spring Summer Autumn Winter
Trend magnitudes Whole TP 3.44 4.06 13.28 3.52 −7.11Eastern TP 4.33 5.17 13.77 4.13 −5.77Western TP 2.73 3.17 12.90 3.03 −8.18
Average air temperature Whole TP 0.14 0.04 0.04 0.19 0.29Eastern TP 0.21 0.12 0.19 0.27 0.31Western TP 0.09 0.01 −0.08 0.14 0.30
Figure 5. Average annual regional trends for the whole TP, easternTP and western TP based on NCEP/NCAR (a) and ERA-40 (b) during
1961–2004 and 1961–2001, respectively.
Correlations between regional mean annual tempera-ture for the whole TP, the eastern and western TP are 0.49and 0.51, respectively. Figure 5 indicates that the vari-ability of temperature based on ERA-40 is quite differentin different regions. The regional air temperature for thewhole TP is increasing, with a rate of 0.14 °C/decade,and trends are more prominent in winter and autumn(Table II). Although both the eastern and western TPshow warming trends, especially in winter, the trendsin the east appear to be larger (0.21 °C/decade) thanin the west (0.09 °C/decade). This is inconsistent withmodel output results by Rangwala et al. (2010). It isnotable that temperature trend assessment using reanaly-sis data is sometimes dangerous because of the changesin the amount and quality of assimilation data. For exam-ple, changes of data source can result in climatic jumpsand produce spurious trends before and after the late1970s because of different assimilation datasets (Frauen-feld et al., 2005).
There are two issues should be paid attention in theTP. One is the interpolating methods. The interpolat-ing temperature from a coarse resolution into a finerresolution, can improve the results in the region withcomplex topography, but the interpolation method can
also produce obvious bias between reanalysis and obser-vation. The other is that the western TP has low density ofstations, which need more multi-datasets such as remotesensing and field observation, to improve the scientificunderstanding. To summarize, the primary problem asso-ciated with climate analysis in the western TP is the lackof good horizontal resolution of historic climate records(Xu et al., 2008).
4.2. Can the ‘observation minus analysis’ method beused in the TP?
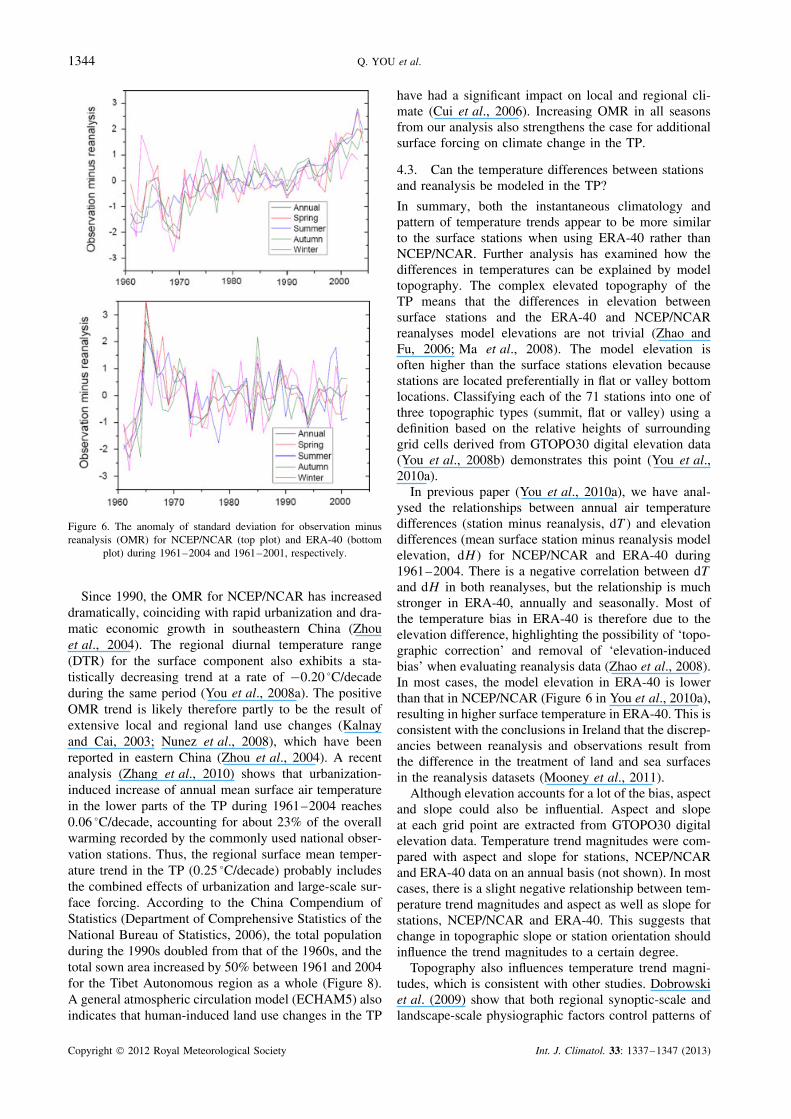
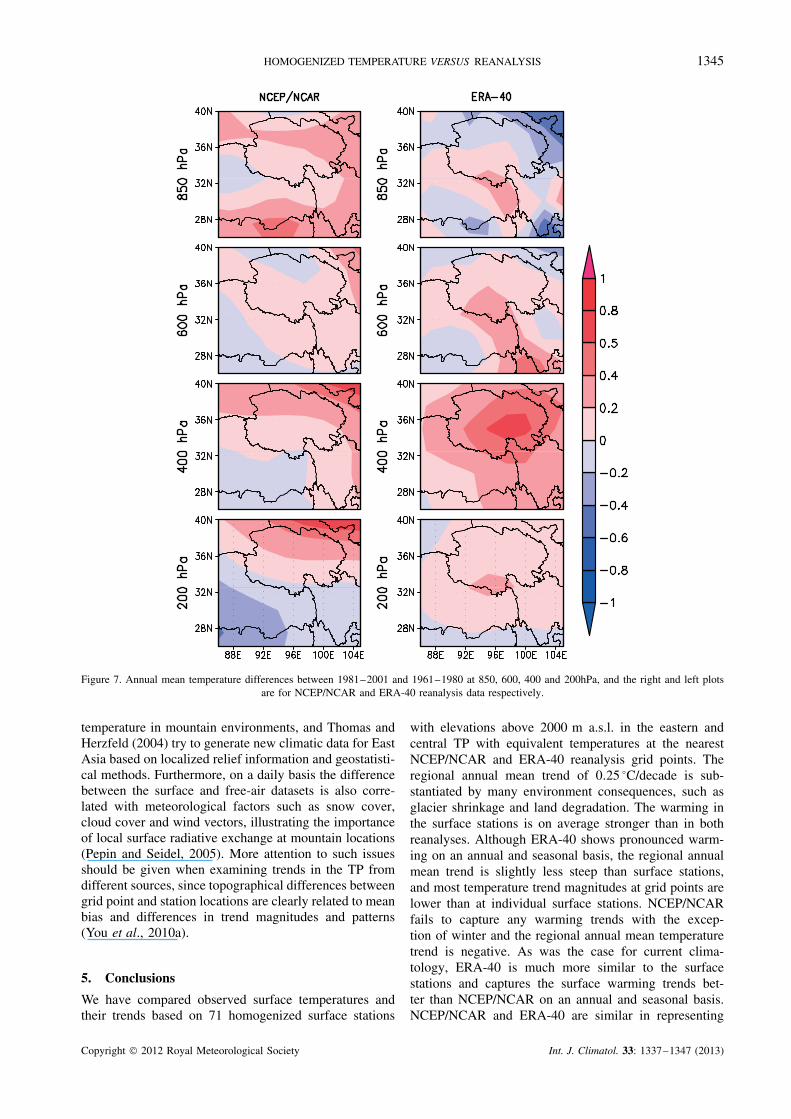
NCEP/NCAR clearly does not represent surface con-ditions well and is more representative of regionalscale free atmosphere conditions. The ‘observation minusreanalysis’ (OMR) method calculated by the differencebetween observation and reanalysis, has been used withNCEP/NCAR to estimate the impact of surface properties(including urbanization and agricultural practices suchas irrigation) on climate trends. Several studies there-fore compute the trend in the difference between surfaceobservations (which reflect all the sources of climate forc-ing, including surface effects) and NCEP/NCAR reanal-ysis (which only contains forcing influencing assimilatedfree-atmospheric trends) (Kalnay and Cai, 2003; Limet al., 2005, 2008; Nunez et al., 2008). Pepin and Seidel(2005) take a similar approach to examine ‘real’ trends insurface/free-air temperature differences at mountain sites.Figure 6 shows the standardized anomaly of regionalOMR for both NCEP/NCAR and ERA-40 on an annualand seasonal basis during 1961–2004. In general, sea-sonal trends of OMR for both reanalyses are similar totheir annual trends. The OMR for ERA-40 shows a lim-ited trend because ERA-40 uses surface air temperaturesin the initialization of soil temperature and moisture, indi-cating that ERA-40 includes not only assimilated freeatmospheric trends but also surface effects. In order toknow whether NCEP/NCAR and ERA-40 are converg-ing in describing the climatology and changes in thefree atmosphere, the annual mean temperature differencesbetween 1981–2001 and 1961–1980 at 850, 600, 400 and200hPa are analysed (Figure 7), and the right and leftplots are for NCEP/NCAR and ERA-40 reanalysis datarespectively. It is clear that both the differences betweenNCEP/NCAR and ERA-40 are apparently larger at lowertroposphere, and both reanalyses become more similar atupper tropospheric levels (400 and 200 hPa).
Copyright 2012 Royal Meteorological Society Int. J. Climatol. 33: 1337–1347 (2013)
1344 Q. YOU et al.
Figure 6. The anomaly of standard deviation for observation minusreanalysis (OMR) for NCEP/NCAR (top plot) and ERA-40 (bottom
plot) during 1961–2004 and 1961–2001, respectively.
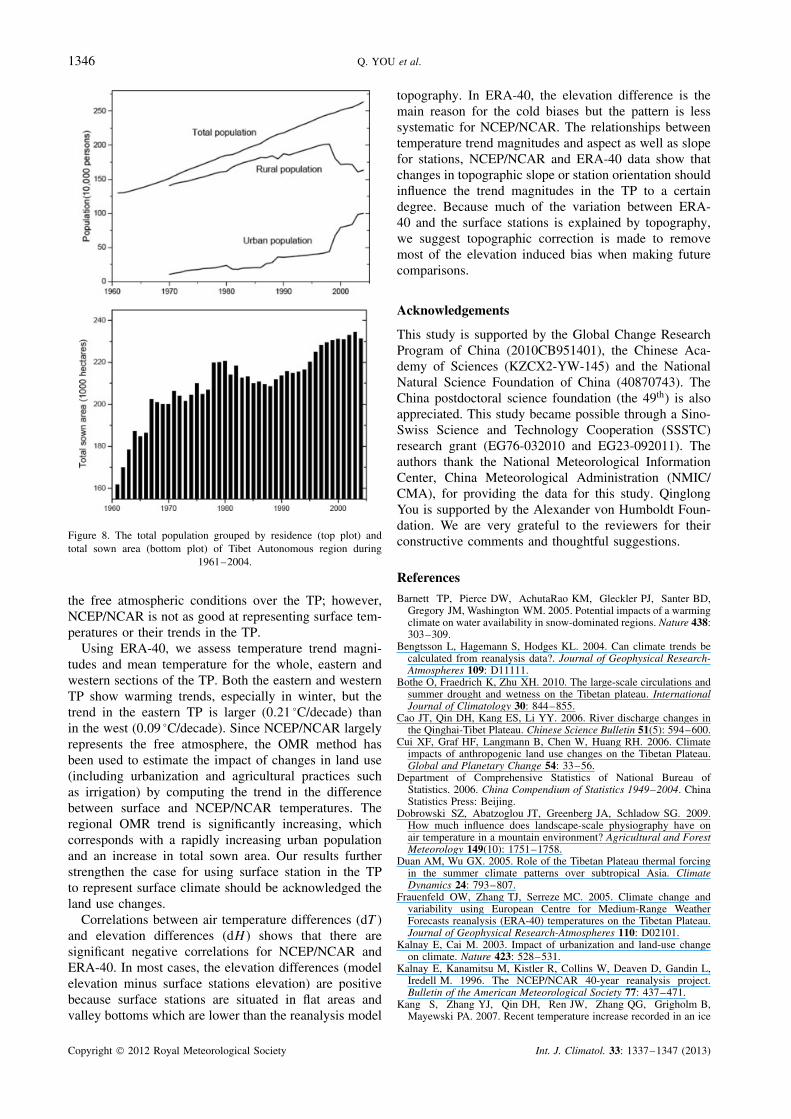
Since 1990, the OMR for NCEP/NCAR has increaseddramatically, coinciding with rapid urbanization and dra-matic economic growth in southeastern China (Zhouet al., 2004). The regional diurnal temperature range(DTR) for the surface component also exhibits a sta-tistically decreasing trend at a rate of −0.20 °C/decadeduring the same period (You et al., 2008a). The positiveOMR trend is likely therefore partly to be the result ofextensive local and regional land use changes (Kalnayand Cai, 2003; Nunez et al., 2008), which have beenreported in eastern China (Zhou et al., 2004). A recentanalysis (Zhang et al., 2010) shows that urbanization-induced increase of annual mean surface air temperaturein the lower parts of the TP during 1961–2004 reaches0.06 °C/decade, accounting for about 23% of the overallwarming recorded by the commonly used national obser-vation stations. Thus, the regional surface mean temper-ature trend in the TP (0.25 °C/decade) probably includesthe combined effects of urbanization and large-scale sur-face forcing. According to the China Compendium ofStatistics (Department of Comprehensive Statistics of theNational Bureau of Statistics, 2006), the total populationduring the 1990s doubled from that of the 1960s, and thetotal sown area increased by 50% between 1961 and 2004for the Tibet Autonomous region as a whole (Figure 8).A general atmospheric circulation model (ECHAM5) alsoindicates that human-induced land use changes in the TP
have had a significant impact on local and regional cli-mate (Cui et al., 2006). Increasing OMR in all seasonsfrom our analysis also strengthens the case for additionalsurface forcing on climate change in the TP.
4.3. Can the temperature differences between stationsand reanalysis be modeled in the TP?
In summary, both the instantaneous climatology andpattern of temperature trends appear to be more similarto the surface stations when using ERA-40 rather thanNCEP/NCAR. Further analysis has examined how thedifferences in temperatures can be explained by modeltopography. The complex elevated topography of theTP means that the differences in elevation betweensurface stations and the ERA-40 and NCEP/NCARreanalyses model elevations are not trivial (Zhao andFu, 2006; Ma et al., 2008). The model elevation isoften higher than the surface stations elevation becausestations are located preferentially in flat or valley bottomlocations. Classifying each of the 71 stations into one ofthree topographic types (summit, flat or valley) using adefinition based on the relative heights of surroundinggrid cells derived from GTOPO30 digital elevation data(You et al., 2008b) demonstrates this point (You et al.,2010a).
In previous paper (You et al., 2010a), we have anal-ysed the relationships between annual air temperaturedifferences (station minus reanalysis, dT ) and elevationdifferences (mean surface station minus reanalysis modelelevation, dH ) for NCEP/NCAR and ERA-40 during1961–2004. There is a negative correlation between dT
and dH in both reanalyses, but the relationship is muchstronger in ERA-40, annually and seasonally. Most ofthe temperature bias in ERA-40 is therefore due to theelevation difference, highlighting the possibility of ‘topo-graphic correction’ and removal of ‘elevation-inducedbias’ when evaluating reanalysis data (Zhao et al., 2008).In most cases, the model elevation in ERA-40 is lowerthan that in NCEP/NCAR (Figure 6 in You et al., 2010a),resulting in higher surface temperature in ERA-40. This isconsistent with the conclusions in Ireland that the discrep-ancies between reanalysis and observations result fromthe difference in the treatment of land and sea surfacesin the reanalysis datasets (Mooney et al., 2011).
Although elevation accounts for a lot of the bias, aspectand slope could also be influential. Aspect and slopeat each grid point are extracted from GTOPO30 digitalelevation data. Temperature trend magnitudes were com-pared with aspect and slope for stations, NCEP/NCARand ERA-40 data on an annual basis (not shown). In mostcases, there is a slight negative relationship between tem-perature trend magnitudes and aspect as well as slope forstations, NCEP/NCAR and ERA-40. This suggests thatchange in topographic slope or station orientation shouldinfluence the trend magnitudes to a certain degree.
Topography also influences temperature trend magni-tudes, which is consistent with other studies. Dobrowskiet al. (2009) show that both regional synoptic-scale andlandscape-scale physiographic factors control patterns of
Copyright 2012 Royal Meteorological Society Int. J. Climatol. 33: 1337–1347 (2013)
HOMOGENIZED TEMPERATURE VERSUS REANALYSIS 1345
Figure 7. Annual mean temperature differences between 1981–2001 and 1961–1980 at 850, 600, 400 and 200hPa, and the right and left plotsare for NCEP/NCAR and ERA-40 reanalysis data respectively.
temperature in mountain environments, and Thomas andHerzfeld (2004) try to generate new climatic data for EastAsia based on localized relief information and geostatisti-cal methods. Furthermore, on a daily basis the differencebetween the surface and free-air datasets is also corre-lated with meteorological factors such as snow cover,cloud cover and wind vectors, illustrating the importanceof local surface radiative exchange at mountain locations(Pepin and Seidel, 2005). More attention to such issuesshould be given when examining trends in the TP fromdifferent sources, since topographical differences betweengrid point and station locations are clearly related to meanbias and differences in trend magnitudes and patterns(You et al., 2010a).
5. Conclusions
We have compared observed surface temperatures andtheir trends based on 71 homogenized surface stations
with elevations above 2000 m a.s.l. in the eastern andcentral TP with equivalent temperatures at the nearestNCEP/NCAR and ERA-40 reanalysis grid points. Theregional annual mean trend of 0.25 °C/decade is sub-stantiated by many environment consequences, such asglacier shrinkage and land degradation. The warming inthe surface stations is on average stronger than in bothreanalyses. Although ERA-40 shows pronounced warm-ing on an annual and seasonal basis, the regional annualmean trend is slightly less steep than surface stations,and most temperature trend magnitudes at grid points arelower than at individual surface stations. NCEP/NCARfails to capture any warming trends with the excep-tion of winter and the regional annual mean temperaturetrend is negative. As was the case for current clima-tology, ERA-40 is much more similar to the surfacestations and captures the surface warming trends bet-ter than NCEP/NCAR on an annual and seasonal basis.NCEP/NCAR and ERA-40 are similar in representing
Copyright 2012 Royal Meteorological Society Int. J. Climatol. 33: 1337–1347 (2013)
1346 Q. YOU et al.
Figure 8. The total population grouped by residence (top plot) andtotal sown area (bottom plot) of Tibet Autonomous region during
1961–2004.
the free atmospheric conditions over the TP; however,NCEP/NCAR is not as good at representing surface tem-peratures or their trends in the TP.
Using ERA-40, we assess temperature trend magni-tudes and mean temperature for the whole, eastern andwestern sections of the TP. Both the eastern and westernTP show warming trends, especially in winter, but thetrend in the eastern TP is larger (0.21 °C/decade) thanin the west (0.09 °C/decade). Since NCEP/NCAR largelyrepresents the free atmosphere, the OMR method hasbeen used to estimate the impact of changes in land use(including urbanization and agricultural practices suchas irrigation) by computing the trend in the differencebetween surface and NCEP/NCAR temperatures. Theregional OMR trend is significantly increasing, whichcorresponds with a rapidly increasing urban populationand an increase in total sown area. Our results furtherstrengthen the case for using surface station in the TPto represent surface climate should be acknowledged theland use changes.
Correlations between air temperature differences (dT )and elevation differences (dH ) shows that there aresignificant negative correlations for NCEP/NCAR andERA-40. In most cases, the elevation differences (modelelevation minus surface stations elevation) are positivebecause surface stations are situated in flat areas andvalley bottoms which are lower than the reanalysis model
topography. In ERA-40, the elevation difference is themain reason for the cold biases but the pattern is lesssystematic for NCEP/NCAR. The relationships betweentemperature trend magnitudes and aspect as well as slopefor stations, NCEP/NCAR and ERA-40 data show thatchanges in topographic slope or station orientation shouldinfluence the trend magnitudes in the TP to a certaindegree. Because much of the variation between ERA-40 and the surface stations is explained by topography,we suggest topographic correction is made to removemost of the elevation induced bias when making futurecomparisons.
Acknowledgements
This study is supported by the Global Change ResearchProgram of China (2010CB951401), the Chinese Aca-demy of Sciences (KZCX2-YW-145) and the NationalNatural Science Foundation of China (40870743). TheChina postdoctoral science foundation (the 49th) is alsoappreciated. This study became possible through a Sino-Swiss Science and Technology Cooperation (SSSTC)research grant (EG76-032010 and EG23-092011). Theauthors thank the National Meteorological InformationCenter, China Meteorological Administration (NMIC/CMA), for providing the data for this study. QinglongYou is supported by the Alexander von Humboldt Foun-dation. We are very grateful to the reviewers for theirconstructive comments and thoughtful suggestions.
References
Barnett TP, Pierce DW, AchutaRao KM, Gleckler PJ, Santer BD,Gregory JM, Washington WM. 2005. Potential impacts of a warmingclimate on water availability in snow-dominated regions. Nature 438:303–309.
Bengtsson L, Hagemann S, Hodges KL. 2004. Can climate trends becalculated from reanalysis data?. Journal of Geophysical Research-Atmospheres 109: D11111.
Bothe O, Fraedrich K, Zhu XH. 2010. The large-scale circulations andsummer drought and wetness on the Tibetan plateau. InternationalJournal of Climatology 30: 844–855.
Cao JT, Qin DH, Kang ES, Li YY. 2006. River discharge changes inthe Qinghai-Tibet Plateau. Chinese Science Bulletin 51(5): 594–600.
Cui XF, Graf HF, Langmann B, Chen W, Huang RH. 2006. Climateimpacts of anthropogenic land use changes on the Tibetan Plateau.Global and Planetary Change 54: 33–56.
Department of Comprehensive Statistics of National Bureau ofStatistics. 2006. China Compendium of Statistics 1949–2004. ChinaStatistics Press: Beijing.
Dobrowski SZ, Abatzoglou JT, Greenberg JA, Schladow SG. 2009.How much influence does landscape-scale physiography have onair temperature in a mountain environment? Agricultural and ForestMeteorology 149(10): 1751–1758.
Duan AM, Wu GX. 2005. Role of the Tibetan Plateau thermal forcingin the summer climate patterns over subtropical Asia. ClimateDynamics 24: 793–807.
Frauenfeld OW, Zhang TJ, Serreze MC. 2005. Climate change andvariability using European Centre for Medium-Range WeatherForecasts reanalysis (ERA-40) temperatures on the Tibetan Plateau.Journal of Geophysical Research-Atmospheres 110: D02101.
Kalnay E, Cai M. 2003. Impact of urbanization and land-use changeon climate. Nature 423: 528–531.
Kalnay E, Kanamitsu M, Kistler R, Collins W, Deaven D, Gandin L,Iredell M. 1996. The NCEP/NCAR 40-year reanalysis project.Bulletin of the American Meteorological Society 77: 437–471.
Kang S, Zhang YJ, Qin DH, Ren JW, Zhang QG, Grigholm B,Mayewski PA. 2007. Recent temperature increase recorded in an ice
Copyright 2012 Royal Meteorological Society Int. J. Climatol. 33: 1337–1347 (2013)
HOMOGENIZED TEMPERATURE VERSUS REANALYSIS 1347
core in the source region of Yangtze River. Chinese Science Bulletin52: 825–831.
Krishnanl R, Ramanathan V. 2002. Evidence of surface cooling fromabsorbing aerosols. Geophysical Research Letters 29: 1340.
Li, QX, Liu XN, Zhang HZ, Peterson TC, Easterling DR. 2004a.Detecting and adjusting temporal inhomogeneity in Chinese meansurface air temperature data. Advances in Atmospheric Sciences 21:260–268.
Li QX, Zhang H, Liu X, Huang J. 2004b. Urban heat island effecton Annual Mean Temperature during Recent 50 Years in China.Theoretical and Applied Climatology 79(4): 165–174.
Lim YK, Cai M, Kalnay E, Zhou LM. 2008. Impact of vegetation typeson surface temperature change. Journal of Applied Meteorology andClimatology 47: 411–424.
Lim YK, Cai M, Kalnay E, Zhou LM. 2005. Observational evidence ofsensitivity of surface climate changes to land types and urbanization.Geophysical Research Letters 32: L22712.
Liu XC, Xu ZX, Yu YH. 2011a. Trend of climate variability in Chinaduring the past decades. Climatic Change 109: 503–516.
Liu XM, Zheng HX, Zhang MH, Liu CM. 2011b. Identification ofdominant climate factor for pan evaporation trend in the TibetanPlateau. Journal of Geographical Science 21(4): 594–608.
Liu XD, Chen BD. 2000. Climatic warming in the Tibetan Plateauduring recent decades. International Journal of Climatology 20:1729–1742.
Ma LJ, Zhang TJ, Li QX, Frauenfeld OW, Qin DH. 2008. Evaluationof ERA-40, NCEP/NCAR-1, and NCEP/NCAR-2 reanalysis airtemperatures with ground-based measurements in China. Journal ofGeophysical Research-Atmospheres 113: D15115.
Mooney PA, Mulligan FJ, Fealy R. 2011. Comparison of ERA-40, ERA-Interim and NCEP/NCAR reanalysis data with observedsurface air temperatures over Ireland. International Journal ofClimatology 31(4): 545–557.
Nunez MN, Ciapessoni HH, Rolla A, Kalnay E, Cai M. 2008. Impactof land use and precipitation changes on surface temperature trendsin Argentina. Journal of Geophysical Research-Atmospheres 113:D06111.
Pepin NC, Seidel DJ. 2005. A global comparison of surface and free-airtemperatures at high elevations. Journal of Geophysical Research-Atmospheres 110: D03104.
Qiu J. 2008. The third pole. Nature 454(7203): 393–396.Rangwala I, Miller JR, Xu M. 2009. Warming in the Tibetan
Plateau: possible influences of the changes in surface water vapor.Geophysical Research Letters 36: L06703.
Rangwala I, Miller J, Russell G, Xu M. 2010. Using a global climatemodel to evaluate the influences of water vapor, snow cover andatmospheric aerosol on warming in the Tibetan Plateau during thetwenty-first century. Climate Dynamics 34(6): 859–872.
Ren GY, Xu MZ, Chu ZY. 2005. Change in surface air temperatureover China during 1951–2004. Climatic and EnvironmentalResearch 10(4): 717–727 (in Chinese).
Sen PK 1968. Estimates of regression coefficient based on Kendall’stau. Journal of the American Statistical Association 63: 1379–1389.
Simmons AJ, Jones PD, Bechtold VD, Beljaars ACM, Kallberg PW,Saarinen S, Uppala SM, Viterbo P, Wedi N. 2004. Comparisonof trends and low-frequency variability in CRU, ERA-40, andNCEP/NCAR analyses of surface air temperature. Journal ofGeophysical Research-Atmospheres 109: D24115.
Thomas A, Herzfeld UC. 2004. Regeotop: new climatic data fields forEast Asia based on localized relief information and geostatistical.International Journal of Climatology 24(10): 1283–1306.
Tian LD, Yao TD, Li Z, MacClune K, Wu GJ, Xu BQ, Li YF, Lu AX,Shen YP. 2006. Recent rapid warming trend revealed from theisotopic record in Muztagata ice core, eastern Pamirs. Journal ofGeophysical Research-Atmospheres 111: D13103.
Uppala SM, Kallberg PW, Simmons AJ, Andrae U, Bechtold VD,Fiogino M, Gibson JK, Haseler J. 2005. The ERA-40 re-analysis.Quarterly Journal of Royal Meteorological Society 131: 2961–3012.
Wang B, Bao Q, Hoskins B, Wu GX, Liu YM. 2008. Tibetan plateauwarming and precipitation changes in East Asia. GeophysicalResearch Letters 35: L14702.
Xu ZX, Gong TL, Li JY. 2008. Decadal trend of climate in the TibetanPlateau – regional temperature and precipitation. HydrologicalProcesses 22(16): 3056–3065.
Yeh TC, Gao YX. 1979. Meteorology of the Qinghai-Xizang (Tibet)Plateau (in Chinese). Science Press: Beijing.
You QL, Kang SC, Aguilar E, Yan YP. 2008a. Changes in dailyclimate extremes in the eastern and central Tibetan Plateau during1961–2005. Journal of Geophysical Research-Atmospheres 113:D07101.
You QL, Kang SC, Pepin N, Yan YP. 2008b. Relationship betweentrends in temperature extremes and elevation in the eastern andcentral Tibetan Plateau, 1961–2005 Geophysical Research Letters35: L04704.
You QL, Kang SC, Pepin N, Fluegel WA, Yan YP, Behrawan H,Huang J. 2010a. Relationship between temperature trend magnitude,elevation and mean temperature in the Tibetan Plateau fromhomogenized surface stations and reanalysis data. Global andPlanetary Change 71(1–2): 124–133.
You QL, Kang SC, Pepin N, Fluegel WA, Sanchez-Lorenzo A,Yan YP, Zhang YJ. 2010b. Climate warming and associated changesin atmospheric circulation in the eastern and central Tibetan Plateaufrom a homogenized dataset. Global and Planetary Change 72:11–24.
Zhang YL, Li BY, Zheng D. 2002. A discussion on the boundary andarea of the Tibetan Plateau in China. Geographical Research 21:1–8 (in Chinese).
Zhang T. 2007. Perspectives on environmental study of response toclimatic and land Cover/Land use change over the Qinghai-TibetanPlateau: an introduction. Arctic Antarctic and Alpine Research 39:631–634.
Zhang AY, Ren GY, Zhou JX. 2010. Urbanization effect on surfaceair temperature trends over China Acta Meteorologica Sinica 68(6):957–966 (in Chinese).
Zhao T, Fu C. 2006. Preliminary comparison and analysis betweenERA-40, NCEP/NCAR-2 reanalysis and observations over China.Climate Environmental Research 11: 14–32.
Zhao T, Guo W, Fu C. 2008. Calibrating and evaluating reanalysissurface temperature error by topographic correction. Journal ofClimate: 21: 1440–1446.
Zhou LM, Dickinson RE, Tian YH, Fang JY, Li QX, Kaufmann RK,Tucker CJ, Myneni RB. 2004. Evidence for a significant urbaniza-tion effect on climate in China. Proceedings of the National Academyof Sciences of the United States of America 101: 9540–9544.
Zhu X, Bothe O, Fraedrich K. 2011. Summer atmospheric bridgingbetween Europe and Central Asia: influence on drought and wetnesson the Tibetan Plateau. Quaternary International 236: 151–157.
Copyright 2012 Royal Meteorological Society Int. J. Climatol. 33: 1337–1347 (2013)