Soil Organic Carbon Pools and Stocks in Permafrost-Affected Soils on the Tibetan Plateau
9
Soil Organic Carbon Pools and Stocks in Permafrost- Affected Soils on the Tibetan Plateau Corina Do ¨ rfer 1 *, Peter Ku ¨ hn 1 , Frank Baumann 1 , Jin-Sheng He 2 , Thomas Scholten 1 1 Department of Geosciences, Physical Geography and Soil Science, University of Tuebingen, Tuebingen, Germany, 2 Department of Ecology, College of Urban and Environmental Sciences, Peking University, Beijing, People’s Republic of China Abstract The Tibetan Plateau reacts particularly sensitively to possible effects of climate change. Approximately two thirds of the total area is affected by permafrost. To get a better understanding of the role of permafrost on soil organic carbon pools and stocks, investigations were carried out including both discontinuous (site Huashixia, HUA) and continuous permafrost (site Wudaoliang, WUD). Three organic carbon fractions were isolated using density separation combined with ultrasonic dispersion: the light fractions (,1.6 g cm 23 ) of free particulate organic matter (FPOM) and occluded particulate organic matter (OPOM), plus a heavy fraction (.1.6 g cm 23 ) of mineral associated organic matter (MOM). The fractions were analyzed for C, N, and their portion of organic C. FPOM contained an average SOC content of 252 g kg 21 . Higher SOC contents (320 g kg 21 ) were found in OPOM while MOM had the lowest SOC contents (29 g kg 21 ). Due to their lower density the easily decomposable fractions FPOM and OPOM contribute 27% (HUA) and 22% (WUD) to the total SOC stocks. In HUA mean SOC stocks (0–30 cm depth) account for 10.4 kg m 22 , compared to 3.4 kg m 22 in WUD. 53% of the SOC is stored in the upper 10 cm in WUD, in HUA only 39%. Highest POM values of 36% occurred in profiles with high soil moisture content. SOC stocks, soil moisture and active layer thickness correlated strongly in discontinuous permafrost while no correlation between SOC stocks and active layer thickness and only a weak relation between soil moisture and SOC stocks could be found in continuous permafrost. Consequently, permafrost-affected soils in discontinuous permafrost environments are susceptible to soil moisture changes due to alterations in quantity and seasonal distribution of precipitation, increasing temperature and therefore evaporation. Citation: Do ¨ rfer C, Ku ¨ hn P, Baumann F, He J-S, Scholten T (2013) Soil Organic Carbon Pools and Stocks in Permafrost-Affected Soils on the Tibetan Plateau. PLoS ONE 8(2): e57024. doi:10.1371/journal.pone.0057024 Editor: Caroline P. Slomp, Utrecht University, Netherlands Received May 24, 2012; Accepted January 21, 2013; Published February 26, 2013 Copyright: ß 2013 Do ¨ rfer et al. This is an open-access article distributed under the terms of the Creative Commons Attribution License, which permits unrestricted use, distribution, and reproduction in any medium, provided the original author and source are credited. Funding: This work was supported by the Federal Ministry of Education and Research (BMBF, 03G0810A, http://www.bmbf.de/en), the German Academic Exchange Service (DAAD, http://www.daad.de) and the National Natural Science Foundation of China (31025005 and 31021001). The funders had no role in study design, data collection and analysis, decision to publish, or preparation of the manuscript. Competing Interests: The authors have declared that no competing interests exist. * E-mail: [email protected] Introduction The relationship between soil organic carbon (SOC) stocks and site characteristics has been well investigated in the temperate zones at local and regional scale (e.g. [1–4]), but much less studies exist about the role of SOC in high-cold alpine regions (e.g. [5–8]). Studies in Arctic regions have shown that permafrost-influenced alpine ecosystems are highly sensitive to global climate change [9]. Prevailing low temperatures and permanently low turn-over rates result in large SOC stocks, providing a great emission potential for greenhouse gases such as CO 2 and CH 4 [10–14]. Thus, an estimate of SOC stocks in their extent and distribution is essential to predict feedback of SOC on global climate change [4,1,3]. Furthermore, differentiation between carbon pools is necessary because various SOM fractions show large differences in their turn-over rates according to their mineral binding [15–17]. The Tibetan Plateau is a particularly sensitive area in terms of possible effects of global climate change. It is the largest and highest plateau on earth and covers an area of 2.5 million square kilometers with an average altitude of more than 4000 m a.s.l. comprising about a quarter of China’s mainland [18]. On the Tibetan Plateau seasonally frozen soils are widespread [19]. Approximately two thirds of the total area is affected by permafrost [20]. Many studies focus on recent changes of the permafrost conditions on the Tibetan Plateau, attesting increasing permafrost temperatures, active layer thickness and rising degra- dation (e.g. [21–26]. Due to relatively high permafrost tempera- tures just below the freeze-thaw point, the so-called warm permafrost is more sensitive to global warming than the cold permafrost of higher latitudes [27]. The permafrost distribution is closely related to the characteristics of the land surface such as slope, exposure, vegetation distribution and snow cover. In this study permafrost is classified after the Chinese Permafrost Classification which differs from the classification of the In- ternational Permafrost Association (IPA). 50–90% of permafrost is required for classifying discontinuous permafrost after IPA Permafrost Classification; 30–70% is required after Chinese Permafrost Classification [28]. Recent soil ecological research mainly focuses on soil temper- ature as the main driving force for ecosystem processes (e.g. [3,29– 31]). Baumann et al. [6] showed that nutrient availability is a limiting factor for plant growth as well, which in turn is controlled by soil moisture. Furthermore studies show soil moisture is the dominant parameter regarding to the spatial variation of SOC contents [6] and soil CO 2 efflux [32] on the landscape scale in permafrost influenced ecosystems. Zhao et al. PLOS ONE | www.plosone.org 1 February 2013 | Volume 8 | Issue 2 | e57024
-
Upload
uni-tuebingen -
Category
Documents
-
view
0 -
download
0
Transcript of Soil Organic Carbon Pools and Stocks in Permafrost-Affected Soils on the Tibetan Plateau

Soil Organic Carbon Pools and Stocks in Permafrost-Affected Soils on the Tibetan PlateauCorina Dorfer1*, Peter Kuhn1, Frank Baumann1, Jin-Sheng He2, Thomas Scholten1
1Department of Geosciences, Physical Geography and Soil Science, University of Tuebingen, Tuebingen, Germany, 2Department of Ecology, College of Urban and
Environmental Sciences, Peking University, Beijing, People’s Republic of China
Abstract
The Tibetan Plateau reacts particularly sensitively to possible effects of climate change. Approximately two thirds of thetotal area is affected by permafrost. To get a better understanding of the role of permafrost on soil organic carbon poolsand stocks, investigations were carried out including both discontinuous (site Huashixia, HUA) and continuous permafrost(site Wudaoliang, WUD). Three organic carbon fractions were isolated using density separation combined with ultrasonicdispersion: the light fractions (,1.6 g cm23) of free particulate organic matter (FPOM) and occluded particulate organicmatter (OPOM), plus a heavy fraction (.1.6 g cm23) of mineral associated organic matter (MOM). The fractions wereanalyzed for C, N, and their portion of organic C. FPOM contained an average SOC content of 252 g kg21. Higher SOCcontents (320 g kg21) were found in OPOM while MOM had the lowest SOC contents (29 g kg21). Due to their lower densitythe easily decomposable fractions FPOM and OPOM contribute 27% (HUA) and 22% (WUD) to the total SOC stocks. In HUAmean SOC stocks (0–30 cm depth) account for 10.4 kg m22, compared to 3.4 kg m22 in WUD. 53% of the SOC is stored inthe upper 10 cm in WUD, in HUA only 39%. Highest POM values of 36% occurred in profiles with high soil moisture content.SOC stocks, soil moisture and active layer thickness correlated strongly in discontinuous permafrost while no correlationbetween SOC stocks and active layer thickness and only a weak relation between soil moisture and SOC stocks could befound in continuous permafrost. Consequently, permafrost-affected soils in discontinuous permafrost environments aresusceptible to soil moisture changes due to alterations in quantity and seasonal distribution of precipitation, increasingtemperature and therefore evaporation.
Citation: Dorfer C, Kuhn P, Baumann F, He J-S, Scholten T (2013) Soil Organic Carbon Pools and Stocks in Permafrost-Affected Soils on the Tibetan Plateau. PLoSONE 8(2): e57024. doi:10.1371/journal.pone.0057024
Editor: Caroline P. Slomp, Utrecht University, Netherlands
Received May 24, 2012; Accepted January 21, 2013; Published February 26, 2013
Copyright: � 2013 Dorfer et al. This is an open-access article distributed under the terms of the Creative Commons Attribution License, which permitsunrestricted use, distribution, and reproduction in any medium, provided the original author and source are credited.
Funding: This work was supported by the Federal Ministry of Education and Research (BMBF, 03G0810A, http://www.bmbf.de/en), the German AcademicExchange Service (DAAD, http://www.daad.de) and the National Natural Science Foundation of China (31025005 and 31021001). The funders had no role in studydesign, data collection and analysis, decision to publish, or preparation of the manuscript.
Competing Interests: The authors have declared that no competing interests exist.
* E-mail: [email protected]
Introduction
The relationship between soil organic carbon (SOC) stocks and
site characteristics has been well investigated in the temperate
zones at local and regional scale (e.g. [1–4]), but much less studies
exist about the role of SOC in high-cold alpine regions (e.g. [5–8]).
Studies in Arctic regions have shown that permafrost-influenced
alpine ecosystems are highly sensitive to global climate change [9].
Prevailing low temperatures and permanently low turn-over rates
result in large SOC stocks, providing a great emission potential for
greenhouse gases such as CO2 and CH4 [10–14]. Thus, an
estimate of SOC stocks in their extent and distribution is essential
to predict feedback of SOC on global climate change [4,1,3].
Furthermore, differentiation between carbon pools is necessary
because various SOM fractions show large differences in their
turn-over rates according to their mineral binding [15–17].
The Tibetan Plateau is a particularly sensitive area in terms of
possible effects of global climate change. It is the largest and
highest plateau on earth and covers an area of 2.5 million square
kilometers with an average altitude of more than 4000 m a.s.l.
comprising about a quarter of China’s mainland [18]. On the
Tibetan Plateau seasonally frozen soils are widespread [19].
Approximately two thirds of the total area is affected by
permafrost [20]. Many studies focus on recent changes of the
permafrost conditions on the Tibetan Plateau, attesting increasing
permafrost temperatures, active layer thickness and rising degra-
dation (e.g. [21–26]. Due to relatively high permafrost tempera-
tures just below the freeze-thaw point, the so-called warm
permafrost is more sensitive to global warming than the cold
permafrost of higher latitudes [27]. The permafrost distribution is
closely related to the characteristics of the land surface such as
slope, exposure, vegetation distribution and snow cover. In this
study permafrost is classified after the Chinese Permafrost
Classification which differs from the classification of the In-
ternational Permafrost Association (IPA). 50–90% of permafrost is
required for classifying discontinuous permafrost after IPA
Permafrost Classification; 30–70% is required after Chinese
Permafrost Classification [28].
Recent soil ecological research mainly focuses on soil temper-
ature as the main driving force for ecosystem processes (e.g. [3,29–
31]). Baumann et al. [6] showed that nutrient availability is
a limiting factor for plant growth as well, which in turn is
controlled by soil moisture. Furthermore studies show soil
moisture is the dominant parameter regarding to the spatial
variation of SOC contents [6] and soil CO2 efflux [32] on the
landscape scale in permafrost influenced ecosystems. Zhao et al.
PLOS ONE | www.plosone.org 1 February 2013 | Volume 8 | Issue 2 | e57024
[20] found a negative relationship between vegetation cover/
biomass and active layer thickness in alpine meadow ecosystems.
Permafrost favors the development of alpine meadow ecosystems,
protecting in turn permafrost by their dense vegetation cover from
degradation [33,34].
According to Wang et al. [5] about 33.52 Pg SOC are stored in
grassland soils of the Tibetan Plateau down to a depth of 70 cm.
Alpine meadow and alpine steppe soils have a share of 23.2 Pg,
which represents 2.5% of the global soil carbon pool [5]. Alpine
meadows make up 38.2% of total grassland soil carbon in Chinese
grassland soils [35]. Wang et al. [33] estimated that the
degradation of grassland is resulting in a loss of 57% of SOC in
heavy fractions (HF) and 84% in light fractions (LF) from alpine
meadow soils in Dari County (Qinghai Province). From 1986 to
2000 land cover changes have led to a loss of 1.8 Gg SOC and
a mass loss of 65% in the LF in the upper 30 cm [36].
Major objectives of this study are (1) to investigate SOC stocks
and their affiliation to pools by density fractionation and (2) to
examine interactions of SOC, soil moisture, and active layer
thickness in permafrost-affected soils on the Tibetan Plateau. For
comparing stocks and processes in soils affected by continuous and
discontinuous permafrost adequately, sites with similar rainfall
under varying temperatures were selected.
Materials and Methods
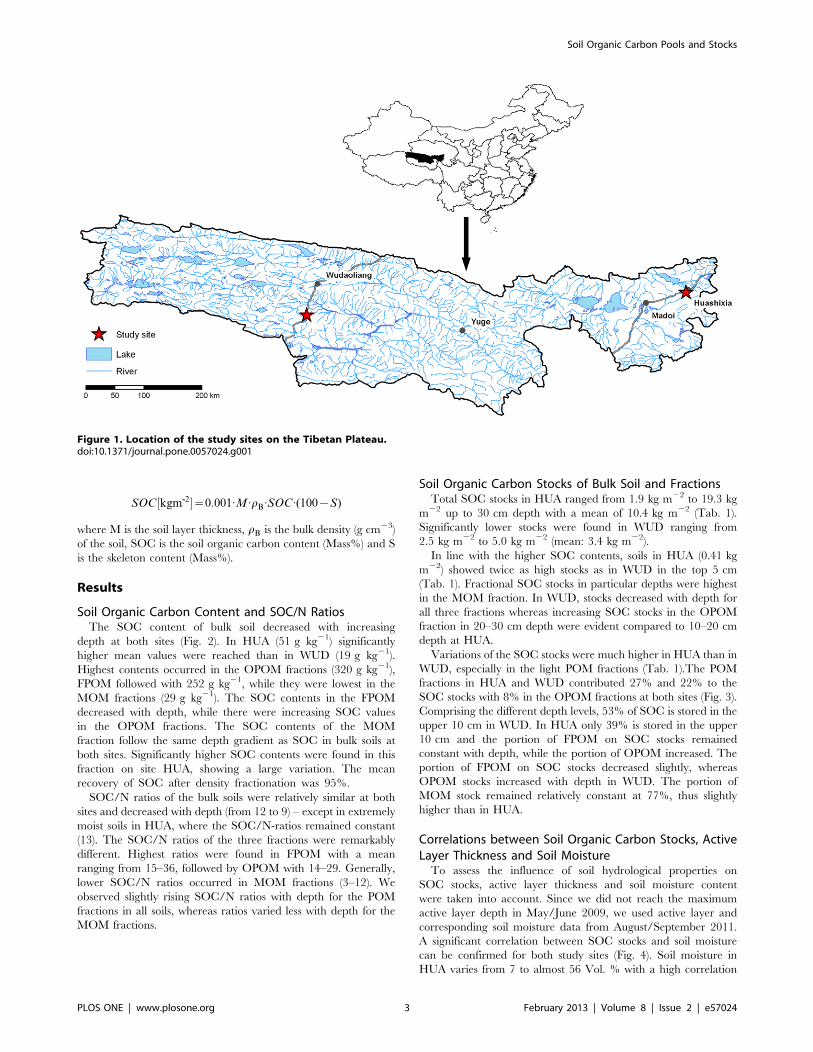
Study SitesThe study sites are located on the northeastern Tibetan Plateau,
Qinghai Province, China and were investigated in May/June 2009
and 2010 (Fig. 1). Site HUA is situated near the settlement of
Huashixia in Maduo County in the Yellow River catchment area,
4300 m a.s.l. The area is affected by the subtropical East Asian
Monsoon, which transports air masses with high water vapor
content from the lowlands to the Tibetan Plateau through the
meridional flow furrows [37], leading to relatively high rainfall.
The nearest climate station at Maduo shows a Mean Annual Air
Temperature (MAAT) of 24.1uC and a Mean Annual Pre-
cipitation (MAP) of 326 mm [38]. The catchment area of the
Yellow River (Huang He) is characterized by discontinuous,
unstable permafrost. The soils freeze to a depth of 2–3 m, while
the upper limit of the permafrost lies in 4–7 m depth; so-called
taliks have developed [39]. This vertical disconnection of the
permafrost is widespread near the study site. The site is influenced
by severe summer grazing with yak (Bos grunniens) and sheep (Ovis
aries) and a temporary settlement by nomads.
Site WUD is located in the headwaters of the Yangtze River, in
the middle between Wudaoliang and Tuotuohe next to the
Qinghai-Tibet Highway. Precipitation decreases from SE to NW
on the Plateau, but due to its location on the Fenghuo Shan
mountains, site WUD is characterized by higher precipitation and
lower temperatures as the surrounding area (MAP: 348 mm,
MAAT: 25.75uC, 4801 m a.s.l., [32]). The high elevation and the
low influence of the South Asian Monsoon are responsible for the
widespread continuous permafrost in that area [40] which is
relatively poor in ice [39]. This also results in a shorter vegetation
growth period compared to HUA. During the field campaign no
grazing occurred. Nevertheless, the area is used only as late
summer pasture due to extreme climate conditions. Generally,
grazing is less intensive compared to HUA.
The soils in both study areas are developed in sandy loess,
mixed with coarser material derived from frost weathering
processes. Poorly developed soils at site HUA are classified as
gleyic Fluvisols, haplic Regosols and mollic Cryosols, whereas
cambic Cryosols are common in WUD [41]. Alpine Kobresia
meadow ecosystems are the most common vegetation types on
the plateau [38] occurring at elevations ranging from 3200 to
5200 m a.s.l. [42]. At the study sites, particularly Kobresia
pygmaea and K. humilis are widespread. Plant composition is
similar at both sites, differing along the altitudinal gradient
according to water supply. Strongly rooted, partly felty topsoils
are common [43].
Field MethodsDuring May and June in 2009, 11 soil profiles were sampled
(HUA: 6, WUD: 5). All soil profiles were arranged along an
elevation gradient and affected by permafrost with an active layer
thickness less than 100 cm at both sites. At each site two soil
profiles in footslope position, two soil profiles in lower mid-slope
position and two (HUA) and one (WUD) soil profiles in upper
mid-slope position were sampled. We set a high value on the
comparability of both study sites in topographic position of the soil
profiles, inclination of the slopes and vegetative cover. Soil
sampling was split into three parts: horizon-wise sampling for
pedogenesis and soil chemical analyses using soil pits, schematic
sampling conducted by drilling at four depth-increments (0–5, 5–
10, 10–20 and 20–30 cm, four replicates each) for C analysis and
volumetric sampling at the same depths for bulk density and
gravimetric water content determination (three replicates each).
Detailed description of soil profiles and pedogenic implications will
be published elsewhere.
Laboratory AnalysisAll soil samples were air-dried and sieved to,2 mm. The pH of
the samples was measured in deionized water and in 0.01 M
CaCl2 solution at a solution:soil ratio of 2.5:1 with a glass electrode
(Sentix 81, WTW, pH 340). CaCO3 was analyzed gasvolume-
trically on ground subsamples (Calcimeter, Eijkelkamp). Total C
and N in bulk soil samples and density fractions were determined
on ground subsamples by heat combustion with a CNS analyzer
(Vario EL III, Elementar GmbH, Hanau, Germany). SOC in bulk
soils and density fractions was calculated as the difference between
soil total and soil inorganic carbon. Water content was determined
by gravimetric water content analysis, corrected by the skeleton
content (.2 mm).
Density fractionation was carried out using sodium polytung-
state, following the procedures of Grunewald et al. [44]. It is
generally accepted that the density of OM is ,1.5 g cm23. After
Golchin et al. [45] a density fractionation at 1.6 g cm23 separates
light organic fractions from mineral dominated heavy fractions
under the assumption, that most mineral particles contain less than
20% OM [46]. Three fractions were isolated: the light fractions
free particulate organic matter (FPOM) and occluded particulate
organic matter (OPOM) with a density ,1.6 g cm23, plus a heavy
fraction of mineral associated organic matter (MOM) with
a density of .1.6 g cm23. FPOM was separated by floatation
after gently shaking in a sodium polytungstate solution (soil:solu-
tion ratio 1:5) and centrifugation at 4,500 rpm for 20 min,
followed by vacuum filtration. OPOM was separated after
ultrasonic dispersion (58 J ml21) and centrifugation at 4,500 rpm
for 15 min. Calibration of the ultrasonic output energy was carried
out according to Roscoe et al. [47]. The remains (MOM) were
washed three times to remove the salt. Due to soil inhomogeneity
fractionation was carried out twice per sample. The dried and
ground fractions were analyzed for C, N and SOC. The density
solution was recycled after Six et al. [48]. SOC stocks for bulk soils
and individual fractions were calculated down to a depth of 30 cm,
according to Ohtsuka et al. [7]:
Soil Organic Carbon Pools and Stocks
PLOS ONE | www.plosone.org 2 February 2013 | Volume 8 | Issue 2 | e57024
SOC½kgm-2�~0:001:M:rB:SOC:(100{S)
where M is the soil layer thickness, rB is the bulk density (g cm23)
of the soil, SOC is the soil organic carbon content (Mass%) and S
is the skeleton content (Mass%).
Results
Soil Organic Carbon Content and SOC/N RatiosThe SOC content of bulk soil decreased with increasing
depth at both sites (Fig. 2). In HUA (51 g kg21) significantly
higher mean values were reached than in WUD (19 g kg21).
Highest contents occurred in the OPOM fractions (320 g kg21),
FPOM followed with 252 g kg21, while they were lowest in the
MOM fractions (29 g kg21). The SOC contents in the FPOM
decreased with depth, while there were increasing SOC values
in the OPOM fractions. The SOC contents of the MOM
fraction follow the same depth gradient as SOC in bulk soils at
both sites. Significantly higher SOC contents were found in this
fraction on site HUA, showing a large variation. The mean
recovery of SOC after density fractionation was 95%.
SOC/N ratios of the bulk soils were relatively similar at both
sites and decreased with depth (from 12 to 9) – except in extremely
moist soils in HUA, where the SOC/N-ratios remained constant
(13). The SOC/N ratios of the three fractions were remarkably
different. Highest ratios were found in FPOM with a mean
ranging from 15–36, followed by OPOM with 14–29. Generally,
lower SOC/N ratios occurred in MOM fractions (3–12). We
observed slightly rising SOC/N ratios with depth for the POM
fractions in all soils, whereas ratios varied less with depth for the
MOM fractions.
Soil Organic Carbon Stocks of Bulk Soil and FractionsTotal SOC stocks in HUA ranged from 1.9 kg m22 to 19.3 kg
m22 up to 30 cm depth with a mean of 10.4 kg m22 (Tab. 1).
Significantly lower stocks were found in WUD ranging from
2.5 kg m22 to 5.0 kg m22 (mean: 3.4 kg m22).
In line with the higher SOC contents, soils in HUA (0.41 kg
m22) showed twice as high stocks as in WUD in the top 5 cm
(Tab. 1). Fractional SOC stocks in particular depths were highest
in the MOM fraction. In WUD, stocks decreased with depth for
all three fractions whereas increasing SOC stocks in the OPOM
fraction in 20–30 cm depth were evident compared to 10–20 cm
depth at HUA.
Variations of the SOC stocks were much higher in HUA than in
WUD, especially in the light POM fractions (Tab. 1).The POM
fractions in HUA and WUD contributed 27% and 22% to the
SOC stocks with 8% in the OPOM fractions at both sites (Fig. 3).
Comprising the different depth levels, 53% of SOC is stored in the
upper 10 cm in WUD. In HUA only 39% is stored in the upper
10 cm and the portion of FPOM on SOC stocks remained
constant with depth, while the portion of OPOM increased. The
portion of FPOM on SOC stocks decreased slightly, whereas
OPOM stocks increased with depth in WUD. The portion of
MOM stock remained relatively constant at 77%, thus slightly
higher than in HUA.
Correlations between Soil Organic Carbon Stocks, ActiveLayer Thickness and Soil MoistureTo assess the influence of soil hydrological properties on
SOC stocks, active layer thickness and soil moisture content
were taken into account. Since we did not reach the maximum
active layer depth in May/June 2009, we used active layer and
corresponding soil moisture data from August/September 2011.
A significant correlation between SOC stocks and soil moisture
can be confirmed for both study sites (Fig. 4). Soil moisture in
HUA varies from 7 to almost 56 Vol. % with a high correlation
Figure 1. Location of the study sites on the Tibetan Plateau.doi:10.1371/journal.pone.0057024.g001
Soil Organic Carbon Pools and Stocks
PLOS ONE | www.plosone.org 3 February 2013 | Volume 8 | Issue 2 | e57024

of R2= 0.74 between SOC stocks and soil moisture. The range
in WUD is smaller with values between 11 and 50 Vol. % soil
moisture and a weak correlation (R2 = 0.05).
An inverse correlation can be observed for active layer
thickness and soil moisture (Fig. 5). The mean thaw depth at
both locations is similar (HUA: 97 cm, WUD: 99 cm).
Contrarily, the range differs distinctly, with a variation co-
efficient of 22.0 in HUA and 15.8 in WUD. The interrelation
between active layer thickness and SOC stocks is positive for
site HUA with R2= 0.77. For site WUD, similar significant
correlations could not be detected.
Discussion
Soil Organic Carbon ContentSOC contents decreased with soil depth at both locations in all
soil profiles. At site HUA, however, much higher overall values
were found than in WUD. The more humid, partly water logging
conditions inhibit microbial decomposition processes [49] leading
in combination with a more dense vegetation cover to a larger
accumulation of organic matter.
Concerning the relative amount of OM fractions, our findings
are in line with the results of Golchin et al. [50], who found
higher SOC contents in the OPOM than in the FPOM and
MOM fractions as well. Wang et al. [33] isolated a light
Figure 2. Fractional soil organic carbon (SOC) contents of four different depth increments at Huashixia (HUA, left, n =40) undWudaoliang (WUD, right, n =32).doi:10.1371/journal.pone.0057024.g002
Soil Organic Carbon Pools and Stocks
PLOS ONE | www.plosone.org 4 February 2013 | Volume 8 | Issue 2 | e57024

fraction (LF) and a heavy fraction (HF) using a 1.8 g cm23
density solution. In LF SOC contents of 290 g kg21 (0–10 cm)
and 260 g kg21 (10–20 cm), for HF 30 g kg21 (0–10 cm) and
40 g kg21 (10–20 cm) were found. The comparably slightly
lower SOC contents in the LF may reflect the influence of the
MOM fraction. However, the comparison is difficult, because
different density ranges for the fractionation were used [33].
SOC in FPOM and MOM decreased with depth, whereas the
contents of the OPOM fractions increased slightly at both sites.
Larger aggregates composed of coarse textured OPOM with
a lower degree of decomposition were present in the depth
increment 0–10 cm. A reduction of particle size with depth was
clearly observable during the fractionation process. Even though
the SOC content was relatively small compared with the POM
fractions, the portion of total SOC stored in OPOM is large
(Fig. 2).
OC/N RatiosOC/N ratios of bulk soil decreased with depth indicating
a higher age and grade of humification in the subsoil [51]. SOC/N
ratios in water-saturated soils in HUA remained relatively stable
with depth indicating inhibited decomposition processes. The
highest SOC/N ratios with depth were found in the FPOM
fraction followed by OPOM and MOM. Comparable results were
reported by Grunewald et al. [44] and John et al. [52], who also
observed decreasing SOC/N ratios with depth from FPOM.O-
POM.MOM for all soils, indicating an increasing degree of OM
degradation and humification. Golchin et al. [50] observed higher
ratios for OPOM than for FPOM, whereas Kolbl and Kogel-
Knabner [53] found no differences between both fractions.
OC/N ratios in FPOM showed little variations with depth,
while the portion of carbon content decreases. Further, we
observed a decrease in particle size in the POM fractions during
the fractionation that may also contribute to a shift in the SOC/N
ratio with depth. The very low SOC/N ratios in MOM fractions
suggest a generally larger contribution of microbial biomass and,
Table 1. Max, Min, Mean values and standard deviations of total (A) and fractional (B) soil organic carbon stocks.
HUA WUD
Depth [cm] FPOM OPOM MOM S OM FPOM OPOM MOM S OM
A. Total soil organic carbon stocks
0–30 Mean [kg m22]SD
1.9(2.1)
0.9(0.9)
7.6(4.5)
10.4(7.1)
0.5(0.2)
0.3(0.1)
2.7(0.6)
3.4(0.8)
0–30 Max [kg m22] 5.0 2.4 12.9 19.3 0.7 0.4 3.9 5.0
0–30 Min [kg m22] 0.2 0.1 1.5 1.9 0.2 0.2 2.2 2.5
B. Fractional soil organic carbon stocks
0–5 Mean [kg m22]SD
0.41(0.25)
0.10(0.05)
1.62(0.58)
2.15(0.83)
0.18(0.10)
0.08(0.03)
0.87(0.19)
1.14(0.29)
5–10 Mean [kg m22]SD
0.39(0.38)
0.16(0.13)
1.34(0.79)
1.90(1.24)
0.08(0.04)
0.05(0.01)
0.50(0.16)
0.64(0.20)
10–20 Mean [kg m22]SD
0.58(0.75)
0.26(0.31)
2.45(1.77)
3.30(2.60)
0.12(0.08)
0.08(0.03)
0.65(0.27)
0.87(0.37)
20–30 Mean [kg m22]SD
0.56(0.80)
0.36(0.46)
2.14(1.71)
3.07(2.88)
0.08(0.05)
0.07(0.02)
0.57(0.18)
0.73(0.24)
HUA: Huashixia (A: n = 24; B: n = 7), WUD: Wudaoliang (A: n = 20; B: n = 6). FPOM: free particulate organic matter, OPOM: occluded particulate organic matter, MOM:mineral-associated organic matter, S OM: Total organic matter. SD: standard deviation.doi:10.1371/journal.pone.0057024.t001
Figure 3. Portion of fractional soil organic carbon (SOC) stocks on total soil organic carbon stocks in particular depth at Huashixia(HUA, top) and Wudaoliang (WUD, bottom).doi:10.1371/journal.pone.0057024.g003
Soil Organic Carbon Pools and Stocks
PLOS ONE | www.plosone.org 5 February 2013 | Volume 8 | Issue 2 | e57024
hence, stronger microbial decomposition of plant debris than for
POM fractions. The contribution of inorganic N to the total N
content – resulting in a very low SOC/N ratio – cannot be
excluded.
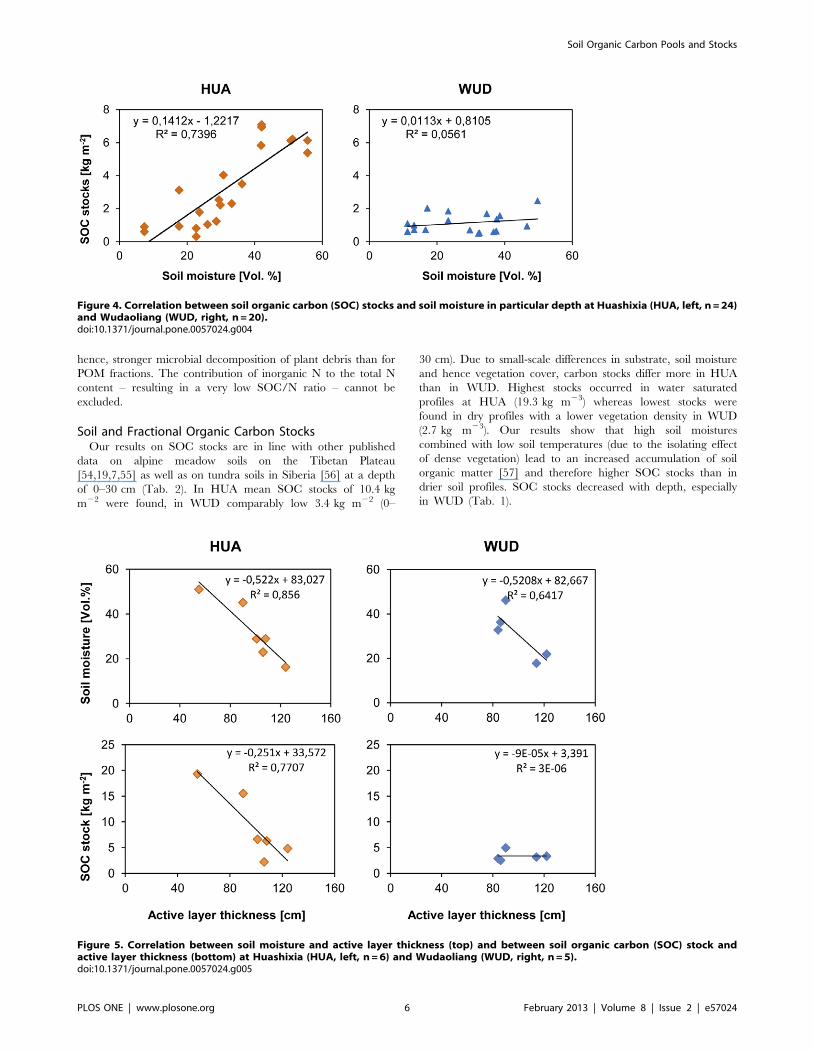
Soil and Fractional Organic Carbon StocksOur results on SOC stocks are in line with other published
data on alpine meadow soils on the Tibetan Plateau
[54,19,7,55] as well as on tundra soils in Siberia [56] at a depth
of 0–30 cm (Tab. 2). In HUA mean SOC stocks of 10.4 kg
m22 were found, in WUD comparably low 3.4 kg m22 (0–
30 cm). Due to small-scale differences in substrate, soil moisture
and hence vegetation cover, carbon stocks differ more in HUA
than in WUD. Highest stocks occurred in water saturated
profiles at HUA (19.3 kg m23) whereas lowest stocks were
found in dry profiles with a lower vegetation density in WUD
(2.7 kg m23). Our results show that high soil moistures
combined with low soil temperatures (due to the isolating effect
of dense vegetation) lead to an increased accumulation of soil
organic matter [57] and therefore higher SOC stocks than in
drier soil profiles. SOC stocks decreased with depth, especially
in WUD (Tab. 1).
Figure 4. Correlation between soil organic carbon (SOC) stocks and soil moisture in particular depth at Huashixia (HUA, left, n =24)and Wudaoliang (WUD, right, n =20).doi:10.1371/journal.pone.0057024.g004
Figure 5. Correlation between soil moisture and active layer thickness (top) and between soil organic carbon (SOC) stock andactive layer thickness (bottom) at Huashixia (HUA, left, n =6) and Wudaoliang (WUD, right, n =5).doi:10.1371/journal.pone.0057024.g005
Soil Organic Carbon Pools and Stocks
PLOS ONE | www.plosone.org 6 February 2013 | Volume 8 | Issue 2 | e57024

The comparison of fractional SOC stocks with the results of
other published research is challenging, as different density
ranges and fractionation methods are used and the number of
studies on the Tibetan Plateau is limited. Compared to other
grassland ecosystems like steppe soils in Ukraine and Kazakh-
stan [58] and grassland soils in Saxony-Anhalt, Germany [52],
in this study significantly higher portions of FPOM and OPOM
on SOC stocks were found. About 18% of the total contents in
HUA and 14% in WUD were contributed by the FPOM
fraction. The OPOM portions were the same at both sites (8%)
and the MOM fractions contributed 74 and 78% to the total
SOC stocks (Fig. 3). Due to lower litter production in WUD,
lower fraction masses and SOC contents led to lower portions
of POM on total SOC stocks (Fig. 3). At site HUA the share of
FPOM remained relatively constant with depth, while the stocks
in WUD were decreasing. The share of OPOM increased at
both sites with increasing depth. The increase in OPOM stocks
was linked also to the increasing SOC content of the fractions
with increasing depth.
The limitation of water caused a lower turnover of organic
matter at very dry profile sites in HUA and WUD. This resulted in
a relatively high share of FPOM on SOC with small portions of
OPOM similar to desert soils investigated by Kadono et al. [58].
The largest FPOM and OPOM shares were found in water-
saturated profiles at site HUA with a contribution of 39% of the
POM fractions to the SOC stocks since further degradation of
SOM is strongly inhibited there.
Our results are comparable to studies in Siberia [59] and the
Tibetan Plateau [36,33]. Wang et al. [36] isolated a light and
heavy fraction (1.85 g cm23 density solution) without distinction
between FPOM and OPOM. In this case only trends can be
compared with our results. The LF contained 7 kg m22 and thus
about 37–44% of SOC from 0–30 cm depth. Altogether, SOC
stocks comprised 9.81 kg m22 at a depth of 30 cm. Wang et al.
[33] isolated LF and HF with a density range of 1.8 g cm23. They
found a SOC stock of 7.5 kg m22 at a depth of 0–20 cm, with
0.8 kg m22 in LF and 2.8 kg m22 in HF in the upper 10 cm.
0.4 kg m22 in LF and 3.5 kg m22 in HF were contained in 10–
20 cm depth.
Correlation between Organic Carbon Stocks, Active LayerThickness and Soil MoistureSimilar mean active layer thicknesses are evident at both sites,
but significantly larger variations were observed in HUA. These
spatial dynamics are related to small scale changes in substrate,
bulk density, soil moisture values [6] and hence in vegetation
coverage leading to larger active layer thicknesses. Patches of
dense vegetation have an isolating effect, protecting permafrost
from thawing [33,20] resulting in shallower active layer depths.
The detected thawing depths of 55–124 cm in HUA and 84–
122 cm in WUD correspond to the range of the maximum
thawing depths of 80–150 cm near WUD in September published
by Wang et al. [36]. Yang et al. [19] and Baumann et al. [6]
showed, that soil moisture affects significantly extension and
distribution of carbon stocks on the Tibetan Plateau, as we found
as well. Soil moisture, active layer thickness and carbon stocks
correlated strongly at HUA (Fig. 4 and 5). As a consequence of the
moist to water-saturated conditions and the dense vegetation
cover, a higher amount of organic matter is accumulated in HUA
compared to WUD, where a lower litter input due to the shorter
growing season and drier conditions accelerating mineralization,
are prominent. In WUD we found no correlation between soil
moisture and SOC stocks as well as between SOC stocks and
active layer thickness.
ConclusionsIn this paper we investigated the interactions of SOC stocks and
the proportion of light and heavy SOC fractions with soil moisture
and active layer thickness in permafrost-affected soils on the
Tibetan Plateau. Furthermore, the affiliation of SOC stocks into
different SOC pools was examined. The research sites are located
in both continuous (WUD) and discontinuous (HUA) permafrost
areas.
SOC stocks, soil moisture, and active layer thickness correlated
strongly in discontinuous permafrost, whereas no correlation
between SOC stocks and active layer thickness and only a weak
relation between SOC stocks and soil moisture could be detected
for continuous permafrost. Organic carbon contents and SOC
stocks were remarkably lower under continuous permafrost
conditions. We conclude that drier soil conditions and a shorter
Table 2. Comparison of soil organic carbon (SOC) stocks in high-altitude and high-latitude permafrost-affected ecosystems.
Study Mean SOC stocks [kg m22]Depth [cm] Ecosystem type Region
Post et al. (1982) [4] 21.8 100 Tundra
Gundelwein et al. (2007) [59] 30.7 100 Tussock Tundra Siberia, Russia
Jobbagy and Jackson (2000) [1] 14.2 100 Tundra Canada
Uhlirova et al. (2007) [56] 16.3 30 Tussock Tundra Siberia, Russia
Wang et al. (2008) [54] 9.3 30 Alpine steppe Tibetan Plateau, China
9.8 30 Alpine meadow Tibetan Plateau, China
10.7 30 Alpine swamp meadow Tibetan Plateau, China
Yang et al. (2008) [19] 6.2 30 Alpine meadow Tibetan Plateau, China
Ohtsuka et al. (2008) [7] 2.6 to 13.7 30 Alpine meadow Tibetan Plateau, China
Wang et al. (2002) [5] 53.1 75 Alpine meadow Qinghai, China
29.0 75 Alpine meadow Tibet, China
Yang et al. (2010) [26] 9.2 40 Alpine meadow Tibetan Plateau, China
12.4 100 Alpine meadow Tibetan Plateau, China
This study 3.4 to 10.4 30 Alpine meadow Tibetan Plateau, China
doi:10.1371/journal.pone.0057024.t002
Soil Organic Carbon Pools and Stocks
PLOS ONE | www.plosone.org 7 February 2013 | Volume 8 | Issue 2 | e57024

vegetation period compared to areas with discontinuous perma-
frost account for this. Moreover, these soils contain higher portions
of easily decomposable POM fractions.
Although the POM fractions comprise only a small portion of
the organic carbon mass balance, they contribute a large pro-
portion on SOC stocks due to their high SOC contents. These
results show that different POM fractions play specific roles under
the scope of climate change: light POM fractions have short
turnover rates and are particularly vulnerable to increasing
temperatures in terms of potential CO2 and CH4 emission from
soils.
Acknowledgments
We thank Yang Xiaoxia and Mi Zhaorong (NWIPB, CAS, China) for
supporting the field campaign and Christian Wolf, Kathrin Drechsel and
Sabine Flaiz (University of Tuebingen, Germany) for their assistance
during laboratory analyses.
Author Contributions
Conceived and designed the experiments: CD FB. Performed the
experiments: CD FB. Analyzed the data: CD. Wrote the paper: CD PK
FB JSH TS.
References
1. Jobbagy EG, Jackson RB (2000) The vertical distribution of soil organic carbon
and its relation to climate and vegetation. Ecological Applications 10 (2): 423–
436.
2. Bockheim JG, Hinkel KM, Nelson FE (2003) Predicting Carbon Storage in
Tundra Soils of Arctic Alaska. Soil Sci. Soc. Am. J 67 (3): 948–950. Available:
https://www.crops.org/publications/sssaj/abstracts/67/3/948.
3. Callesen I, Listi J, Raulund-Rasmussen K, Olsson MT, Tau-Strand L, et al.
(2003) Soil carbon stores in Nordic well-drained forest soils - relationships with
climate and texture class. Global Change Biology 9: 358–370.
4. Post WM, Emanuel WR, Zinke PJ, Stangenberger AG (1982) Soil carbon pools
and world life zones. Nature 298: 156–159.
5. Wang G, Qian J, Cheng G, Lai Y (2002) Soil organic carbon pool of grassland
soils on the Qinghai-Tibetan Plateau and its global implication. The Science of
the Total Environment 291: 207–217.
6. Baumann F, He J, Schmidt K, Kuhn P, Scholten T (2009) Pedogenesis,
permafrost, and soil moisture as controlling factors for soil nitrogen and carbon
contents across the Tibetan Plateau. Global Change Biology 15 (12): 3001–3017.
Available: http://dx.doi.org/10.1111/j.1365-2486.2009.01953.x.
7. Ohtsuka T, Hirota M, Zhang X, Shimono A, Senga Y, et al. (2008) Soil organic
carbon pools in alpine to nival zones along an altitudinal gradient (4400–
5300 m) on the Tibetan Plateau. Polar Science 2 (4): 277–285.
8. Zhang Y, Tang Y, Jiang J, Yang Y (2007) Characterizing the dynamics of soil
organic carbon in grasslands on the Qinghai-Tibetan Plateau. Science in China
Series D: Earth Sciences 50 (1): 113–120.
9. Luo T, Li W, Zhu H (2002) Estimated biomass and productivity of natural
vegetation on the Tibetan plateau. Ecological Applications 12 (4): 980–997.
doi:10.1890/1051-0761(2002)012[0980:EBAPON]2.0.CO.
10. Kirschbaum MUF (1995) The temperature dependence of soil organic matter
decomposition, and the effect of global warming on soil organic C storage. Soil
Biology & Biochemistry 27 (6): 753–760.
11. Wagner D, Liebner S (2009) Global Warming and Carbon Dynamics in
Permafrost Soils: Methane Production and Oxidation. In: Margesin R, editor.
Permafrost Soils. Berlin/Heidelberg: Springer. 219–236.
12. Tarnocai C, Canadell JG, Schuur EAG, Kuhry P, Mazhitova G, et al. (2009)
Soil organic carbon pools in the northern circumpolar permafrost region. Global
Biogeochem. Cycles 23 (2): GB2023. Available: http://dx.doi.org/10.1029/
2008GB003327.
13. Grosse G, Romanovsky V, Jorgenson T, Anthony KW, Brown J, et al. (2011)
Vulnerability and Feedbacks of Permafrost to Climate Change. Eos Trans. AGU
92 (9): 73–74. doi:10.1029/2011EO090001.
14. Schuur EAG, Bockheim J, Canadell JG, Euskirchen E, Field CB, et al. (2008)
Vulnerability of Permafrost Carbon to Climate Change: Implications for the
Global Carbon Cycle. BioScience 58 (8): 701–714.
15. Torn MS, Trumbore SE, Chadwick OA, Vitousek PM, Hendricks DM (1997)
Mineral control of soil organic carbon storage and turnover. Nature 389 (6647):
170–173. Available: http://dx.doi.org/10.1038/38260.
16. Trumbore S (2006) Carbon respired by terrestrial ecosystems – recent progress
and challenges. Global Change Biology 12 (2): 141–153.
17. Lutzow M, Kogel-Knabner I, Ekschmitt K, Flessa H, Guggenberger G, et al.
(2007) SOM fractionation methods: Relevance to functional pools and to
stabilization mechanisms. Soil Biology and Biochemistry 39: 2183–2207.
18. Du Zheng, Zhang Q, Wu S (2000) Mountain geoecology and sustainable
development of the Tibetan Plateau. Dordrecht/Boston: Kluwer Academic
Publishers.
19. Yang Y, Fang J, Tang Y, Ji C, Zheng C, et al. (2008) Storage, patterns and
controls of soil organic carbon in the Tibetan grasslands. Global Change Biology
14: 1592–1599.
20. Zhao L, Cheng G, Li S, Zhao X, Wang S (2000) Thawing and freezing processes
of active layer in Wudaoliang region of Tibetan Plateau. Chinese Science
Bulletin 45: 2181–2187.
21. Kang SXY, You Q, Flugel W, Pepin N, Yao T (2010) Review of climate and
cryospheric change in the Tibetan Plateau. Environ. Res. Lett. 5: 1–8.
22. Jin H, Zhao L, Wang S, Jin R (2006) Thermal regimes and degradation modes
of permafrost along the Qinghai-Tibet Highway. Science in China Series D:
Earth Sciences 49 (11): 1170–1183.
23. Yang M, Wang S, Yao T, Gou X, Lu A, et al. (2004) Desertification and its
relationship with permafrost degradation in Qinghai-Xizang (Tibet) plateau.
Cold Regions Science and Technology 39: 47–53.
24. Cheng G, Wu T (2007) Responses of permafrost to climate change and their
environmental significance, Qinghai-Tibet Plateau. J. Geophys. Res 112:
F02S03. doi:10.1029/2006JF000631.
25. Nan Z, Li S, Cheng G (2005) Prediction of permafrost distribution on the
Qinghai-Tibet Plateau in the next 50 and 100 years. Science in China Series D:
Earth Sciences 48 (6): 797–804.
26. Yang M, Nelson FE, Shiklomanov NI, Guo D, Wan G (2010) Permafrost
degradation and its environmental effects on the Tibetan Plateau: A review of
recent research. Earth-Science Reviews 103 (1–2): 31–44. Available: http://
www.sciencedirect.com/science/article/pii/S0012825210000826.
27. Wang B, French HM (1995) Permafrost on the Tibet Plateau, China.
Quaternary Science Reviews 14: 255–274.
28. Zhang T (2005) Historical Overview of Permafrost Studies in China. Physical
Geography 26 (4): 279–298. Available: http://dx.doi.org/10.2747/0272-3646.
26.4.279.
29. Davidson EA, Janssens IA (2006) Temperature sensitivity of soil carbon
decomposition and feedbacks to climate change. Nature 440 (7081): 165–173.
Available: http://dx.doi.org/10.1038/nature04514.
30. Saito M, Kato T, Tang Y (2009) Temperature controls ecosystem CO2
exchange of an alpine meadow on the northeastern Tibetan Plateau. Global
Change Biology 15: 221–228.
31. Kirschbaum MUF (2006) The temperature dependence of organic-matter
decomposition – still a topic of debate. Soil Biology & Biochemistry 38: 2510–
2518.
32. Geng Y, Wang Z, Liang C, Fang J, Baumann F, et al. (2012) Soil Respiration in
Tibetan Alpine Grasslands: Belowground Biomass and Soil Moisture, but Not
Soil Temperature, Best Explain the Large-Scale Patterns. PLoS ONE 7 (4):
e34968. doi:10.1371/journal.pone.0034968.
33. Wang WY, Wang QJ, Lu ZY (2009) Soil organic carbon and nitrogen content of
density fractions and effect of meadow degradation to soil carbon and nitrogen
of fractions in alpine Kobresia meadow. Science in China Series D: Earth
Sciences 52 (5): 660–668. Available: http://dx.doi.org/10.1007/s11430-009-
0056-5.
34. Geng Y, Wang Z, Liang C, Fang J, Baumann F, et al. (2012) Effect of
geographical range size on plant functional traits and the relationships between
plant, soil and climate in Chinese grasslands. Global Ecology and Biogeography:
no. Available: http://dx.doi.org/10.1111/j.1466-8238.2011.00692.x.
35. Ni J (2002) Carbon storage in grasslands of China. Journal of Arid Environments
50: 205–218.
36. Wang G, Li Y, Hu H, Wang Y (2008) Synergistic effect of vegetation and air
temperature changes on soil water content in alpine frost meadow soil in the
permafrost region of Qinghai-Tibet. Hydrological Processes 22: 3310–3320.
37. Weischet W, Endlicher W (2000) Regionale Klimatologie Teil 2. Stuttgart:
Schweizerbart’sche Verlagsbuchhandlung.
38. Zhou H, Zhao X, Tang Y, Gu S, Zhou L (2005) Alpine grassland degradation
and its control in the source regions of the Yangtze and the Yellow Rivers,
China. Grassland Science 51: 191–203.
39. Jin H, Li S, Cheng G, Shaoling W, Li X (2000) Permafrost and climatic change
in China. Global and Planetary Change 26: 387–404.
40. Wang G, Wang Y, Li Y, Cheng H (2007) Influences of alpine ecosystem
responses to climatic change on soil properties on the Qinghai-Tibet Plateau,
China. Catena 70 (3): 506–514.
41. IUSS Working Group WRB. 2007. World Reference Base for Soil Resources
2006, first update 2007. World Soil Resources Reports No. 103. FAO, Rome.
42. Kato T, Tang Y, Gu S, Cui X, Hirota M, et al. (2004) Carbon dioxide exchange
between the atmosphere and an alpine meadow ecosystem on the Qinghai–
Tibetan Plateau, China. Agricultural and forest meteorology 124 (1–2): 121–
134. Available: http://www.sciencedirect.com/science/article/pii/
S0168192304000024.
43. Kaiser K, Miehe G, Barthelmes A (2008) Turf-bearing topsoils on the central
Tibetan Plateau, China: Pedology, botany, geochronology. Catena 73 (3): 300–
311.
Soil Organic Carbon Pools and Stocks
PLOS ONE | www.plosone.org 8 February 2013 | Volume 8 | Issue 2 | e57024

44. Grunewald G, Kaiser K, Jahn R, Guggenberger G (2006) Organic matter
stabilization in young calcareous soils as revealed by density fractionation andanalysis of lignin-derived constituents. Organic Geochemistry 37: 1573–1589.
45. Golchin A, Oades JM, Skemstad J, Clarke P (1994) Study of free and occluded
organic matter in soils by 13C CP/MAS NMR spectroscopy and scanningelectron microscopy. Australian Journal of Soil Research (32): 285–309.
46. Christensen B (1992) Physical fractionation of soil and organic matter in primaryparticle size and density separates. Advances in Soil Science (20): 1–90.
47. Roscoe R, Buurman P, Velthorst EJ (2000) Disruption of soil aggregates by
varied amounts of ultrasonic energy in fractionation of organic matter of a clayLatosol: carbon, nitrogen and d13C distribution in particle-size fractions.
European Journal of Soil Science 51: 445–454.48. Six J, Schultz PA, Jastrow JD, Merckx R (1999) Recycling of sodium
polytungstate used in soil organic matter studies. Soil Biology & Biochemistry31: 1193–1196.
49. Wagner D, Kobabe S, Liebner S (2009) Bacterial community structure and
carbon turnover in permafrost-affected soils of the Lena Delta, northeasternSiberia. Canadian Journal of Microbiology 55 (1): 73–83. Available: http://dx.
doi.org/10.1139/W08-121.50. Golchin A, Oades JM, Skjemstad J, Clarke P (1995) Structural and dynamic
properties of soil organic-matter as reflected by 13C natural-abundance,
pyrolysis mass-spectrometry and solid-state 13C NMR-spectroscopy in densityfractions of an oxisol under forest and pasture. Australian Journal of Soil
Research 33: 59–76. Available: http://dx.doi.org/10.1071/SR9950059.51. Callesen I, Raulund-Rasmussen K, Westman C, Tau-Strand L (2007) Nitrogen
pools and C:N ratios in well-drained Nordic forest soils related to climate andsoil texture. Boreal Environment Research 12 (6): 681–692.
52. John B, Yamashita T, Ludwig B, Flessa H (2005) Storage of organic carbon in
aggregate and density fractions of silty soils under different types of land use.Geoderma 128: 63–79.
53. Kolbl A, Kogel-Knabner I (2004) Content and composition of free and occluded
particulate organic matter in a differently textured arable Cambisol as revealedby solid-state 13C NMR spectroscopy. Journal of Plant Nutrition and Soil
Science 167 (1): 45–53. doi:10.1002/jpln.200321185.54. Wang G, Li Y, Wang Y, Wu Q (2008) Effects of permafrost thawing on
vegetation and soil carbon losses on the Qinghai-Tibet Plateau, China.
Geoderma 143: 143–152.55. Yang YH, Fang JY, Guo DL, Ji CJ, Ma WH (2010) Vertical patterns of soil
carbon, nitrogen and carbon: nitrogen stoichiometry in Tibetan grasslands.Biogeosciences Discuss. 7: 1–24.
56. Uhlirova E, Santruckova H, Davidov SP (2007) Quality and potentialbiodegradability of soil organic matter preserved in permafrost of Siberian
tussock tundra. Soil Biology & Biochemistry 39: 1978–1989.
57. Wang G, Wang Y, Qian J, Wu Q (2006) Land cover change and its impact onsoil C and N in two watersheds in the center of the Qinghai-Tibetan Plateau.
Mountain Research and Development 26 (2): 153–162.58. Kadono A, Funakawa S, Kosaki T (2008) Factors controlling mineralization of
soil organic matter in the Eurasian steppe. Soil Biology and Biochemistry 40 (4):
947–955. Available: http://www.sciencedirect.com/science/article/pii/S0038071707004567.
59. Gundelwein A, Muller-Lupp T, Sommerkorn M, Haupt ETK, Pfeiffer E, et al.(2007) Carbon in tundra soils in the Lake Labaz region of arctic Siberia.
European Journal of Soil Science 58 (5): 1164–1174. Available: http://dx.doi.org/10.1111/j.1365-2389.2007.00908.x.
Soil Organic Carbon Pools and Stocks
PLOS ONE | www.plosone.org 9 February 2013 | Volume 8 | Issue 2 | e57024