Estimating the near-surface permafrost-carbon feedback on global warming
17
Biogeosciences, 9, 649–665, 2012 www.biogeosciences.net/9/649/2012/ doi:10.5194/bg-9-649-2012 © Author(s) 2012. CC Attribution 3.0 License. Biogeosciences Estimating the near-surface permafrost-carbon feedback on global warming T. Schneider von Deimling 1 , M. Meinshausen 1,2 , A. Levermann 1,5 , V. Huber 1 , K. Frieler 1 , D. M. Lawrence 3 , and V. Brovkin 4,1 1 Potsdam Institute for Climate Impact Research, Potsdam, Germany 2 School of Earth Sciences, The University of Melbourne, Victoria, Australia 3 Climate and Global Dynamics Division, National Center for Atmospheric Research, Boulder, Colorado, USA 4 Max Planck Institute for Meteorology, Hamburg, Germany 5 Potsdam University, Potsdam, Germany Correspondence to: T. Schneider von Deimling ([email protected]) Received: 1 March 2011 – Published in Biogeosciences Discuss.: 12 May 2011 Revised: 20 November 2011 – Accepted: 6 January 2012 – Published: 3 February 2012 Abstract. Thawing of permafrost and the associated release of carbon constitutes a positive feedback in the climate sys- tem, elevating the effect of anthropogenic GHG emissions on global-mean temperatures. Multiple factors have hin- dered the quantification of this feedback, which was not in- cluded in climate carbon-cycle models which participated in recent model intercomparisons (such as the Coupled Carbon Cycle Climate Model Intercomparison Project – C 4 MIP) . There are considerable uncertainties in the rate and extent of permafrost thaw, the hydrological and vegetation response to permafrost thaw, the decomposition timescales of freshly thawed organic material, the proportion of soil carbon that might be emitted as carbon dioxide via aerobic decompo- sition or as methane via anaerobic decomposition, and in the magnitude of the high latitude amplification of global warming that will drive permafrost degradation. Addition- ally, there are extensive and poorly characterized regional heterogeneities in soil properties, carbon content, and hydrol- ogy. Here, we couple a new permafrost module to a reduced complexity carbon-cycle climate model, which allows us to perform a large ensemble of simulations. The ensemble is designed to span the uncertainties listed above and thereby the results provide an estimate of the potential strength of the feedback from newly thawed permafrost carbon. For the high CO 2 concentration scenario (RCP8.5), 33–114 GtC (giga tons of Carbon) are released by 2100 (68 % uncertainty range). This leads to an additional warming of 0.04–0.23 ◦ C. Though projected 21st century permafrost carbon emissions are relatively modest, ongoing permafrost thaw and slow but steady soil carbon decomposition means that, by 2300, about half of the potentially vulnerable permafrost carbon stock in the upper 3 m of soil layer (600–1000 GtC) could be released as CO 2 , with an extra 1–4 % being released as methane. Our results also suggest that mitigation action in line with the lower scenario RCP3-PD could contain Arctic temperature increase sufficiently that thawing of the permafrost area is limited to 9–23 % and the permafrost-carbon induced tem- perature increase does not exceed 0.04–0.16 ◦ C by 2300. 1 Introduction The climate response to anthropogenic greenhouse gas emis- sions is markedly influenced by internal Earth system feed- backs. Carbon cycle feedbacks (Cramer et al., 2001; Friedlingstein et al., 2006; Sitch et al., 2008) are among the most prominent examples of such internal feedbacks, where an initial increase in temperature triggers a reaction from land biomass and soils that leads to increased carbon emis- sions, which in turn amplifies the warming. The strength of this carbon cycle – climate feedback (γ L ) is generally mea- sured as cumulative carbon release (or reduced uptake) per degree of warming. This average land carbon sensitivity γ L is +79 GtC ◦ C -1 up to 2100 across the C 4 MIP generation of carbon cycle models (Friedlingstein et al., 2006) under the high A2 forcing scenario (Special Report on Emission Published by Copernicus Publications on behalf of the European Geosciences Union.
-
Upload
pik-potsdam -
Category
Documents
-
view
3 -
download
0
Transcript of Estimating the near-surface permafrost-carbon feedback on global warming

Biogeosciences, 9, 649–665, 2012www.biogeosciences.net/9/649/2012/doi:10.5194/bg-9-649-2012© Author(s) 2012. CC Attribution 3.0 License.
Biogeosciences
Estimating the near-surface permafrost-carbon feedback on globalwarming
T. Schneider von Deimling1, M. Meinshausen1,2, A. Levermann1,5, V. Huber1, K. Frieler 1, D. M. Lawrence3, andV. Brovkin 4,1
1Potsdam Institute for Climate Impact Research, Potsdam, Germany2School of Earth Sciences, The University of Melbourne, Victoria, Australia3Climate and Global Dynamics Division, National Center for Atmospheric Research, Boulder, Colorado, USA4Max Planck Institute for Meteorology, Hamburg, Germany5Potsdam University, Potsdam, Germany
Correspondence to:T. Schneider von Deimling ([email protected])
Received: 1 March 2011 – Published in Biogeosciences Discuss.: 12 May 2011Revised: 20 November 2011 – Accepted: 6 January 2012 – Published: 3 February 2012
Abstract. Thawing of permafrost and the associated releaseof carbon constitutes a positive feedback in the climate sys-tem, elevating the effect of anthropogenic GHG emissionson global-mean temperatures. Multiple factors have hin-dered the quantification of this feedback, which was not in-cluded in climate carbon-cycle models which participated inrecent model intercomparisons (such as the Coupled CarbonCycle Climate Model Intercomparison Project – C4MIP) .There are considerable uncertainties in the rate and extentof permafrost thaw, the hydrological and vegetation responseto permafrost thaw, the decomposition timescales of freshlythawed organic material, the proportion of soil carbon thatmight be emitted as carbon dioxide via aerobic decompo-sition or as methane via anaerobic decomposition, and inthe magnitude of the high latitude amplification of globalwarming that will drive permafrost degradation. Addition-ally, there are extensive and poorly characterized regionalheterogeneities in soil properties, carbon content, and hydrol-ogy. Here, we couple a new permafrost module to a reducedcomplexity carbon-cycle climate model, which allows us toperform a large ensemble of simulations. The ensemble isdesigned to span the uncertainties listed above and therebythe results provide an estimate of the potential strength ofthe feedback from newly thawed permafrost carbon. Forthe high CO2 concentration scenario (RCP8.5), 33–114 GtC(giga tons of Carbon) are released by 2100 (68 % uncertaintyrange). This leads to an additional warming of 0.04–0.23◦C.Though projected 21st century permafrost carbon emissions
are relatively modest, ongoing permafrost thaw and slow butsteady soil carbon decomposition means that, by 2300, abouthalf of the potentially vulnerable permafrost carbon stock inthe upper 3 m of soil layer (600–1000 GtC) could be releasedas CO2, with an extra 1–4 % being released as methane. Ourresults also suggest that mitigation action in line with thelower scenario RCP3-PD could contain Arctic temperatureincrease sufficiently that thawing of the permafrost area islimited to 9–23 % and the permafrost-carbon induced tem-perature increase does not exceed 0.04–0.16◦C by 2300.
1 Introduction
The climate response to anthropogenic greenhouse gas emis-sions is markedly influenced by internal Earth system feed-backs. Carbon cycle feedbacks (Cramer et al., 2001;Friedlingstein et al., 2006; Sitch et al., 2008) are among themost prominent examples of such internal feedbacks, wherean initial increase in temperature triggers a reaction fromland biomass and soils that leads to increased carbon emis-sions, which in turn amplifies the warming. The strength ofthis carbon cycle – climate feedback (γL) is generally mea-sured as cumulative carbon release (or reduced uptake) perdegree of warming. This average land carbon sensitivityγLis +79 GtC◦C−1 up to 2100 across the C4MIP generationof carbon cycle models (Friedlingstein et al., 2006) underthe high A2 forcing scenario (Special Report on Emission
Published by Copernicus Publications on behalf of the European Geosciences Union.

650 T. Schneider von Deimling et al.: Estimating the permafrost-carbon feedback
Scenarios–SRES). Additional release of carbon from newlythawed permafrost, referred to as “permafrost-carbon feed-back” in the following, would add to this land carbon feed-back. At present, the release of additional carbon to the at-mosphere as carbon dioxide or methane due to the thawingof permafrost and the subsequent decomposition of the soilorganic carbon is not typically represented in carbon cyclemodels. For example, none of the carbon cycle models par-ticipating in C4MIP (Friedlingstein et al., 2006) included thisfeedback.
The carbon feedback from high latitude regions and its im-portance for the future climate is rather unconstrained, withuncertainties existing in the overall availability and quality ofcarbon stored in frozen soils, permafrost thawing rates, or-ganic matter decomposition rates and, importantly, the rela-tive proportion of anaerobic decomposition (resulting in CO2and CH4 emissions) versus aerobic decomposition (resultingin CO2 emissions only). A broader discussion of uncertain-ties relevant to the permafrost carbon feedback can be foundin (Schuur et al., 2008; McGuire et al., 2009; Davidson andJanssens, 2006; O’Connor et al., 2010; Grosse et al., 2011).
However, the permafrost feedback uncertainties are basi-cally “one-sided”, i.e. the inclusion of the permafrost-carbonfeedback will most likely increase future climate impacts(see discussion of potential negative permafrost feedbacksin Sect. 4). Although some feedbacks that dampen globalwarming might be triggered, such as vegetation growth in-duced by permafrost thaw and the release of plant-availablenutrients, there is little reason to believe that the net effect oflarge-scale permafrost thaw would lower future temperaturerise (McGuire et al., 2006).
The potential magnitude of the permafrost-carbon feed-back is substantial given that approximately thousand Gi-gatons (10ˆ9 tons) of organic carbon is stored in the upper3 m of permafrost soil alone (Schuur et al., 2008). The to-tal carbon pool in permafrost areas is as high as 1672 GtC,if deeper Yedoma and Deltaic carbon deposits are included,88 % of which reside in perennially frozen ground, as esti-mated by a recent and updated meta-data analysis (Tarnocaiet al., 2009). These numbers can be put into perspective withfossil fuel emissions from the recent Representative Con-centration Pathways (RCPs), which succeed previous SRESemission scenarios. In these new scenarios, GHG concentra-tions are extended beyond 2100 until year 2300. Overall, thenew scenario RCP4.5 is comparable to the previously lowestscenario SRES B1 and RCP8.5 is comparable to the previ-ously highest scenario SRES A1FI1.
The accumulated anthropogenic fossil fuel CO2 emissionsfor the medium-low RCP4.5 scenario amount 1000 GtC overyears 2000 to 2300 (cf. figure 3b in Meinshausen et al.,2011b) – comparable in magnitude to the current atmo-spheric CO2 content of about 830 GtC. Allen et al. (2009) es-
1see Fig. S1 in the Supplement for scenario specific CO2 con-centrations (SRES and RCPs).
timated a most likely CO2-induced warming of 2◦C for total(historical and future) anthropogenic emissions of 1000 Pg.
The purpose of this study is to provide a first probabilisticestimate of the importance of the permafrost-carbon feed-back for the global temperature rise. We investigate thisquestion for the set of all four Representative Concentra-tion Pathways (RCPs) (van Vuuren et al., 2011; Moss et al.,2010). For climatic consequences without permafrost feed-back refer to Schewe et al. (2011).
2 Modeling approach
2.1 General approach and terminology
This section provides an overview of the simulation setup, ofour simplified permafrost module, and of the climate modelused to run the different emission scenarios. Our study in-tends to provide a snapshot of the current scientific under-standing by combining modeling results from the permafrostsoil community with evidence from observational and simu-lation studies of soil microbial processes. Integrating a per-mafrost module into a reduced complexity carbon cycle cli-mate model enables us to provide a first probabilistic esti-mate of the permafrost-carbon effects on global mean tem-perature projections. We chose this computationally efficientapproach to investigate parameter uncertainties in a proba-bilistic framework over the century long timescales involved,here until 2300. Thus, our approach intends to synthesize andsupplement, not to bypass, the highly resolved and process-based permafrost modeling endeavors.
In this study we define the “permafrost-carbon feedback”as the contribution of near-surface permafrost carbon (upper3 m) which is presently stored in perennially frozen ground.The full permafrost-carbon feedback is also affected by cli-mate driven changes in background emissions in permafrostregions. These emissions result from changes in respirationof Arctic soil carbon, which is stored in the active layer un-der present day climate. Another contribution to backgroundemissions results from vegetation induced carbon fluxes inpermafrost regions – through higher CO2 fertilization andincreased CO2 uptake from vegetation growth. In our anal-ysis we account for higher CO2 sequestration through fer-tilization given the calibration of MAGICC6 to the C4MIPcarbon cycle models. As only a few C4MIP models in-cluded dynamic vegetation modules, our emulations do like-wise not fully capture modified carbon fluxes resulting fromvegetation-driven changes in permafrost regions. We alsodo not account for changes in soil respiration from surfacelayers above our considered permafrost pool (see Sect. 2.3).Increased respiration from these surface soil layers and in-creased carbon uptake through vegetation growth cancel outto a certain extent (they might cancel out almost completely,see Koven et al., 2011). A further compensation comesfrom changes in surface albedo (see discussion in Sect. 4).
Biogeosciences, 9, 649–665, 2012 www.biogeosciences.net/9/649/2012/

T. Schneider von Deimling et al.: Estimating the permafrost-carbon feedback 651
So we expect that our inferred carbon fluxes which definethe “permafrost-carbon feedback” are a good approximationto the overall strength of the full near-surface permafrost-carbon feedback.
2.2 Climate carbon-cycle model and simulation setup
For investigating the climatic effect of future carbon re-lease from thawing permafrost soils we apply MAGICC6,the latest version of a reduced complexity carbon cycle cli-mate model (see e.g. Wigley and Raper, 2002), describedin Meinshausen et al. (2011a) . MAGICC6’s carbon cyclecan closely emulate 10 high-complexity carbon cycle mod-els that took part in C4MIP (Friedlingstein et al., 2006) withrespect to their main carbon pools, fluxes and atmosphericCO2 concentrations in no-feedback and with-feedback car-bon cycle experiments. MAGICC6 also includes gas-cycleparameterizations for methane, including temperature andOH-dependent lifetimes (Ehhalt et al., 2001).
Emissions from the thawing of permafrost soils, however,have not been taken into account neither in C4MIP modelsnor in MAGICC6. Adding the carbon dioxide and methaneemissions from the permafrost module (described in the nextsection) to MAGICC6’s gas cycles, and feeding back the re-spective temperatures at each time step to the permafrost andcarbon cycle module allows an integrated and internally con-sistent analysis.
Here, we use a probabilistic version of MAGICC6, whichwas calibrated to reflect historical observations of surface airtemperatures and ocean heat uptake, as described in Mein-shausen et al. (2011a). We combine 2400 equally likelydrawings from the 82-dimensional joint probability distribu-tion for this historically constrained climate model with ran-dom drawings of 9 sets of carbon cycle model parameters,as well as random drawings from uniform and independentdistributions of 22 parameters in our permafrost module (seeTable 1). Each of the 9 carbon cycle parameter sets contains17 individual parameters to emulate one of the C4MIP mod-els, as described in (Meinshausen et al., 2011a). We did notinclude any IPSL CM2C emulations, as the air-to-ocean car-bon flux beyond 2100 (i.e. beyond the time horizon of C4MIPand hence the MAGICC calibration period) is emulated sub-stantially stronger than shown for the IPSL previously (Orr,2002).
We do not prescribe the RCP8.5 GHGs concentrations, butcalculate these dynamically using RCP8.5 emissions, so thatadded permafrost emissions will have an effect on CO2 andCH4 concentrations and simulated temperatures. Thus, westart our analysis from the harmonized set of greenhouse gas,aerosol and tropospheric ozone precursor RCP emissions, asthey were used for creating the RCP GHG concentrations.
In addition to our large ensemble simulations, we performa single illustrative run with default parameter settings forour permafrost module in order to illustrate the dynamicsover century long timescales. For this, we use MAGICC6
settings that are identical to those used for producing theRCP concentration scenarios (Meinshausen et al., 2011b).Specifically, MAGICC6’s carbon cycle is calibrated towardsthe C4MIP Bern2.5CC carbon cycle model, and the climateresponse parameters reflect a median projection across themodels of the third phase of the Coupled Model Intercom-parison Project (CMIP3). For the permafrost module, we as-sume default settings as listed in Table 1, (“Default”).
2.3 Permafrost module
Here, we provide a conceptual overview of our simplifiedpermafrost module and its main parameter assumptions (seeTable 1), with the Appendix providing a detailed mathemati-cal description. Our permafrost module compartmentalizesthe organic carbon of permafrost regions into bins with asimilar warming threshold, above which permafrost will startthawing. In our simplified framework, neglecting topographyand local climate as well as soil conditions, we call these bins“zonal bands”, given that – generally speaking – the south-ernmost permafrost regions of the Northern Hemisphere arelikely to start thawing first, and the northernmost regions last.This spatio-temporal characteristic of permafrost thaw is alsoseen in process-based modeling studies of permafrost degra-dation (Zhuang et al., 2006).
We assume the frozen carbon content that is potentiallyvulnerable to decomposition in the upper 3 m in permafrostsoils to be between 600 and 1000 GtC. As past decompo-sition has left carbon of low quality in the soils before in-corporation into permafrost (Schuur et al., 2008), we con-sider only the fraction of soil carbon which decomposes ona decadal to centennial timescale (intermediate pool) whilewe do not account for carbon emissions from the slow poolwhich eventually gets decomposed on millennial timescales.Based on Koven et al. (2011) we consider 60 % of the per-mafrost carbon available for decomposition in the interme-diate pool, and account for uncertainty in this fraction byconsidering a large spread in the total pool size of 600 to1000 GtC. Our assumption is somewhat lower than recentbest-guess estimates of 1024 GtC of top 3 m soil carbon con-tent in the permafrost zone (Tarnocai et al., 2009; Schuuret al., 2008), as we consider only the fraction of permafrostcarbon in perennially frozen ground. A small portion of theestimated 1000 GtC carbon pool will always reside in near-surface layers, with expected carbon densities approachingthose of non-permafrost soils.
By default, we assume this potentially vulnerable per-mafrost carbon content to be uniformly distributed into 50zonal bands, while for our uncertainty-based projections (seeSect. 3.2) we vary the carbon content across the latitudi-nal bands (see Appendix A1). We assume the “southern-most” band to start thawing at any warming above presentday levels (Tmin = 1◦C), and the “northernmost” band start-ing to thaw at an Arctic warming above pre-industrial levelsof 10–15◦C (see Fig. 1). Several studies have suggested that
www.biogeosciences.net/9/649/2012/ Biogeosciences, 9, 649–665, 2012
652 T. Schneider von Deimling et al.: Estimating the permafrost-carbon feedback
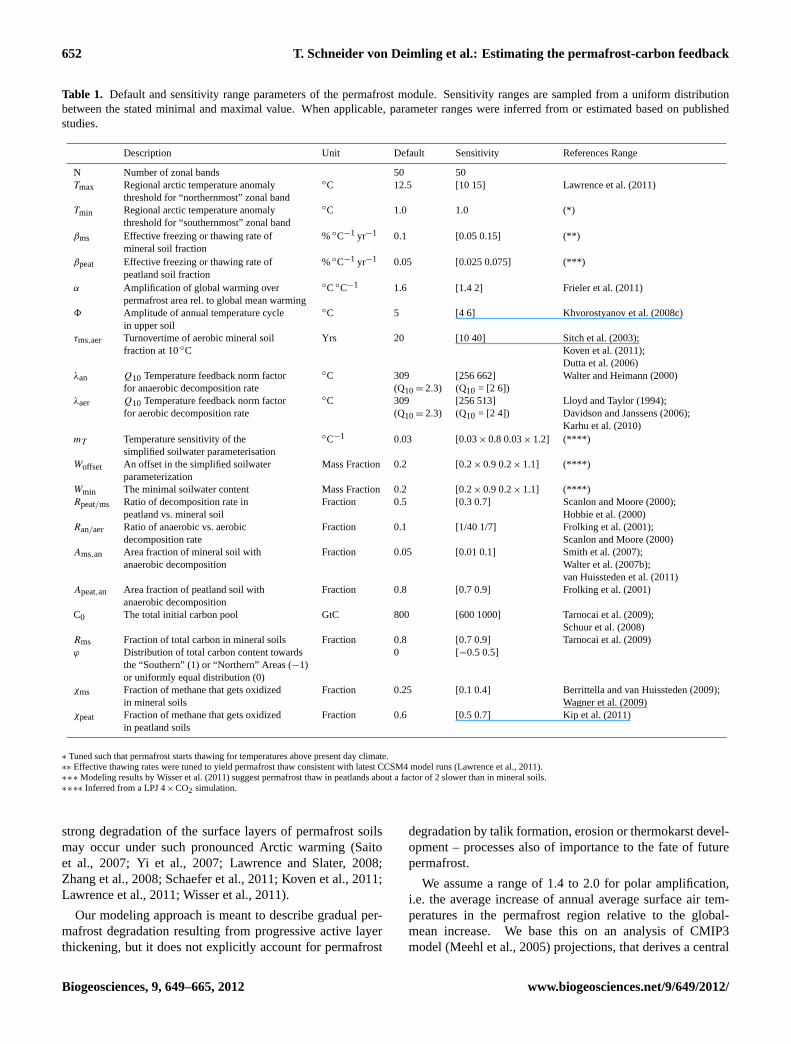
Table 1. Default and sensitivity range parameters of the permafrost module. Sensitivity ranges are sampled from a uniform distributionbetween the stated minimal and maximal value. When applicable, parameter ranges were inferred from or estimated based on publishedstudies.
Description Unit Default Sensitivity References Range
N Number of zonal bands 50 50Tmax Regional arctic temperature anomaly ◦C 12.5 [10 15] Lawrence et al. (2011)
threshold for “northernmost” zonal bandTmin Regional arctic temperature anomaly ◦C 1.0 1.0 (*)
threshold for “southernmost” zonal bandβms Effective freezing or thawing rate of %◦C−1 yr−1 0.1 [0.05 0.15] (**)
mineral soil fractionβpeat Effective freezing or thawing rate of %◦C−1 yr−1 0.05 [0.025 0.075] (***)
peatland soil fractionα Amplification of global warming over ◦C◦C−1 1.6 [1.4 2] Frieler et al. (2011)
permafrost area rel. to global mean warming8 Amplitude of annual temperature cycle ◦C 5 [4 6] Khvorostyanov et al. (2008c)
in upper soilτms,aer Turnovertime of aerobic mineral soil Yrs 20 [10 40] Sitch et al. (2003);
fraction at 10◦C Koven et al. (2011);Dutta et al. (2006)
λan Q10 Temperature feedback norm factor ◦C 309 [256 662] Walter and Heimann (2000)for anaerobic decomposition rate (Q10= 2.3) (Q10 = [2 6])
λaer Q10 Temperature feedback norm factor ◦C 309 [256 513] Lloyd and Taylor (1994);for aerobic decomposition rate (Q10= 2.3) (Q10 = [2 4]) Davidson and Janssens (2006);
Karhu et al. (2010)mT Temperature sensitivity of the ◦C−1 0.03 [0.03× 0.8 0.03× 1.2] (****)
simplified soilwater parameterisationWoffset An offset in the simplified soilwater Mass Fraction 0.2 [0.2× 0.9 0.2× 1.1] (****)
parameterizationWmin The minimal soilwater content Mass Fraction 0.2 [0.2× 0.9 0.2× 1.1] (****)Rpeat/ms Ratio of decomposition rate in Fraction 0.5 [0.3 0.7] Scanlon and Moore (2000);
peatland vs. mineral soil Hobbie et al. (2000)Ran/aer Ratio of anaerobic vs. aerobic Fraction 0.1 [1/40 1/7] Frolking et al. (2001);
decomposition rate Scanlon and Moore (2000)Ams,an Area fraction of mineral soil with Fraction 0.05 [0.01 0.1] Smith et al. (2007);
anaerobic decomposition Walter et al. (2007b);van Huissteden et al. (2011)
Apeat,an Area fraction of peatland soil with Fraction 0.8 [0.7 0.9] Frolking et al. (2001)anaerobic decomposition
C0 The total initial carbon pool GtC 800 [600 1000] Tarnocai et al. (2009);Schuur et al. (2008)
Rms Fraction of total carbon in mineral soils Fraction 0.8 [0.7 0.9] Tarnocai et al. (2009)ϕ Distribution of total carbon content towards 0 [−0.5 0.5]
the “Southern” (1) or “Northern” Areas (−1)or uniformly equal distribution (0)
χms Fraction of methane that gets oxidized Fraction 0.25 [0.1 0.4] Berrittella and van Huissteden (2009);in mineral soils Wagner et al. (2009)
χpeat Fraction of methane that gets oxidized Fraction 0.6 [0.5 0.7] Kip et al. (2011)in peatland soils
∗ Tuned such that permafrost starts thawing for temperatures above present day climate.∗∗ Effective thawing rates were tuned to yield permafrost thaw consistent with latest CCSM4 model runs (Lawrence et al., 2011).∗∗∗ Modeling results by Wisser et al. (2011) suggest permafrost thaw in peatlands about a factor of 2 slower than in mineral soils.∗∗∗∗ Inferred from a LPJ 4× CO2 simulation.
strong degradation of the surface layers of permafrost soilsmay occur under such pronounced Arctic warming (Saitoet al., 2007; Yi et al., 2007; Lawrence and Slater, 2008;Zhang et al., 2008; Schaefer et al., 2011; Koven et al., 2011;Lawrence et al., 2011; Wisser et al., 2011).
Our modeling approach is meant to describe gradual per-mafrost degradation resulting from progressive active layerthickening, but it does not explicitly account for permafrost
degradation by talik formation, erosion or thermokarst devel-opment – processes also of importance to the fate of futurepermafrost.
We assume a range of 1.4 to 2.0 for polar amplification,i.e. the average increase of annual average surface air tem-peratures in the permafrost region relative to the global-mean increase. We base this on an analysis of CMIP3model (Meehl et al., 2005) projections, that derives a central
Biogeosciences, 9, 649–665, 2012 www.biogeosciences.net/9/649/2012/

T. Schneider von Deimling et al.: Estimating the permafrost-carbon feedback 653
Southernmost Band Temperature
bands
Carbon content in each band (GtC)
“North”
“South”
1K (Melting starts at 1K local warming above pre-industrial levels)
0K
2K
3K 4K
5K ...
Depth ~3 m
Variable carbon content across boxes
Permafrost Module
Fig. 1. Schematic overview of the simplified permafrost modulewith n zonal bands (defaultn = 50) in which thawing starts at dif-ferent global warming levels. The carbon content of the representedpermafrost fractions (approximating upper 3 m soil layer) can varyacross the different zonal bands of equally spaced temperature in-tervals (default = 0.2 K spacing), with the default being an initiallyuniform carbon content distribution. Each zonal band is further sub-divided into four soil pools with differing thaw and decompositioncharacteristics: mineral and peatland soils, divided into aerobic andanaerobic fractions.
estimate of∼1.6 with a 2-σ uncertainty of 0.2 (Frieler et al.,2011). Our upper end of the assumed uniform distributionconsidered here is slightly above the maximum value fromAOGCMs (Atmosphere Ocean General Circulation Mod-els) to account for cases of strong future sea ice retreat,which may only partly be captured by the analyzed CMIP3AOGCMs (Stroeve et al., 2007). Such a strong retreat will in-crease polar temperature amplification in permafrost regions(Screen and Simmonds, 2010; Lawrence et al., 2008b). Forthe purpose of retrieving this polar amplification factor fromthe AOGCMs, the diagnosed permafrost region is here as-sumed as North-Eastern Europe (NEE), North-Asia/Siberia(NAS) and Alaska (ALA) following the region definitions ofGiorgi and Bi (2005).
The two main soil types in permafrost regions – mineraland peatland soils – exhibit rather different properties of rel-evance to induced emissions (e.g. in terms of thermal soilconductivities or in terms of the ratio of aerobic vs. anaer-obic soil conditions). By peatland soils we here understandsoils with a high fraction of organic material (peat, litter). Wethus subdivide the carbon in each zonal band into four pools:permafrost carbon stored in mineral and in peatland soils,each pool being subdivided into an aerobic and an anaerobicfraction. The largest carbon pool is characterized by physi-cal properties of mineral soils and we assume that these soilscontain 70–90 % of the total permafrost carbon content (seeRms in Table 1), given that an estimated 80 % of carbon isstored in the upper 3 m frozen mineral soils (Tarnocai et al.,2009).
A key uncertainty is the fraction of carbon that might bedecomposed under anaerobic conditions – resulting poten-tially in methane emissions to the atmosphere. Given thehigh warming potential of methane, the overall magnitude ofthe permafrost-carbon feedback will depend strongly on thisfraction.
Based on Frolking et al. (2001) we assume an anaerobicfraction of 70 % to 90 % for peatland soils. We further as-sume slightly lower decomposition rates in peatland com-pared to mineral soils (ratios of 0.3 to 0.7) given that mosslitter (which is abundant in peat soils) decomposes ratherslowly (Hobbie et al., 2000; Scanlon and Moore, 2000). Min-eral soils are dominated by aerobic conditions with only asmall fraction of carbon in anaerobic environments (90 %–99 % aerobic fraction assumed). Although there is large un-certainty, Arctic climate change could increase water-loggedareas (and hence the anaerobic part of decomposition) due toincreased precipitation and associated soil moisture increasesas well as thermokarst lake and wetland formation as ice-rich permafrost soils thaw and subside. On the other hand,increased drainage could lead to the opposite effect, even un-der increased precipitation. In this study, we hence keep theanaerobic area fractions constant.
In the anaerobic areas, not all decomposed carbon will beemitted as methane. Only half of the decomposed carbonin the anaerobic pool is converted to methane, following theprocess of methagonesis (Khvorostyanov et al., 2008a). Fur-thermore, on its pathway through the soil layers to the atmo-sphere, a part of this methane is oxidized. In mineral soilsa large fraction of methane will likely be released via thefast pathways of ebullition and plant-mediated transport (inthermokarst lake regions), therefore bypassing the oxic layer(Wagner et al., 2009). We assume accordingly low oxidiza-tion rates of 10 %–40 % (seeχ in Table 1). Given the dom-inance of slow diffusive methane transport in peatland soils,we assume much larger methane consumption in this pool,with average oxidation rates of 50 % to 70 %. This range isbased on observations of rather high oxidation in peat-mossecosystems (Kip et al., 2011). Note however that the oxidiza-tion assumptions are subject to substantial uncertainty (Rileyet al., 2011). For example, Walter and Heimann (2000) pointto the large uncertainty in plant-mediated transport, assum-ing a best-estimate of 50 % oxidation of methane.
While we do not explicitly account for the timescale ofCH4 transport, we implicitly account for uncertainty in thetimescale of CH4 release to the atmosphere by considering alarge spread in assumed anaerobic decomposition times (seebelow). Furthermore, by assuming that a fixed fraction ofmethane is oxidized on its way to the atmosphere, we neglectthe direct temperature sensitivity of oxidation rates.
The soil thawing (and re-freezing) rates are assumed tobe half as fast in peatland soil areas compared to thoseof mineral soils because of high thermal insulation of thepeat organic matter and high ice content. We tuned aerobicdecomposition rates of the largest permafrost carbon stock,
www.biogeosciences.net/9/649/2012/ Biogeosciences, 9, 649–665, 2012

654 T. Schneider von Deimling et al.: Estimating the permafrost-carbon feedback
i.e. carbon in mineral soils in the intermediate pool, to coveroverall turnover times of about 20 to 200 yrs. We do not sim-ulate very slow decomposition of low quality carbon whichdecomposes on a millennial timescale. Thus, we neglect thepart of the carbon soil pool which is very resistant to de-composition. The decomposition rate for aerobic conditionsis much higher than for anaerobic conditions with model-ing studies suggesting ratios of 10:1 to 40:1 (Frolking et al.,2001). Incubation experiments tend to favor slightly smallerratios (Scanlon and Moore, 2000). Hence we assume a uni-form range of 7:1 to 40:1. Both, oxic and anoxic decom-position rates in both soil types are adjusted depending onthe soil temperatures. Our sampled parameter range corre-sponds toQ10 values between 2 and 4 for the aerobic andbetween 2 and 6 for the anaerobic decomposition, accountingfor the large uncertainty in temperature sensitivity of soil car-bon mobilization (Davidson and Janssens, 2006). The largeanaerobicQ10 range expresses the larger uncertainty in tem-perature sensitivity of anaerobic decomposition (Walter andHeimann, 2000).
Additionally, we assume that oxic decomposition ratesare dependent on soil moisture and implemented a simplesoil moisture parameterization based on the annual cycle ofsoil temperature. The close link between soil temperatureand soil moisture in our model is motivated by the fact thatstate-of-the-art climate models consistently show an increasein water availability (i.e. an increase in precipitation minusevaporation) in permafrost regions in a warmer climate (seefigure 3.5 in Meehl, 2007).
3 Results
3.1 Illustrative run with default parameter settings
To illustrate the dynamics of our simplified modeling frame-work, we first show results for a single illustrative experi-ment for the high RCP8.5 scenario and with default parame-ters (see Table 1). In our model, permafrost starts degradingat the same level of warming in mineral and peatland soils,though it takes slightly longer for the heat anomaly to pen-etrate into the peatland soil (Fig. 2a, d). By 2050, only thesouthern latitudinal bands are subject to degradation, whileby 2100 about half of the surface permafrost pool is thawed.Degradation of the northernmost permafrost areas only startsin the second half of the 22nd century.
Given the slow timescale of decomposition, permafrostcarbon is released only gradually after thawing the surfacesoils and continues for centuries. The largest contribution tocarbon emission comes from the aerobic decomposition oforganic material located in the mineral soil pool (Fig. 2b).The peak emissions resulting from aerobic decompositionof peatland carbon is about an order of magnitude smallercompared to those from aerobic decomposition from min-eral soils (see Fig. 2b, e). This is because of the assumed
20:80 ratio of total peatland to mineral soil carbon and themuch higher anaerobic soil fraction in peatlands. Carbon re-lease from the anaerobic pool describes the slowest timescaleof permafrost dynamics due to the much lower decomposi-tion rates in anaerobic compared to aerobic environments (afactor of ten difference for our default case). Carbon emis-sions due to aerobic decomposition fall pronouncedly afterpeaks in the early 22nd century, indicating depletion of avail-able soil carbon stocks over the multi-centennial timeframeconsidered here (see Fig. 2b, e). For the southern regionsnear-surface permafrost carbon gets depleted in the 23rd cen-tury.
Assuming that northern peatlands are complex, adaptiveecosystems (Belyea and Baird, 2006) this carbon pool mightprove to be less vulnerable to loss due to self-sustainingvegetation and hydrology feedbacks (Frolking et al., 2011).We assume that the majority of this pool is subject to slowanaerobic decomposition, which is tantamount to assuming alarger resilience of peatland carbon to climate change.
We should add that we only quantify carbon fluxes fromnewly thawed permafrost soils (see Sect. 2.1). These fluxeswill add to total soil carbon fluxes in the Arctic whichare present regardless whether permafrost in the ground isthawed or still intact.
3.2 Projections for RCPs including uncertainties
In the following, we go beyond a consideration of our de-fault parameter scenario and discuss model outcomes in theprobabilistic framework in which we account for uncertaintyin parameters of the carbon-cycle climate model and in thepermafrost module (see Table 1).
For the mitigation scenario RCP3-PD that limits globalmean temperature changes to below 2◦C, cumulative CO2emissions from newly thawed permafrost are 16 GtC (68 %uncertainty range: 9–30 GtC) by 2100 (Table 2). The analy-sis of RCP8.5, a scenario that implies extensive global warm-ing reaching well above 10◦C by 2150 (Fig. 3e), shows apronounced degradation of near-surface permafrost by 2100and almost complete thawing by 2200. Modeling studiesbased on physical permafrost schemes consistently show pro-nounced permafrost degradation by 2100, but to strongly dif-fering extents (Saito et al., 2007; Lawrence et al., 2008a,2011; Zhang et al., 2008; Yi et al., 2007; Euskirchen etal., 2006; Eliseev et al., 2009; Schaefer et al., 2011; Kovenet al., 2011; Wisser et al., 2011). A direct comparisonof permafrost degradation estimates is hindered given dif-ferences in forcing scenarios and in the definitions of per-mafrost degradation which are used in these studies (seee.g. discussion in Wisser et al., 2011). We tuned our de-fault model parameters to simulated near-surface permafrostthaw in CCSM4 (Lawrence et al., 2011) which infers slightlyslower degradation compared to previous model versions dueto implementation of improved soil physics. For the RCP8.5scenario, CCSM4 simulates an increase in thawed permafrost
Biogeosciences, 9, 649–665, 2012 www.biogeosciences.net/9/649/2012/

T. Schneider von Deimling et al.: Estimating the permafrost-carbon feedback 655
2000 2100 2200 2300
10
20
30
40
50
2000 2100 2200 2300
10
20
30
40
50
2000 2100 2200 2300
10
20
30
40
50
2000 2100 2200 2300
10
20
30
40
50
0
10
20
30
40
50
0
0.2
0.4
0.6
0.8
1
0.5
1
1.5
0
0.5
1
1.5
2
2.5
2000 2100 2200 2300
10
20
30
40
50
2000 2100 2200 2300
10
20
30
40
50
0.2
0.4
0.6
0.8
1
0.2
0.4
0.6
0.8
1
0.01
0.1
0.5
1.0
1.0
0.5
0.1
0.01
Mineral Soil
Peatland Soil
“South”
“North”
“South”
“North”
a Frozen Fraction
d Frozen Fraction
Permafrost
Permafrost
Thawed
Thawed
b Emissions from
Aerobic
Decomposition
c Emissions from
Anaerobic
Decomposition
e Emissions from
Aerobic
Decomposition
f Emissions from
Anaerobic
Decomposition
Perm
afro
st Z
on
al B
and
sPe
rmaf
rost
Zo
nal
Ban
ds
Carbon Decomposition (MtC/yr/zonal band) Carbon Decomposition (MtC/yr/zonal band)
Carbon Decomposition (MtC/yr/zonal band) Carbon Decomposition (MtC/yr/zonal band)
Fig. 2. Fraction of intact near-surface permafrost and carbon release in MtC yr−1 per zonal band from mineral soil (upper row) and peatlandsoil (lower row) via aerobic(b, e)and anaerobic(c, f) decomposition, respectively, under the RCP8.5 scenario and illustrative default settings(see text and Table 2). Starting in the “Southernmos” zonal band, the thawing of the parameterized 3m thick soil layer progresses northwardto colder zonal bands (vertical axis) over time (horizontal axis) (seea, d), being followed by carbon releases.
volume relative to present day by about 80 % (45 % for theclimate bias ameliorated run). This range is consistent withour simulated permafrost thaw of 41–81 % (68 % uncertaintyrange) by 2100. Wisser et al. (2011) infer an increase of20 % for the thawed volume of northern American peat (withan average depth of 3.2 m) by 2100 under the A1B scenario.Under the RCP6 scenario (which describes a forcing of sim-ilar strength) our median peat thaw is 18 %. While our es-timates of permafrost degradation fall within the range ofpublished studies, we do not cover the upper estimates ofvery rapid permafrost degradation as reported in Lawrenceet al. (2008a) and Schaefer et al. (2011). Therefore we con-sider our results as conservative with respect to the timingand extent of permafrost degradation.
Given that microbial activity strongly increases for tem-peratures above the freezing point (Monson et al., 2006),large portions of soil carbon are subject to enhanced decom-position. Forcing our model with the high-emission scenarioRCP8.5, thaw-induced CO2 emission rates increase over the21st century to about 2 GtC yr−1 in 2100. This result is com-parable to an extrapolated estimate based on net ecosystemcarbon exchange measurements of permafrost patches, re-sulting in an emission estimate of 0.8–1.1 GtC yr−1 by 2100(Schuur et al., 2009). This observationally inferred estimate
is based on present-day permafrost thaw and gives a lowerbound as future thaw will penetrate to larger depths and pro-vide more carbon available for decomposition. The max-imum of our projected emissions (median 2.5 GtC yr−1) isreached before the mid 22nd century (see Fig. 3c). The up-per end of our 68 % uncertainty range suggests CO2 emissionup to 4 GtC yr−1. CO2 emissions resulting from the oxida-tion of thaw-induced methane and anaerobic CO2 productionin the soils contribute to these large emission rates, but to amuch smaller extent than the aerobic CO2 release (Fig. 3b, e).Cumulative CO2 emissions under RCP8.5 are 63 GtC (33–114 GtC) by 2100. By 2300, about half of the permafrostcarbon stock could be released to the atmosphere, with cu-mulative CO2 emissions being 380 GtC (303–467 GtC) (Ta-ble 2).
Running a simple carbon-climate box model for the fossil-intensive A2 scenario, (Raupach et al., 2008) estimate CO2release from thawing permafrost soils until 2100. Thisstudy does not account for different temporal dynamics ofaerobic/anaerobic and mineral/peatland soil pools and as-sumes a rather fast time constant for the C release fromthawed permafrost carbon. Their estimate of 80 ppm at-mospheric CO2 concentration change from permafrost car-bon is above our high-end estimate in 2100 (45 ppm for the
www.biogeosciences.net/9/649/2012/ Biogeosciences, 9, 649–665, 2012

656 T. Schneider von Deimling et al.: Estimating the permafrost-carbon feedback
Table 2. Median (68 %-range) estimates of permafrost characteristics under the four RCPs in year 2100, 2200 and 2300. The thawedpermafrost area is provided, weighted in relation to the initial carbon pool distribution. Cumulative emissions of CO2, CH4 (withoutcontributions of carbon in the slow pool) and the share of carbon that is released as methane are shown for cumulative emissions frompre-industrial times until the indicated year. Subsequent rows indicate additional CO2 concentrations, CO2 radiative forcing, CH4 radiativeforcing and global mean temperatures due to permafrost thawing above the background scenario. The permafrost carbon sensitivity LPindicates the change in the permafrost carbon stock until that year, given relative to that year’s global mean surface temperature.
RCP3-PD 2100 2200 2300
Thawed Permafrost (%) 15 (10–22) 15 (10–23) 14 (9–23)Cumulative CO2 Emissions (GtC) 16 (9–30) 34 (19–58) 43 (25–71)Cumulative CH4 Emissions (MtCH4) 131 (49–321) 353 (134–852) 535 (207–1301)Carbon released as Methane (%) 0.6 (0.3–1.2 ) 0.8 (0.4–1.5 ) 1 (0.5–1.8 )Added CO2 Concentration (ppm) 4.5 (2.3–8.4) 7.5 (3.8–13.6) 8 (4.1–14.7)Delta CO2 Radiative Forcing (W m−2) 0.06 (0.03–0.1) 0.1 (0.05–0.18) 0.12 (0.06–0.21)Delta CH4 Radiative Forcing (W m−2) 0 (0–0.01) 0 (0–0) 0 (0–0)Delta Temperature (◦C) 0.03 (0.01–0.06) 0.06 (0.03–0.13) 0.08 (0.04–0.16)Permafrost Carbon SensitivityγLP (GtC◦C−1) 9.8 (5.5–16.1) 22.6 (14–34.3) 32.7 (21.3–48)
RCP45
Thawed Permafrost (%) 26 (18–37) 35 (23–51) 38 (26–58)Cumulative CO2 Emissions (GtC) 27 (14–048) 74 (42–0126) 106 (64–0178)Cumulative CH4 Emissions (MtCH4) 222 (840–539) 811 (321–02012) 1482 (596–03725)Carbon released as Methane (%) 0.6 (0.3–1.2) 0.9 (0.4–1.6) 1.1 (0.5–2)Added CO2 Concentration (ppm) 8.6 (4.4–16) 22 (11.3–40.6) 29.7 (15.3–54.3)Delta CO2 Radiative Forcing (W m−2) 0.08 (0.04–0.15) 0.2 (0.11–0.36) 0.27 (0.15–0.46)Delta CH4 Radiative Forcing (W m−2) 0 (0–0.01) 0.01 (0–0.01) 0 (0–0.01)Delta Temperature (◦C) 0.05 (0.02–0.1) 0.14 (0.07–0.29) 0.19 (0.09–0.4)Permafrost Carbon SensitivityγLP (GtC◦C−1) 10.2 (5.9–16.6) 24 (15.6–35.3) 32.3 (22.2–45.1)
RCP6
Thawed Permafrost (%) 33 (23–47) 55 (38–80) 62 (42–92)Cumulative CO2 Emissions (GtC) 30 (16–55) 121 (70–205) 180 (110–295)Cumulative CH4 Emissions (MtCH4) 247 (93–601) 1401 (548–3499) 2838 (1117–7061)Carbon released as Methane (%) 0.6 (0.3–1.2) 0.9 (0.5–1.6) 1.2 (0.6–2.2)Added CO2 Concentration (ppm) 10.5 (5.4–19.5) 42.3 (22.3–78) 59.8 (33.1–108.7)Delta CO2 Radiative Forcing (W m−2) 0.08 (0.04–0.15) 0.27 (0.16–0.47) 0.38 (0.23–0.63)Delta CH4 Radiative Forcing (W m−2) 0.01 (0–0.02) 0.01 (0–0.03) 0.01 (0–0.03)Delta Temperature (◦C) 0.05 (0.02–0.11) 0.2 (0.1–0.46) 0.3 (0.15–0.65)Permafrost Carbon SensitivityγLP (GtC◦C−1) 9.1 (5.3–14.8) 26.3 (17.5–38.0) 36.2 (25.5–48.6)
RCP85
Thawed Permafrost (%) 57 (41–81) 100 (91–100) 100 (100–100)Cumulative CO2 Emissions (GtC) 63 (33–114) 302 (199–405) 380 (303–467)Cumulative CH4 Emissions (MtCH4) 533 (207–1336) 5290 (2002–12 494) 11 666 (4996–22 719)Carbon released as Methane (%) 0.7 (0.3–1.2) 1.4 (0.7–2.5) 2.3 (1.1–3.9)Added CO2 Concentration (ppm) 23.9 (12.3–45.6) 107.7 (61.5–187.5) 136.1 (75.9–219)Delta CO2 Radiative Forcing (W m−2) 0.13(0.07–0.23) 0.3 (0.19–0.46) 0.35 (0.22–0.49)Delta CH4 Radiative Forcing (W m−2) 0.01 (0–0.03) 0.05 (0.02–0.1) 0.03 (0.01–0.05)Delta Temperature (◦C) 0.1 (0.04–0.23) 0.38 (0.18–0.78) 0.42 (0.24–0.78)Permafrost Carbon SensitivityγLP (GtC◦C−1) 11.9 (7.1–19) 28.6 (21.2–37.4) 34.7 (25.5–44.3)
Biogeosciences, 9, 649–665, 2012 www.biogeosciences.net/9/649/2012/

T. Schneider von Deimling et al.: Estimating the permafrost-carbon feedback 657
upper 68 %-range, RCP8.5, see Table 2). A recent studyby Schaefer et al. (2011) infers a cumulative carbon flux of190± 64 GtC from thawed permafrost by 2200 based on theA1B scenario. Our simulation results based on the RCP6 sce-nario (describing a forcing of comparable magnitude) sug-gest median emissions until 2200 of 121 GtC, with maxi-mum emission of 205 GtC for the 68 % range. Key to thehigher estimates of Schaefer et al. (2011) – despite beingbased on a smaller carbon pool – is their simulated fast per-mafrost degradation leading to 80–90 % of permafrost car-bon thaw before 2100 (while we infer an upper bound of47 % under RCP6). Contrary to their study, we account forslow decomposition of anaerobic pools and slower degrada-tion and decomposition of peatland soils which explains whypart of our considered permafrost carbon is more resistantto decay. In another recent study Koven et al. (2011) in-fer climate-induced cumulated CO2 fluxes from permafrostcarbon of 37 GtC until 2100 under the A2 scenario. Theirsimulated Arctic warming can be compared to model resultsfrom our RCP8.5 case where we infer integrated fluxes of33–114 GtC. As Koven et al. (2011) do not simulate contri-butions from peatland carbon their estimate can be expectedto fall on the low site of our range.
Lower carbon emissions are suggested by Zhuang etal. (2006) who applied a process-based emission model toinfer an upper estimate of 17 GtC resulting from permafrostthaw in the 21st century for their high emission scenario (be-ing slightly larger than RCP8.5).
Our inferred methane emissions from anaerobic decom-position of permafrost carbon are rather small, accountingfor approximately 1 % to 3 % of the total carbon release.Due to the higher radiative forcing efficiency of methane,this relatively low fractional release of methane is impor-tant with respect to the total temperature increase, with upto a fifth of the thaw-induced forcing stemming from thesemethane releases under the high RCP8.5 scenario (cf. Ta-ble 2). Compared to current total anthropogenic methaneemissions (roughly 300 MtCH4 yr−1 in year 2000), thaw-induced methane emissions can reach a similar magnitude inthe 22nd century (upper 68 % range around 120 MtCH4 yr−1,see Fig. 3b), which corresponds to roughly a factor of 3 to 10increase of 20th century natural net methane emissions fromthe Arctic (McGuire et al., 2009). An approximate doublingof global methane fluxes from wetlands by 2100 was inferredby Gedney et al. (2004).
If the Siberian Yedoma complex were to thaw as analyzedby one modeling study which factored in the heat releaseby microbial decomposition (Khvorostyanov et al., 2008a)– a process which we neglect in our considerations – per-mafrost CH4 release rates are likely to strongly increase.Future methane emission up to 30 000 Tg CH4 is estimatedfrom a complete thawing of the Yedoma carbon pool alone,based on up-scaling of observational estimates from exten-sive hotspot methane ebullition over thermokarst lakes (Wal-ter et al., 2006, 2007b).
Our global-mean temperature simulations of the RCP sce-narios, once including the permafrost module and once ex-cluding it, indicate that the median warming by 2100 is notsubstantially altered. If we accounted for rather high ratesof permafrost thaw as modeled by Lawrence et al. (2008a)and Schaefer et al. (2011) we expect to infer a non-negligiblewarming contribution by 2100 from permafrost carbon forthe high anthropogenic emission scenarios. For the mitiga-tion scenario RCP3-PD, our results suggest that permafrost-carbon feedbacks add negligibly to the warming. For the highRCP8.5 scenario, permafrost-carbon feedbacks can triggeradditional global-mean temperature increase of about 0.1◦C(0.04–0.23◦C) by 2100, further increasing to 0.38◦C (0.18–0.78◦C) by 2200 and 0.42◦C (0.24–0.78◦C) in 2300 (seeTable 2 and Fig. 3f). The intermediate RCP scenarios implyintermediate permafrost feedbacks, roughly proportional totheir radiative forcing levels (see Table 2).
3.3 Permafrost sensitivities
The permafrost carbon pool is diminished by 11.9 GtC (7.1–19 GtC) per degree of global warming in the 21st centuryunder RCP8.5. This is the RCP scenario that is most closelycomparable to the SRES A2 scenario, for which the C4MIPintercomparison has been undertaken. Hence, the total car-bon sensitivity of, on average, 79 GtC◦C−1 with a broadrange from 20 to 177 GtC◦C−1 across the C4MIP models(Friedlingstein et al., 2006) could be slightly higher. Whenpermafrost-carbon feedbacks are included, the average esti-mate would increase 15 % (9 % to 24 %), shifting the bestestimate of total land carbon sensitivity from 79 GtC◦C−1
by 2100 to above 90 GtC◦C−1.Our results highlight the limitations of this indicator
“carbon pool sensitivity”, given that cumulative carbon re-leases per degree of warming are not a scenario- or time-independent characteristic (Table 2). A common behaviorcan be described by an increase in carbon sensitivity withtime which results from the slow time scale of permafrostcarbon decomposition: carbon fluxes by 2300 are not only aconsequence of permafrost thaw in the 23rd century but arealso affected by emissions from soil which thawed earlier inthe 21st and 22nd century. As a consequence, carbon sensi-tivities are higher by a factor of three in 2300 compared to2100.
4 Limitations
The robustness of our results crucially depends on our as-sumptions made for parameterizing physical and microbialprocesses which determine the magnitude and timing of car-bon release from permafrost soils. By having generously var-ied model parameters to account for known uncertainties wehave spanned a broad possible range of future permafrostevolution. Yet our simplified representation of complex
www.biogeosciences.net/9/649/2012/ Biogeosciences, 9, 649–665, 2012

658 T. Schneider von Deimling et al.: Estimating the permafrost-carbon feedback
2000 2050 2100 2150 2200 2250 23000
0.2
0.4
0.6
0.8
1.0
1.2
2000 2050 2100 2150 2200 2250 23000
1
2
3
4
5
6
7
8
9
10
0
50
100
150
200
250
300
0
20
40
60
80
100
120
140
160
0
0.5
1
1.5
2
2.5
3
3.5
4
4.50%
100%
20%
40%
60%
80%
Thaw
ed A
rea
Frac
tio
n
CO
2 Em
issi
on
s (G
tC/y
r)
Met
han
e Em
issi
on
s (M
tCH
4/yr
)Ex
tra
CO
2 Co
nce
ntr
atio
n C
han
ge
(pp
m)
d Thaw Induced CO2 Concentration Change
e Thaw Induced Temperature Change
f Global-Mean Surface Temperature(incl. permafrost effects)
c CO2 Emissions
from newly thawed permafrost
b CH4 Emissions from newly thawed permafrost
Mar
gin
al G
lob
al M
ean
Tem
per
atu
re C
han
ge
(K)
Tota
l Glo
bal
Mea
n T
emp
erat
ure
rel.
to p
re-i
nd
ust
rial
(K)
a Thawed Permafrost Fraction
80%
80%
68%
68%
50%
50%Median
Range
Fig. 3. This study’s estimated ranges of thawed permafrost fraction(a), methane(b) and CO2 emissions(c) from carbon in newly thawedpermafrost soils, thaw induced CO2 concentration(d) and temperature change(e), and the total anthropogenically induced global meantemperature anomaly(f). Results were obtained from an uncertainty analysis for the RCP8.5 scenario. The uncertainty ranges results from2400 member ensemble simulations, using a Monte Carlo sampling that combines the joint distribution of 82 climate model parameters, 9sets of 17 carbon cycle parameters and 22 independently sampled parameters of our permafrost model (see text and Table 1).
permafrost thawing dynamics and subsequent carbon releasehas several important limitations.
Effects of snow cover changes, which either can amplify ordampen soil warming, are not accounted for explicitly in ourmodel. While snow state changes are likely to have stronglyimpacted recent soil temperatures trends, its role of affectingsoil temperatures beyond 2050 is expected to exert a muchsmaller weight as surface air warming becomes the domi-nant driver for permafrost degradation (Lawrence and Slater,2010).
Due to pronounced spatial inhomogenities in the soilsand in local climatology, the “real world” change at
specific permafrost sites will differ strongly from our simpli-fied model which assumes that carbon is distributed homo-geneously in each latitudinal band and is of the same quality(while carbon content is varied across latitudes). Highly site-specific permafrost thaw can result from site-specific soil andvegetation cover properties, such as a strong insulation effectexerted by an organic-rich surface or a thin peat layer, or theeffect on soil thermal properties resulting from unfrozen wa-ter in the ground (Alexeev et al., 2007; Yi et al., 2007; Nicol-sky et al., 2007) and variability in excess ground ice con-centration. Additionally, interaction of the C- and N-cycle(Canadell et al., 2007) and various non-linear and complex
Biogeosciences, 9, 649–665, 2012 www.biogeosciences.net/9/649/2012/
T. Schneider von Deimling et al.: Estimating the permafrost-carbon feedback 659
ecosystem feedback loops (Heimann and Reichstein, 2008;Jorgenson et al., 2010) can play an important role in the fateof permafrost carbon but are not considered here.
We focus our analysis on the top 3 m of land permafrostsoils where carbon densities are high and uncertainty aboutthe rate of thaw of deep ground layers is not as important.For large warming anomalies on multi-centennial timescales,carbon release from deeper carbon reservoirs is likely. Ofparticular relevance is the potential degradation and emis-sions of highly labile carbon found in deeper layers of theSiberian Yedoma complex (Khvorostyanov et al., 2008b) andfluvial deposits (Tarnocai et al., 2009), with a potential tofurther increase emissions from permafrost. Furthermore,large amounts of carbon are likely to be stored in sub-seapermafrost (Shakhova et al., 2010a) and in methane hydratedeposits on continental margins (Archer et al., 2009). We didnot account for these additional carbon sources and thereforeour high-end estimate of 1000 GtC of carbon being poten-tially vulnerable to future release is likely a conservative es-timate. Furthermore, we only considered a fraction of 60 %of soil carbon pool being eventually available for release. Ifwe also considered carbon fluxes from the remainder carbonpool with decomposition on millennial timescales, our longterm estimates by 2300 will be larger by about 10–20 % (es-timated from an additional ensemble with model parameterstuned to millennial decomposition).
A key question remains with respect to the impact ofpermafrost thaw on water table depth, which ultimatelydetermines the fraction of carbon released as CO2 or asmethane. This aspect is considered an obvious gap in state-of-the-art Earth system models (O’Connor et al., 2010).Thawing may lead to enhanced soil drainage (lowering ofwater table) while landscape collapse is likely to favorthermokarst lake or wetland formation, resulting in increasedCH4/CO2emission ratios. High rates of CH4 release fromnewly forming thermokarst lakes indicate that this processmight be a crucial contributor to future methane emissionfrom permafrost soils (Walter et al., 2007a). Apart from thiseffect on hydrology, soil thermal properties are changed withenhanced permafrost thaw, although this dynamic is not con-sidered in our study.
With future permafrost thaw and Arctic temperature rise,vegetation cover will respond to more favorable growingconditions, resulting in expected higher CO2 sequestrationin Arctic regions (Canadell et al., 2007; Friedlingstein etal., 2006). Nutrients, released during the decompositionof organic material, could support new forest and biomassbuildup. We do not explicitly account for the effect of in-creased CO2 uptake by expansion of vegetation into thawedpermafrost regions. From a radiative balance viewpoint, thecarbon sequestration effect is likely to be compensated some-what or in full by the lowering of albedo resulting from modi-fied Arctic vegetation (Matthews and Keith, 2007). In case ofvery strong warming with a pronounced decrease in spring-time snow-cover this compensation will be less effective (a
decrease in albedo feedback) – while increased transpirationfrom enhanced forest cover and the associated positive watervapor feedback might become more important (Swann et al.,2010). Observed protection of permafrost through shrub ex-pansion (Blok et al., 2010) was recently shown to be likelyovercompensated by changes in surface albedo (Lawrenceand Swenson, 2011).
Our results are limited by the realism of global-mean tem-perature projections: While our results cannot confidentlyproject warmings of 10◦C, which is above the upper end ofthe AOGCM calibration range of MAGICC6 (approximately6◦C), our results can be taken as an indication of the tim-ing and potential magnitude of permafrost feedback effects.The results that we present here, i.e. that permafrost-carbonfeedbacks are relevant at the global scale and will becomeincreasingly important on longer time horizons, are based onhighly simplified representations of permafrost and carbon-cycle climate dynamics. Similar studies using process-basedmodels that are constrained by observations are urgentlyneeded to better quantify permafrost-carbon and other per-mafrost feedbacks more robustly.
5 Conclusions
The inclusion of a highly simplified, dynamic permafrostmodule into the reduced complexity carbon-cycle climatemodel MAGICC6 has shown how permafrost carbon emis-sions could affect long-term projections of future tempera-ture change. Our results underline the importance of ana-lyzing long-term consequences of land carbon emissions be-yond 2100. Studies focusing on short time horizons (e.g.Anisimov, 2007) infer a rather small permafrost feedback, inline with our results, while climatic consequences of thawingpermafrost soils become clearly apparent after 2100 for themedium and higher RCP scenarios. Even more pronouncedthan many other components of the Earth System, the per-mafrost feedback highlights the lagged and slow responseto human perturbations. Once unlocked under strong warm-ing, thawing and decomposition of permafrost can releaseamounts of carbon until 2300 comparable to the historical an-thropogenic emissions up to 2000 (approximately 440 GtC,cf. Allen et al., 2009). Under the RCP8.5 scenarios – with cu-mulative CO2 emissions from newly thawed permafrost soilsof 303 GtC to 467 GtC (up to 20 % larger values when con-sidering very slow decomposition of low quality carbon) –this permafrost-carbon feedback could add nearly half a de-gree warming (0.18–0.78◦C) warming from 2200 onwards,albeit in a world that will already be dissimilar to the cur-rent one due to global-mean temperature levels near to andpossibly in excess of 10◦C. Our method is however not ableto bound a worst-case scenario. For example, if there is ex-tensive thermokarst formation or subsea permafrost degrada-tion (Shakhova et al., 2010a, b), substantial CH4 emissionscould result from thawing these high Arctic ecosystems.
www.biogeosciences.net/9/649/2012/ Biogeosciences, 9, 649–665, 2012

660 T. Schneider von Deimling et al.: Estimating the permafrost-carbon feedback
For lower scenarios, e.g. the mitigation scenario RCP3-PD, our results suggest that future warming is unlikely toincrease Arctic temperatures enough to release a large frac-tion of the carbon stored in permafrost soils, although up to22 % could be thawed already by 2100. If strong mitigationof emissions is pursued, it seems still possible to prevent therelease of large fractions of this permafrost carbon over thecoming centuries.
Appendix A
Model description
The following Appendix describes our simplified permafrostmodule and its parameterizations.
A1 Initial carbon pool distribution
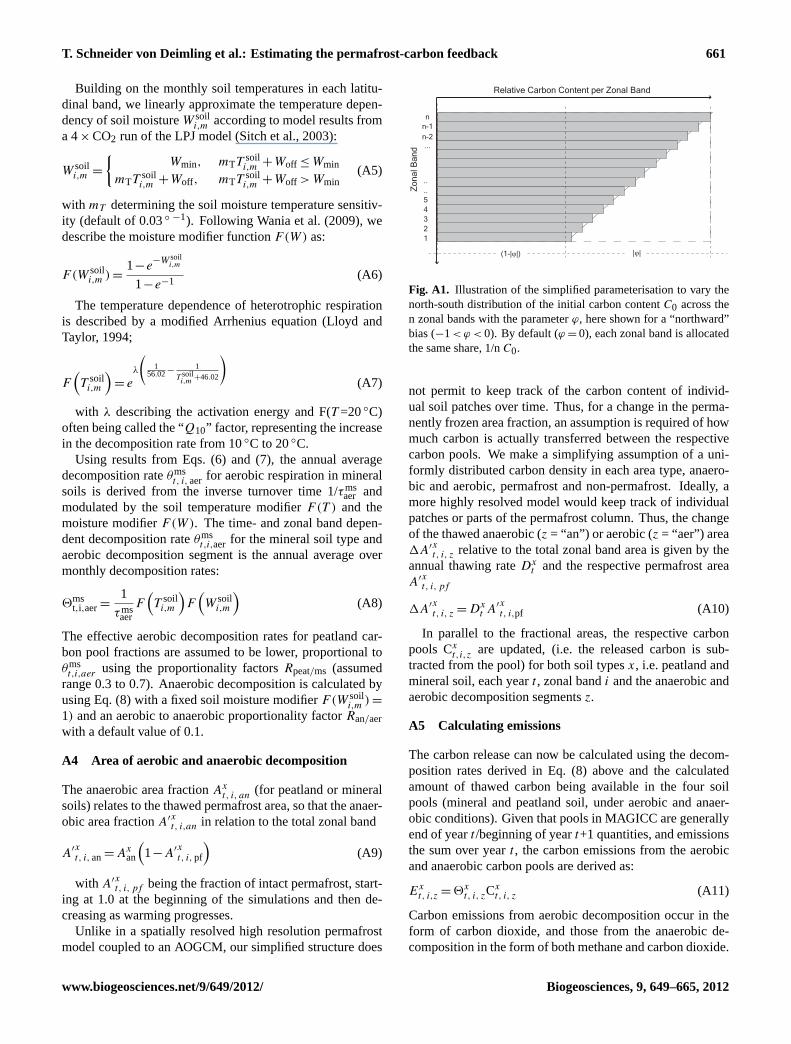
Our default carbon distribution assumes equal amounts ofcarbon in each of the zonal bands. These zonal bands rep-resent carbon stores liable to thawing at different warmingthresholds. In order to capture the uncertainty that a larger orsmaller fraction of the total permafrost carbon might be sub-ject to thawing for comparatively low temperature increases,we introduced flexibility in the model regarding this initialcarbon distribution along the “North-South” axis. Depend-ing on the input parameterϕ, initial total carbon poolC0 isdistributed across ourn zonal bandsCi,0 according to:
Ci,0 =
(i|ϕ|
n2 +1−|ϕ|
n
)1
AtotC0, −1≤ ϕ < 0
1nC0, ϕ = 0((n− i +1)
|ϕ|
n2 +1−|ϕ|
n
)1
AtotC0, 0< ϕ ≤ 1
(A1)
with Atot being the normalization constant, ensuringthat the individual contributions add up to C0 (surfacearea of the grey shaded region marked in Fig. A1),(Atot = 1−
|ϕ|
2
(1−
1n
)). For the limit ϕ = 1, the “north-
ernmost” zonal band (i=n) will only contain the small frac-tion 1/(n2
× Atot) of the total carbon pool, while the south-ernmost zonal band (i = 1) will contain the largest fraction1/(n × Atot) with linear increasing carbon pool fractions inbetween. Graphically, the carbon pool fraction distributionsthat can be set via theϕ parameter can be represented bya horizontally striped trapeze, with the lower/upper paral-lel side approaching zero forϕ being set at 1 or−1 (seeFig. A1). This initial carbon pool in each zonal band is at-tributed to the mineral and peatland soil fractions using theparametersRms, south for band i = 1 andRms, north for the“northernmost” bandi = n, with linear interpolation for in-termediate zonal bands.
A2 The thawing threshold in each zonal band
A regional warming threshold1T threshi is attributed to each
zonal band for describing the latitudinal dependency of per-
mafrost thaw. A minimum warming for thaw is required inthe southernmost band (1Tmin), and a maximum warmingthreshold in the northernmostGuten Mooooo band (1Tmax).Thus, by linearly interpolating between the zonal bands, thewarming threshold in zonal band i is defined as:
1T threshi = 1Tmin+
(i −1)(1Tmax−1Tmin)
n−1(A2)
Using this threshold, we calculate the maximum thaw tem-perature reached during summer (T thaw
i,t ) relative to the freez-ing point in each year t in each zonal band:
T thawi,t = α1Tglobal,t −1T thresh
i (A3)
with 1Tglobal,t being the global-mean, annual average tem-perature anomaly,α being the latitudinal amplification fac-tor, i.e. the ratio at which permafrost regions are expectedto warm relative to the global mean, assuming a linear re-lationship between regional and global warming (Santer etal., 1990; Mitchell, 2003; Frieler et al., 2011). As soonas global temperature increase is high enough to raise per-mafrost temperatures above zero in a given latitudinal band(i.e.T thaw
i,t > 0 ), permafrost thaw is initiated and soil carbonin this band becomes subject to decomposition.
We calculate the transformation from soil between the per-mafrost and non-permafrost area on an annual basis. Thesummer temperature in year t is simply multiplied with theeffective thawing/refreezing rateβx to calculate the thawingor re-refreezing fractional depthDx
t,thaw of each zonal band,
with Dxt = βx T thaw
i,t (x denoting either “ms” or “peat” forthe mineral or peatland soils). By choosing different settingsfor βx, we account for the large uncertainty present in modelsimulations of permafrost thaw.
A3 Decomposition rates and their sensitivities to soilmoisture and temperature
Oxic decomposition rates in peat and mineral soils are as-sumed to be dependent on two factors, i.e. soil moistureand soil temperature. In the following, we describe simpleparametrizations of the soil moisture status and of the tem-perature dependency of decomposition to infer a formula foreffective decomposition rates. For anoxic conditions, decom-position rates are a function of soil temperature only.
Using a simple sinusoidal function, we approximate theannual cycle of the effective soil temperature in each bandi,to compute the monthly soil temperaturesT soil
i,m
T soili,m =
8
2sin
π (m−1)
11−
8
2+T thaw
i,t (4), (A4)
with m = 1,...,12 denoting the 12 months of yeart , and8
the amplitude of the mean soil temperature cycle in the up-per 3 meters (estimated as 4–6◦C) (cf. Khvorostyanov et al.,2008c).
Biogeosciences, 9, 649–665, 2012 www.biogeosciences.net/9/649/2012/
T. Schneider von Deimling et al.: Estimating the permafrost-carbon feedback 661
Building on the monthly soil temperatures in each latitu-dinal band, we linearly approximate the temperature depen-dency of soil moistureW soil
i,m according to model results froma 4× CO2 run of the LPJ model (Sitch et al., 2003):
W soili,m =
{Wmin, mTT soil
i,m +Woff ≤ Wmin
mTT soili,m +Woff, mTT soil
i,m +Woff > Wmin(A5)
with mT determining the soil moisture temperature sensitiv-ity (default of 0.03◦ −1). Following Wania et al. (2009), wedescribe the moisture modifier functionF(W) as:
F(W soili,m ) =
1−e−W soil
i,m
1−e−1(A6)
The temperature dependence of heterotrophic respirationis described by a modified Arrhenius equation (Lloyd andTaylor, 1994;
F(T soil
i,m
)= e
λ
(1
56.02−1
T soili,m
+46.02
)(A7)
with λ describing the activation energy and F(T =20◦C)often being called the “Q10” factor, representing the increasein the decomposition rate from 10◦C to 20◦C.
Using results from Eqs. (6) and (7), the annual averagedecomposition rateθms
t, i, aer for aerobic respiration in mineralsoils is derived from the inverse turnover time 1/τms
aer andmodulated by the soil temperature modifierF(T ) and themoisture modifierF(W). The time- and zonal band depen-dent decomposition rateθms
t,i,aer for the mineral soil type andaerobic decomposition segment is the annual average overmonthly decomposition rates:
2mst,i,aer=
1
τmsaer
F(T soil
i,m
)F(W soil
i,m
)(A8)
The effective aerobic decomposition rates for peatland car-bon pool fractions are assumed to be lower, proportional toθmst,i,aer using the proportionality factorsRpeat/ms (assumed
range 0.3 to 0.7). Anaerobic decomposition is calculated byusing Eq. (8) with a fixed soil moisture modifierF(W soil
i,m ) =
1) and an aerobic to anaerobic proportionality factorRan/aerwith a default value of 0.1.
A4 Area of aerobic and anaerobic decomposition
The anaerobic area fractionAxt, i, an (for peatland or mineral
soils) relates to the thawed permafrost area, so that the anaer-obic area fractionA′x
t, i,an in relation to the total zonal band
A′xt, i, an= Ax
an
(1−A′x
t, i, pf
)(A9)
with A′xt, i, pf being the fraction of intact permafrost, start-
ing at 1.0 at the beginning of the simulations and then de-creasing as warming progresses.
Unlike in a spatially resolved high resolution permafrostmodel coupled to an AOGCM, our simplified structure does
|φ|(1-|φ|)
12345....
nn-1n-2...
Relative Carbon Content per Zonal Band
Zon
al B
and
Fig. A1. Illustration of the simplified parameterisation to vary thenorth-south distribution of the initial carbon contentC0 across then zonal bands with the parameterϕ, here shown for a “northward”bias (−1< ϕ < 0). By default (ϕ = 0), each zonal band is allocatedthe same share, 1/nC0.
not permit to keep track of the carbon content of individ-ual soil patches over time. Thus, for a change in the perma-nently frozen area fraction, an assumption is required of howmuch carbon is actually transferred between the respectivecarbon pools. We make a simplifying assumption of a uni-formly distributed carbon density in each area type, anaero-bic and aerobic, permafrost and non-permafrost. Ideally, amore highly resolved model would keep track of individualpatches or parts of the permafrost column. Thus, the changeof the thawed anaerobic (z = “an”) or aerobic (z = “aer”) area1A′x
t, i, z relative to the total zonal band area is given by theannual thawing rateDx
t and the respective permafrost areaA′x
t, i, pf
1A′xt, i, z = Dx
t A′xt, i,pf (A10)
In parallel to the fractional areas, the respective carbonpools Cx
t,i,z are updated, (i.e. the released carbon is sub-tracted from the pool) for both soil typesx, i.e. peatland andmineral soil, each yeart , zonal bandi and the anaerobic andaerobic decomposition segmentsz.
A5 Calculating emissions
The carbon release can now be calculated using the decom-position rates derived in Eq. (8) above and the calculatedamount of thawed carbon being available in the four soilpools (mineral and peatland soil, under aerobic and anaer-obic conditions). Given that pools in MAGICC are generallyend of yeart /beginning of yeart+1 quantities, and emissionsthe sum over yeart , the carbon emissions from the aerobicand anaerobic carbon pools are derived as:
Ext, i,z = 2x
t, i, zCxt, i, z (A11)
Carbon emissions from aerobic decomposition occur in theform of carbon dioxide, and those from the anaerobic de-composition in the form of both methane and carbon dioxide.
www.biogeosciences.net/9/649/2012/ Biogeosciences, 9, 649–665, 2012

662 T. Schneider von Deimling et al.: Estimating the permafrost-carbon feedback
With half of the carbon in anaerobic areas being converted toCH4 in the soil, a certain fractionχ of the latter half is as-sumed to be oxidized on its way through the upper soil layers,before reaching the atmosphere.
Supplementary material related to thisarticle is available online at:http://www.biogeosciences.net/9/649/2012/bg-9-649-2012-supplement.pdf.
Acknowledgements.The authors wish to thank our colleagueswhose input was crucial for building our simplified permafrostmodule. Our special thank is to Vladimir Romanovsky andAlexey Eliseev for discussing physics of permafrost soil thaw, toCharles Tarnocai for discussions about soil carbon characteristics,and to Sybill Schaphoff and Ursula Heyder for their input aboutdynamic carbon and vegetation modeling. Malte Meinshausen andKatja Frieler were supported by the Federal Environment Agencyfor Germany (UBA) under project UFOPLAN FKZ 370841103.
Edited by: J. Leifeld
References
Alexeev, V. A., Nicolsky, D. J., Romanovsky, V. E., and Lawrence,D. M.: An evaluation of deep soil configurations in the CLM3for improved representation of permafrost, Geophys. Res. Lett.,34, L09502, doi:10.1029/2007GL029536, 2007.
Allen, M. R., Frame, D. J., Huntingford, C., Jones, C. D., Lowe, J.A., Meinshausen, M., and Meinshausen, N.: Warming caused bycumulative carbon emissions towards the trillionth tonne, Nature,458, 1163–1166, 2009.
Anisimov, O. A.: Potential feedback of thawing permafrost to theglobal climate system through methane emission, Environ. Res.Lett., 2, 2–7, 2007.
Archer, D., Buffett, B., and Brovkin, V.: Ocean methane hydratesas a slow tipping point in the global carbon cycle, P. Natl. Acad.Sci. USA, 106, 20596–20601, 2009.
Belyea, L. R. and Baird, A. J.: Beyond “The limits to peat boggrowth”: cross-scale feedback in peatland development, Ecol.Monogr., 76, 299–322, 2006.
Berrittella, C. and van Huissteden, J.: Uncertainties in modellingCH4 emissions from northern wetlands in glacial climates: effectof hydrological model and CH4 model structure, Clim. Past, 5,361–373,doi:10.5194/cp-5-361-2009, 2009.
Blok, D., Heijmans, M. M. P. D., Schaepman-Strub, G., Kononov,A. V., Maximov, T. C., and Berendse, F.: Shrub expansionmay reduce summer permafrost thaw in Siberian tundra, Glob.Change Biol., 16, 1296–1305, 2010.
Canadell, J. G., Pataki, D. E., Pitelka, L. F., Canadell, J., Pataki,D., Gifford, R., Houghton, R., Luo, Y., Raupach, M., Smith, P.,and Steffen, W.: Saturation of the Terrestrial Carbon Sink, in:Terrestrial Ecosystems in a Changing World, Global Change –The IGBP Series, Springer Berlin Heidelberg, 59–78, 2007.
Cramer, W., Bondeau, A., Woodward, F. I., Prentice, I. C., Betts,R. A., Brovkin, V., Cox, P. M., Fisher, V., Foley, J. A., Friend,A. D., Kucharik, C., Lomas, M. R., Ramankutty, N., Sitch, S.,Smith, B., White, A., and Young-Molling, C.: Global responseof terrestrial ecosystem structure and function to CO2 and cli-mate change: results from six dynamic global vegetation models,Global Change Biology, 7, 357–373, 2001.
Davidson, E. A. and Janssens, I. A.: Temperature sensitivity of soilcarbon decomposition and feedbacks to climate change, Nature,440, 165–173, 2006.
Dutta, K., Schuur, E. A. G., Neff, J. C., and Zimov, S. A.: Poten-tial carbon release from permafrost soils of Northeastern Siberia,Glob. Change Biol., 12, 2336–2351, 2006.
Ehhalt, D., Prather, M. J., Dentener, F., Derwent, R. G., Dlugo-kencky, E., Holland, E., Isaksen, I. S. A., Katima, J., Kirchhoff,V., Matson, P., Midgley, P., and Wang, M.: Atmospheric Chem-istry and Greenhouse Gases, in: Climate Change 2001: The Sci-entific Basis, Cambridge University Press, Cambridge, 2001.
Eliseev, A. V., Arzhanov, M. M., Demchenko, P. F., and Mokhov,I. I.: Changes in climatic characteristics of Northern Hemisphereextratropical land in the 21st century: Assessments with the IAPRAS climate model, IZV Atmos. Ocean. Phys., 45, 271–283,2009.
Euskirchen, E. S., McGuire, A. D., Kicklighter, D. W., Zhuang, Q.,Clein, J. S., Dargaville, R. J., Dye, D. G., Kimball, J. S., McDon-ald, K. C., Melillo, J. M., Romanovsky, V. E., and Smith, N. V.:Importance of recent shifts in soil thermal dynamics on growingseason length, productivity, and carbon sequestration in terres-trial high-latitude ecosystems, Glob. Change Biol., 12, 731–750,2006.
Friedlingstein, P., Cox, P., Betts, R., Bopp, L., Von Bloh, W.,Brovkin, V., Cadule, P., Doney, S., Eby, M., Fung, I., Bala, G.,John, J., Jones, C., Joos, F., Kato, T., Kawamiya, M., Knorr,W., Lindsay, K., Matthews, H. D., Raddatz, T., Rayner, P., Re-ick, C., Roeckner, E., Schnitzler, K. G., Schnur, R., Strassmann,K., Weaver, A. J., Yoshikawa, C., and Zeng, N.: Climate-carboncycle feedback analysis: Results from the (CMIP)-M-4 modelintercomparison, J. Climate, 19, 3337–3353, 2006.
Frieler, K., Meinshausen, M., Mengel, M., Braun, N., and Hare, W.:A scaling approach to probabilistic assessment of regional cli-mate change, J. Climate, doi:10.1175/JCLI-D-11-00199.1, 2011.
Frolking, S., Roulet, N. T., Moore, T. R., Richard, P. J. H., Lavoie,M., and Muller, S. D.: Modeling northern peatland decomposi-tion and peat accumulation, Ecosystems, 4, 479–498, 2001.
Frolking, S., Talbot, J., Jones, M. C., Treat, C. C., Kauffman, J.B., Tuittila, E.-S., and Roulet, N.: Peatlands in the Earth’s 21stcentury climate system, Environ. Rev., 19, 371–396, 2011.
Gedney, N., Cox, P. M., and Huntingford, C.: Climate feed-back from wetland methane emissions, Geophys. Res. Lett., 31,L20503, doi:10.1029/2004GL020919, 2004.
Giorgi, F. and Bi, X.: Updated regional precipitation and tem-perature changes for the 21st century from ensembles of re-cent AOGCM simulations, Geophys. Res. Lett., 32, L21715,doi:10.1029/2005GL024288, 2005.
Grosse, G., Harden, J., Turetsky, M., McGuire, A. D., Camill,P., Tarnocai, C., Frolking, S., Schuur, E. A. G., Jorgen-son, T., Marchenko, S., Romanovsky, V., Wickland, K. P.,French, N., Waldrop, M., Bourgeau-Chavez, L., and Striegl,R. G.: Vulnerability of high-latitude soil organic carbon in
Biogeosciences, 9, 649–665, 2012 www.biogeosciences.net/9/649/2012/

T. Schneider von Deimling et al.: Estimating the permafrost-carbon feedback 663
North America to disturbance, J. Geophys. Res., 116, G00K06,doi:10.1029/2010JG001507, 2011.
Heimann, M. and Reichstein, M.: Terrestrial ecosystem carbon dy-namics and climate feedbacks, Nature, 451, 289–292, 2008.
Hobbie, S. E., Schimel, J. P., Trumbore, S. E., and Randerson, J. R.:Controls over carbon storage and turnover in high-latitude soils,Glob. Change Biol., 6, 196–210, 2000.
Jorgenson, M. T., Romanovsky, V., Harden, J., Shur, Y., O’Donnell,J., Schuur, E. A. G., Kanevskiy, M., and Marchenko, S.: Re-silience and vulnerability of permafrost to climate change, C. J.Forest Res., 40, 1219–1236, 2010.
Karhu, K., Fritze, H., HAMALAINEN, K., Vanhala, P., Jungner, H.g., Oinonen, M., Sonninen, E., Tuomi, M., Spetz, P., Kitunen, V.,and Liski, J.: Temperature sensitivity of soil carbon fractions inboreal forest soil, Ecology, 91, 370–376, 2010.
Khvorostyanov, D. V., Ciais, P., Krinner, G., and Zimov,S. A.: Vulnerability of east Siberia’s frozen carbon storesto future warming, Geophys. Res. Lett., 35, L10703,doi:10.1029/2008GL033639, 2008a.
Khvorostyanov, D. V., Ciais, P., Krinner, G., Zimov, S. A., Corradi,C., and Guggenberger, G.: Vulnerability of permafrost carbon toglobal warming, Part 2: sensitivity of permafrost carbon stock toglobal warming, Tellus B, 60, 265–275, 2008b.
Khvorostyanov, D. V., Krinner, G., Ciais, P., Heimann, M., and Zi-mov, S. A.: Vulnerability of permafrost carbon to global warm-ing, Part 1: Model description and role of heat generated by or-ganic matter decomposition, Tellus B, 60, 250–264, 2008c.
Kip, N., van Winden, J. F., Pan, Y., Bodrossy, L., Reichart, G.-J.,Smolders, A. J. P., Jetten, M. S. M., Damste, J. S. S., and Opden Camp, H. J. M.: Global prevalence of methane oxidation bysymbiotic bacteria in peat-moss ecosystems, Nature Geosci., 3,617–621, 2011.
Koven, C. D., Ringeval, B., Friedlingstein, P., Ciais, P., Cadule, P.,Khvorostyanov, D., Krinner, G., and Tarnocai, C.: Permafrostcarbon-climate feedbacks accelerate global warming, P. Natl.Acad. Sci., 108, 14769–14774, 2011.
Lawrence, D. M. and Slater, A. G.: Incorporating organic soil intoa global climate model, Clim. Dynam., 30, 145–160, 2008.
Lawrence, D. M., Slater, A. G., Romanovsky, V. E., and Nicol-sky, D. J.: Sensitivity of a model projection of near-surface per-mafrost degradation to soil column depth and representation ofsoil organic matter, J. Geophys. Res.-Earth Surf., 113, F02011,doi:10.1029/2007JF000883, 2008a.
Lawrence, D. M., Slater, A. G., Tomas, R. A., Holland, M. M.,and Deser, C.: Accelerated Arctic land warming and permafrostdegradation during rapid sea ice loss, Geophys. Res. Lett., 35,L11506, doi:10.1029/2008GL033985, 2008b.
Lawrence, D. M. and Slater, A. G.: The contribution of snow condi-tion trends to future ground climate, Clim. Dynam., 34, 969–981,2010.
Lawrence, D. M., Slater, A. G., and Swenson, S. C.: Sim-ulation of Present-day and Future Permafrost and Season-ally Frozen Ground Conditions in CCSM4, J. Climate,doi:http://dx.doi.org/10.1175/JCLI-D-11-00334.1, 2011.
Lawrence, D. M. and Swenson, S. C.: Permafrost response toincreasing Arctic shrub abundance depends on relative influ-ence of shrubs on local soil cooling versus large-scale climatewarming, Environ. Res. Lett., 6, 045504, doi:10.1088/1748-9326/6/4/045504, 2011.
Lloyd, J. and Taylor, J. A.: On the Temperature-Dependence of SoilRespiration, Funct. Ecol., 8, 315–323, 1994.
Matthews, H. D. and Keith, D. W.: Carbon-cycle feedbacks in-crease the likelihood of a warmer future, Geophys. Res. Lett.,34, L09702, doi:10.1029/2006GL028685, 2007.
McGuire, A. D., Chapin, F. S., Walsh, J. E., and Wirth, C.: Inte-grated Regional Changes in Arctic Climate Feedbacks: Implica-tions for the Global Climate System*, Annu. Rev. Environ. Res.,31, 61–91, 2006.
McGuire, A. D., Anderson, L. G., Christensen, T. R., Dallimore, S.,Guo, L. D., Hayes, D. J., Heimann, M., Lorenson, T. D., Mac-donald, R. W., and Roulet, N.: Sensitivity of the carbon cycle inthe Arctic to climate change, Ecol. Monogr., 79, 523–555, 2009.
Meehl, G. A., Covey, C., McAvaney, B., Latif, M., and Stouffer, R.J.: Overview of the Coupled Model Intercomparison Project, B.Am. Meteorol. Soc., 86, 89–93, 2005.
Meehl, G. A., Stocker, T. F., Collins, W., Friedlingstein, P., Gaye,A., Gregory, J. M., Kitoh, A., Knutti, R., Murphy, J., Noda, A.,Raper, S. C. B., Watterson, I., Weaver, A., and Zhao Chapter 10,Z.-C.: Global Climate Projections, IPCC Fourth Assessment Re-port, edited by: IPCC, Cambridge University Press, Cambridge,2007.
Meinshausen, M., Raper, S. C. B., and Wigley, T. M. L.: Emulat-ing coupled atmosphere-ocean and carbon cycle models with asimpler model, MAGICC6 –Part 1: Model description and cali-bration, Atmos. Chem. Phys., 11, 1417–1456,doi:10.5194/acp-11-1417-2011, 2011.
Meinshausen, M., Smith, S., Calvin, K., Daniel, J., Kainuma, M.,Lamarque, J. F., Matsumoto, K., Montzka, S., Raper, S., Riahi,K., Thomson, A., Velders, G., and van Vuuren, D. P.: The RCPgreenhouse gas concentrations and their extensions from 1765 to2300, Climatic Change, 19(1–2), 213–241, doi:10.1007/s10584-011-0156-z., 2011b.
Mitchell, T. D.: Pattern scaling – An examination of the accuracyof the technique for describing future climates, Climatic Change,60, 217–242, 2003.
Monson, R. K., Lipson, D. L., Burns, S. P., Turnipseed, A. A., De-lany, A. C., Williams, M. W., and Schmidt, S. K.: Winter forestsoil respiration controlled by climate and microbial communitycomposition, Nature, 439, 711–714, 2006.
Moss, R. H., Edmonds, J. A., Hibbard, K. A., Manning, M. R.,Rose, S. K., van Vuuren, D. P., Carter, T. R., Emori, S., Kainuma,M., Kram, T., Meehl, G. A., Mitchell, J. F. B., Nakicenovic, N.,Riahi, K., Smith, S. J., Stouffer, R. J., Thomson, A. M., Weyant,J. P., and Wilbanks, T. J.: The next generation of scenarios forclimate change research and assessment, Nature, 463, 747–756,2010.
Nicolsky, D. J., Romanovsky, V. E., Alexeev, V. A., and Lawrence,D. M.: Improved modeling of permafrost dynamics in aGCM land-surface scheme, Geophys. Res. Lett., 34, L08501,doi:10.1029/2007GL029525, 2007.
O’Connor, F. M., Boucher, O., Gedney, N., Jones, C. D., Folberth,G. A., Coppell, R., Friedlingstein, P., Collins, W. J., Chappel-laz, J., Ridley, J., and Johnson, C. E.: Possible role of wetlands,permafrost, and methane hydrates in the methane cycle underfuture climate change: A review, Rev. Geophys., 48, RG4005,doi:10.1029/2010RG000326, 2010.
Orr, J. C.: Global Ocean Storage of Anthropogenic Carbon(GOSAC), Final report, 128 pp., 2002.
www.biogeosciences.net/9/649/2012/ Biogeosciences, 9, 649–665, 2012
664 T. Schneider von Deimling et al.: Estimating the permafrost-carbon feedback
Raupach, M., Canadell, J., Dolman, J., Valentini, R., and Freibauer,A.: Observing a Vulnerable Carbon Cycle, in: The Continental-Scale Greenhouse Gas Balance of Europe, Springer New York,5–32, 2008.
Riley, W. J., Subin, Z. M., Lawrence, D. M., Swenson, S. C., Torn,M. S., Meng, L., Mahowald, N. M., and Hess, P.: Barriers topredicting changes in global terrestrial methane fluxes: analysesusing CLM4Me, a methane biogeochemistry model integrated inCESM, Biogeosciences, 8, 1925–1953,doi:10.5194/bg-8-1925-2011, 2011.
Saito, K., Kimoto, M., Zhang, T., Takata, K., and Emori, S.: Eval-uating a high-resolution climate model: Simulated hydrother-mal regimes in frozen ground regions and their change underthe global warming scenario, J. Geophys. Res., 112, F02S11,doi:10.1029/2006JF000577, 2007.
Santer, B. D., Wigley, T. M. L., Schlesinger, M. E., and Mitchell,J. F. B.: Developing Climate Scenarios from Equilibrium GCMResults, MPI, Hamburg, Germany, 47, 1990.
Scanlon, D. and Moore, T.: Carbon dioxide production from peat-land soil profiles: The influence of temperature, oxic/anoxic con-ditions and substrate, Soil Sci., 165, 153–160, 2000.
Schaefer, K., Zhang, T., Bruhwiler, L., and Barrett, A. P.: Amountand timing of permafrost carbon release in response to climatewarming, Tellus B, 63, 165–180, 2011.
Schewe, J., Levermann, A., and Meinshausen, M.: Climate changeunder a scenario near 1.5◦C of global warming: monsoon inten-sification, ocean warming and steric sea level rise, Earth Syst.Dynam., 2, 25–35,doi:10.5194/esd-2-25-2011, 2011.
Schuur, E. A. G., Bockheim, J., Canadell, J. G., Euskirchen, E.,Field, C. B., Goryachkin, S. V., Hagemann, S., Kuhry, P., Lafleur,P. M., Lee, H., Mazhitova, G., Nelson, F. E., Rinke, A., Ro-manovsky, V. E., Shiklomanov, N., Tarnocai, C., Venevsky, S.,Vogel, J. G., and Zimov, S. A.: Vulnerability of permafrost car-bon to climate change: Implications for the global carbon cycle,Bioscience, 58, 701–714, 2008.
Schuur, E. A. G., Vogel, J. G., Crummer, K. G., Lee, H., Sickman,J. O., and Osterkamp, T. E.: The effect of permafrost thaw onold carbon release and net carbon exchange from tundra, Nature,459, 556–559, 2009.
Screen, J. A. and Simmonds, I.: The central role of diminishingsea ice in recent Arctic temperature amplification, Nature, 464,1334–1337, 2010.
Shakhova, N., Semiletov, I., and Gustafsson, O.: Methane from theEast Siberian Arctic Shelf Response, Science, 329, 1147–1148,2010a.
Shakhova, N., Semiletov, I., Salyuk, A., Yusupov, V., Kosmach,D., and Gustafsson, O.: Extensive Methane Venting to the At-mosphere from Sediments of the East Siberian Arctic Shelf, Sci-ence, 327, 1246–1250, 2010b.
Sitch, S., Smith, B., Prentice, I. C., Arneth, A., Bondeau, A.,Cramer, W., Kaplan, J. O., Levis, S., Lucht, W., Sykes, M. T.,Thonicke, K., and Venevsky, S.: Evaluation of ecosystem dy-namics, plant geography and terrestrial carbon cycling in the LPJdynamic global vegetation model, Glob. Change Biol., 9, 161–185, 2003.
Sitch, S., Huntingford, C., Gedney, N., Levy, P. E., Lomas, M.,Piao, S. L., Betts, R., Ciais, P., Cox, P., Friedlingstein, P., Jones,C. D., Prentice, I. C., and Woodward, F. I.: Evaluation of the ter-restrial carbon cycle, future plant geography and climate-carbon
cycle feedbacks using five Dynamic Global Vegetation Models(DGVMs), Glob. Change Biol., 14, 2015–2039, 2008.
Smith, L. C., Sheng, Y., and MacDonald, G. M.: A first pan-Arcticassessment of the influence of glaciation, permafrost, topographyand peatlands on Northern Hemisphere lake distribution, Per-mafrost Periglac., 18, 201–208, 2007.
Stroeve, J., Holland, M. M., Meier, W., Scambos, T., and Serreze,M.: Arctic sea ice decline: Faster than forecast, Geophys. Res.Lett., 34, L09501, doi:10.1029/2007GL029703, 2007.
Swann, A. L., Fung, I. Y., Levis, S., Bonan, G. B., and Doney, S.C.: Changes in Arctic vegetation amplify high-latitude warm-ing through the greenhouse effect, P. Natl. Acad. Sci. USA, 107,1295–1300, 2010.
Tarnocai, C., Canadell, J. G., Schuur, E. A. G., Kuhry, P., Mazhi-tova, G., and Zimov, S.: Soil organic carbon pools in the north-ern circumpolar permafrost region, Global Biogeochem. Cy., 23,GB2023, doi:10.1029/2008GB003327, 2009.
van Huissteden, J., Berrittella, C., Parmentier, F. J. W., Mi, Y.,Maximov, T. C., and Dolman, A. J.: Methane emissions frompermafrost thaw lakes limited by lake drainage, Nature Clim.Change, 1, 119–123, 2011.
van Vuuren, D., Edmonds, J., Kainuma, M., Riahi, K., Thomson,A., Hibbard, K., Hurtt, G., Kram, T., Krey, V., Lamarque, J.-F., Masui, T., Meinshausen, M., Nakicenovic, N., Smith, S.,and Rose, S.: The representative concentration pathways: anoverview, Climatic Change, 109, 5–31, 2011.
Wagner, D., Liebner, S., and Margesin, R.: Global Warming andCarbon Dynamics in Permafrost Soils: Methane Production andOxidation, in: Permafrost Soils, Springer Berlin Heidelberg,219–236, 2009.
Walter, B. P. and Heimann, M.: A process-based, climate-sensitivemodel to derive methane emissions from natural wetlands: Ap-plication to five wetland sites, sensitivity to model parameters,and climate, Global Biogeochem. Cy., 14, 745–765, 2000.
Walter, K. M., Zimov, S. A., Chanton, J. P., Verbyla, D., and Chapin,F. S.: Methane bubbling from Siberian thaw lakes as a positivefeedback to climate warming, Nature, 443, 71–75, 2006.
Walter, K. M., Edwards, M. E., Grosse, G., Zimov, S. A., andChapin, F. S.: Thermokarst lakes as a source of atmospheric CH4during the last deglaciation, Science, 318, 633–636, 2007a.
Walter, K. M., Smith, L. C., and Chapin, F. S.: Methane bub-bling from northern lakes: present and future contributions to theglobal methane budget, Philos. T. R. Soc. A, 365, 1657–1676,2007b.
Wania, R., Ross, I., and Prentice, I. C.: Integrating peat-lands and permafrost into a dynamic global vegetation model– Part 2: Evaluation and sensitivity of vegetation and car-bon cycle processes, Global Biogeochem. Cy., 23, GB3015,doi:10.1029/2008GB003413, 2009.
Wigley, T. M. L. and Raper, S. C. B.: Reasons for Larger WarmingProjections in the IPCC Third Assessment Report, J. Climate, 15,2945–2952, 2002.
Wisser, D., Marchenko, S., Talbot, J., Treat, C., and Frolking, S.:Soil temperature response to 21st century global warming: therole of and some implications for peat carbon in thawing per-mafrost soils in North America, Earth Syst. Dynam., 2, 121–138,doi:10.5194/esd-2-121-2011, 2011.
Yi, S. H., Woo, M. K., and Arain, M. A.: Impacts of peat and veg-etation on permafrost degradation under climate warming, Geo-
Biogeosciences, 9, 649–665, 2012 www.biogeosciences.net/9/649/2012/

T. Schneider von Deimling et al.: Estimating the permafrost-carbon feedback 665
phys. Res. Lett., 34, L16504, doi:10.1029/2007GL030550, 2007.Zhang, Y., Chen, W. J., and Riseborough, D. W.: Transient projec-
tions of permafrost distribution in Canada during the 21st cen-tury under scenarios of climate change, Global Planet. Change,60, 443–456, 2008.
Zhuang, Q. L., Melillo, J. M., Sarofim, M. C., Kicklighter, D.W., McGuire, A. D., Felzer, B. S., Sokolov, A., Prinn, R. G.,Steudler, P. A., and Hu, S. M.: CO2 and CH4 exchanges be-tween land ecosystems and the atmosphere in northern high lat-itudes over the 21st century, Geophys. Res. Lett., 33, L17403,doi:10.1029/2006GL026972, 2006.
www.biogeosciences.net/9/649/2012/ Biogeosciences, 9, 649–665, 2012